1. Introduction
Currently, diffuse gas discharges initiated by runaway electrons (runaway electron preionized diffuse discharge—REP DD) are intensively investigated [
1,
2,
3,
4]. As it was shown in [
5], it is possible to form a diffuse discharge in a gap with an inhomogeneous electric field strength distribution filled with atmospheric-pressure air by applying nanosecond voltage pulses with an amplitude up to several tens of kilovolts to the cathode with a small radius of curvature. Thus, the electric field near the cathode can reach critical values at which initial electrons gain more energy than they lose in collisions—they become runaway. As they move towards the anode, runaway electrons produce electrons with lower energy. This leads to the development of electron avalanches that overlap and, ultimately, contribute to the diffuse discharge formation [
6]. This type of discharge has a number of unique features: high specific input power (up to 1 GW/cm
3) [
7], generation of X-rays, runaway electron beams with the amplitude of tens of amperes [
5,
8,
9], and a current pulse duration (full-width at half-maximum—FWHM) of ~100 ps [
10], as well as powerful UV and VUV radiation [
11]. There are several factors affecting a grounded anode in REP DD. They are a dense plasma, an ultrashort electron beam with a wide energy spectrum, optical radiation, and products of plasma–chemical reactions [
12,
13].
This paper continues the investigations started in [
14,
15,
16]. In [
14,
15], modification of copper specimens (foils and plates) with a REP DD plasma in ambient air formed using a setup based on a RADAN-220 voltage pulse generator operated with a pulse repetition rate of 1 Hz was investigated. Those studies have shown that the most significant changes in the elemental composition of a copper surface occur after 6600 pulses. However, because of the low repetition rate, this type of modification takes a lot of time. In [
16] it was found that use of a pulse–periodic REP DD in a stream of nitrogen provides ultrafine surface cleaning from carbon and increases the free energy of the surface up to 3 times, while the surface roughness remains unchanged and nanohardness slightly decreases, highly likely due to tensile stresses arising in a thin surface layer. However, this assumption must be confirmed by microstructure studies using electron microscopy. Therefore, the objective of this paper is to study the changes in the microstructure of the surface of copper and steel specimens caused by the action of the pulse–periodic REP DD.
2. Materials and Methods
Experiments were carried out on three experimental setups. Setups #1 and #2 operated in a mode where a working gas flowed through the discharge chamber. A setup #3 operated at constant gas pressure and was equipped with a system of gas circulation inside the discharge chamber. We used commercial nitrogen (N2—99.5%, O2—0.5, H2O—0.02 mg/l) as a working gas. To burn REP DD, negative voltage pulses with an FWHM of 4 ns, an amplitude of up to 60 kV, and a pulse repetition rate of up to 100 Hz were applied to an electrode with a small radius of curvature (pointed electrode). A GIN-100-1 (“Antares” Ltd.) voltage pulse generator was used in the setups #1 and #2. A FPG-60 voltage pulse generator (JSC “PK FID-TEKHNIKA”) producing four voltage pulses simultaneously via four parallel synchronized channels was used in the setup #3. The mean input power into the discharge plasma was 2 W.
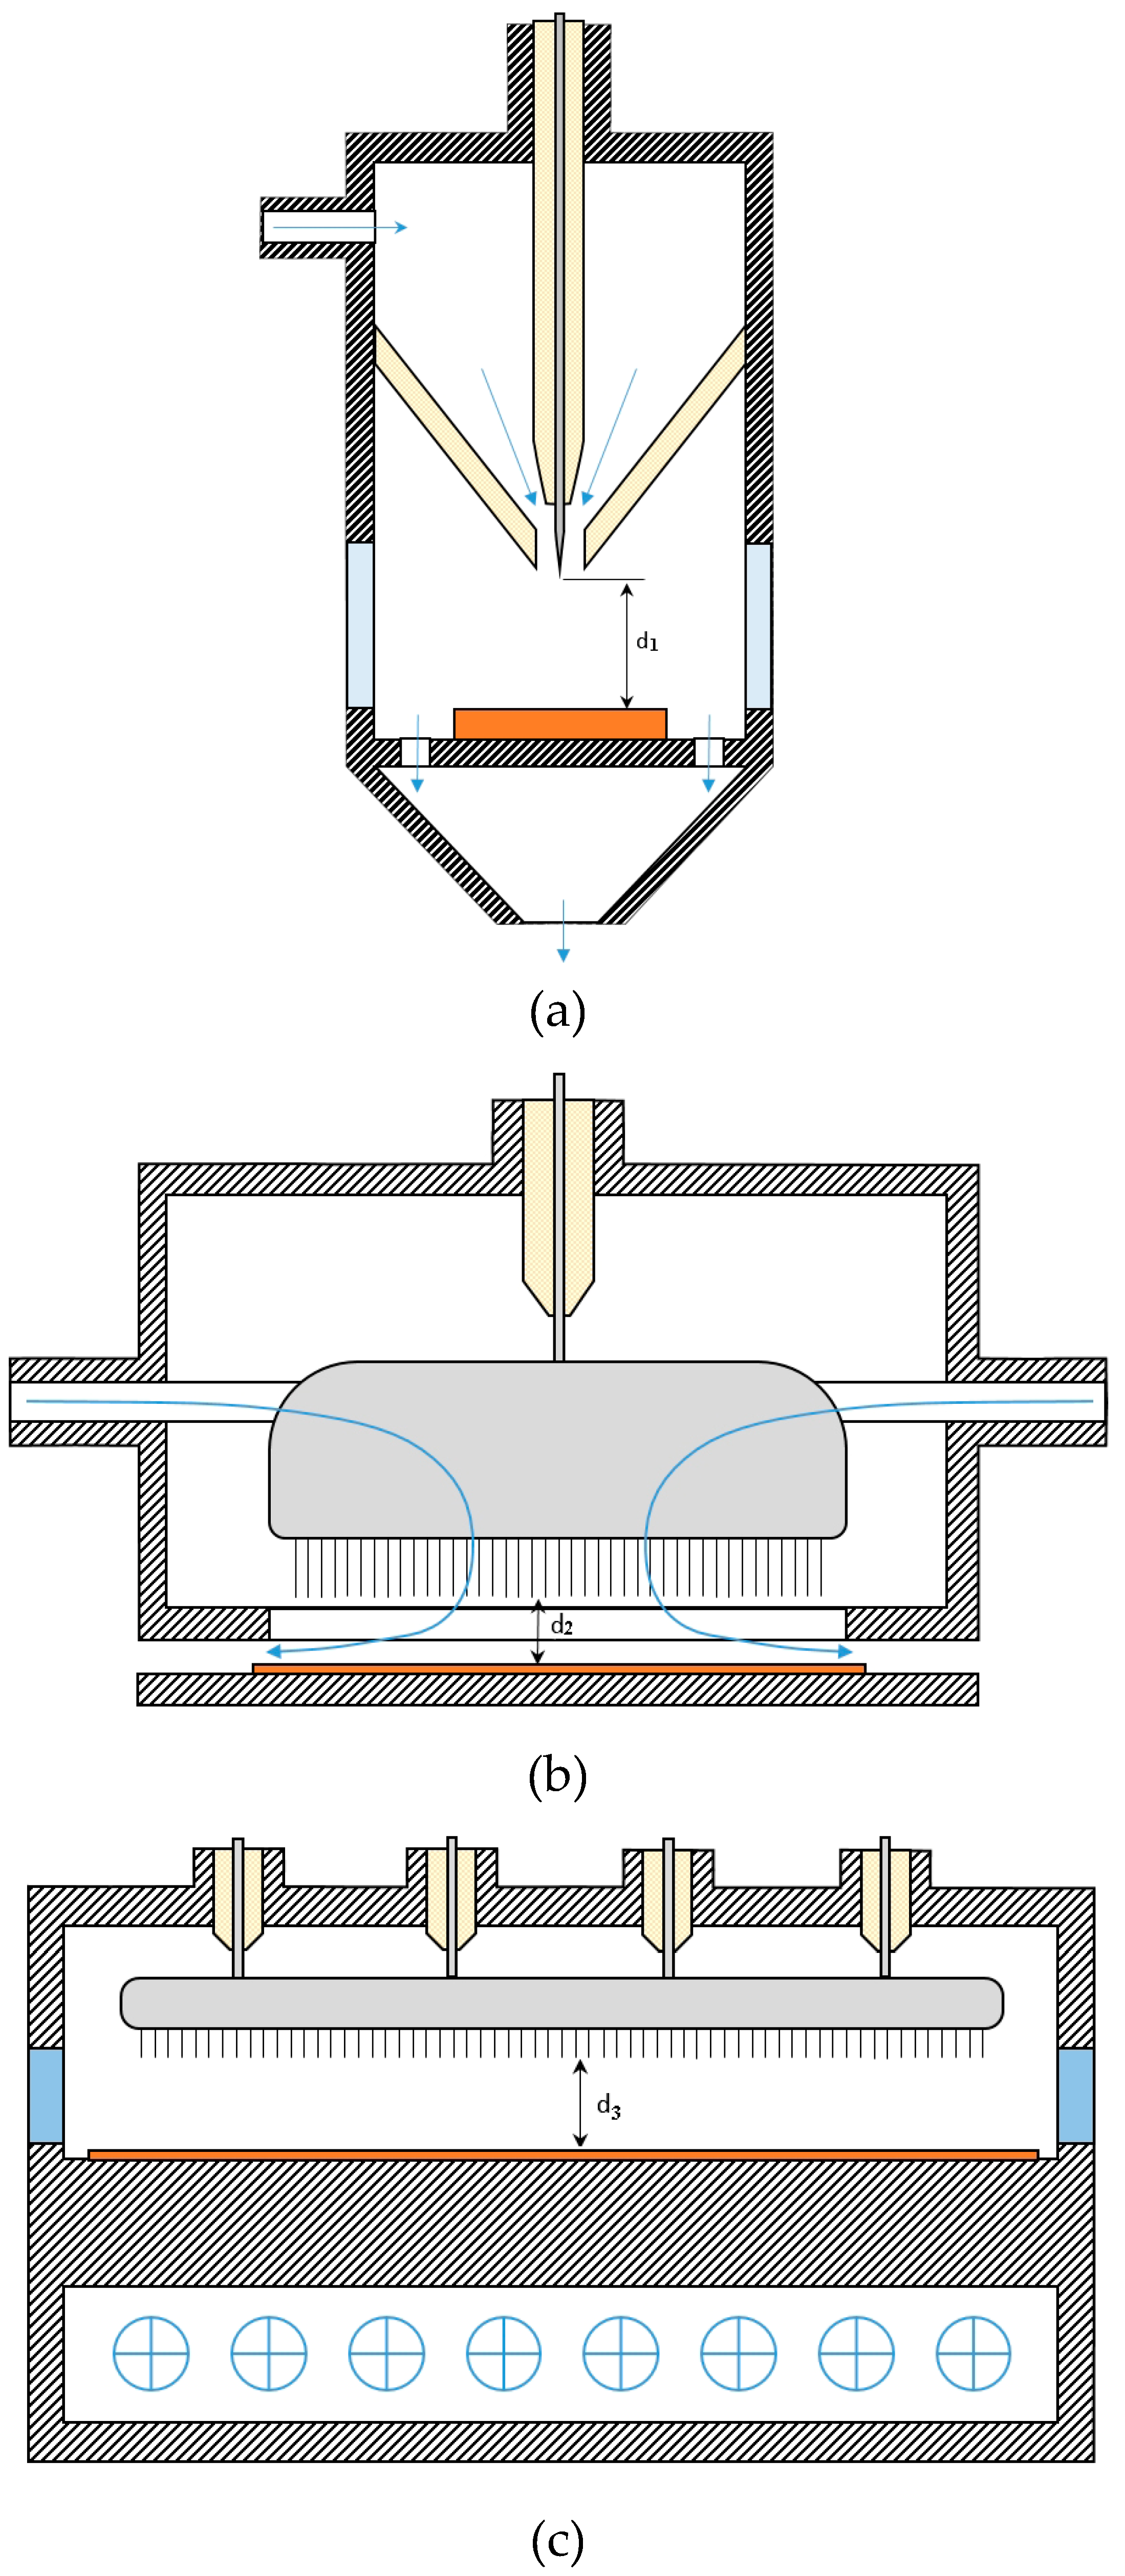
The designs of the used discharge chambers are shown in
Figure 1. A photo and a cross-sectional diagram of the setup #1 allowing modification of a surface of cylindrical specimens with a diameter of up to 10 mm are shown in
Figure 1a. High-voltage pulses were applied to a pointed cathode made of tool steel with an apex angle of 36° and a curvature radius of 0.2 mm. The cathode was pressed into a Teflon insulator. High-voltage pulses were applied to the pointed cathode. The discharge form was controlled visually through 20-mm-diameter quartz windows located opposite the discharge gap. The working gas was fed into the discharge chamber through an inlet in its upper part and was directed along the cathode using a conical Teflon nozzle. A gas outlet was located at the bottom part of the chamber. The distance between the pointed cathode and the plane anode (gap width) could vary in the range of 1–20 mm. A modifiable specimen was placed on the anode.
The second setup (
Figure 1b) made it possible to modify the surface of flat specimens with dimensions of 10 mm × 130 mm. The high-voltage cathode 130 mm long consisted of 18 steel needles (the apex angle of 52°, the curvature radius of 0.1 mm) arranged in a row at a distance of 8 mm from each other. The discharge chamber was made of a 100-mm-diameter polyvinyl chloride tube equipped with end nipple working gas. At the bottom part of the tube, there were holes under each needlelike electrode, through which gas-discharge plasma was blown out. The gap width could vary from 10 to 20 mm.
In the third experimental setup (
Figure 1c) plasma was formed in a cylindrical discharge chamber with a diameter of 210 mm and a length of 500 mm filled with atmospheric-pressure gas. The gap width was 6 mm. To avoid discharge constriction due to gas heating in the gap, a cooling system providing gas circulation in the chamber was used. To ensure cooling, eight fans were installed at the bottom of the chamber. The gas pumping velocity could reach 20 m/s. The design of the cathode was as follow. It represented two rows of needles with an apex angle of 52°and a curvature radius of 0.1 mm (100 needles in total) arranged in a staggered manner. The length of the discharge region was 40 cm. This provided more uniform specimen treatment. Specimens were mounted on the plane anode located 10 mm away from the cathode tips. Two quartz windows were located on both sides of the chamber opposite the discharge gap.
A smart mass flow regulator and Microprocessor Control and Read Out Unit 0154 (Brooks Instruments) were used to ensure gas flow rate through the discharge chamber at a speed of 1 slm. Discharge current through the discharge gap and voltage across it were measured with shunts and voltage capacitive dividers. The shunts were made of low-inductance chip resistors. Electric signals from the probes were recorded with a Tektronix MDO3104 oscilloscope (1 GHz, 5 GS/s).
The concentration of electrons
ne in the plasma was estimated as follows. The amplitude of discharge current
Idis is determined by the expression (1):
where
j is current density;
S is cross-section of current-flow zone;
e is electron charge; and
vdr is electron drift velocity. From Equation (1),
ne is determined as follow:
According to [
17]
vdr is:
where µ
e is electron mobility;
E is electric field strength;
d is gap width; and
U is voltage across the gap (calculated from oscillogram). Finally, an expression for
ne is the following:
According to [
17], the value of electron mobility µ
e ×
p = 0.42 × 10
6 (cm
2∙Torr∙V
–1∙s
–1) can be used for nitrogen when the electron energy is in the range of 1–10 eV. Such electron energies are realized in the REP DD plasma. The maximum values of the electron concentration in the middle of the discharge gap corresponding to the moment when discharge current reached its maximum were ~4 × 10
14 cm
–3 for nitrogen and ~3 × 10
14 cm
−3 for air.
To measure the electron temperature
Te and the reduced electric field strength
E/
N in the REP DD plasma, a method based on the radiative–collisional model of plasma was used. According to this method,
Te and
E/
N in a non-equilibrium plasma are determined by the ratio
R391/394 of peak intensities of the ionic N
2+ (λ = 391.4 nm) and molecular N
2 (λ = 394.3 nm) nitrogen bands, the so called first negative ((1
–)-system, transition
B2Σ
u+ →
X2Σ
g+) and second positive ((2
+)-system, transition
C3Π
u →
B3Π
g) systems of a nitrogen molecule [
18]. The dependencies of R
391/394 on
Te and
E/N are presented in [
19] and [
20]. Thus, by measuring peak intensities of nitrogen bands mentioned above, one can determine the electron temperature and the reduced electric field in a non-equilibrium discharge plasma. The integral values of
Te and
E/N in atmospheric-pressure plasma of nitrogen and air were ~2 eV, ~270 Td and ~1.8 eV, ~260 Td, respectively. This corresponds to R
391/394 ~0.3.
In experiments on setup #1, copper cylindrical specimens with a diameter of 24 mm and a height of 5 mm were used. Specimens made of ST3 steel (European analog S235J0) with dimensions of 0.7 mm × 10 mm × 130 mm and 0.7 mm × 20 mm × 400 mm were treated by the REP DD plasma generated in setups #2 and #3, respectively. All specimens were preliminarily polished to a mirror shine, and then twice cleaned in an ultrasonic bath filled with alcohol.
Changes in the concentration of the main chemical elements in the surface layer of treated specimens were measured using the Auger electron spectroscopy (AES) technique. A SHKHUNA-2 Auger-spectrometer was used. The concentration of hydrogen was measured by means of atomic emission spectral analysis with use of a spectral analytic complex (JSC “Sital”) based on a DFS-458C spectrograph (JSC “LOMO”).
Changes in the microstructure of copper specimens after plasma treatment during 105 pulses were studied by transmission electron microscopy technique. In order to avoid erosion by ions when performing this procedure, the test surface of a copper specimen was covered with a 0.5-μm-thick layer of platinum. Then, using a focused ion beam, a foil with the dimensions of 20 μm × 5 μm was cut out. This operation was performed in the direction perpendicular to the surface of the bulk of the sample. This foil was extracted using a manipulator on a copper substrate with a micro-holder. The extracted foil was welded to the micro-holder with a platinum ion beam. All these procedures were carried out in vacuum (residual pressure was 10–5 Torr) on a FEI Quanta 200 3D scanning ion–electron microscope. The microscope had a spatial resolution of 7 nm. The structure and phase composition were studied by transmission electron microscopy (TEM) using a Philips CM12 electron microscope operating at an accelerating voltage of 200 kV. In addition, the method of electron diffraction in the selected region using a selecting diaphragm (diameters were about 1 and 0.1 μm), as well as the methods light-field and dark-field diffraction microscopy were used to study the surface. X-ray phase analysis of the surface of copper specimens before and after treatment by the REP DD plasma was performed with a XRD-6000 diffractometer. The imaging was carried out using monochrome CuKα radiation in the range of angles (2θ) of 10–80° with an increment of 0.02° and a scan rate of 2 degrees per minute. The phase composition was analyzed using the PDF 4+ database, as well as the full-profile analysis software POWDER CELL 2.4.
3. Results
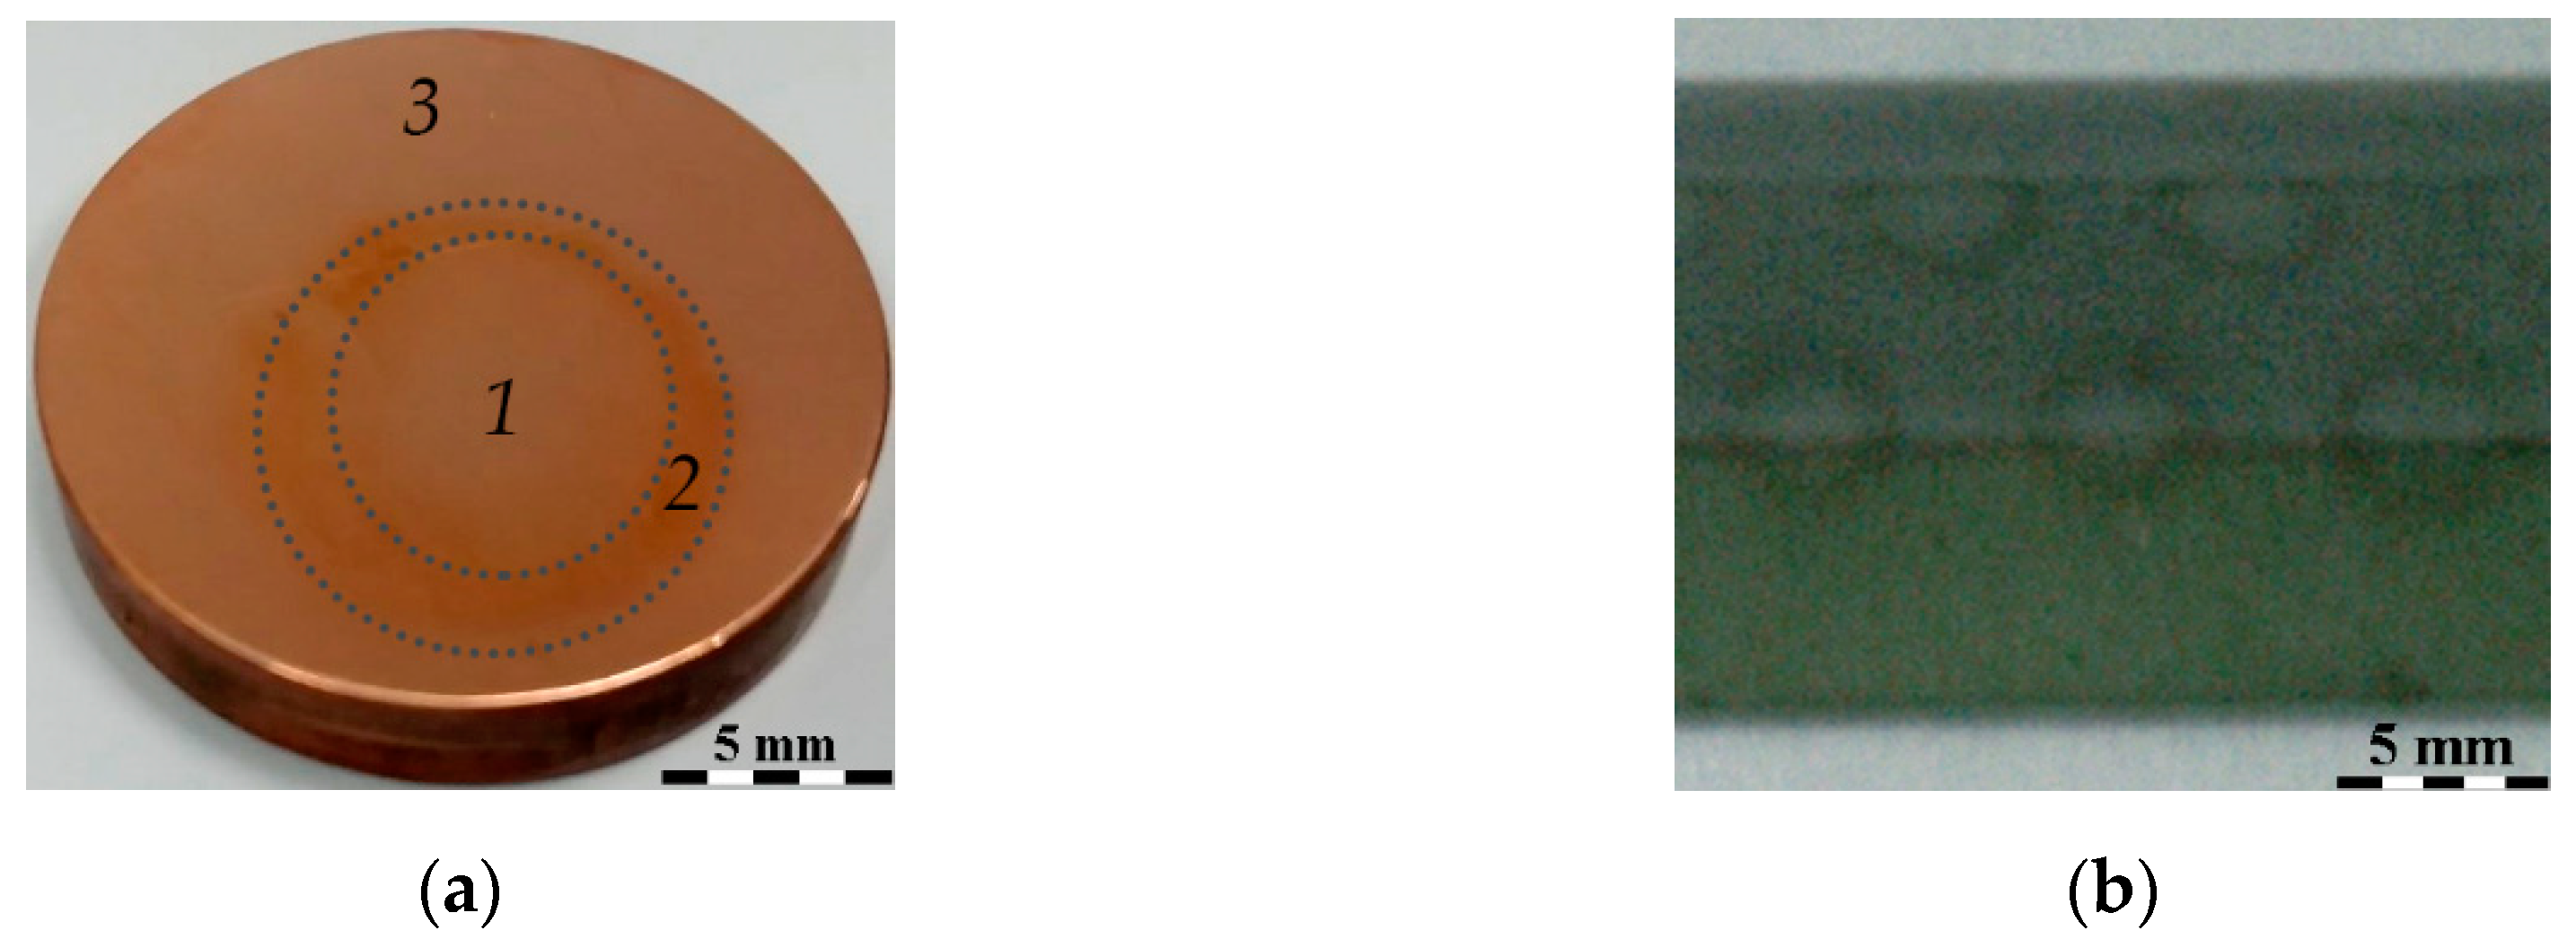
Figure 2a,b demonstrate photos of copper and ST3 steel specimens treated with 10
5 discharge pulses on experimental setups #1 and #3, respectively. As can be seen from
Figure 2a, there is a bright region (
1) surrounded by a darker ring-shaped one (
2) with a width of 2–4 mm on the specimen surface. The first region is of dense plasma exposure and its size was determined by the geometry and length of the interelectrode gap. In experiments on setup #1, the gap width was 8–10 mm. This provided a plasma treatment zone with a diameter of up to 10 mm. After treatment on setups #2 and #3 of ST3 steel specimens, imprints in the form of identical non-intersecting (visually) round spots were observed on the surface (
Figure 2b). The pattern of distribution of spots on the sample surface completely repeated the location of the needles forming the high-volt cathode.
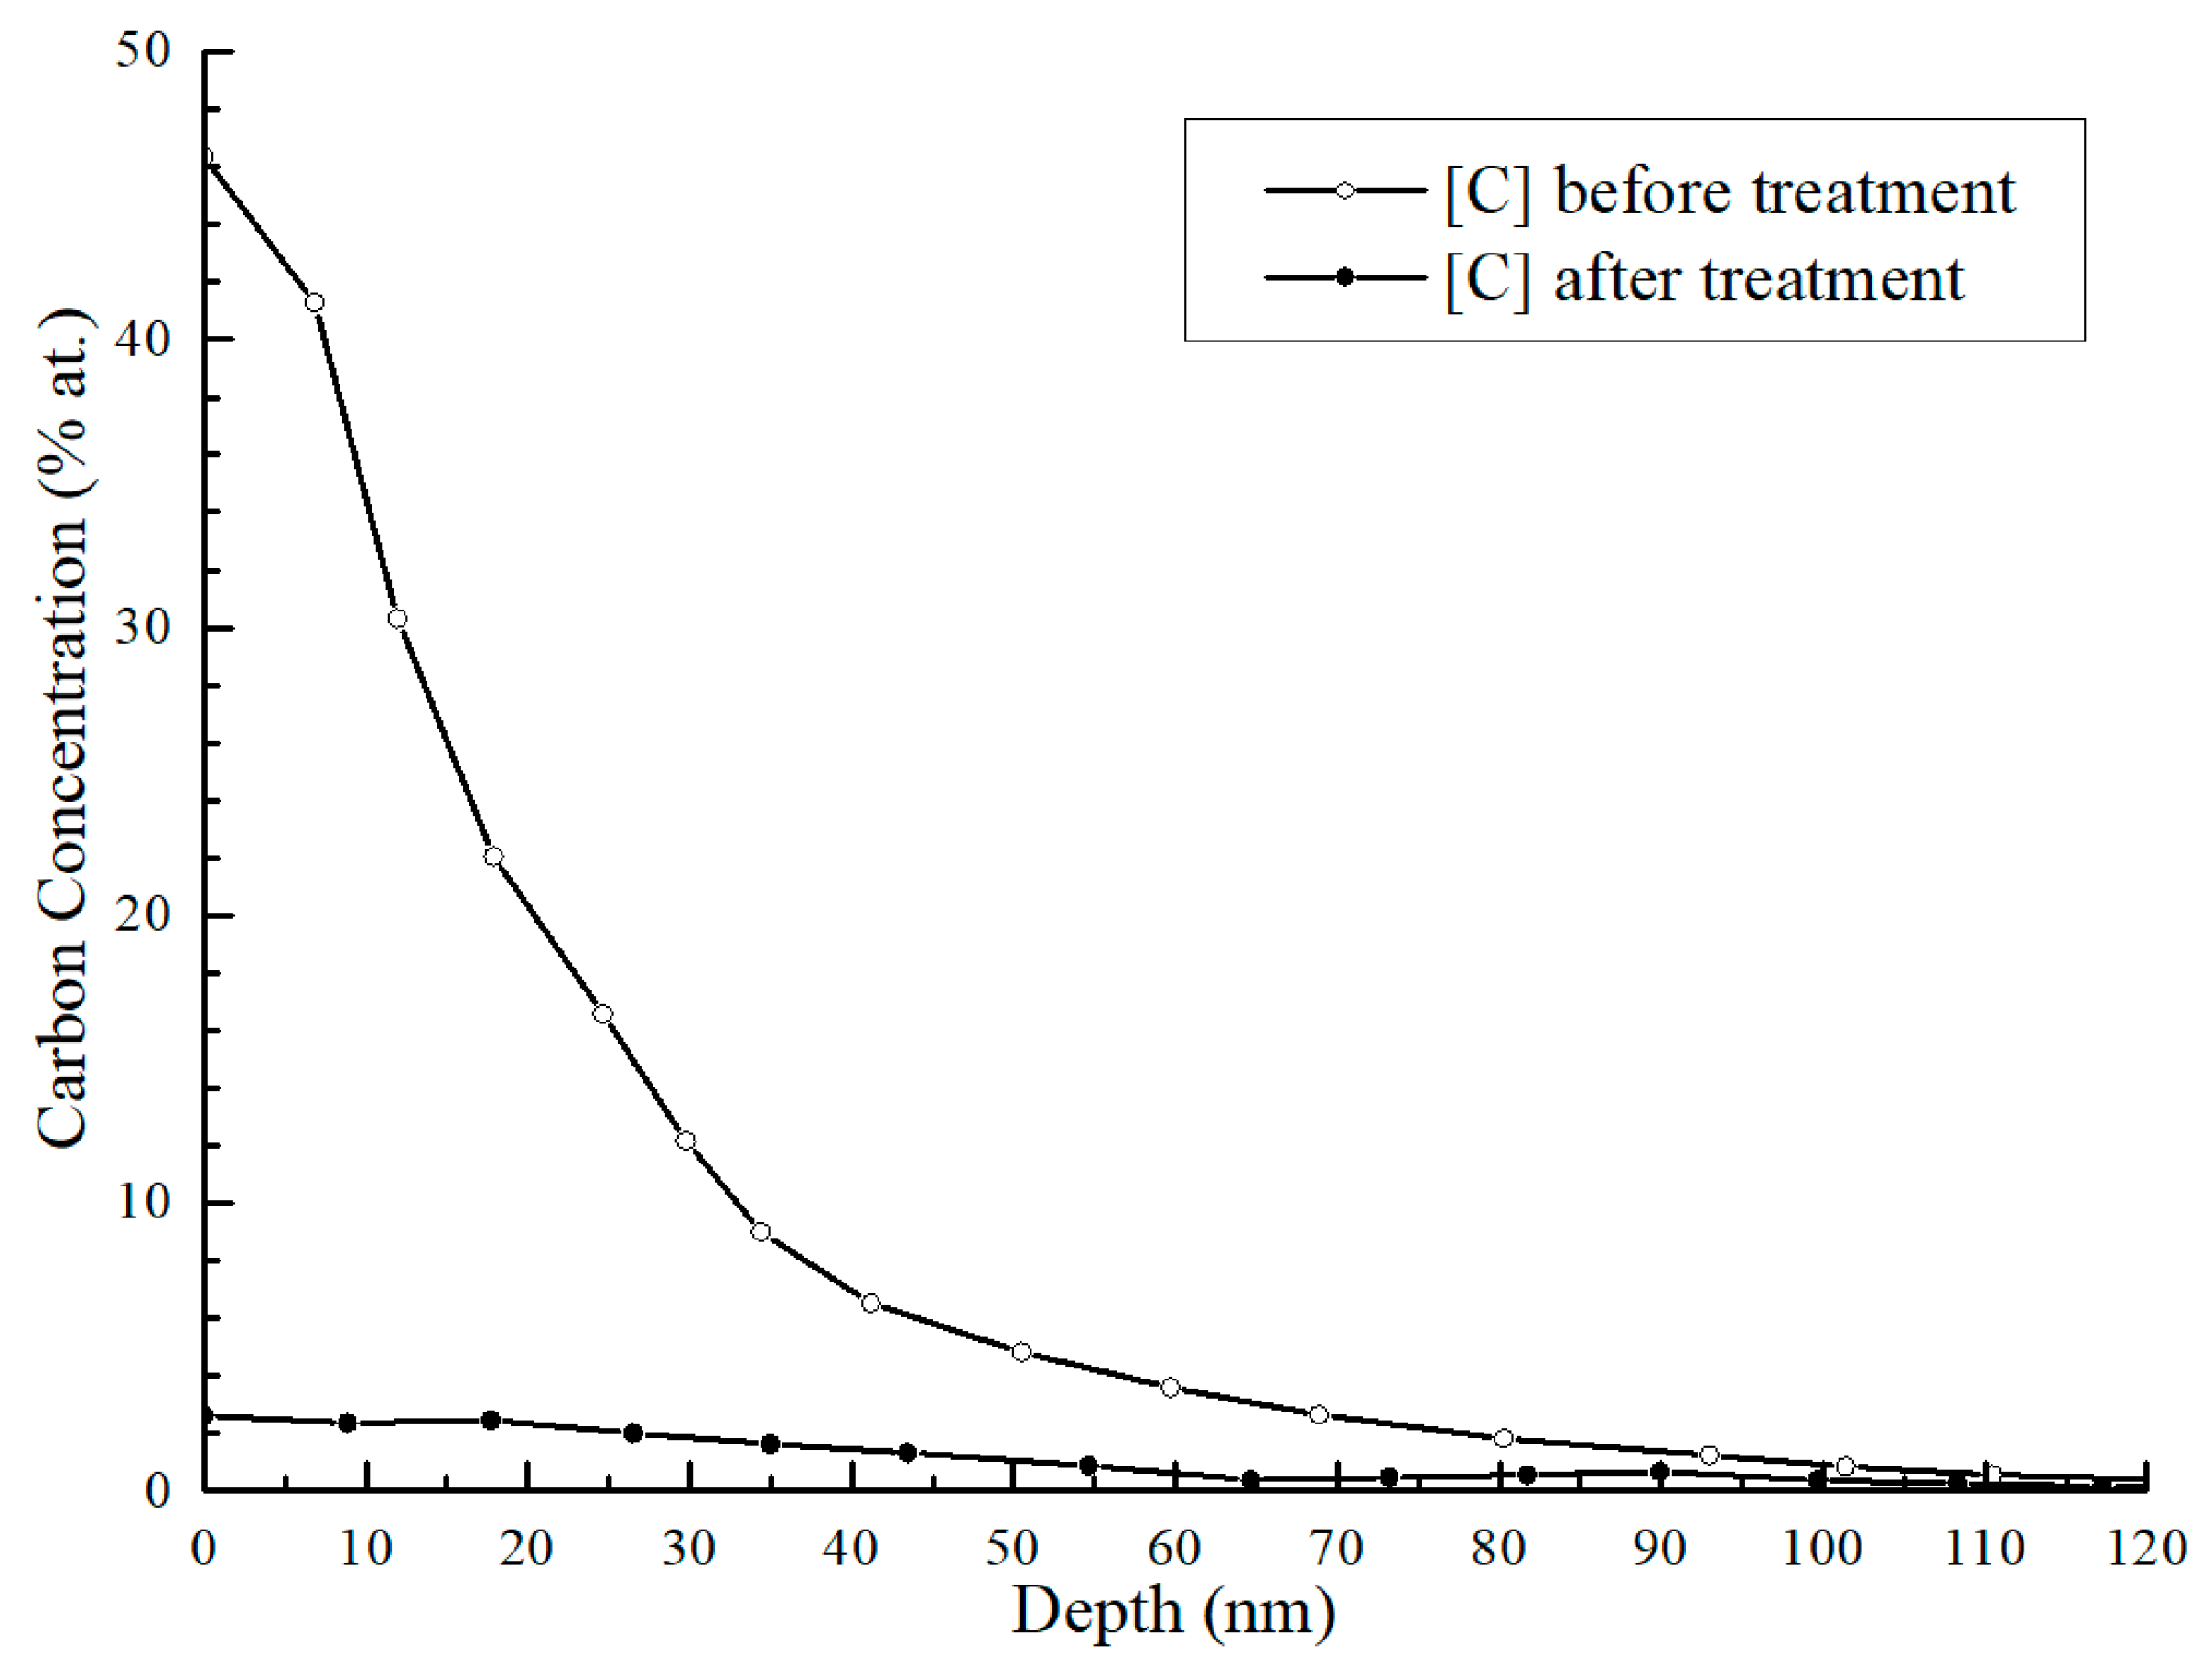
As it is seen from
Figure 3, the carbon concentration in the subsurface layer (at a depth of 10–20 nm) of a metal specimen treated by 10
5 diffuse discharge pulses on experimental setup #3 decreased drastically (about one order of magnitude). It was found [
16] that the surface free energy calculated by the Owen–Wendt method [
21] increased by three times even after treatment with 5000 pulses. These data correlated with the results of Auger electron spectroscopy, showing that the higher the quality of surface cleaning, the larger the increase in the surface free energy. Moreover, an increase in the polar component of the surface free energy, which represents the hydrogen bonds characteristic of organic compounds, was more significant than an increase in the dispersive component. Hydrophobic surfaces have low surface free energy due to high content of –CH
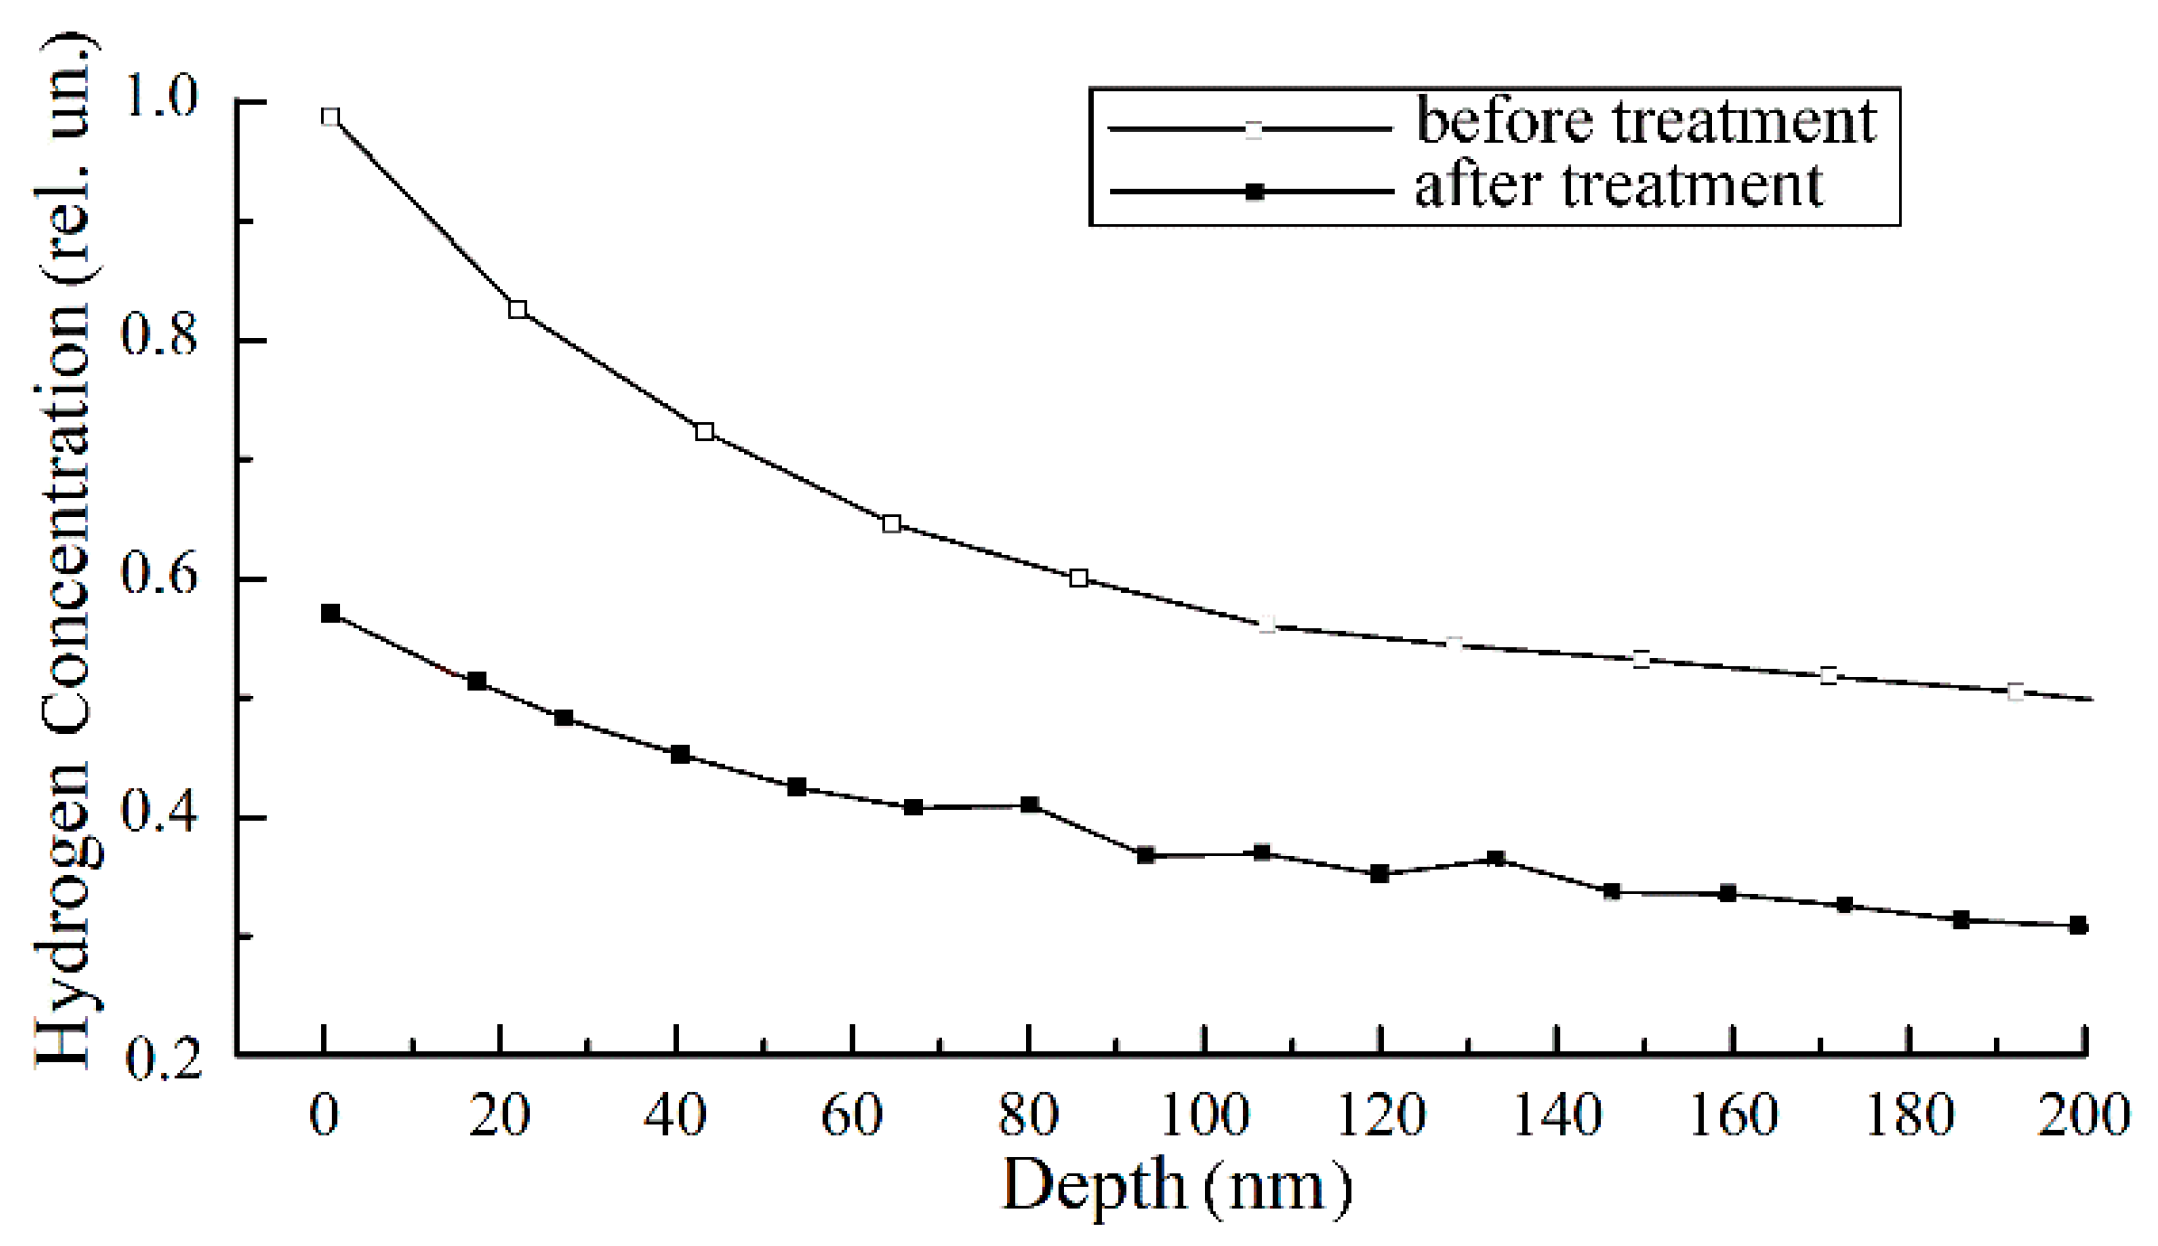
x groups. Profiles (see
Figure 4) obtained with an atomic emission spectrometer show that after 10
5 diffuse discharge pulses the hydrogen concentration in the surface layer of copper specimens decreased about two times. This fact also indicates an increase in the number of free polar bonds after treatment with the REP DD plasma.
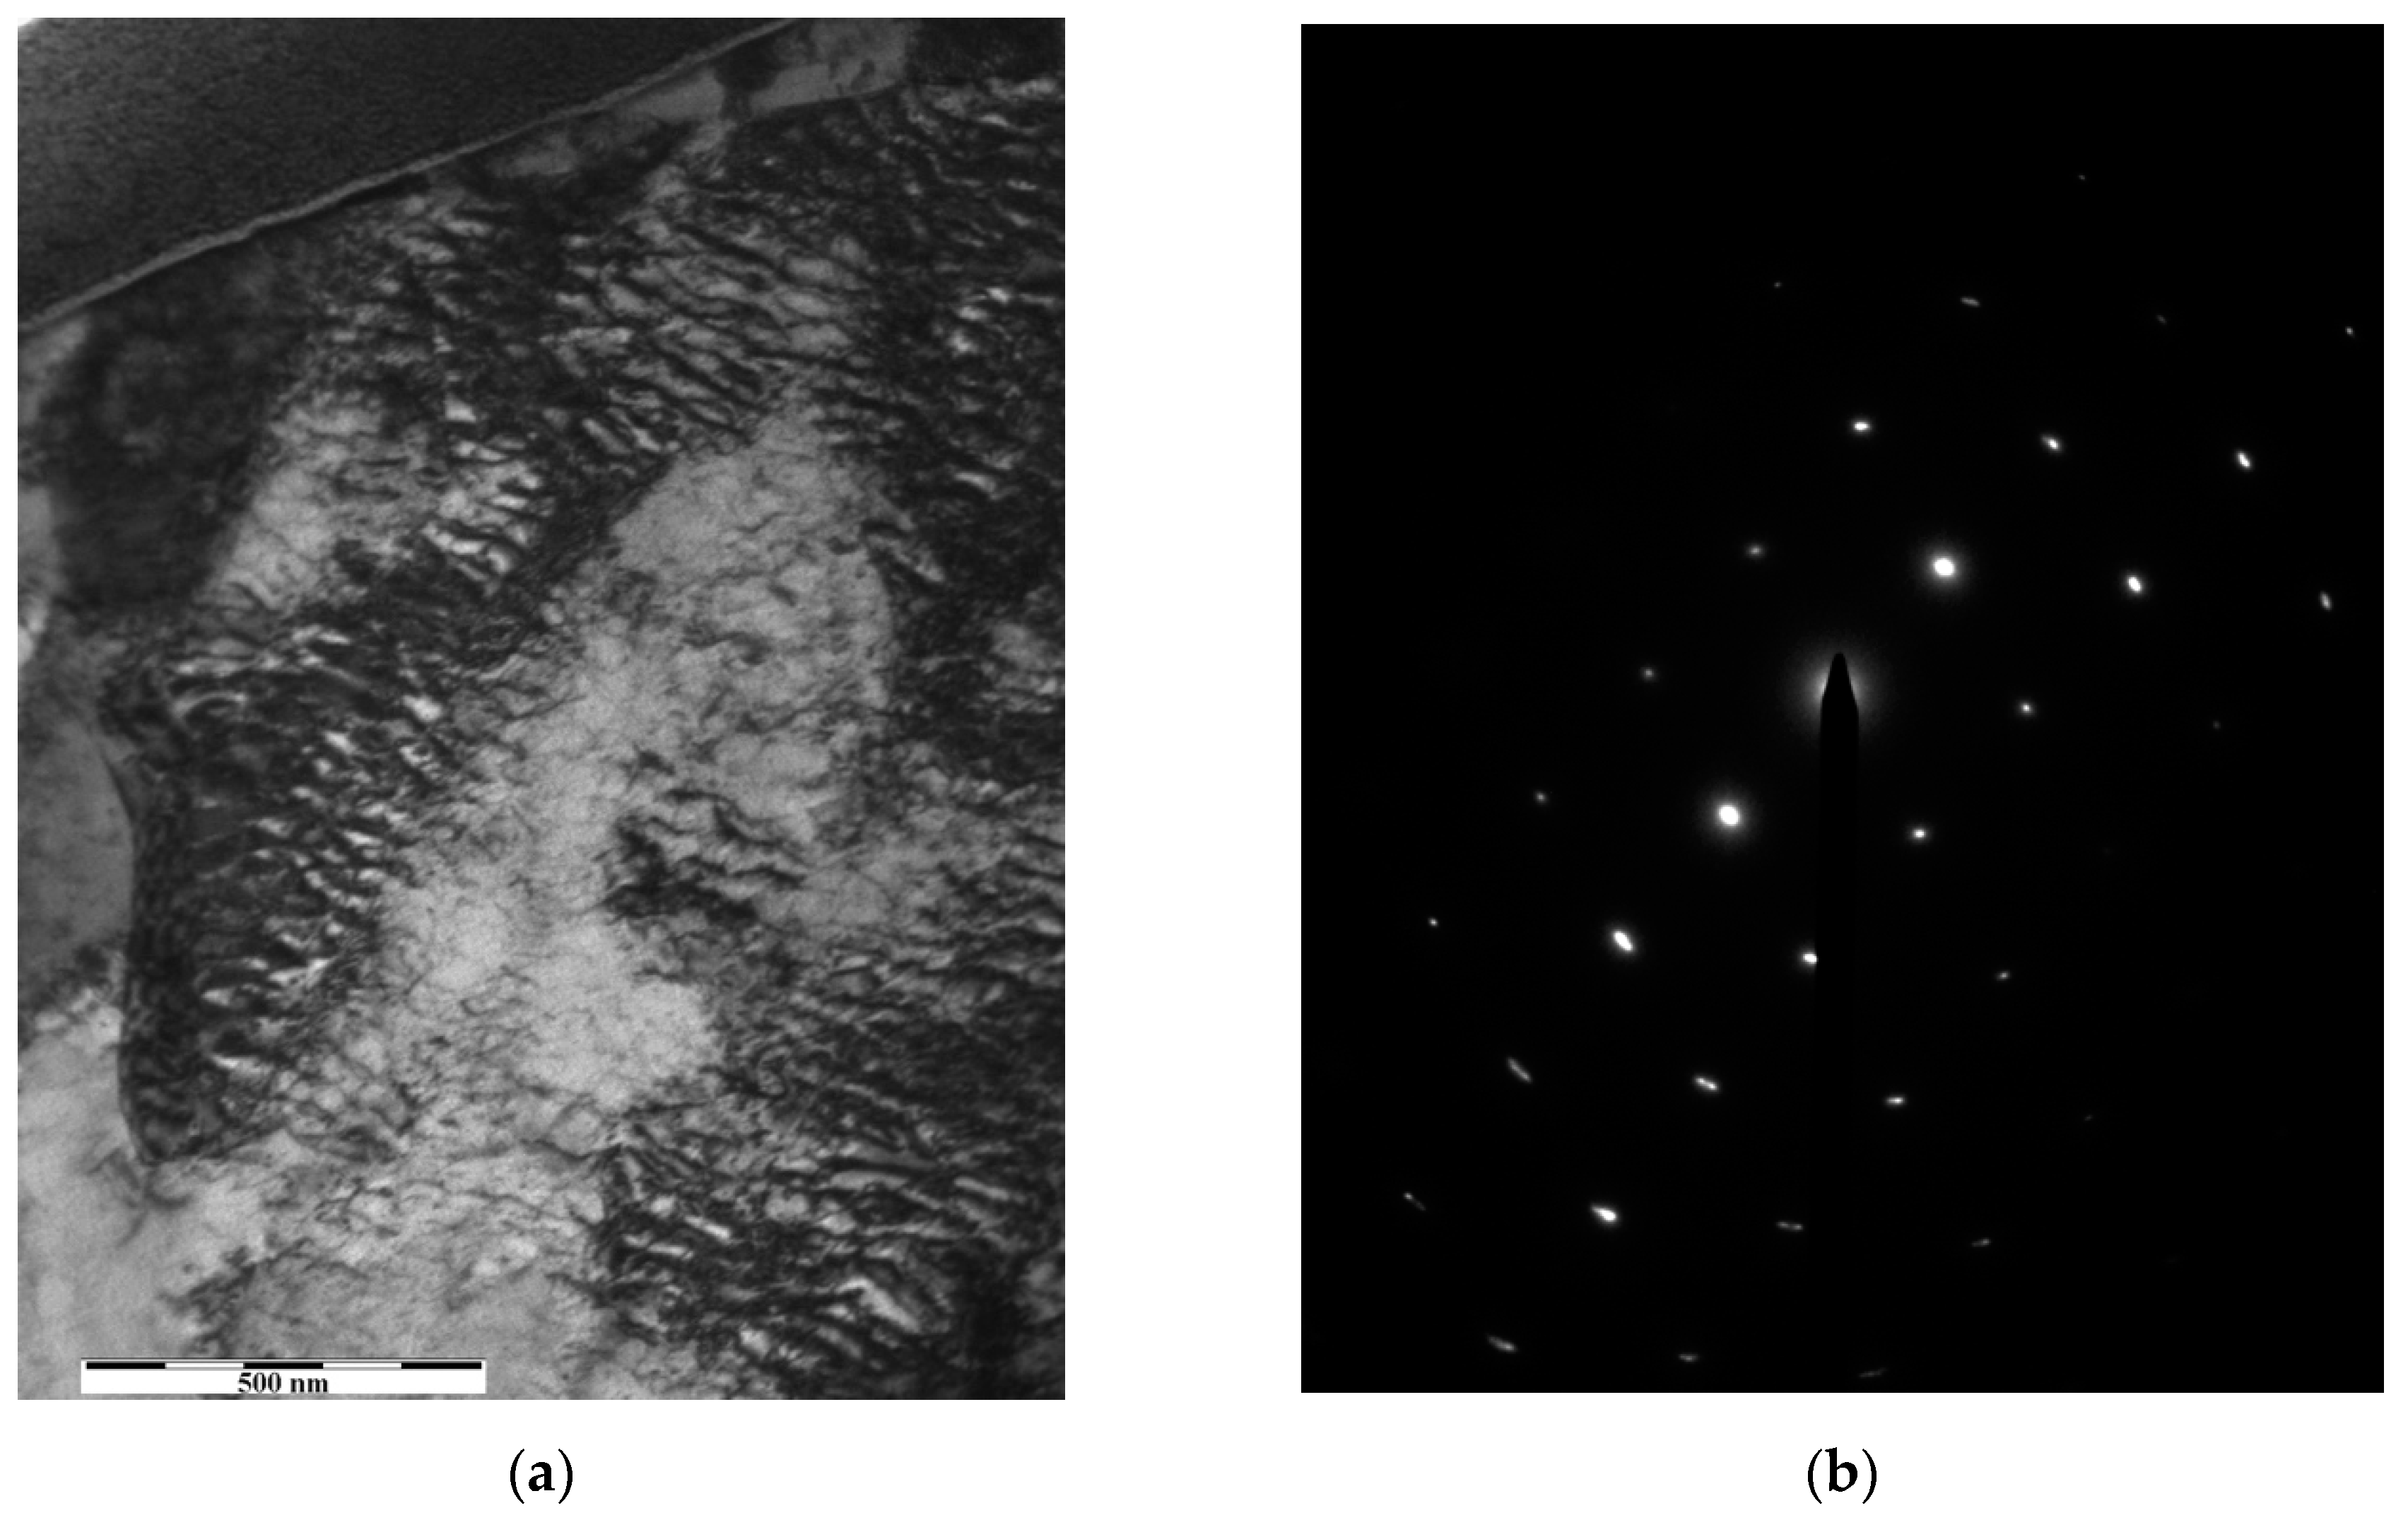
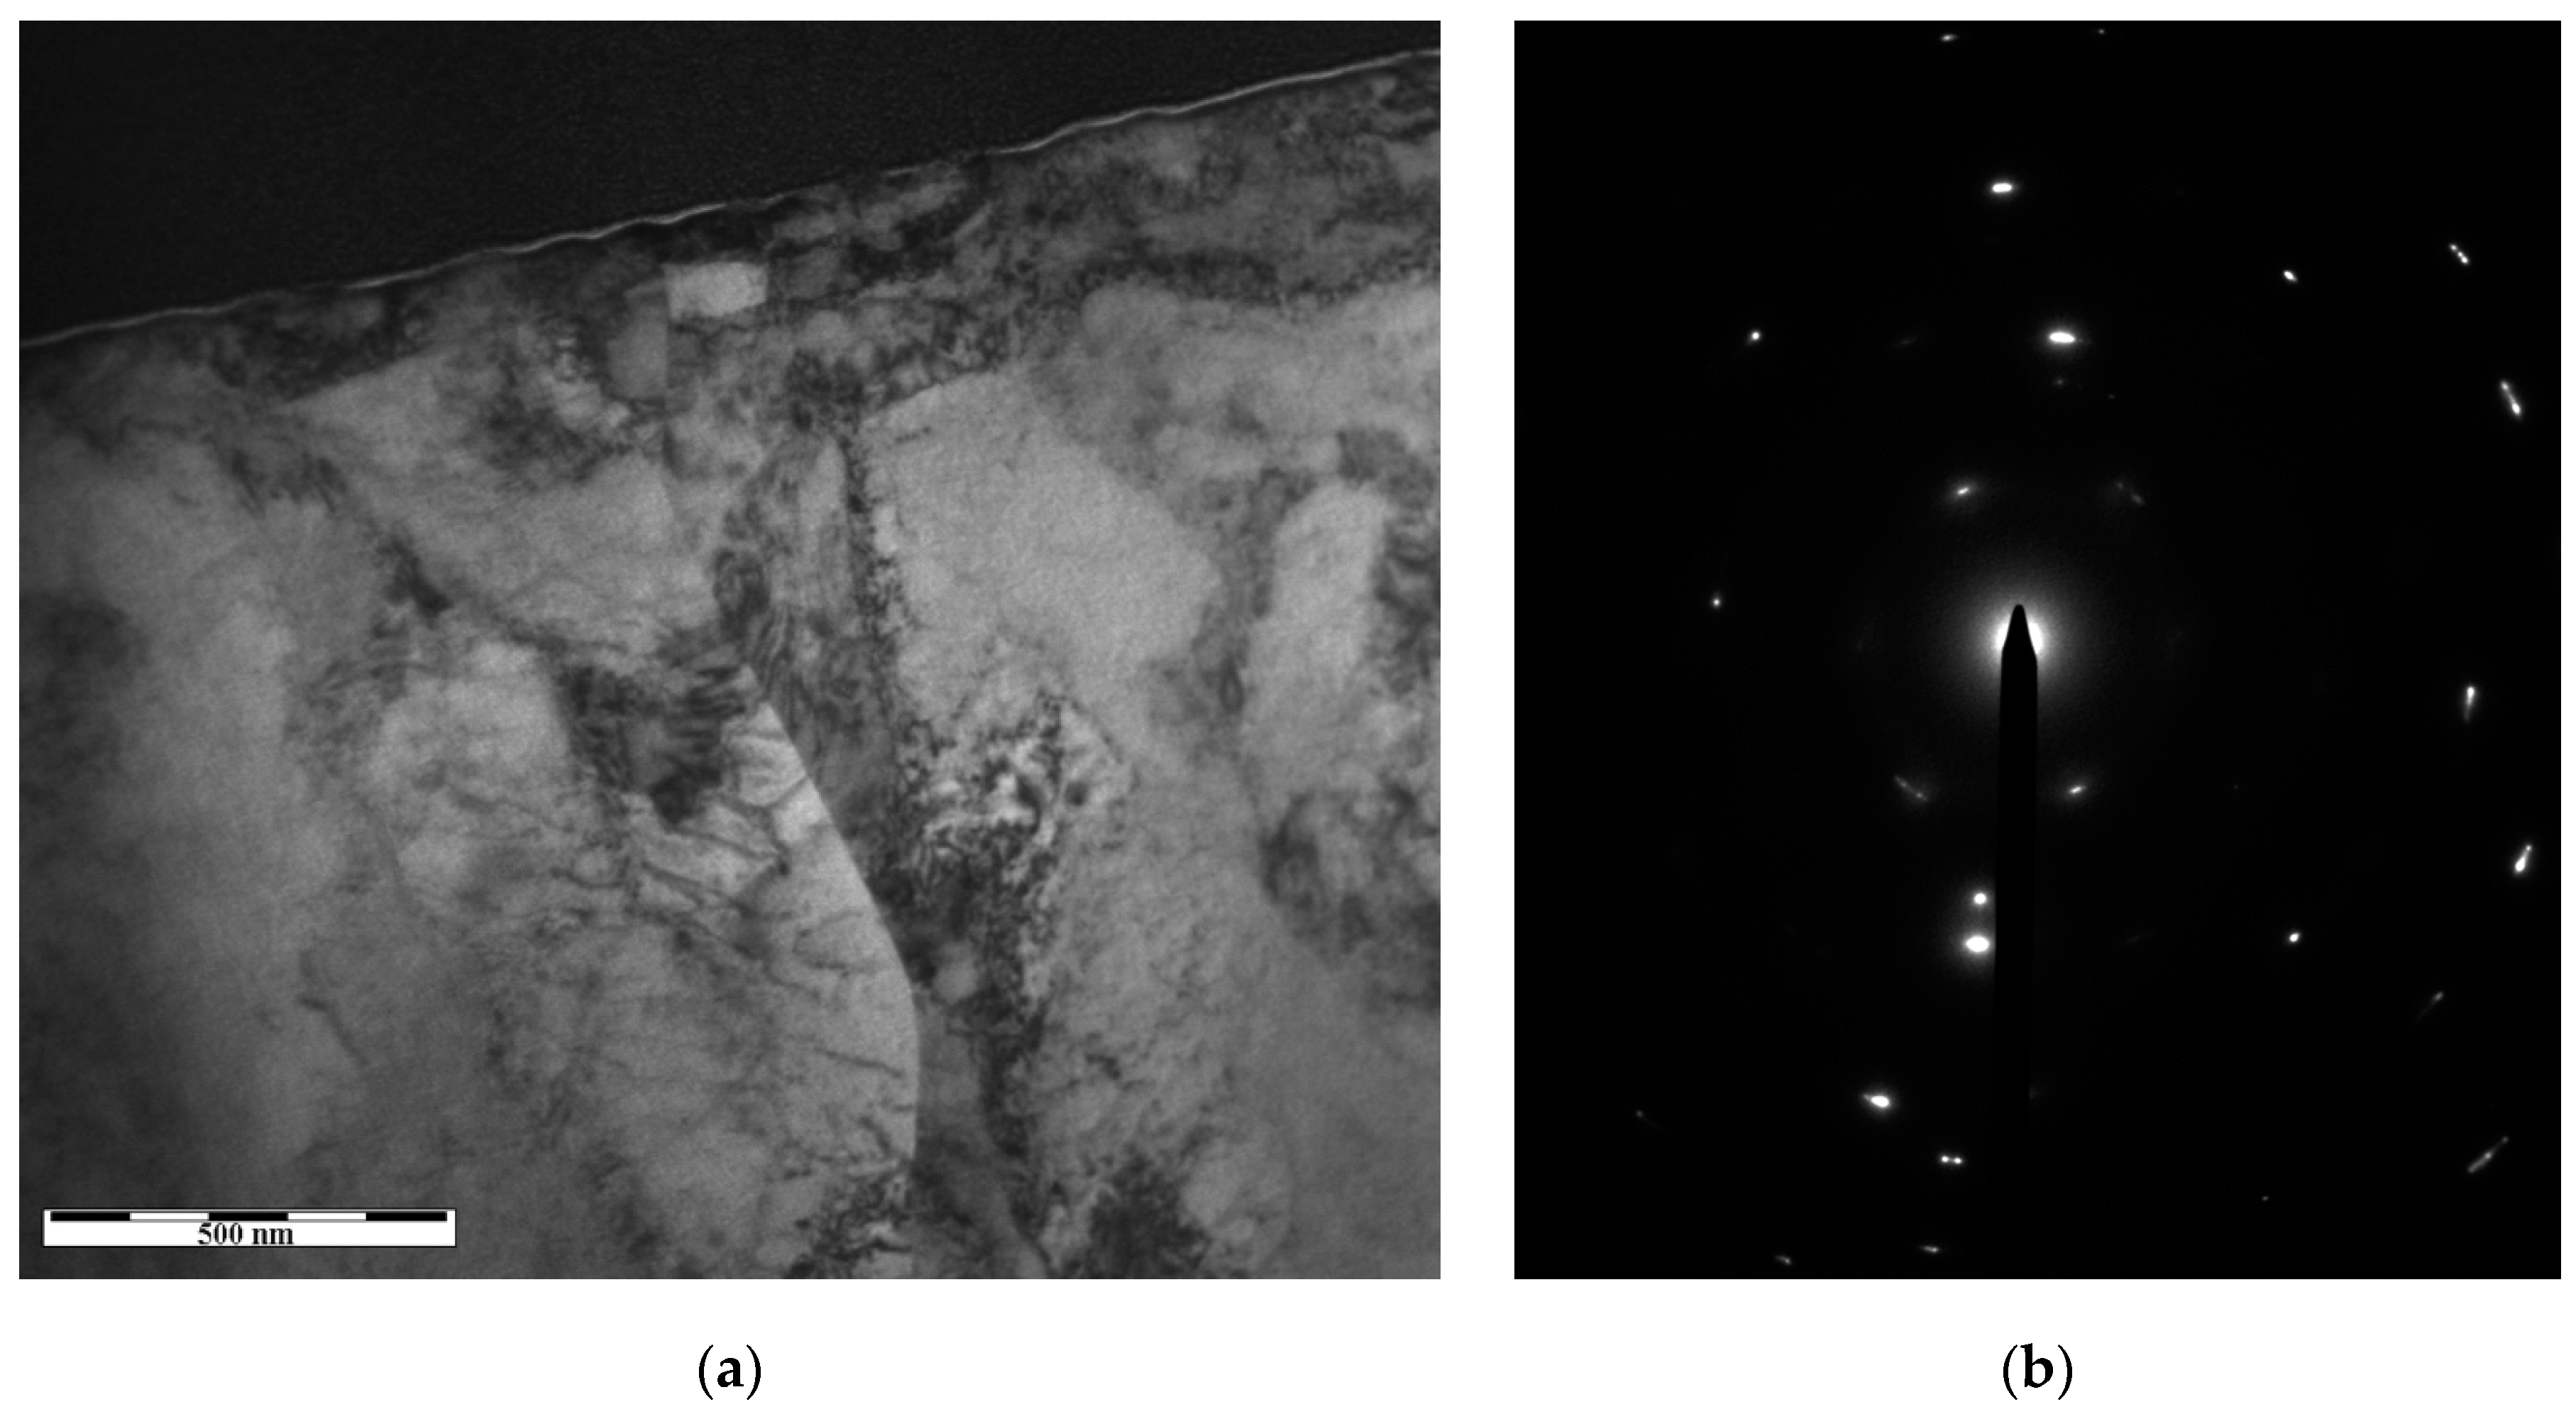
The microstructure of the surface layer of the copper specimen before and after treatment on experimental setup #1 was studied by means of transmission electron microscopy. An electron-microscopic image and a microelectron diffraction pattern of a surface layer region before treatment are shown, respectively, in
Figure 5a,b. This region had a homogeneous, non-fragmented structure with a dislocation density of the order of 10
11.
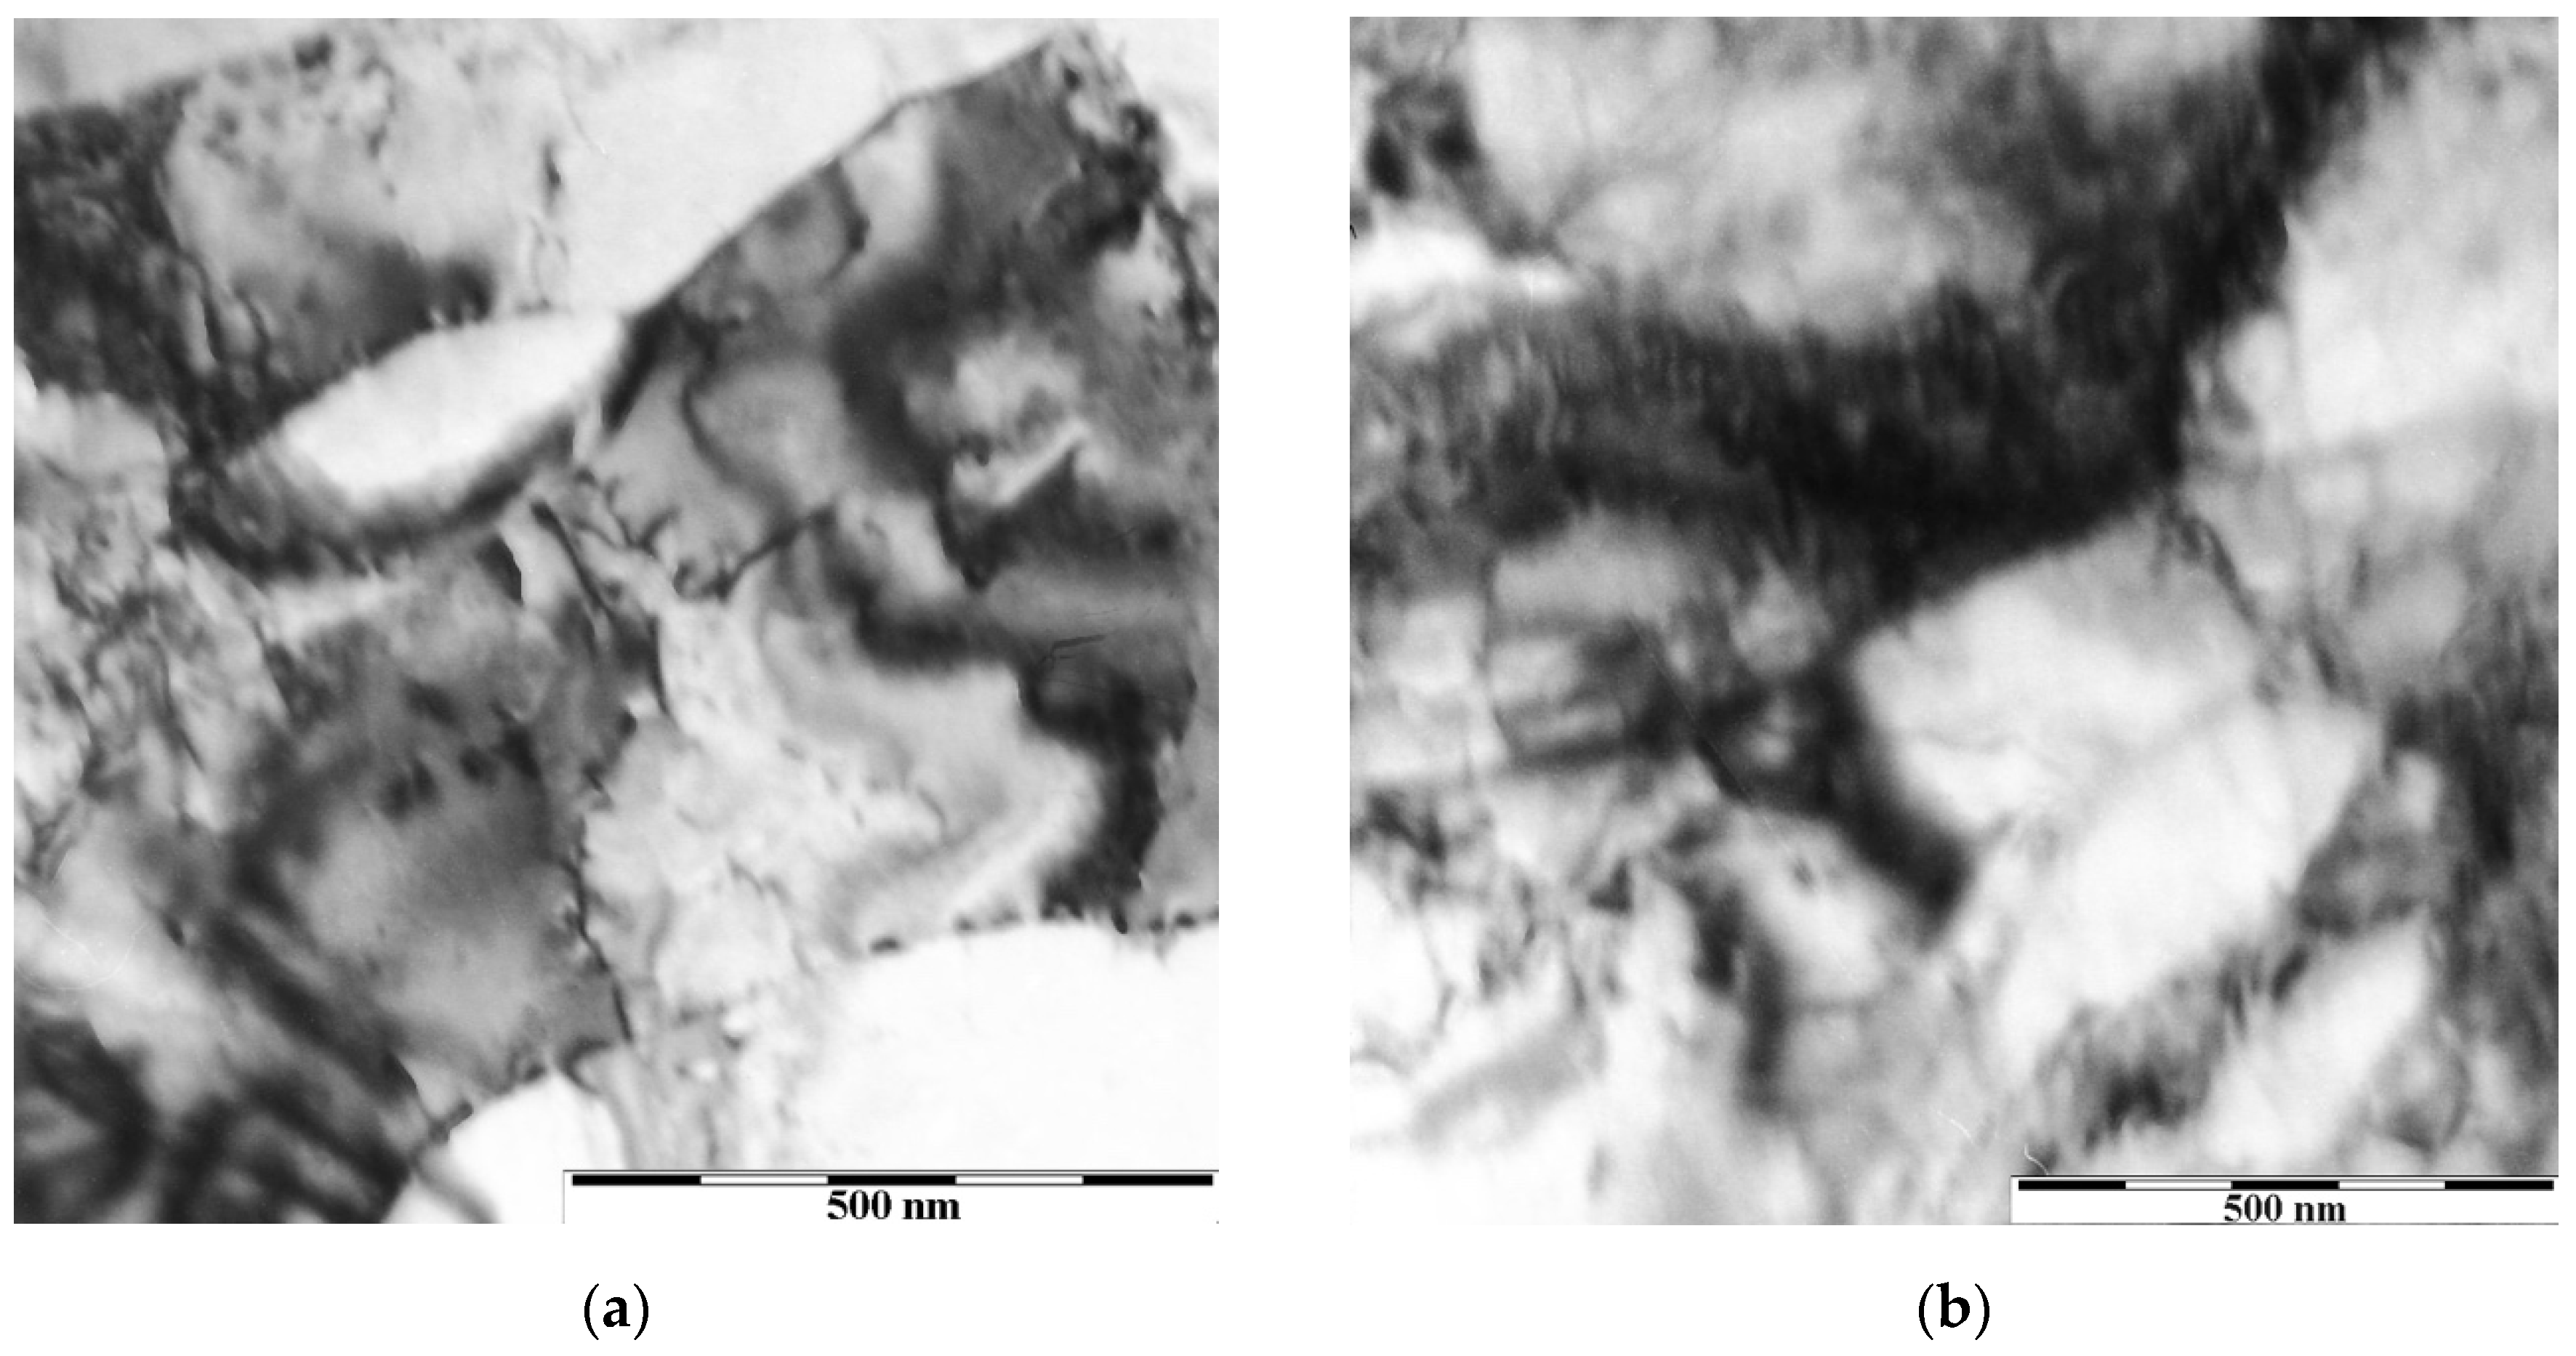
Figure 6a shows the microstructure of an intermediate layer with a thickness of 200 nm formed in the subsurface layer of the copper specimen after exposure to 10
5 pulses of REP DD. The results of dark-field microscopy and diffraction analysis allow us to conclude that the structure of the intermediate layer was fragmentary. The geometry of the corresponding reflexes shown in the microelectron diffraction pattern (
Figure 6b) indicates the presence of azimuthally disoriented ones.
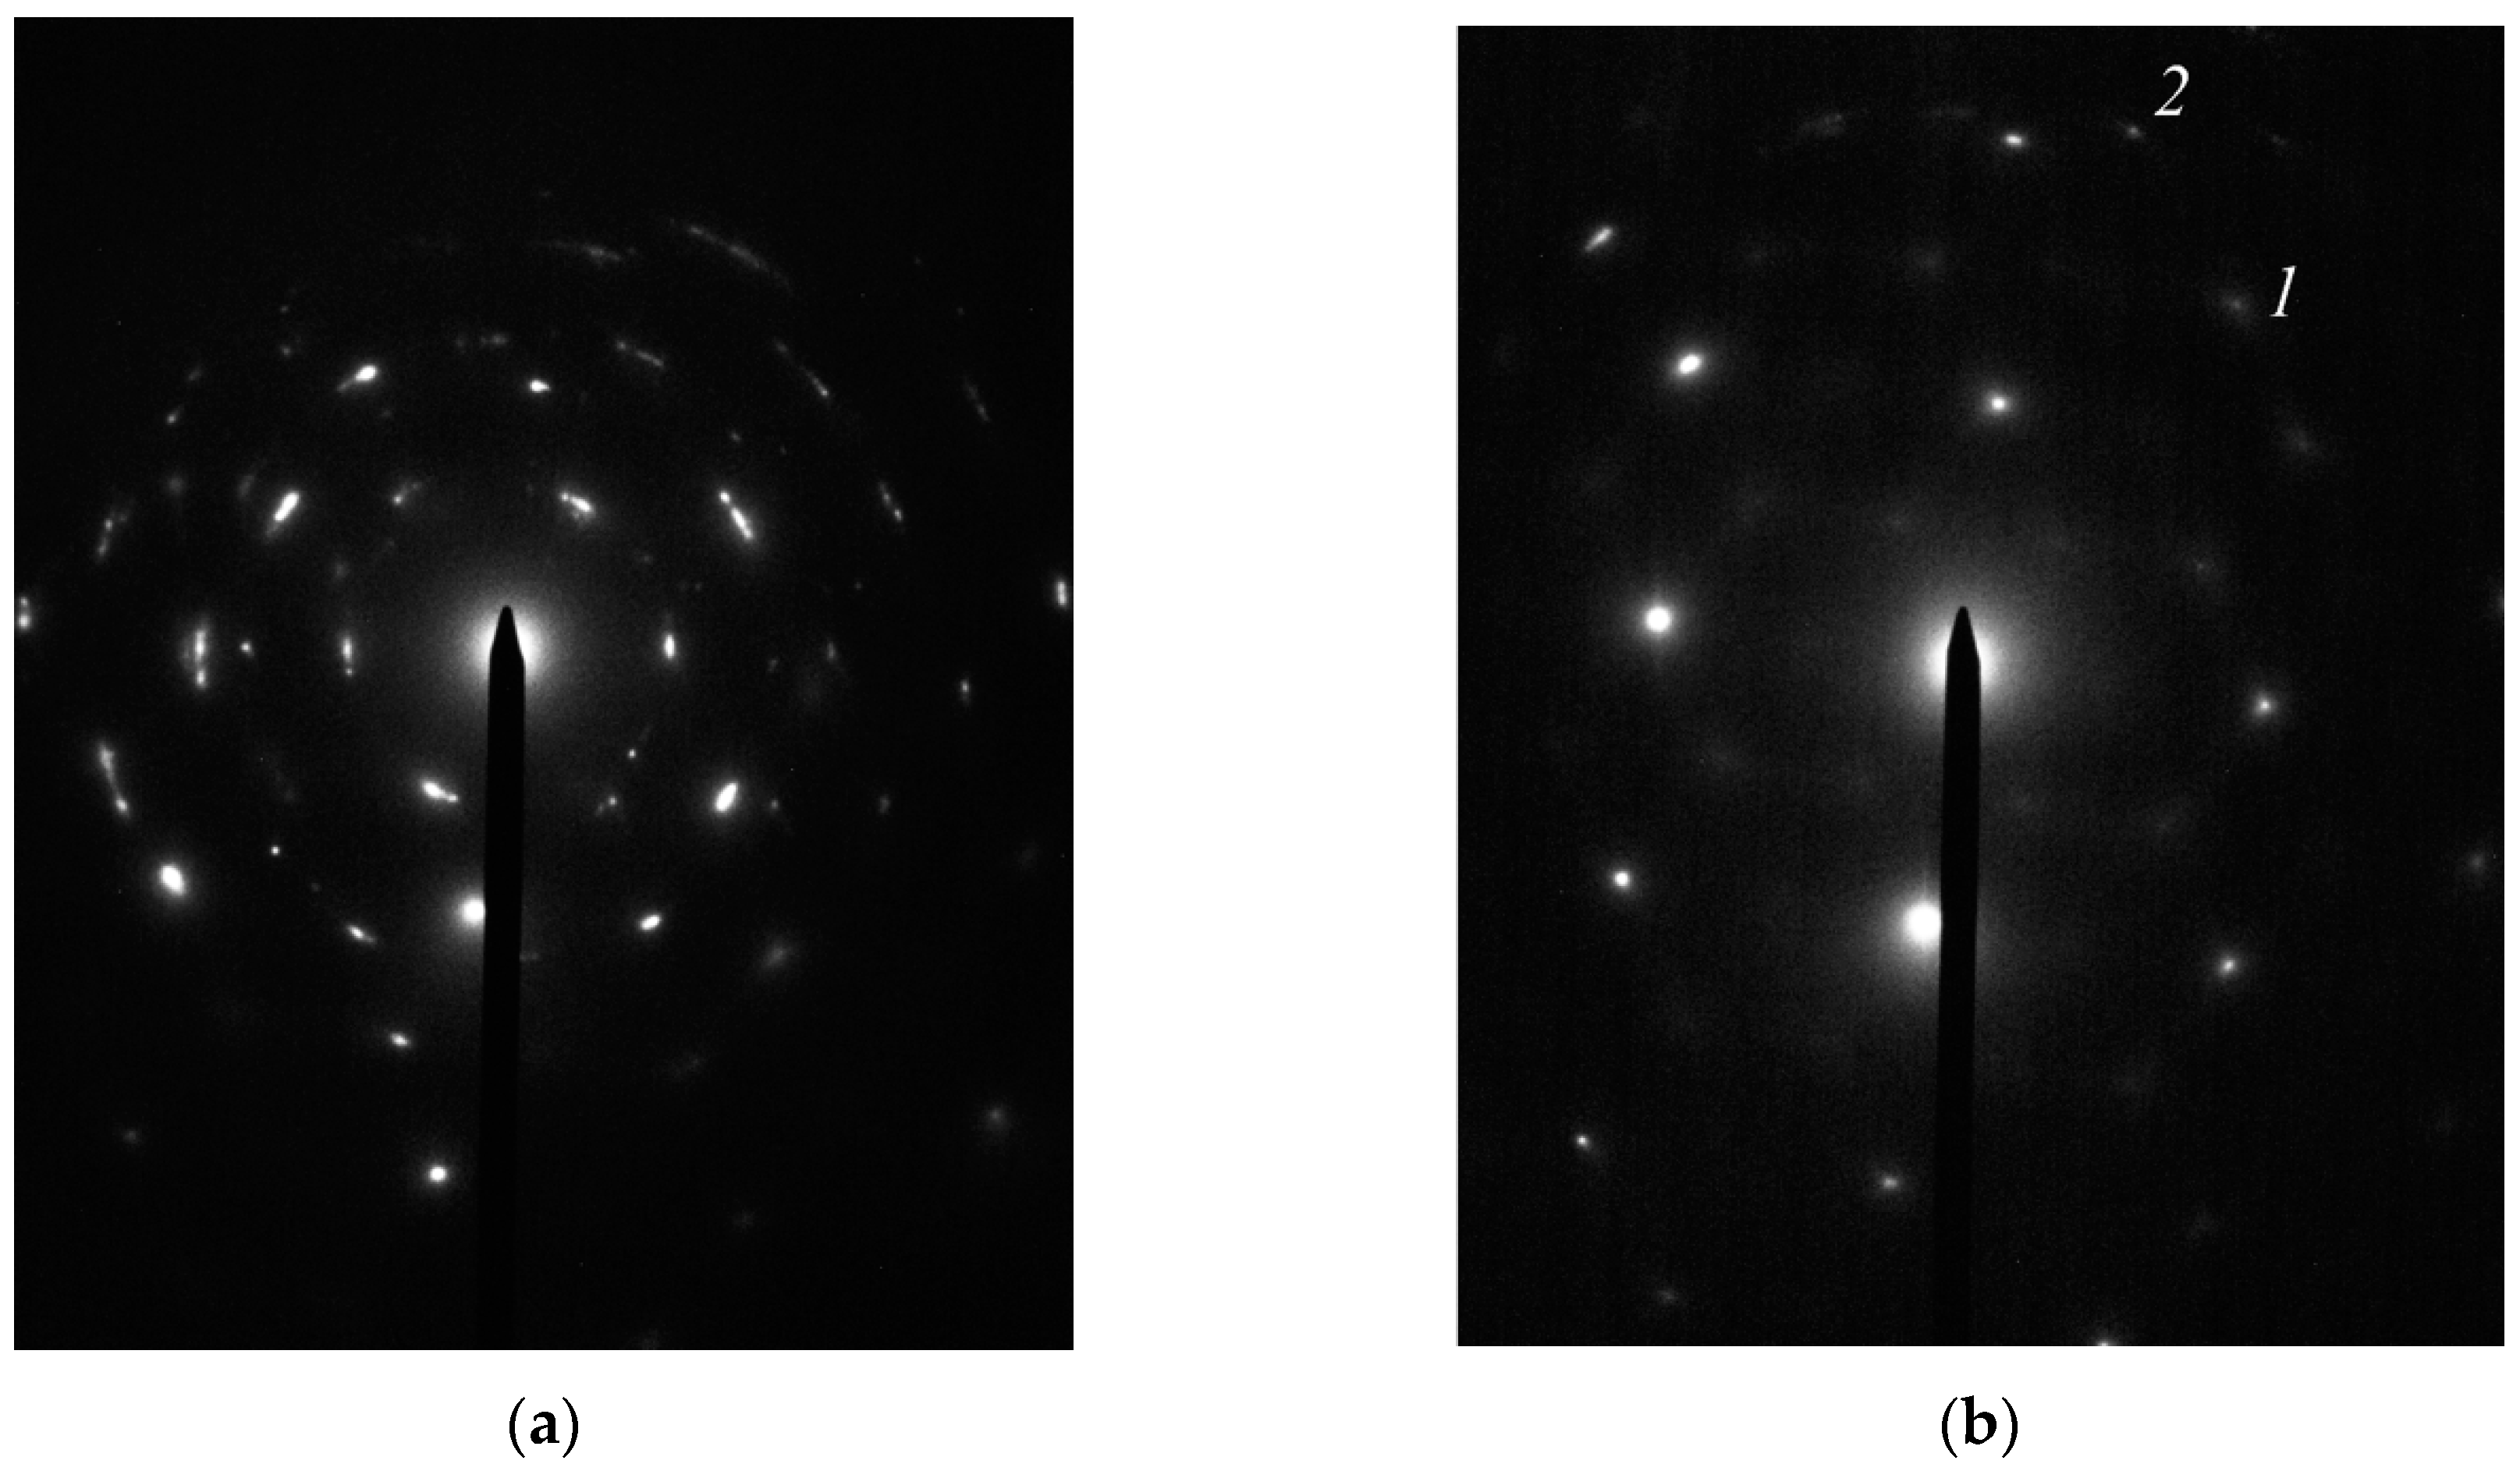
The microelectron diffraction pattern of the intermediate layer captured with a small diaphragm is presented in
Figure 7a. Reflexes of more than one axis of the zone are clearly visible in this image. When an electron beam in the microscope propagated in the direction of the material matrix, the geometry of the reflexes underwent changes (
Figure 7b). Thus, the reflex
1 belonged to the material matrix, and the reflex
2 corresponded to the intermediate layer (see
Figure 5b). This indicates the low-angles disorientation of the fragments of the intermediate layer relative to the bulk of the specimen.
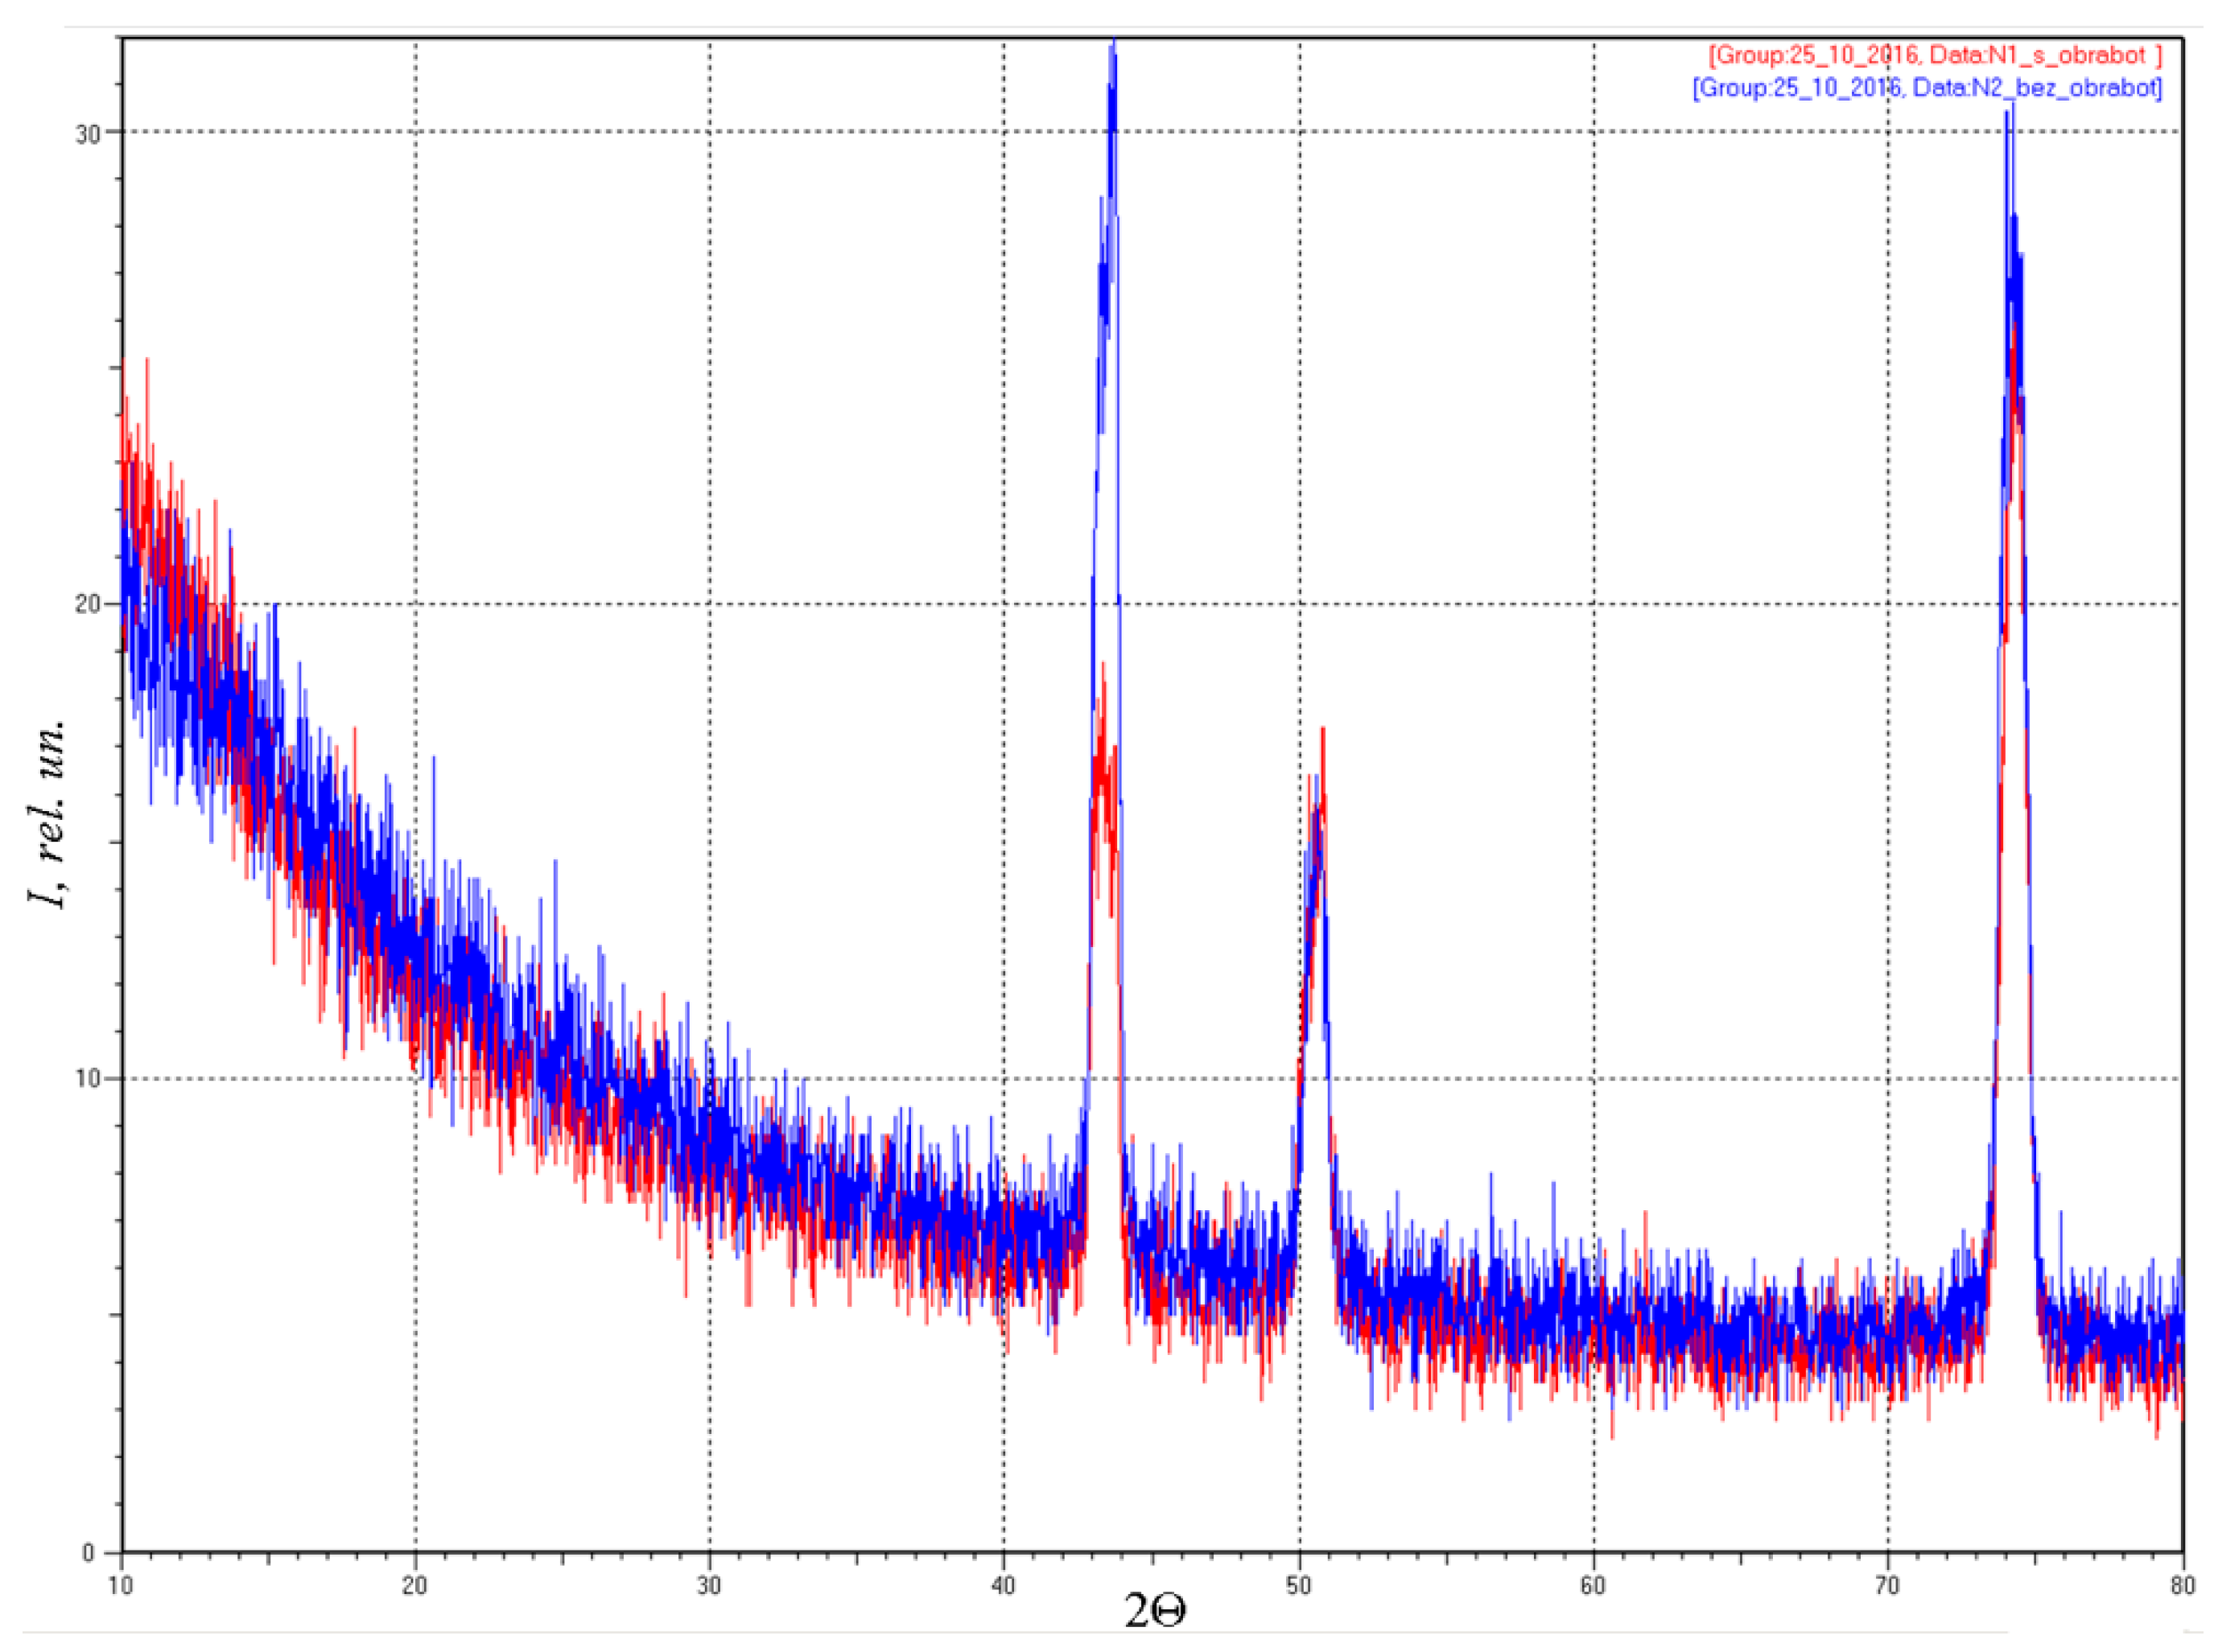
Table 1 shows the results of the X-ray diffraction study of the copper specimen surface before and after treatment with 10
5 diffuse discharge pulses.
Figure 8 shows the diffraction patterns. When analyzing the data obtained, no changes in the phase composition of the material were identified. However, the REP DD plasma treatment of the surface of copper specimens led to an increase in the lattice parameter and the microstrain from 3.6153 to 3.6214 nm and from 1.9 × 10
–3 to 2.9 × 10
–3, respectively. This indicates the appearance of tensile stresses in the surface layer of a sample.
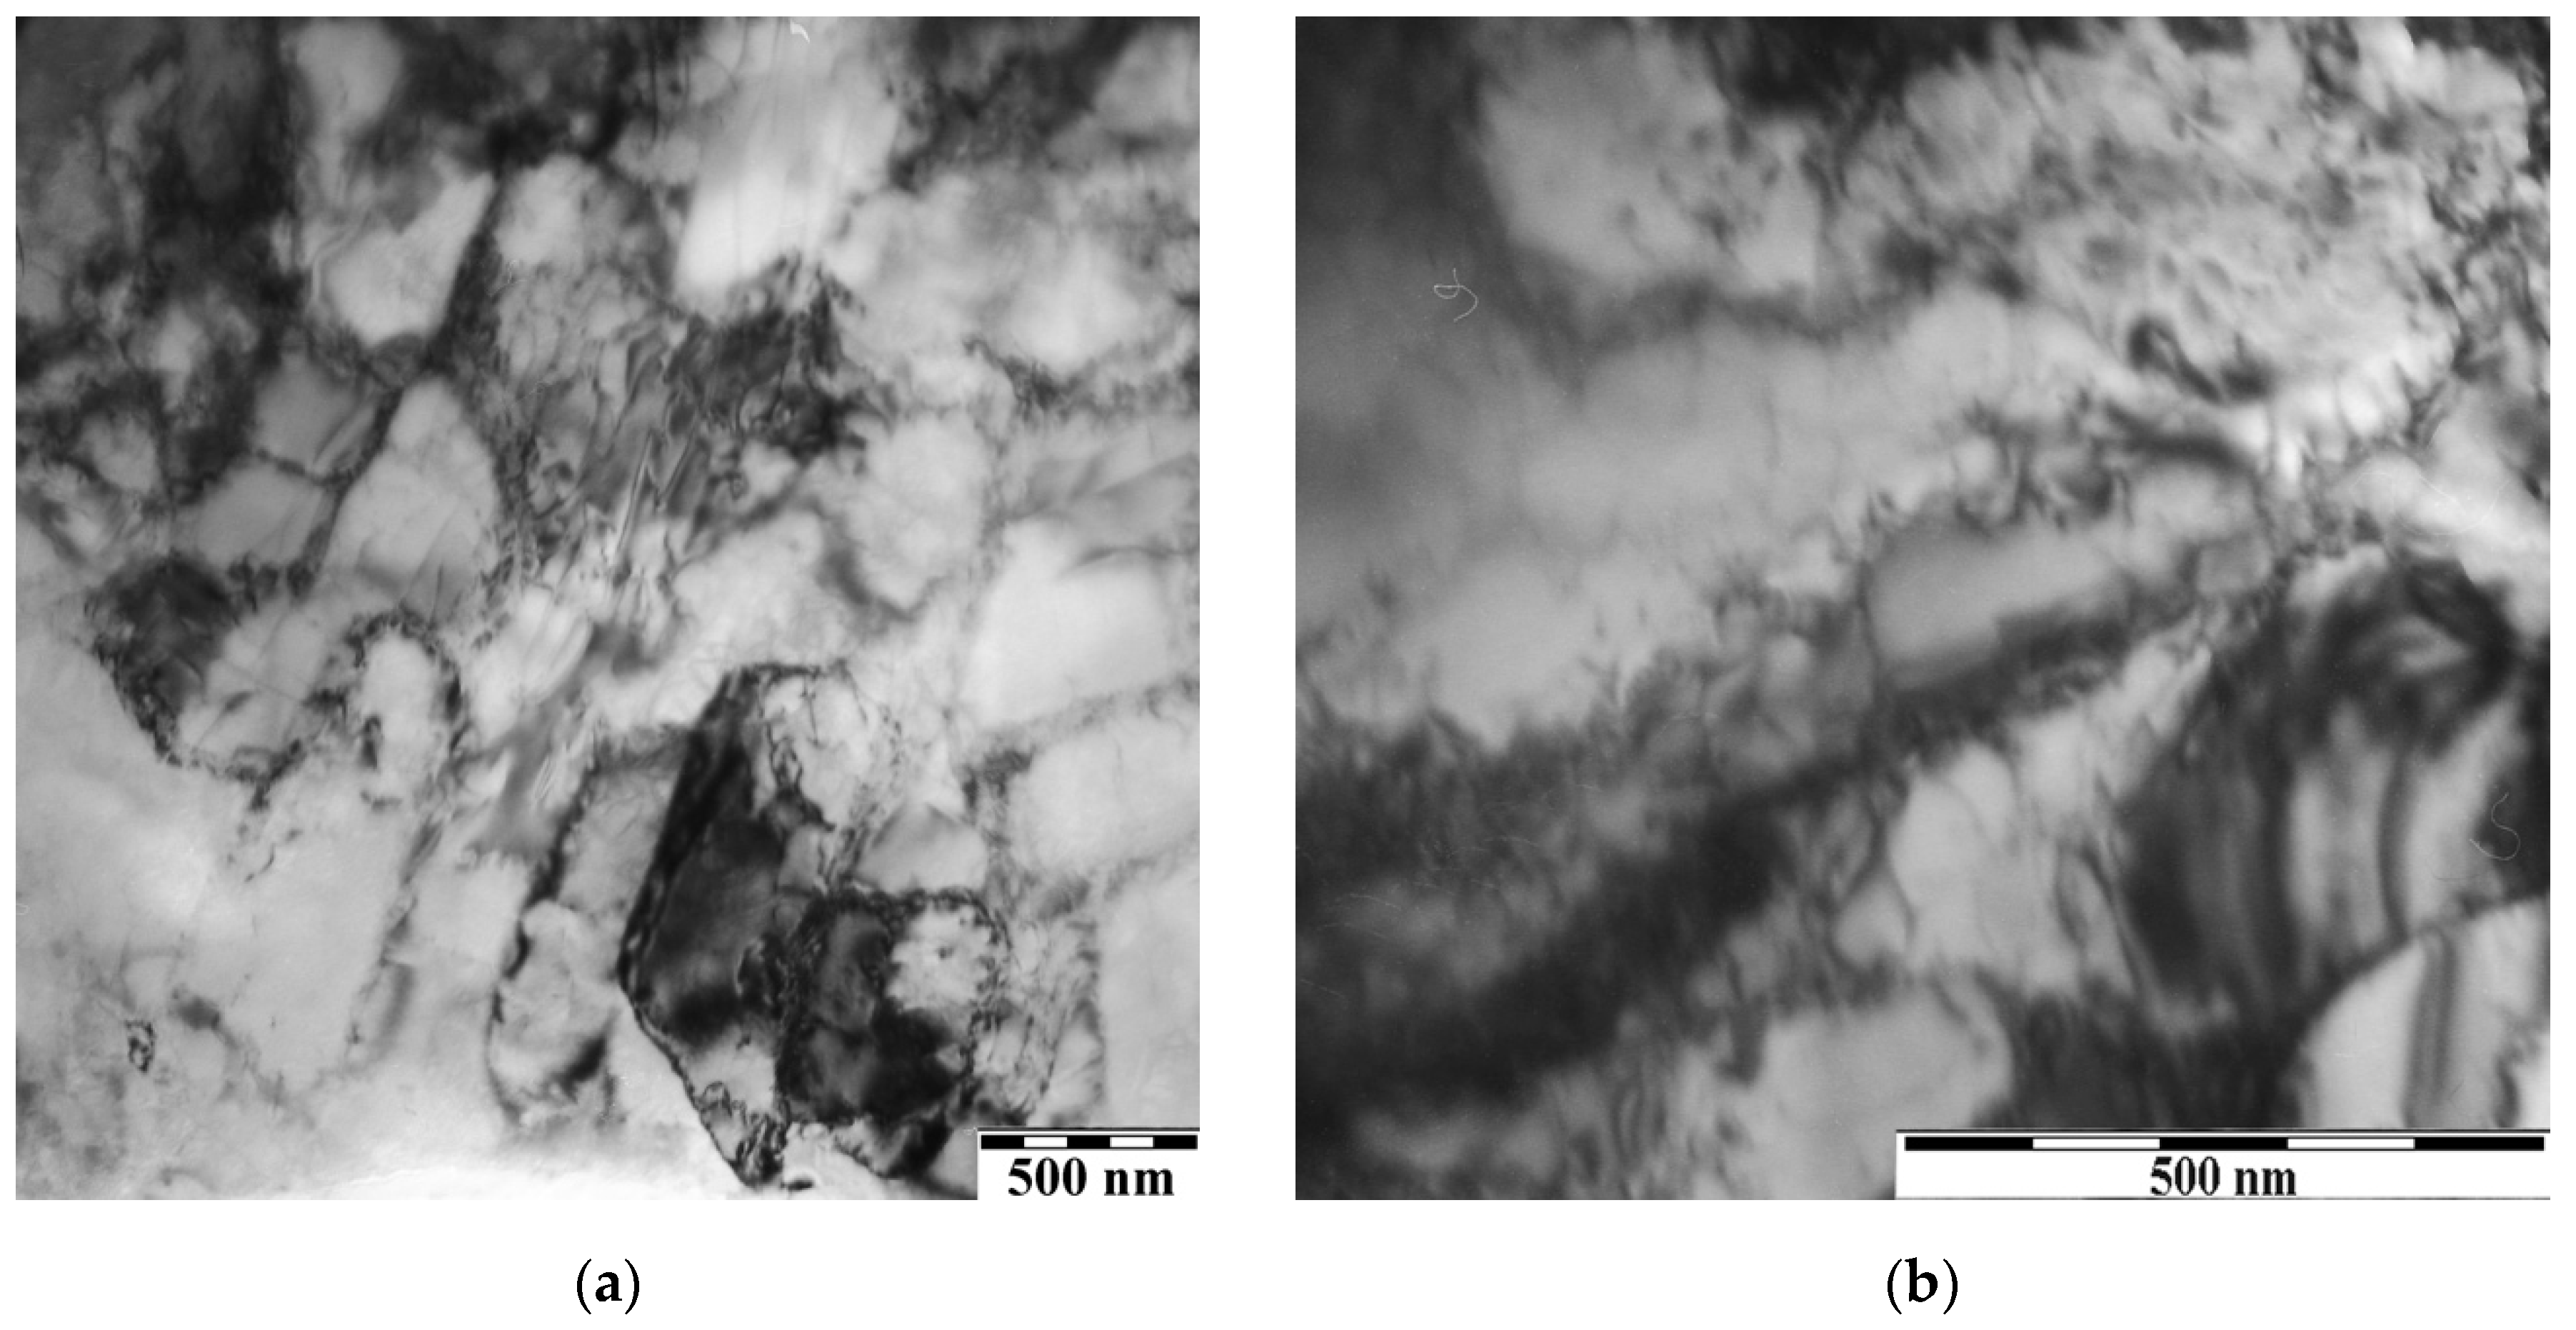
Using transmission electron microscopy, it was found that prior to the REP DD plasma treatment, the structure of the ST3 steel specimen was a polycrystalline aggregate with weakly disoriented fragmented grains of non-equiaxed shape. The study of the structure of ST3 steel specimens treated on setup #3 demonstrated that the structure remained a polycrystalline aggregate with a significantly modified intragranular structure. Thus, the band substructure formed in the junctions of the grain (
Figure 9a) and fragment boundaries, along with the formation of the dislocation network (
Figure 9b) were observed. The scalar dislocation density increased from 10
10 up to 4.1 × 10
10 cm
–2.
Due to the incompatibility of plastic deformation of adjacent steel volumes, extinction bend contours were detected in the steel structure (
Figure 10a). Formation of extinction bend contours in the ST3 steel structure indicated internal stress fields, sources (stress concentrators) of which were interfaces between fragments and a band substructure (
Figure 9a), grains, as well as particles of the second phase (
Figure 10b).
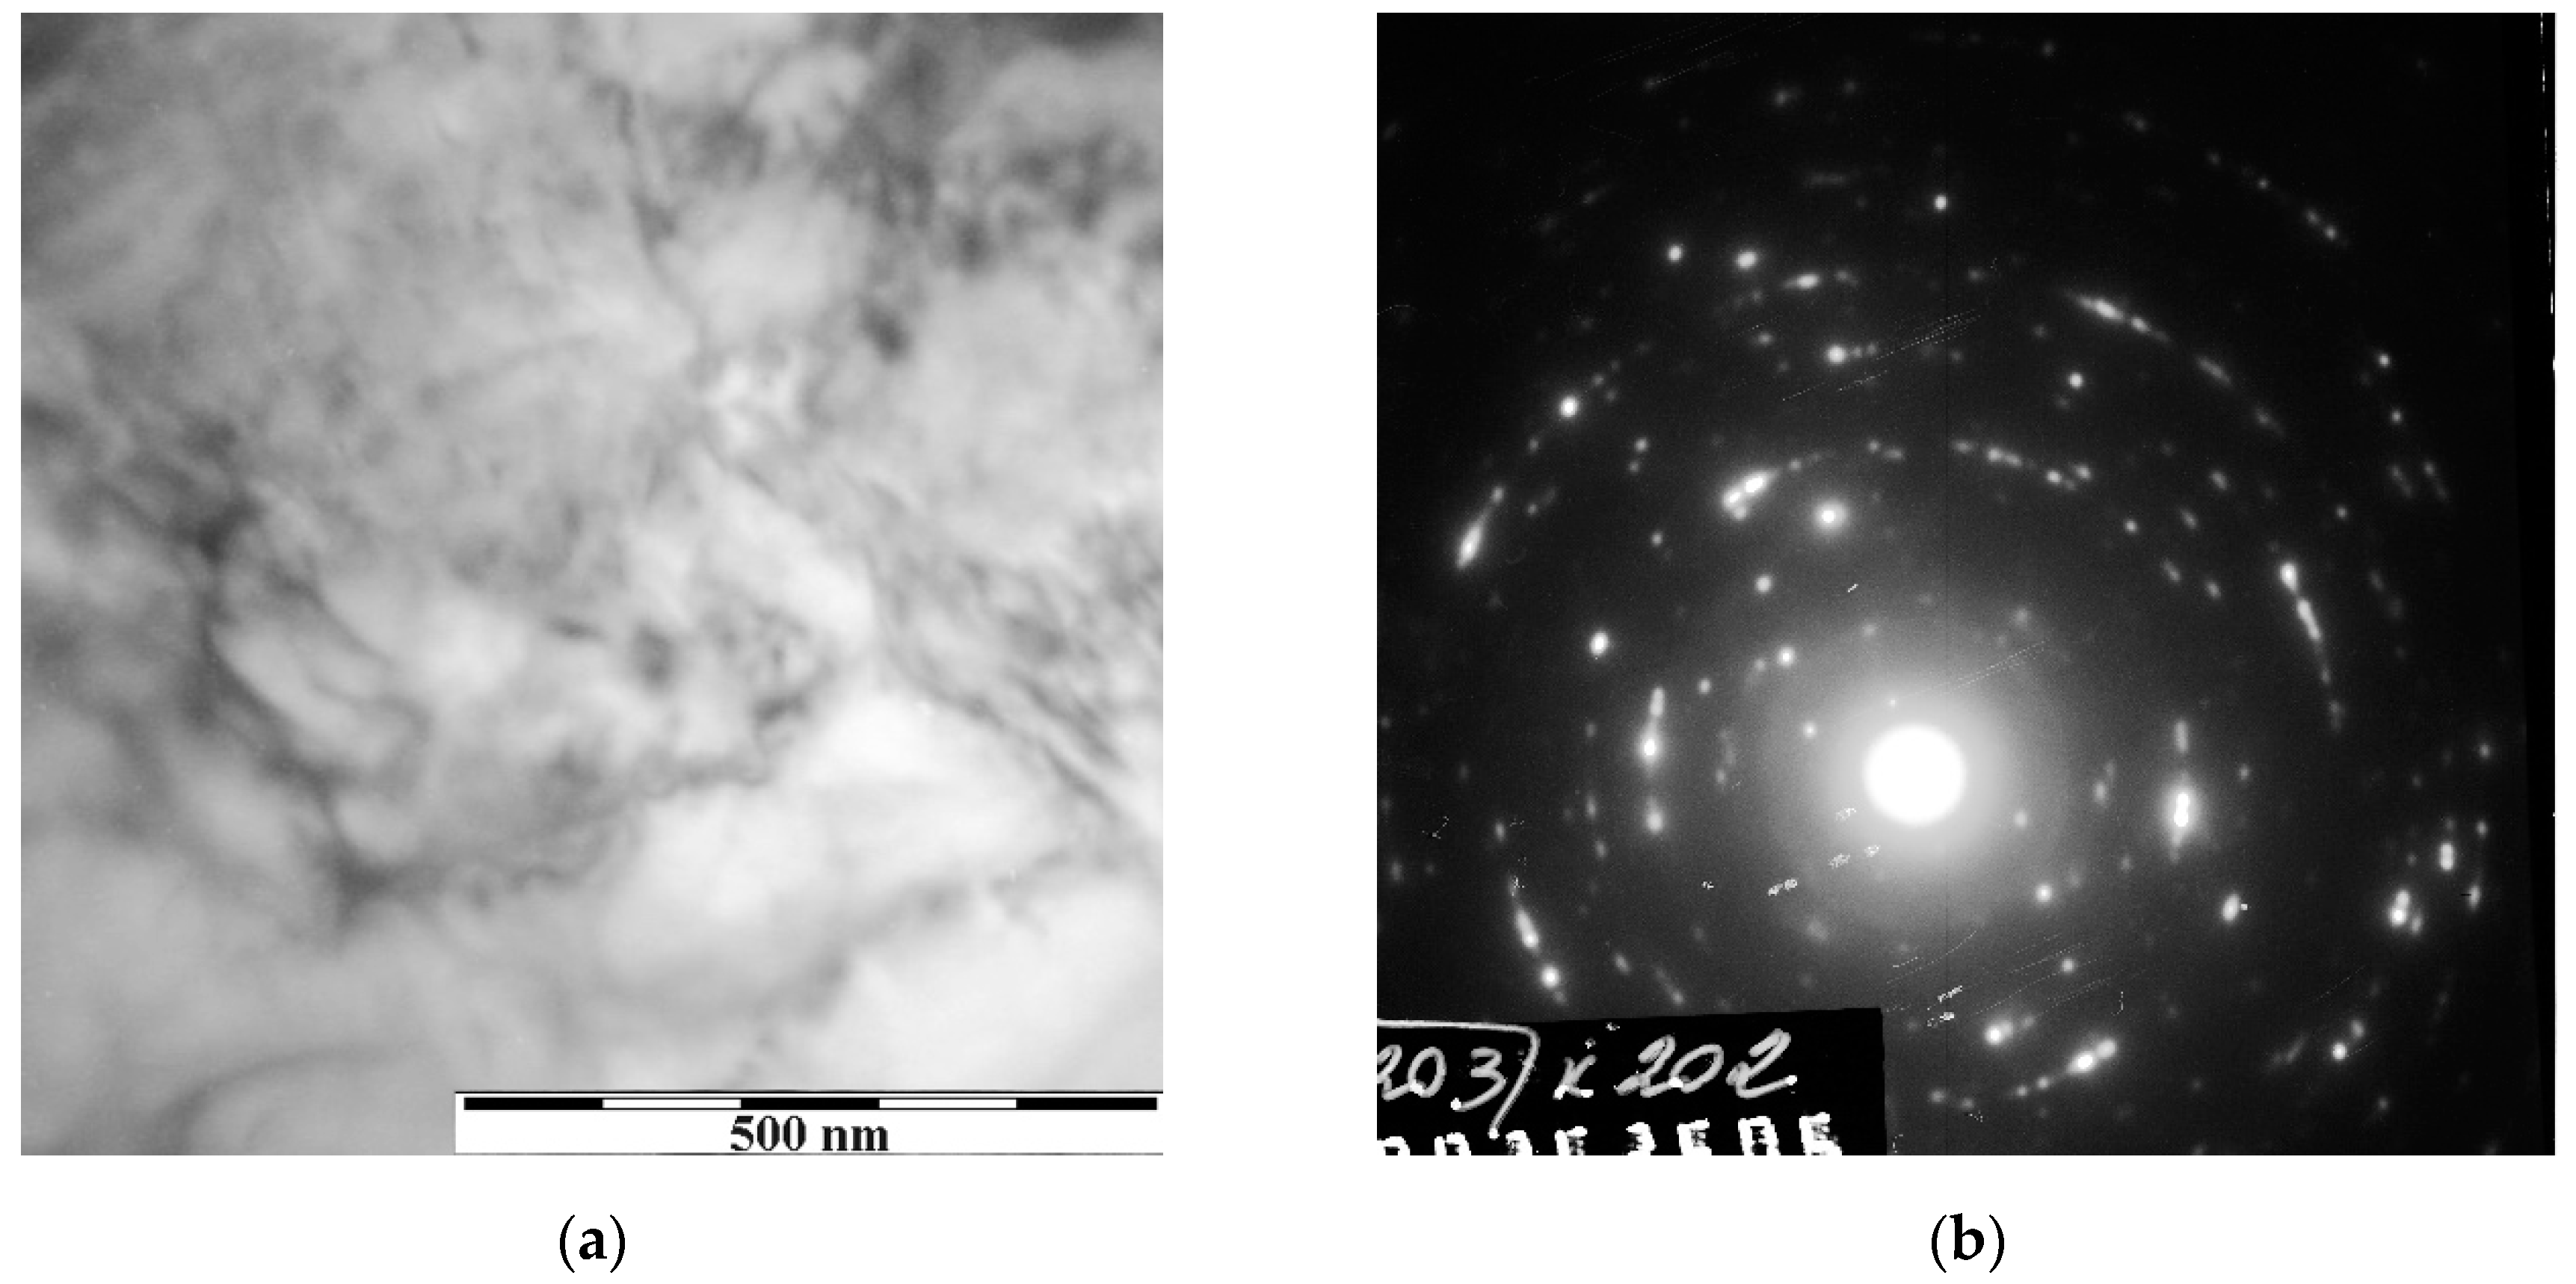
Moreover, formation of nanoscale (30–50 nm) regions (
Figure 11a) was observed at the boundaries of grains and fragments. The quasi-ring structure of the microelectron diffraction pattern (
Figure 11b) obtained for such specimen indicated small sizes of a similar region. The frequency of occurrence of the carbide phase reflections in electron microdiffraction patterns multiplied by a factor of 2–3. This fact demonstrates the fracture (dissolution) of the initial iron carbide particles, the redistribution of carbon within the grain bulk, and the redeposition of carbide phase particles.
4. Discussion
Three experimental setups generating a dense low-temperature plasma, which are formed during the runaway electron preionized diffuse discharge (REP DD) in an atmospheric-pressure gaseous medium, have been developed.
The first one is a small-sized setup that provides plasma treatment in the mode when gas flows through the discharge chamber. Two other setups allow surface plasma treatment of specimens made of different materials with dimensions up to 20 mm × 400 mm. One of them operates in ambient air in the mode of pumping of a gas through the discharge gap, the other in the mode of circulation of the working gas in the discharge chamber. Due to differences in the design and parameters of the interelectrode gap, the flow rate of the working gas, and the repetition rate of high-voltage pulses for each experimental setup, a huge amount of data on the modification of the metal surface was acquired. The data on the effect of the REP DD plasma on the structure and chemical composition of the metal surface treated on different setups in similar experimental conditions (number of discharge pulses, temperature, and electron concentration) were compared. The surface characteristics obtained from the AES spectra allow us to conclude that plasma treatment by 105 pulses provides ultra-fine cleaning of the surface from carbon contamination. The surface free energy of treated specimens increases up to 3 times, while the other surface properties, such as hardness and roughness, remain almost unchanged. Due to the bombardment of the specimen surface with runaway electrons and negative ions from the plasma of a diffuse discharge, decomposition of the –CHx groups occurs. This leads to the cleaning of the subsurface layer and the surface of a metal specimen from carbon and hydrogen, providing an increase in free hydrogen bonds. The experiments showed that after the REP DD plasma treatment by 105 pulses of the copper specimen surface, an intermediate layer is formed to a depth of 200 nm. This layer has a fragmented structure and is disoriented with the specimen matrix. After treatment, the phase composition of the copper surface remains unchanged, but the lattice parameter and microstress are increased in the thin surface layer with low-angle disorientations of fragments. The structural phase transformation revealed in ST3 steel specimens indicates that the diffuse discharge treatment has a thermomechanical effect on the material. Formation of additional interfaces, an increase in the density of scalar dislocations, formation of internal stress fields, and transformations of a carbide subsystem indicate a multistage process occurs in ST3 steel during the diffuse discharge plasma treatment.

 and
and 


