Review

Experiments Designed to Study the Non-Linear Transition of High-Power Microwaves through Plasmas and Gases

1
Physics Department, Technion, Israel Institute of Technology, Haifa 32000, Israel
2
Institute of High Current Electronics, Russian Academy of Sciences, Tomsk 634055, Russia
3
Electrical Engineering and Computer Science Department, University of Michigan, Ann Arbor, MI 48109, USA
4
Faculty of Physics, Weizmann Institute of Science, Rehovot 36100, Israel
5
Physics Department, Tomsk State University of Control Systems and Radioelectronics, Tomsk 634050, Russia
*
Author to whom correspondence should be addressed.
Plasma 2019, 2(1), 51-64; https://doi.org/10.3390/plasma2010006
Submission received: 31 January 2019 / Revised: 28 February 2019 / Accepted: 4 March 2019 / Published: 8 March 2019
(This article belongs to the Special Issue High-Power Microwave and Plasma Interactions)

Abstract

:
The interaction of powerful sub-picosecond timescale lasers with neutral gas and plasmas has stimulated enormous interest because of the potential to accelerate particles to extremely large energies by the intense wakefields formed and without being limited by high accelerating gradients as in conventional accelerator cells. The interaction of extremely high-power electromagnetic waves with plasmas is though, of general interest and also to plasma heating and wake-field formation. The study of this subject has become more accessible with the availability of sub-nanosecond timescale GigaWatt (GW) power scale microwave sources. The interaction of such high-power microwaves (HPM) with under-dense plasmas is a scale down of the picosecond laser—dense plasma interaction situation. We present a review of a unique experiment in which such interactions are being studied, some of our results so far including results of our numerical modeling. Such experiments have not been performed before, self-channeling of HPM through gas and plasma and extremely fast plasma electron heating to keV energies have already been observed, wakefields resulting from the transition of HPM through plasma are next and more is expected to be revealed.

1. Introduction

When a high energy density laser, producing high intensity (>1016 W/cm2) ultra-short pulses (~30 fs), is directed into a high density plasma (~1018 cm−3), the extremely high laser electric fields act as a ponderomotive force generating a charge separation in the plasma, a wake. The latter is accompanied by strong electric fields, a wakefield (>100 GV/m) which can be used instead of a vacuum accelerator cell as an accelerating gradient for charged particles [1,2,3,4]. The characteristic times and lengths of the plasma in such wakes are tens of fs and tens of µm respectively which make diagnostics rather difficult. There are several sophisticated experimental studies using a unique longitudinal interferometric technique [5] and time-resolved polarimetry with plasma shadowgraphy [6] to measure plasma density gradients and the parameters of the electron bunches during the formation and evolution of a wake. Most of the diagnostics was focused on the accelerated particles or using the driving laser to diagnose the plasma density itself [7,8,9,10]. An experimental system to study this problem is affordable only to a few laboratories because of the unique features of such laser system and the expenses involved.
In addition to exciting plasma waves by laser pulses, there is a growing interest in the possibility of driving plasma waves with pulsed high-power microwaves (HPM). The study of the interaction of HPMs with plasma is of interest in space and plasma physics with a broad range of applications, such as plasma production and heating for tokamaks, stellarators, mirror machines, charged particles acceleration, plasma waveguides and antennas, etc. [11,12,13,14].
Radio-frequency (RF) wakefield generation was first realized by Y. Nishida et al. [15] using 10 kW, 2.86 GHz microwave pulses interacting with a plasma of 2 × 1011 cm−3 density. The plasma density modulation up to 40% was obtained when the microwave pulse duration is near the ion oscillation period. Other experimental studies of plasma wakefield generation, ponderomotive force effects, and self-focusing of microwaves (with frequencies in the range of 3–10 GHz) in plasma were also carried out [16,17,18]. All these experiments were characterized by a relatively low power microwave sources (10–250 kW) with much longer pulses (60 ns–1 µs) than the periods of the plasma electron and ion oscillation.
The mechanism of wakefield generation, which is relevant both to laser and microwave drives, has also been studied using numerical simulations for non-magnetized (e.g., [19,20]) and magnetized plasma [21,22,23,24]. Note, that even for extremely high power [several GigaWatt (GW)] microwave beams cannot compete with the power density of focused laser beams, and consequently the resulting accelerating gradients, which are several orders of magnitude larger, allowing the generation of wake fields >100 GV/m.
It was also suggested that the interaction of HPMs with magnetized plasma can be used in other schemes to realize particle accelerators and high-power coherent microwave sources. Shvets et al. [24] introduced two possible schemes for particle acceleration, one of which relies on magnetically induced transparency (MIT). Under MIT conditions, the propagation of the electromagnetic wave along an externally applied magnetic field, constant in time and varying in space, leads to the appearance of a longitudinal plasma wave propagating in the same direction as the electromagnetic wave, but with low group velocity. This longitudinal plasma modulation is also expected to accelerate charged particles, and the first experimental evidence of MIT was demonstrated by Gad et al. [25]. The second possible accelerating mechanism, which also considers HPM interaction with strongly magnetized plasma, is the inverse Cherenkov accelerator in magnetized plasma (ICAMP). Calculations showed that for a 100 GHz, 3 × 10⁷ W/cm2 HPM, a longitudinal electric field of ~10 MV/m can be generated [24].
HPMs cannot directly ionize most atomic or molecular gases because of insufficient electric field for field ionization of ground state electrons. When a background initial electron density is present in the gas, HPM radiation can accelerate these electrons to sufficient energy to cause excitation and impact ionization of the gas by an avalanching process. A background electron density may be the result of cosmic radiation or can be generated by electric sparks or lasers as is the case in high-power microwave compressors. In such compressors a resonant gas filled cavity is charged during a long period of time (microseconds) by microwave energy which is released by a fast plasma interference switch, the result of a local ns time scale gas discharge plasma. This plasma, a mm-scale streamer, changes the wave interference in the cavity, kept destructive during the charging period, by changing one wave’s phase sufficient to release the energy from the cavity [26,27]
In recent years, HPM sources producing sub-ns timescale, multi-GW power scale, >10 GHz repetition rates and >20 MV/m electric field pulses have become available. Systems such as SR-BWO’s (Super Radiance Backward Wave Oscillator) which can generate such pulses, have a small footprint and are relatively cheap. These HPM sources can be used to form a wakefield in a plasma of density below the critical plasma density, that is, for plasmas almost transparent to the microwave pulse. The time and space scales involved are considerably larger than those typical to the laser wakefield experiments and therefore diagnostics can be more detailed for the same underlying physical phenomena. These unique experiments will be reviewed below.
An SR-BWO (Super Radiance Backward Wave Oscillator) [28,29,30,31,32,33] can generate hundreds of MegaWatt (MW) to a few GW peak power in sub-ns pulses. An SR-BWO has an extended length SWS (Slow Wave Structure) compared to a conventional BWO, along which the beam self-bunches and interacts coherently with a slow spatial harmonic of the electromagnetic wave producing a short single radiation pulse. The electromagnetic wave propagates along the electron beam with a group velocity of opposite direction to the beam velocity. It is required that the electron beam persists for a time longer than the sum of the traveling time of the beam from its source to the end of the SWS and the time of propagation of the electromagnetic wave in the BWO. For these conditions the radiated pulse is much shorter than the electron beam and exceeds its power considerably.
An X-band SR-BWO operating at a wavelength of λ ~ 3 cm and a pulse-length of ~0.5 ns, propagating through an under-dense plasma is expected to exert on the plasma electrons a ponderomotive force,   F P = e 2 4 m ω 2 ( E m w 2 ) , where e, m, ω and Emw are the electron charge, mass, the microwave angular frequency and the amplitude of the microwave electric field respectively. For a cylindrical microwave beam with a radial Gaussian profile,   E m w =   E 0 e ( r 2 / ρ 0 2 ) , focused to ρ 0 2   cm , one can estimate the density modulation by equating FP with the space charge force, F S C = e E S C =   e 2 δ n   r / ε 0 , assuming that the latter it is directed mainly radially. Then the density modulation is given as δ n n 0   = 2 ( e E m W ρ 0 m 𝜔 𝜔 P ) , where n0 is the initial uniform plasma density and ω P = ( n 0 e 2 ε 0 m ) 1 / 2 is the plasma electron frequency. If we assume consider a microwave pulse of peak power P ≥ 200 MW with an electric field component of Emw ≥ 20 MV/m, a density modulation of at least   δ n n 0   0.4   can be obtained for an initial electron density of n0 ~ 1010 cm−3 below the critical density. The density modulation period is of the order of 1 ns over a range of ~10 cm, a parameter range much more tractable than the laser/plasma experiments though realized with much lower ponderomotive forces. Early studies of the interaction of microwaves with plasmas were performed at much lower powers (<250 kW and pulse lengths of 50 ns–3 µs) [11,15,16,17,18].
For an HPM beam interacting with a neutral gas, it was theoretically predicted [34] that for certain conditions beams will self-channel through the plasma formed by background electron acceleration and impact ionization. This was explained by electrons gaining energies higher than the energy for which the ionization cross section is highest and the higher the energy the lower the ionization rate. For an HPM beam with a Gaussian radial intensity distribution this will lead to a lower plasma density at the center of the beam than at its periphery: an ionization induced plasma channel through which the beam can propagate.
In this article, we shall review the results of experiments, analytical modeling and numerical studies we have performed so far to study the interaction of HPMs with plasmas and neutral gases using the HPM beams produced by the SR-BWO systems we have developed and our predictions for our future experiments.

2. The Experiment

Two SR-BWOs were developed and built in our laboratory. One operating in the X-band at 9.6 GHz (referred to below as X-SR-BWO) [29,35] and the second at 28.6 GHz in the Ka band (Ka-SR-BWO) [36,37]. Drawings of the X-band SR-BWO is presented in Figure 1. Both HPM sources are driven by the same 200 Ω internal impedance generator based on magnetic compression stages and SOS (semiconductor-opening-switches) [38]. On a matched impedance, this generator produces a ~350 kV, 0.5 ns risetime, ~6 ns long (FWHM) high voltage pulse. The sub-ns risetime is obtained by connecting the load through a spark gap switch and it is a crucial parameter for the proper operation of the SR-BWO.
The two systems differ mainly in the design of their SWS and the axial magnetic field achieved by an external solenoid which produces a guiding axial magnetic field of ~2.5 T (~70 cm long with axial non-uniformity of ~1% and with a half period of ~4.4 ms) for the X-SR-BWO and ~8 T (~20 cm long and ~15 ms half period) for the Ka-SR-BWO. The solenoids are powered by the discharge of high voltage capacitors. Both SR-BWO’s transmit a TM01 mode electromagnetic wave but for the X-SR-BWO we used a mode convertor to convert this mode to a TE11 mode, more appropriate for focusing.
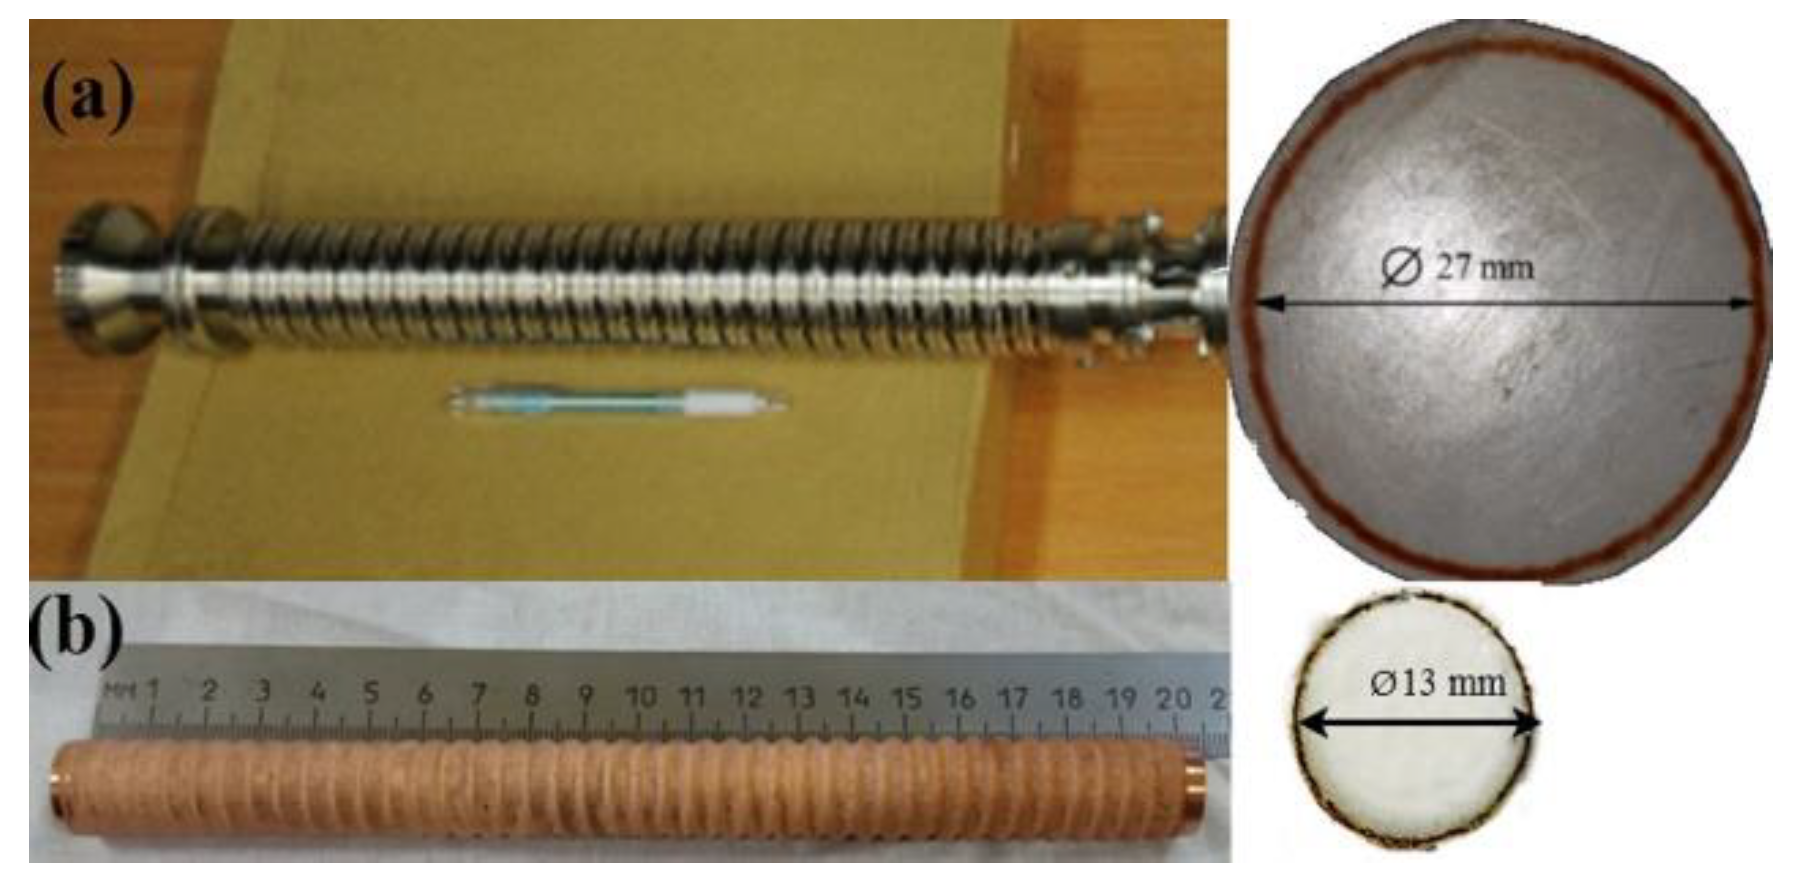
A magnetically insulated foilless diode with a hollow graphite circular sharp-edged cathode is used to produce an annular electron beam [39]. The dimensions and exact location of the cathode are part of the design of each SR-BWO. In Figure 2 photographs of the SWS’s of the two SR-BWO’s are presented together with the cross-section of the annular electron beam as recorded on a plastic witness plate when the beam traverses an ordinary conducting tube immersed in the magnetic field instead of the SWS. This reflects the good axial alignment of the system axis and the magnetic field axis.
The operation of the two SR-BWO systems was tested by MAGIC-PIC [40] simulations and the resulting HPM pulse shape and power were close to that obtained experimentally [40,41]. The X-SR-BWO produces ~500 MW whereas the Ka-SR-BWO, ~1.2 GW peak power in a ~0.4 ns long pulse.
The TM01 mode electromagnetic wave produced by the X-SR-BWO is transmitted through a mode-converter which transforms it to TE11, followed by an appropriate antenna which radiates the power towards a hyperbolic dielectric lens (34 cm diameter) which focuses the power ~8 cm from its tip inside a Pyrex tube (see Figure 1). This tube may be filled with gas to controllable pressures, with RF plasma produced by a set of quadrupole antennas placed near its walls [41], or pumped to near vacuum. A set of diagnostic tools, receiving antennas to measure microwave transmission, a fast frame camera to visualize the plasma in time and space, a spectrometer to study the plasma parameters and scintillators attached to photomultipliers to measure electron energies, are placed around this experimental chamber as seen in Figure 1. A matrix of Neon lamps placed on plane perpendicular to the microwave beam axis inside or outside the chamber, is also used to produce a two-dimensional spatial integrated distribution of the electromagnetic beam power. All our experiments so far have been performed in this chamber [35,42,43,44].
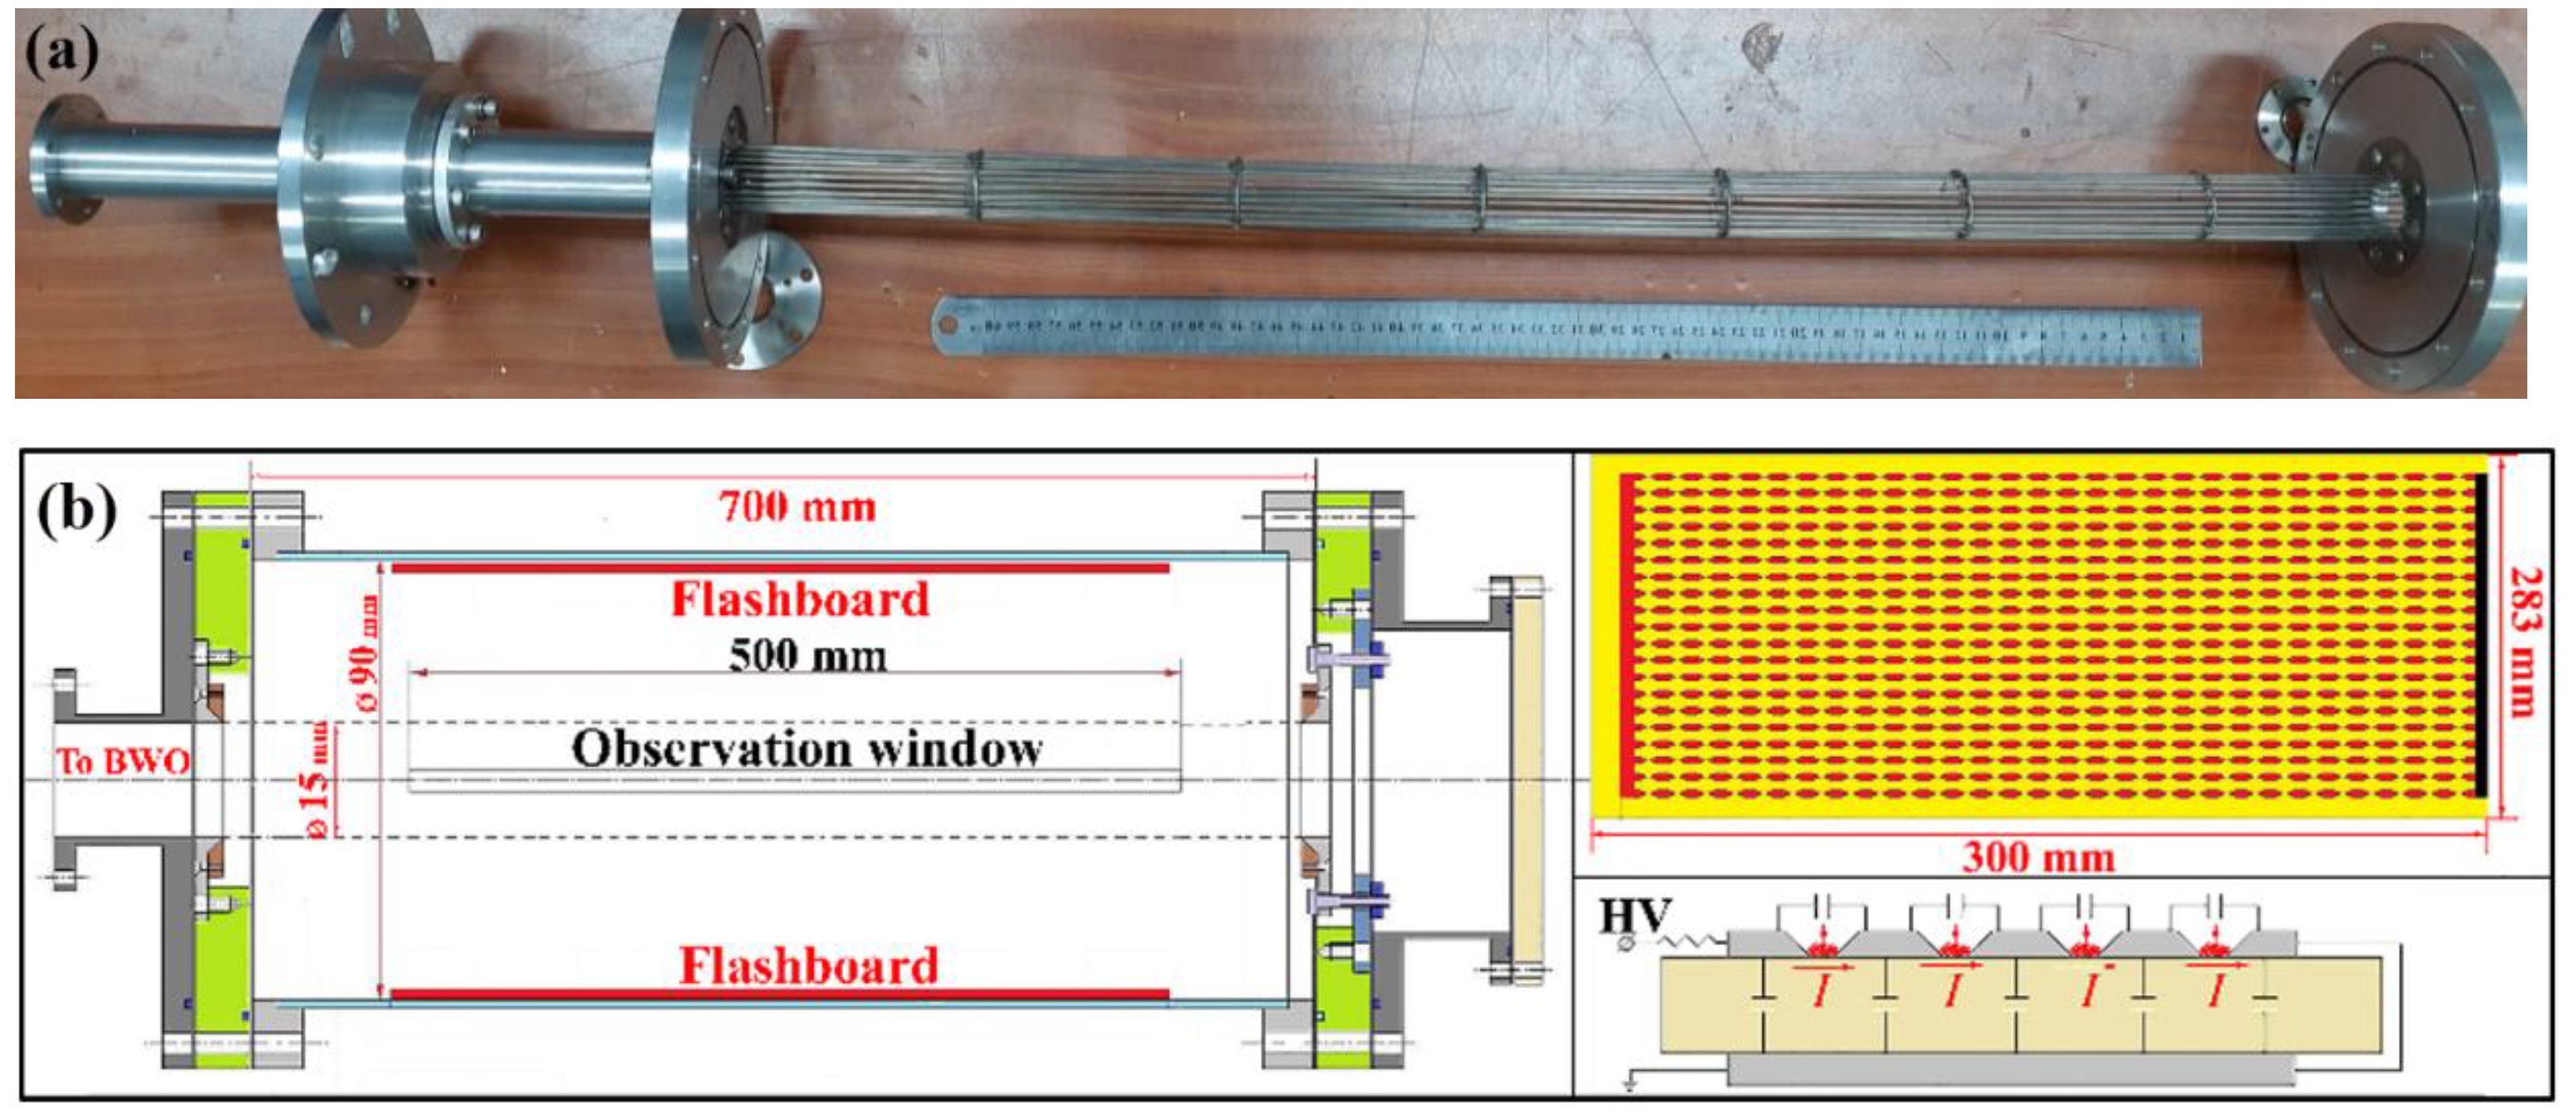
In addition to the above experimental chamber, we designed a plasma filled waveguide into which the TM01 mode electromagnetic wave can be introduced directly (Figure 3a) [41]. This waveguide is made of parallel wires so that the longitudinal slots between the wires is large enough for the plasma produced by flashboard source [45] placed along the walls of the chamber (Figure 3b), to fill the volume of the waveguide. At the same time, the distance between the wires is small enough so that the electromagnetic power is contained with minimal losses. The flashboard plasma was characterized to be stable in time and space [37]. The chamber has longitudinal observation windows where external diagnostics can be placed.

3. Self-Channeling Experiments

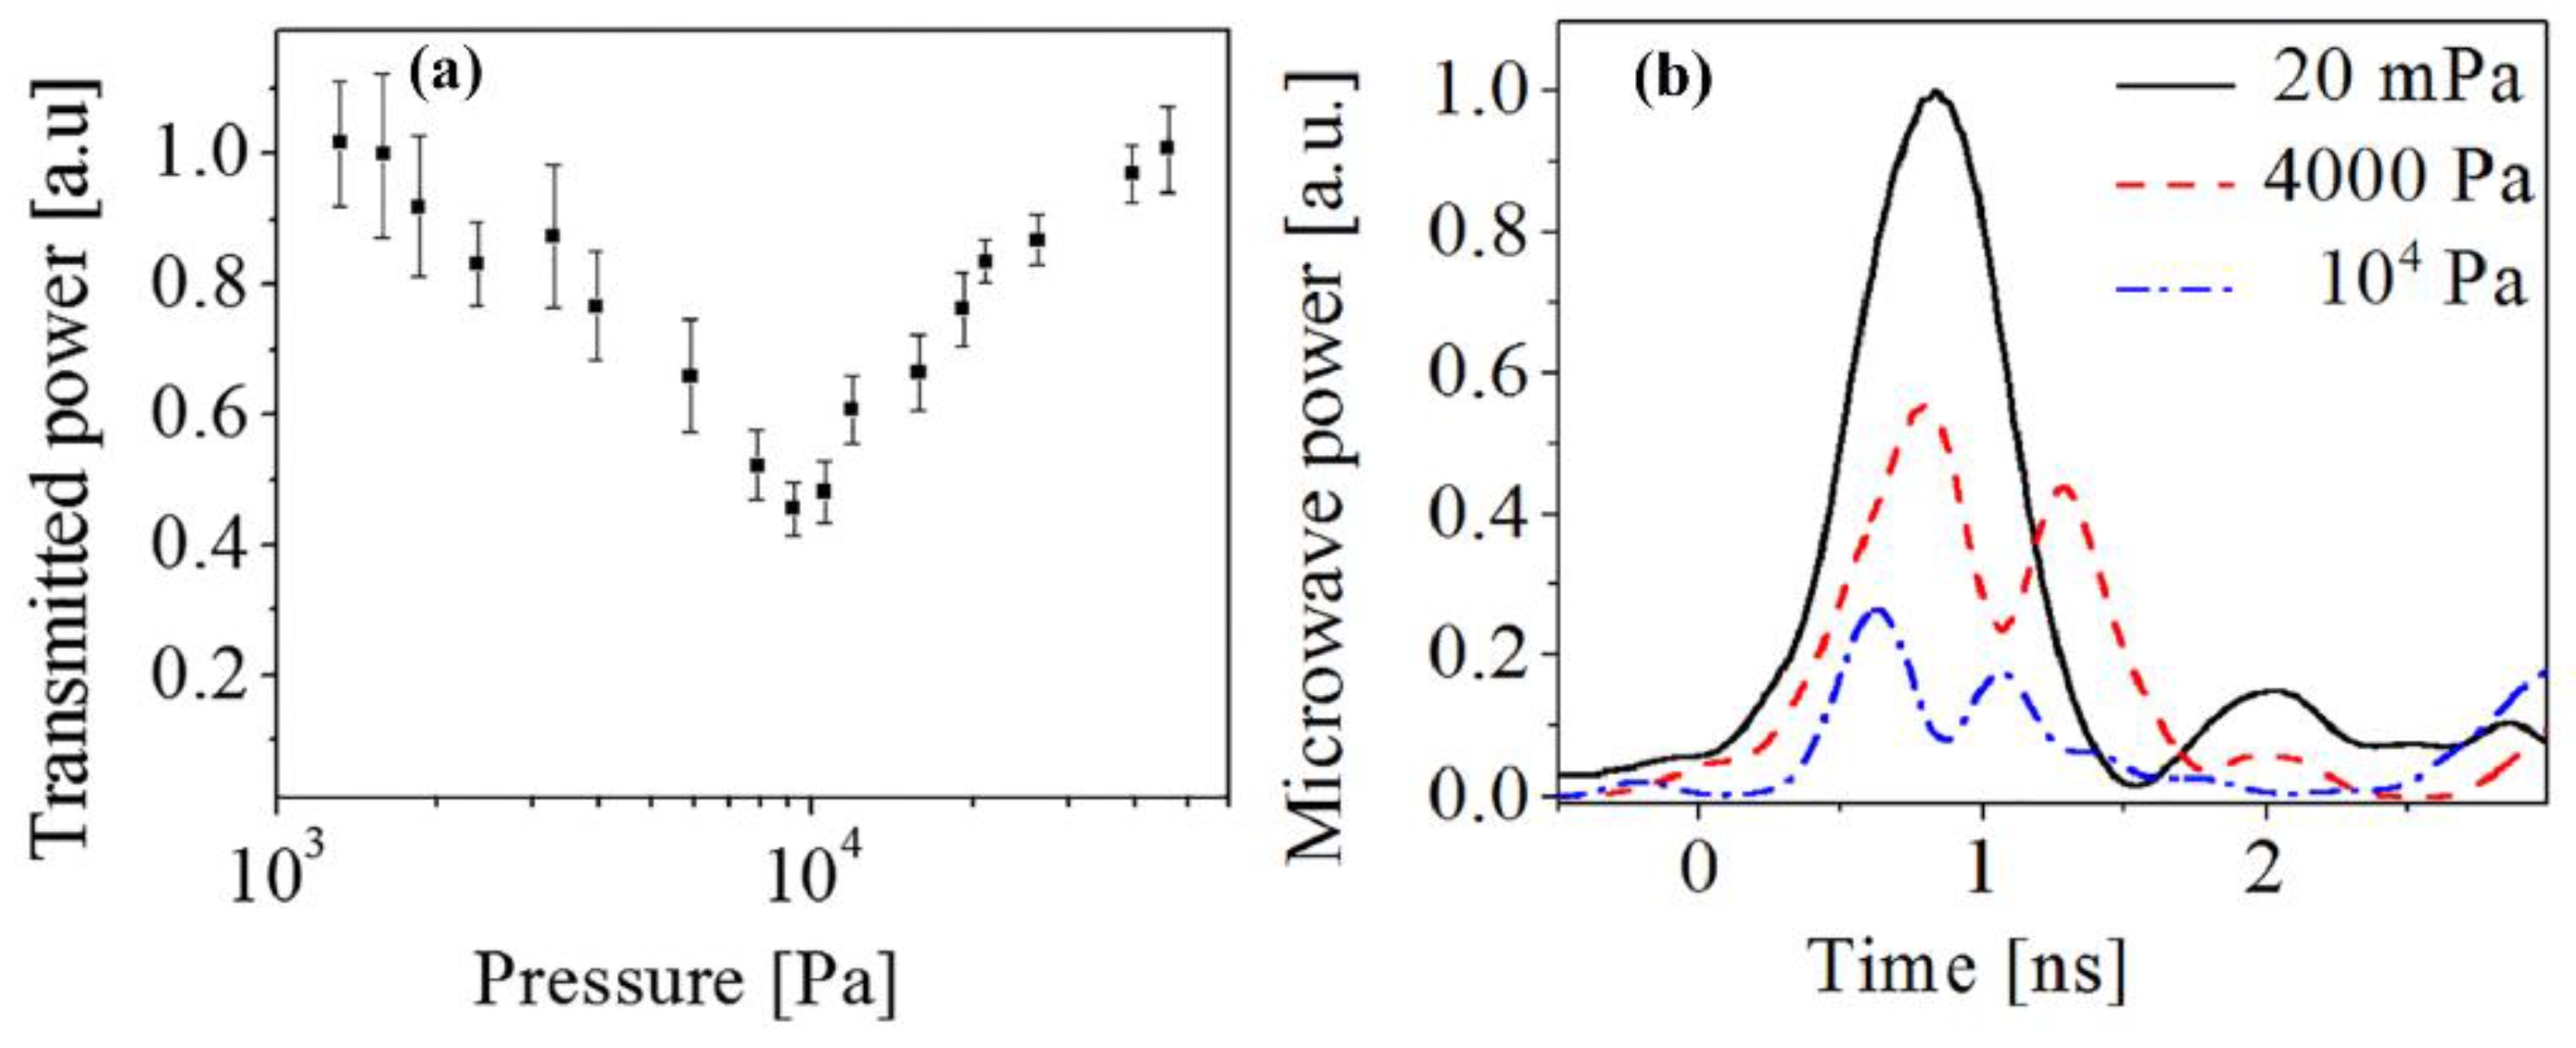
When a microwave beam produced by the X-SR-BWO was introduced in the gas filled interaction chamber (Figure 1) the transmitted power measured at the downstream end for different gases at varying pressures showed an irregular behavior (for He see Figure 4).
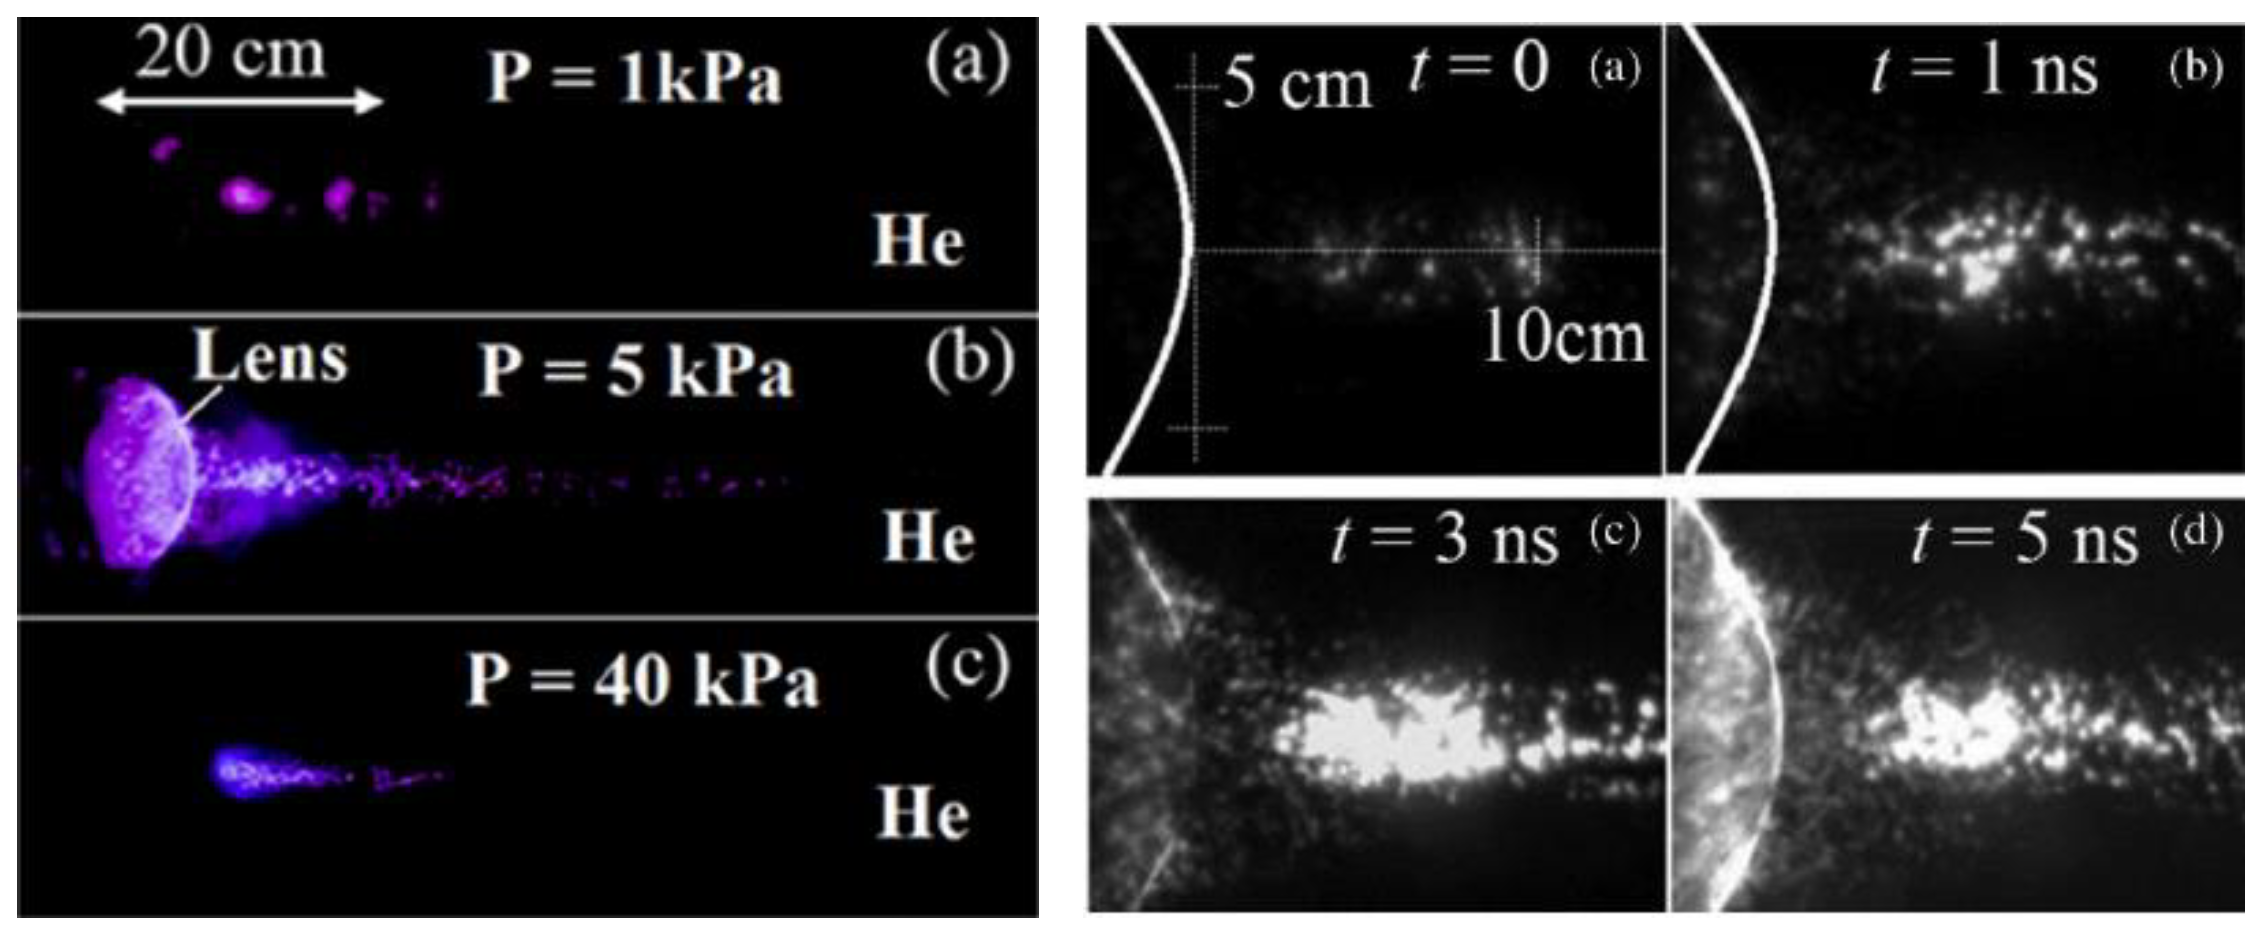
These irregularities in transmitted microwave power raised the suspicion that plasma is formed during the HPM neutral gas interaction which was indeed validated in the images of the light emission which appeared in the chamber. In the left panel of Figure 5 a side view of the integrated light emission from the interaction chamber during and after the transition of a pulse of the microwave beam for three values of He gas pressure are presented [42]. In the right panel of Figure 5 a smaller region near the dielectric lens is depicted by a fast framing camera [43] for the same He pressure as in frame (b) on the left panel.
As the He pressure increases up to ~10 kPa, the beam power transmitted downstream decreases and then it increases as the pressure increases above 10 kPa (Figure 5a). For low gas pressure (below ~20 mPa) there is insufficient gas to enable considerable plasma to form and the power is transmitted almost undisturbed (Figure 4b). At higher pressures the transmitted power reduces (Figure 4a) and it appears as a double peak in time (Figure 4b). For these pressures a ~40 cm long, 4 cm diameter plasma rod is seen (middle picture in the left panel of Figure 5) ~7 times longer than the estimated Rayleigh length. The initial time evolution of this is seen in the right panel of Figure 5. The plasma forms initially close to the focal plane and it evolves downstream and upstream until it is seen to shine along the surface of the dielectric surface of the lens. The latter is proof that the plasma is not the result of plasma formed on the lens itself.
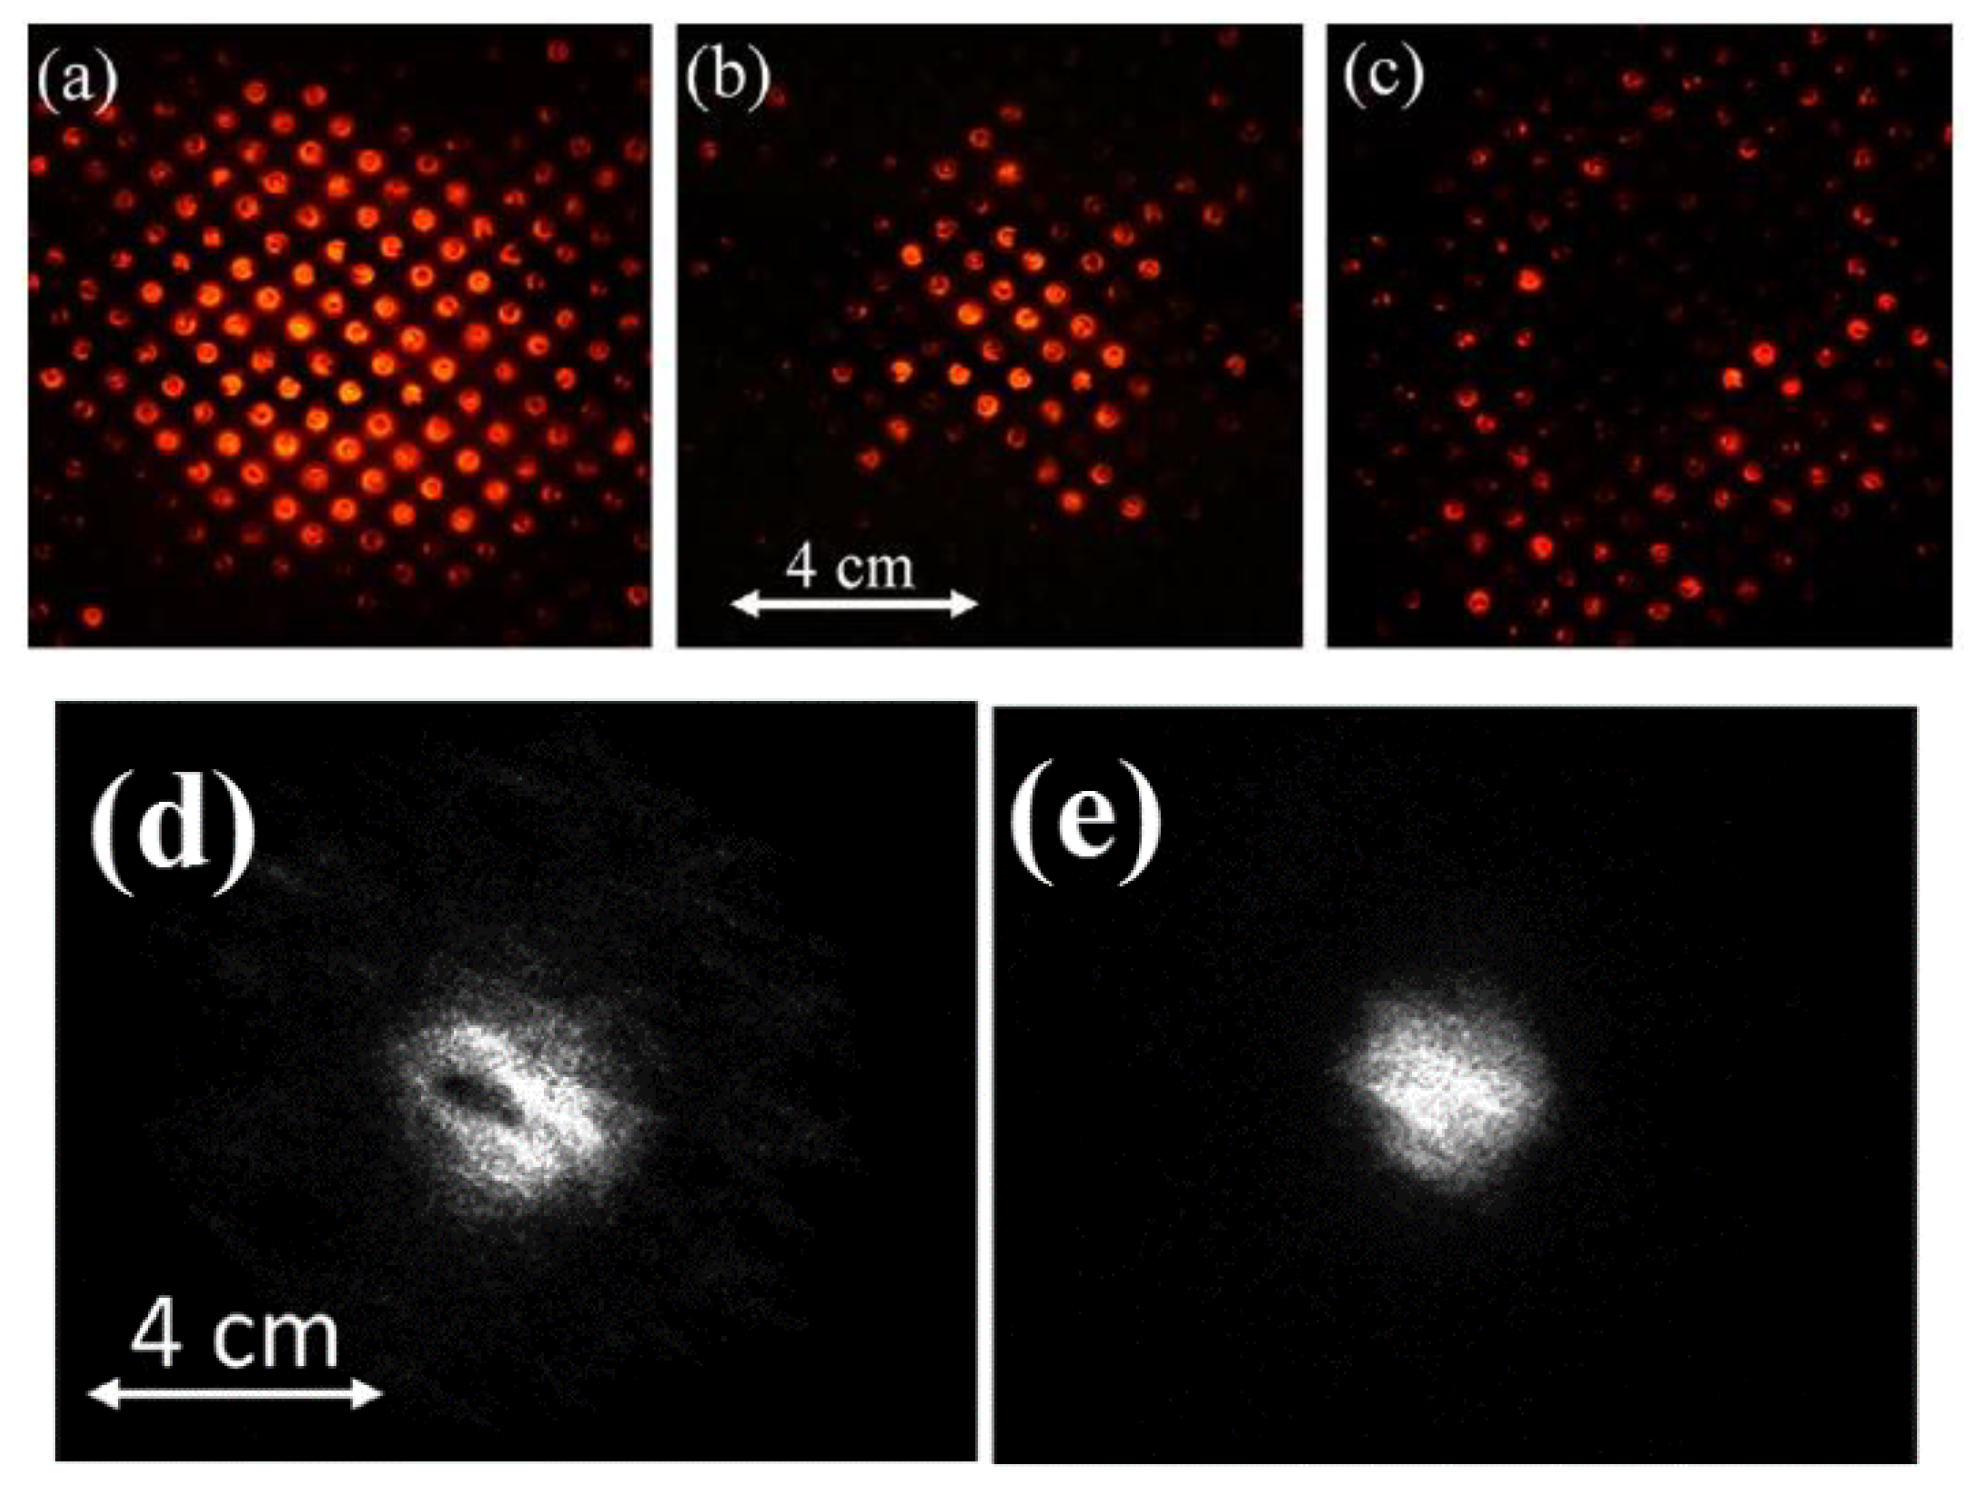
We also observed that the trace of the beam on a planar matrix of Ne lamps placed ~10 cm from the focal plane of the beam is hollow for certain gas pressures (Figure 6 left panel, frames c and d) or of a smaller diameter (Figure 6 left panel, frames b and e).
In Figure 6d for 4.5 kPa He, a hollow channel forms inside a plasma of at least critical density so that the microwave beam, instead of defocusing after the focal plane (Figure 6a), it travels through it to light only the central region of the neon lamps matrix (Figure 6b). For 30 kPa He, a narrow critical or higher density plasma cylinder is seen (Figure 6e) which obstructs the passage of the center of the beam (Figure 6c). This behavior is the integral of the time dependence seen in Figure 4b. We also estimated the plasma electron density by absolute calibrated spectroscopy measuring the population level of the excited He I and He II ions in 4.5 kPa He, to be in the range 2–8 × 1014 cm−3. Note, that different well developed optical diagnostic methods based on laser assisted spectroscopy, Stark broadening of spectral lines and the observation of forbidden lines can be applied to measure high-frequency electric fields in the plasma [46,47,48,49,50,51,52,53]. However, the application of these methods in this case is very challenging because the plasma is dilute and the microwave beam interaction with the plasma is over less than a nanosecond resulting in only a limited number of photons emitted by the excited atoms which does not allow one to obtain a reliable spectral line profile.
The plasma electron energy was measured by the luminescence generated by electrons impacting plastic scintillators covered by different thickness thin Al foils placed at a 4.5 cm radius on the focal plane, attached to an optical fiber leading the light outside the interaction chamber to a PMT. Electron energies ≥ 15 keV were detected. Note that for our experimental conditions, the normalized vector potential is a0 ≈ 0.14 for an electric field of 150 kV/cm, resulting in an average energy of ~25 keV for the oscillating electrons which is in agreement with the experimental results.
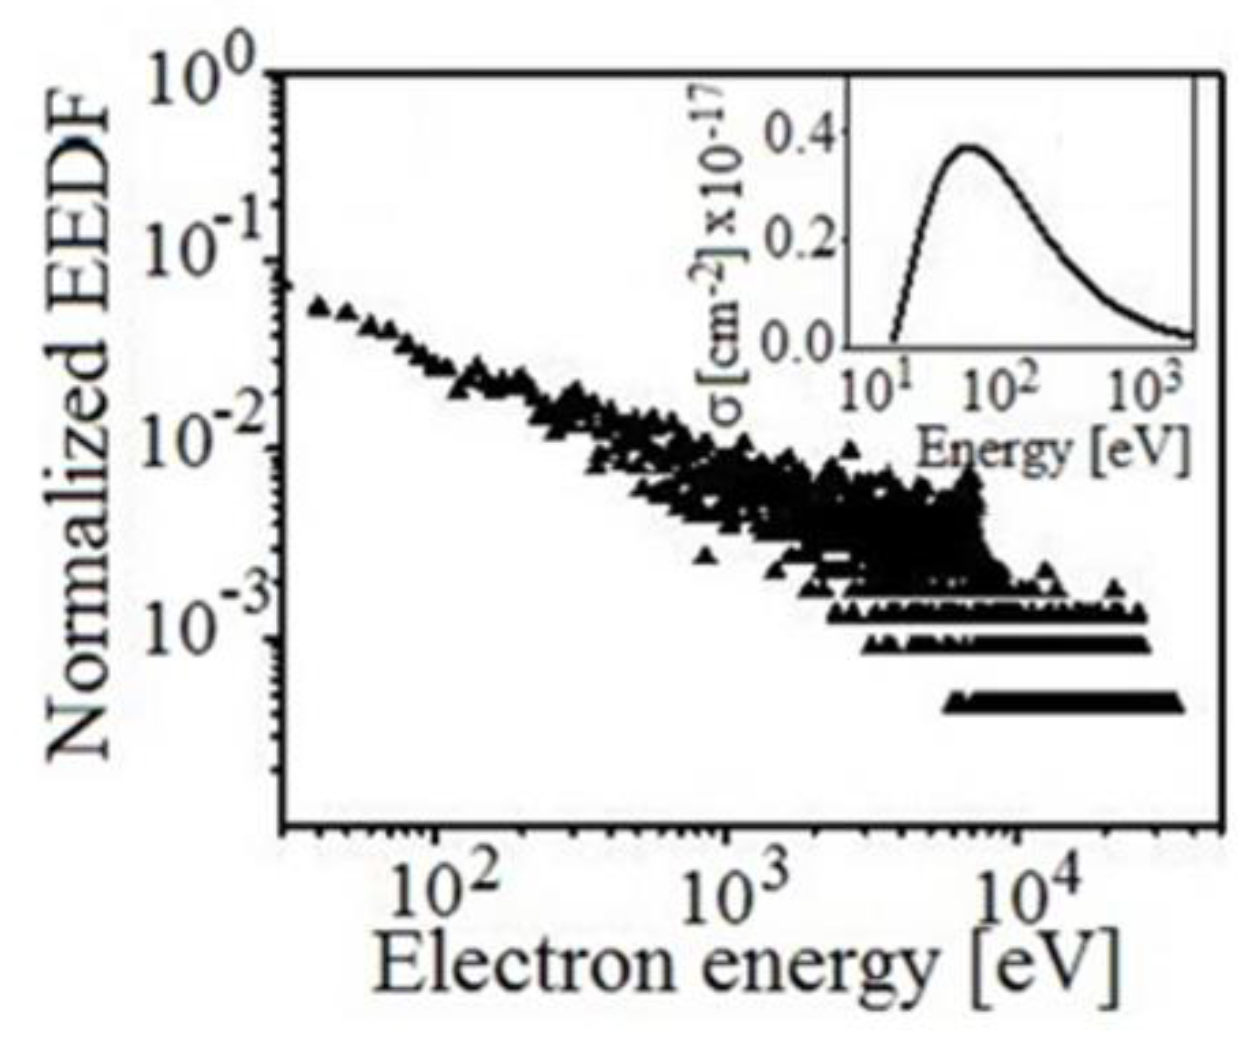
We think that the mechanism responsible for this behavior is that the MW beam accelerates background electrons to high energies which ionize the gas to form a plasma channel through which it propagates as predicted by Bogomolov et al., 1987 [34]. We developed a simple 1D analytical model [42,43] which explains this process of self-channeling and is the result of the non-monotonic behavior of the electron impact ionization cross-section which for He has a maximum at ~150 eV and decreases by more than an order of magnitude for electron energies above 10 keV [54]. If we assume a background electron density n0 ≤ 105 cm−3, then for a microwave beam of Gaussian distribution around r, we obtain an ionization electron density by ln [ n e ( r , t ) / n 0 ] = n g 0 t v ( r , t ) σ i [ w ( r , t ) ] d t , where ng is the gas number density, v the electron velocity and w the electron energy. This model predicts that as the microwave power increases during the rise of the pulse, the plasma density shifts from the axis to the beam periphery. It also shows that a threshold field amplitude exists for this process to occur, E t h ( V / c m ) ( 4 5 ) × 10 5 / λ , where for λ =3 cm, the wavelength associated to the 9.6 GHz microwave beam Eth = 150 kV/cm. The 1D Particle in Cell (PIC) simulations [43] confirm that high energy electrons are indeed produced during the process (Figure 7).
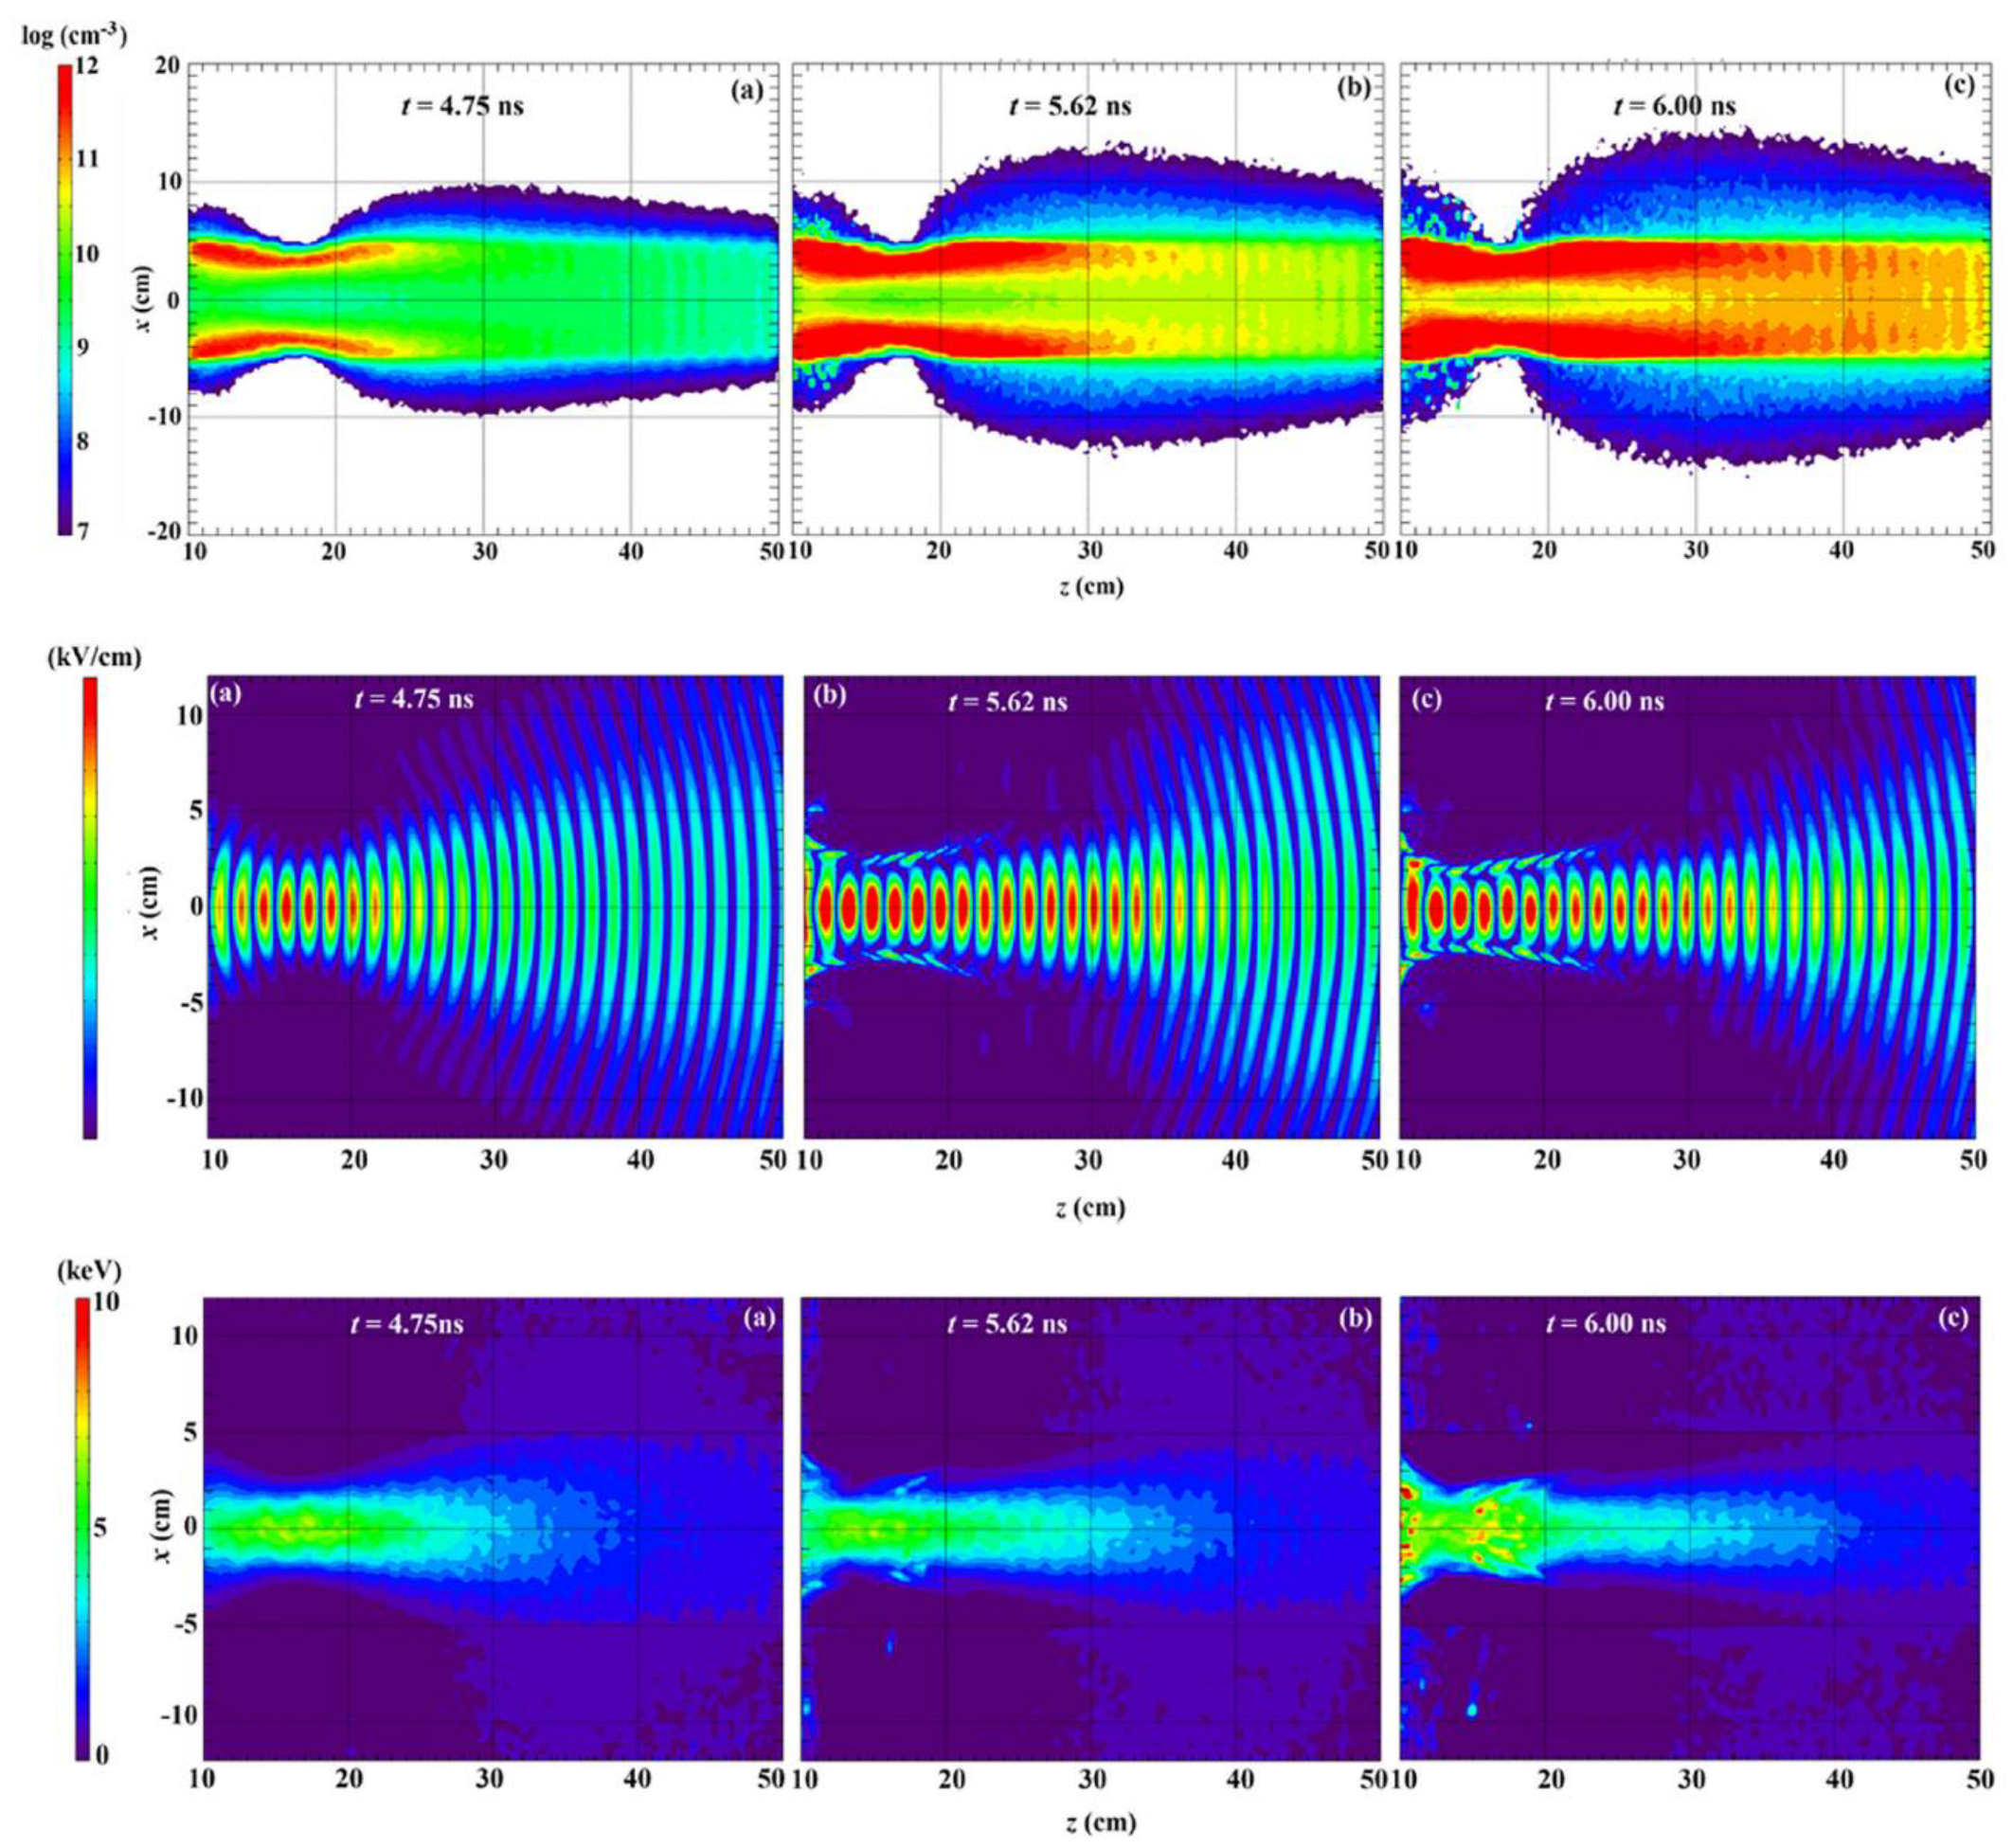
Finally, we used the LSP (Large Scale Plasma) PIC Monte-Carlo hybrid code [55,56] to simulate this complex system. The focusing is modeled as an optical focusing of a microwave “laser” beam, so it is not exactly the experimental MW beam focused by a dielectric lens, but it has the same symmetry. The results for a 10 GHz beam with maximum electric field of 175 kV/cm propagating in a gas ng = 1.64 × 1017 cm−3 and a 106 cm−3 background electron density are seen in Figure 8 (for a detailed explanation see Ref. 46).
In Figure 8 (1st row) the evolution of a plasma channel forming during ~1 ns with above critical density (≥1012 cm−3) walls is seen. In Figure 8. (2nd row) the guiding and reflections of the electric field inside and from the walls of the plasma channel can be depicted whereas in the 3rd row high energy electrons form along the axis. These LSP simulations confirm that the experiments described where an HPM beam interacts with a neutral gas, reveal an ionization induced self-channeling process.
We have also performed these experiments with the same system but with the interaction chamber filled with preliminarily produced RF-plasma. The plasma produced by the quadrupole antennas in a low-pressure gas (<150 Pa), was characterized using different electrical, spectroscopic and microwave diagnostics and our results of the microwave beam interaction with this preliminary formed plasma were summarized in Ref. [42]. Channeling is observed in these experiments too and we confirm by modeling and simulation that it is induced by the same ionization process as that occurring in neutral gas but at significantly lower neutral gas pressure compensated by significantly larger preliminary electron number densities. In the absence of ionization, no channeling is observed in simulations. Moreover, for our experimental setup we confirm that the dielectric lens releases gas with a non-uniform density distribution which enhances the ionization-induced channeling process.
Ionization induced self-channeling of sub-nanosecond HPM pulse propagation in neutral gases has been detected in these experiments not only in He but also in air and Argon. Such experiments have never before been performed.

4. Wakefield Experiments

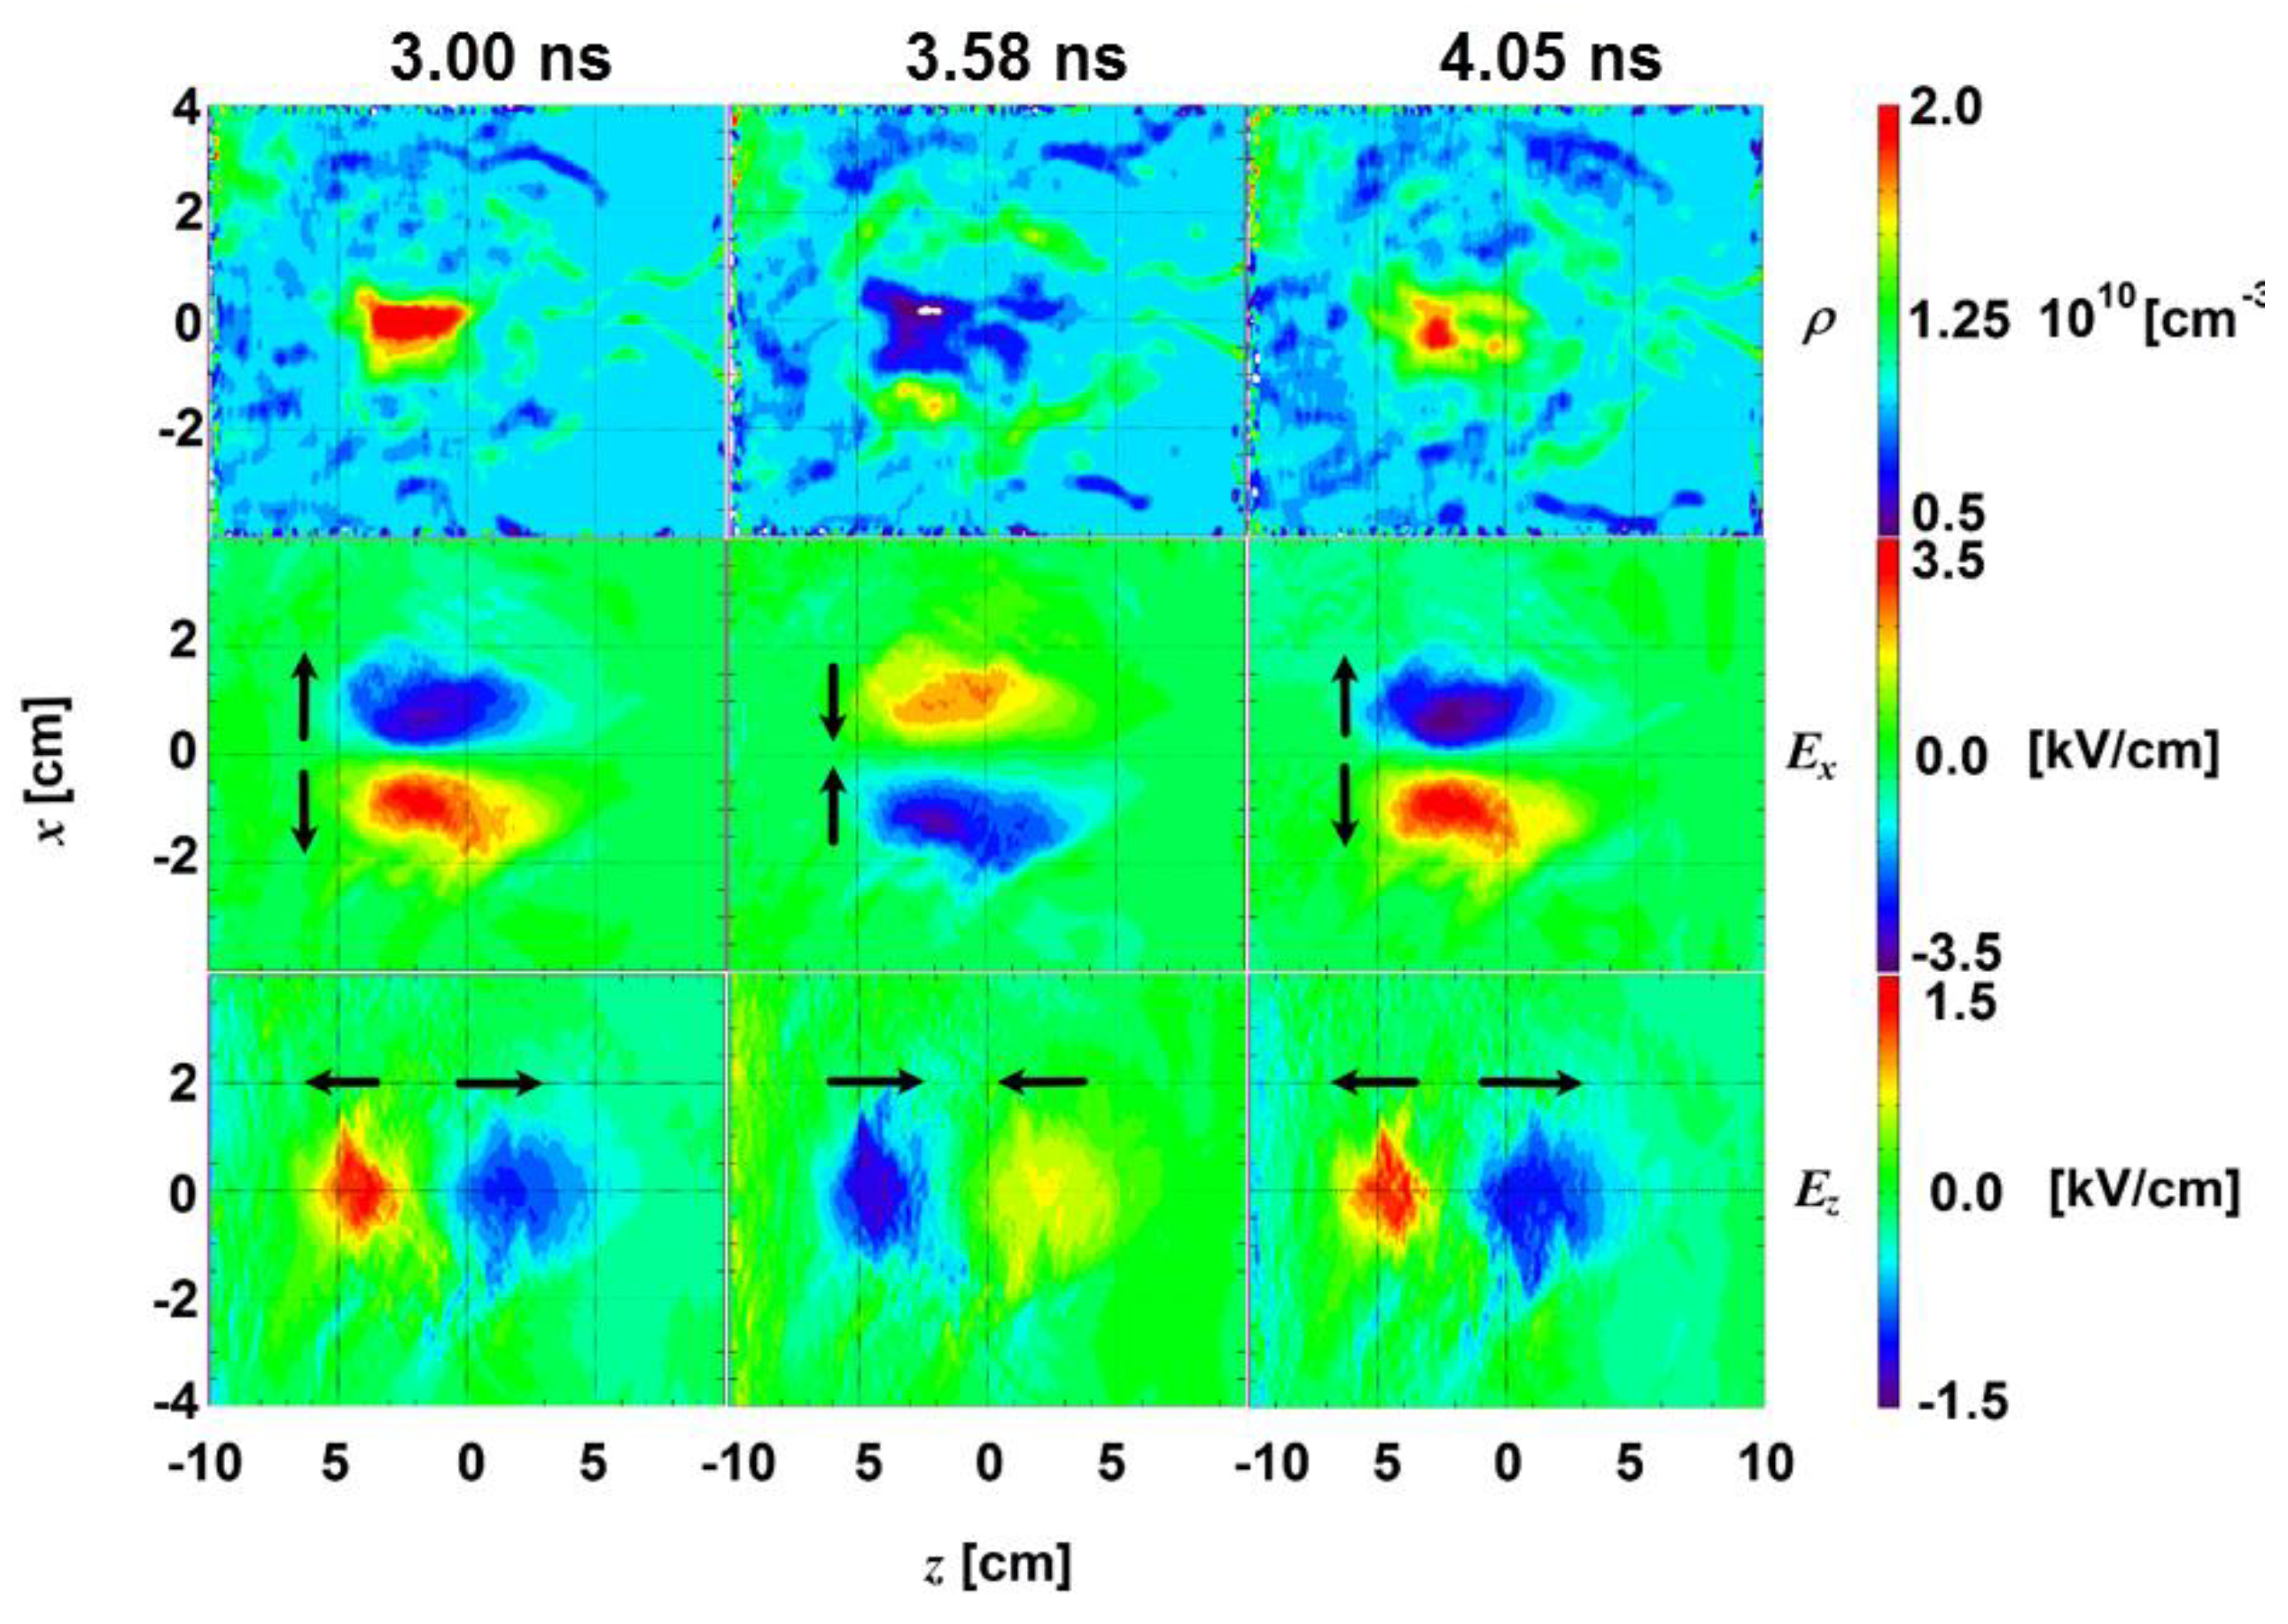
In Ref. [35] we evaluated the possibility to observe a wakefield for the X-SR-BWO’s focused beam in the configuration seen in Figure 1. We simulated the transition of the 9.6 GHz microwave beam with a maximum electric field of 175 kV/cm in a 1010 cm−3 density plasma and obtained that a localized wake develops near the focal plane (z = 0, in Figure 9 [35]) after the pulse has left this region.
The electron density modulates between values above and below the initial density by a factor of ~2, with a period of ~1 ns, over a region of the order of ~1 cm. This is accompanied by electric fields of a few kV/cm. We estimated that these values are detectable by relatively simple diagnostics. Since our channeling experiments we realized that the presence of neutral gas can interfere with the ability to detect a wakefield in this experiment so we decided to explore another experimental setup.
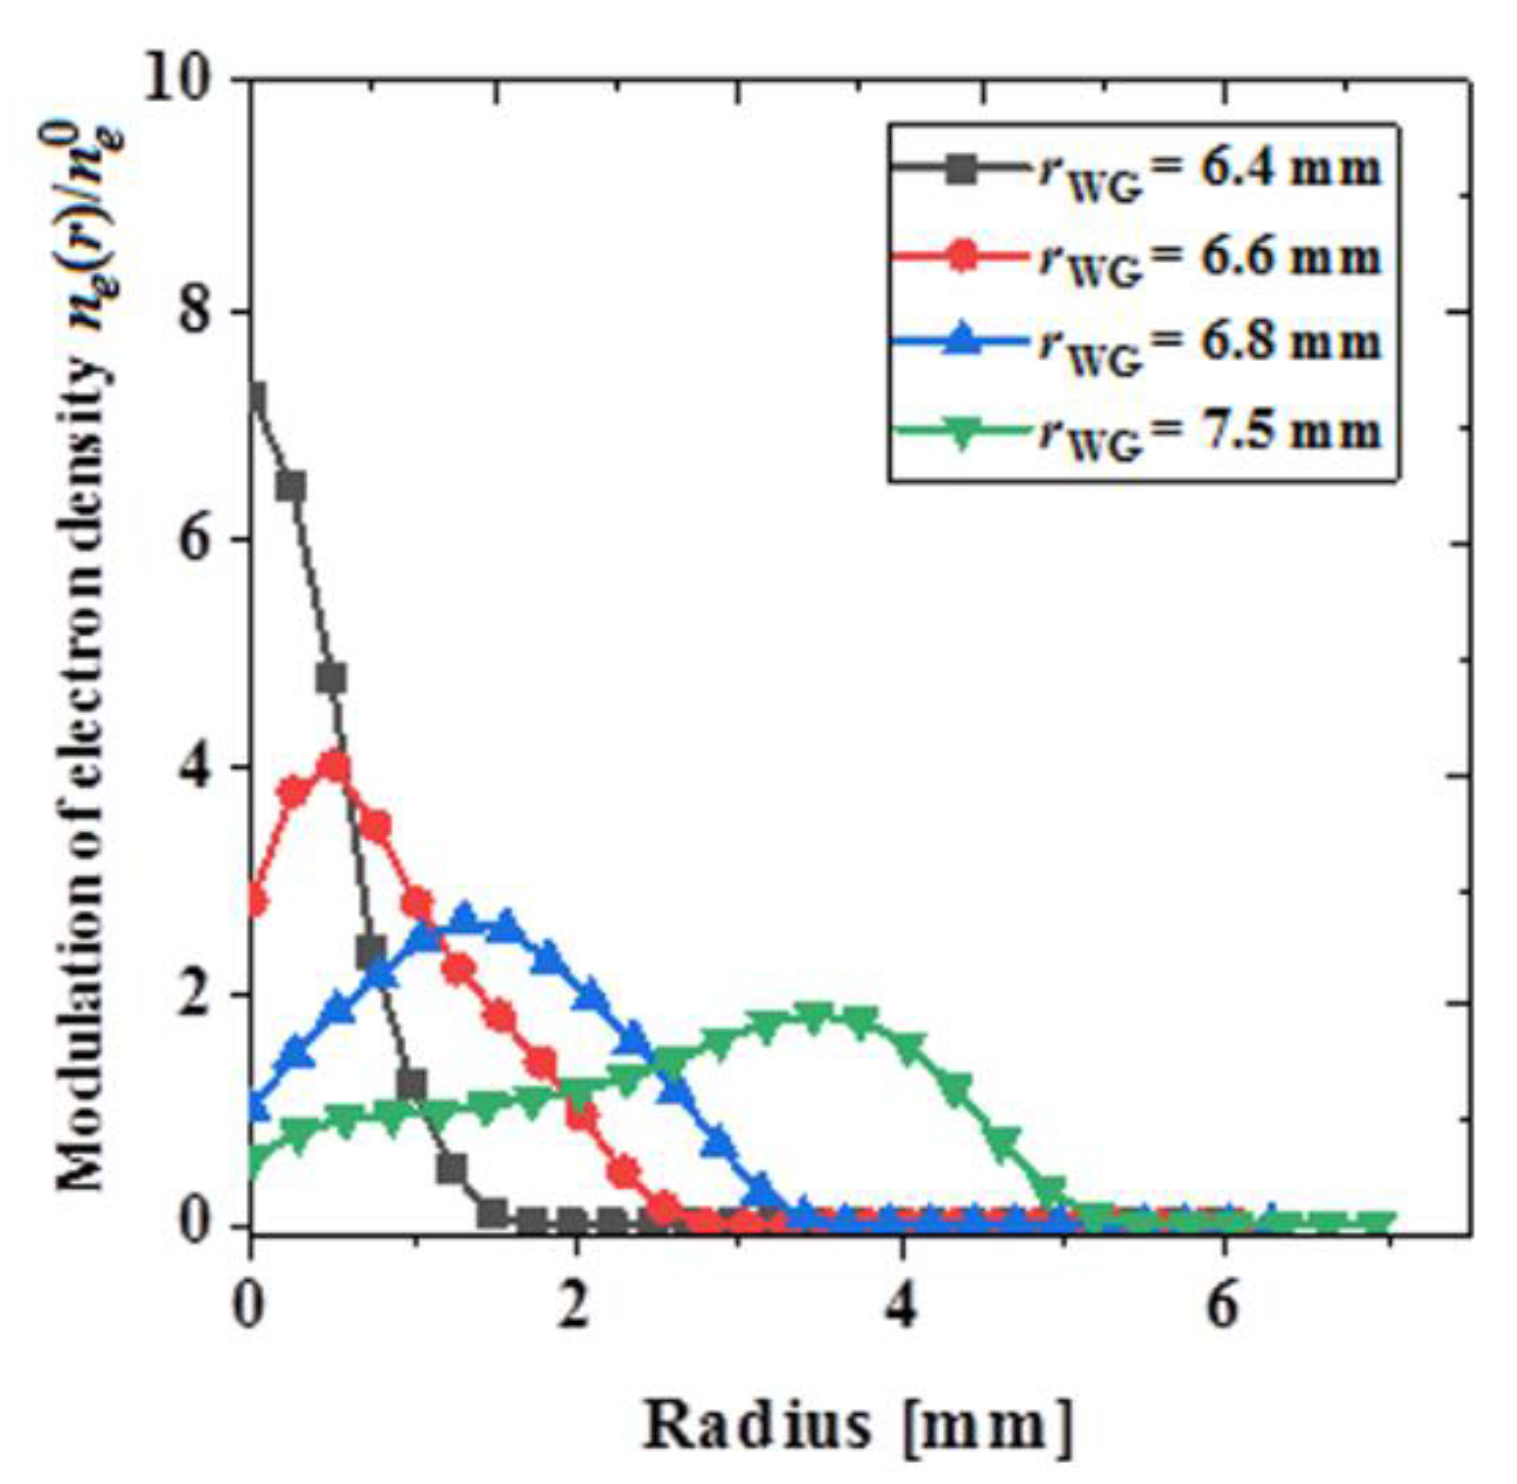
The flashboard plasma filled waveguide (Figure 3) is devoid of neutral gas and can be attached directly at the output of either the X-SR-BWO or the Ka-SR-BWO. We have developed a 1D model of the interaction of a sub-nanosecond high-power (~1 GW), 10 GHz TM01 mode pulse propagating in a cylindrical waveguide filled with under-dense plasma [57]. The electron motion can be separated into a fast and slow motion. The fast motion, oscillations at the microwave frequency can be averaged out to leave only the slower motion following the time dependence of the amplitude of the pulse envelope. This leaves a set of relatively simple equations of motion, d v ¯ r d t = f r ( r ) E 0 2 ,   d v ¯ z d t = f z ( r ) E 0 2 , where fr,z(r) describe dependencies of the radial and longitudinal forces on the radius r, and E0(t) is the time dependent pulse envelope for a given waveguide radius. The analysis shows that the radial force fr(r) is much stronger than the longitudinal force fz(r) which also changes sign. The radial force is the sum of two opposing forces, the ponderomotive and the Lorentz force. Depending on the waveguide radius, the total radial force can either be in the direction of the Lorentz force, outwards from the axis of the waveguide, or in the opposite direction forcing the electrons towards the waveguide axis. For the radial force to be positive everywhere, that is, all electrons are forced towards the waveguide walls, it is required that the waveguide radius be r W G   r c r [ cm ] = 19.85 f [ G H z ] [37]. If r W G >   r c r , some electrons move towards the axis and some towards the walls. This model was tested numerically for the Ka-SR-BWO and some of the results are seen in Figure 10.
To validate the above model, we performed 3D LSP PIC simulations with some of the results seen in Figure 11. These results show significantly lower density modulations than those obtained with the 1D model but the overall behavior is similar and in an experimentally detectable range.
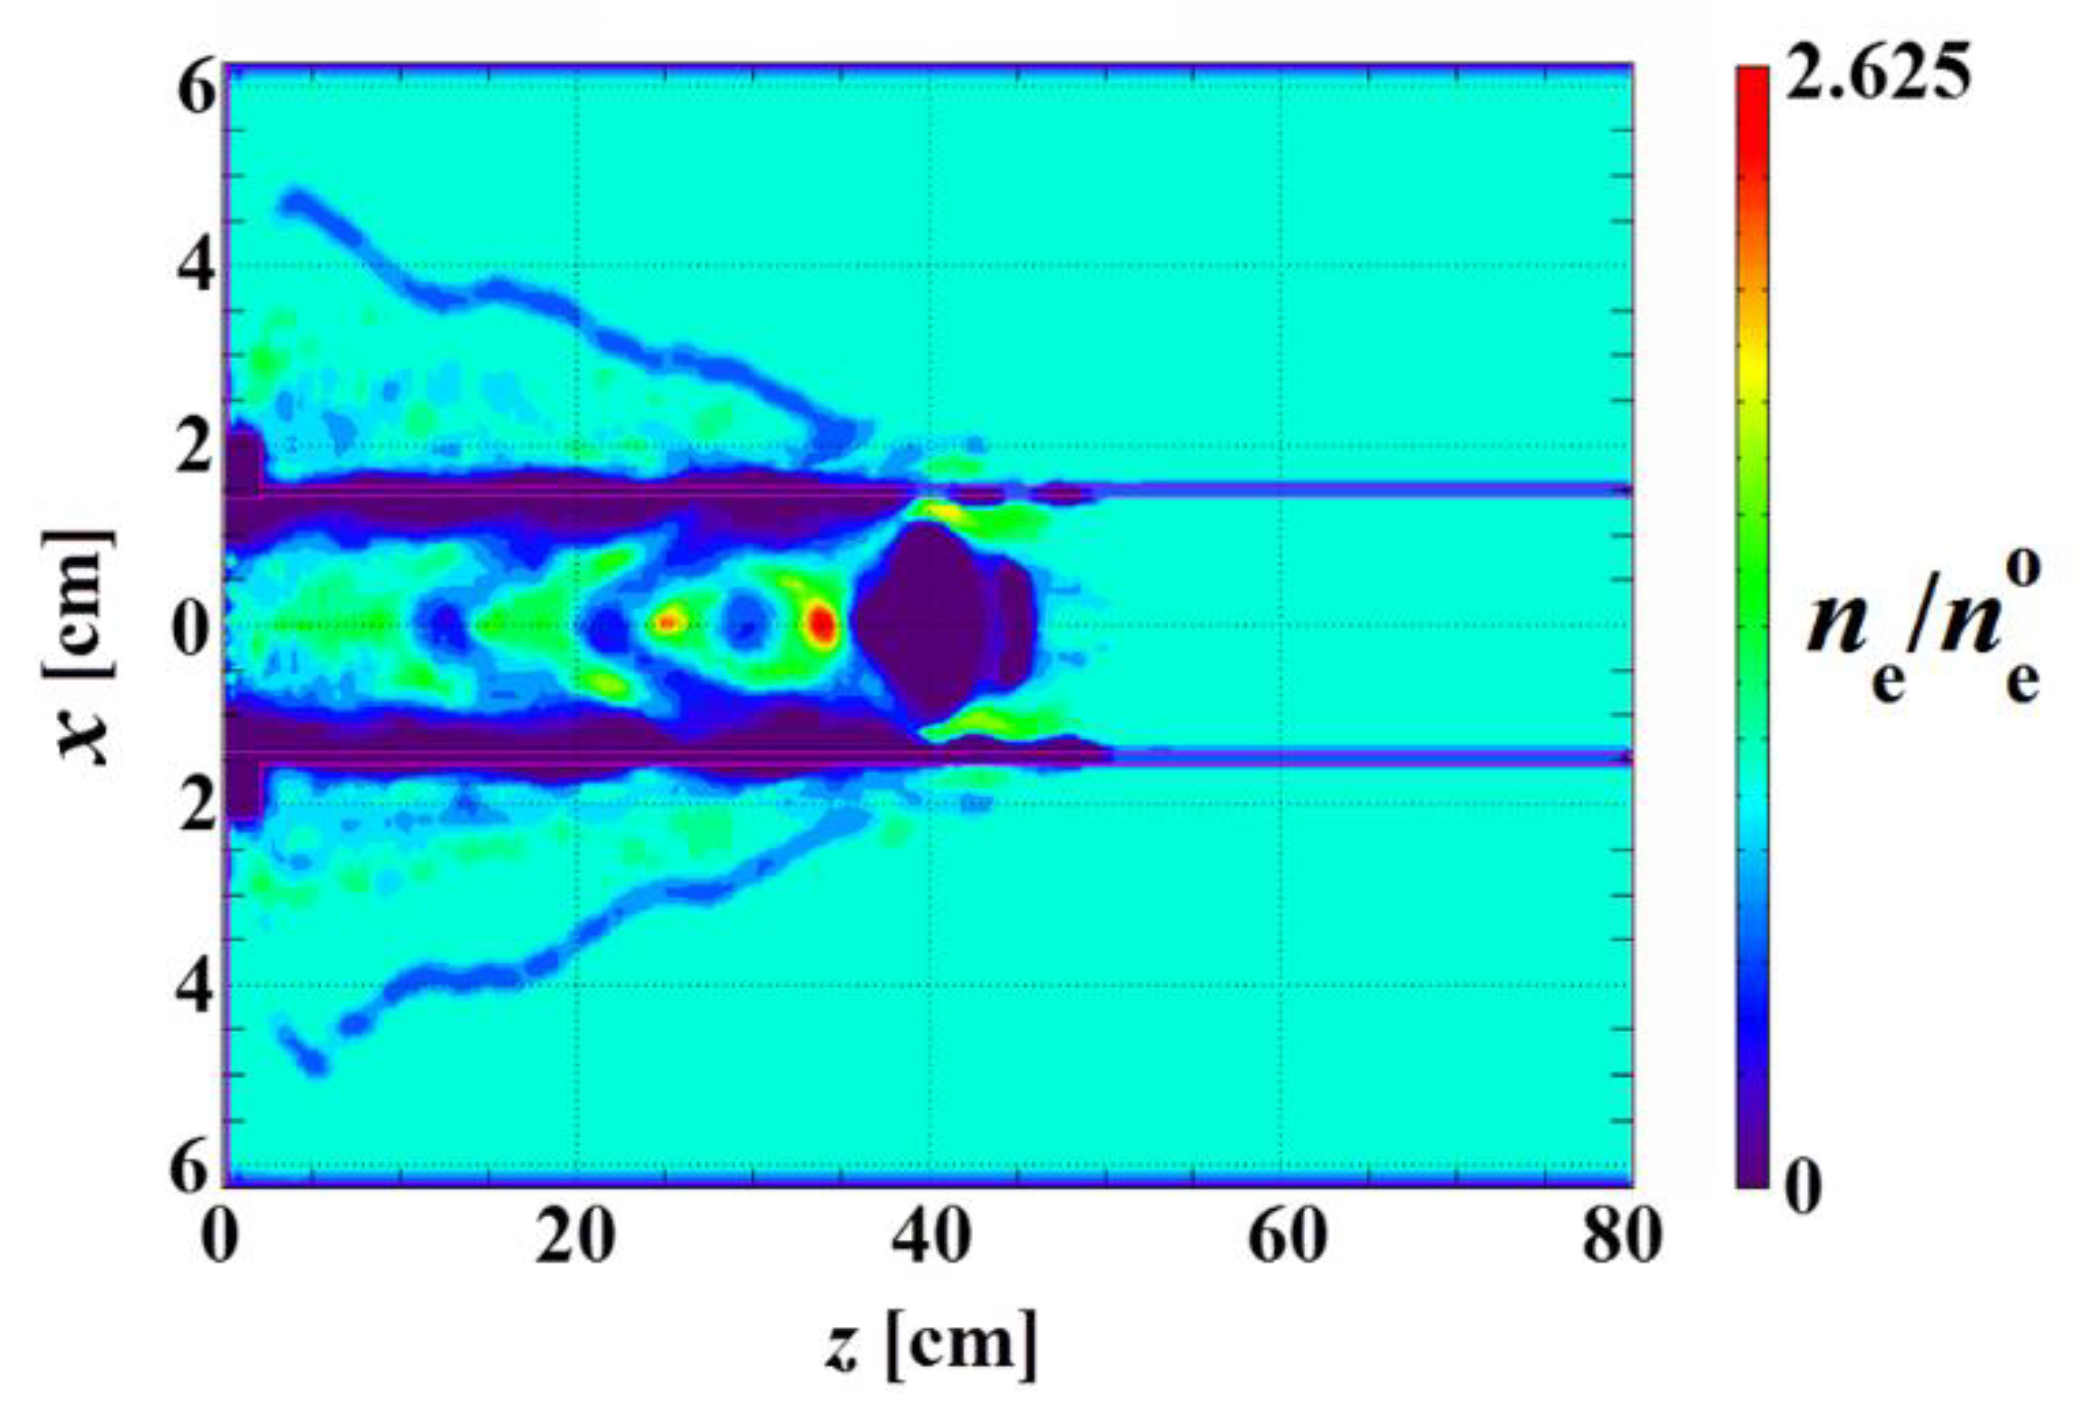
The above 1D analytical model and the 3D PIC simulations considered solid wall waveguides. We have also tested the effect of the longitudinal spaces when the waveguide is slotted. In Figure 12 we present a snapshot of the density modulation in such a waveguide for a 10 GHz TM01 source traversing a 1.4 cm radius waveguide made up of 24 uniformly distributed 2 mm diameter wires in a 5.25 cm radius tube (Figure 3) filled with a 3 × 1010 cm−3 electron density plasma.
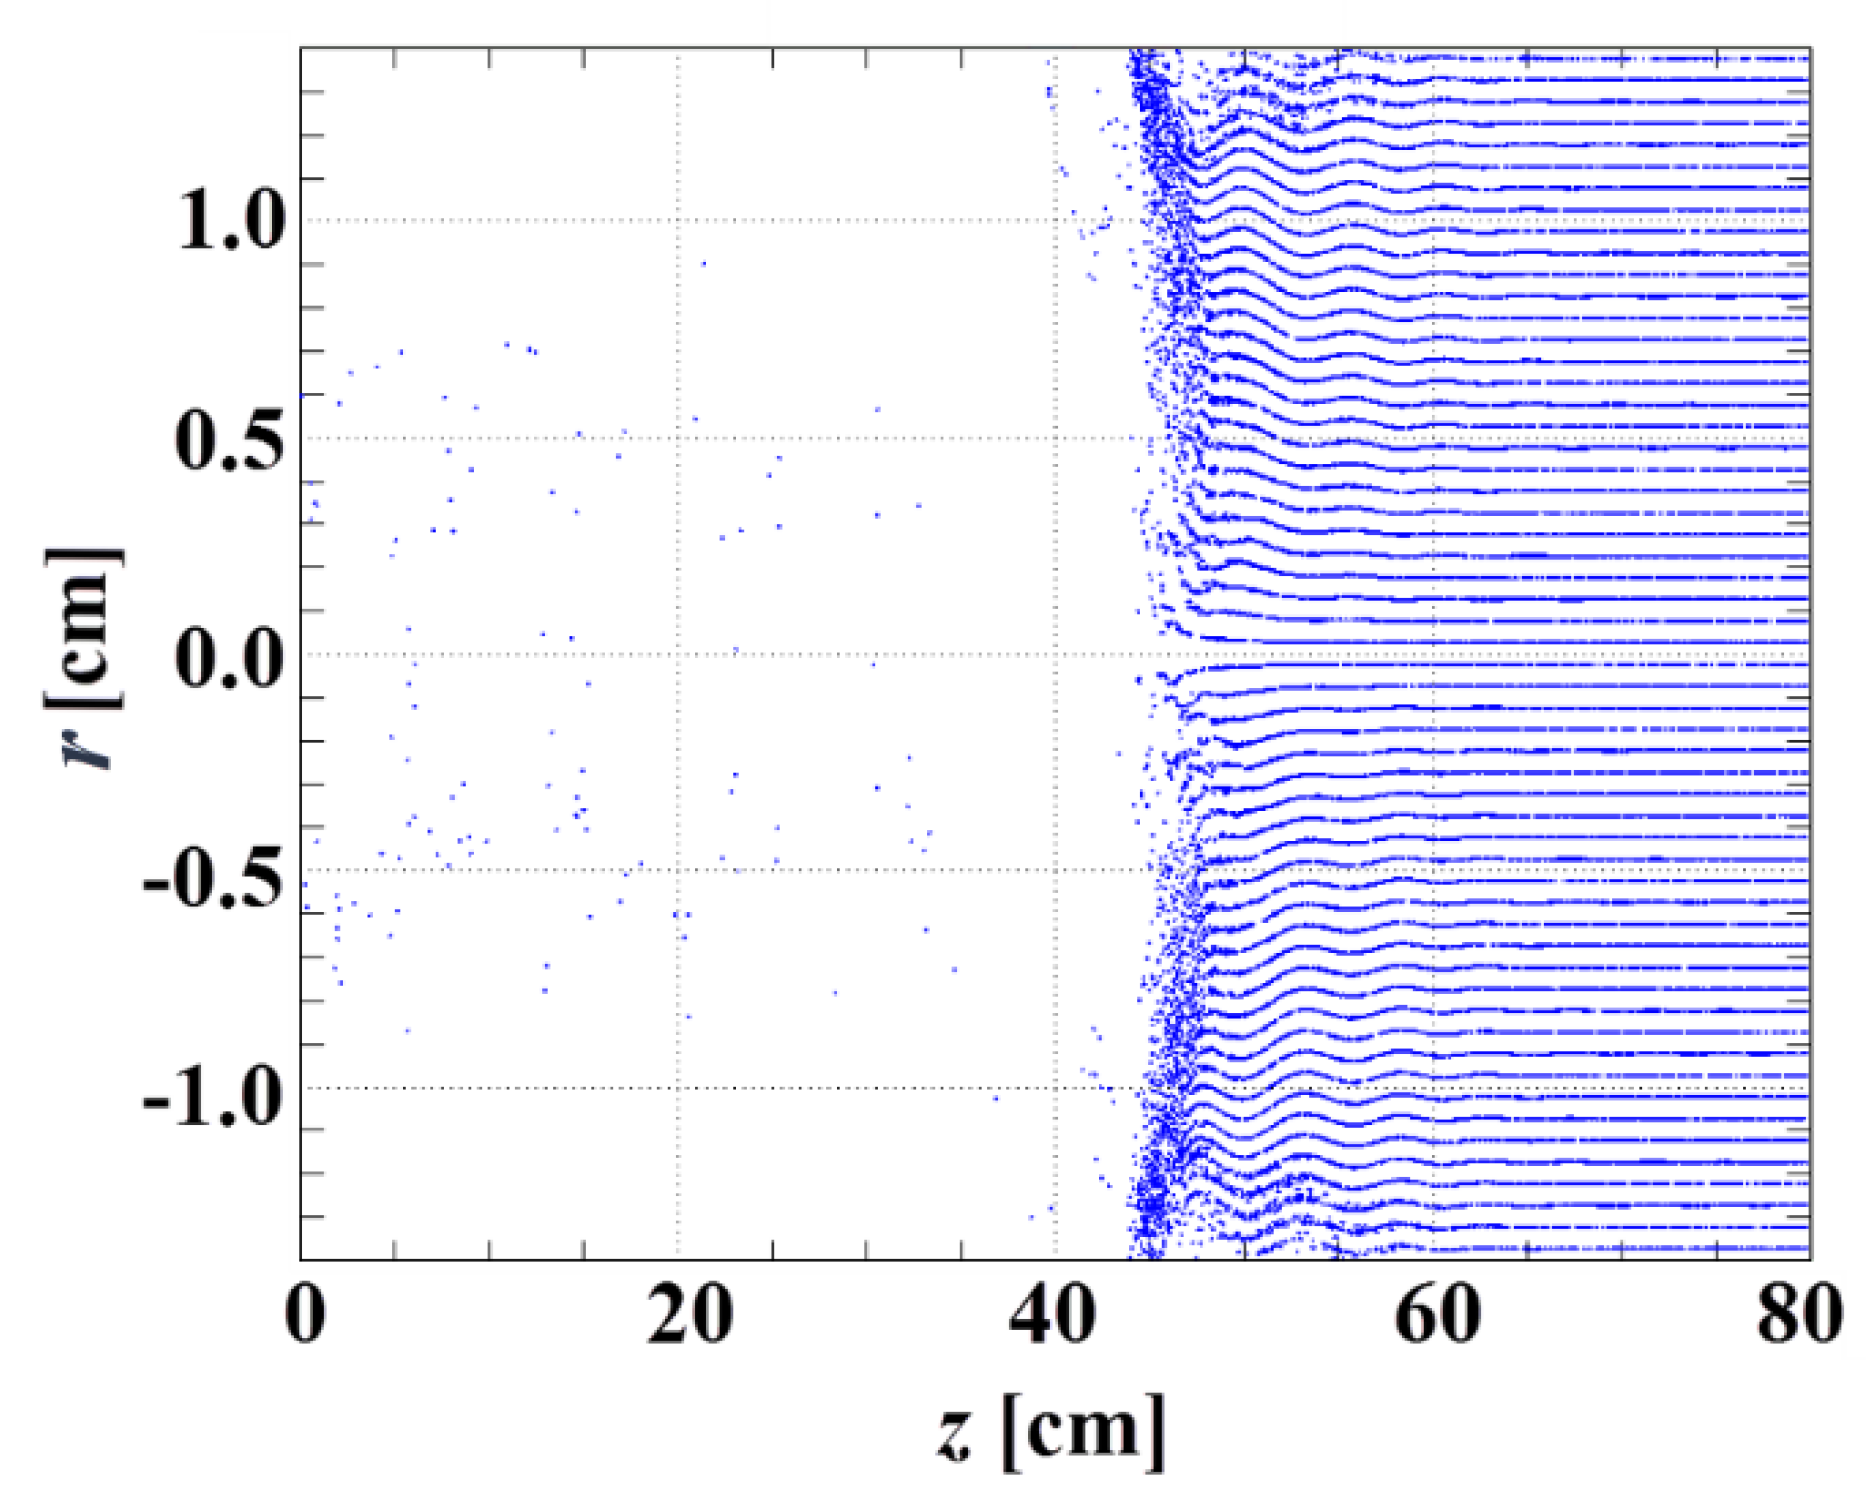
Finally, we should mention that we have found that for sufficiently high-power microwaves the plasma electrons can completely be driven to the waveguide walls like a snowplow effect leaving a positively charged plasma (see Figure 13) [57].
Our analytical model and numerical simulations support the feasibility of producing plasma density modulations and wakefields in the experimental environment we developed.

5. Summary

We reviewed here our unique experimental setup providing a benchmark for studying the nonlinear interaction of extremely HPM sub-nanosecond long pulses with neutral gases, plasmas or gas/plasma mixtures. We have so far observed ionization induced self-channeling and predicted the parameter regions to observe plasma wakes and wakefields. Wakefield experiments are being performed at present. We can imagine more experimental challenges, such as adding external magnetic fields and more diagnostics, such as a nonintrusive optical measurement of the local electric field with high spatial and temporal resolution using the non-resonant four-wave mixing interaction with a driving femtosecond pulsed laser beam [58].

Author Contributions

Conceptualization, Y.E.K., Y.P.B., and A.F.; Methodology, Y.E.K., G.S., Y.P.B., J.G.L., V.V.R.; Software, J.G.L., and D.L.; Validation, J.G.L., D.L., Y.P.B.; Formal Analysis, G.S., Y.C., V.B., Y.P.B.; Investigation, G.S., M.S.-T., D.Z., V.G., Y.S.; Resources, S.G., G.R., V.V.R., Y.E.K.; Writing-J.L., Y.E.K.; Original Draft Preparation, J.G.L.; Writing-Review & Editing, J.G.L., Y.E.K., Y.P.B., V.V.R.; Supervision, R.G., A.F.

Funding

This work was funded in part by the PAZY under Grant No. 2020960 and in part by the research program of the RAS #10.

Conflicts of Interest

The authors declare no conflict of interest.

References

  1. Tajima, T.; Dawson, J.M. Laser Electron Accelerator. Phys. Rev. Lett. 1979, 43, 267–270. [Google Scholar] [CrossRef]
  2. Esaray, E.; Schroeder, C.; Lemans, W. Physics of laser-driven plasma-based electron accelerators. Rev. Mod. Phys. 2009, 81, 1229–1285. [Google Scholar]
  3. Malka, V. Laser plasma accelerators. Phys. Plasmas 2012, 19, 055501. [Google Scholar] [CrossRef] [Green Version]
  4. Leemans, W.P.; Nagler, B.; Gonsalves, A.J.; Toth, C.; Nakamura, K.; Geddes, C.G.R.; Esarey, E.; Schroeder, C.B.; Hooker, S.M. GeV electron beams from a centimetre-scale accelerator. Nat. Phys. 2006, 2, 696–699. [Google Scholar]
  5. Siders, C.W.; le Blanc, S.P.; Fisher, D.; Tajima, T.; Downer, M.W.; Babine, A.; Stepanov, A.; Sergeev, A. Laser wakefield excitation and measurement by femtosecond longitudinal interferometry. Phys. Rev. Lett. 1996, 76, 3570–3573. [Google Scholar] [CrossRef] [PubMed]
  6. Buck, A.; Nicolai, M.; Schmid, K.; Sears, C.M.S.; Sävert, A.; Mikhailova, J.M.; Krausz, F.; Kaluza, M.C.; Veisz, L. Real-time observation of laser-driven electron acceleration. Nat. Phys. 2011, 7, 543–548. [Google Scholar] [Green Version]
  7. Mangles, S.P.D.; Murphy, C.D.; Najmudin, Z.; Thomas, A.G.R.; Collier, J.L.; Dangor, A.E.; Divall, E.J.; Foster, P.S.; Gallacher, J.G.; Hooker, C.J.; et al. Monoenergetic beams of relativistic electrons from intense laser–plasma interactions. Nature 2004, 431, 535–538. [Google Scholar] [CrossRef]
  8. Litos, M.; Adli, E.; An, W.; Clarke, C.I.; Clayton, C.E.; Corde, S.; Delahaye, J.P.; England, R.J.; Fisher, S.; Frederico, J.; et al. High-efficiency acceleration of an electron beam in a plasma wakefield accelerator. Nature 2014, 515, 92–95. [Google Scholar]
  9. Matlis, N.H.; Reed, S.; Bulanov, S.S.; Chvykov, V.; Kalintchenko, G.; Matsuoka, T.; Rousseau, P.; Yanovsky, V.; Maksimchuk, A.; Kalmykov, S.; et al. High-efficiency acceleration of an electron beam in a plasma wakefield accelerator. Nat. Phys. 2006, 2, 749–753. [Google Scholar] [CrossRef]
  10. Schwab, M.B.; Savert, A.; Jackel, O.; Polz, J.; Schnell, M.; Rinck, T.; Veisz, L.; Moller, M.; Hansinger, P.; Paulus, G.G.; et al. Few-cycle optical probe-pulse for investigation of relativistic laser-plasma interactions. Appl. Phys. Lett. 2013, 103, 191118. [Google Scholar] [Green Version]
  11. Ito, H.; Rajyaguru, C.; Yugami, N.; Nishida, Y.; Hosoya, T. Propagation characteristics and guiding of a high-power microwave in plasma waveguide. Phys. Rev. E 2004, 69, 066406. [Google Scholar] [CrossRef] [PubMed]
  12. Kichigin, G.N. Relativistic waves raised by explosions in space as sources of ultra-high-energy cosmic rays. Adv. Space Res. 2013, 2, 309–314. [Google Scholar] [CrossRef]
  13. Aria, A.K.; Malik, H.K. Wakefield Generation in a Plasma Filled Rectangular Waveguide. Open Plasma Phys. J. 2008, 1, 1–8. [Google Scholar] [CrossRef]
  14. Niknam, A.R.; Akhlaghipour, N. Microwave ponderomotive action on the inhomogeneous collisionless and collisional plasmas. Waves Rand. Compl. Med. 2013, 23, 183–199. [Google Scholar] [CrossRef]
  15. Nishida, Y.; Kusaka, S.; Yugami, N. Excitation of wakefield and electron acceleration by short microwave pulse. Phys. Scr. 1994, T52, 65–68. [Google Scholar] [CrossRef]
  16. Yugami, N.; Kusaka, S.; Nishida, Y. Observation of plasma-wave echoes in an ion-wave regime. Phys. Rev. E 1994, 49, 2276–2281. [Google Scholar] [CrossRef]
  17. Ito, H.; Nishida, Y.; Yugami, N. Formation of Duct and Self-Focusing in Plasma by High Power Microwave. Phys. Rev. Lett. 1996, 76, 4540–4543. [Google Scholar] [CrossRef]
  18. Kamal-Al-Hassan, M.; Ito, J.; Yugami, N.; Nishida, Y. Dynamic of ion density perturbations observed in a microwave-plasma interaction. Phys. Plasmas 2005, 12, 112307. [Google Scholar] [CrossRef]
  19. Nishida, Y.; Ito, H.; Rajyaguru, C.; Yugami, N. On the experiments of Surfatron concept with use of capillary plasma. Aip Conf. Proc. 2004, 737, 957. [Google Scholar]
  20. Martins, S.F.; Fonseca, R.A.; Lu, W.; Mori, W.B.; Silva, L.O. Exploring laser-wakefield-accelerator regimes for near-term lasers using particle-in-cell simulation in Lorentz-boosted frames. Nat. Phys. 2010, 6, 311–316. [Google Scholar] [CrossRef]
  21. Holkundkar, A.; Brodin, G.; Marklund, M. Wakefield generation in magnetized plasmas. Phys. Rev. E 2011, 84, 036409. [Google Scholar] [CrossRef] [PubMed]
  22. Jha, P.; Saroch, A.; Mishra, R.K.; Upadhyay, A.K. Laser wakefield acceleration in magnetized plasma. Phys. Rev. St Accel. Beams 2012, 15, 081301. [Google Scholar] [CrossRef]
  23. Bulanov, S.V.; Esirkepov, T.Z.; Kando, M.; Koga, J.K.; Hosokai, T.; Zhidkov, A.G.; Kodama, R. Nonlinear plasma wave in magnetized plasmas. Phys. Plasmas 2013, 20, 083113. [Google Scholar] [CrossRef]
  24. Shvets, G.; Wurtele, J.S.; Hur, M. Applications of Magnetized Plasma to Particle Acceleration. Aip Conf. Proc. 2002, 647, 681. [Google Scholar]
  25. Gad, R.; Leopold, J.G.; Fisher, A.; Fredkin, D.R.; Ron, A. Observation of Magnetically Induced Transparency in a Classical Magnetized Plasma. Phys. Rev. Lett. 2012, 108, 15503. [Google Scholar] [CrossRef] [PubMed]
  26. Beilin, L.; Shlapakovski, A.; Donskoy, M.; Queller, T.; Krasik, Y.E. Plasma density temporal evolution in a high-power microwave pulse compressor switch. Epl (Europhys. Lett.) 2015, 109, 25001. [Google Scholar] [CrossRef] [Green Version]
  27. Shlapakovski, A.S.; Beilin, L.; Hadas, Y.; Schamiloglu, E.; Krasik, Y.E. Self-consistent evolution of plasma discharge and electromagnetic fields in a microwave pulse compressor. Phys. Plasmas 2015, 22, 073111. [Google Scholar] [CrossRef]
  28. Ginzburg, N.S.; Novozhilova, N.Y.; Zotova, I.V.; Sergeev, A.S.; Peskov, N.Y.; Phelps, A.D.; Wiggins, S.M.; Cross, A.W.; Ronald, K.; He, W.; et al. Generation of powerful subnanosecond microwave pulses by intense electron bunches moving in a periodic backward wave structure in the superradiative regime. Phys. Rev. E Stat. Phys. Plasmasfluidsrelat. Interdiscip. Top. 1999, 60, 3297–3304. [Google Scholar] [CrossRef]
  29. Eltchaninov, A.A.; Korovin, S.D.; Rostov, V.V.; Pegel, I.V.; Mesyats, G.A.; Rukin, S.N.; Shpak, V.G.; Yaladin, M.I.; Ginzburg, N.S. Production of short microwave pulses with a peak power exceeding the driving electron beam power. Laser Part. Beams 2003, 21, 187–196. [Google Scholar] [CrossRef]
  30. Ginzburg, N.S.; Zotova, I.V.; Cross, A.W.; Phelps, A.D.R.; Yalandin, M.I.; Rostov, V.V. Generation, Amplification, and Nonlinear Self-Compression of Powerful Superradiance Pulses. IEEE Trans. Plasma Sci. 2013, 41, 646–660. [Google Scholar] [CrossRef] [Green Version]
  31. El’chaninov, A.A.; Korovin, S.D.; Rostov, V.V.; Pegel, I.V.; Mesyats, G.A.; Yalandin, M.I.; Ginzburg, N.S. Cherenkov superradiance with a peak power higher than electron flow power. JETP Lett. 2003, 77, 266–269. [Google Scholar] [CrossRef]
  32. Ginzburg, N.S.; Zotova, I.V.; Pegel, I.V.; Rostov, V.V.; Shpak, V.G.; Yalandin, M.I. Generation of high-power ultrashort electromagnetic pulses on the basis of effects of superradiance of electron bunches. Radiophys. Quantum Electron. 2007, 50, 762–779. [Google Scholar] [CrossRef]
  33. Rostov, V.V.; Totmeninov, E.M.; Yalandin, M.I. High-Power Relativistic Microwave Sources Based on the Backward Wave Oscillator with a Modulating Resonant Reflector. Radiophysics 2008, 78, 85–92. [Google Scholar] [CrossRef]
  34. Bogomolov, Y.L.; Lirin, S.F.; Semenov, V.E.; Sergeev, A.M. ionization self-channeling of extreme intense electromagnetic waves in a plasma. JETP Lett. 1987, 45, 680–683. [Google Scholar]
  35. Shafir, G.; Shlapakovski, A.; Siman-Tov, M.; Bliokh, Y.; Leopold, J.G.; Gleizer, S.; Gad, R.; Rostov, V.V.; Krasik, Y.E. High power microwave source for a plasma wakefield experiment. J. Appl. Phys. 2017, 121, 033301. [Google Scholar] [CrossRef]
  36. Rostov, V.V.; Romanchenko, I.V.; Pedos, M.S.; Rukin, S.N.; Sharypov, K.S.; Shpak, V.G.; Shunailov, S.A.; Yalandin, M.I. Superradiant Ka-band Cherenkov oscillator with 2-GW peak power. Phys. Plasmas 2016, 23, 093103. [Google Scholar] [CrossRef]
  37. Cao, Y.; Bliokh, Y.; Leopold, J.G.; Rostov, V.; Slutsker, Y.; Krasik, Y.E. Wakefield excitation by a powerful sub-nanosecond 28.6 GHz microwave pulse propagating in a plasma filled waveguide. Phys. Plasmas 2019, 25, 023102. [Google Scholar] [CrossRef]
  38. Rukin, S.N. High-power nanosecond pulse generators based on semiconductor opening switches. Instrum. Exp. Tech. 1999, 42, 439–467. [Google Scholar]
  39. Shafir, G.; Kreif, M.; Gleizer, J.Z.; Gleizer, S.; Krasik, Y.E.; Gunin, A.V.; Kutenkov, O.P.; Pegel, I.V.; Rostov, V.V. Experimental research of different plasma cathodes for generation of high-current electron beams. J. Appl. Phys. 2015, 118, 193302. [Google Scholar] [CrossRef]
  40. Goplen, B.; Ludeking, L.; Smith, D.; Warren, G. User-configurable MAGIC for electromagnetic PIC calculations. Comp. Phys. Commun. 1995, 87, 54–86. [Google Scholar] [CrossRef]
  41. Shafir, G.; Zolotukhin, D.; Godyak, V.; Shlapakovski, A.; Gleizer, S.; Slutsker, Y.; Gad, R.; Bernshtam, V.; Ralchenko, Y.; Krasik, Y.E. Characterization of inductively coupled plasma generated by quadruple antenna. Plasma Sources Sci. Technol. 2017, 26, 025005. [Google Scholar] [CrossRef]
  42. Shafir, G.; Cao, Y.; Bliokh, Y.; Leopold, J.G.; Levko, D.; Rostov, V.; Gad, R.; Fisher, A.; Bernshtam, V.; Krasik, Y.E. The interaction of intense, ultra-short microwave beams with the plasma generated by gas ionization. Phys. Plasmas 2018, 25, 032308. [Google Scholar] [CrossRef]
  43. Shafir, G.; Krasik, Y.E.; Bliokh, Y.P.; Levko, D.; Cao, Y.; Leopold, J.G.; Rostov, V.; Gad, R.; Bernshtam, V.; Fisher, A. Ionization-Induced Self-Channeling of an Ultrahigh-Power Subnanosecond Microwave Beam in a Neutral Gas. Phys. Rev. Lett. 2018, 120, 135003. [Google Scholar] [CrossRef] [PubMed]
  44. Cao, Y.; Leopold, J.G.; Bliokh, Y.P.; Krasik, Y.E. Self-channeling of powerful microwave beams in preliminarily formed plasma. Phys. Plasmas 2018, 25, 103101. [Google Scholar] [CrossRef]
  45. Krasik, Y.E.; Weingarten, A. Energetic Electron and Ion Beam Generation in Plasma Opening Switches. IEEE Trans. Plasma Sci. 1998, 26, 208–219. [Google Scholar] [CrossRef]
  46. Burrell, C.F.; Kunze, H.-J. Two-photon absorption and stimulated Raman scattering on excited Helium atoms in a plasma. Phys. Rev. Lett. 1972, 29, 1445–1448. [Google Scholar] [CrossRef]
  47. Brizhinev, M.P.; Gavrilenko, V.P.; Egorov, S.V.; Eremin, B.G.; Kostrov, A.V.; Oks, E.A.; Shagiev, Y.M. Procedure for quasilocal measurements of electric fields in a plasma by using satellites of helium forbidden lines. Zh. Eksp. Teor. Fiz. 1983, 85, 893–908. [Google Scholar]
  48. Rebhan, U.; Wiegart, N.J.; Kunze, H.-J. Measurements of fluctuating electric fields by means of high frequency Stark effect in a laser excited lithium beam. Phys. Lett. 1981, 85, 228–230. [Google Scholar] [CrossRef]
  49. Shefer, R.E.; Bekefi, G. Stark broadening induced by the intense electric field of a pulsed relativistic magnetron. Phys. Fluids 1979, 22, 1584–1586. [Google Scholar] [CrossRef]
  50. Oks, E.A. Plasma spectroscopy with quasimonochromatic electric fields. Sov. Phys. Dokl. 1984, 29, 224–226. [Google Scholar]
  51. Kamp, A.; Himmel, G. Determination of rf electric in deuterium from satellite of Balmer lines field strengths structure. Appl. Phys. B 1988, 47, 177–185. [Google Scholar] [CrossRef]
  52. Polushkin, I.N.; Ryabikin, M.Y.; Shagiev, Y.M.; Yazenkov, V.V. Local microwave field measurements in plasmas by resonant laser-induced fluorescence of hydrogen atoms. Zh. Eksp. Teor. Fiz. 1985, 89, 1648–1655. [Google Scholar]
  53. Akhmedzhanov, R.A.; Polushkin, I.N.; Rostovstev, Y.V.; Ryabikin, M.Y.; Shagiev, Y.M.; Yazenkov, V.V. Observation of the fine structure of a hydrogen plasma in a microwave field by intracavity laser spectroscopy. Zh. Eksp. Teor. Fiz. 1986, 63, 52–58. [Google Scholar]
  54. Ralchenko, Y.; Janev, R.K.; Kato, T.; Fursa, D.V.; Bray, I.; de Heer, F.J. Electron-impact excitation and ionization cross sections for ground state and excited helium atoms. At. Data Nucl. Data Tables 2008, 94, 603–622. [Google Scholar] [CrossRef]
  55. Welch, D.R.; Rose, D.V.; Oliver, B.V.; Clark, R.E. Simulation techniques for heavy ion fusion chamber transport. Nucl. Instrum. Methods Phys. Res. Sect. A 2001, 464, 134–139. [Google Scholar] [CrossRef]
  56. Welch, D.R.; Rose, D.V.; Cuneo, M.E.; Campbell, R.B.; Mehlhorn, T.A. Integrated simulation of the generation and transport of proton beams from laser-target interaction. Phys. Plasmas 2006, 13, 063105. [Google Scholar] [CrossRef]
  57. Bliokh, Y.P.; Leopold, J.G.; Shafir, G.; Shlapakovski, A.; Krasik, Y.E. Wakefield in a waveguide. Phys. Plasmas 2018, 24, 063112. [Google Scholar] [CrossRef]
  58. Dogariu, A.; Goldberg, B.M.; O’Byrne, S.; Miles, R.B. Species-Independent Femtosecond Localized Electric Field Measurement. Phys. Rev. Appl. 2017, 7, 024024. [Google Scholar] [CrossRef]
Figure 1. General mechanical drawing (not to scale) of the X-band Super Radiance Backward Wave Oscillator (SR-BWO) and interaction chamber.
Plasma 02 00006 g001
Figure 2. (a) The Slow Wave Structure (SWS) of the X-SR-BWO and the electron beam cross section. (b) The same for the Ka-SR-BWO.
Plasma 02 00006 g002
Figure 3. (a) The slotted cylindrical waveguide (b) Drawing of the experimental chamber (left), the structure of a flashboard (upper right) and the equivalent circuit of the flashboard breakdown process (lower right) [37].
Plasma 02 00006 g003
Figure 4. (a) The transmitted power measured on the receiving antenna placed at the downstream end of the interaction chamber (Figure 4) vs. gas pressure for He. (b) Time dependence of the transmitted power measured at the same position for three values of the He pressure [42].
Plasma 02 00006 g004
Figure 5. Time integrated side-view of the light emitted along the He filled interaction chamber for various values of the gas pressure [42] (left panel). 1.2 ns long images of the light emission in a region close to the dielectric lens for 4.5 kPa, He pressure from the time light appears at t = 0 [46] (right panel).
Plasma 02 00006 g005
Figure 6. Time integrated patterns of the microwave beam power distribution measured by the array of Ne lamps at the distance of 10 cm from the focal plane: for He at 20 mPa (a) 4.5 kPa (b) 30 kPa (c) and front view fast framing images of the plasma obtained for He at 4.5 kPa (d) and 30 kPa (e).
Plasma 02 00006 g006
Figure 7. The 1D PIC calculated Electron Energy Distribution Function (EEDF) at the peak of the microwave field [43]. Insert: The electron impact ionization cross section vs. the electron energy [54].
Plasma 02 00006 g007
Figure 8. Results of Large Scale Plasma (LSP) simulations: Time- and space-resolved evolution 1st row: of the density of the plasma; 2nd row: of the electric field |Ex| (electric field ranges in (a) between 0 and 200 kV/cm, whereas in (b,c) 0–150 kV/cm and the contour colors scale accordingly); and 3rd row: plasma electron energy [42].
Plasma 02 00006 g008
Figure 9. Electron density, ρ, contours (first row), contours of Ex (second row), and contours of Ez (third row) vs. z, for three time points. For electric field contour plots, the arrows represent the direction of the electron motion resulting from the corresponding electric field [35].
Plasma 02 00006 g009
Figure 10. Radial distributions of the normalized density n e ( r ) / n e 0 for different waveguide radii, for P = 0.5 GW, n e 0 = 2.5 × 1010 cm−3 [37].
Plasma 02 00006 g010
Figure 11. Contours of the electron density ne normalized to the initial density, neo = 2.5 × 1010 cm−3 vs. z at 3 ns from the microwave pulse injection start time at z = 0, t = 0, for different waveguide radii 6.2 (a), 6.4 (b), 6.6 (c) and 7.5 mm (d) for a 28 GHz, 500 MW and 0.4 ns Full Width at Half Maximum (FWHM) microwave pulse propagating from z = 0 downstream [37].
Plasma 02 00006 g011
Figure 12. Relative electron density contours in the [r, z] plane at y = 0 and t = 3.5 ns [57].
Plasma 02 00006 g012
Figure 13. Electron positions in the [r,z] plane including all electrons within a 1 mm thick slice, at t = 3.5 ns for 1.25 GW, 10 GHz, 0.4 ns FWHM pulse and ne = 3 × 1010 cm−3 [57].
Plasma 02 00006 g013