
Article

Evaluating the Reliability of Cross-Instrument Comparison: (p)XRF Measurements of Two Rare ‘Kangxi-Reign’ Enameled Glasses


1
Department of Metallurgical and Materials Engineering, Faculty of Chemical and Metallurgical Engineering, Yildiz Technical University, Davutpasa Mah. Davutpasa Caddesi Esenler, Istanbul 34220, Türkiye
2
Laboratoire ‘De la Molécule au Nano-Objet: Réactivité, Interaction et Spectroscopies’ (MONARIS UMR8233), CNRS, Sorbonne Université, Campus P.-et-M. Curie, 4 Place Jussieu, 75005 Paris, France
3
National Palace Museum, 221, Sec. 2, Zhishan Rd., Shilin Dist., Taipei 111001, Taiwan
4
Graduate Institute of Art History, National Taiwan University, No. 1, Sec. 4, Roosevelt Road, Taipei 10617, Taiwan
5
Centre de Recherche sur les Civilisations de l’Asie Orientale—CRCAO UMR 8155, CNRS, Collège de France, 75005 Paris, France
*
Author to whom correspondence should be addressed.
Ceramics 2026, 9(9), 98; https://doi.org/10.3390/ceramics9090098
Submission received: 18 August 2026 / Revised: 30 August 2026 / Accepted: 4 September 2026 / Published: 11 September 2026
(This article belongs to the Special Issue Advances in Ceramics, 3rd Edition)

Abstract

The study of heterogeneous exceptional objects preserved in different places implies the use of various instruments. Here, we compare the manufacturing techniques of two rare enameled glasses (a box and a vase) made for the Kangxi Emperor (r. 1661–1722) using XRF analyses performed in the laboratory for one object and with a mobile spectrometer for the other. The enamels are identified and compared based on the characteristic signals of different chemical elements, with or without multivariate analysis. Although the bodies have similar compositions (but differ in trace elements) and are opacified with calcium arsenate, large differences are observed for certain enamels: the red of the box is obtained using the traditional Chinese method based on copper nanoparticles, while the brown and purple to pink of the vase use gold nanoparticles, a recipe imported from Europe. The white highlights of the box are opacified with tin. Cobalt is rich in arsenic and contains bismuth and nickel, consistent with European importation as reported in historical sources. Naples yellow is used in both objects. A comparison of the distinctive features of these objects with those of painted enameled imperial porcelain and cloisonné enamelware further highlights the technological exchanges and material choices involved in the production of imperial decorative objects, as well as the very innovative ‘research’ conducted at the imperial glass workshop.

Graphical Abstract

1. Introduction

Comparing technological data of extremely rare objects is challenging. These objects belong to collections preserved in different countries, and the non-invasive analytical equipment that can be used is generally different, as are their characteristics and performance. The time available to carry out measurements is also limited, and some objects present additional difficulties due to their complex shape and heterogeneous/multi-layered nature. This is the case for the two objects studied in this work: two rare enameled glass pieces produced during the reign of the Qing emperor Kangxi (r. 1661–1722) at the beginning of the 18th century. Only three objects of this type are known to date [1,2,3].
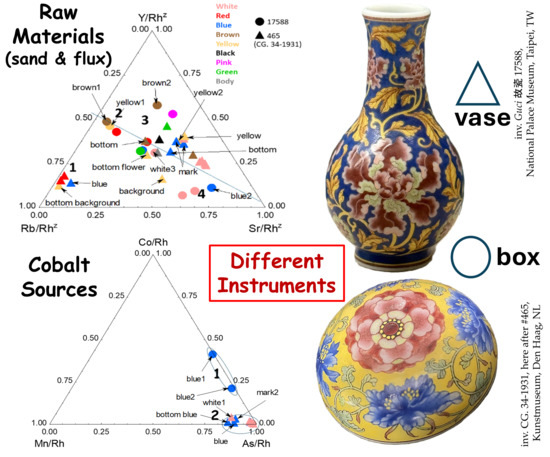
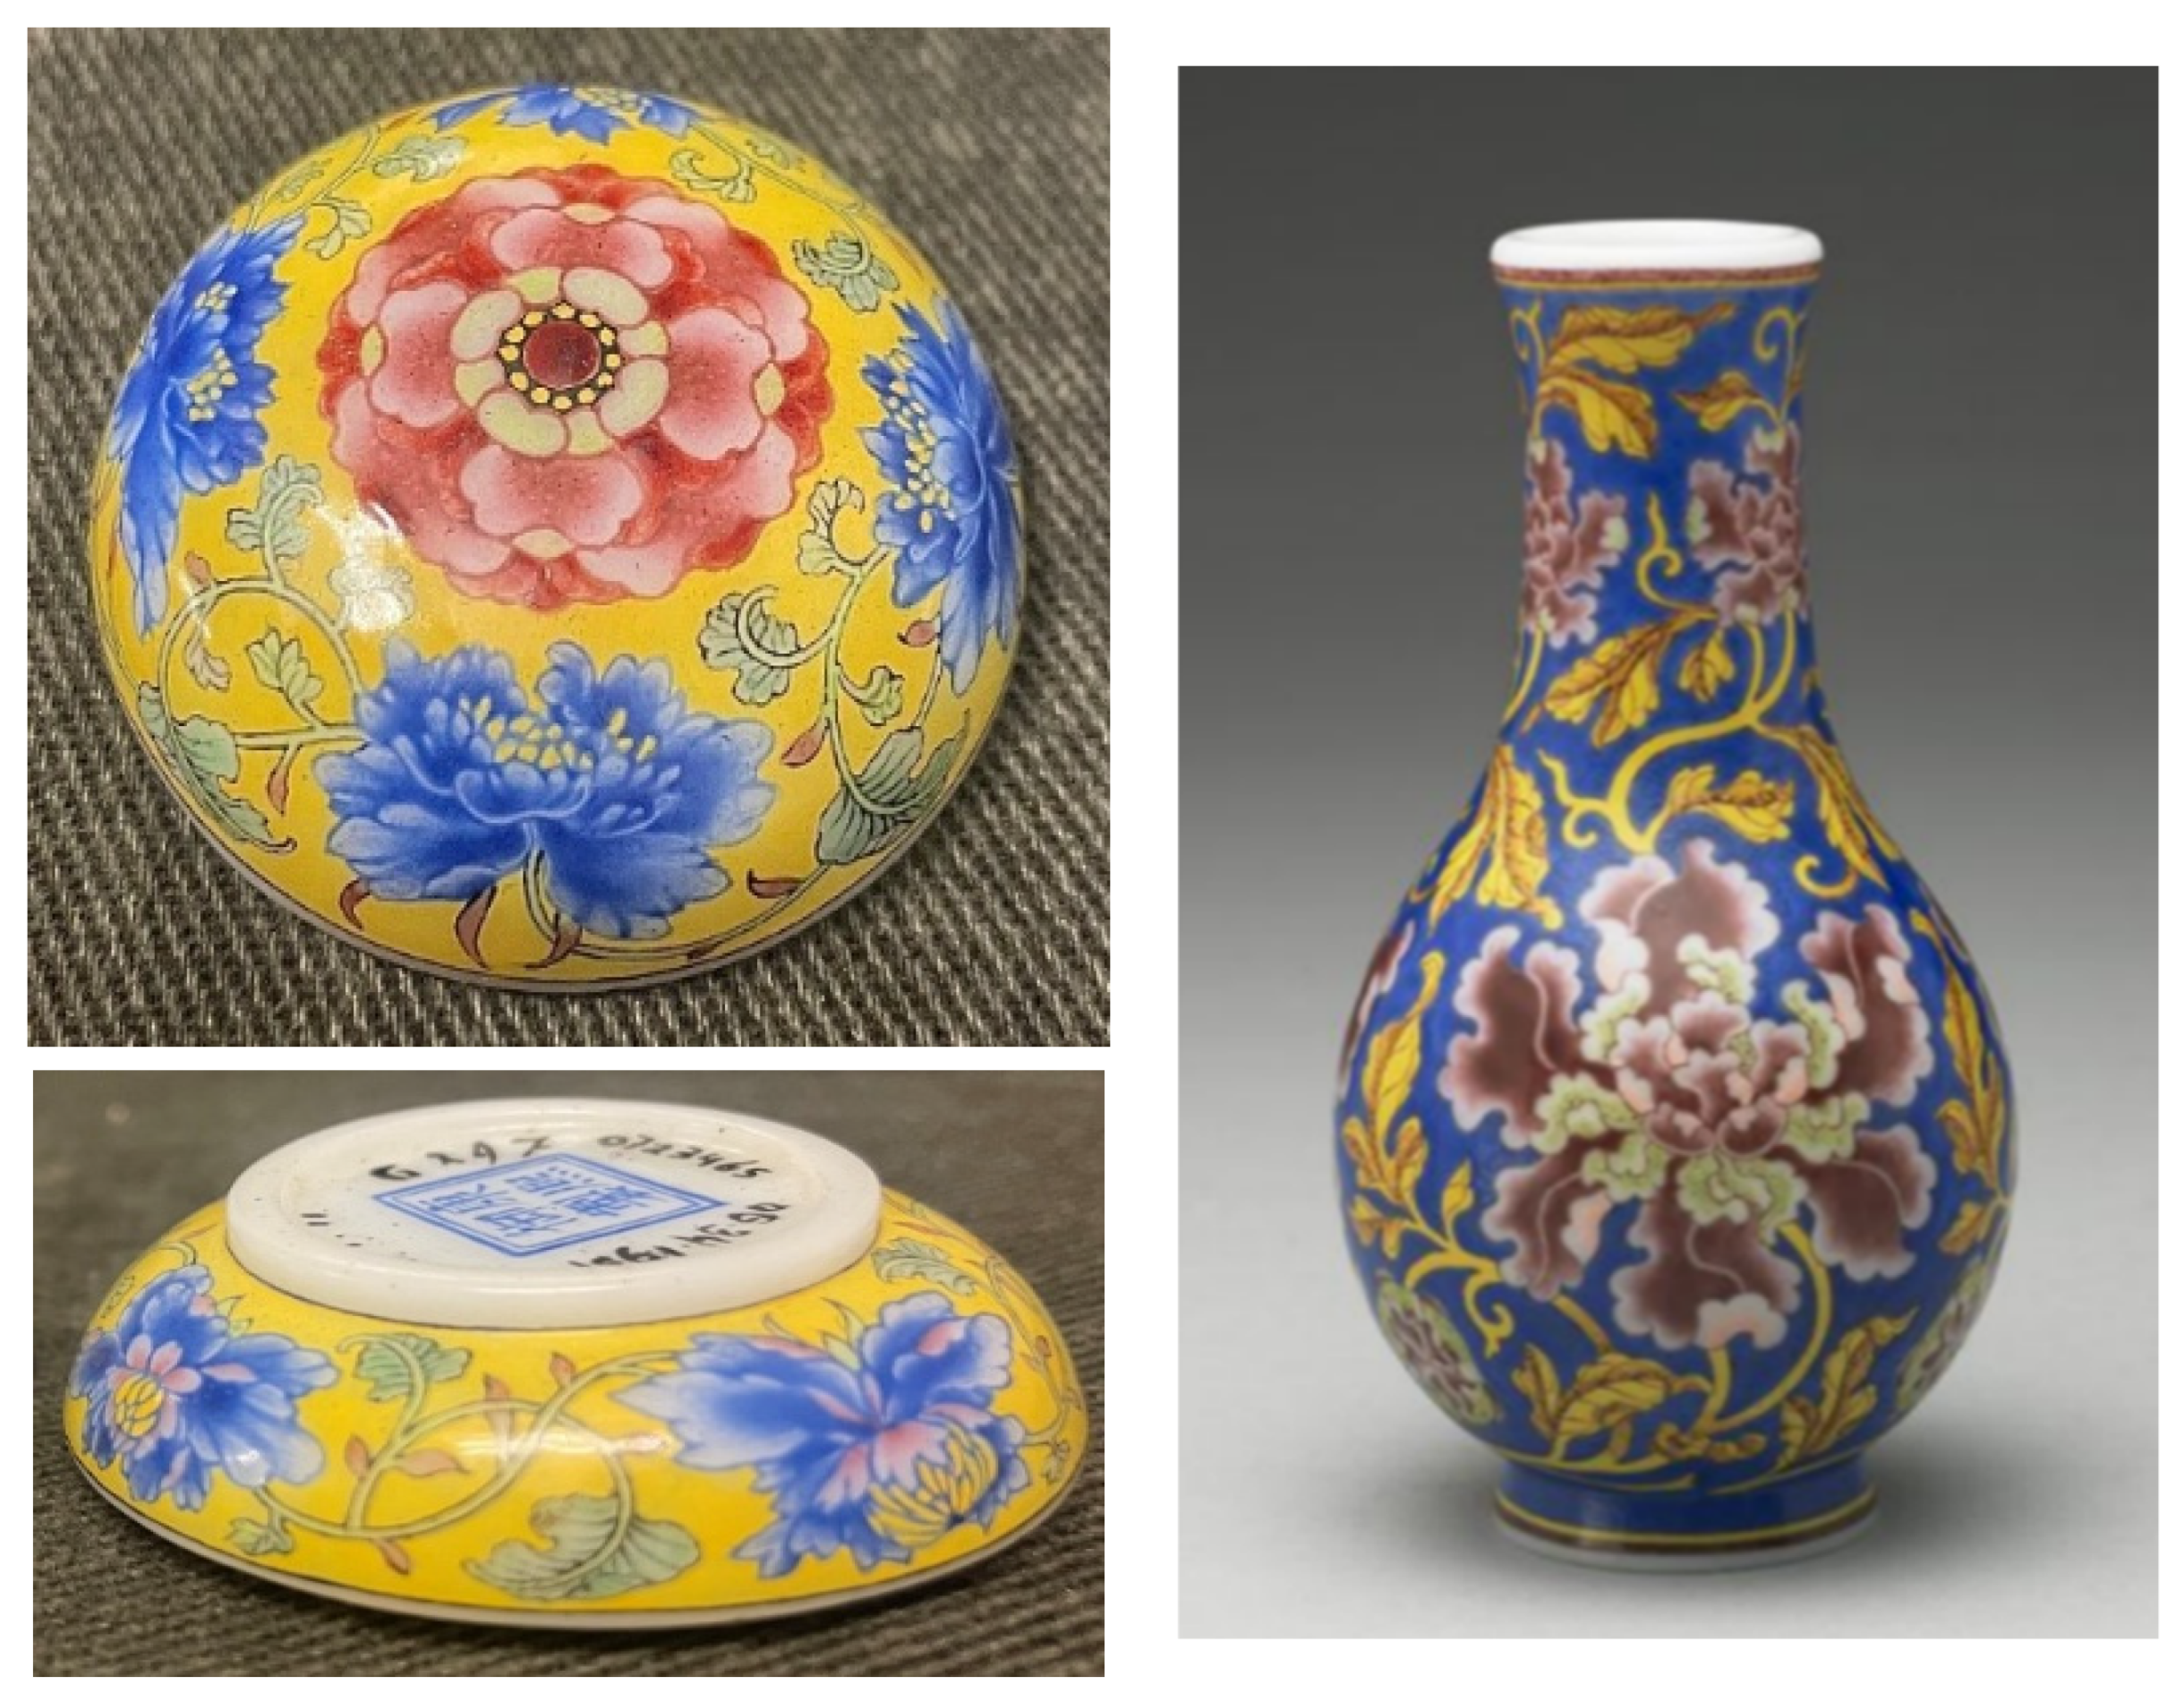
The comparison focuses on these two objects shown in Figure 1: a small box (diameter: 4.5 cm; height: 3.5 cm) belonging to the Kunstmuseum in The Hague (The Netherlands), which has never been analyzed, and a small vase (height: 12.4 cm) belonging to the National Palace Museum in Taipei (Taiwan), whose study by X-ray fluorescence (XRF) and Raman microspectroscopy has recently been published [1].
The box bears the mark ‘Kangxi yu zhi’ (i.e., ‘made by imperial command of the Kangxi emperor’) in blue enamel, enclosed within a double square border, while the unmarked vase is believed to have been produced during the same era based on its closely related form and style. Although the vase bears no reign mark, the title inscribed on its wooden box—probably made during the Qianlong period for the former Qing imperial collection [1]—together with subsequent archival records of imperial display (e.g., during the Daoguang 道光 reign, r. 1820–1850) supports its attribution. In both cases, the body is made of opaque white glass, and the floral enamel decoration uses yellow, blue, white, green, brown, purple, red, and black colors. These objects are of great interest for the study of technological exchanges between Europe and China in the 18th century [1,2,3]. Indeed, both French and Vatican documents (missionary reports, correspondence, and diplomatic archives) [2,4,5,6,7] and Chinese sources (Imperial Palace archives) [8,9,10] attest to the establishment of a glass workshop with an enameling atelier at Beitang, the church of the French Jesuits received at court by the Manchu emperor Kangxi. This church, adjacent to the Forbidden City, served as a site for the production of optical glass and other glass objects from 1696 onward, using European raw materials and recipes under the direction of Jesuit experts, particularly the German Jesuit, Killian Stumpf (1655–1720, the first director of the Imperial glass workshop in Beijing, and probably also those who arrived from France aboard the ship Amphitrite in 1698 [11]. Painted enameling was first carried out on glass and later applied to porcelain [2,9,10,12,13]. Detailed non-invasive studies of enameled imperial porcelains show, in agreement with historical documents, that the colors that use European ingredients and techniques include yellow, blue, red and pink, white, and certain shades of green [12,13,14,15,16].
The objective of this research is to compare the technologies used in the manufacture of these two objects, based on a comparison of elemental analyses carried out non-invasively by X-ray fluorescence (XRF) spectroscopy. The combination of the highly heterogeneous nature of the material forming the enameled decoration—due to the variable concentration of coloring agents and the layered enameling—and the requirement to perform measurements from the surface, together with the very wide energy range (1 to 40 keV) in which the characteristic peaks of the different electronic transitions (K, L, M, and secondary) are measured, results in spectra—and thus characteristic peak intensities—that are highly dependent on the measurement conditions and the elemental composition of the artifact being analyzed. In the material—and in air—low-energy X-ray photons are absorbed; therefore, X-ray fluorescence spectroscopy probes the content of light elements only within a surface layer that is a few microns thick (see calculation in [17]), due to the absorption of the excitation beam and, especially, of the fluorescence signal. To avoid the issues caused by the absorption of the signal by the air, laboratory setups can therefore operate under primary vacuum to improve the evaluation of silicon, aluminum, and magnesium (low-Z elements) content and to enable the measurement of sodium and even fluorine when present in sufficient quantities. Furthermore, regardless of the instrument used, the main fluorescence peaks of many heavy elements (Sn, Sb, etc., which are high-energy) are measured over a thickness greater than hundreds of µm, a thickness 2 to 10 times greater than that of the enamel layers. Therefore, the XRF spectrum depends strongly on the thickness and composition of the glaze at the spot of analysis.
All these parameters mean that determining the exact composition of the enameled decoration is not feasible using non-invasive methods [15,16,18,19] (only information on the composition of the body can be obtained for elements with Z > 10). Moreover, in the case of enamels with highly varied colors over small areas—as each volume analyzed contains materials of different compositions—absolute quantification is not meaningful. In any case, for objects as rare as those studied in this work, micro-destructive methods such as LIBS (laser-induced breakdown spectroscopy) and LA-ICP-MS (laser ablation inductively coupled plasma mass spectrometry) are completely ruled out. Instead, comparison of the distributions of characteristic fluorescence peak areas of elements in ternary diagrams relevant to enameling technologies, or the use of chemometric approaches, is employed to identify enamels with similar colors and, in some cases, those using the same raw materials [15,16,18,19]. Elemental analyses provide hypotheses regarding the nature of coloring agents, which would require validation through further non-invasive analyses using Raman microspectroscopy—a technique that identifies the nature (structure, symmetry, etc.) of many amorphous and/or crystalline phases present. In this work, we compare the analytical results obtained for the vase belonging to the National Palace Museum (NPM) in Taipei, previously analyzed using an XRF laboratory instrument operating under primary vacuum and Raman microspectroscopy, with those obtained at the Kunstmuseum in The Hague using a portable XRF spectrometer (pXRF) operating in air.

2. Materials and Methods

2.1. Measurements in the Laboratory (XRF Working Under Primary Vacuum) [1]

XRF analysis was performed at the Laboratory housed in the National Palace Museum, Taipei, using an M4 TORNADO Plus instrument (Bruker, Berlin, Germany), featuring a Rh-anode X-ray tube and dual XFlash® Silicon Drift Detectors (energy resolution < 140 eV for Mn Kα; detection range: 1.3–43 keV in air (Bruker Nano GmbH, Berlin, Germany)). The sample chamber and X-ray pathway are under primary vacuum, and measurements were taken in the mapping mode (20 µm spot mapped over an area of 0.06–0.16 mm2 visible in the image provided by a camera) for 300 s at 45 kV and 300 μA, with no filter between the tube and the sample. Focus is computer-controlled. The analysis depth, estimated using the Beer–Lambert law (defined as the layer from which 90% of the fluorescence originates [17]), was approximately 6 μm for Si Kα (1.740 keV), 170 μm for Cu Kα (8.048 keV), 300 μm for Au Lα (9.713 keV)—comparable to the largest glaze thicknesses—and 3 mm for Sn Kα (25.27 keV). The data were treated using the built-in MQuant software, which operates directly on the core computational architecture of Bruker ESPRIT Reveals 2.6.0.1028 software (Bruker Nanoanalytics, Berlin, Germany).

2.2. On-Site Measurements (Portable X-Ray Fluorescence Spectroscopy (pXRF))

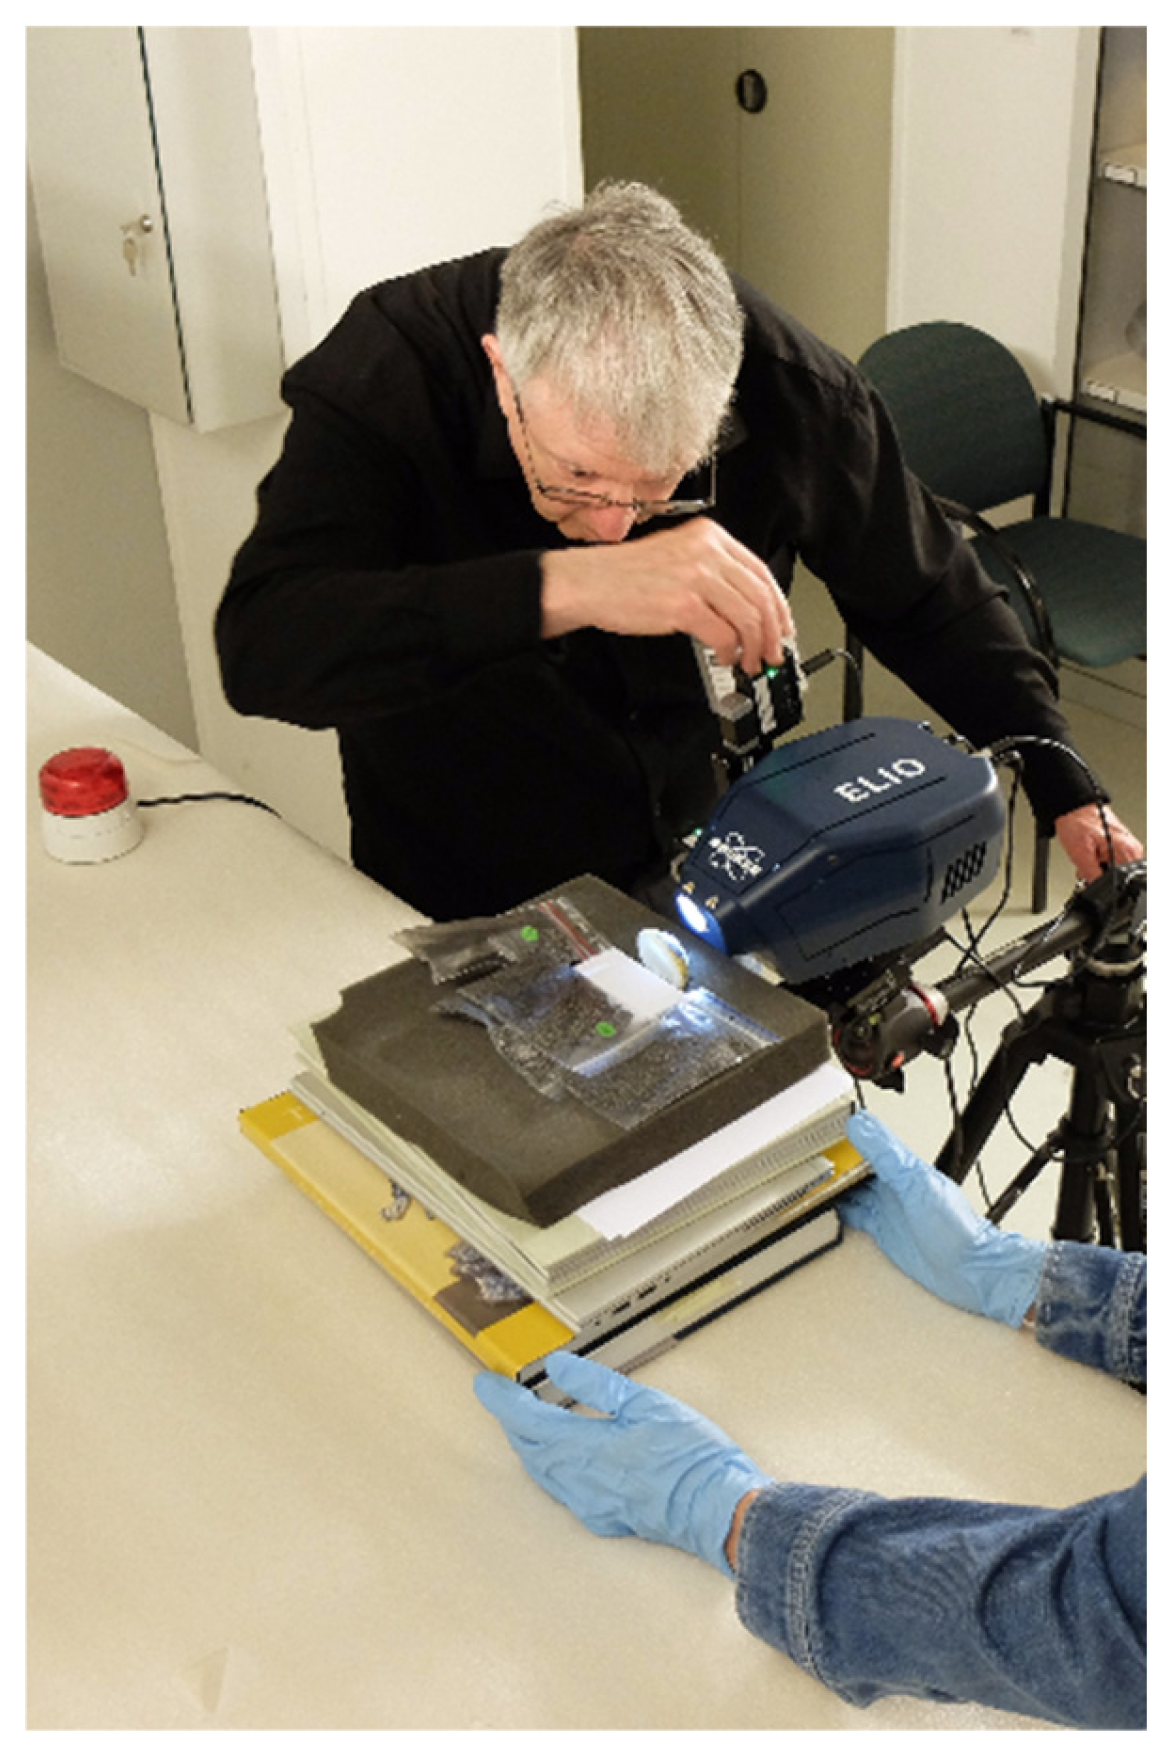
X-ray fluorescence analysis was performed at the Kunstmuseum, Den Haag (Figure 2) using a portable Elio-Bruker instrument (Berlin, Germany). The set-up includes a miniature 4W X-ray tube with a rhodium anode, a collimator producing a beam with a diameter of ~1 mm, and a large-area Silicon Drift Detector (active area: 50 mm2) equipped with a CUBE preamplifier, offering an energy resolution similar to that of the above-mentioned instrument. After prepositioning the artifact, a camera allows the analyzed area to be viewed (magnification ~12×) and the working distance to be adjusted. Two alignment lasers are used to perform z-axis focusing, which is carried out manually, while the analyzed point is adjusted using a motorized micrometric X-Y stage. The working distance between the front of the instrument and the analyzed spot is about 1 cm, which permits the selection of colored areas located on relatively flat or convex zones. Perfect perpendicularity to the measured area was sought in order to minimize Compton peaks and control the analyzed area. Measurements were carried out in point mode with an acquisition time of 360 s for white, blue, and red colors, and 180 s for the other colors, using a tube voltage of 50 kV and a current of 80 μA. The thumbnail images captured by the camera visualize the analysis area (via the laser spot used for focusing). However, experience has shown that a small portion of the beam illuminates a much larger surface area, leading to signal contamination from the most intense peaks in the regions surrounding the spot.

2.3. Data Normalization Procedures for the Interpretation of the Results

The data fitting procedure using Artax 7.4.0.0 (Bruker, AXS GmbH, Karlsruhe, Germany) software has been described in previous papers [15,18,19]. As discussed in the Introduction, for objects that are particularly heterogeneous in terms of surface and depth, it is not possible to achieve a meaningful absolute quantification of the composition. To address this, we compared the areas of characteristic peaks, as performed in previous studies [15,18,19]. The net area under the peak at the characteristic fluorescence energy of each selected element in the periodic table was calculated, and the counts of the major, minor, and trace elements were determined for the paste and colored areas (white, red, yellow, orange, blue, green, and black). To enable ‘quantitative’ comparison of the data, the net areas for each element were normalized by the number of XRF photons derived from the Kα peak of the rhodium X-ray tube. Normalization with respect to the Co signal was also used for comparing specific elements. The normalized data were then plotted in ternary scatter plots for interpretation and discussion using the software Statistica® 13.5.0.17 (TIBCO Software Inc., Palo Alto, Santa Clara, CA, USA).
One of the primary objectives of applying geochemical approaches is to detect elemental anomalies that may reflect the occurrence of mineral deposits or purification processes applied to raw materials before artifact production. The evaluation of such anomalies is generally strengthened through the consideration of statistical descriptors, such as the mean, variance, and standard deviation.
Following the normalization of the XRF data, carried out previously to account for variations in measurement conditions and instrumental response, further standardization is advised for some data analyses (such as principal component analysis) in order to overcome the effects associated with the different orders of magnitude of the data [20]. These two procedures therefore address different sources of variability: Rh-normalization improves the comparability of the measured XRF signals, whereas z-score standardization places the different elemental variables on a comparable statistical scale. This distinction is particularly important in the present dataset because the count intensity of Pb is substantially higher than that of Rh and of many other analyzed elements. Consequently, even after Rh-normalization, Pb can dominate the distribution of the data and mask variations in elements present at lower count intensities. For example, in ternary scatter plots based on Rh-normalized peak areas, the high Pb contribution causes the data points to cluster toward the Pb apex, making it difficult to distinguish compositional groups.
The z-score is a standardization approach expressing the distance of an observation, x, from the mean in terms of standard deviation units [18,20,21]. In the present work, z-scores were obtained by subtracting the mean value and dividing by the standard deviation for the peak areas of each analyzed element. Through this normalization, the data are “centered-reduced”, meaning that each variable has been scaled so that it has a mean of 0 and a standard deviation of 1, facilitating the recognition of anomalous behaviors that can be hidden by large differences in peak areas [20,21]. In this context, z-score standardization is not intended to replace Rh-normalization, but to prevent high-count elements such as Pb from disproportionately influencing subsequent multivariate analyses and graphical representations. As emphasized in the recent review by Brereton [20], standardizing analytical data columns represents a widely used preprocessing step before performing principal component analysis (PCA).
Because ternary scatter plots require positive proportional values, in order to plot centered-reduced data in such a diagram, the obtained z-scores were subsequently converted using the cumulative distribution function (CDF) of the standard normal distribution [22]. This sigmoidal transformation constrains the original z-score values to the interval between 0 and 1. In this way, the statistical meaning of elemental variations was maintained while generating a suitable coordinate framework for ternary plotting [18,23]. The procedure also allowed the simultaneous visualization of elemental enrichments and depletions within the same triangular representation.
In this work, we analyze and discuss the XRF data at several stages of “processing”. These range from the observation of raw spectra to the extraction of Rh-normalized fluorescence peak areas, and the latter data following z-score transformation. These quantitative data are then analyzed using ternary diagrams and Principal Component Analysis (PCA). Results/diagrams derived from Rh-normalized peak areas were compared with those obtained after applying z-score transformation to the Rh-normalized dataset. This sequential approach allows the effects of instrumental variability and differences in elemental scale to be considered separately. It also minimizes the dominance of major elements such as Pb and enhances the contribution of lower-intensity elements that may provide more discriminative information regarding differences in raw material usage and production technologies.

3. Results

3.1. Enamel Coloring: State of the Art at the End of the 17th Century

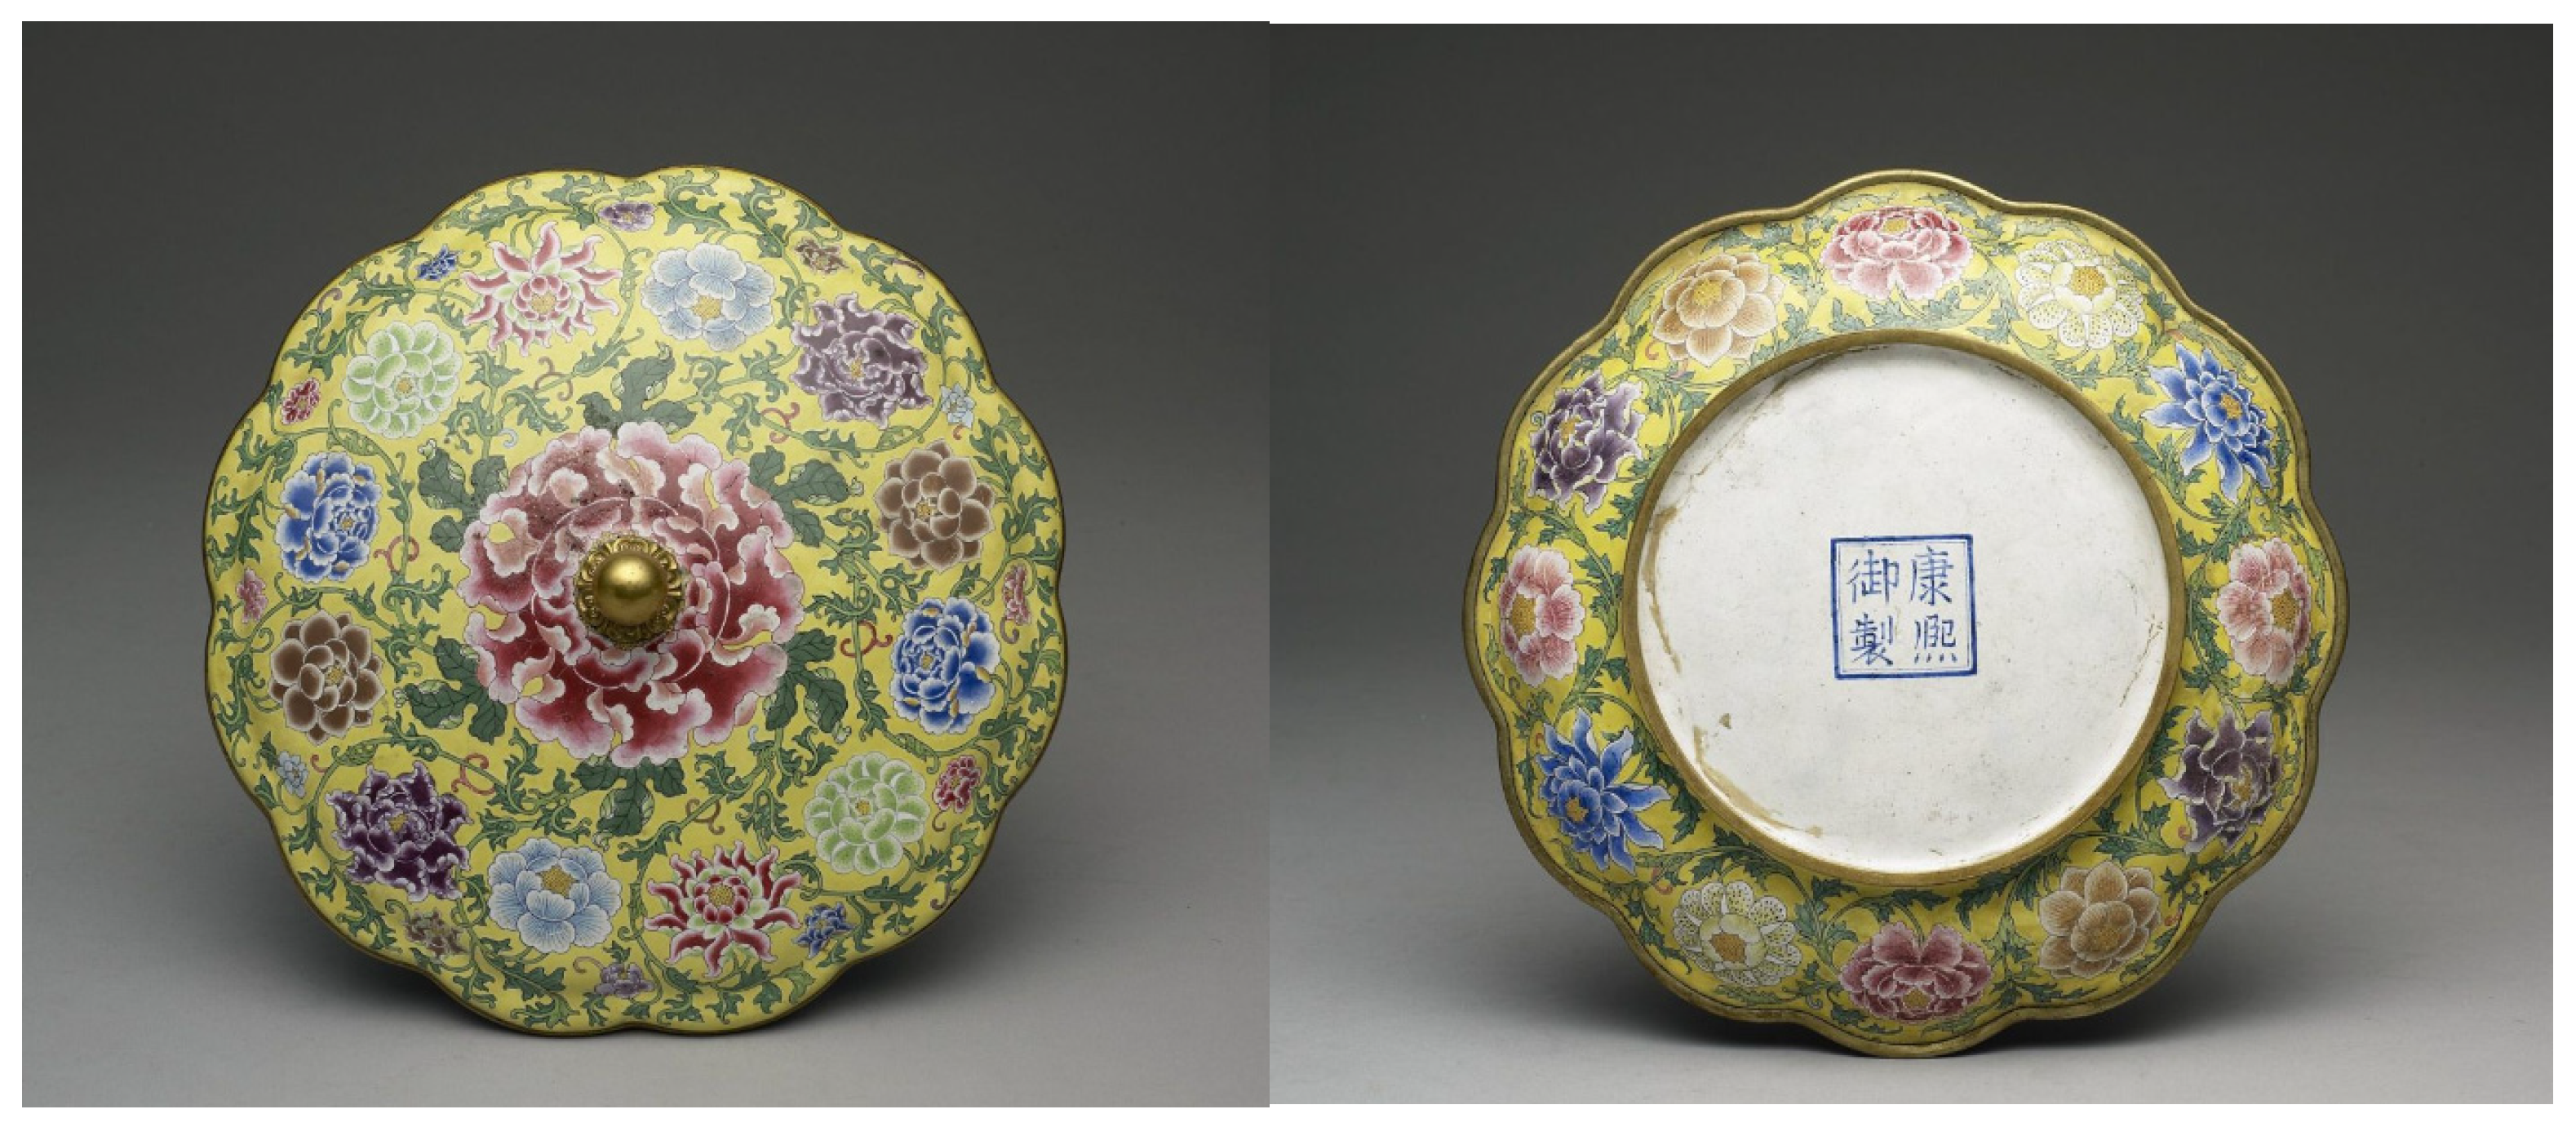
Blue, yellow, red, and pink constitute the dominant color palette for both objects (Figure 1). Notably, the decorative execution of the yellow-ground floral box displays a higher degree of artistic maturity, manifested in the surface texture of the blossoms and the sophisticated modulation of color gradients. A comparable composition is observable in a yellow-ground painted enamel floral box on a copper substrate (also bearing the Kangxi reign mark) from the collection of the National Palace Museum (Figure 3). Its analogous color scheme and botanical iconography render it a premier specimen for comparative study.
Crucially, the yellow ground of the copper-bodied painted enamel work appears more muted and pastel, closely aligning with the most representative ‘yellow-ground enamel’ imperial style that was subsequently utilized on a large scale by the Qing court. Within the Qing dynasty, yellow served as an exclusive symbol of imperial sovereignty [10]. Before the arrival of the Jesuits in Beijing, yellow, as a background color or for monochromes, was traditionally produced using a lead-rich glaze colored by iron ions [24,25]. Pure lead-tin yellow started to be significantly used for overglaze decoration of porcelain under the Wanli reign (1572–1620). However, it has been claimed that Pb-Sn-Sb-containing pigment should have been used during the Chenghua reign (1447–1487). The introduction of this recipe is debated. Actually, lead-tin pigment was introduced in Japan by Portuguese Jesuits in Arita (Kyushu Island) during the Kan’ei period (1624–1645) or even earlier (Giovanni Cola established Seminario in 1583 at Arie, a small city close to Nagasaki) [26,27,28]. Jesuits established in Macao depended on the Visitator located in Japan, and dissemination of the know-how toward Macao, Canton and imperial workshops is likely. In Europe, the antimony/tin-yellow pigment, also called Naples yellow pigment, which offers a larger variety of hues from yellow to green by dissolving additional Cu2+ ions in the glassy matrix, started to be used on a large scale for istoriato majolica at the end of the 16th century in Europe [18,29,30,31,32], and was innovatively deployed in the Qing imperial glass workshops as a dominant ‘ground color’ (yellow ground) across expansive surfaces [9,10,14,16], thereby forging the classic and canonical ‘yellow-ground enamel’ imperial aesthetic.
Red color was traditionally obtained by Chinese potters using copper nanoparticles (Cu° NPs) dispersed in porcelain glaze fired at high temperature in a reducing atmosphere [33,34,35]. This technique has also been common in Europe since the Celtic and Roman periods [35]. Red to ruby and purple glasses were prepared by dispersing gold nanoparticles (Au° NPs) in a glassy silicate network from the 17th century onward [35]. Although the technique is likely Roman (rare red dichroic glasses are colored by both Cu° and Au° NPs [35]), production of red to ruby glass was first made by Bernard Perrot, an Italian glassmaker established in Orléans (France) and working since circa 1666 for the Sun King Louis XIV [36,37]. The gold powder used to color the glass is prepared from a gold (AuCl4) solution obtained by dissolution of gold in aqua regia (mixture of nitric and hydrochloric acids) by addition of multivalent ions (tin, arsenic, antimony, mercury or iron) whose oxidation permits reduction of AuCl4 ions into Au° NPs [19,35,36,37]. The recipe was popularized by Johannes Kunckel’s 1679 book, Ars Vitraria Experimentalis, (Johannes Kunckel was the head of the Sachsen Mining Office and contributed to the studies that led to the discovery of porcelain glaze recipes in Meissen), under the name ‘Cassius purple’ after 1720 [35]. According to Wang [38], two primary Qing sources document the use of gold to color glass: first, a 1716 palace memorial by Guangdong Governor Yang Lin mentioning that ‘Pan Chun from Guangdong can fire enamelware… his peach-pink color involves mixing gold with red copper… 廣東人潘淳能燒法藍物件… 潘淳所製法桃紅顏色的金子攙紅銅料…’; and second, a 1719 requisition list by French Jesuit Jean Baptiste Gravereau (1690–1762, Chinese name 陳忠信 Chen Zhongxin) to the Paris Jesuits, specifying one ounce of carmine enamel shipped in a pewter box. Gravereau’s specific instructions evoke a compelling connection to Sol Sine Veste (Gold Unveiled: Modulating Red Glass with Purple Gold Powder), published in 1684 by the German metallurgist Johann Christian Orschall [35]. Recent analysis of painted enameled Qing porcelains shows the preferential use of Perrot’s method (gold precipitated with arsenic) instead of Kunckel’s method (precipitation with tin) in Qing Dynasty artifacts [16,39]. Alternatively, red enamel was also obtained in glazed Qing imperial porcelain (Kangxi reign and after) using hematite pigment [14].

3.2. Visual Comparison of XRF Spectra

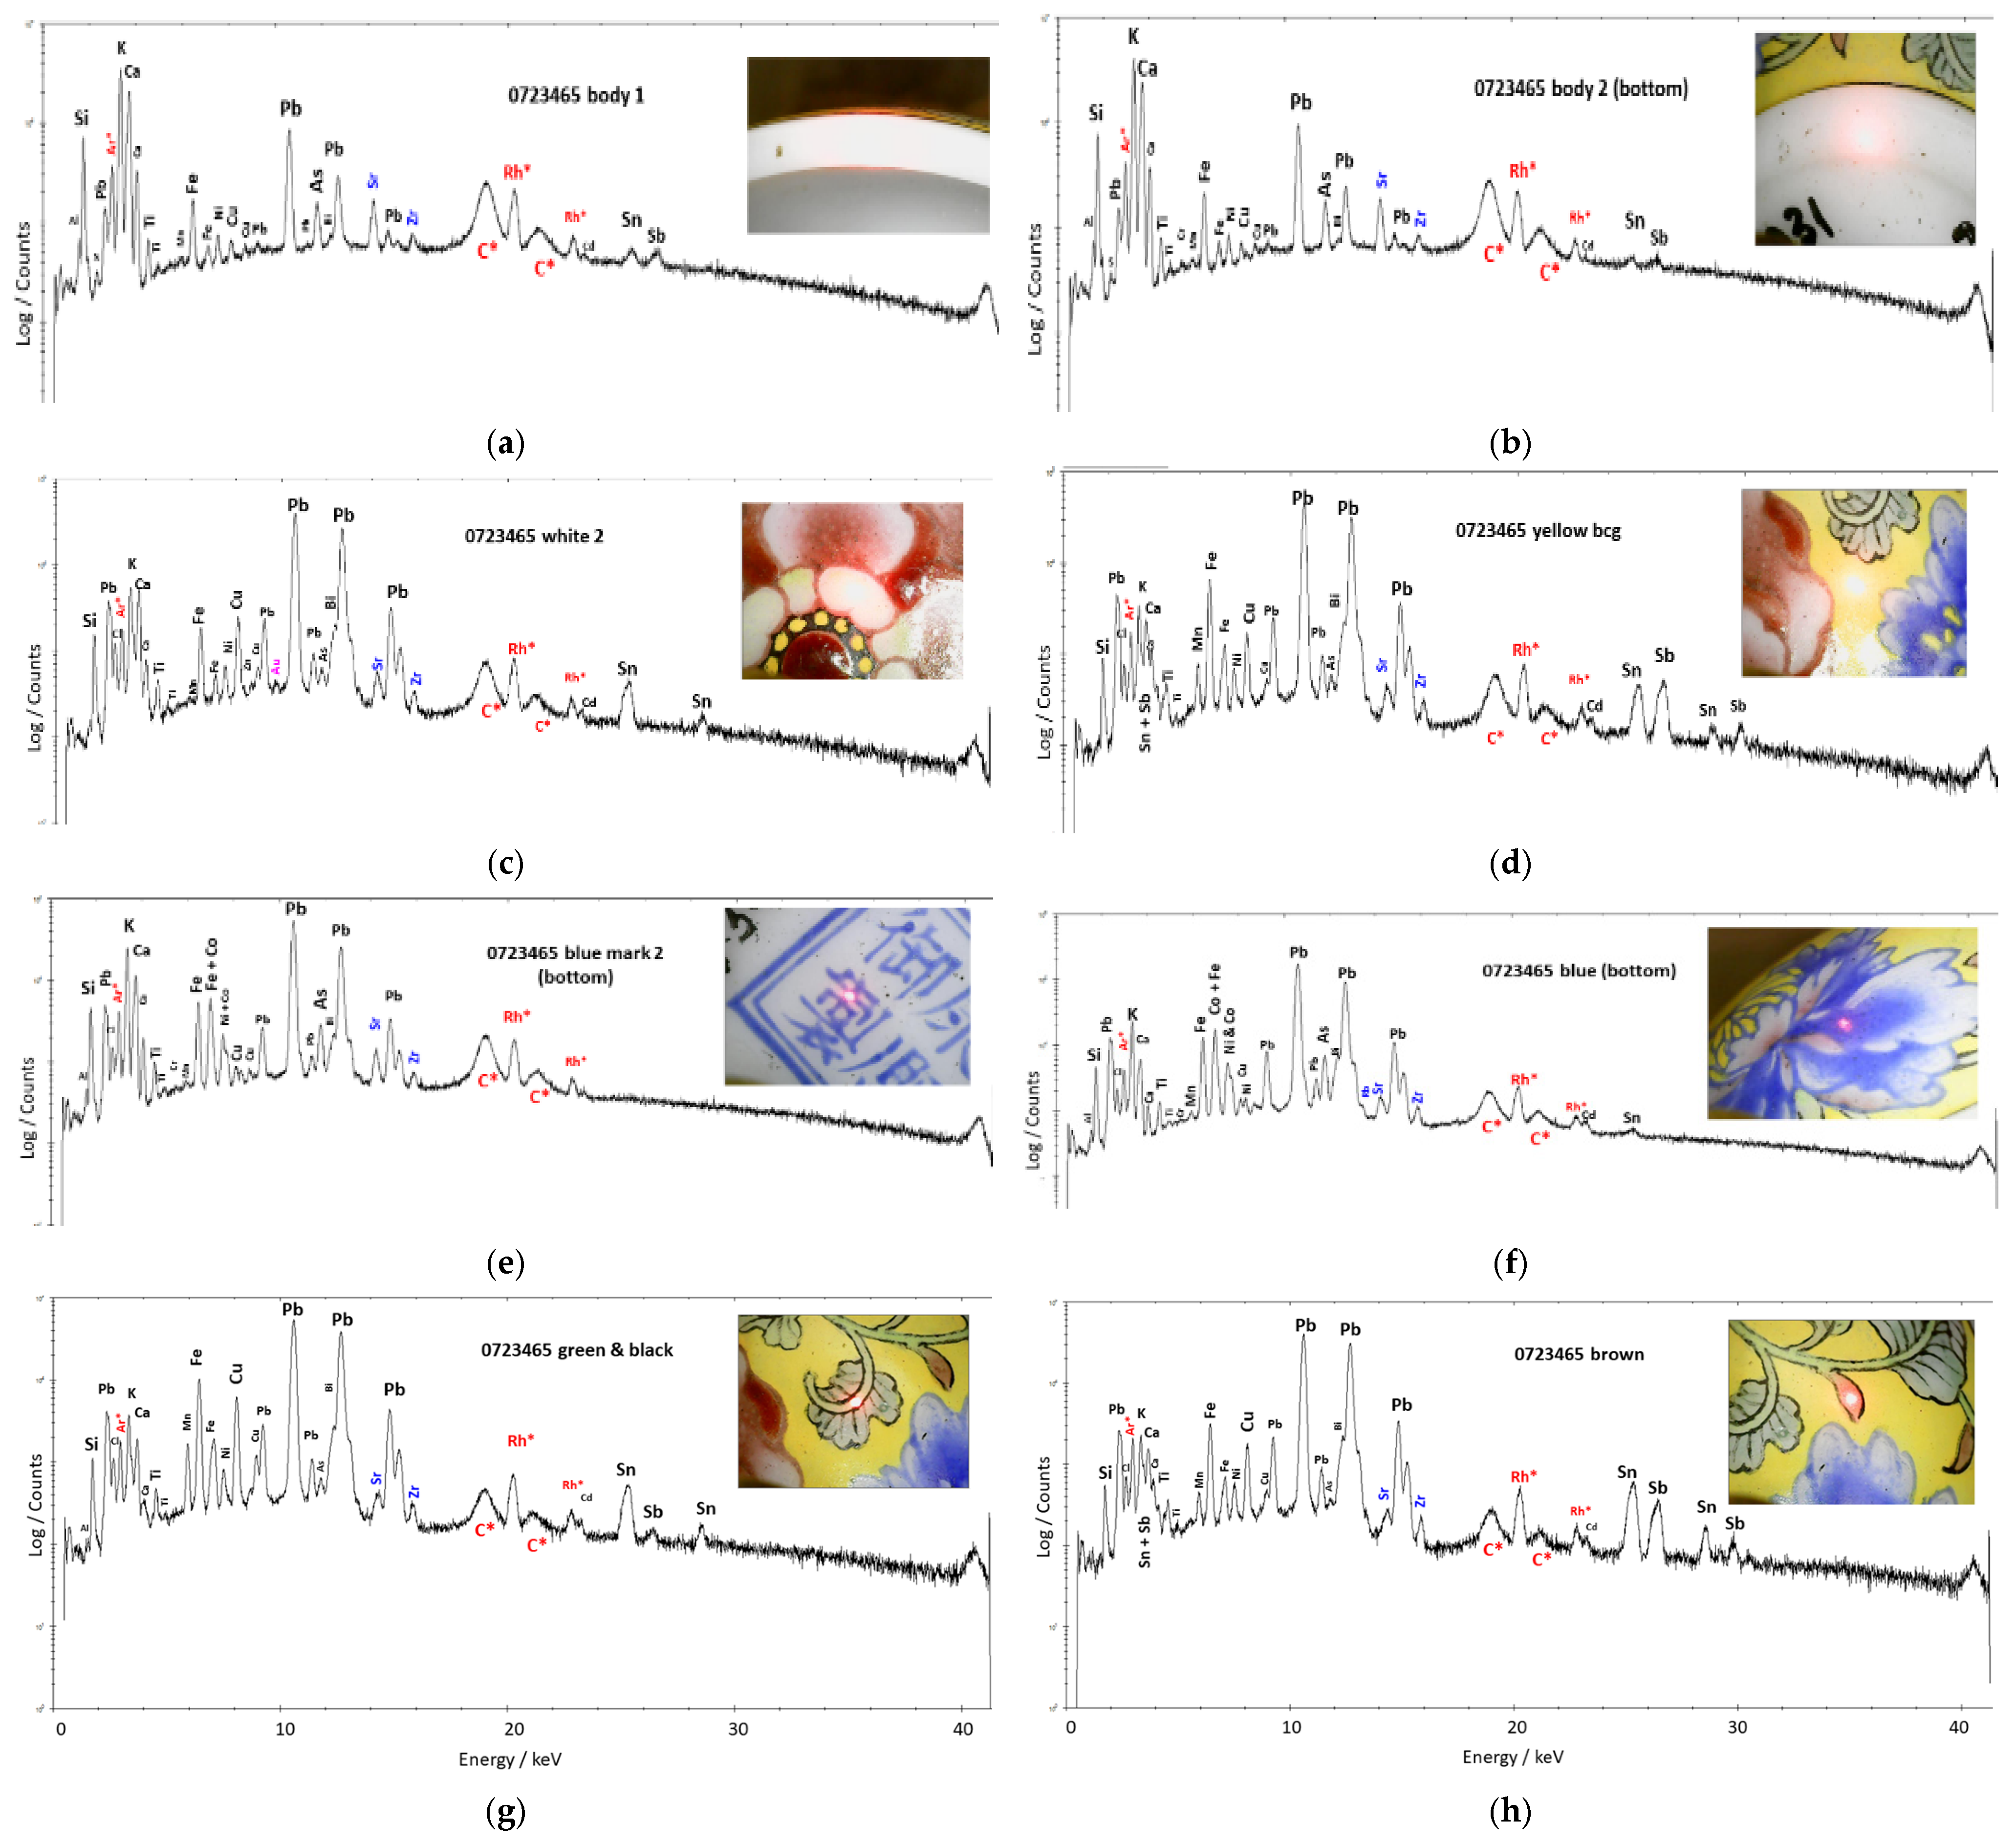
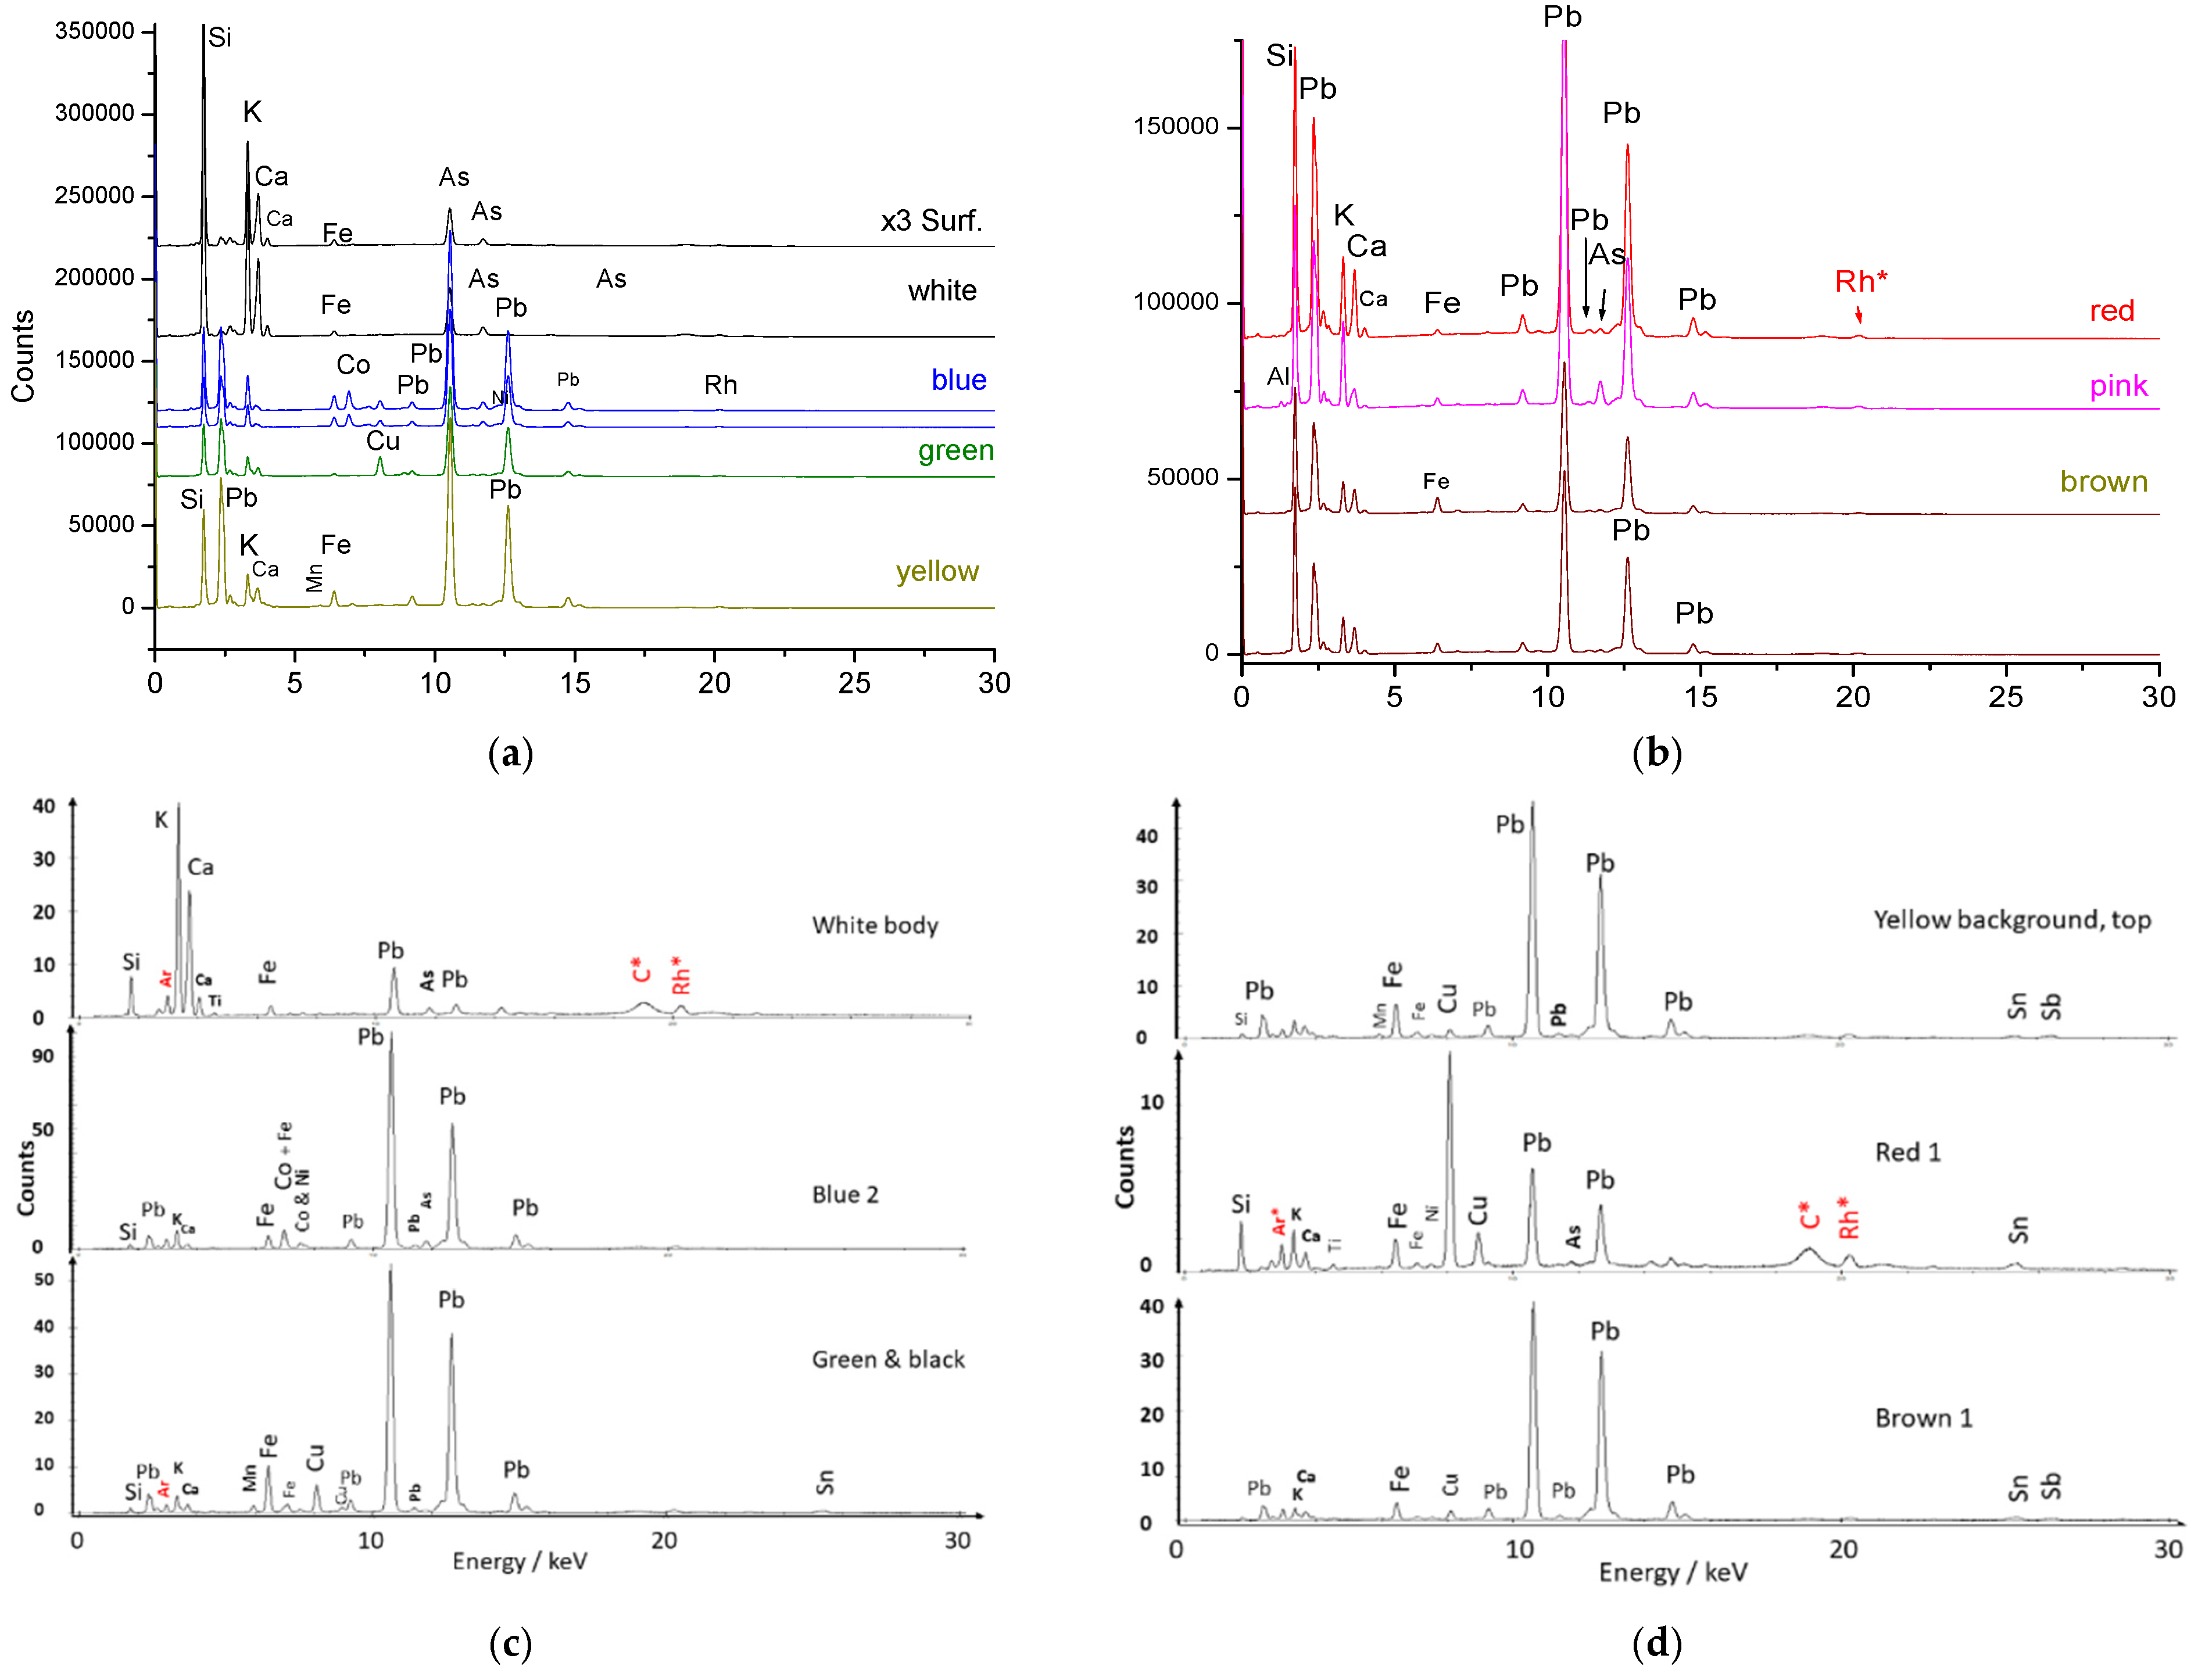
Comparison of the spectra from laboratory XRF measurements with those obtained using a portable instrument, as presented in Figure 4, clearly highlights the decrease in the intensity of fluorescence peaks below 3 keV, which strongly affects the silicon peak when measurements are made in air with a mobile instrument (Figure 4c,d). Nevertheless, the qualitative comparison of the spectra (visual examination) reveals several noteworthy features. The complete set of spectra obtained for the box is provided in the Supplementary Materials (Figure S1); see reference [1] for the detailed study of the vase.
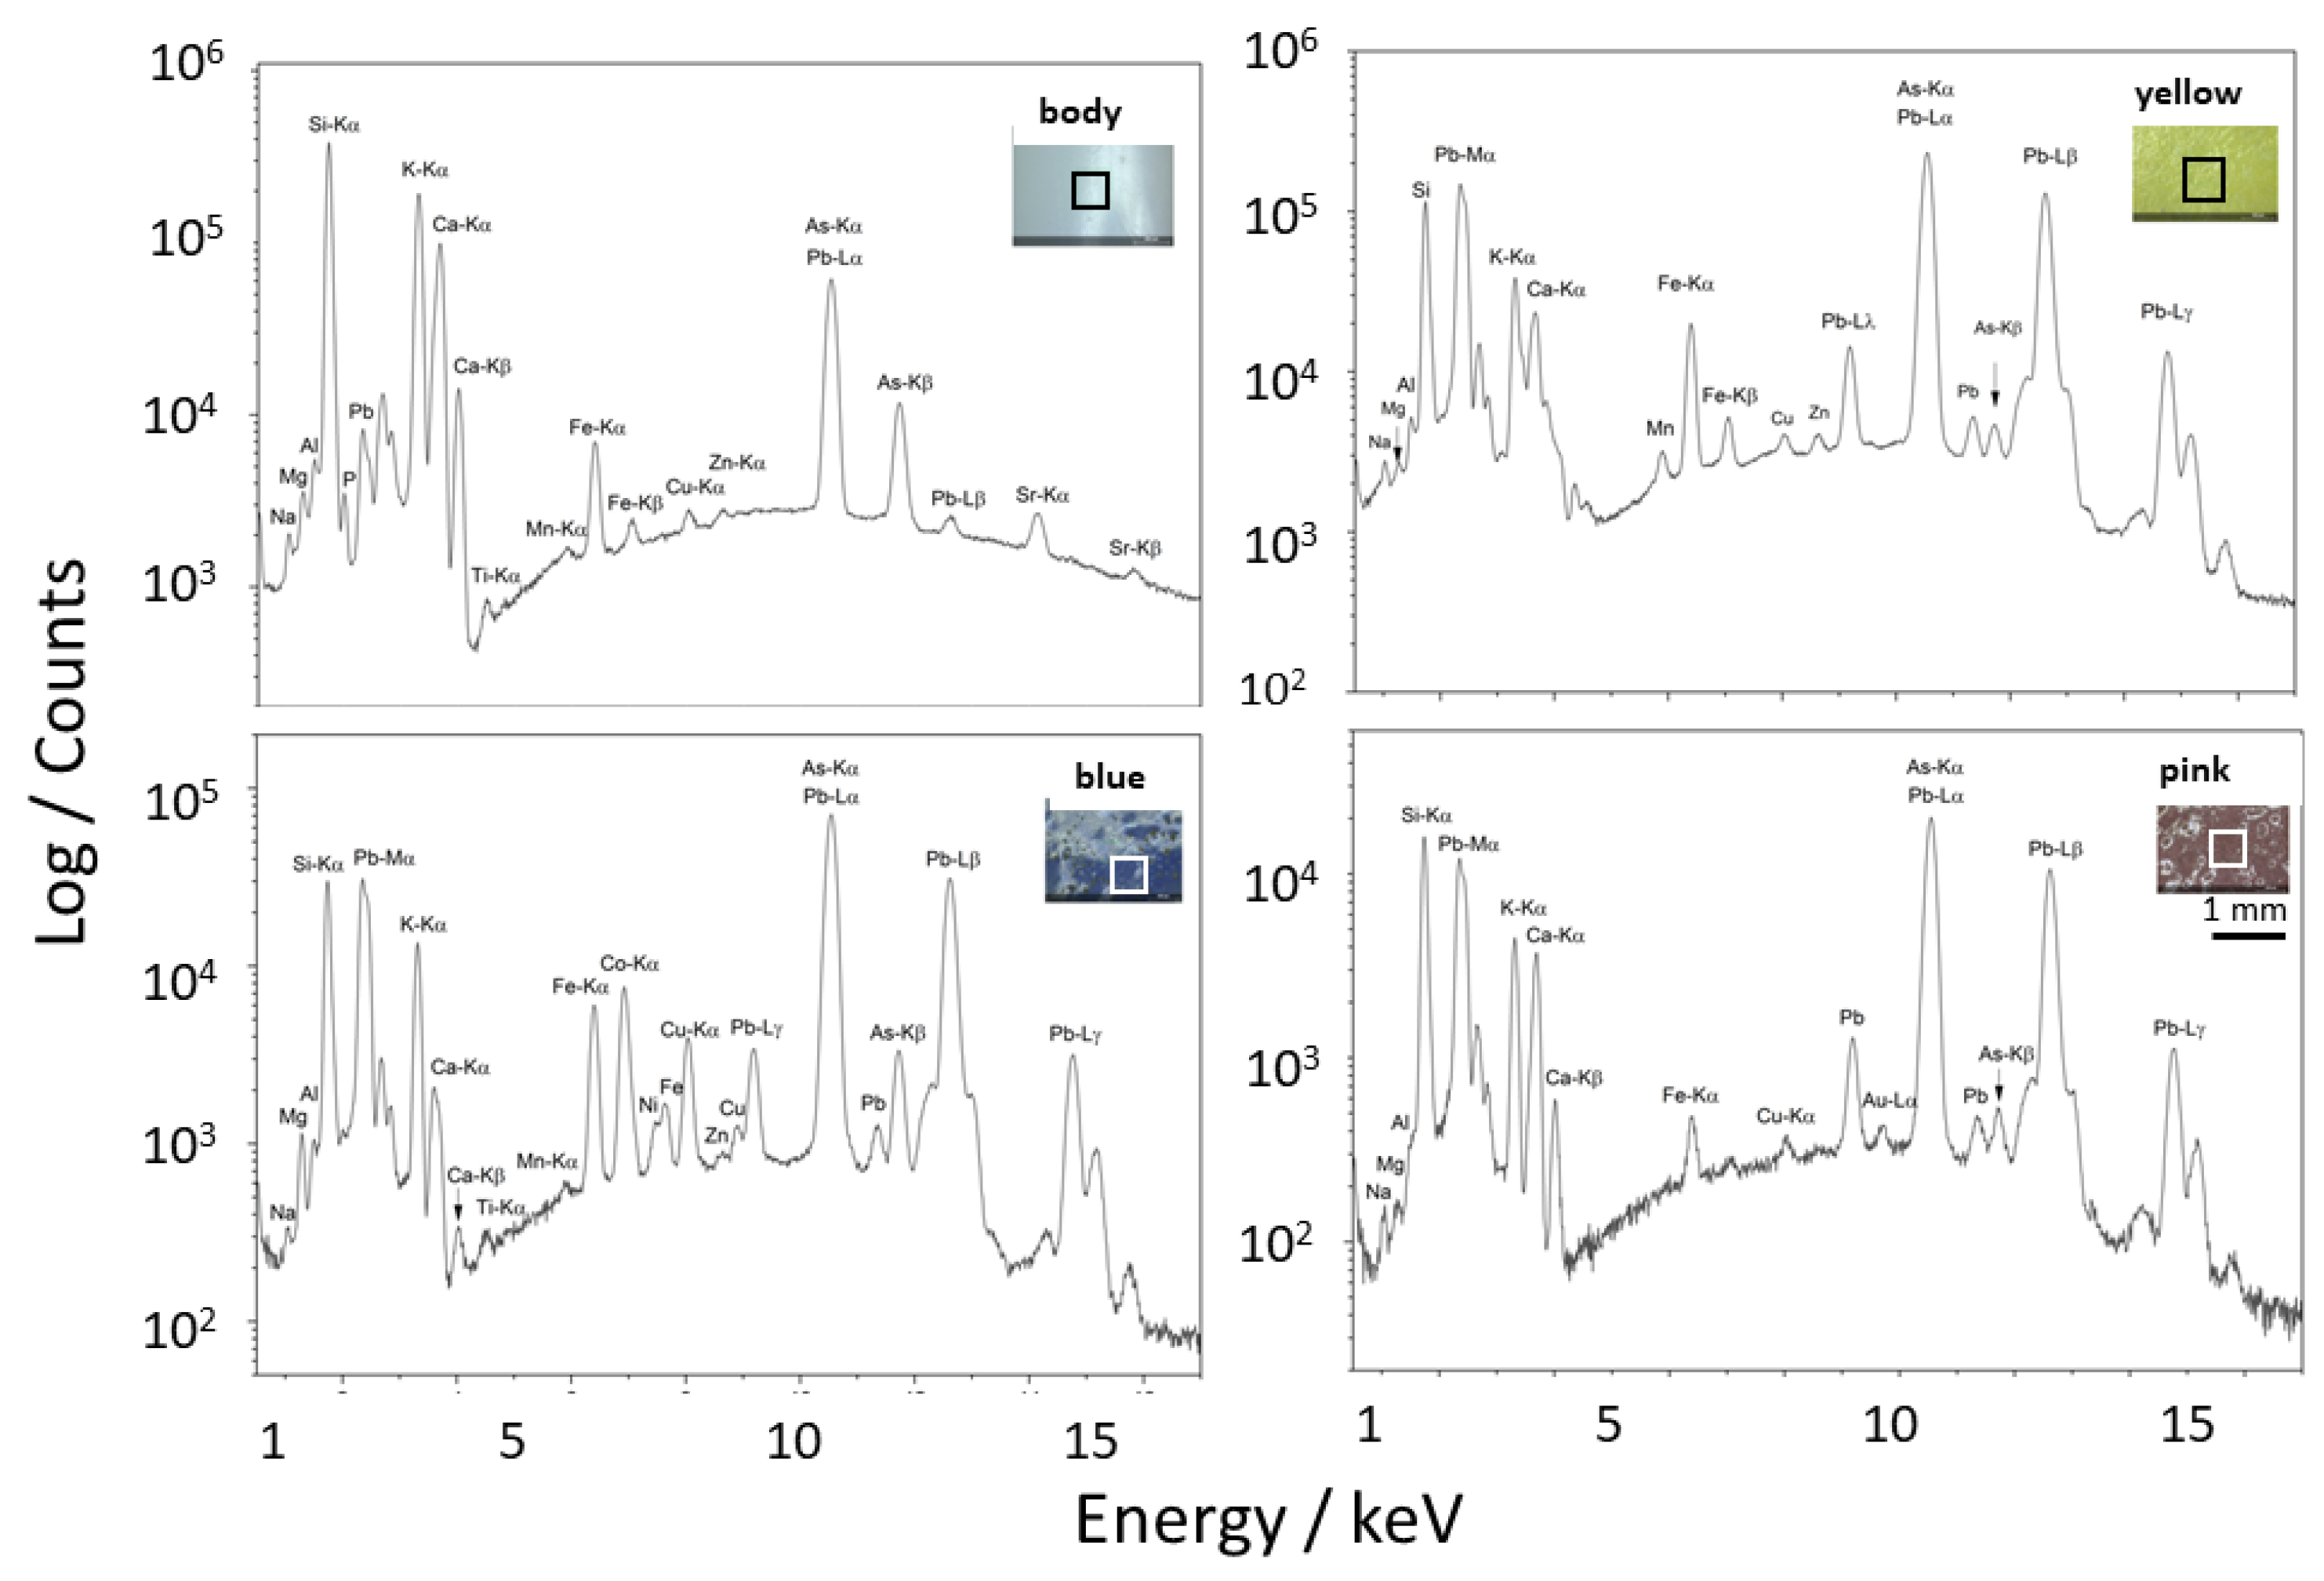
For both objects, the white opacified glassy body is almost free of lead (Figure 5 and Figure 6). The very weak lead peaks observed for the box and the vase result from surface contamination during glaze firing (contamination is virtually non-existent when the measurement is taken on the edge of the foot, which has been machined to obtain a suitable geometry and remove the contaminated surface), since lead oxide becomes highly volatile above approximately 750–800 °C, whereas no lead peak was visible in the vase spectrum using linear intensity scaling. The observation of a higher amount of lead traces on the surface of the box could indicate that the enamels were fired at a higher temperature, which increased the volatilization of PbO and resulted in greater surface contamination. The logarithmic-scale spectrum of the box (Figure 5) reveals traces of tin and antimony, which are not observed in the vase (Figure 6). The only plausible explanation for the white opacification is the presence of calcium arsenate phase(s). This differs from the standard solutions (cassiterite, lead calcium/potassium/sodium arsenate, calcium antimonate, calcium phosphate) used in glass production in Europa [12,19,37,40,41].
Further conclusions can also be drawn from the observation of the spectra. As for the vase [1], visual examination of the relative intensities of the lead and silicon peaks shows two types of lead-based glazes: a lead-poor red glaze and other lead-rich glazes. The red glaze of the box is obtained using copper [33,34,35] (Figure 4d), whereas the purple-red and pink-red glazes of the vase exhibit traces of both copper and gold. Indeed, coloration produced by gold nanoparticles is an alternative solution for producing these shades [1]. Figure 7 compares a zoom of the ca. 7.5 to 16 keV spectral range where Au XRF L peaks are expected [42]. The two strongest Lα and Lβ peaks of gold are expected at 9.71 and 11.44 keV (arrows in Figure 7), i.e., just before and after the first strong Pb Lα peak at 10.55 keV. A small Lα peak is clearly observed; the Lβ peak is always smaller than the Lα one and its position falls at the same position as a secondary peak of lead. Due to the high coloration efficiency of Au NPs, less than 0.1 wt% of gold is sufficient to produce the color [35], and alternative techniques, such as the detection of plasmon luminescence, are much more efficient for detecting coloration using metal nanoparticles, as observed for the vase [1] and Famille rose ruby-back porcelain plates from the Yongzheng reign [39].
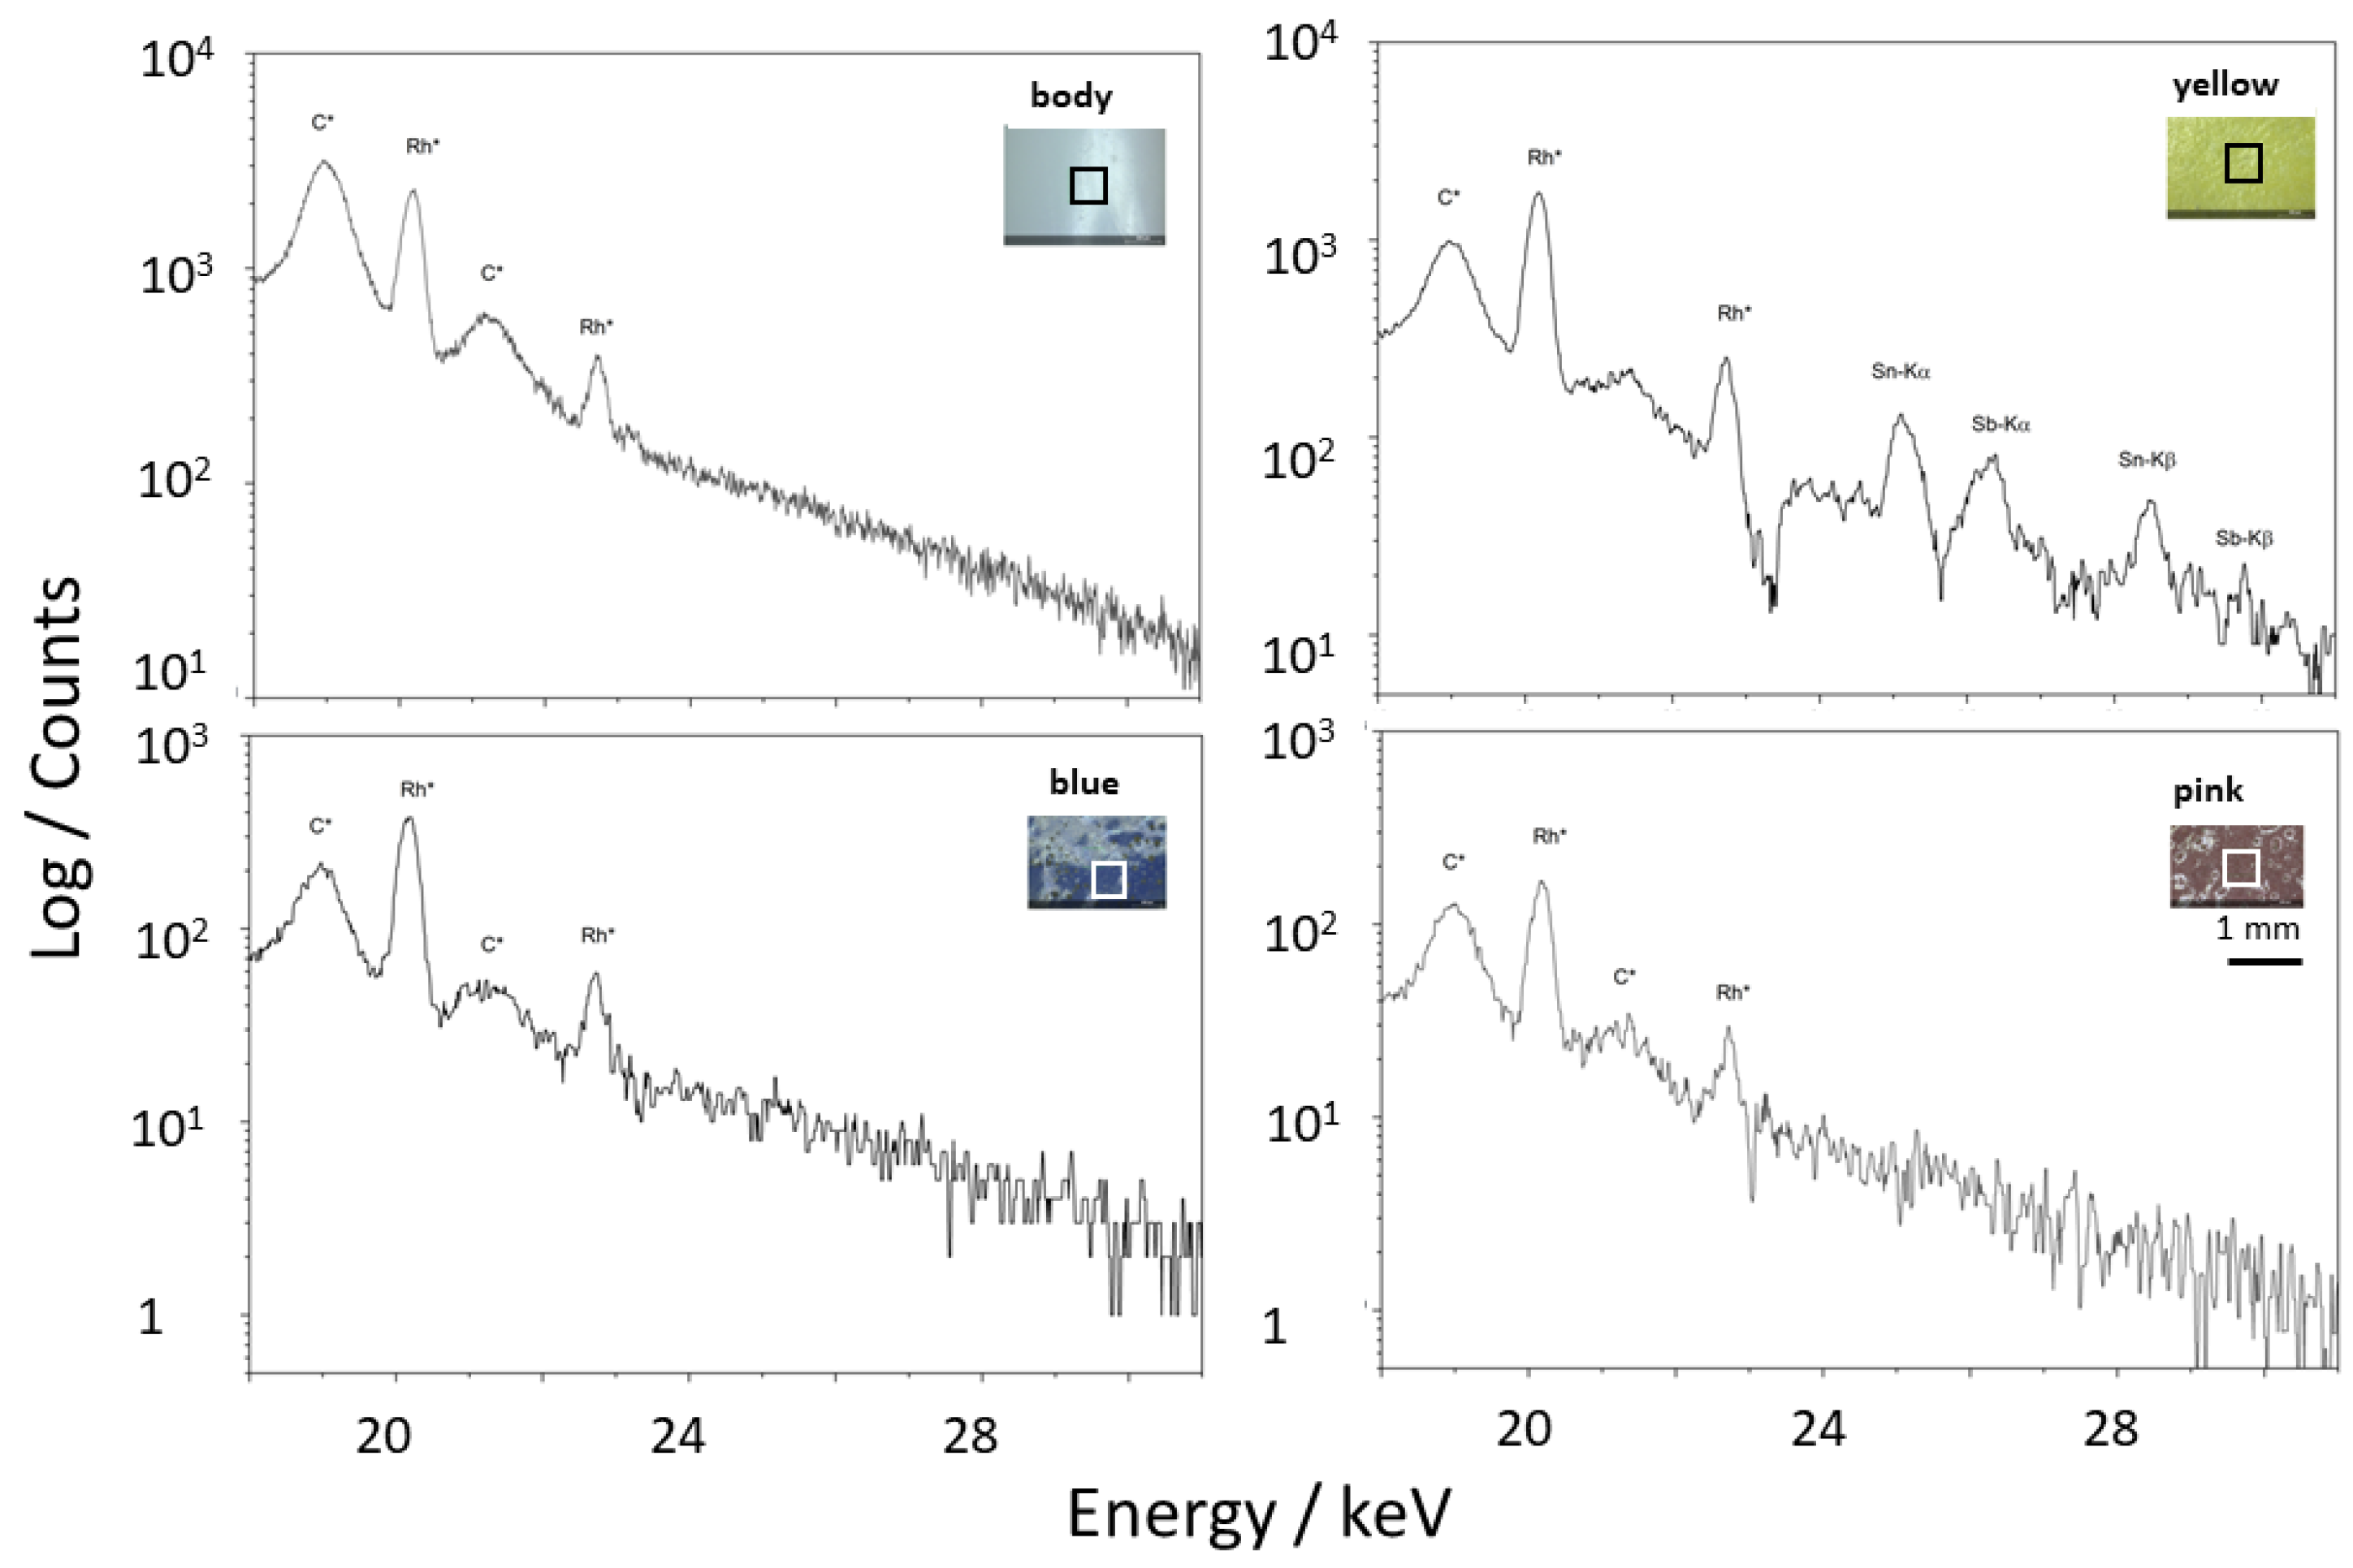
However, chemical elements associated with gold, characteristics of the preparation route, are detected, including arsenic (Kβ at 11.73 keV; the Kα peak at 10.54 keV being indistinguishable from the Pb Lα peak at 10.55 keV) and tin (Kα and Kβ at 25.27 and 28.49 keV). Comparison with the XRF signature of the body is required because, in this energy range, the depth of analysis is greater than the enamel layer thickness. Traces of tin and antimony are present in the box body (Figure 5a,b). Higher levels of tin are measured for the white enamel of the box (Figure 5c).
Green color is classically produced by Cu2+ ions in a lead-based glass (Figure 5g). The black lines contain manganese and iron. For both objects, the cobalt blue contains arsenic.
The white enamel of the box flowers contains a high level of tin (Figure 5c and very little arsenic, less than in the blue areas, consistent with opacification by cassiterite, an opacifier very rarely observed for Qing Dynasty enameled wares: The use of cassiterite is observed only in very rare objects—such as the earliest falangcai imperial porcelains bearing the Kangxi mark [13,14], or gold objects decorated with cloisonné and painted enamels bearing the Qianlong mark [12,13,23]—and is explained by the decisive influence of the Jesuits on their production. Thus, the two objects share common compositional features in the body and in the blue, yellow, green, and black glazes, as well as differences in the red and white glazes and regarding some traces. A quantitative comparison is required to refine these preliminary observations.

3.3. Quantitative Statements Regarding the Glassy Matrix

We first focus on the elements forming the glass network, namely silicon (Si), the main network former of the polymeric structure and the fluxes detected by pXRF, namely potassium (K) and calcium (Ca) (sodium is only measured for the vase (Table 1), boron and lithium are not measured in both cases); as well as two elements that may either be dissolved in the network or precipitate to form pigments or opacifiers, namely tin (Sn) and antimony (Sb). The comparison of relative fluorescence peak areas after normalization by the rhodium source signal is presented in Figure 8, Figure 9 and Figure 10 and the ratio of peak areas measured for the box and the vase is presented in Table 1. Comparing the Si K-alpha peak areas measured for the vessel under primary vacuum versus in air shows, as expected, the strong absorption of low-energy photons, as already evidenced in Figure 4 (the measured Si area ratio is nearly 16). The same applies to the aluminum signal. For the potassium and calcium signals, the values become closer between the two measurement conditions (ratios close to 1.5 and 1.3—values also observed for most other elements, with the exception of titanium, arsenic, tin, antimony, and lead, for which the ratios differ significantly from 1). These differences regarding minor elements are attributable to the use of raw materials from different sources, rather than to the measurement conditions. This will be addressed later.
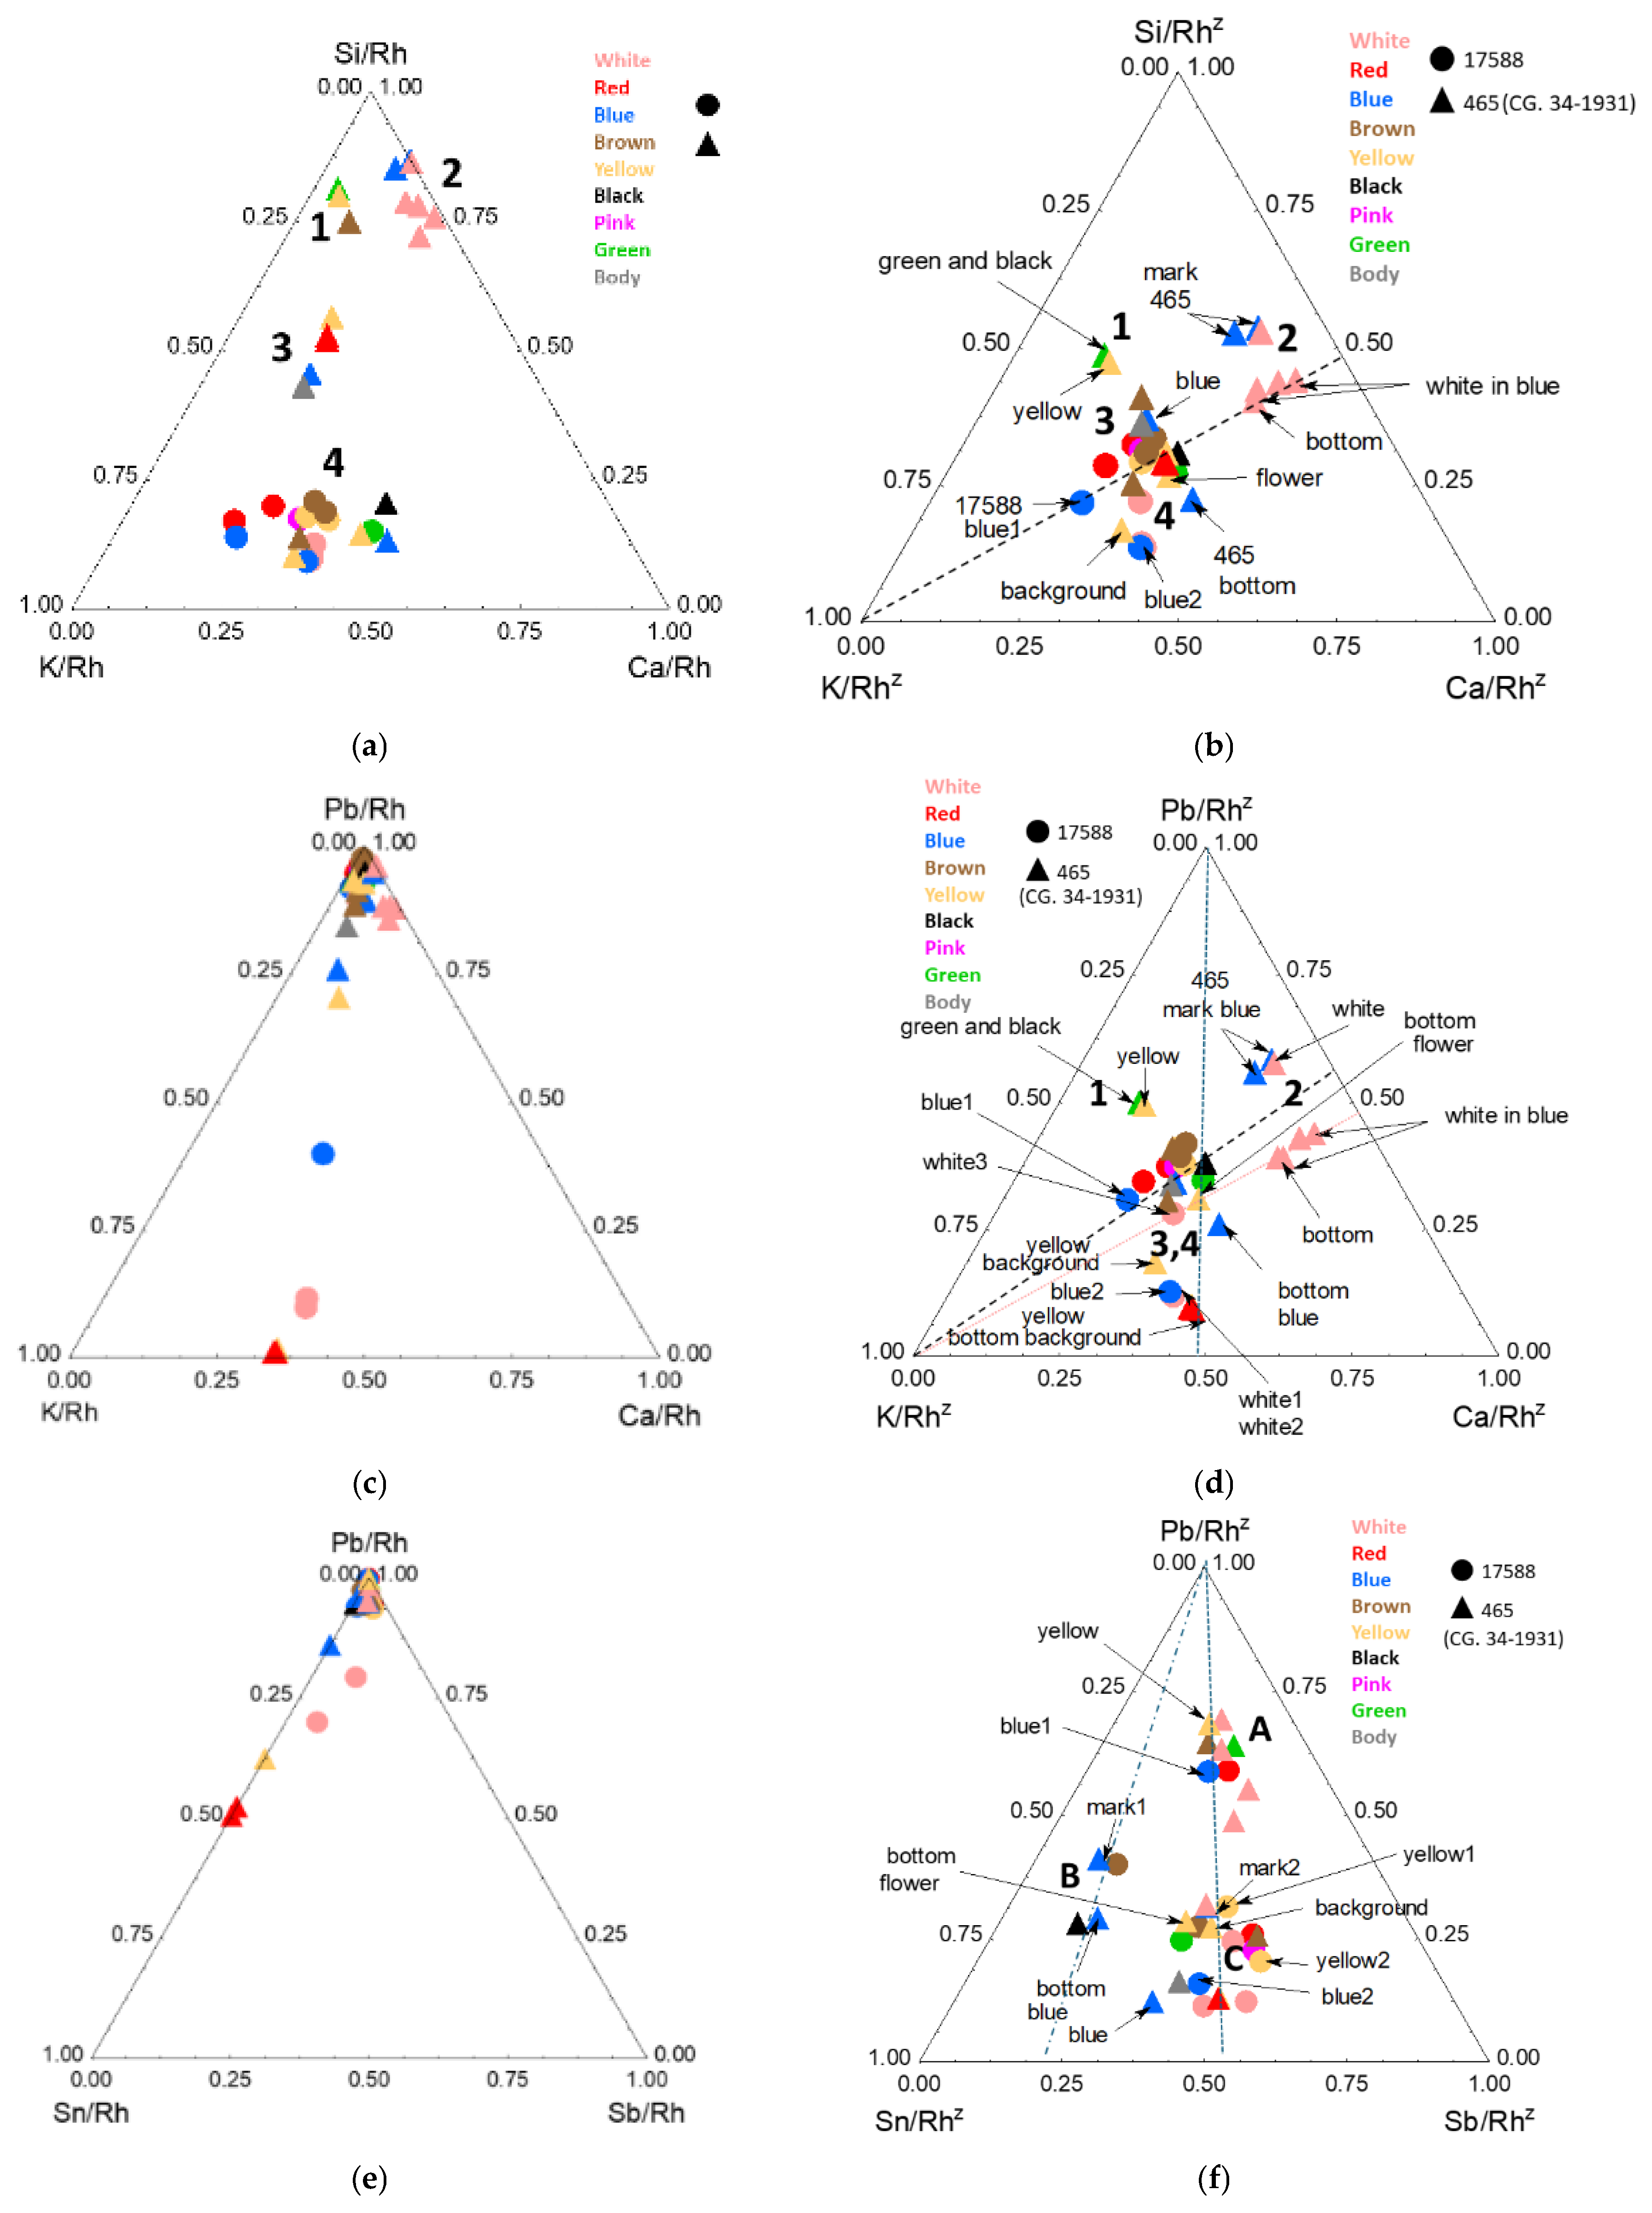
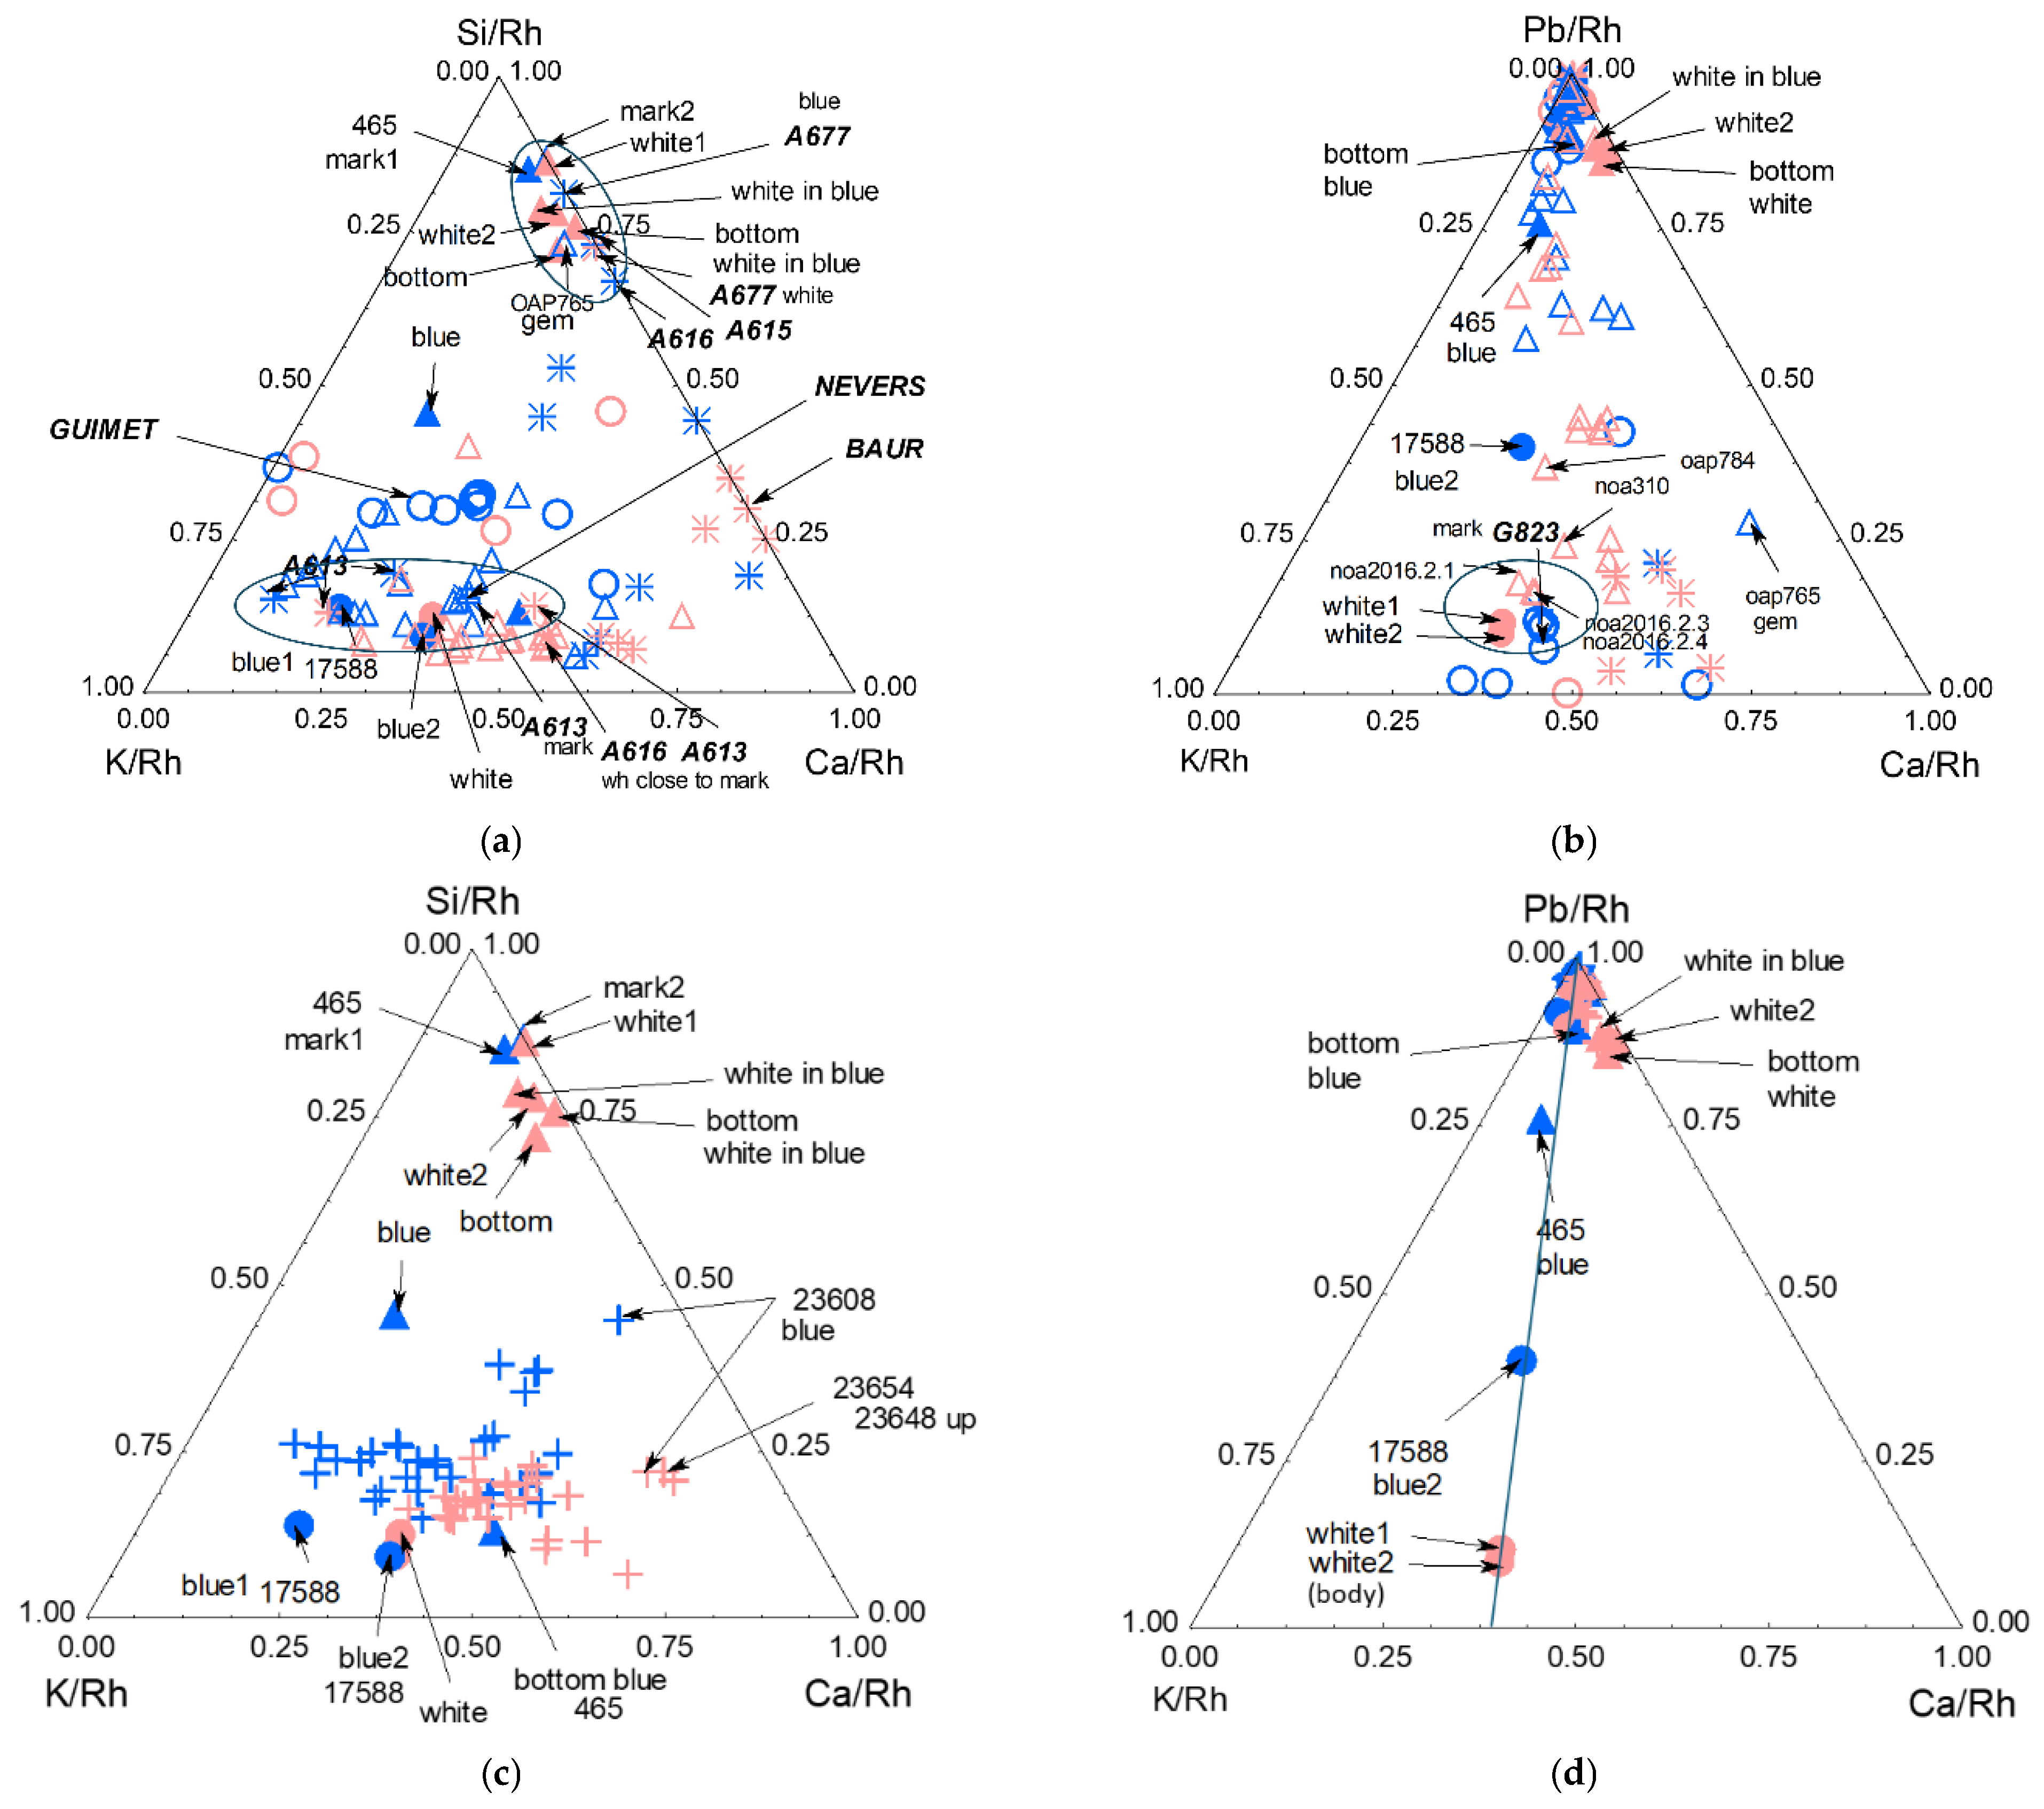
The distribution of data after normalization by the source signal shows several distinct compositional clusters on ternary diagrams of glass matrix informative components. Considering the Si–K–Ca ternary diagram (Figure 8a), several groups can be observed as a function of Si content (Figure 8c), with most of the box-related data clustering in a silica-richer domain. After z-score standardization of the same elements (Figure 8b)—a data processing procedure designed to partially mitigate the effects of highly variable intensities—three groups remain when compared with the groups defined in Figure 8a: groups 1, 3–4 (which merge), and 2, with group 1 being close to group 3. However, from the comparison of the data in Figure 4 and Table 1, it is obvious that the location of the vase data closer to the Si vertex arises from the different procedures used: measurements in air drastically decrease the Si peak intensity due to absorption. The diagrams in Figure 8a,b are therefore useless, regardless of the sophistication of the data treatment. Differences related to Si and Al contents are thus not significant.
Considering the flux elements measurable by both instruments, namely Pb, K, and Ca, a ternary diagram of rhodium-normalized signals (Figure 8c) shows that most of the glass matrices of the various colors fall into three groups. For the same diagram after z-score standardization (Figure 8d), the same clusters are defined and are very similar to those shown in Figure 8b with Si and standardized data.
Considering the tin, antimony, and lead signals (Figure 8e), in some compositions the tin signal is absent, while others contain significant levels of tin, particularly the red glazes of the box.
After z-score standardization (Figure 8f), three groups (A, B and C) can be distinguished, differing mainly in the relative peak areas of Sn and Sb for groups B and C, and in terms of Pb content for group A. Overall, the box shows the enamels with the highest tin content. The large ratio differences measured for Ti, As, and Sb indicate the use of very different raw materials for the box and the vase.

3.4. Quantitative Statements Regarding Impurities and Raw Materials

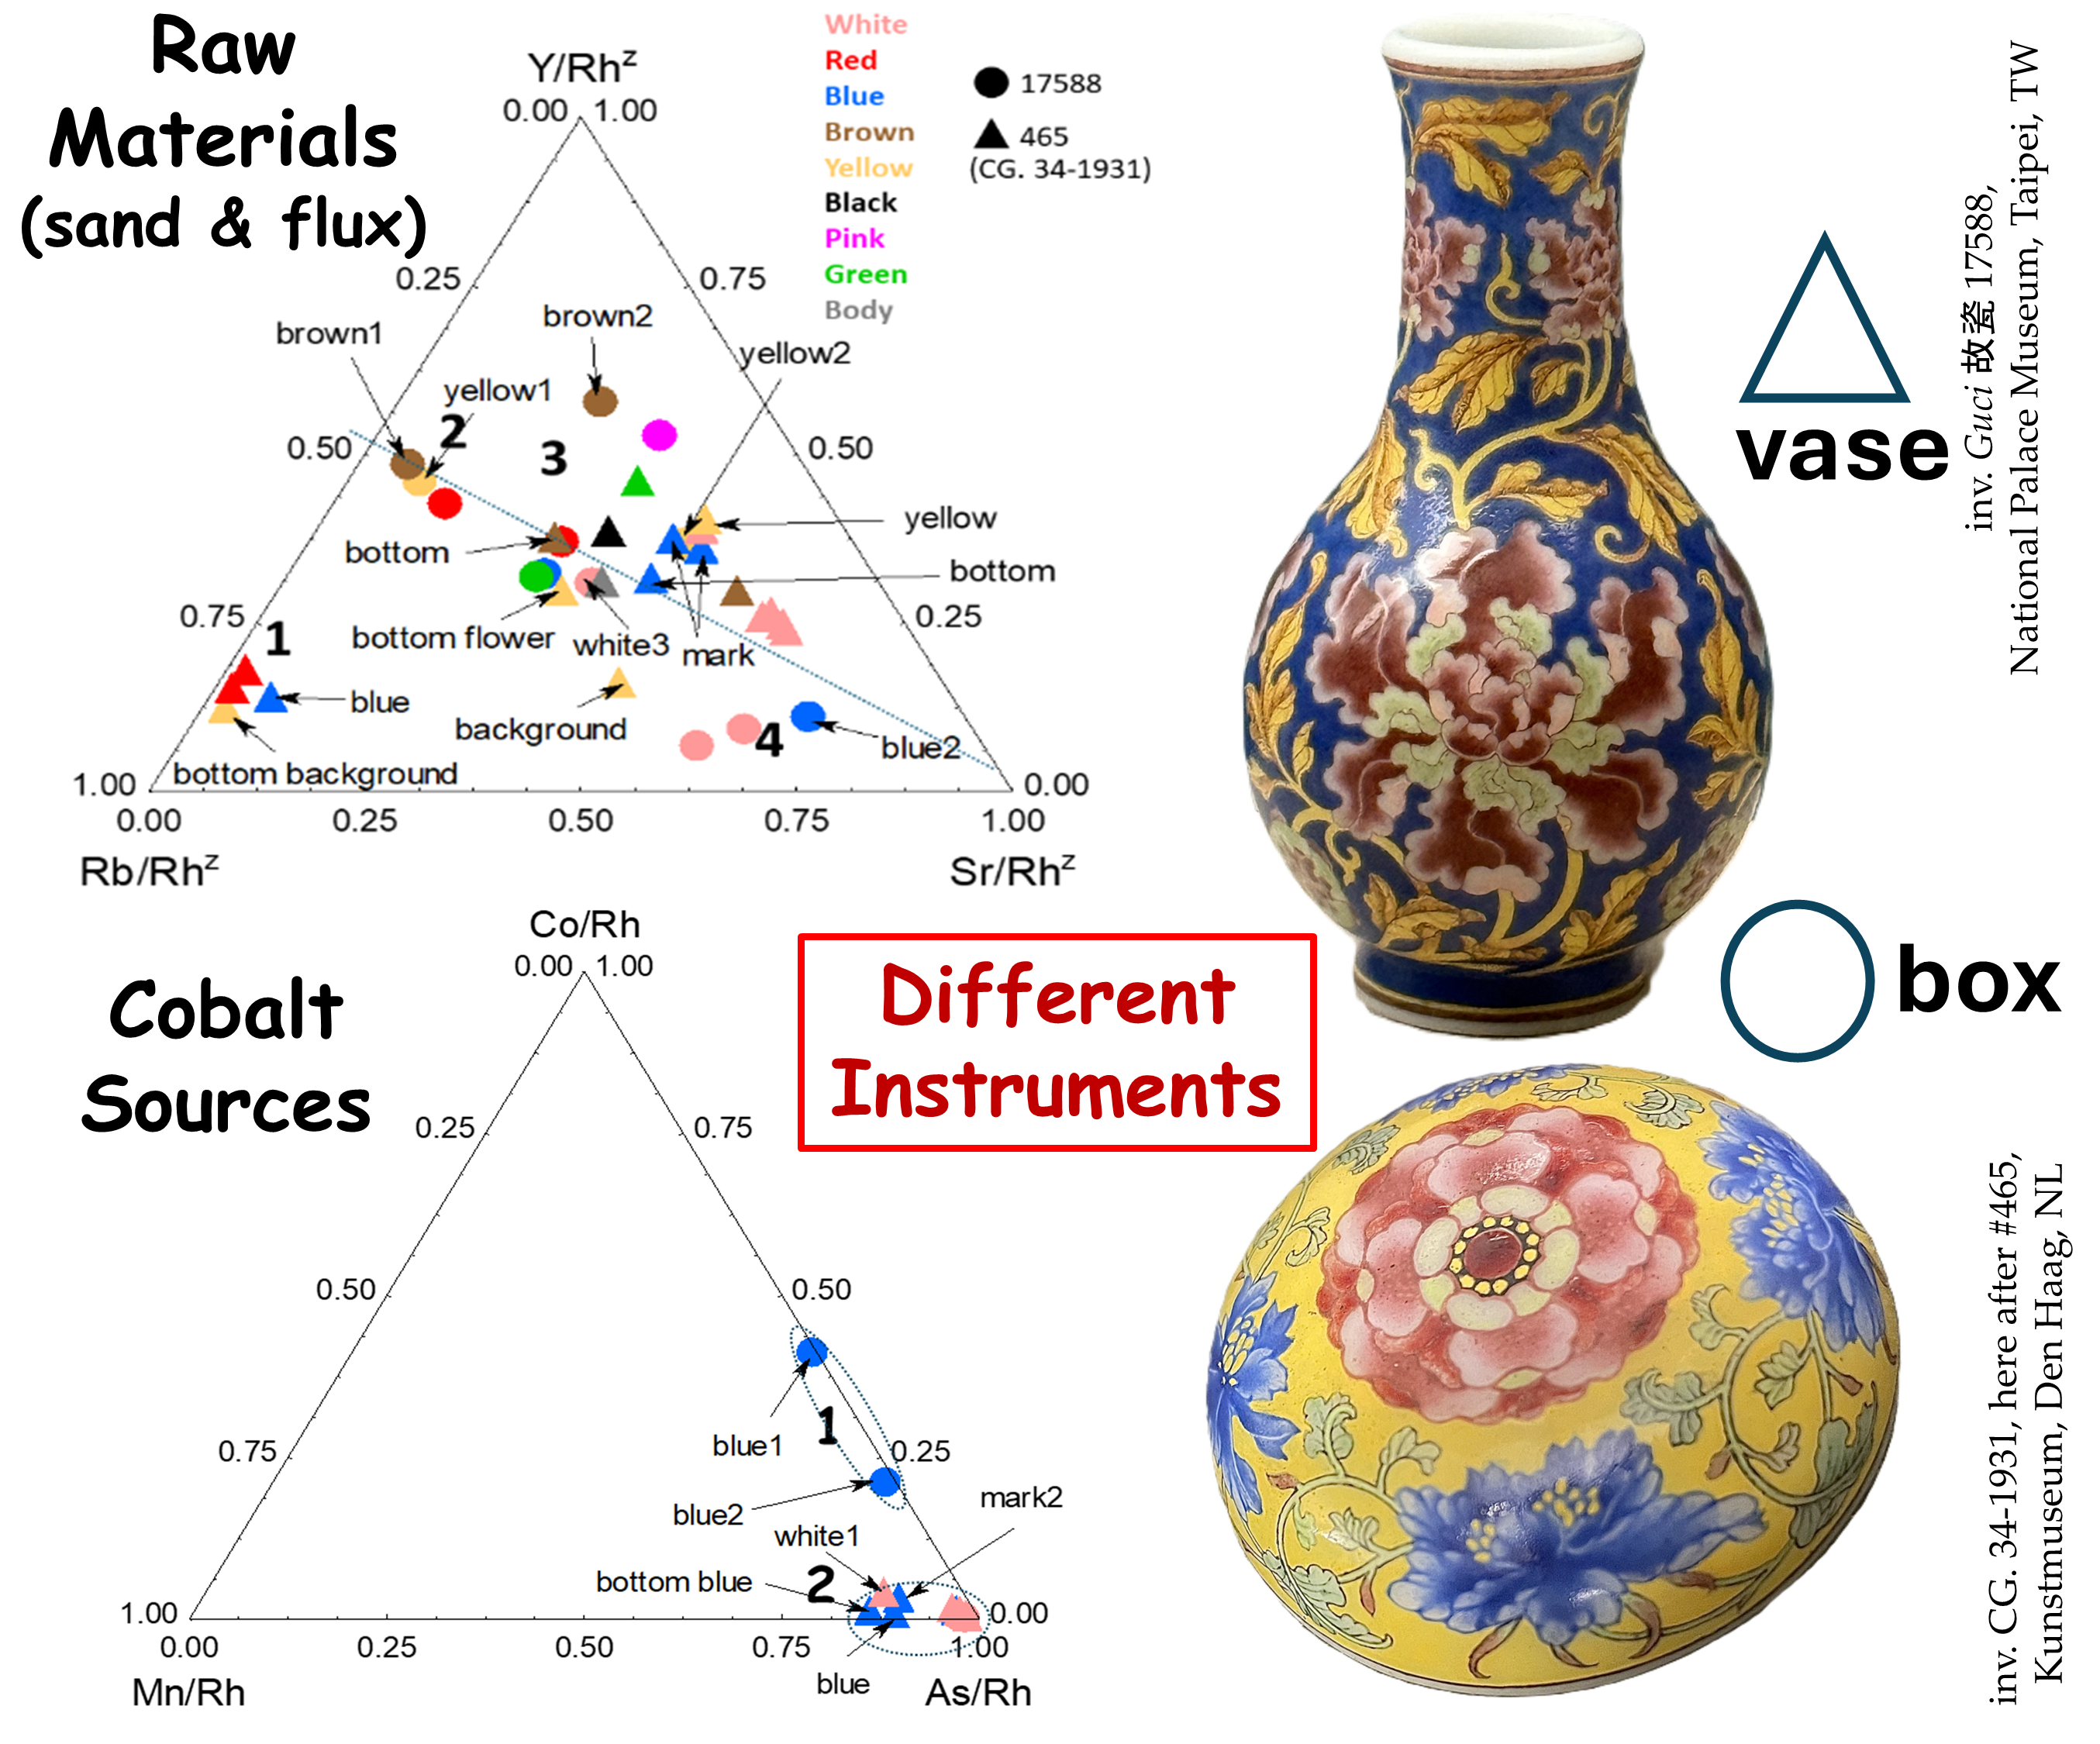
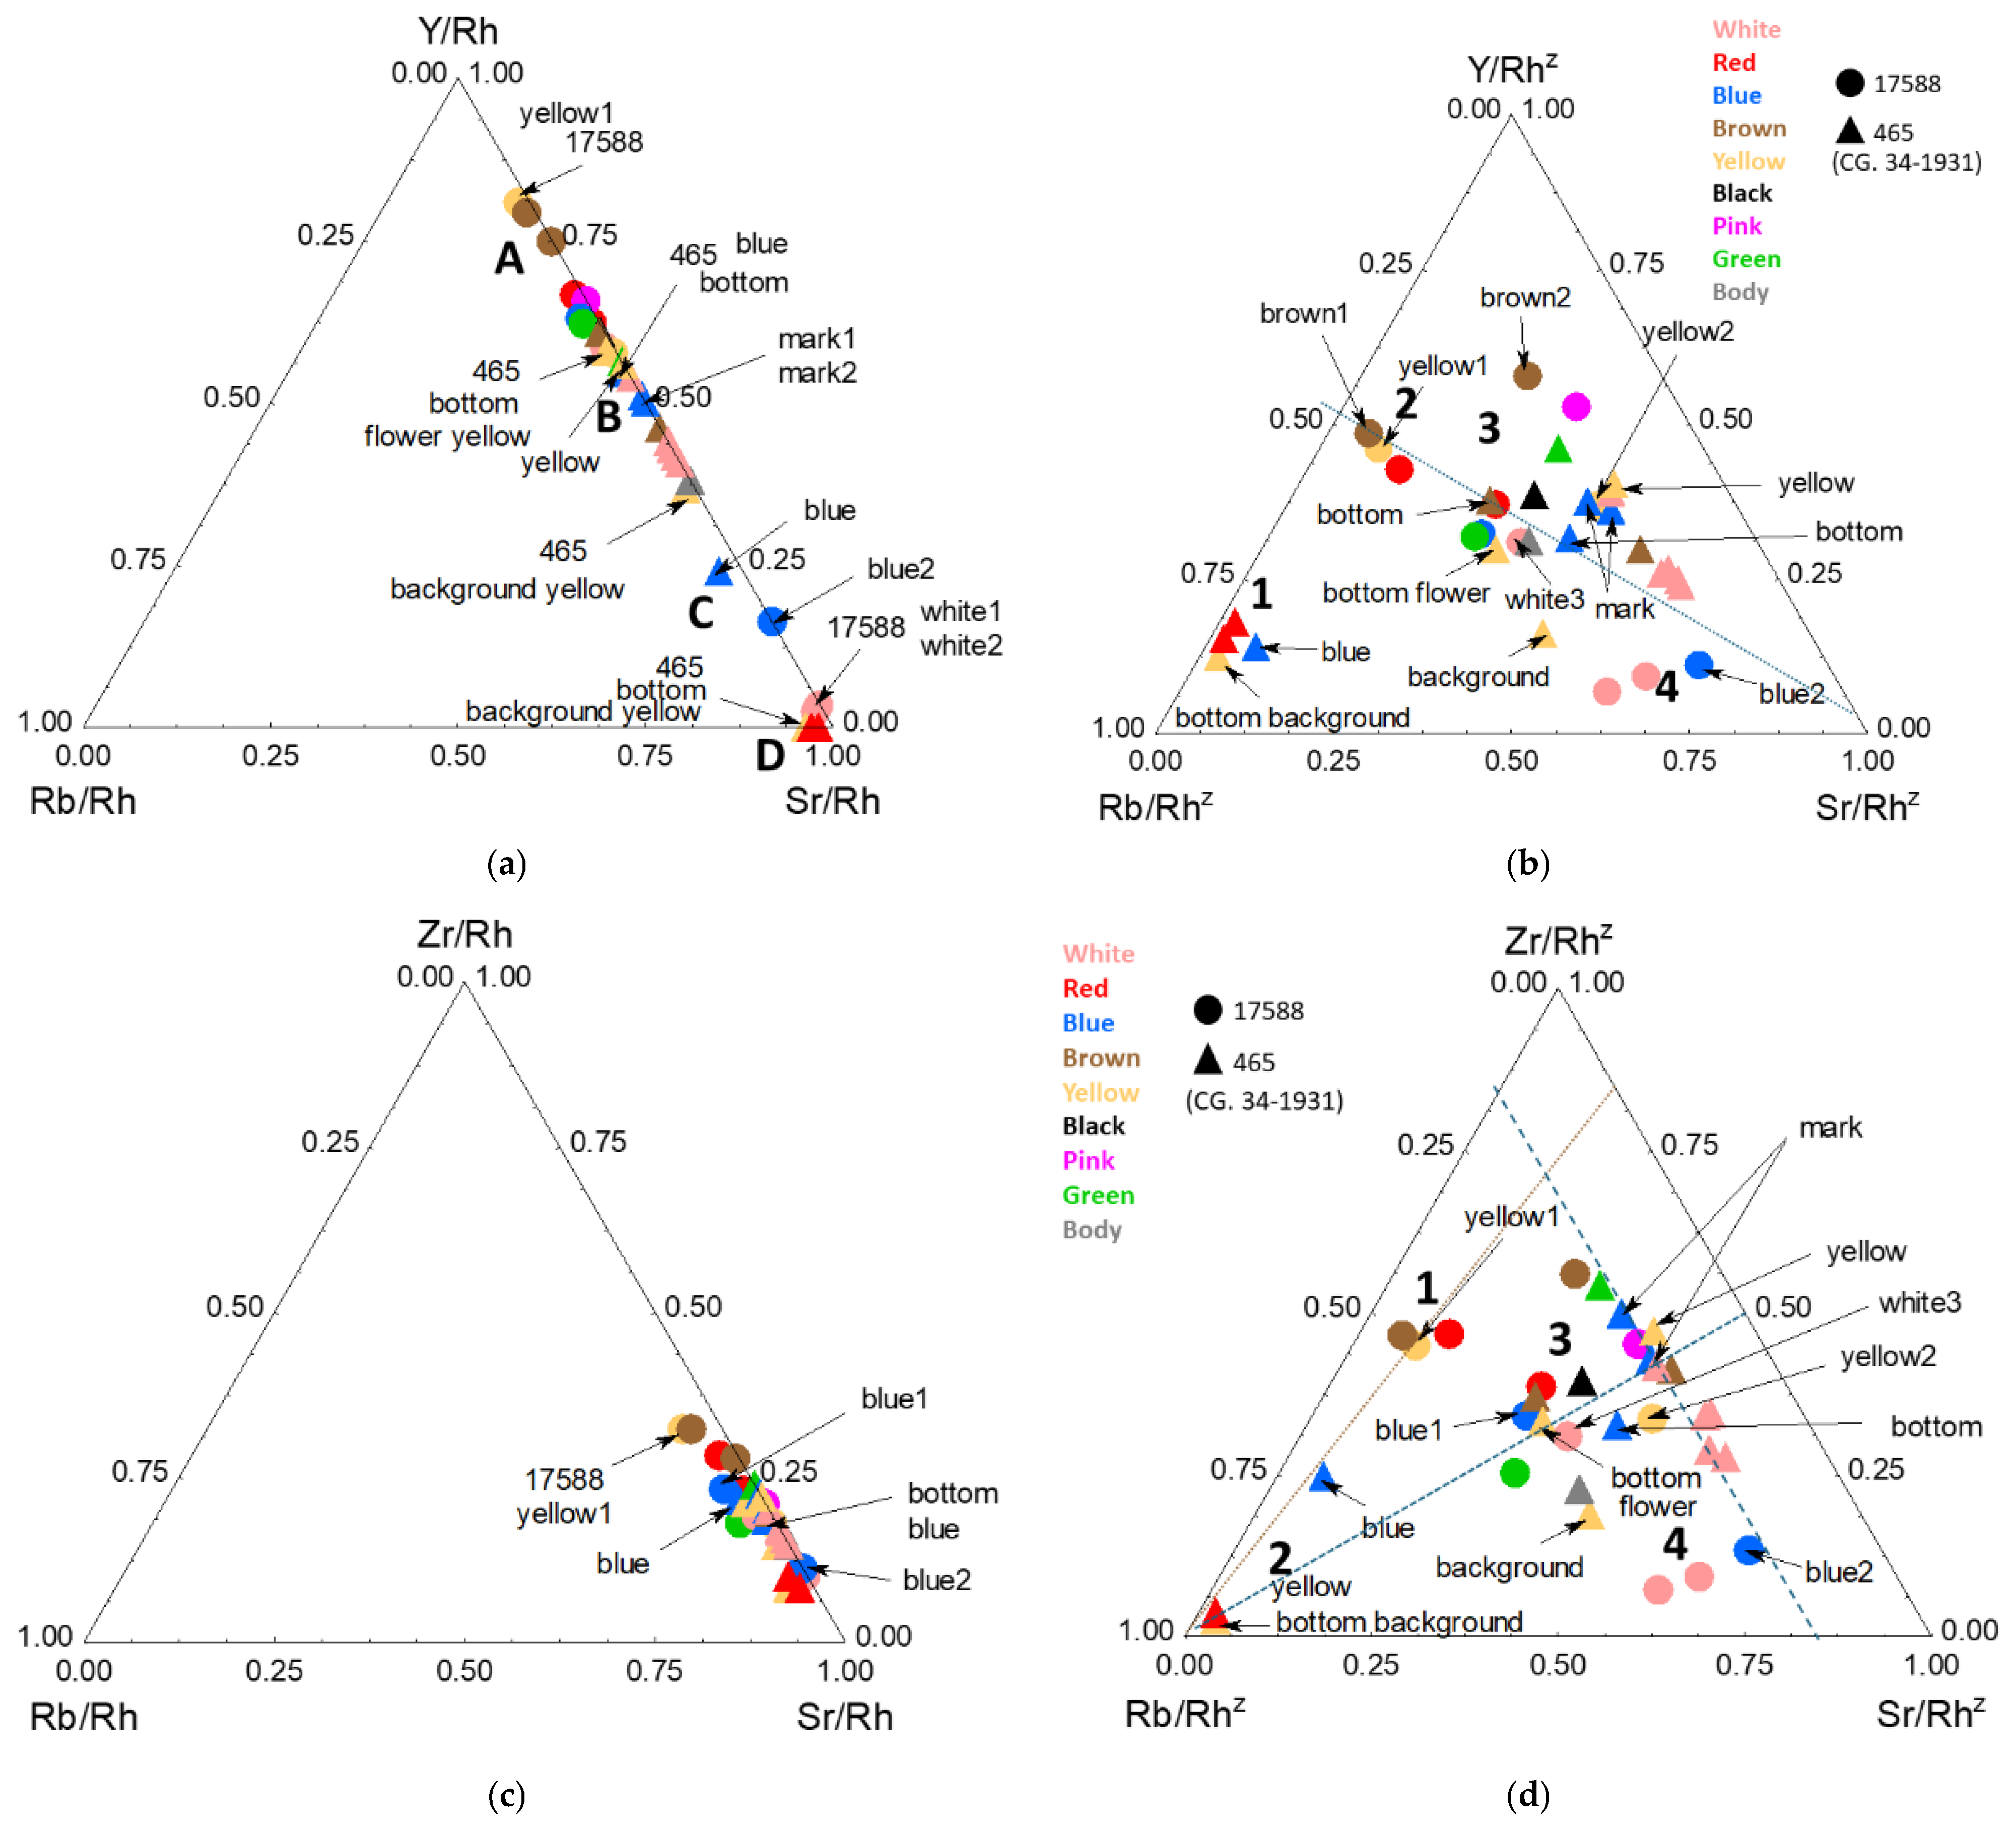
Certain elements, even at trace levels, produce a significant XRF signal, allowing comparison of their relative concentrations. This is the case for zirconium, yttrium (an impurity of quartz in the form of zircon [43]), strontium (an impurity associated with calcium), and rubidium (an impurity associated with alkalis [18,44,45,46,47]). These trace elements are therefore widely used to assess whether glasses or ceramics were produced using the same raw materials [18,45,46].
The comparison of Rh-normalized signals (Figure 9a,c) does not allow discrimination based on rubidium, as its signal is too weak and partially overlaps with that of lead. Using the zirconium versus strontium signals (Figure 9c), only a single compositional group can be distinguished, whereas the yttrium versus strontium plot reveals four distinct groups: A, B, C, D (Figure 9a). After z-standardization (Figure 9b,d), several clusters emerge; however, they do not exactly correspond to the groups obtained using “solely” Rh normalization, although yttrium remains a discriminating element. Nevertheless, the groupings identified by the two approaches are broadly consistent: groups A–D approximately correspond to groups 1, 3, 4, and 2, respectively. Group 2 includes the red, blue, and yellow glazes from the box decoration. Furthermore, the blue decorations of the two artifacts belong to different compositional groups, both of which are distinct from the blue mark of the box.

3.5. Comparison of Cobalt Sources

The rarity and geological specificity of cobalt-bearing ore deposits [48,49,50,51,52,53,54], which generally occur as by-products of silver, bismuth, or arsenic mining [48,49,50,51,52,53,54,55,56,57,58], together with the limited purification techniques available before the 19th century, imply that cobalt-based colorants were typically accompanied by significant amounts of some elements associated with cobalt ores, allowing them to be distinguished. These include mainly arsenic and transition metals (Mn, Fe, Ni, Cu, and Zn), as well as residues of the principal extracted metals, such as silver or bismuth, or particular elements such as uranium [49,50,51,52,53,54,55,56,57,58]. The relative abundances of these associated elements, evaluated using binary and ternary diagrams based on the X-ray fluorescence signals of these elements, may therefore provide valuable information for distinguishing different cobalt sources [55,59,60]. Briefly, Asian sources of cobalt are associated with manganese and iron, whereas European cobalt ores are associated with arsenic, as in Persian cobalt ores used during the Yuan Dynasty [49,55,57,59,60].
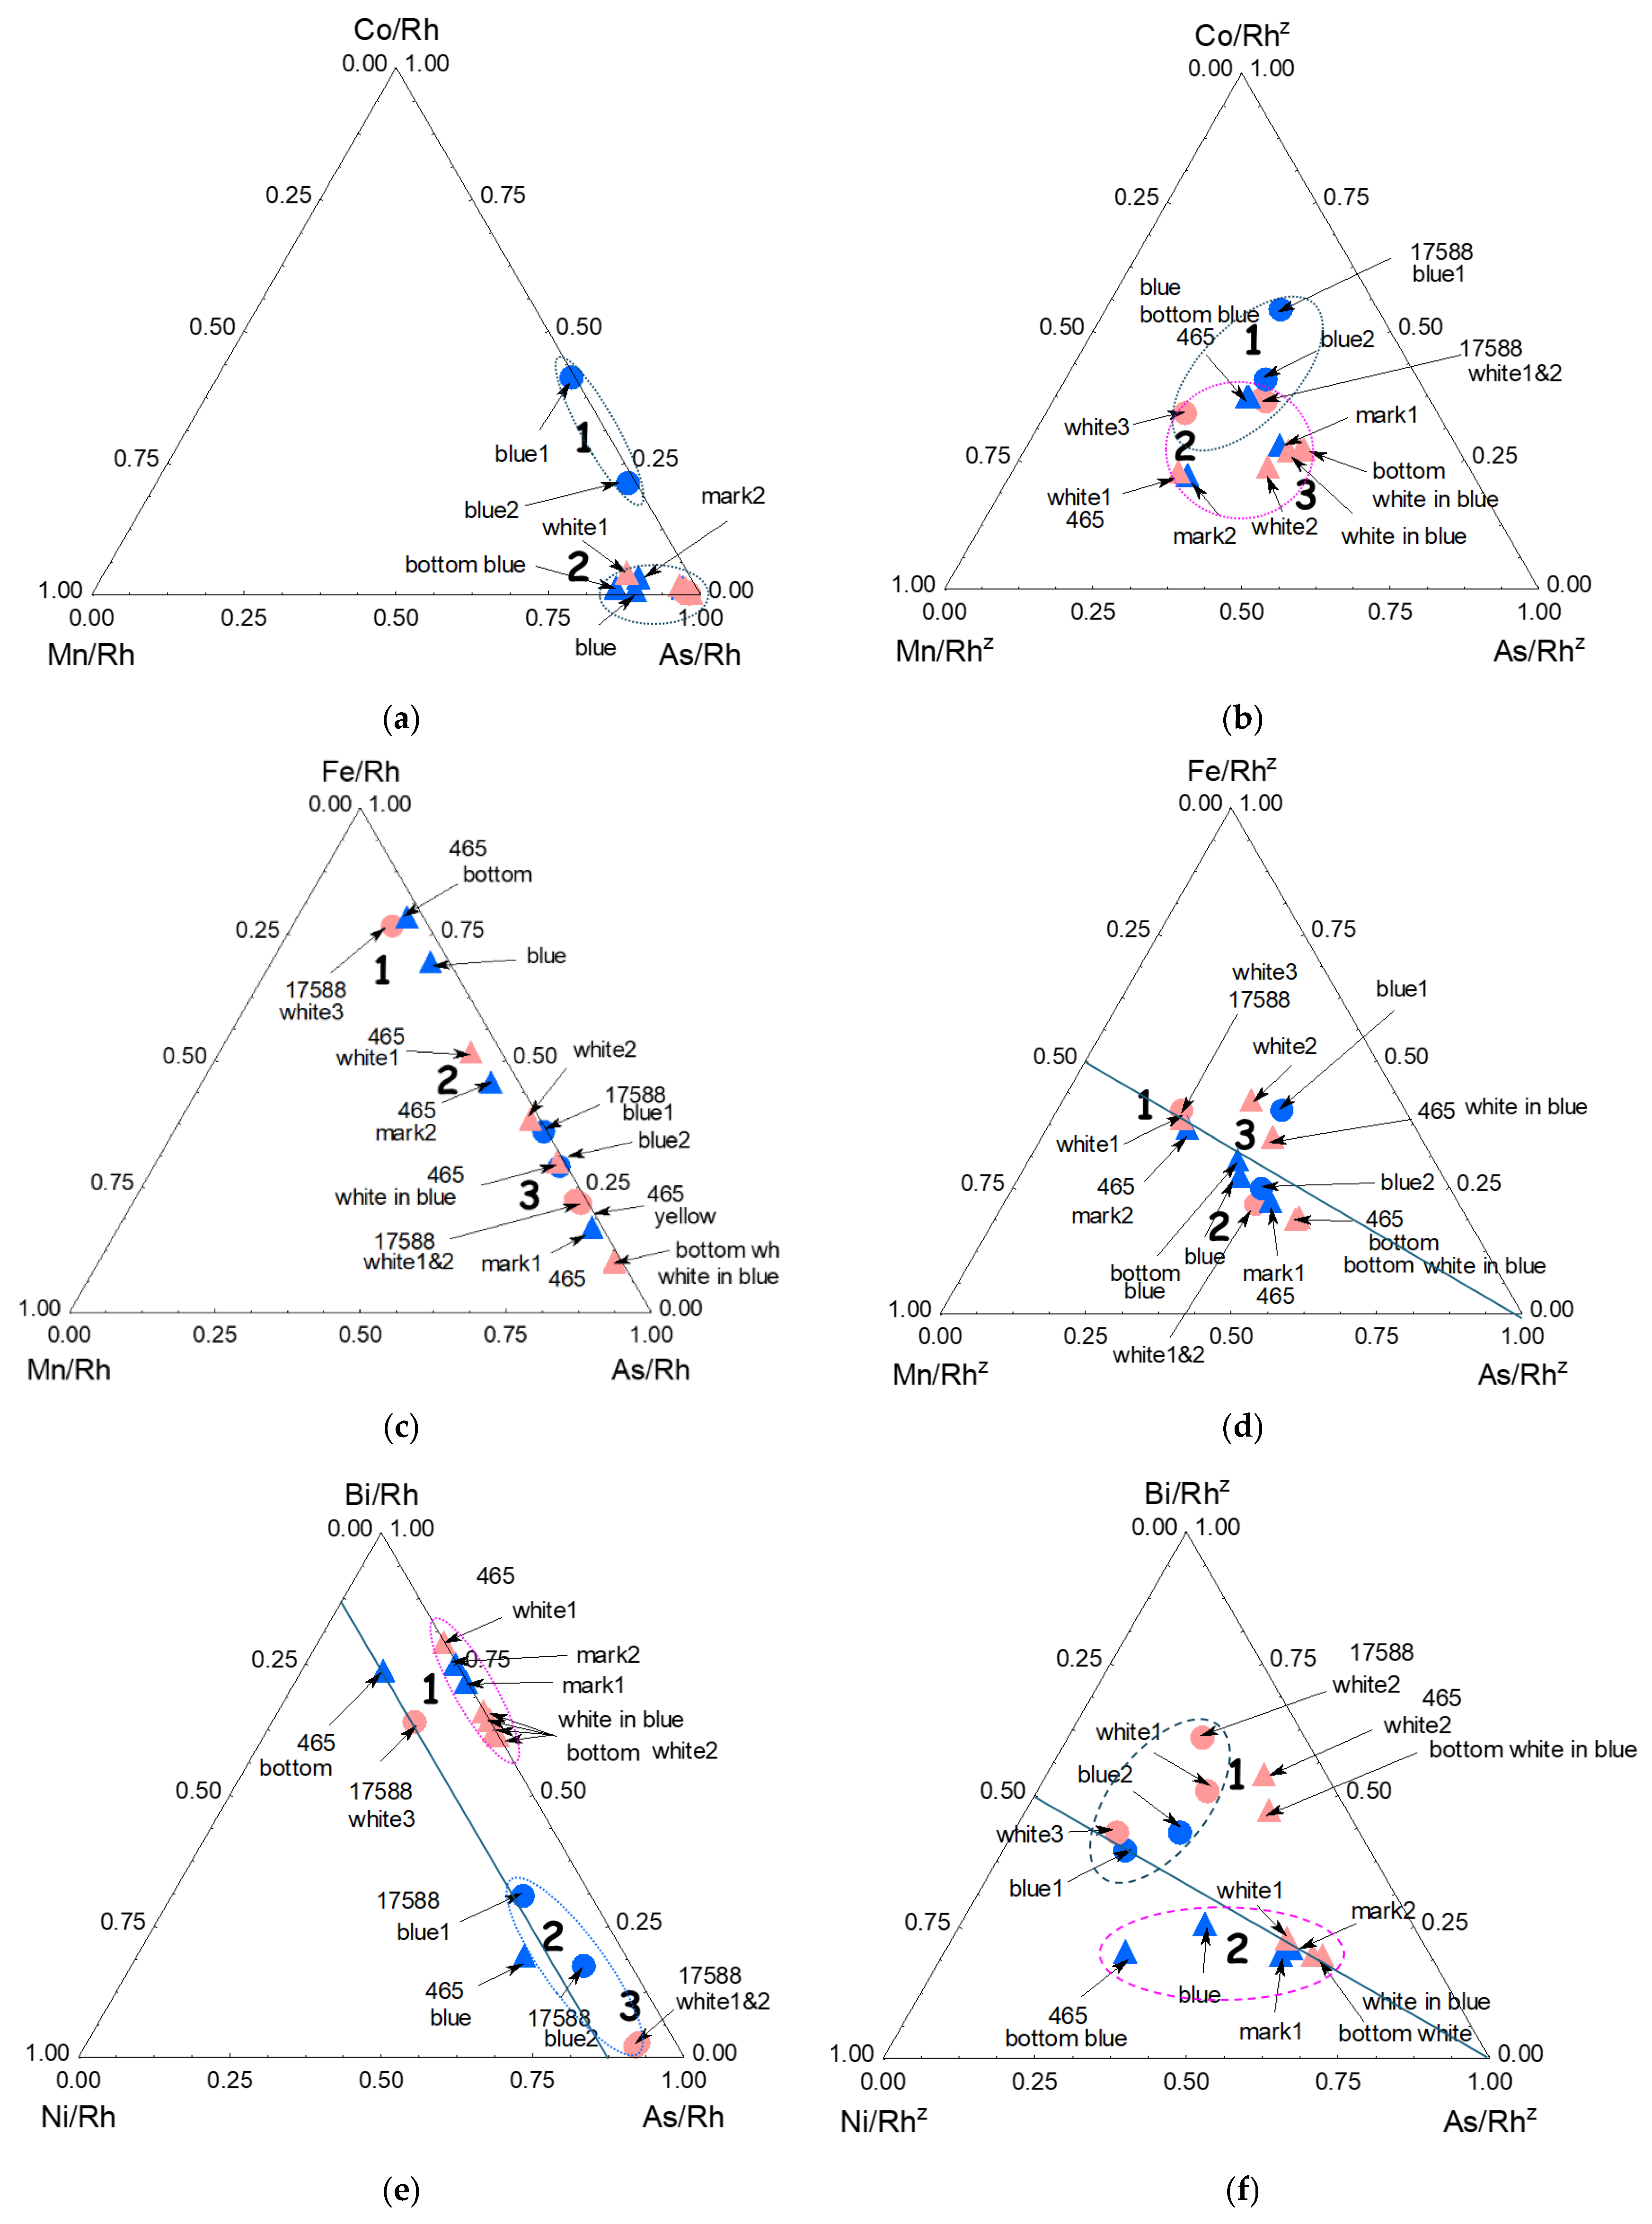
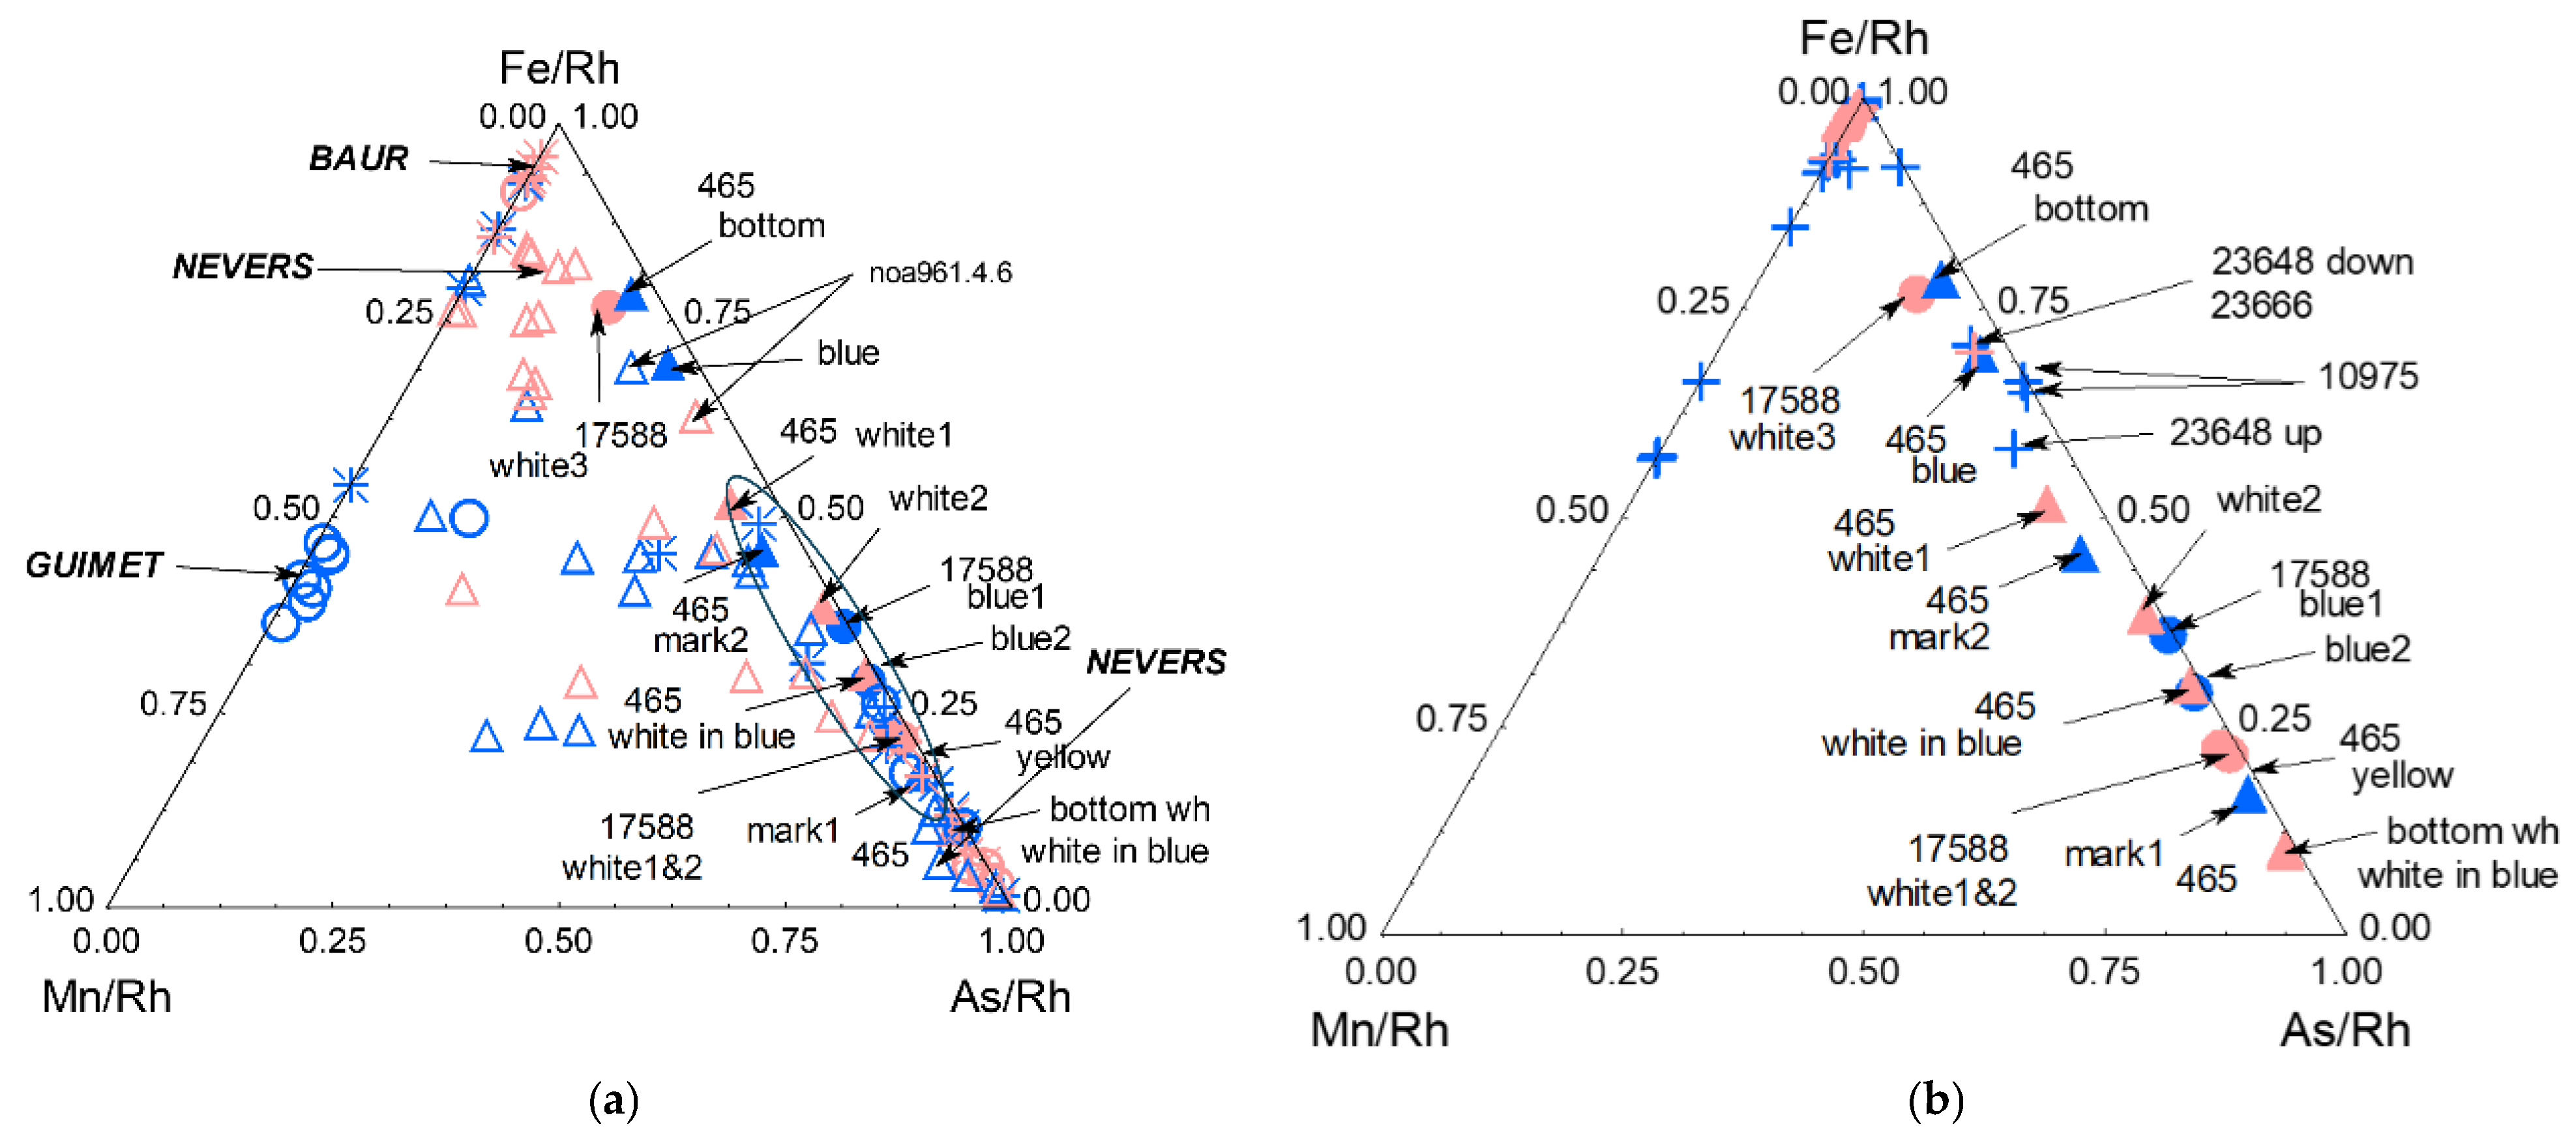
Figure 10 compares the Co-Mn-As, Fe–Mn–As, and Bi–Ni–As ternary diagrams of fluorescence peaks normalized by the Rh signal and after additional z-score standardization. When the blue and ‘white’ enamels/glass are considered, three apparent clusters can be distinguished in the diagrams before standardization. After z-score standardization, the differences between the clusters are reduced, indicating that some of the initial discrimination was determined by the different orders of magnitude of the variables used. In the Co-Mn-As diagram, only two groups involve blue-colored areas containing cobalt, with each group corresponding to one object. Different cobalt sources (or grades) were therefore used for the vase and the box. The differences are much less pronounced in the Fe-Mn-As diagram. An intermediate pattern is observed in the Bi-Ni-As diagram (Figure 10).
Because cobalt ions possess very high coloring efficiency, cobalt is present only at low concentrations (typically less than 0.05 to 0.1 wt% CoO [55]). Moreover, the Fe Kβ and Co Kα emission lines are very close in energy, with a separation comparable to the energy resolution of the XRF instrument used (Figure 5). Consequently, when both elements are present in minor amounts, we only observe a broadening of the peak where the Co Kα and Fe Kβ transitions are expected, together with an increase in its intensity (Figure 5). The cobalt signal measured in the blue enamels of the vase is significantly stronger than that of the box (Figure 10a,b), whereas, before z-score standardization, the spectra collected on the blue areas of the box remain very similar to those acquired from colorless regions (Figure 10a). As a result, although the cobalt signal is clearly visible in the measurements performed on the blue mark (Figure 5), these measurements are only weakly affected by the cobalt concentration and its associated trace elements, as the contribution of the body and glassy matrix dominates the signal from the analyzed volume. It is therefore not possible to draw any conclusion regarding the characteristics of the cobalt used in the mark.
Restricting the comparison to the blue glazes, for which the selected trace elements are expected to be the most discriminating, a clearer separation nevertheless emerges. The blue decorations of the box and the vase form two distinct clusters (Figure 10), both clearly separated from that of the blue mark, indicating that different cobalt raw materials were used for their production. Furthermore, the Mn signal remains weak and shows little dependence on glaze color, supporting the use of European cobalt ores. In contrast, the arsenic signal is noticeably stronger in the vase, whereas the box exhibits slightly higher nickel intensities. These differences further support the conclusion that different cobalts were employed. In the Discussion section, these results will be compared with those obtained for other imperial productions as well as European ones to refine the interpretation of the provenance of the cobalt pigments.

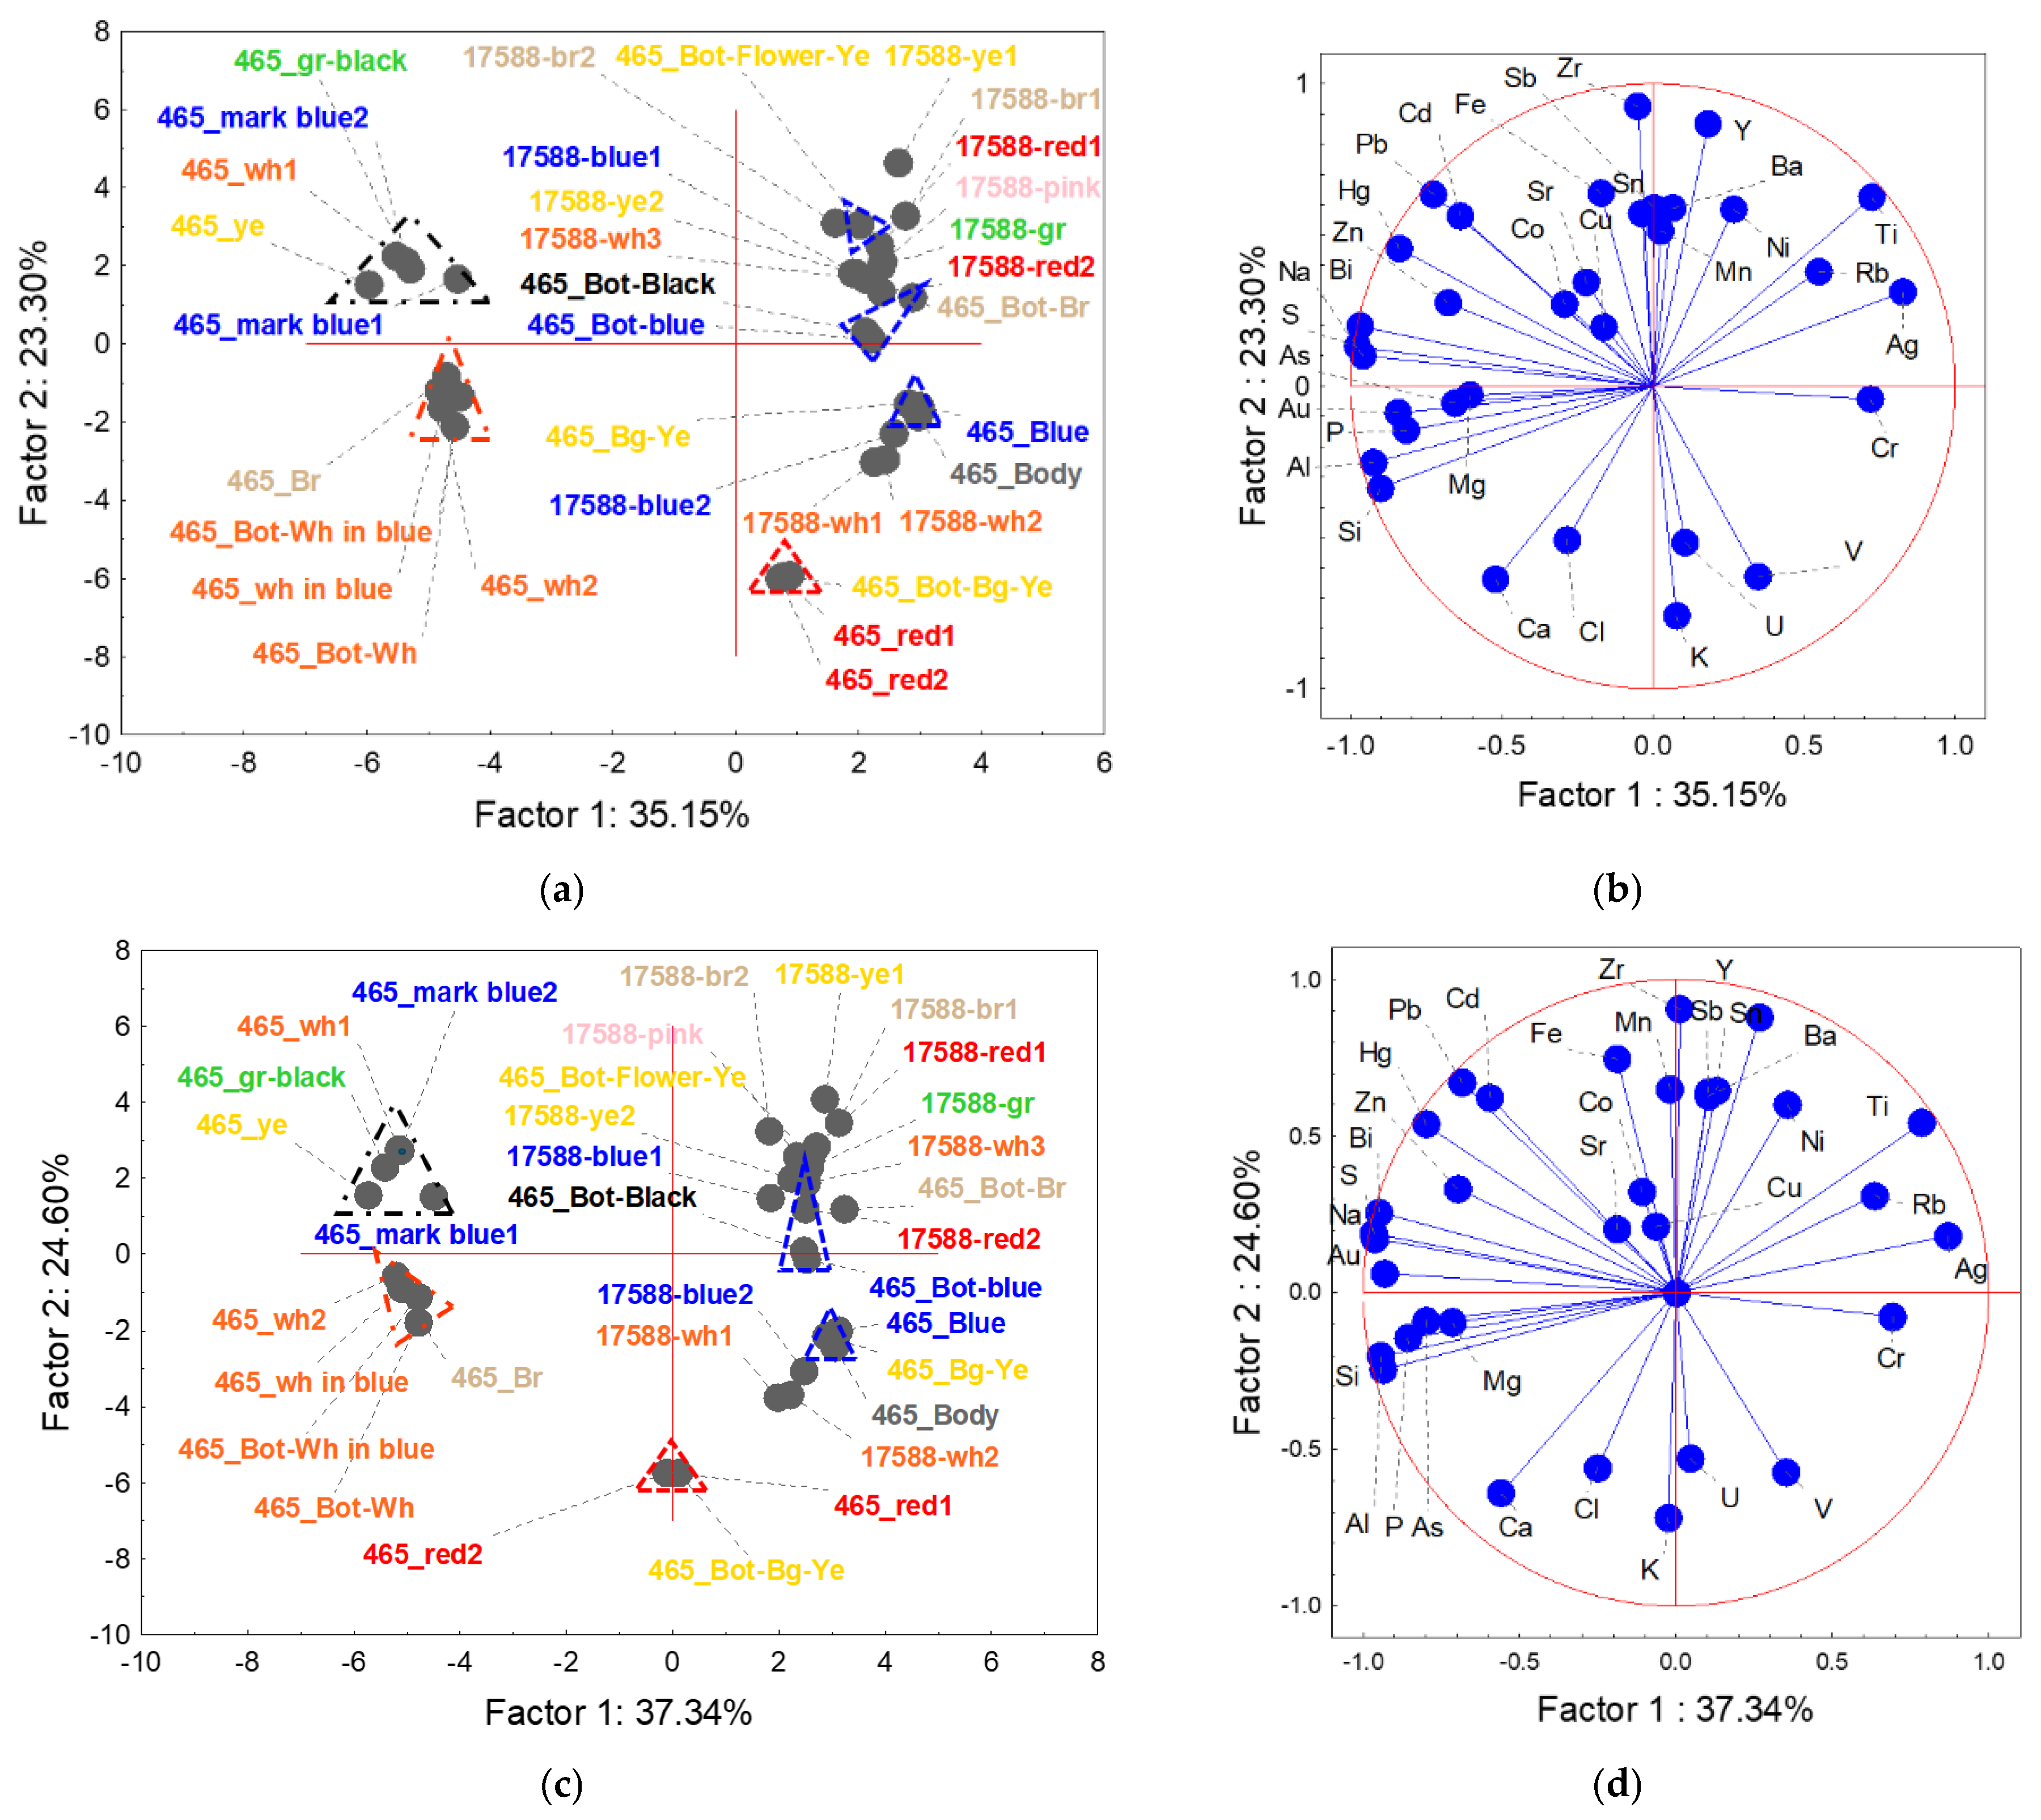
3.6. Data Analysis Using PCAs

Figure 11 compares the Principal Component Analysis score and loading plots obtained using simple Rh-normalized signals of the constituent elements in the glass body (white) and enamels of different colors (Figure 11a) with those obtained after additional z-score standardization (Figure 11c). The results are very similar with and without z-score standardization, although the clustering of the box data becomes slightly clearer after standardization. We also note that the blue of the box mark differs from the blue enamel of the box, or rather, that the blue of the enameled decoration is different, because the blue of the reign mark belongs to the same group as the other enamels. Obviously, as mentioned earlier, the cobalt signal is too weak to draw conclusions about the cobalt used in the overglazed mark. The question of whether the measurements are influenced by the contribution of the support, i.e., the body of the object, remains unresolved. Using these PCA analyses, we reach the same conclusions as those obtained from the visual analysis of the spectra and ternary diagrams, which are summarized in Table 2.
Different technical solutions were therefore used for the two objects, resulting in a clear separation in the PCA diagrams, which thus have the benefit of summarizing the compositional groups observed. The data from the box are located in the left quadrants (negative values of Factor 1), while those from the vase are located in the right quadrants (positive values of Factor 1), except for the data from the box concerning the blue enamel (right quadrants), the red enamel (a value around zero for Factor 1), and some of the yellow areas.

4. Discussion

4.1. Similarities and Differences Regarding the Production of Enameled Objects for the Court: Raw Materials

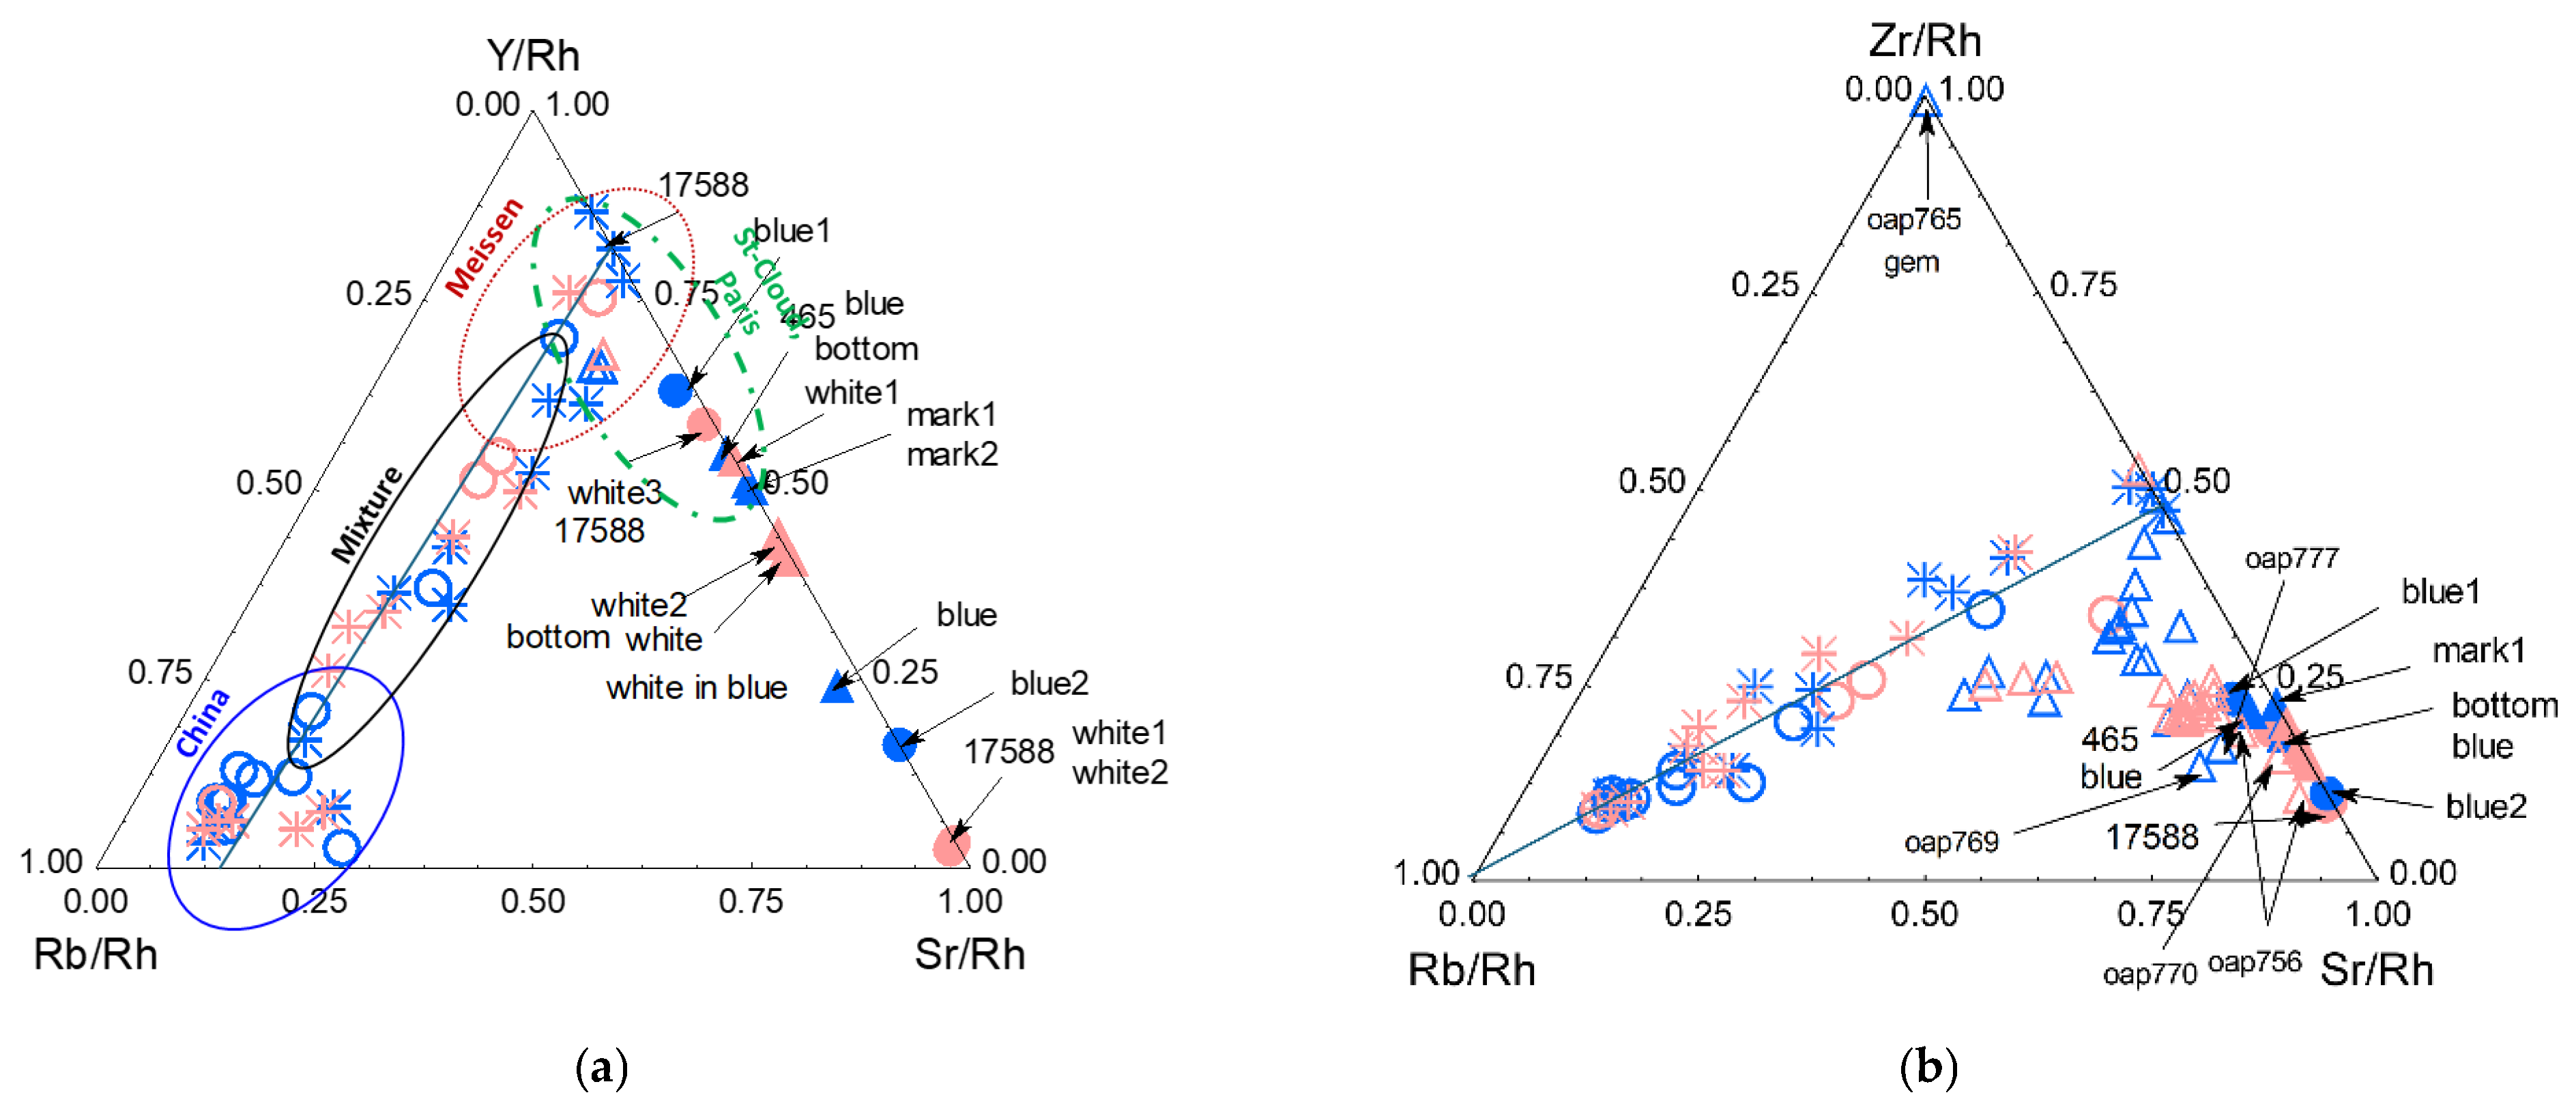
No information can be obtained from light elements, including silicon. Conversely, the impurities associated with silicon and the fluxes provide very useful information. We first compare the results for the box and the vase with those obtained for enamels from imperial porcelains. Figure 12 compares the Y-Rb-Sr (12a) and Zr-Rb-Sr (12b) diagrams. Obviously, the raw materials used for imperial porcelains [15,16,23,60] differ from those used for the box and the vase. However, the data from French Nevers city spun glass artifacts, mainly dating from the 17th and 18th centuries [18,48] and made by firing at relatively low temperatures (700–900 °C range), are located together with those of the box and the vase. The distribution of the porcelain enamel data along a line parallel to the Y-Rb line and along the Rb side-middle of the Zr-Sr line, a feature already noted [15,16,47], indicates that the materials used for porcelain enamels are mixtures of those corresponding to the extremes. Zirconium and yttrium are impurities originating from the quartz sand used. The sand used in French/European production is located along the Y-Sr line, close to the Y vertex, for the Saint-Cloud and Paris area (soft-paste porcelain) factories [16], as well as for Meissen hard-paste porcelain [19]. For the latter, data are also observed along a line parallel to the Y-Rb line, as in Chinese painted enameled imperial porcelain [16]. Ming porcelain data are located close to the Rb vertex [16]. On the other hand, data related to Ming porcelain are located close to the Rb vertex [15,16]. This observation supports the use of glass imported from Europe for the preparation of the Kangxi glass box and vase, particularly for the yellow enamel of the vase, as all the data are located along the Y-Sr side of the ternary diagram. The same behavior is also observed for the blue 1 and white areas of the vase. The other data are too far apart and correspond to other types of raw materials.
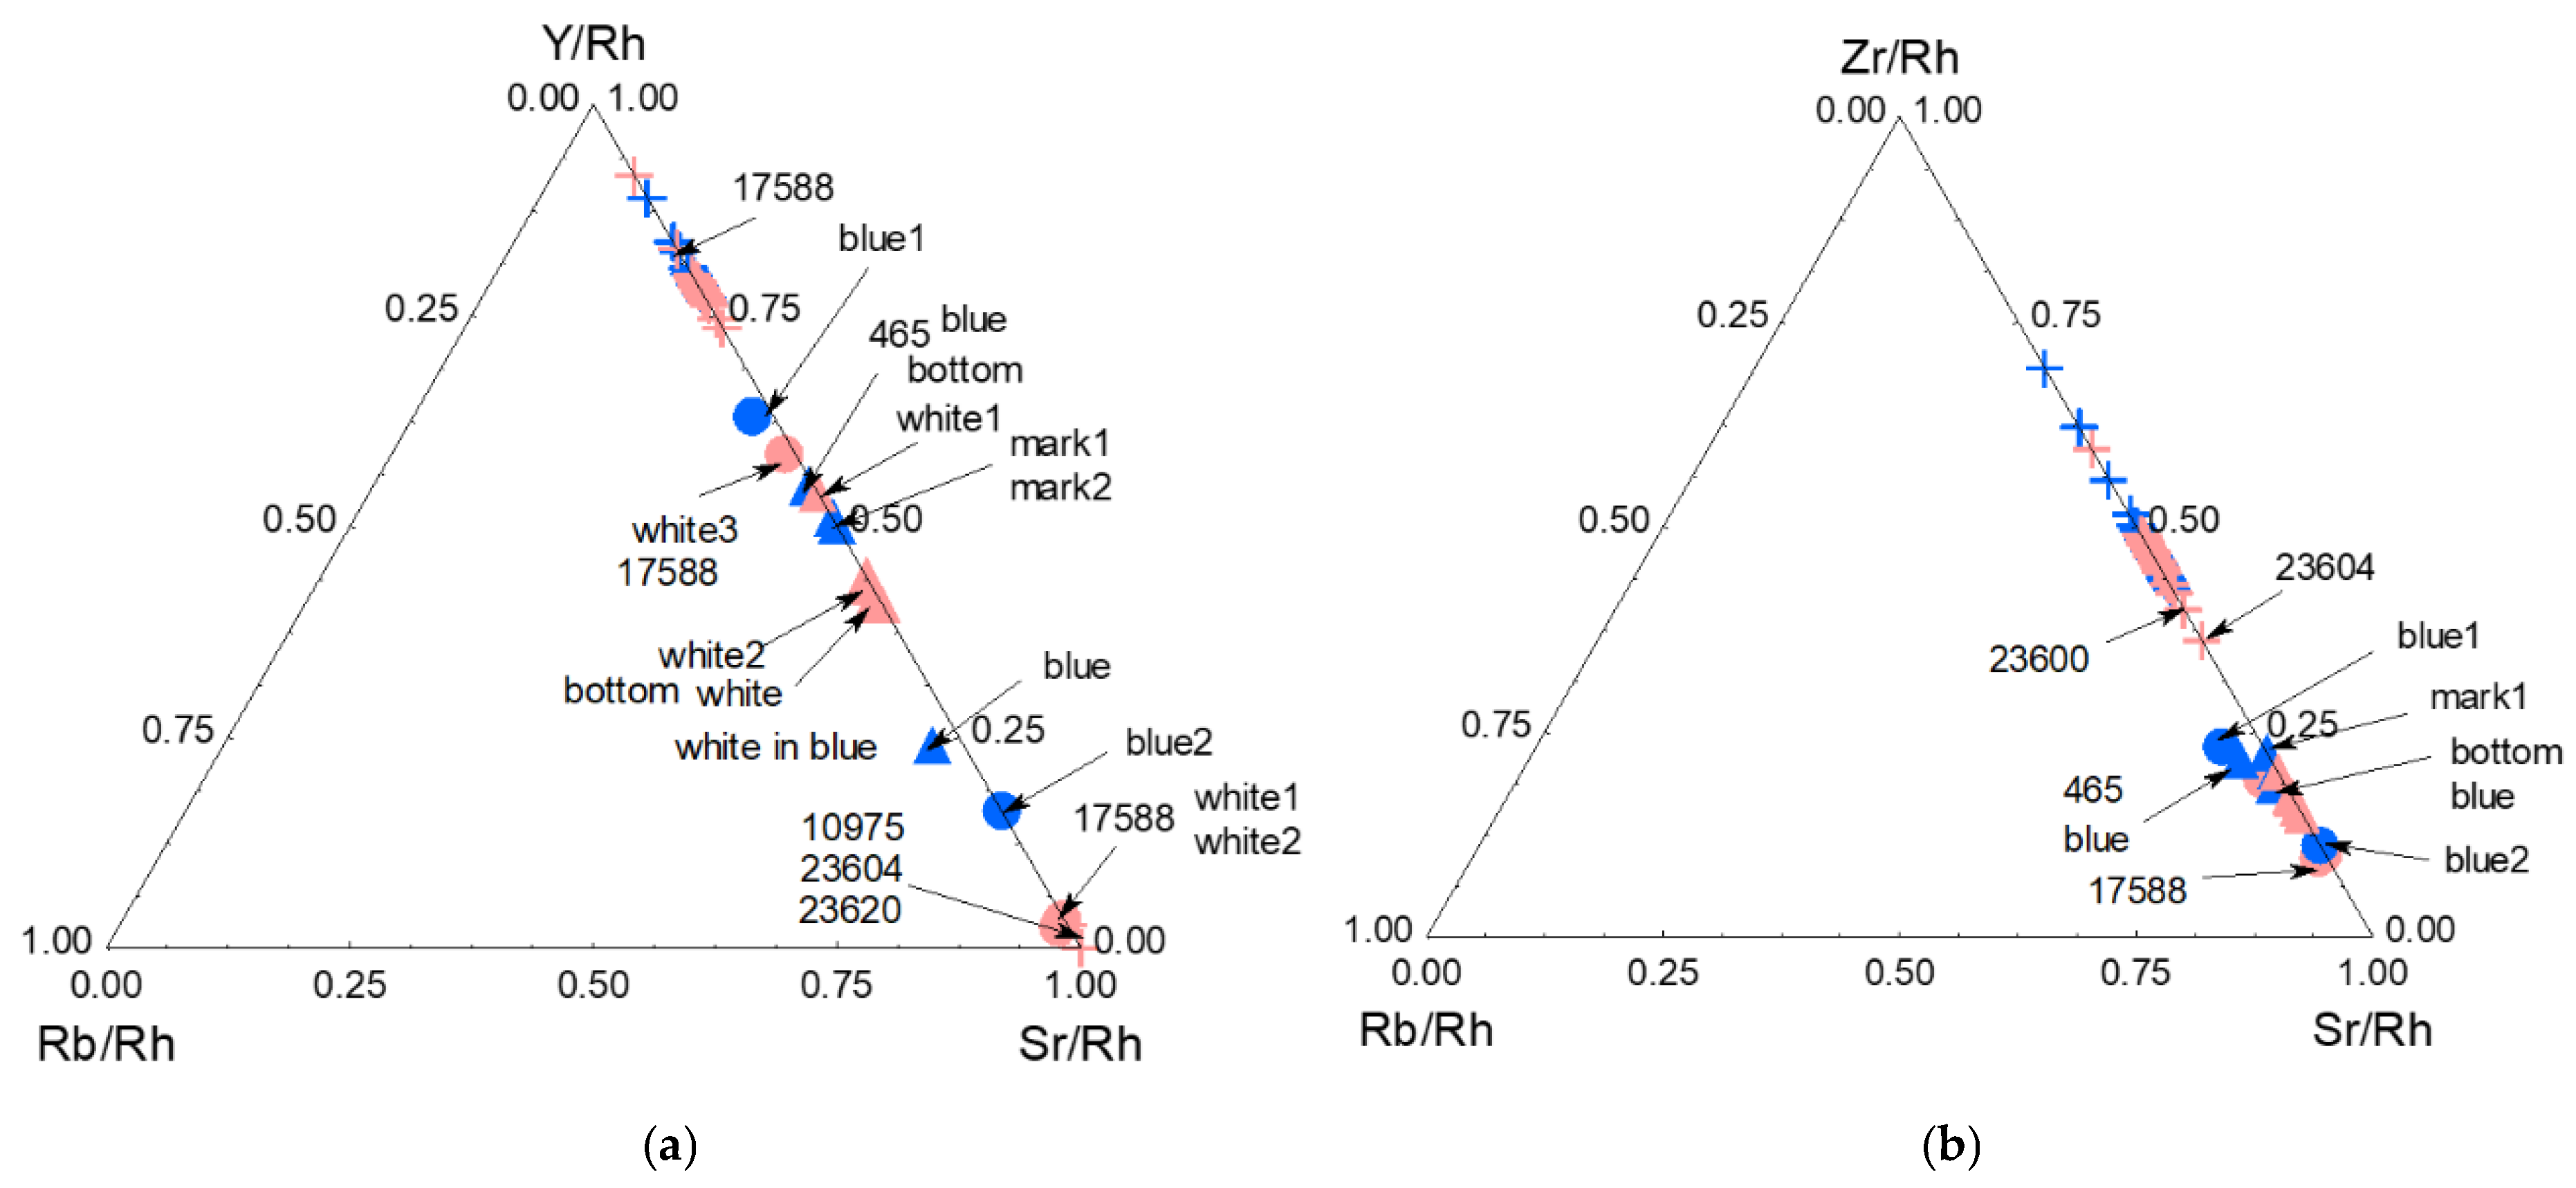
The plots generated from data obtained for the cloisonné enamels in the collection of the Musée des arts décoratifs (Paris), measured with the Elio instrument using the same procedure [61], differ completely from those of imperial porcelain enamels, also measured with the same procedure [15,16]. These cloisonné objects are attributed to reigns spanning the period from the end of the Yuan dynasty to the Qianlong period of the Qing dynasty. Two or three groups have been identified—along with a few specific cases —but all are distributed along the Y-Sr and Zr-Sr sides of the diagrams in Figure 13, similarly to the French enamels [61].
The first important conclusion is that the cloisonné enamels were prepared using raw materials different from those used for imperial porcelain painted enamels. The second conclusion is that the two Kangxi objects—the box and the vase—utilized the same raw materials as the cloisonné enamels, or materials with similar geological origins. The use of raw materials from France leads to data located relatively close to the yttrium vertex, suggesting that only the box enamels may have been prepared with extensive use of raw materials imported from France.

4.2. Compositions of the Enamels

Despite the uncertainties surrounding silicon, examination of the Si-K-Ca ternary diagram (Figure 14) reveals that the composition of the blue enamels and the vitreous body of the box—in terms of these major elements, using the same measurement procedure for the box and the reference samples—is comparable to that of the blue enamels on the imperial bowls from the Baur Foundation: A615 (inv. CB.CC.1937.615, Yongzheng reign or later), A616 (inv. CB.CC.1930.616, Yongzheng reign), and A677 (inv. CB.CC.1936.677, Kangxi reign or later) [15,16]. Conversely, the composition of the corresponding colors on the vase is closer to that of the enamels on bowls A613 (inv. CB.CC.1932.613b, Kangxi reign) and A616 (inv. CB.CC.1930.616, Yongzheng reign or later). These observations are consistent with the conclusion that the blue decoration on the two objects was produced using different technological protocols, possibly reflecting different production periods, but both at the end of the Kangxi reign or during the Yongzheng reign.
Comparison with data from the cloisonné objects confirms a high degree of similarity. A possible relationship between imperial cloisonné and the Beitang enameling workshop has been suspected by some authors [61,62,63,64,65]. This indicates that, although the raw materials used for the porcelain and cloisonné enamels differ significantly, the resulting enamel compositions are similar. The impurity fingerprint of the raw materials of the vase enamels is very close to that of the cloisonné enamels, whereas the enamels on the box differ by having significantly higher silica and lead contents.

4.3. Cobalt Sources

Examination of the plots generated using signals from elements associated with cobalt—specifically transition metals such as manganese, iron (part of which originates from the glass matrix), and nickel, as well as arsenic and bismuth (Figure 15)—reveals the following: the data points along the Fe-Mn line correspond to underglaze cobalt marks from the late Ming period, as previously established [16,18,23]. Notably, the data for the box and the vase fall along the Fe-As line, consistent with the use of cobalt imported from outside China. The diagrams built using data from enameled imperial porcelain and cloisonné wares are rather similar, which is consistent with the use of the same two types of cobalt: those imported from abroad (Persian and/or European, rich in arsenic) for the decoration and Asian cobalt (rich in manganese, with two subgroups according to the Mn/Fe ratio) for the marks [55].

4.4. Processing and Dating

According to Xue & Maxwell [66], “a memorandum in the imperial archives, dated 12th July 1728, records the use of nine enamel colours imported from the West and eighteen new colours developed by the imperial glass workshop during the Yongzheng period (1723–35). The Western enamels were identified as moon white, white, yellow, green, deep bright green, light blue, pine yellow, light bright green and black. The imperial workshop developed Chinese versions of these colours as well as entirely new shades, which were listed together as moon white, white, yellow, light green, light indigo, blue, pine green, light green, black, soft white, autumn yellow, light pine green-yellow, pinkish purple, light green, sauce brown, deep grape purple, bronze and pine yellow”.
The correspondence between the colors identified on the vase and those listed in the 1728 memorandum suggests that these colors were available within the imperial workshop during the Yongzheng period. However, the memorandum should not be interpreted as evidence for a linear replacement of Chinese recipes by European ones. Rather, it indicates that imported Western colors coexisted with colors developed within the imperial workshop, reflecting ongoing experimentation with different coloring solutions. The surface defects and the absence of a reign mark on the vase are consistent with its possible interpretation as an experimental or test piece, potentially produced before the box, whose enameling appears visually more refined. The absence of white enamel on the vase may provide additional support for this hypothesis, although it does not by itself establish a precise chronology. Although the glass bodies of the two objects are compositionally very similar, significant differences are observed in their enameling techniques. The source of cobalt for blue enamels also differs, although both exhibit compositional inhomogeneities at the scale of the measurement (mm scale). The inhomogeneity of the blue enamel on the vase is consistent with poorly controlled firing, as indicated by the numerous bubbles observed. On the other hand, the use of gold nanoparticles to produce the brown and red colors of the box reflects sophisticated recipes and advanced technical expertise. A return to traditional Chinese recipes was observed with the arrival of the Yongzheng Emperor (r. 1722–1735) [13,61]. It should be recalled that the mark of a previous reign may be officially applied at a later date and the presence of the Kangxi reign does not exclude production under the Yongzheng reign.
It is noteworthy that the mastery of gold nanoparticles at the Meissen factory only dates between 1720 and 1726 (e.g., the artifact inv. MNC2274-9 dated 27th August 1726) [19,67], many years before Vincennes-Sèvres [68]. Ulterior dates are therefore plausible for the production of the two studied objects. Indeed, although it has been reported that, in February 1706, the Kangxi Emperor (r. 1661–1722) presented the papal legate Maillard de Tournon with an enameled glass snuff bottle [6], the 1706 date cannot be considered as the starting point for the production of high-quality enameled glass in the Beitang workshop. Accordingly, also taking into account Governor Yang Lin’s report, the production of the present objects can reasonably be placed between circa 1720 and 1730, probably between 1726 and 1730.
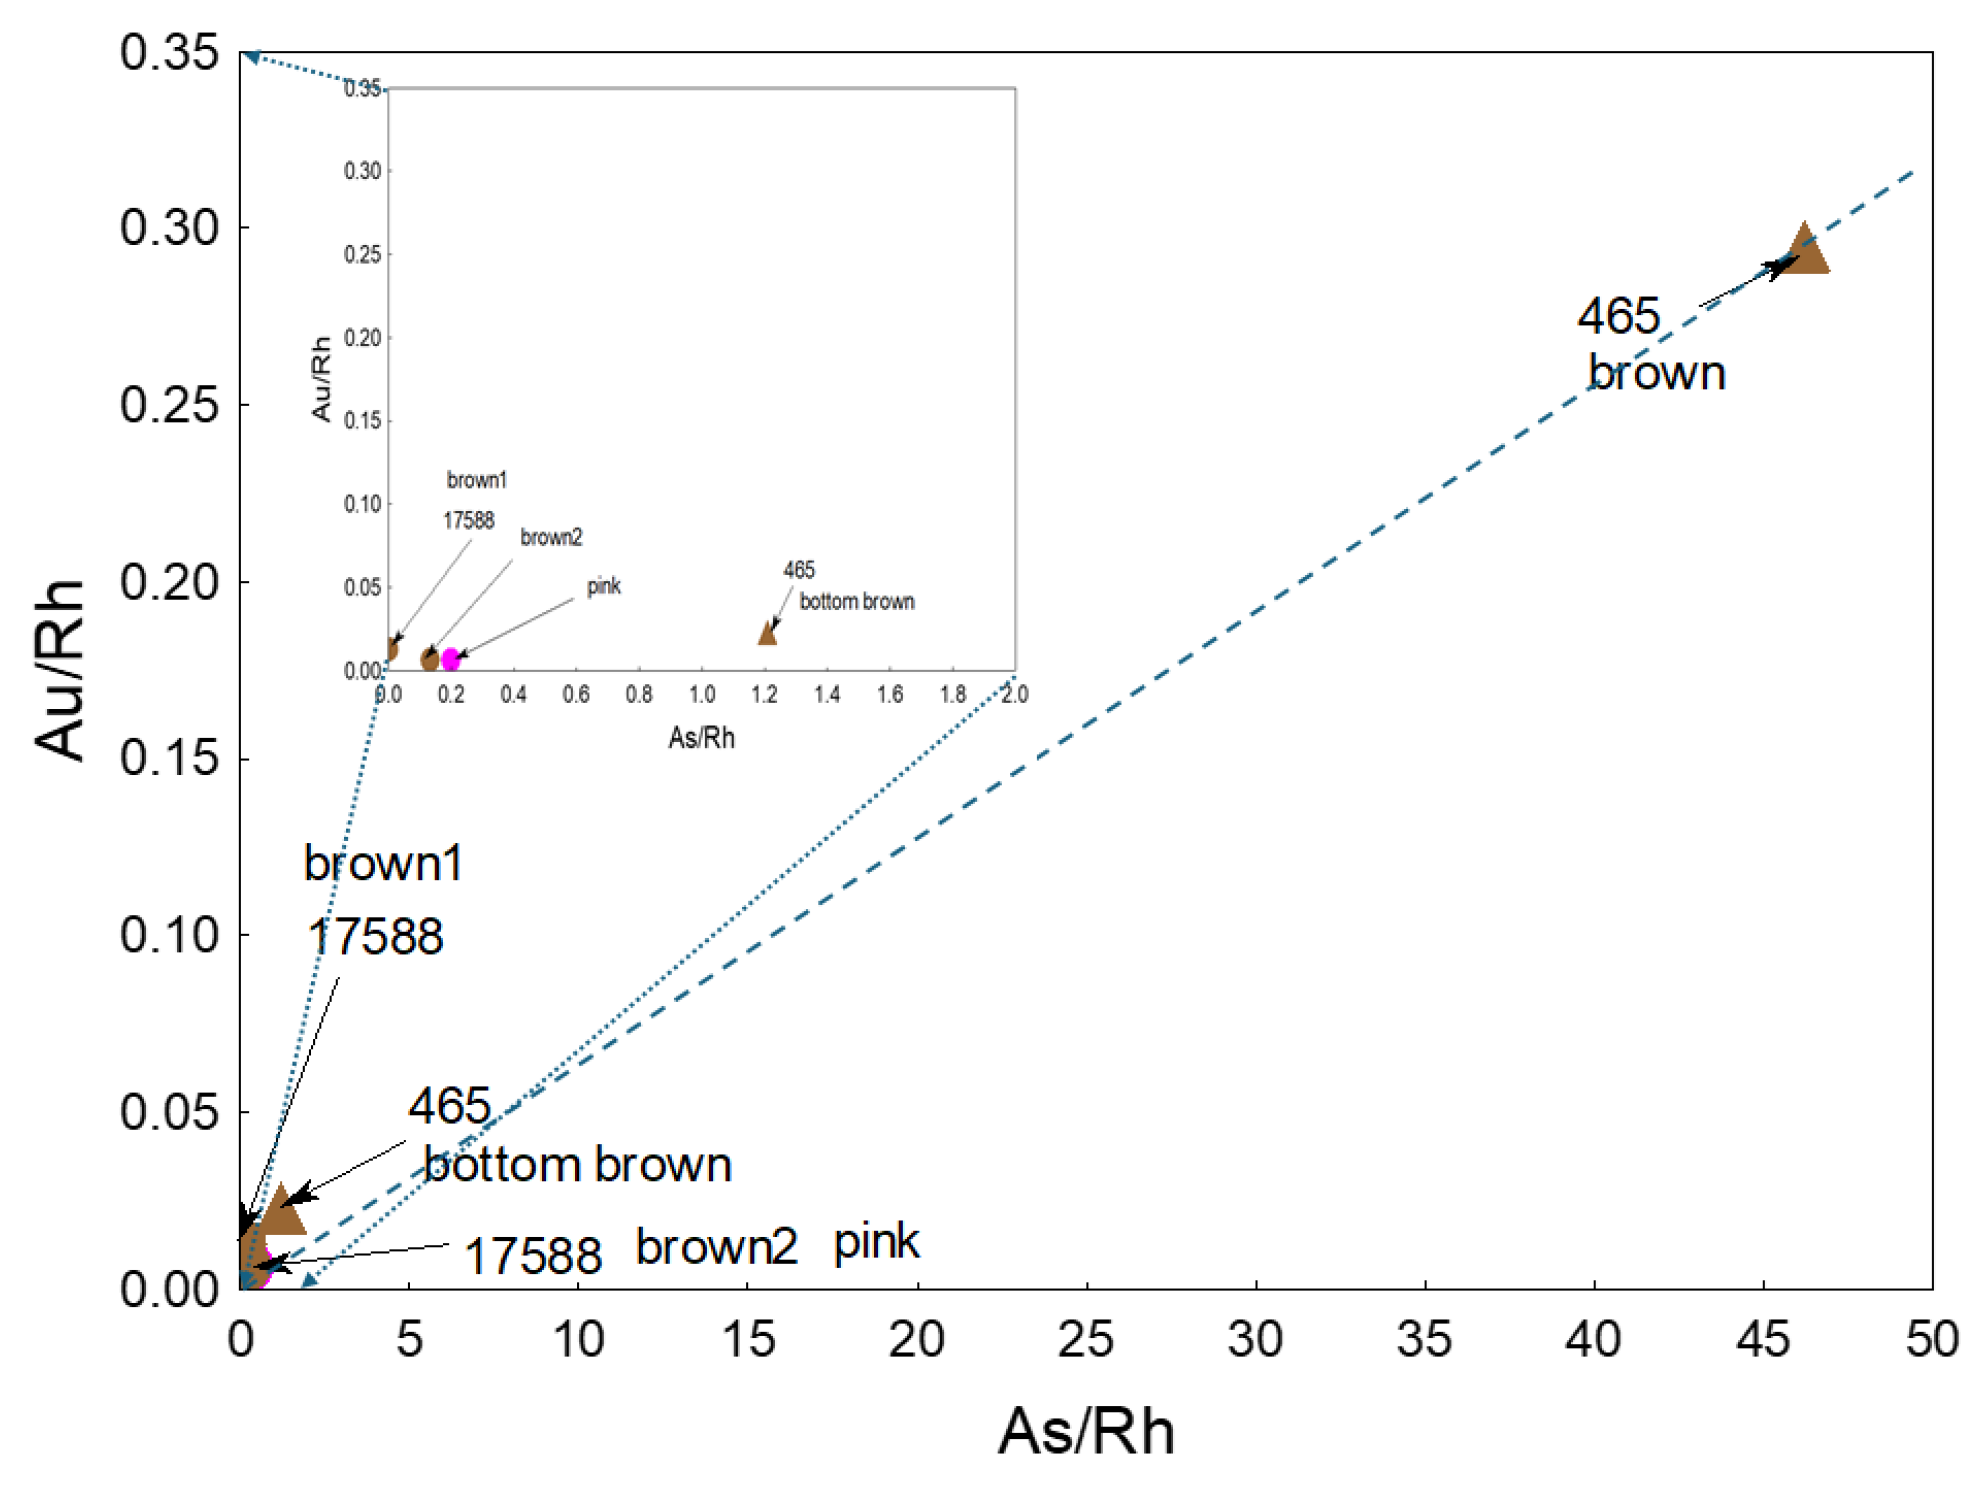
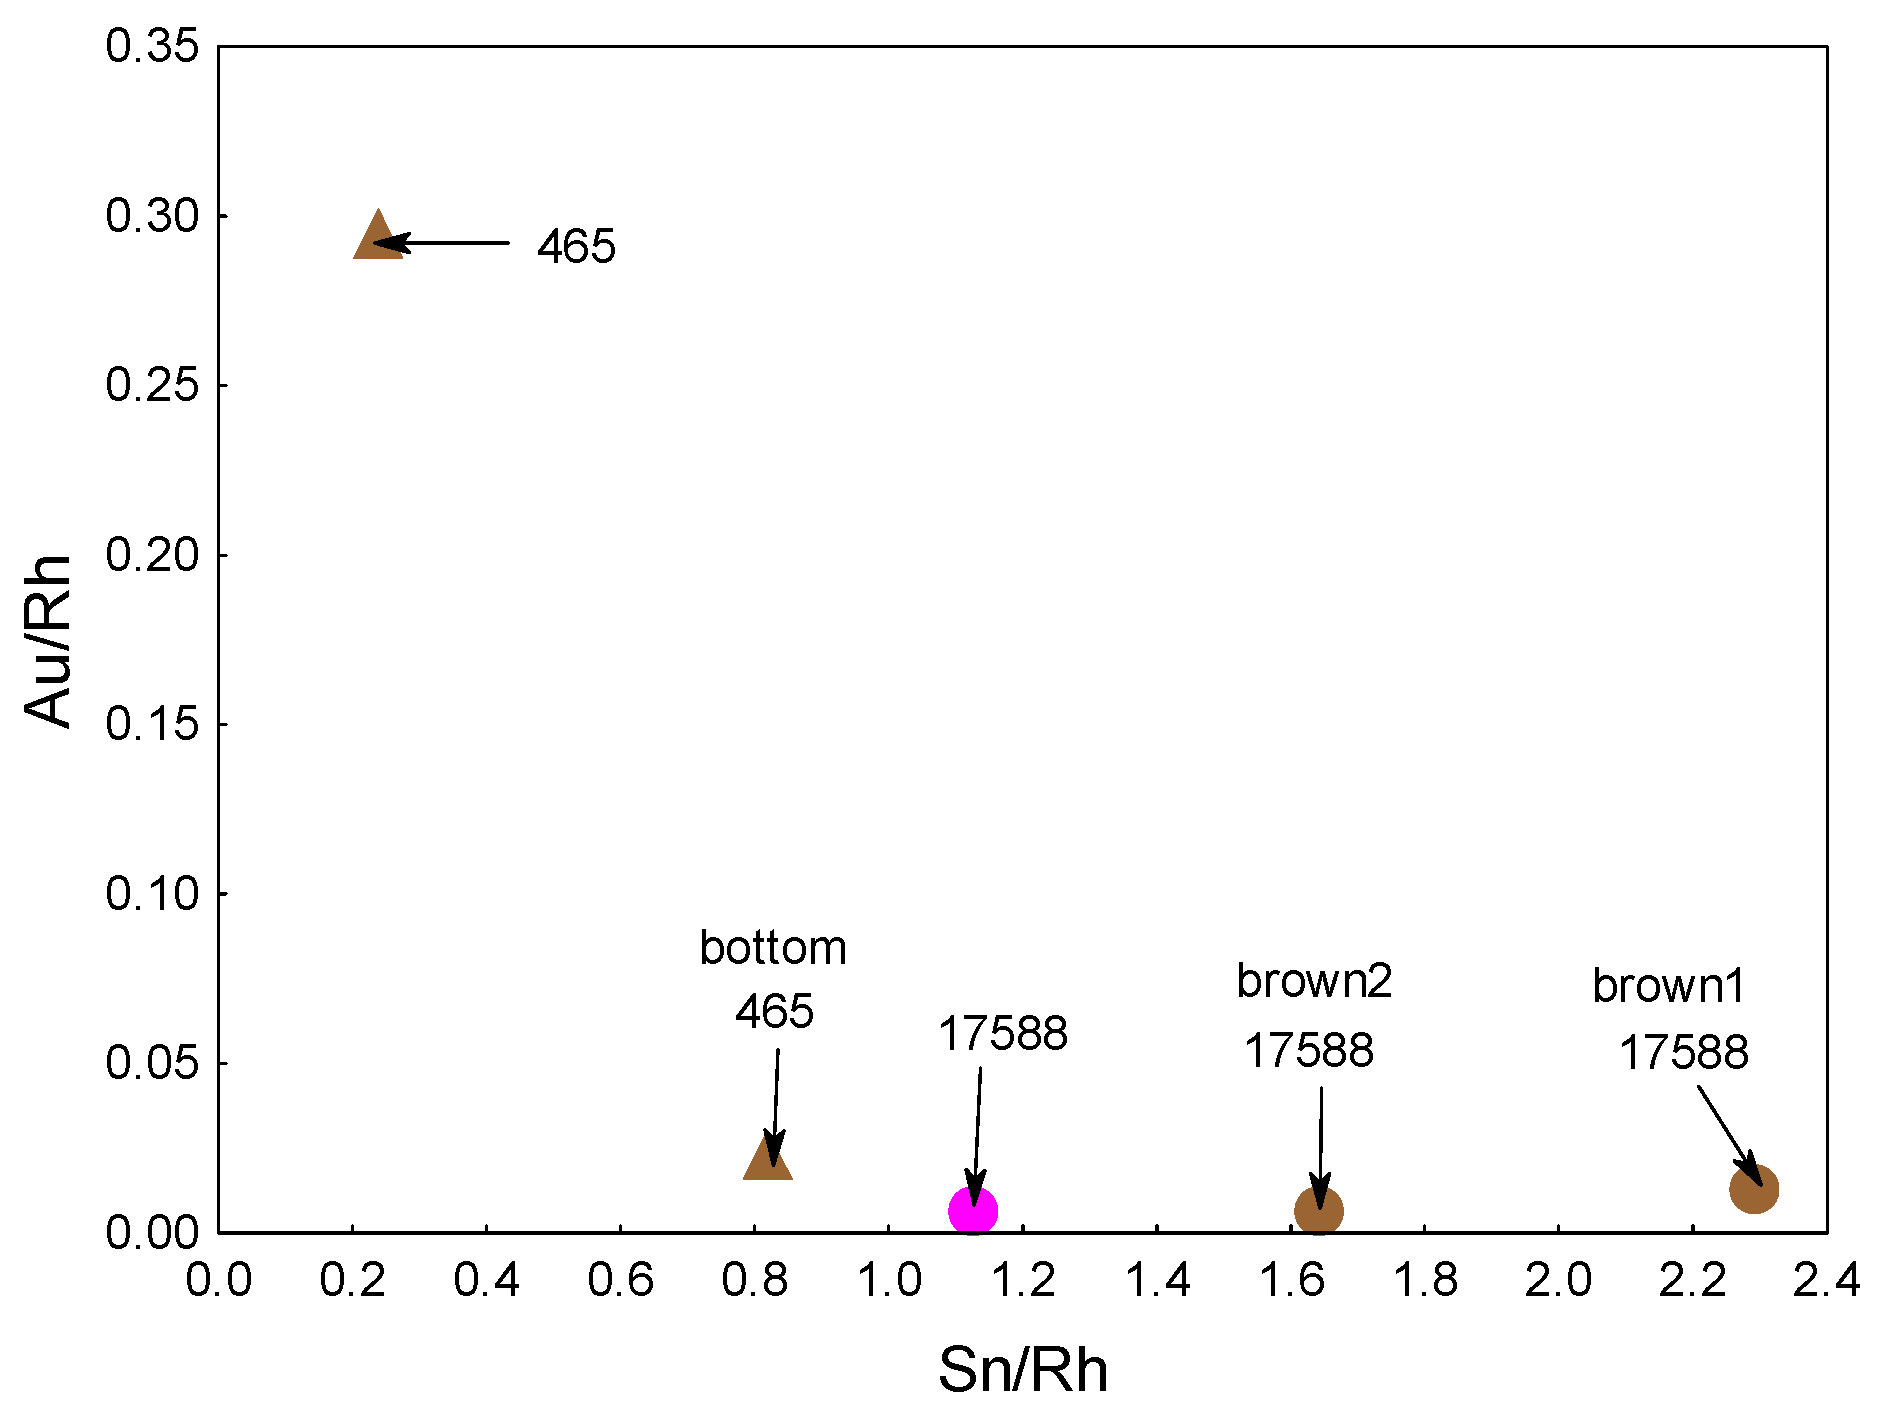
In France, gold nanoparticles had already been used to produce red-to-purple painted enamels on gold since the mid-17th century [19,69] and to manufacture ruby glass since at least the last quarter of the 17th century [36,37]. In China, the large use of gold nanoparticles starts with the Yongzheng reign [39,70]. Figure 16 shows the relationship between the Au and As contents in the brown enamels of the box, suggesting that the gold nanoparticles (Au° NPs) were synthesized using Perrot’s procedure [37]. Indeed, Figure 17 shows a rather intense As Kβ peak and a weak Sn Kα peak in the red to brown-colored area, although the Au peak is not detected or is hardly detectable. Furthermore, the As peak intensity is well correlated with the Au content, which is not the case for Sn. Traces of tin are thus impurities of lead and are not associated with gold.
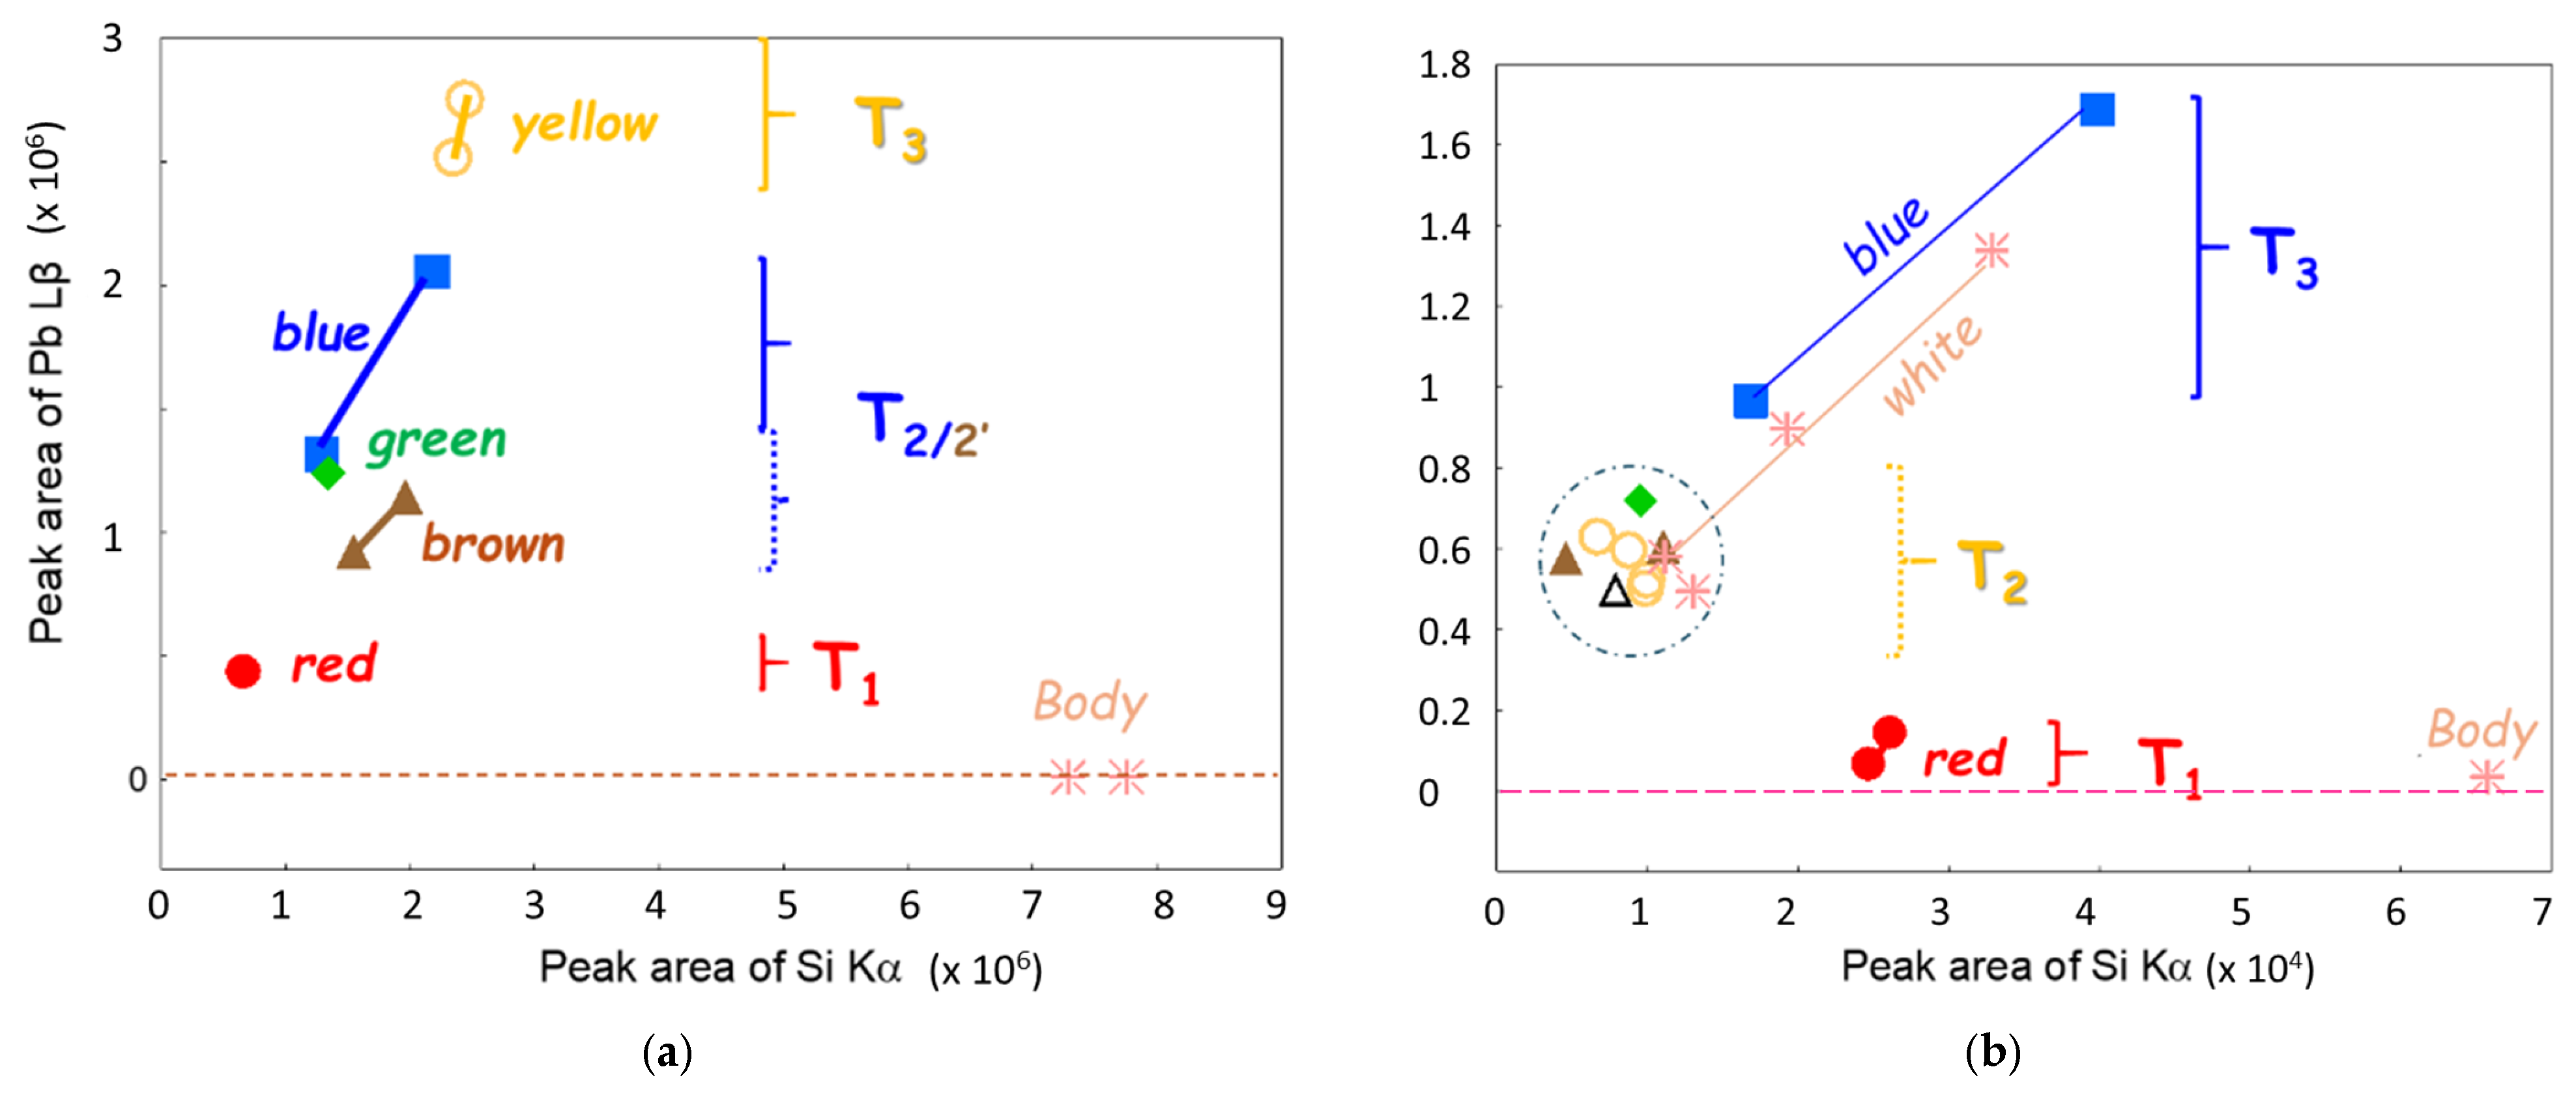
Figure 18 compares the peak areas of the lead Lβ transition with those of the silicon Kα peak for the different enamel colors according to Table 1. The glass bodies of both artifacts are virtually free of lead; the trace amounts detected most likely result from surface contamination caused by PbO evaporation during the firing of the lead-rich enamels. Two to three distinct lead signal levels are observed in the two objects. In the vase (Figure 18a), the yellow enamel exhibits the highest lead content, and the blue and green colors correspond to lower peak areas; the brown color peak area is lower, and that of the red color is very low. In the box (Figure 18b), the blue and white overglaze enamels exhibit the highest lead signals, exceeding those measured for all other colors except the red color. This compositional difference suggests the use of at least two firing temperatures, with the higher temperature likely employed for the lead-poor red enamels. These observations further indicate that the enameling processes differed between the two artifacts.

5. Conclusions

This study first underlines that precise comparison is difficult when different XRF instruments are used. However, as has been shown, a procedure that normalizes the fluorescence peaks against the Rh tube signal, combined with the use of ternary diagrams (or PCA analyses), enables relevant comparisons to be established for impurities associated with major elements (Zr/Y/Rb/Sr) and for elements associated with cobalt, leading to informative insights into ceramic technologies and the origins of raw materials. To begin with, the analysis reveals a strong similarity in the glass bodies of the two objects, which are opacified with calcium arsenate (plus probably antimonate traces for the box), but different procedures for the enameling of the painted enamel decoration. The cobalt in the enamels of the two artifacts differs in origin or level of purification. No reliable conclusion can be drawn regarding the cobalt used for the box mark, as the quantity of cobalt in the analyzed spot is too small. The red color of the box is produced by metallic copper nanoparticles (Cu° NPs), whereas the pink on the vase (and likely on the box) and the brown-purple on the vase are colored by gold nanoparticles (Au° NPs) prepared using arsenic, according to Perrot’s method. Only the box uses tin-opacification for the white enamel, a technical solution exceptional for Qing production, used only for outstanding imperial artifacts, whatever the reign. It is worth recalling that opacification using cassiterite has been widely employed in European majolica glazes since the 16th century, in painted enamels on gold [69], as well as in the enamels of soft-paste porcelain (Chantilly Manufactory, after 1725) [71] and, to a lesser extent, in the enamels of spun-glass figurines from the 17th century onwards [37].
The variation in lead signal levels in the enamels indicates that at least two firings at different temperatures were required. Different types of raw materials are identified, imported from Europe or domestic, related to those used for imperial painted enameled porcelain as well as for cloisonné enamelware. On the basis of all the information gathered, it can be assumed that the production of the objects presented here can reasonably be dated to circa 1720–1730, spanning the end of the Kangxi reign and the beginning of the Yongzheng reign. Their technical characteristics provide evidence for the experimental phase of enameling in the imperial workshop(s), during which different raw materials, pigment formulations, and enamel recipes were systematically explored and refined. The observed variations in enamel composition and manufacturing techniques are consistent with a period of various technological developments and innovation preceding the standardization of enamel production under the Yongzheng court. This type and quality of painted enamel on glass had no European equivalent at the time; these objects demonstrate the refinement of enameling techniques in China, using European ingredients and recipes originally developed for painted enamel decoration on metal.

Supplementary Materials

The following supporting information can be downloaded at https://www.mdpi.com/article/10.3390/ceramics9090098/s1, Table S1: Kangxi glass XRF peak areas Data. Figure S1: XRF spectra collected on the box.

Author Contributions

Conceptualization, P.C., T.-H.C. and C.-F.S. methodology, P.C., L.B.-G. and G.S.-F.; investigation, P.C. and L.B.-G.; data curation, P.C. and G.S.-F.; writing—original draft preparation, P.C., T.-H.C. and G.S.-F.; writing—review and editing, P.C., G.S.-F., T.-H.C., L.B.-G., B.Z., C.-F.S. and P.-C.Y.; visualization, P.C. and G.S.-F.; funding acquisition, P.C. and B.Z. All authors have read and agreed to the published version of the manuscript.

Funding

This research was partly funded by Agence Nationale de la Recherche ANR EnamelFC project—19-CE27–0019-02. The purchase of the Bruker Elio XRF spectrometer used in this work was supported by Sorbonne University, the CNRS and the Paris Île-de-France Region—DIM “Patrimoines matériels—innovation, expérimentation et résilience” (project IDF-DIM-PAMIR-2023-1-003).

Institutional Review Board Statement

Not applicable.

Informed Consent Statement

Not applicable.

Data Availability Statement

The raw data supporting the conclusions of this article will be made available by the authors on request.

Acknowledgments

Suzanne Lambooy and Yang Xu from Kunstmuseum, Den Haag (NL) are acknowledged for their support, their warm welcome at the museum, and the authorization to study the box inv. CG. 34-1931. Liu Hanwen from the Palace Museum, Beijing, is kindly acknowledged for many discussions and the collection of data used for comparison.

Conflicts of Interest

The authors declare no conflicts of interest.

References

  1. Chen, T.-H.; Colomban, P.; Chen, Y.-C.; Yu, P.-C.; Shih, C.-F. Non-invasive composition and Raman study of Kangxi Period glass-body enameled vase made with European technology. Herit. Sci. 2026; submitted.
  2. Curtis, E.B. Glass Exchange Between Europe and China, 1550–1800; Ashgate: Burlington, VT, USA, 2009. [Google Scholar]
  3. Bellemare, J.A. New Palette: Reassessing the Development of Enamel Colors in Early Eighteenth-Century China. J. Glass Stud. 2022, 64, 147–168. [Google Scholar]
  4. Landry-Deron, I. Mathematicians sent to China by Louis XIV in 1685. Arch. Hist. Exact Sci. 2001, 55, 423–463. (In French) [Google Scholar] [CrossRef] [Scilit]
  5. Landry-Deron, I. La contribution des missionnaires aux arts du feu à la cour de Pékin (XVIIe-XVIIIe siècles). Artifact. Tech. Hist. ET Sci. Hum. 2023, 18, 117–137. [Google Scholar] [CrossRef] [Scilit]
  6. Curtis, E.B. Chinese glass and the Vatican records. Trans. Orient. Ceram. Soc. 1992–1993, 57, 49–58. [Google Scholar]
  7. Curtis, E.B. European Contributions to the Chinese Glass of the Early Qing Period. J. Glass 1993, 35, 91–101. [Google Scholar]
  8. Chang, L.-S. Shilun Qinggon Huafalang gongyi fazhang shi 試論清宮畫琺瑯工藝發展史 (On the History of the Development of Painted Enamel Craftsmanship in the Qing Court). Natl. Palace Mus. Q. 1983, 17, 25–38. (In Chinese) [Google Scholar]
  9. Shih, C.-F. The Arrival of a New Colour Palette in Eighteenth-century Jingdezhen. In Le Secret des Couleurs, Céramiques de Chine et d’Europe du XVIIIe Siècle à Nos Jours; d’Abrigeon, P., Ed.; Fondation Baur-Musée des Arts d’Extrême Orient-5 Continents: Genève, Switzerland, 2022; pp. 21–59. [Google Scholar]
  10. Shih, C.-F. Re Yue Guan Ghua日月光華 (Radiant Luminance: Painted Enamelware from the Qing Court); National Palace Museum: Taipei, Taiwan, 2012; pp. 9–12. (In Chinese) [Google Scholar]
  11. du Halgouet, H. Mémoire, Pages Coloniales, Relations Maritimes de la Bretagne et de la Chine au XVIIIE Siècle, Letters from Canton; Société d‘histoire et d’archéologie de Bretagne: Rennes, France, 1934; pp. 331–441. Available online: https://www.shabretagne.com/document/article/2410/Pages-coloniales-Relations-maritimes-de-la-Bretagne-et-de-la-Chine-au-XVIIe-siecle-Lettres-de-Canton (accessed on 29 December 2025). (In French)
  12. Colomban, P. Trace the use of European recipes and/or ingredients in enameled objects: Strategy and first results. Artifact. Tech. Hist. ET Sci. Hum. 2023, 18, 161–193. (In French) [Google Scholar] [CrossRef] [Scilit]
  13. Colomban, P. The Quest for the Western Colors in China Under the Qing Emperors. Journal18 2024, 17, 7219. [Google Scholar]
  14. Colomban, P.; Zhang, Y.; Zhao, B. Non-invasive Raman analyses of huafalang and related porcelain wares. Searching for evidence for innovative pigment technologies. Ceram. Int. 2017, 43, 12079–12088. [Google Scholar] [CrossRef] [Scilit]
  15. Colomban, P.; Simsek Franci, G.; Gironda, M.; d’Abrigeon, P.; Schumacher, A.-C. pXRF Data Evaluation Methodology for On-Site Analysis of Precious Artifacts: Cobalt Used in the Blue Decoration of Qing Dynasty Overglazed Porcelain Enameled at Customs District (Guangzhou), Jingdezhen and Zaobanchu (Beijing) Workshops. Heritage 2022, 5, 1752–1778. [Google Scholar] [CrossRef] [Scilit]
  16. Colomban, P.; Gironda, M.; Simsek Franci, G.; d’Abrigeon, P. Distinguishing genuine imperial Qing dynasty porcelain from ancient replicas by on-site non-invasive XRF and Raman spectroscopy. Materials 2022, 15, 5747. [Google Scholar] [CrossRef] [Scilit]
  17. Available online: https://xrfcheck.bruker.com/InfoDepth (accessed on 5 May 2026).
  18. Simsek-Franci, G.; Colomban, P.; Chevalier, M.L. Nevers City Earthenware Blue Glaze: pXRF Categorization from Cobalt Sources and Raw Materials Impurities: Comparison of Reasoned and Chemometrics Methods. Materials 2026, 19, 2442. [Google Scholar] [CrossRef] [Scilit]
  19. Colomban, P.; Simsek Franci, G.; Gerken, M.; Gironda, M.; Mesqui, V. Non-Invasive On-Site XRF and Raman classification and dating of ancient ceramics: Application to 18th and 19th Century Meissen Porcelain (Saxony) and Comparison with Chinese Porcelain. Ceramics 2023, 6, 2178–2212. [Google Scholar] [CrossRef] [Scilit]
  20. Brereton, R. Principal Component Analysis: Standardisation. J. Chemom. 2025, 39, e3607. [Google Scholar] [CrossRef] [Scilit]
  21. Brereton, R.G. The normal distribution. J. Chemom. 2014, 28, 789–792. [Google Scholar] [CrossRef] [Scilit]
  22. Larson, R.; Farber, B. Elementary Statistics: Picturing the World, 5th ed.; Pearson Education Inc.: Boston, MA, USA, 2012. [Google Scholar]
  23. Colomban, P.; Simsek Franci, G.; Burlot, J.; Gallet, X.; Zhao, B.; Clais, J.-B. Non-Invasive On-Site pXRF Analysis of Coloring Agents, Marks and Enamels of Qing Imperial and Non-Imperial Porcelain. Ceramics 2023, 6, 447–474. [Google Scholar] [CrossRef] [Scilit]
  24. Colomban, P.; Gallet, X.; Simsek Franci, G.; Fournery, N.; Quette, B. Non-Invasive Raman Classification Comparison with pXRF of Monochrome and Related Qing Porcelains: Lead-Rich-, Lead-Poor-, and Alkali-Based Glazes. Materials 2024, 17, 3566. [Google Scholar] [CrossRef] [Scilit]
  25. Wood, N. Chinese Glazes: Their Origins, Chemistry, and Recreation; University of Pennsylvania Press: Philadelphia, PA, USA, 1999. [Google Scholar]
  26. Montanari, R.; Alberghina, M.F.; Schiavone, S.; Pelosi, C. The Jesuit painting Seminario in Japan: European Renaissance technology and its influence on Far Eastern art. X-Ray Spectrom. 2022, 51, 64–85. [Google Scholar] [CrossRef] [Scilit]
  27. Montanari, R.; Alberghina, M.F.; Municchia, A.C.; Massa, E.; Pelagotti, A.; Pelosi, C.; Schiavone, S.; Sodo, A. A polychrome Mukozuke (1624–1644) porcelain offers a new hypothesis on the introduction of European enameling technology in Japan. J. Cult. Herit. 2018, 32, 232–237. [Google Scholar] [CrossRef] [Scilit]
  28. Montanari, R.; Murakami, N.; Colomban, P.; Alberghina, M.F.; Pelosi, C.; Schiavone, S. European ceramic technology in the Far East: Enamels and pigments in Japanese art from the 16th to the 20th century and their reverse influence on China. Herit. Sci. 2020, 8, 48. [Google Scholar] [CrossRef] [Scilit]
  29. Sakellariou, K.; Miliani, C.; Morresi, A.; Ombelli, M. Spectroscopic investigation of yellow majolica glazes. J. Raman Spectrosc. 2004, 35, 61–67. [Google Scholar] [CrossRef] [Scilit]
  30. Botticelli, M.; Miliani, C.; Ravan, E.L.; Caliri, C.; Romano, F.P. Naples Yellow Revisited: Insights into Trades and Use in 17th-Century Sicily from the Macro X-ray Fluorescence Scanning of Matthias Stomer’s ‘The Mocking of Christ’. Heritage 2024, 7, 1188–1201. [Google Scholar] [CrossRef] [Scilit]
  31. Veronesi, U.; Bandiera, M.; Manso, M.; Ruivo, A.; Vilarigues, M.; Coentro, S. Naples yellow: Experimental re-working of historical recipes and the influence of the glazing process in the in situ analysis of historical artwork. Bol. Soc. Esp. Cerámica Vidr. 2023, 62, 558–570. [Google Scholar] [CrossRef] [Scilit]
  32. Padeletti, G.; Fermo, P. Significant findings concerning the production of Italian Renaissance lustred majolica. Appl. Phys. A 2013, 113, 825–833. [Google Scholar] [CrossRef] [Scilit]
  33. Zhu, J.; Duan, H.; Yang, Y.; Guan, L.; Xu, W.; Chen, D.; Zhang, J.; Wang, L.; Huang, Y.; Wang, C. Colouration mechanism of underglaze copper-red decoration porcelain (AD 13th–14th century), China. J. Synchrotron Radiat. 2014, 21, 751–755. (In Chinese) [Google Scholar] [CrossRef] [Scilit]
  34. Sciau, P.; Noé, L.; Colomban, P. Metal nanoparticles in contemporary potters’ master pieces: Lustre and red “pigeon blood” potteries as models to understand the ancient pottery. Ceram. Int. 2016, 42, 15349–15357. [Google Scholar] [CrossRef] [Scilit]
  35. Colomban, P. The use of metal nanoparticles to produce yellow, red and iridescent colour, from bronze age to present times in lustre pottery and glass: Solid state chemistry, spectroscopy and nanostructure. J. Nano Res. 2009, 8, 109–132. [Google Scholar] [CrossRef] [Scilit]
  36. Geyssant, J. Bernard Perrot (1640–1709), maître de la verrerie d’Orléans. Ses innovations dans le contexte verrier européen du XVIIe siècle. Sèvres. Rev. Société Amis Mus. Natl. Céramique 2014, 23, 30–43. (In French) [Google Scholar] [CrossRef] [Scilit]
  37. Colomban, P.; Kırmızı, B. Non-invasive on-site Raman study of polychrome and white enamelled glass artifacts in imitation of porcelain assigned to Bernard Perrot and his followers. J. Raman Spectrosc. 2020, 51, 133–146. [Google Scholar] [CrossRef] [Scilit]
  38. Wang, C.-P. Cong kexue fenxi wenxian huigu kan falangcai, yangcai yu fencai de fenlei yu mingming 從科學分析文獻回顧看琺瑯彩、洋彩與粉彩的分類與命名 (Nomenclature for Painted Enamel on Porcelain in Qing Dynasty: A Scientific Viewpoint). Gu Gong Xue Shu Ji Kan 故宮學術季刊 Natl. Palace Mus. Res. Q. 2012, 29, 115–155. (In Chinese) [Google Scholar]
  39. Colomban, P.; Tang, H.; Simsek-Franci, G. Non-Invasive Study of Gold Nanoparticles in Famille rose and Ruby-Back Qing Porcelain by Luminescence, Low-Wavenumber Raman Scattering and pXRF. Appl. Sci. 2025, 15, 12265. [Google Scholar] [CrossRef] [Scilit]
  40. Ricciardi, P.; Colomban, P.; Tournié, A.; Macchiarola, M.; Ayed, N. A non-invasive study of Roman Age mosaic glass tesserae by means of Raman spectroscopy. J. Archaeol. Sci. 2009, 36, 2551–2559. [Google Scholar] [CrossRef] [Scilit]
  41. Lahlil, S.; Biron, I.; Cotte, M.; Susini, J. New insight on the in situ crystallization of calcium antimonate opacified glass during the Roman period. Appl. Phys. A 2010, 100, 683–692. [Google Scholar] [CrossRef] [Scilit]
  42. Lawrence Berkeley National Laboratory, XRF Tables. Available online: https://xdb.lbl.gov/Section1/Table_1-2.pdf (accessed on 16 March 2026).
  43. Schaltegger, U. Hydrothermal zircon. Elements 2007, 3, 51–79. [Google Scholar] [CrossRef] [Scilit]
  44. Nardi, L.V.S.; Formoso, M.L.L.; Müller, I.F.; Fontana, E.; Jarvis, K.; Lamarão, C. Zircon/rock partition coefficients of REEs, Y, Th, U, Nb, and Ta in granitic rocks: Uses for provenance and mineral exploration purposes. Chem. Geol. 2013, 335, 1–7. [Google Scholar] [CrossRef] [Scilit]
  45. Yap, C.T. EDXRF studies on the variation in elemental concentrations of ceramic glazes. X-Ray Spectrom. 1989, 18, 31–34. [Google Scholar] [CrossRef] [Scilit]
  46. Leung, P.L.; Luo, H. A study of provenance and dating of ancient Chinese porcelain by x-ray fluorescence spectrometry. X-Ray Spectrom. 2000, 29, 34–38. [Google Scholar] [CrossRef]
  47. Bezur, A.; Casadio, F. The Analysis of Porcelain Using Handheld and Portable X-Ray Fluorescence Spectrometers. Handheld XRF for Art and Archaeology; Leuven University Press: Leuven, Belgium, 2013; pp. 249–312. [Google Scholar]
  48. Colomban, P.; Simsek Franci, G.; Chevalier, M.-L. Coloring of spun glass figurines attributed to Nevers. A huge variety of composition imposed by the preparation process. Heritage 2026, 9, 230. [Google Scholar] [CrossRef] [Scilit]
  49. Kissin, S.A. Five-element (Ni-Co-As-Ag-Bi) veins. Geosci. Can. 1992, 19, 113–124. [Google Scholar]
  50. Berrie, B.H. Mining for color: New blues, yellows, and translucent paint. Early Sci. Med. 2015, 20, 308–334. [Google Scholar] [CrossRef] [Scilit]
  51. Moskalyk, R.R.; Alfantazi, A.M. Review of present cobalt recovery practice. Min. Metall. Explor. 2000, 17, 205–216. [Google Scholar] [CrossRef] [Scilit]
  52. Roberts, S.; Gunn, G. Cobalt. Cobalt. In Critical Metals Handbook; Gunn, G., Ed.; John Wiley & Sons, Ltd.: Chichester, UK, 2014; pp. 122–149. [Google Scholar] [CrossRef] [Scilit]
  53. Mudd, G.M.; Weng, Z.; Jowitt, S.M.; Turnbull, I.D.; Graedel, T.E. Quantifying the recoverable resources of by-product metals: The case of cobalt. Ore Geol. Rev. 2013, 55, 87–98. [Google Scholar] [CrossRef] [Scilit]
  54. Hitzman, M.W.; Bookstrom, A.A.; Slack, J.F.; Zientek, M.L. Cobalt—Styles of Deposits and the Search for Primary Deposits; No. 2017–1155; US Geological Survey: Reston, VA, USA, 2017. [CrossRef] [Scilit]
  55. Colomban, P.; Kirmizi, B.; Simsek Franci, G. Cobalt and associated impurities in blue (and green) glass, glaze and enamel: Relationships between raw materials, processing, composition, phases and international trade. Minerals 2021, 11, 633. [Google Scholar] [CrossRef] [Scilit]
  56. Molera, J.; Climent-Font, A.; Garcia, G.; Pradell, T.; Vallcorba, O.; Zucchiatti, A. Experimental study of historical processing of cobalt arsenide ore for colouring glazes (15–16th century Europe). J. Archaeol. Sci. Rep. 2021, 36, 102797. [Google Scholar] [CrossRef] [Scilit]
  57. Čermáková, Z.; Hradil, D.; Míková, J.; Hradilová, J.; Rohanová, D. Co-glass and blue pigment smalt production at the turn of the 15th/16th centuries: LA-ICP-MS study. Archaeol. Anthropol. Sci. 2026, 18, 68. [Google Scholar] [CrossRef] [Scilit]
  58. Banda, W.; Morgan, N.; Eksteen, J.J. The role of slag modifiers on the selective recovery of cobalt and copper from waste smelter slag. Miner. Eng. 2002, 15, 899–907. [Google Scholar] [CrossRef] [Scilit]
  59. Gratuze, B.; Soulier, I.; Barrandon, J.N.; Foy, D. De l’origine du cobalt dans les verres (On the origin of cobalt in glass). Rev. D’archéométrie 1992, 16, 97–108. (In French) [Google Scholar] [CrossRef] [Scilit]
  60. Gratuze, B.; Soulier, I.; Blet, M.; Vallauri, L. De l’origine du cobalt: Du verre à la céramique (On the Origin of Cobalt: From Glass to Ceramics). Rev. d’Archéom. 1996, 20, 77–94. (In French) [Google Scholar] [CrossRef] [Scilit]
  61. Colomban, P. Decipher, Understand, and Compare the Enameling Techniques of Imperial Porcelain of the Qing Dynasty by Non-Invasive On-site Analysis. In Technical Studies of Asian Art: Proceedings of the Seventh Forbes Symposium at the Freer Gallery of Art, Proceedings of the Seventh Forbes Symposium on Scientific Research in the Field of Asian Art, Smithsonian National Museum of Asian Art, Washington, DC, USA, 9–11 June 2023; McCarthy, B., Giaccai, J., Clarke, M., Talbert, K., Eds.; Archetype Publications in association with the National Museum of Asian Art, Smithsonian Institution: London, UK, 2025; pp. 175–181. [Google Scholar]
  62. Liu, H.; Colomban, P.; Simsek-Franci, G.; Quette, B. Technological Categorization and Dating of Chinese cloisonné Enamelware. npj Herit. Sci. submitted.
  63. Wood, N. The influence of glass technology on Chinese ceramics. In Proceedings of the International Ceramic Fair & Seminar, London, UK, 15–18 June 2001; pp. 15–18. Available online: https://www.haughton.com/articles/2017/4/11/mcupv49cf16tki2bchxz7wfu7cpol6 (accessed on 5 May 2026).
  64. Ma, H.J.; Henderson, J.; Cui, J.F.; Chen, K.L. Glassmaking of the Qing Dynasty: A Review, New Data, and New Insights. Adv. Archaeom. 2020, 1, 27–35. [Google Scholar] [CrossRef] [Scilit]
  65. Norris, D.; Braekmans, D.; Shortland, A. Emulation and technological adaptation in late 18th-century cloisonné-style Chinese painted enamels. Archaeometry 2022, 64, 951–968. [Google Scholar] [CrossRef] [Scilit]
  66. Xue, S.; Maxwell, C.L. A pair of Qianlong imperial enamel-painted glass vases in the Corning Museum of Glass. Burlingt. Mag. 2020, 162, 832–839. [Google Scholar]
  67. Chari, C.S.; Taylor, Z.W.; Bezur, A.; Xie, S.; Faber, K.T. Nanoscale engineering of gold particles in 18th century Böttger lusters and glazes. Proc. Natl. Acad. Sci. USA 2022, 119, e2120753119. [Google Scholar] [CrossRef] [Scilit]
  68. Maggetti, M.; d’Albis, A. Phase and compositional analysis of a Sèvres soft paste porcelain plate from 1781, with a review of early porcelain techniques. Eur. J. Mineral. 2017, 29, 347–367. [Google Scholar] [CrossRef] [Scilit]
  69. Colomban, P.; Kırmızı, B.; Gougeon, C.; Gironda, M.; Cardinal, C. Pigments and glassy matrix of the 17th–18th century enamelled French watches: A non-invasive on-site Raman and pXRF study. J. Cult. Herit. 2020, 44, 1–14. [Google Scholar] [CrossRef] [Scilit]
  70. Liu, H.; Wang, H.; Zhang, R.; Qu, L. Differentiation and research on gold-red glaze for Qing dynasty painted enamel. Sci. Conserv. Archaeol. 2023, 35, 17–26. (In Chinese) [Google Scholar] [CrossRef]
  71. Colomban, P.; Robert, I.; Roche, C.; Sagon, G.; Milande, V. Identification des porcelaines «tendres» du 18e siècle par spectroscopie Raman: Saint-Cloud, Chantilly, Mennecy et Vincennes/Sèvres. Rev. D’archéométrie 2004, 28, 153–167. [Google Scholar] [CrossRef] [Scilit]
Figure 1. Box (left, diameter: 4.5 cm, inv. CG. 34-1931, here after #465, Kunstmuseum, Den Haag, NL, photo P. Colomban) and vase (right, height: 12.4 cm, inv. Guci 故瓷 17588, National Palace Museum, Taipei, TW, CC BY 4.0 @www.npm.gov.tw) with floral painted enamel decoration (see text and references for detailed information).
Ceramics 09 00098 g001
Figure 2. Measurement of the box (465) in air (Elio instrument).
Ceramics 09 00098 g002
Figure 3. Copper lidded dish with Western lotuses in painted enamels (inv. Gufa 故琺 377, National Palace Museum, Taipei, Taiwan, CC BY 4.0 @www.npm.gov.tw).
Ceramics 09 00098 g003
Figure 4. Representative XRF spectra (linear scale) recorded from areas of different colors, with the white area corresponding to the body of the objects and the other areas to the glazed regions for the vase ((a,b), measurement in primary vacuum at the laboratory) and the box ((c,d), measurement made in air with mobile instrument): C* and Rh* peaks correspond to Compton and rhodium source peaks, respectively.
Ceramics 09 00098 g004
Figure 5. XRF spectra (logarithmic scale) obtained from the box body (lid, (a): base, (b)) and from the white (c), yellow (d), blue ((e), mark; (f), floral motif), green-black (g), and brown (h) glazes of the box; see Figure 4 for label explanations.
Ceramics 09 00098 g005
Figure 6. XRF spectra (logarithmic scale) obtained from the body and from the blue, yellow, and pink areas of the vase; see Figure 4 for label explanations. The measured squared surfaces are shown.
Ceramics 09 00098 g006
Figure 7. Zoomed XRF vase spectra shown in Figure 6 (body, yellow, blue and pink) in the energy range where Sn and Sb peaks are expected (C*: Compton scattering; Rh*: Kα and Kβ peak of the rhodium source).
Ceramics 09 00098 g007
Figure 8. Comparison of characteristic fluorescence peak areas for Si, K, and Ca (a,b), Pb, K, and Ca (c,d) and Pb, Sn, and Sb (e,f), after normalization by the rhodium source signal (a,c), and after additional standardization using the z-score method (b,d), for the box (filled triangle) and the vase (filled circle). The colors of the analyzed areas correspond to the colors of the symbols used in the diagrams.
Ceramics 09 00098 g008
Figure 9. Y-Rb-Sr and Zr-Rb-Sr ternary diagrams of fluorescence peak areas after normalization by the rhodium source signal (a,c), and after additional z-score standardization (b,d), for the box (filled triangle) and the vase (filled circle). The colors of the analyzed areas correspond to the colors of the symbols used in the diagrams.
Ceramics 09 00098 g009
Figure 10. Comparison of the fluorescence characteristic peak areas for cobalt and Mn/As associated elements (a,b), cobalt-associated elements Fe, Mn, and As (c,d), and Bi, Ni, and As (e,f), after normalization by the rhodium source signal (a,c,e), and after additional standardization using the z-score method (b,d,f) for the box (filled triangle) and the vase (filled circle). Ellipses drawn here serve as a guide for eyes.
Ceramics 09 00098 g010
Figure 11. Comparison of the PCA score (a,c) and loading (b,d) plots calculated from data normalized by the rhodium signal ((a), with the corresponding loading plot in (b)) and from the same data additionally standardized by z-score method ((c), with the corresponding loading plot in (d)) for the box (465, filled circles; the filled circles are located within a triangle) and the vase (17588, filled circles). Data related to blue and white (enamel/body) are included within dashed triangle guides for visual reference.
Ceramics 09 00098 g011
Figure 12. Comparison of the characteristic fluorescence peak areas of raw material impurities with significant XRF intensities ((a): Y-Rb-Sr; (b): Zr-Rb-Sr) after normalization by the rhodium signal, measured in white (pink labels) and blue (blue labels) areas: filled triangle: box; filled circle: vase; open circle: imperial porcelain from the Musée national des arts asiatique-Guimet (Paris) collection [23]; cross: imperial porcelain from the Baur Foundation (Genova) collection [16]; open triangle: 18th century spun glass from the Nevers city collection [47]; ellipses indicate areas where data related to painted enameled Chinese [16], Meissen [19], and Saint-Cloud/Paris porcelain [19] are located.
Ceramics 09 00098 g012
Figure 13. Comparison of the characteristic fluorescence peak areas of raw material impurities with significant XRF intensities ((a): Y-Rb-Sr; (b): Zr-Rb-Sr) after normalization by the rhodium signal, measured on white (pink labels) and blue areas (blue label): filled triangle: box; filled circle: vase; open circle: cloisonnés enameled wares from the Musée des arts décoratifs (Paris) collection [62].
Ceramics 09 00098 g013
Figure 14. Comparison of the characteristic fluorescence peak areas of major elements ((a,c): Si-K-Ca; (b,d): Pb-K-Ca) after normalization by the rhodium signal, measured on white (pink labels) and blue areas (blue label): filled triangle: box; filled circle: vase; (a,b): comparison with enameled imperial porcelain: open circle: imperial porcelain from the Musée national des arts asiatique-Guimet collection [23]; cross: imperial porcelain from the Baur Foundation collection [16]; open triangle: 18th century spun glass from the Nevers city collection [18]; (c,d): cross: cloisonnés enameled wares from the Musée des arts décoratifs (Paris) collection [62]. Ellipses drawn here serve as guides for the eye.
Ceramics 09 00098 g014
Figure 15. Comparison of the characteristic fluorescence peak areas of elements associated with cobalt ((a): Fe-Mn-As) after normalization by the rhodium signal, measured on white (pink labels) and blue areas (blue label): filled triangle: box; filled circle: vase; (a) comparison with enameled imperial porcelain (open circle: porcelain from the Musée national des arts asiatique-Guimet collection [23]; cross: porcelain from the Baur Foundation collection [15,16]) and with 18th century French spun glass (open triangle) from the Nevers city collection [18]; (b) comparison with cloisonné enameled wares from the Musée des arts décoratifs (Paris) collection (cross) [61].
Ceramics 09 00098 g015
Figure 16. Comparison of the peak area of the Au Lα transition peak versus that of As Kβ, normalized by Rh signal for the brown/pink color of the vase (#17588) and the box (#465).
Ceramics 09 00098 g016
Figure 17. Comparison of the peak area of the Au Lα transition peak versus that of Sn Kα, normalized by the Rh signal for the brown/pink color of the vase (#17588) and the box (#465).
Ceramics 09 00098 g017
Figure 18. Comparison of the fluorescence peak areas of Pb Lβ and Si Kα measured for different enamels and the body of the vase (a) and the box (b). At least three firings at different temperatures had to be carried out to produce these objects (T3 < T2 < T1).
Ceramics 09 00098 g018
Table 1. Body composition of the vase determined by laboratory XRF [1], and pXRF peak areas measured for the vase and the box; n.m.: not measured. The most significant ratios are shown in bold.
OxideVase
(wt %)
[1]
Vase
Peak Area
(Counts)
[1]
Box
Peak Area
(Counts)
Vase/
Box
Peak Area
Ratio
B2O3n.m.nmn.m.nm
Fn.m.nmn.m.nm
Na2O0.88nmn.m.nm
MgO0.56nmn.m.nm
Al2O30.5Al: 14,272Al: 3891Al: 3.67
SiO268.53Si: 975,663Si: 60,275Si: 16.19
P2O50.18nmnmnm
Cl-nmnmnm
K2O18.95K: 491,865K: 330,531K:1.49
CaO7.76Ca: 265,828Ca: 211,338Ca: 1.26
TiO20.02Ti: 246Ti: 3755Ti: 0.06
MnO0.01Mn: 2029Mn: 1511Mn: 1.34
Fe2O30.14Fe: 31,793Fe: 18,003Fe: 1.76
CoO-Co: 134Co: 360Co: 0.37
CuO0.01Cu: 2411Cu: 2896Cu: 0.83
ZnO0.01Zn: 1814Zn: 1269Zn: 1.43
As2O32.38As: 275,152As: 61,000As: 4.51
SnO2--Sn: 11,440-
Sb2O3--Sb: 7171-
PbO0.04Pb: 13,547Pb: 71,713Pb: 0.19
Table 2. Main identification of characteristic elements and phases (-: not present or not detected, underlined: Raman spectroscopy, data available only for the vase).
MaterialBox
(inv. CG. 34-1931)
Expected
Coloring/
Opacifying
Phases
Vase
(inv. Guci
故瓷 17588)
Expected
Coloring/
Opacifying
Phases
White
body
Potash-lime (boron?) glass
Pb, As, Sn, Sb
Ca3(AsO4)2?
CaSb2O7?
CaSb2O6
Potash-lime (boron?) glass
No Pb, As
Ca3(AsO4)2?
CaSiO3
White enamelPb-rich glass
Sn, As and Bi,
SnO2-
bluePb-rich glass
Co, As, Sn, Cu, Ni
Co2+ ionsPb-rich glass
As, Cu, Ni
As-apatite
Co2+ ions
Blue markPb-glass
Co, As
Co2+ ions-
yellowPb-rich glass
Sb, Sn
PbSb2-xSnxO7Pb-rich glass
Sb, Sn
PbSb2-xSnxO7
(+PbSn2O4?)
redPb-poor glass
Cu
Cu° NPs-
pinkPb-rich glass
Cu, As, Sn
Cu° or Au° NPs?Au, AsAu° NPs
Plasmon
Brown to
purple
Pb-rich glass
Fe, Cu, Sb, Sn
Fe3+?, Cu2+?
PbSb2-xSnxO7
Au, AsAu° NPs
Plasmon
greenPb-rich glass
Cu, Sn
Cu2+ ionsPb-rich glass
Cu
Cu2+ ions
blackPb-rich glass
Mn, Fe
Spinel?-
Disclaimer/Publisher’s Note: The statements, opinions and data contained in all publications are solely those of the individual author(s) and contributor(s) and not of MDPI and/or the editor(s). MDPI and/or the editor(s) disclaim responsibility for any injury to people or property resulting from any ideas, methods, instructions or products referred to in the content.