3.1. Characterizations of MFI-Structured Zeolites in Basic Medium
The X-ray diffractograms of the MFI-structured zeolites synthesized from Aerosil
®200 and MPI silica at the studied crystallization times are shown in
Figure 1. The standard used is the zeolite synthesized with commercial silica Aerosil
®200. Zeolites synthesized with MPI silica were compared with this standard to calculate the relative crystallinity, considering the ZMP 3 d as 100%. It is observed that the synthesized materials are similar, confirming the crystal structure and characteristics of the MFI-structured zeolites. The reflections for calculating crystallinity were obtained in the 2θ range from 22.5 to 25°. The reflections correspond to the planes (501), (151), (051), and (303) in MFI-type structures [
20,
21,
22].
The results for the zeolites with MPI silica had lower crystallinity levels than ZMP 3 d, a characteristic behavior mainly when using natural materials. Thus, considering the optimization, the ideal synthesis condition in this work was 15 h, with a crystallinity of 86%. The crystallization time has an important influence on the synthesis of zeolites. Increasing synthesis time favors the formation of the MFI zeolite; however, in the long term, it will produce other undesirable crystalline phases [
23]. Variations in the crystallinity of materials at high synthesis times may occur because some of the crystals present may undergo dissolution and recrystallization processes [
24]. For the samples presented in
Figure 1, we did not observe such an effect because we can see that the relative crystallinity increases linearly over time. The intensity of the peaks increases with the Si/Al ratio. This phenomenon is in accordance with a higher structural order due to the increasing number of equal Si-O-Si bonds in tetrahedral positions, thus decreasing the average length of the T-O-T bond [
25].
The XRF data of the zeolites synthesized with Aerosil
®200 silica (ZMP 3 d) and MPI (ZM) are presented in
Table 4. The results indicate that the MFI-structured zeolites in the basic medium synthesized with MPI silica presented a similar composition to the main oxides obtained with ZMP 3 d, regardless of the crystallization time studied. The percentage variations would be associated with the characteristics of the alternative source of MPI silica.
The Si/Al molar ratios of ZM zeolites increase compared to zeolite with Aerosil
®200 silica, and, with the increasing crystallization time, variations in the Si/Al ratio occurred. MPI silica has a high percentage of silicon in its composition, which implies a high Si/Al ratio, which makes it suitable for the synthesis of MFI-structured zeolites that have a high Si/Al ratio, ranging from 15 to infinity. In this work, this ratio varied from 30.18 to 38.78, which is in the range of results found in the literature, such as those reported by Sivalingam and Sen, (2020) [
26], who obtained a Si/Al ratio of 32.24.
The main bands of MFI-structured zeolites in the basic medium sintered with Aerosil
®200 silica (ZMP 3 d) and MPI (ZM) at the times studied were identified by FTIR, as can be seen in
Figure 2. The band at 1632 cm
−1 is attributed to the stretching of the water molecule that was absorbed on the surface of the zeolite structure. The band at 1222 cm
−1 is related to the asymmetric bonds of siliceous materials in the T-O-T group of the TO4 tetrahedron. The bands at 1066 cm
−1 and 794 cm
−1 are attributed to the symmetric stretching of outer TOT bonds and the asymmetric stretching of inner TOT bonds, respectively. The band at 540 cm
−1 represents the vibrations from the deformation of the TO bond of the internal tetrahedral of SiO
4 and AlO
4, and the vibrations at 427 cm
−1 correspond to the asymmetric stretching of the two-membered rings (D5R) of the pentassyl structure of zeolites with an MFI structure and characteristics, which states the formation of its structure [
27,
28,
29,
30]. FTIR analysis thus suggests the successful formation of zeolites with MFI-type structures [
31].
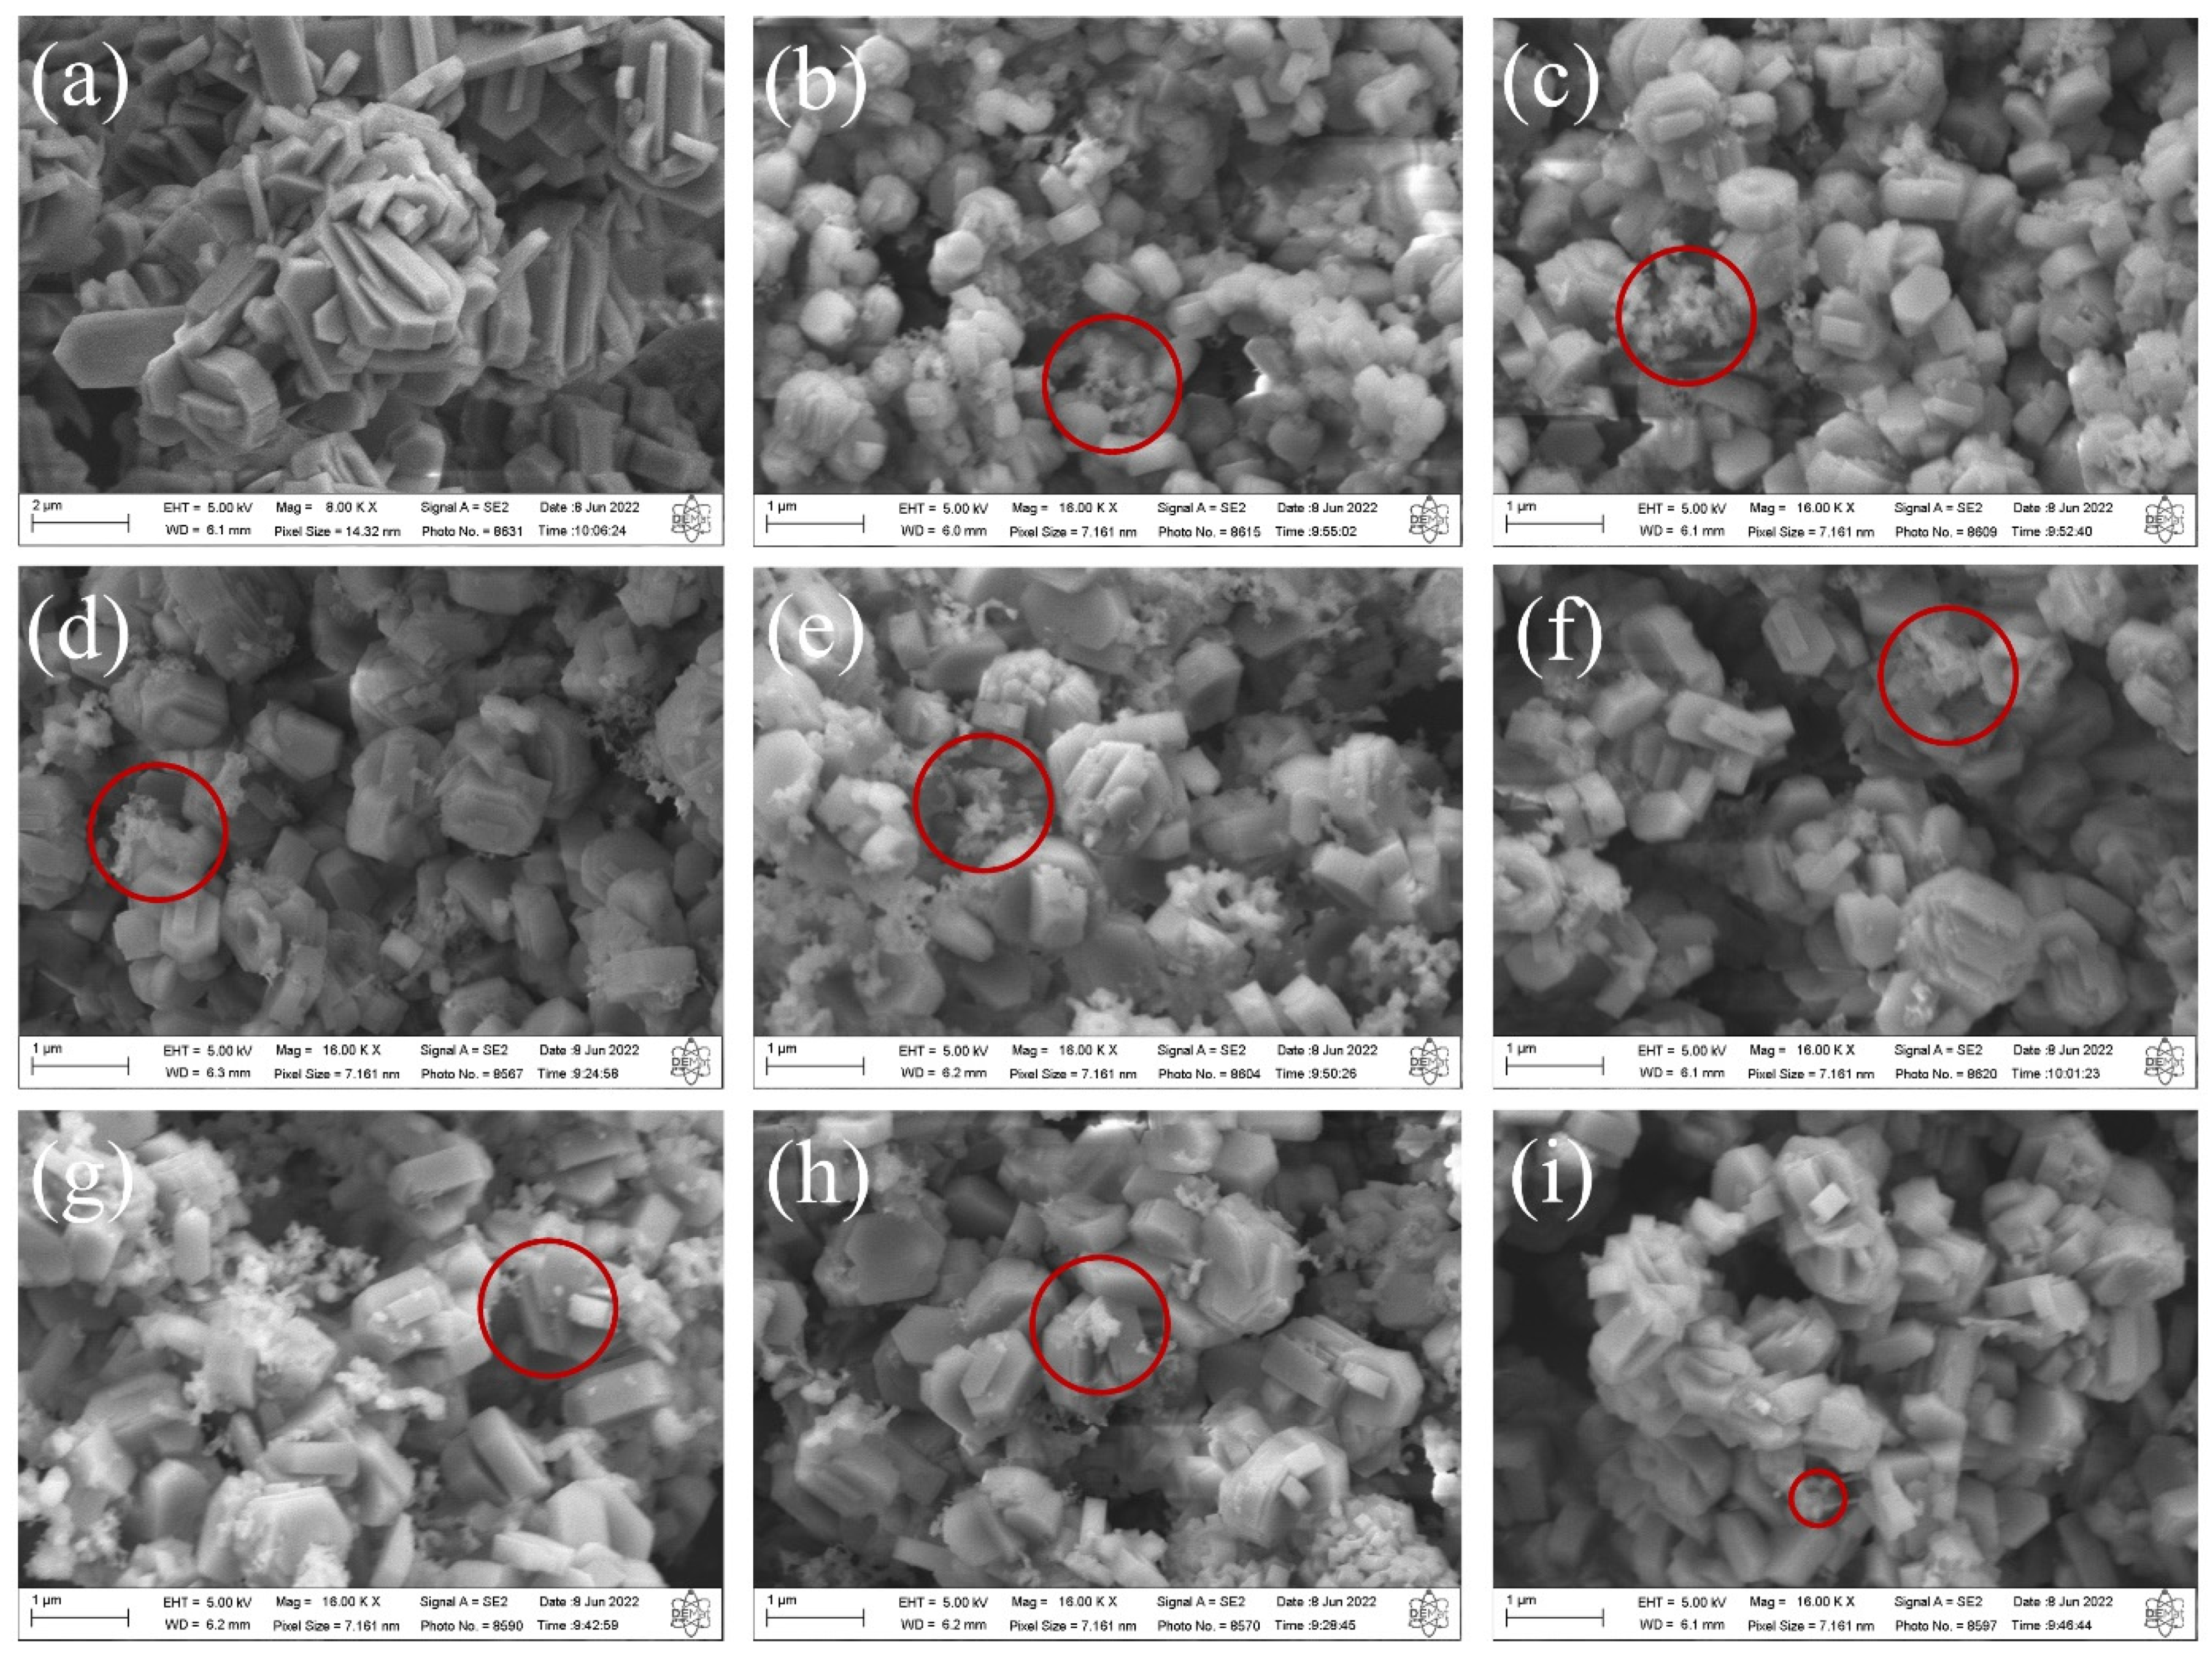
The SEM images of the synthesized MFI-structured zeolites in the basic medium are shown in
Figure 3. The results indicate that the zeolite synthesized with Aerosi
®200 (a) ZMP 3 d silica exhibits agglomerated hexagonal clintheriform crystals with miscellaneous particle size distribution. The zeolites obtained from MPI silica at the times studied, namely (b) ZM 7.5 h, (c) ZM 9.5 h, (d) ZM 10.5 h, (e) ZM 11.5 h, (f) ZM 12 h, (g) ZM 12.5 h, and (i) ZM 15 h, also exhibit crystals with agglomerated hexagonal clintheriform morphology with varying size distributions, being smaller than those synthesized with Aerosil
®200 silica [
24,
32]. Furthermore, it is possible to see clusters of amorphous silica (images highlighted in red micrographs of
Figure 3) with an irregular distribution that probably did not react during the synthesis or are the result of the dissolution of the tetrahedra of the zeolitic structure. The particle size does not change significantly with the extension of the crystallization time.
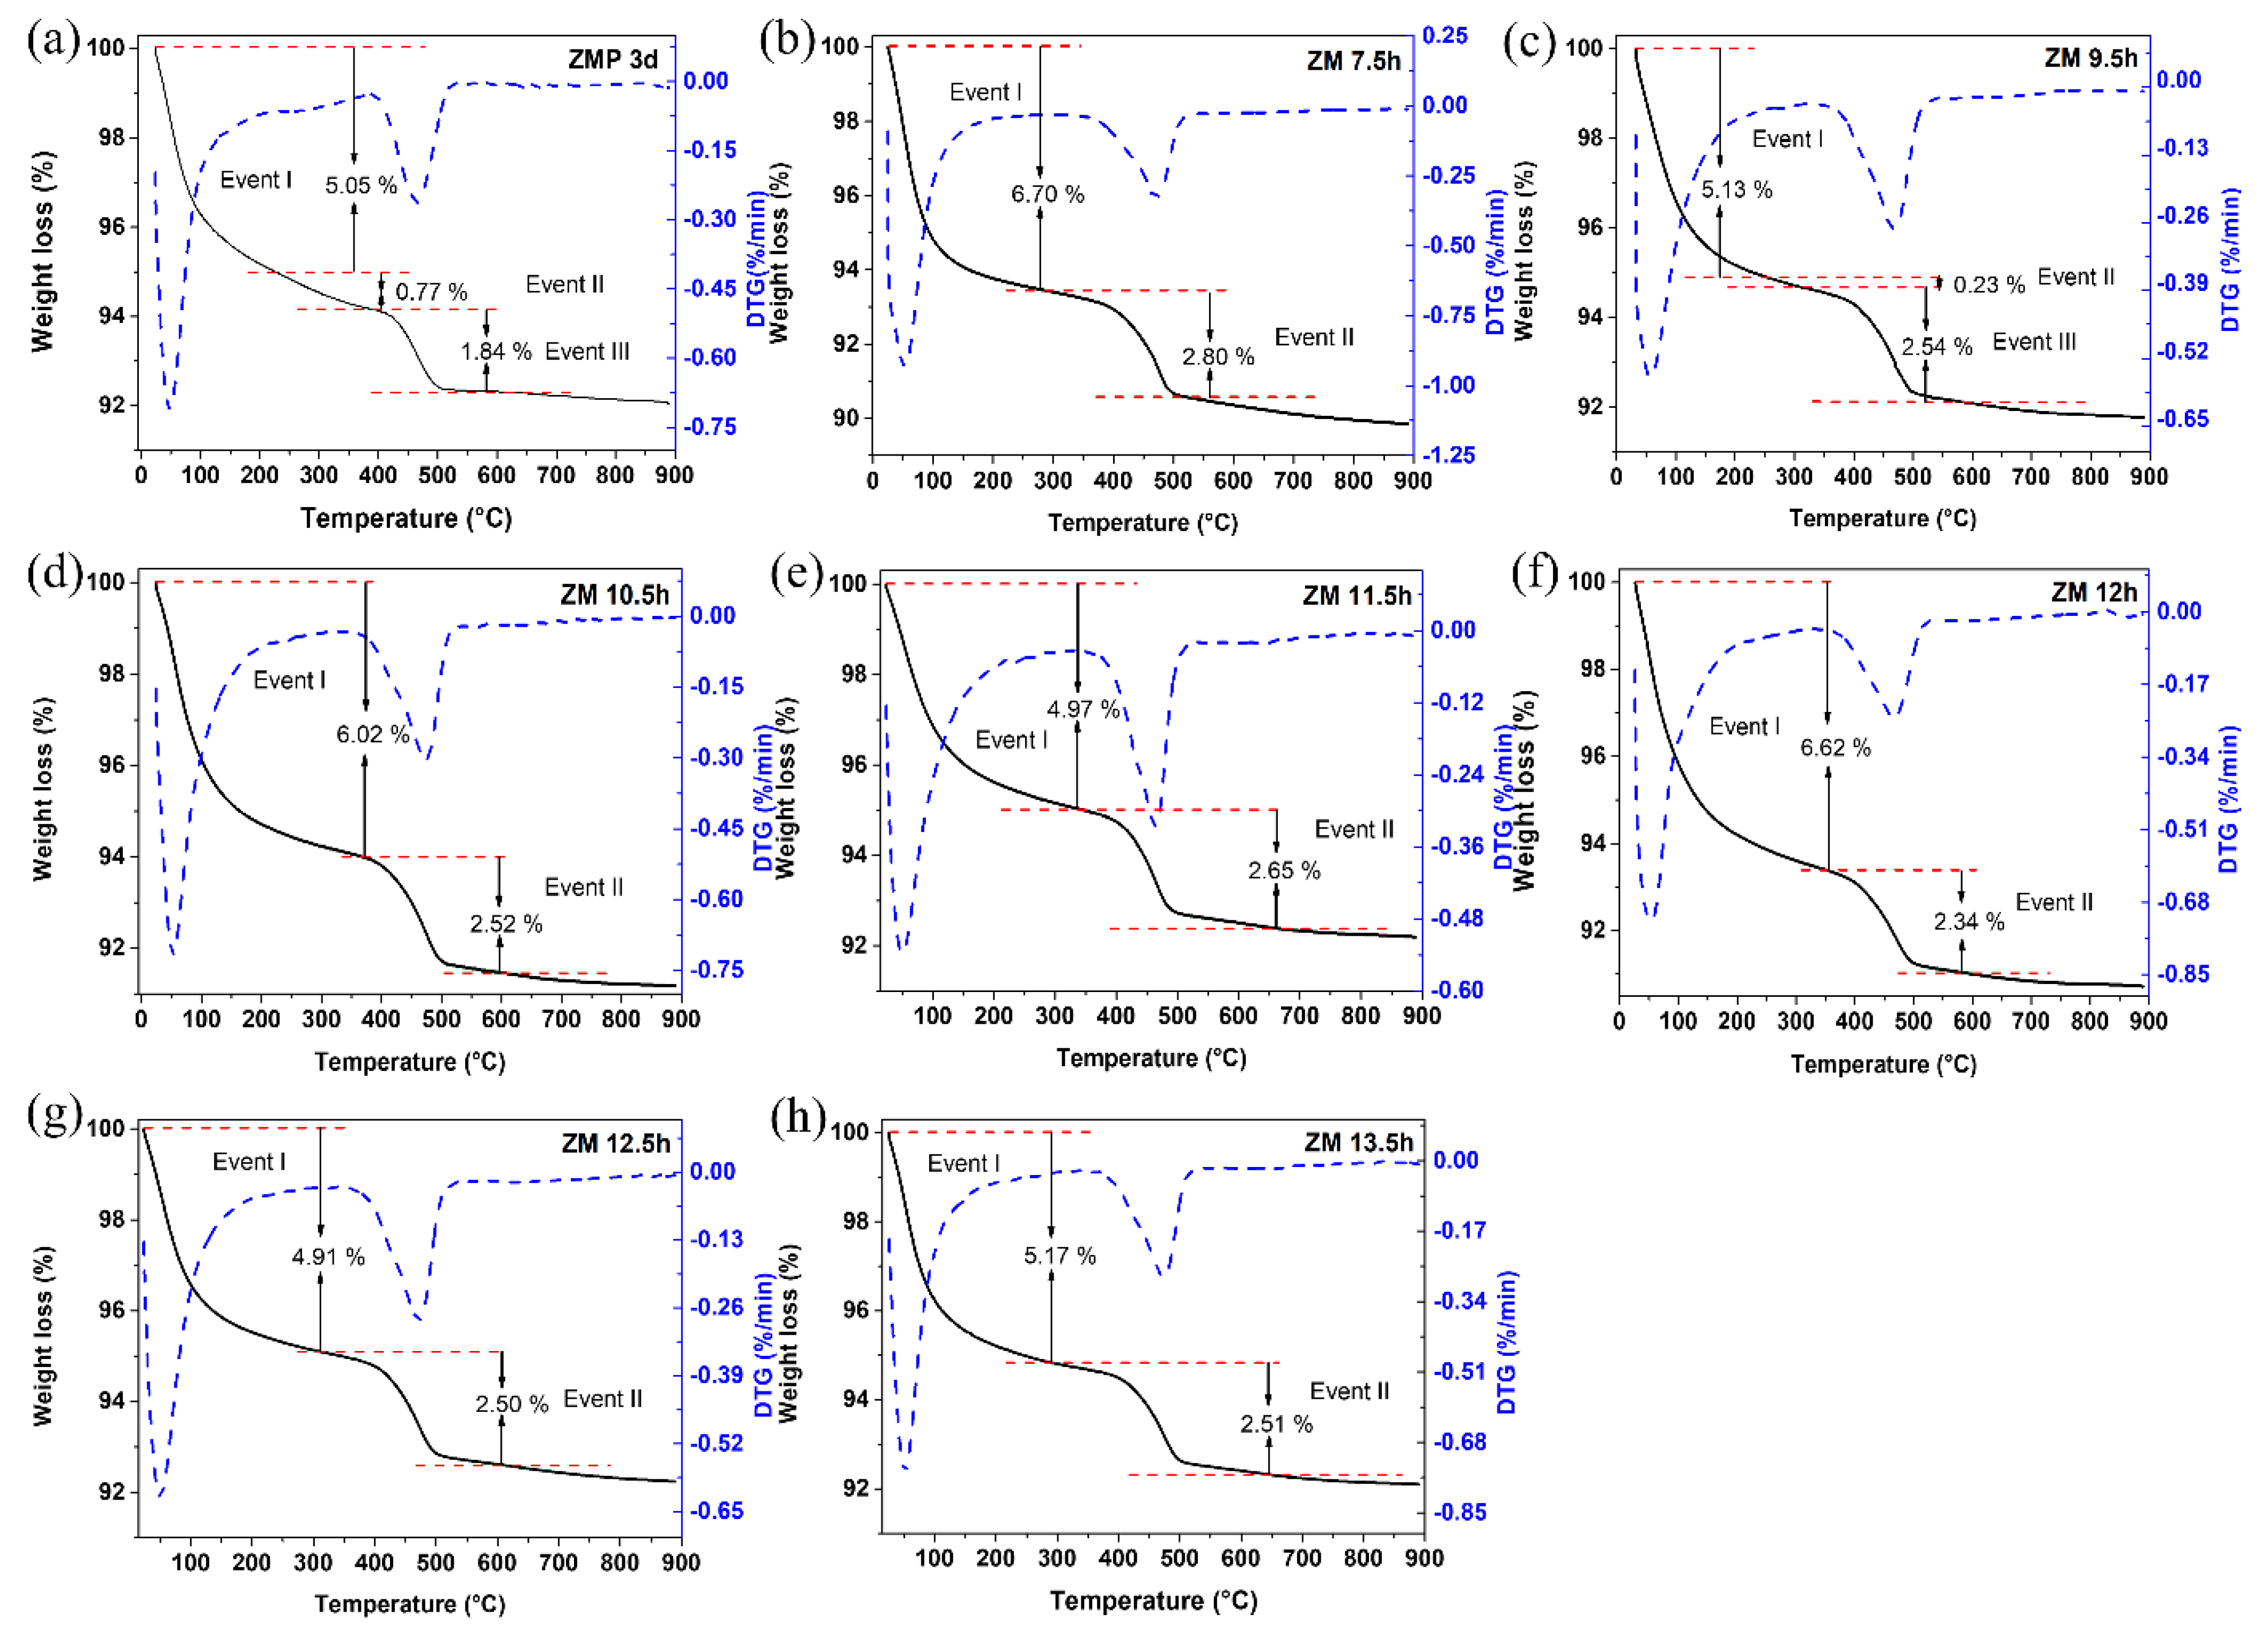
The results of the thermogravimetric and differential thermal curves of MFI-structured zeolites in the basic medium are presented in
Figure 4, (a) with Aerosil
®200 silica (ZMP 3 d) and with MPI silica, at different times, namely (b) ZM 7.5 h, (c) ZM 9.5 h, (d) ZM 10.5 h, (e) ZM 11.5 h, (f) ZM 12 h, and at times (g) ZM 12.5 h and (h) ZM 13.5 h. Two or three mass loss events can be observed in the gravimetric curves, which vary according to the synthesis time. For ZMP 3 d, we have the first event that occurs in the range of approximately 25 °C to 229 °C with a mass loss of 5.05%, corresponding to the desorption of H
2O. The second event is in the range of approximately 229 °C to 378 °C, with a mass loss of 0.77%, and the third event is in the range of 378 °C to 526 °C, with a mass loss of 1.84%, corresponding to the degradation of the organic director TPABr [
27]. Zeolites synthesized with MPI silica present similar events and mass losses to zeolites with Aerosil
®200 silica. These results indicate that calcination at 550 °C can eliminate TPABr from zeolites with an MFI structure [
33].
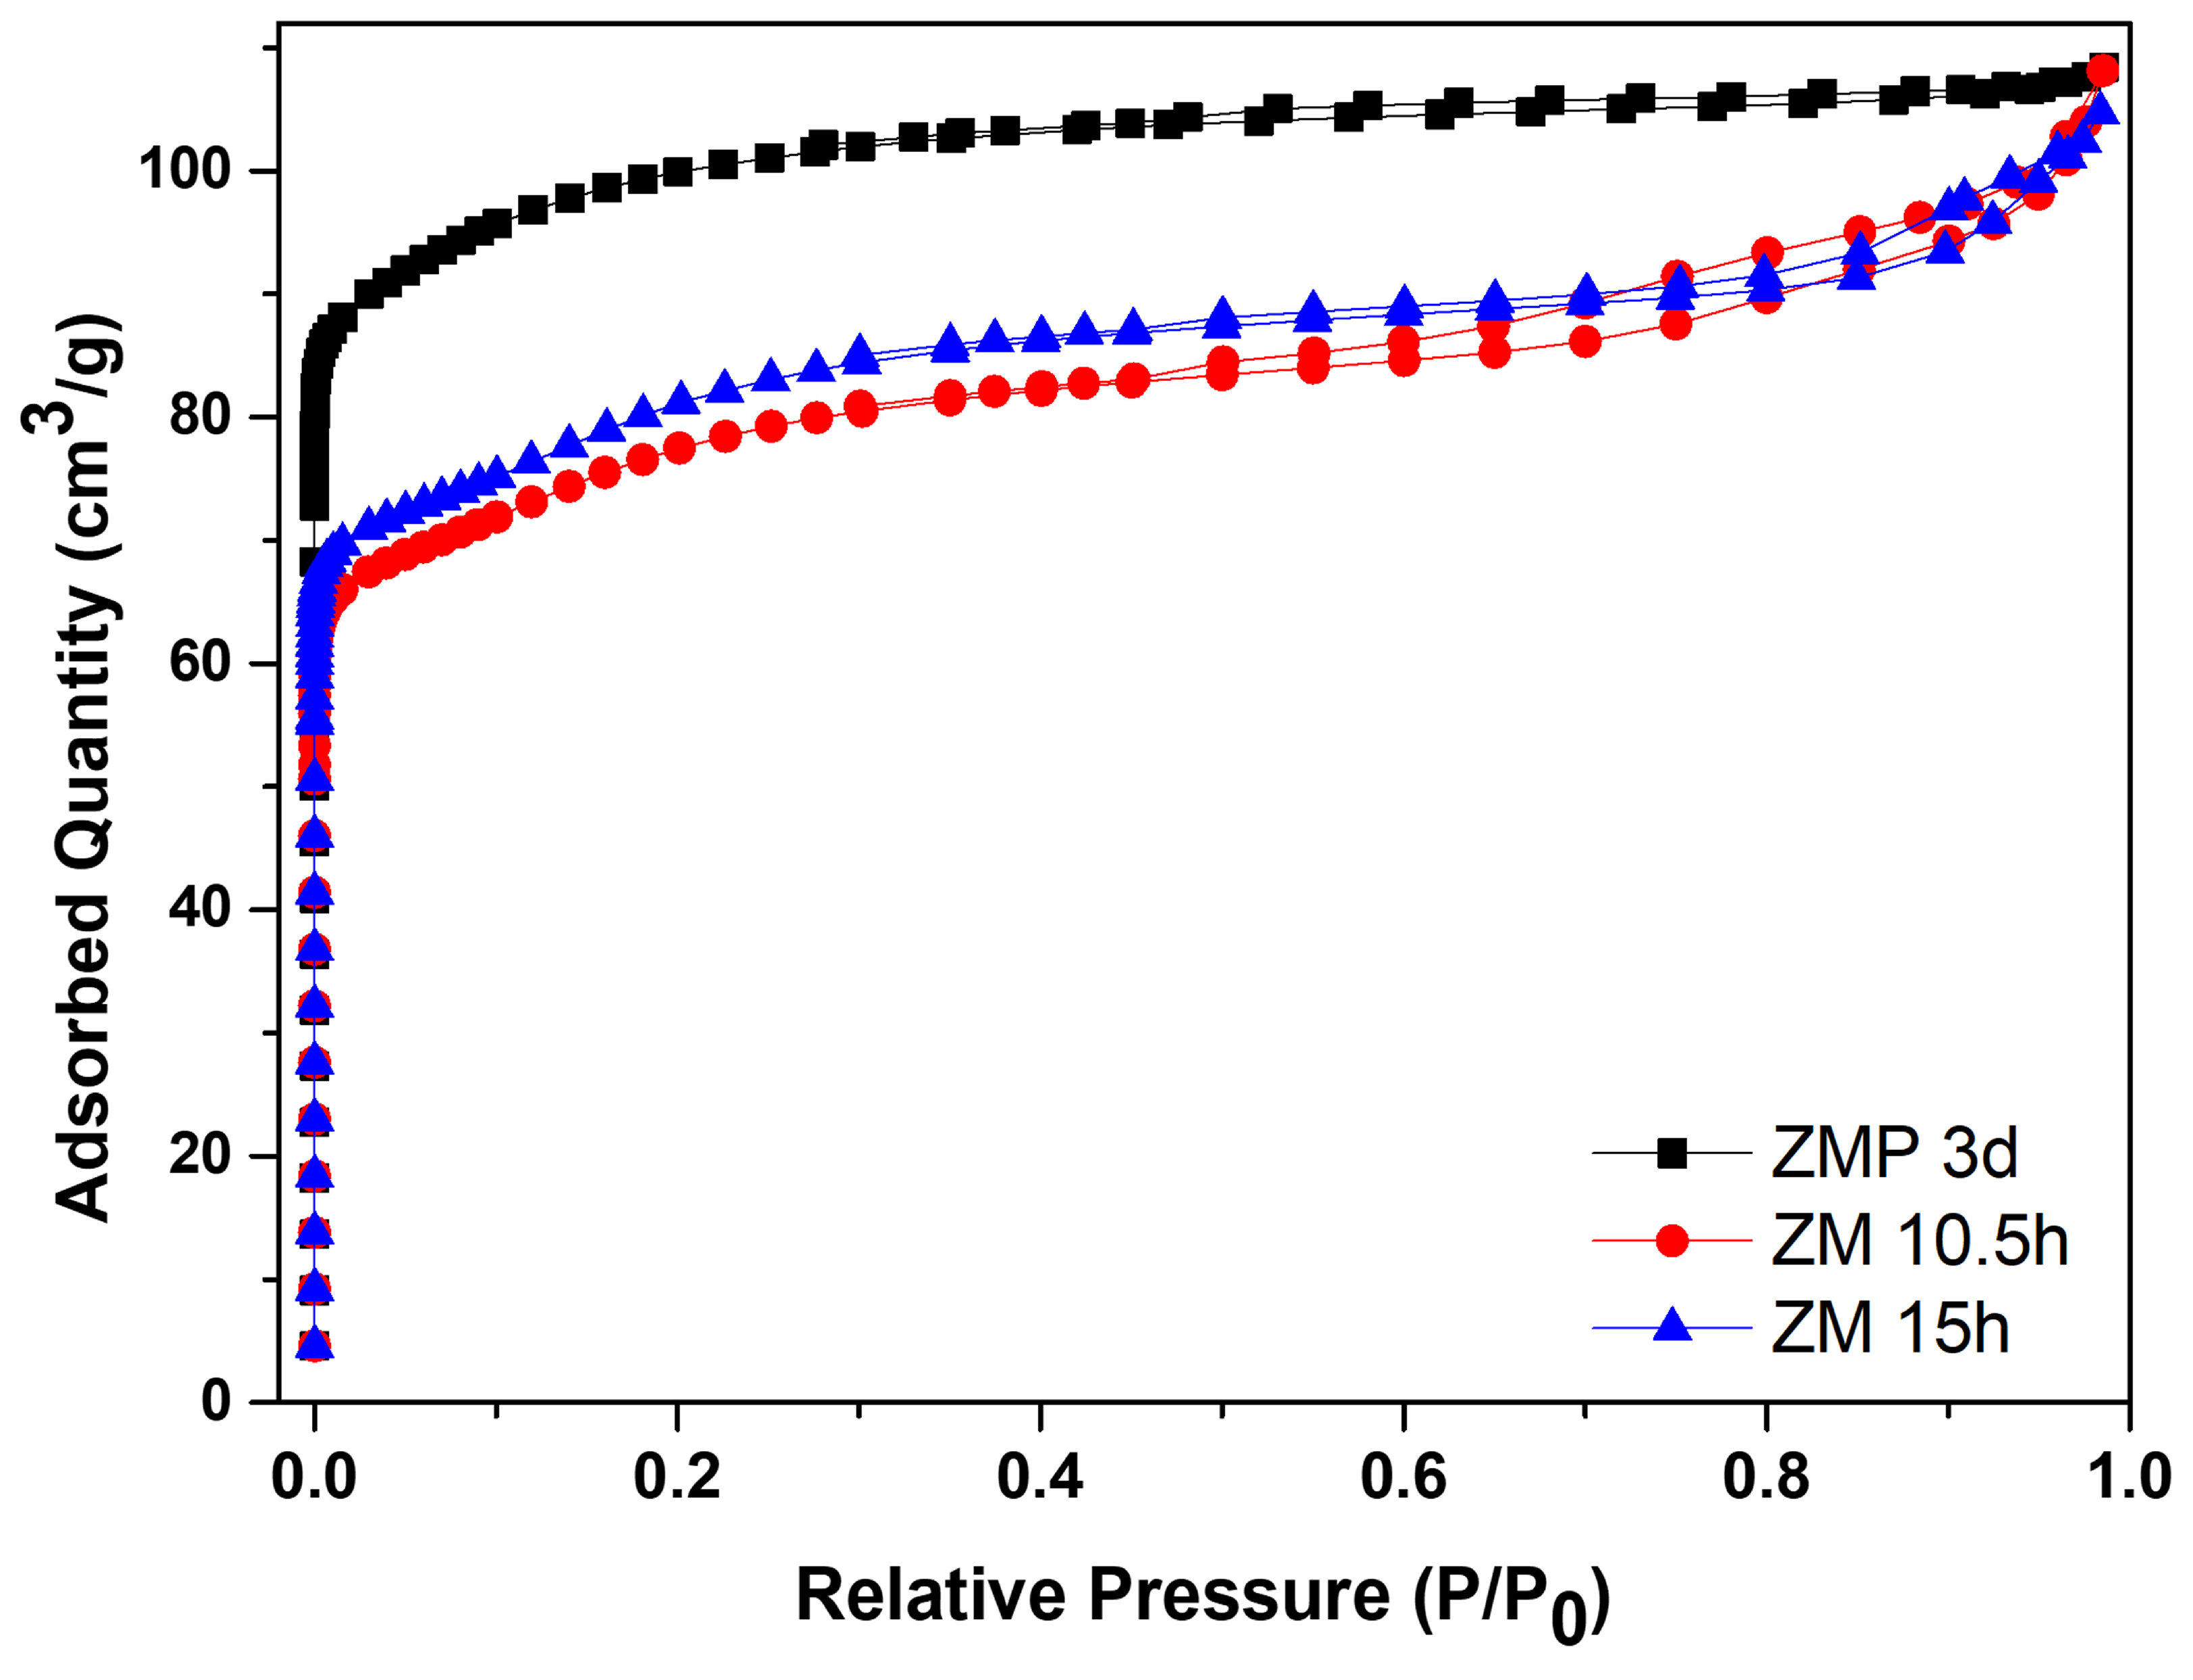
Figure 5 shows the N
2 adsorption/desorption isotherms for the zeolite with Aerosil
®200 silica, ZMP 3 d, and those synthesized with MPI silica, ZM 10.5 h and ZM 15 h.
Table 5 contains the textural parameters. The results show that the isotherms of the materials are a combination of type I and II that have micropore characteristics and a contribution of the external area and volume between particles (typical of porous or macroporous materials) [
34,
35,
36,
37]. Furthermore, the intercrystalline pores of zeolites can be formed through aggregates of nanometric zeolitic crystals. The intercrystalline mesopores may be formed via the aggregation of nanosized zeolite crystals [
38]. Another characteristic present in the isotherms is high N
2 adsorption at relatively low pressures, which can be attributed to the intrinsic micropores of the zeolites [
39].
The zeolite with Aerosil
®200 silica has a larger area of 380 m
2/g, a total volume of 0.168 cm
3/g, and micropores of 0.119 cm
3/g, which are larger than zeolites from MPI silica but have a smaller average pore diameter. The modification with silica directed the formation of mesopores, consequently causing a smaller micropore volume. The total pore volume remained almost constant, indicating that the modification did not change this parameter [
40]. Usually, when the crystallization of the zeolite exceeds the aging stage and enters the crystallized stage, the value of the specific micropore area is directly related to the crystallinity; this would be the reason for the more significant number of micropores of the ZMP 3 d zeolite, followed by the ZM 15 h zeolite [
41]. Comparing the zeolites from MPI silica, ZM 15 h had more significant textural parameters, except for the total pore volume, but was approximately the same. Therefore, these results of the textural parameters are consistent with the results obtained from the calculated crystallinity and phases observed in the XRD. The materials with higher percentages of more crystallinity present higher textural parameters.
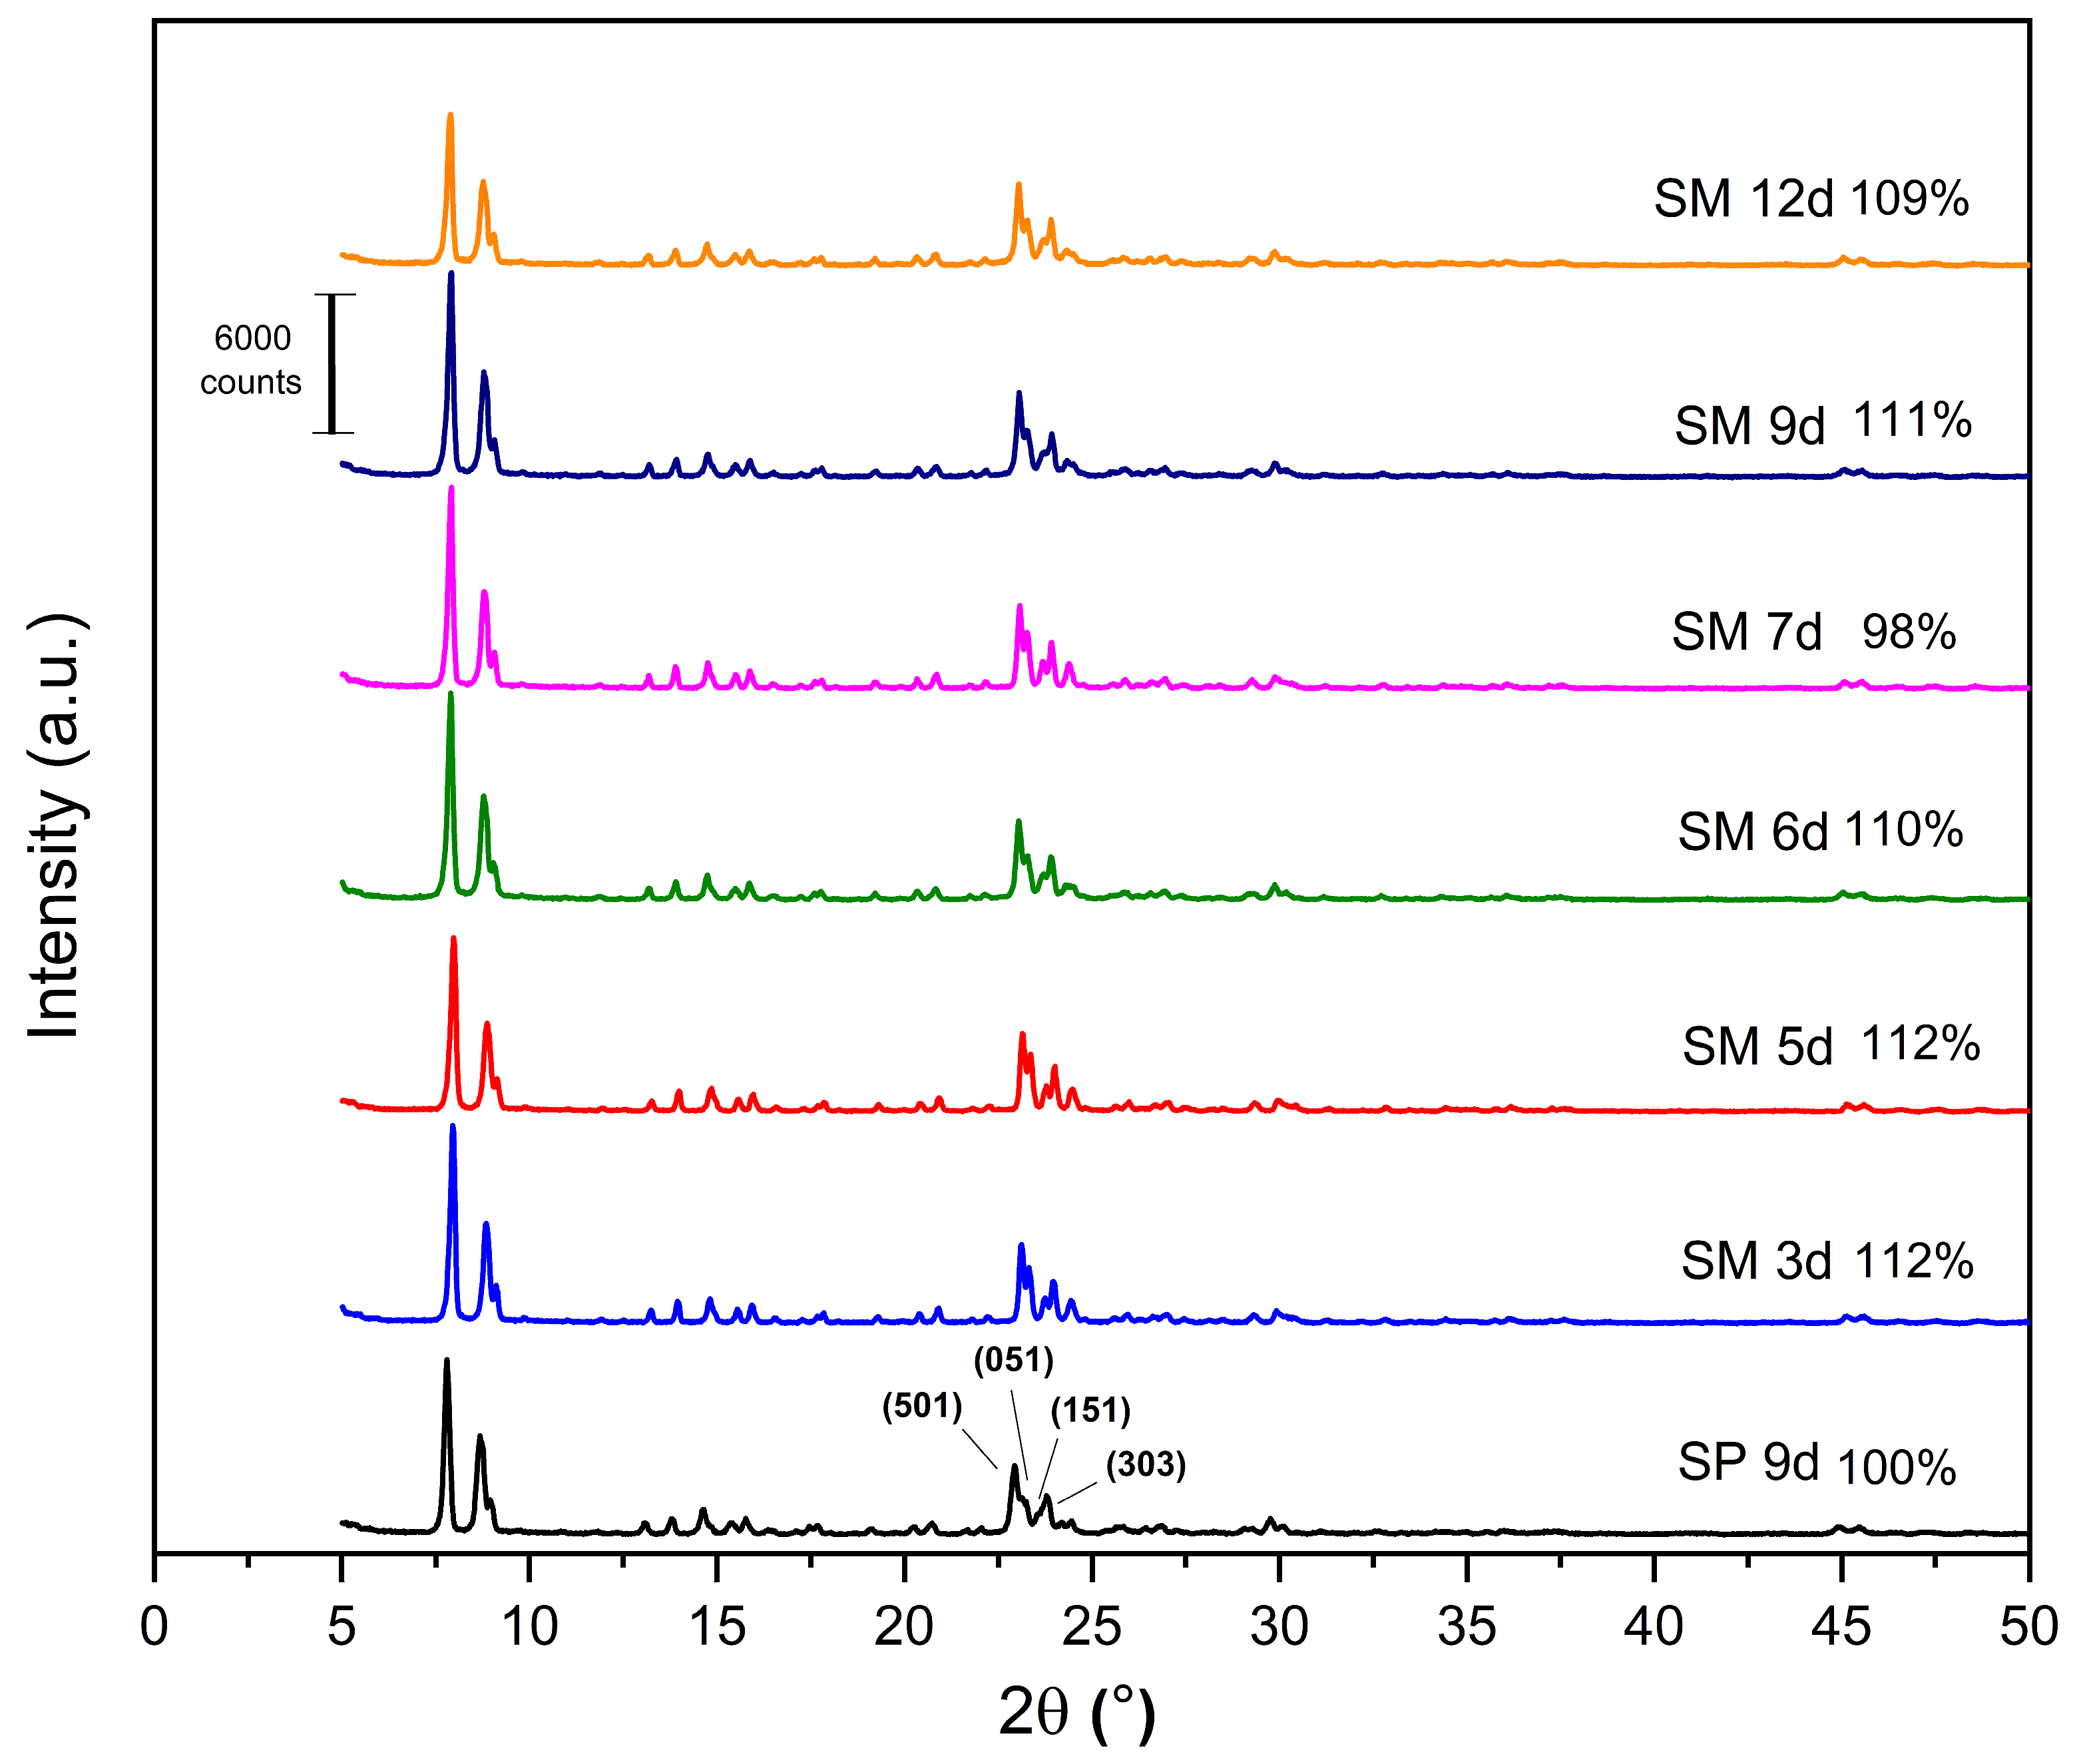
3.2. Characterizations of MFI-Structured Zeolites in Hydrofluoric Medium
The X-ray diffractograms of the MFI-structured zeolites synthesized from Aerosil
®200 and MPI silica are shown in
Figure 6, as well as the relative crystallinity, with SP 9 d taken as 100%. All the synthesized zeolites have the following reflections: 2θ = 7.80°, 8.86°, 14.64°, 22.93°, 23.79°, and 24.18°, which include the hkl planes (011), (200), (051), (501), (033), and (313), respectively, of the pentasil structure of MFI-type zeolites [
21,
24,
41,
42].
The results of the XRD patterns (
Figure 6) indicate that most of the zeolites with MPI silica had a higher relative crystallinity than SP 9 d, with the best result for the SM 5 d zeolite, which occurs mainly when natural zeolites are used. Considering the optimization of the synthesis parameters, the ideal condition was 3 days with a relative crystallinity of 112%. Over the synthesis time, there was an increase and decrease in crystallinity, probably due to the dissolution and crystallization of the crystals [
23]. This behavior was similar to the synthesis of zeolites with MFI structures in the basic medium.
The XRF analysis of silicalite with Aerosil
®200 silica (SP 9d) and zeolites with MFI structure in the hydrofluoric medium from MPI silica (SM) at the studied times are presented in
Table 6. The results indicate that the zeolites synthesized with MPI silica have compositional variations regarding those synthesized with standard silica, regardless of the crystallization time studied, but with a high percentage of silicon. The percentage variations would be associated with the characteristics of the alternative source of MPI silica. The Si/Al molar ratios of zeolites with MPI silica have higher average values than those in the basic medium.
The main groups of the silicalite synthesized with Aerosil
®200 silica (SP 9 d) and zeolites with MFI structures in the hydrofluoric medium from MPI silica (SM) were identified by FTIR, as can be seen in
Figure 7. The band at 1632 cm
−1 refers to the -OH bond of the water absorbed on the zeolite surface. The band at 1226 cm
−1 is attributed to the asymmetric stretching of the Si-O-Si bond of the external SiO
4 tetrahedron. The band at 1049 cm
−1 arises from the asymmetric stretching of the Si–O–Si bond of the internal SiO
4 tetrahedron. The band at 782 cm
−1 refers to the symmetric stretching of the Si–O–Si bond of the external SiO
4 tetrahedron. The band at 537 cm
−1 is attributed to the vibration of the double five ring (D5R) and is characteristic of the pentasil structure of MFI-structured zeolites in the hydrofluoric medium. The intensity of this band is useful to evaluate the stability and crystallinity of the obtained samples. Similar intensities suggest that the zeolites are similar in structure, stability, and crystallinity. The band at 405 cm
−1 refers to the vibration of the Si-O-Si bond [
43,
44,
45,
46,
47].
The SEM micrographs of silicalites synthesized with Aerosil
®200 silica (SP 9 d) and zeolites with MFI structures in the hydrofluoric medium from MPI silica (SM) are shown in
Figure 8. The results indicate that the zeolite (a) SP 9 d exhibits hexagonal elongated prismatic crystals [
10]. The zeolites with MFI structures with MPI silica at the studied times, namely (b) SM 3 d, (c) SM 6 d, (d) SM 9 d, and (e) SM 12 d, also exhibit crystals with a hexagonal prismatic morphology, but that are generally more rounded, that agglomerated with a varied size distribution, that have smaller particles than those synthesized with standard silica, and that have larger particles than those in the basic medium with MPI silica. A possible explanation for the morphological changes in MFI-type zeolites includes the characteristics of MPI silica, which also contain other elements in their composition, such as aluminum, and may have led to the formation of morphological characteristics more similar to those in the basic medium.
The differential thermogravimetric and thermal curves of silicalite (a) SP 9 d and zeolites with MFI structures in the hydrofluoric medium with MPI silica at different times, namely (b) SM 3 d, (c) SM 6 d, (d) SM 9 d and (e) SM 12 d, are shown in
Figure 9. Most zeolites have from one to up to three mass loss events. The results indicate an event in the range approximately from 288 °C to 639 °C with a mass loss of 12.81% that corresponds to the decomposition and combustion of the organic template TPAOH and the losses of fluoride. Some zeolites synthesized with MPI silica (SM 6 d, SM 9 d, and SM 12 d) presented a first event in the range of 25 °C to 155 °C with a mass loss in the range of 0.4% to 0.58% and an event in the range of 155 °C to 247 °C with a mass loss in the range of 0.7% to 1.57%, which can be attributed to the loss of free water and water present in the zeolitic structure, respectively [
10,
28,
33].
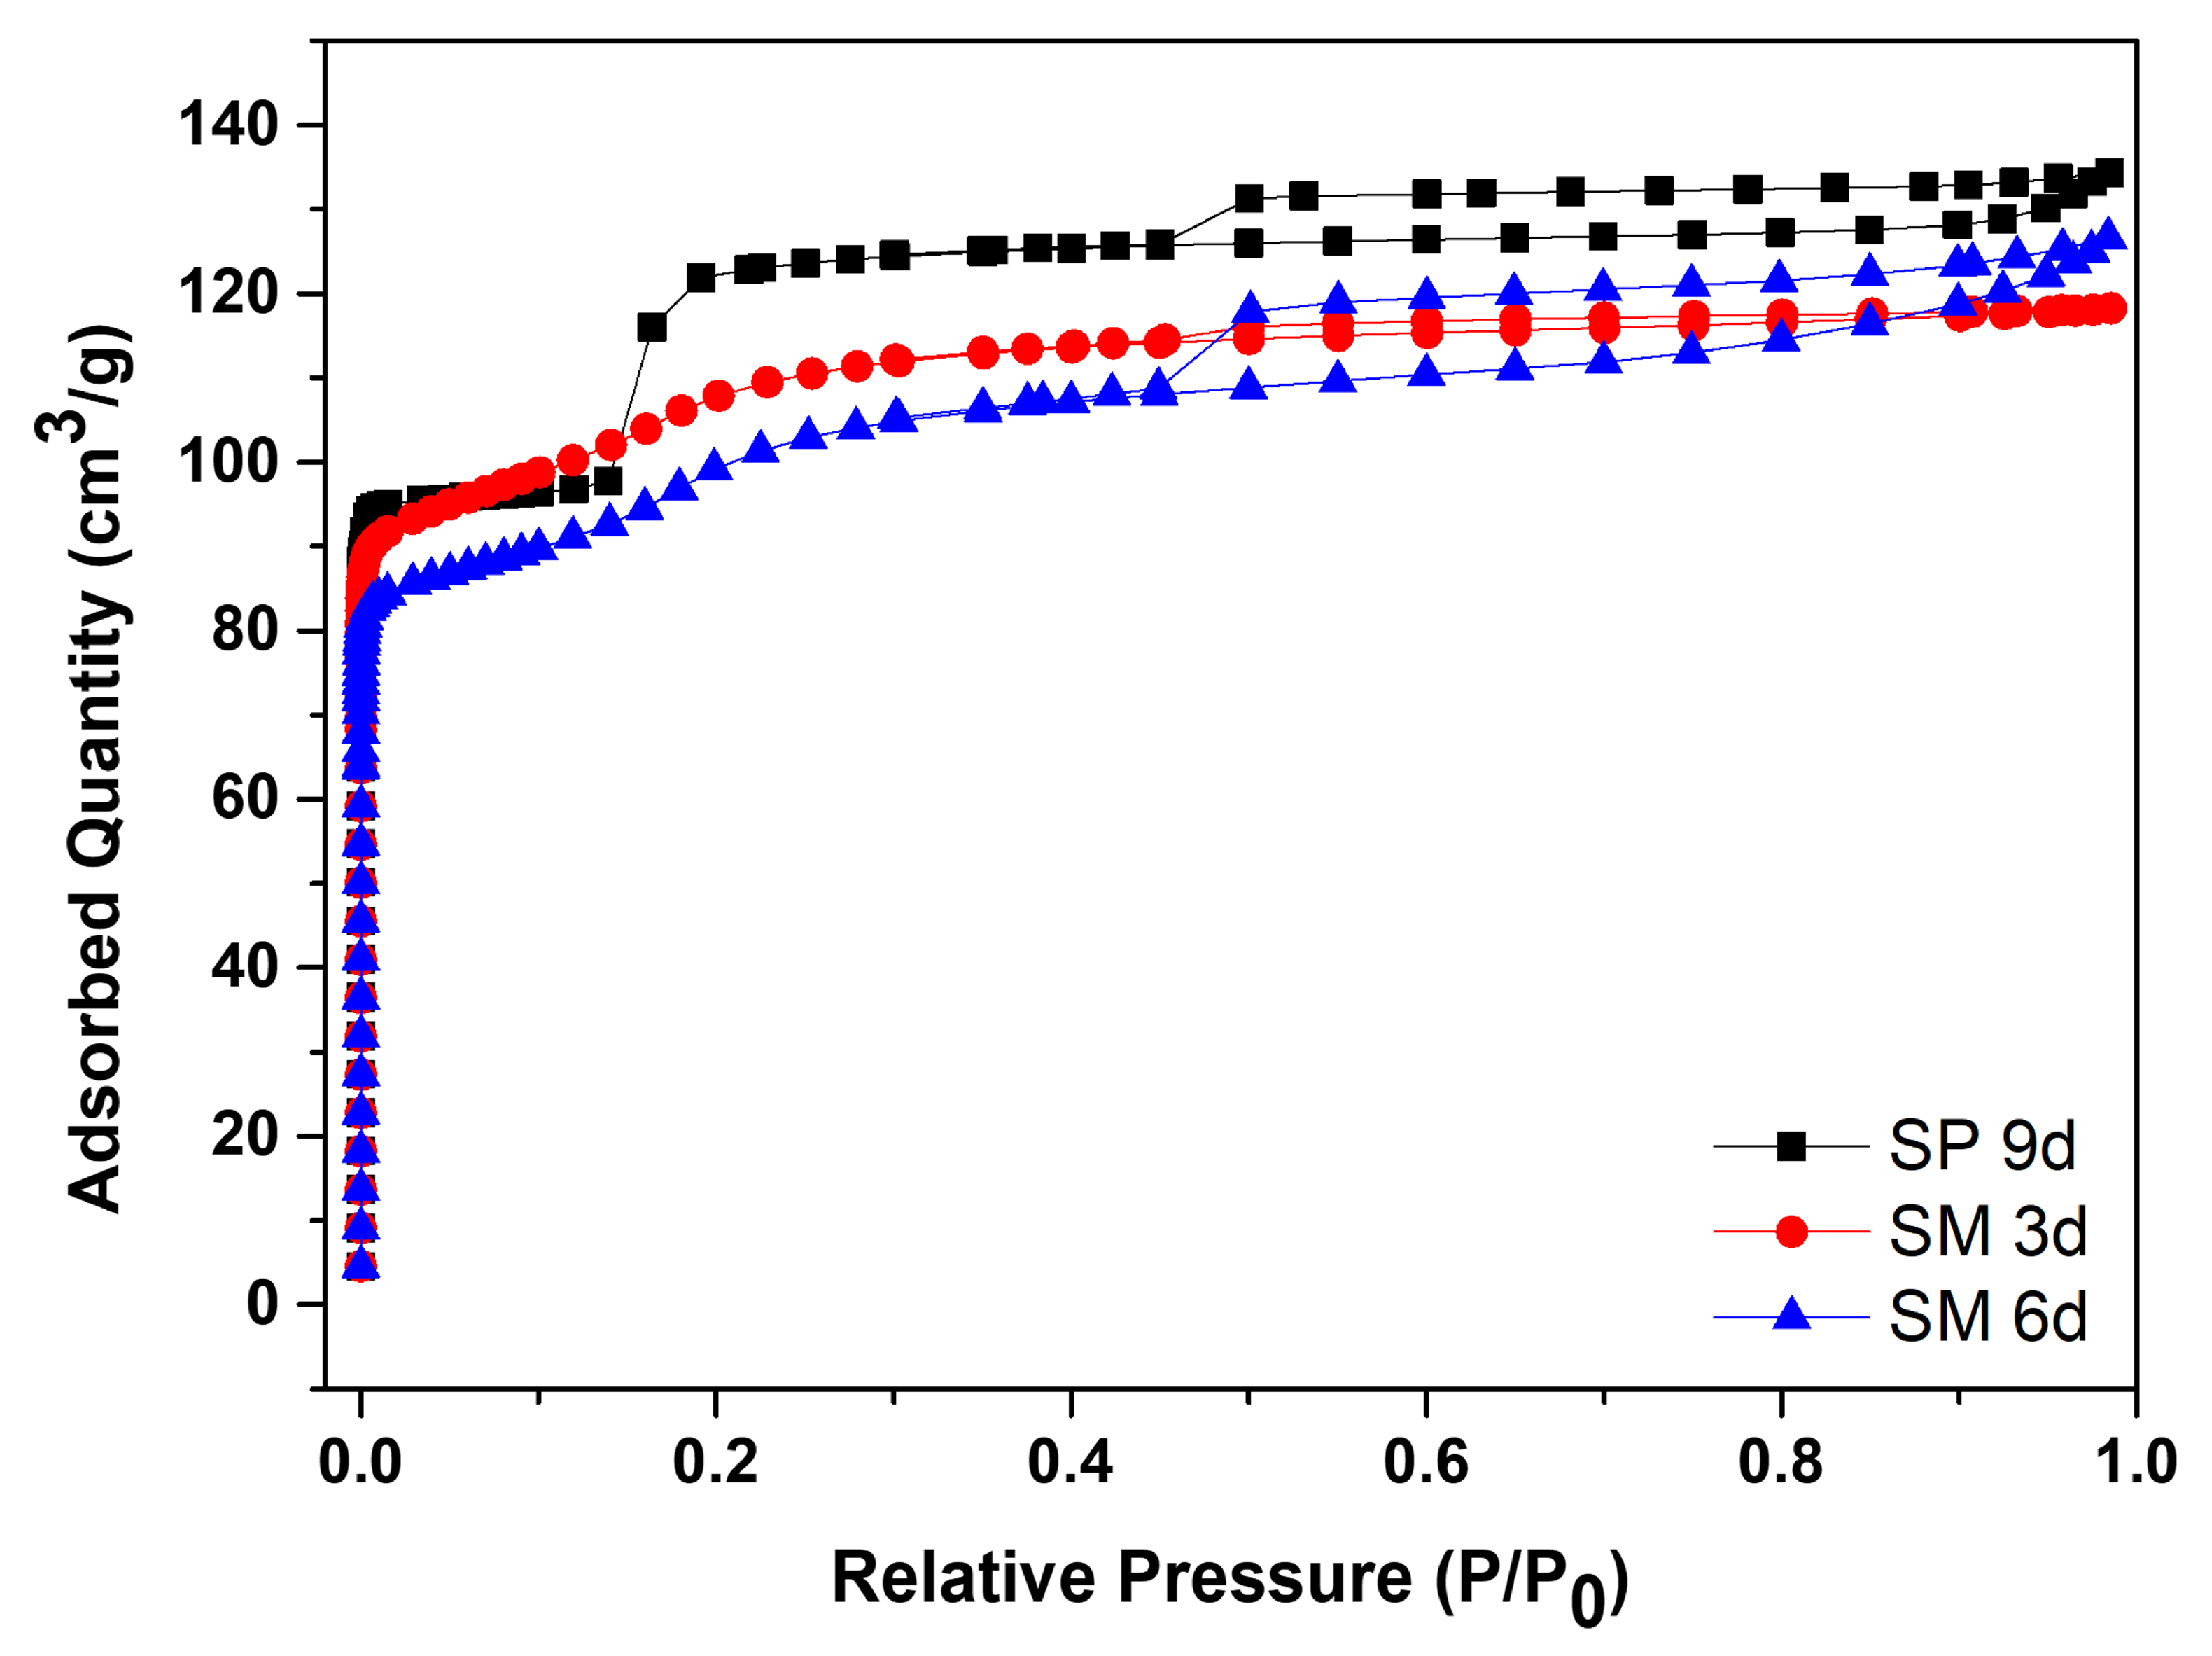
Figure 10 contains the N
2 adsorption/desorption isotherms for silicalite with Aerosil
®200 silica, SP 9 d, and MFI-structured zeolites in the hydrofluoric medium from MPI silica, namely SM 3 d and SM 6 d, and
Table 7 presents the textural parameters. The results show that the isotherms of the synthesized zeolites present a combination of type I and IV isotherms, which present narrow steps that are indicative of the microporous nature and capillary condensation of N
2 in the primary mesopores, possibly derived from the crystal grain boundaries [
48,
49,
50,
51].
The SP 9 d zeolite has a larger area of 407 m
2/g, a total pore volume of 0.208 cm
3/g, a micropore volume of 0.166 cm
3/g, and an average pore diameter of 0.467 nm, which are larger compared to zeolites with MPI silica. The modification with silica, as well as those synthesized in the basic medium, led to lower mesopore formation and micropore volume. The different crystallinity values, as observed in the MFI-structured zeolite in the basic medium, may have influenced the variations in the textural parameters. Comparing the MFI-type zeolites with MPI silica, SM 3 d had a larger area and average pore diameter than SM 6 d, but had a smaller total pore volume. This variation may be related to the time variation that implies the change in the textural parameters [
41].
From the characterization results, the materials synthesized with MPI silica have similar characteristics, so the main results will be used.
3.3. Application of Zeolitic Materials in CO2 Capture
Figure 11a shows the isotherms for the MFI-structured zeolite with Aerosil
®200 silica and MPI silica. The results indicate that ZMP 3 d obtained an adsorption level of 3.72 mmol/g of CO
2, which was higher compared to ZM 15 h, with 3.22 mmol/g of CO
2 and ZM 10.5 h, with 3.10 mmol/g of CO
2.
Figure 11b contains isotherms for silicalite and the MFI-structured zeolites from MPI silica. The SP 9 d zeolite had an adsorption level of 3.94 mmol/g of CO
2, which was higher compared to zeolites SM 3 d, with 3.78 mmol/g of CO
2 and SM 6 d, with 3.60 mmol/g of CO
2. The starting material, MPI silica, showed the lowest adsorption capacity of 2.29 mmol/g CO
2, indicating the advantage of using zeolites for CO
2 adsorption. All adsorption curves showed type I isotherms, according to the IUPAC classification [
52,
53].
In the
Supplementary Materials,
Tables S1 and S2 show the results obtained regarding the CO
2 adsorption capacity of materials at low pressures of up to 20 KPa and the maximum pressure reached, 1000 kPa, at a temperature of 23 °C.
Table 8 shows some of the materials in the literature used for CO
2 capture with their respective adsorptive capacities. Some of the results found are inferior, similar, or better compared to those obtained in this work. On the other hand, this work uses a low-cost source that causes modifications in the characteristics of the studied zeolites, as observed in the morphology, which can be explored and modified to improve the CO
2 adsorptive capacity of these materials.
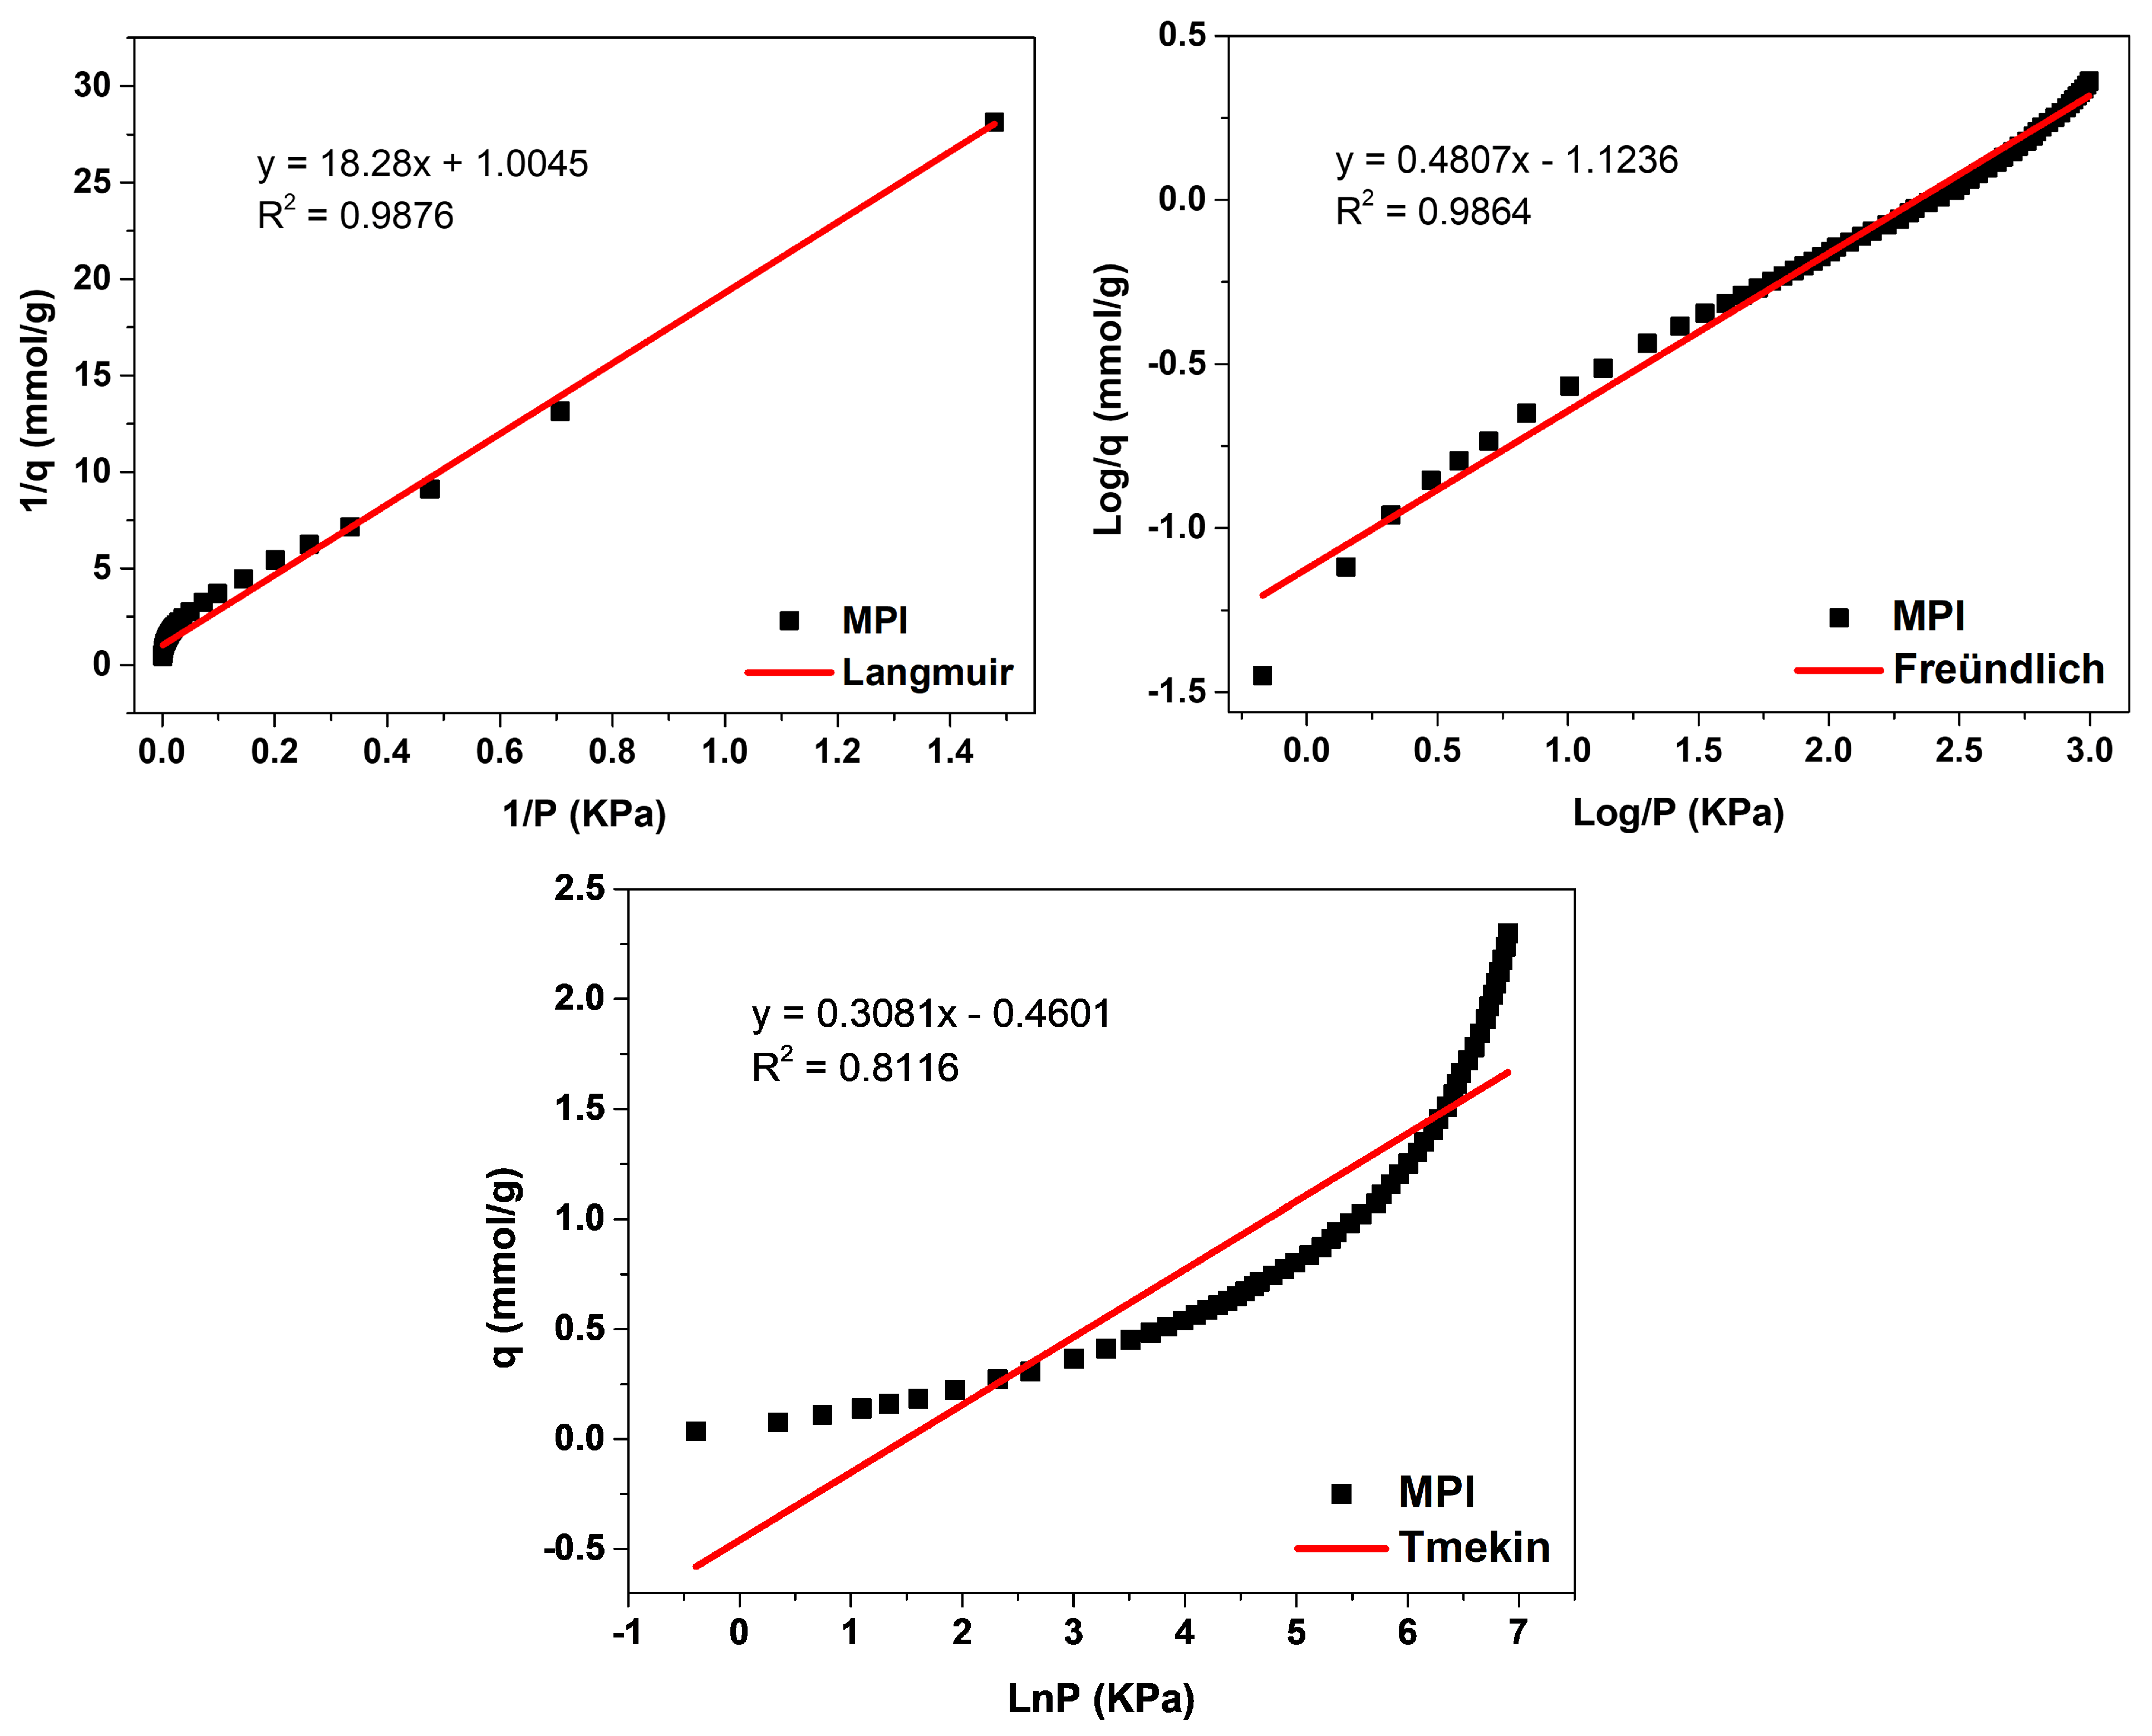
The evaluation of the adsorption mechanisms involving the adsorbent and adsorbate was obtained from the adjustments of the Langmuir, Freündlich, and Temkin linear mathematical models, shown in
Figure 12,
Figure 13 and
Figure 14.
Table 9 presents the parameters obtained. The results indicate that the highest adsorptive capacities of each type of adsorbent (qm) were for those synthesized with Aerosil
®200 silica 2.56 mmol/g CO
2 (ZMP 3 d) and 3.79 mmol/g CO
2 (SP 9 d). Regarding those synthesized with MPI silica, the best result was for SM 3 d, with a capacity of 2.23 mmol/g CO
2 and ZM 15 h, with a capacity of 1.87 mmol/g CO
2. MPI silica had the lowest adsorption capacity, with 0.99 mmol/g CO
2. All synthesized materials have the separation factor R
L between 0 and 1, indicating that they are favorable to CO
2 adsorptive processes.
MPI silica,
Figure 12, obtained the best fit for the Langmuir model, with a correlation coefficient of R
2 = 0.9876, meaning that the predominant adsorption mechanism has a homogeneous distribution on the surface. Monolayer adsorption contributes to a restricted amount of adsorbent sites that are energetically equivalent. Furthermore, there is no interaction between the adsorbed molecules [
12,
13]. The Freündlich model was the second-best fit, with a correction coefficient of R
2 = 0.9864, higher K
F values indicate a greater affinity for an adsorbate and a specific temperature. The value of 1/n was greater than 0 and less than 1 (0 < 1/n < 1), indicating that the adsorptive process involved is favorable, which is in agreement with the results of the separation factor R
L [
17,
18]. The MPI silica did not fit the Temkin model, with a coefficient of R
2 = 0.8116
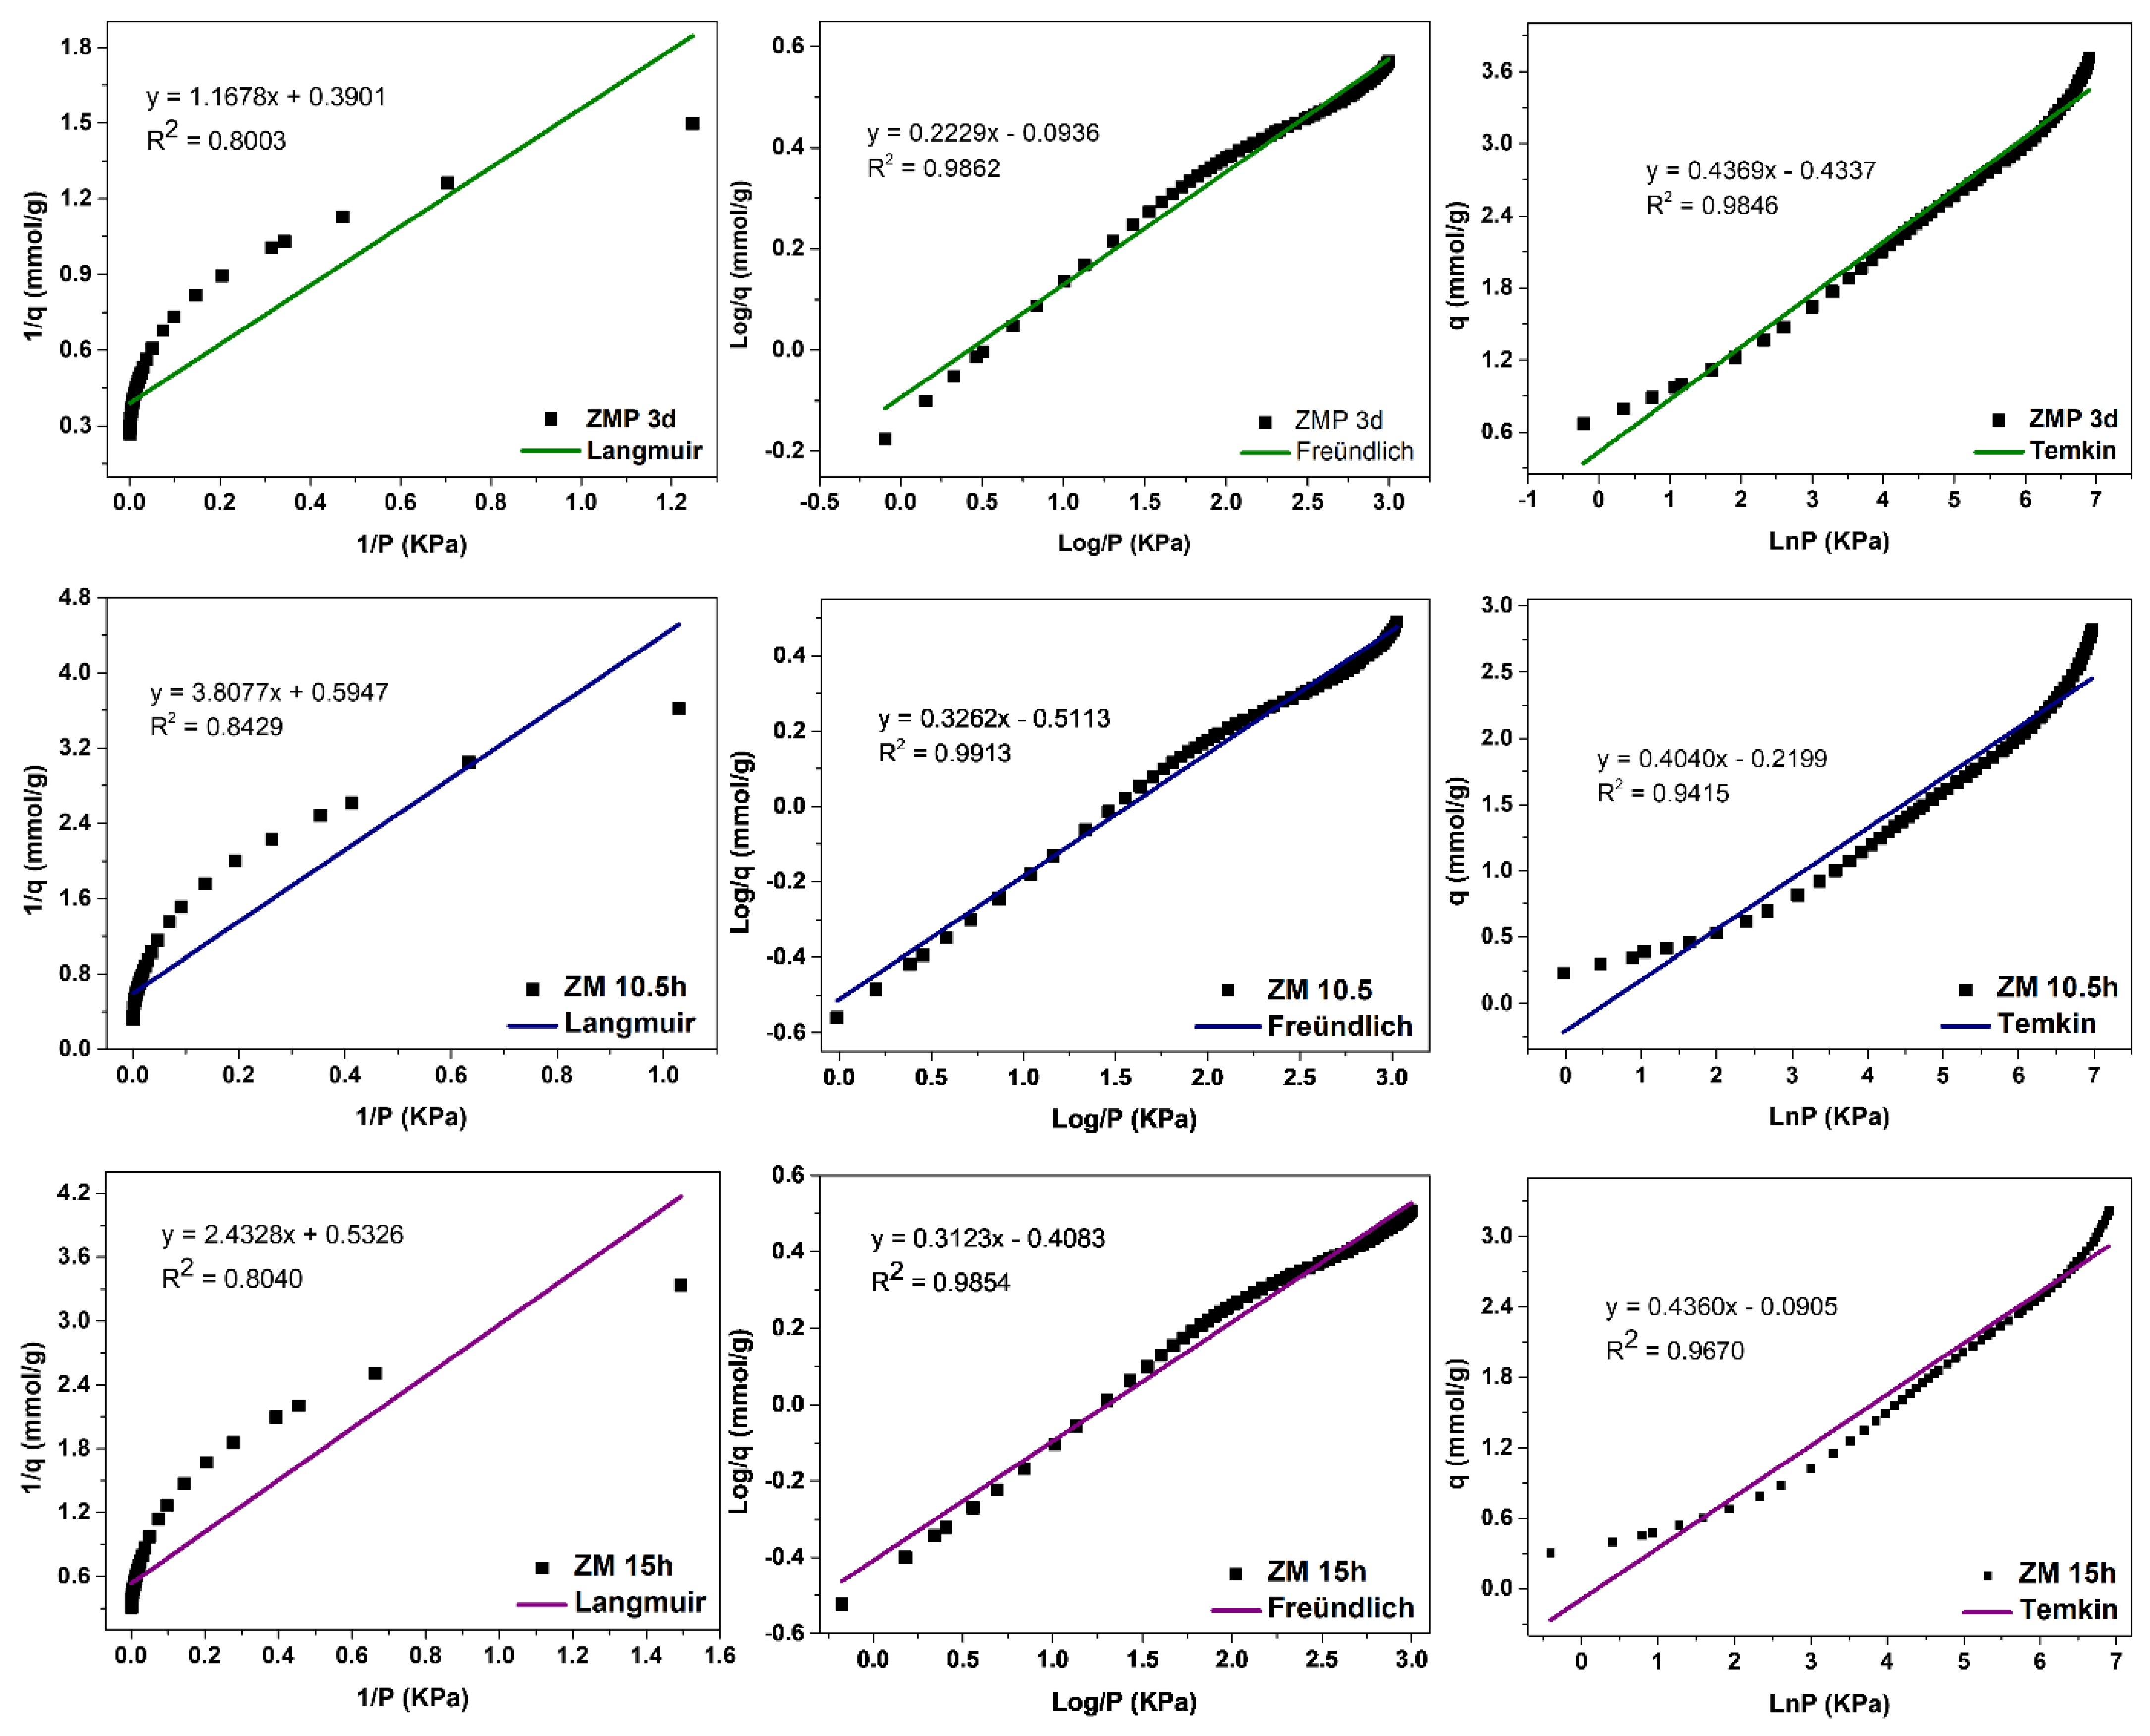
The MFI-structured zeolites in the basic medium,
Figure 13, had the best fit to the Freündlich model, with R
2 = 0.9862, R
2 = 0.9913, and R
2 = 0.9854 for ZMP 3 d, ZM 10.5 h, and ZM 15 h, respectively, indicating that the predominant mechanism is the adsorption on the heterogeneous surface of the adsorbent through multilayers [
14]. The value of 1/n was greater than 0 and less than 1, indicating that the adsorptive process involved is favorable. Higher K
F values indicate a greater affinity for an adsorbate at a specific temperature. These zeolites showed a good fit to the Temkin model, with the correlation coefficients R
2 = 0.9846, R
2 = 0.9415, and R
2 = 0.9670, respectively, indicating that a physical nature acts in the adsorption process. The value of the Temkin constant (BT) was also lower than 8000 Kj·mmol
−1, indicating that there is a contribution of physical nature in the adsorptive process. The Langmuir model did not fit the zeolites ZMP 3 d, ZM 10.5 h, and ZM 15 h, with coefficients of R
2 = 0.8003, R
2 = 0.8429, and R
2 = 0.8040, respectively.
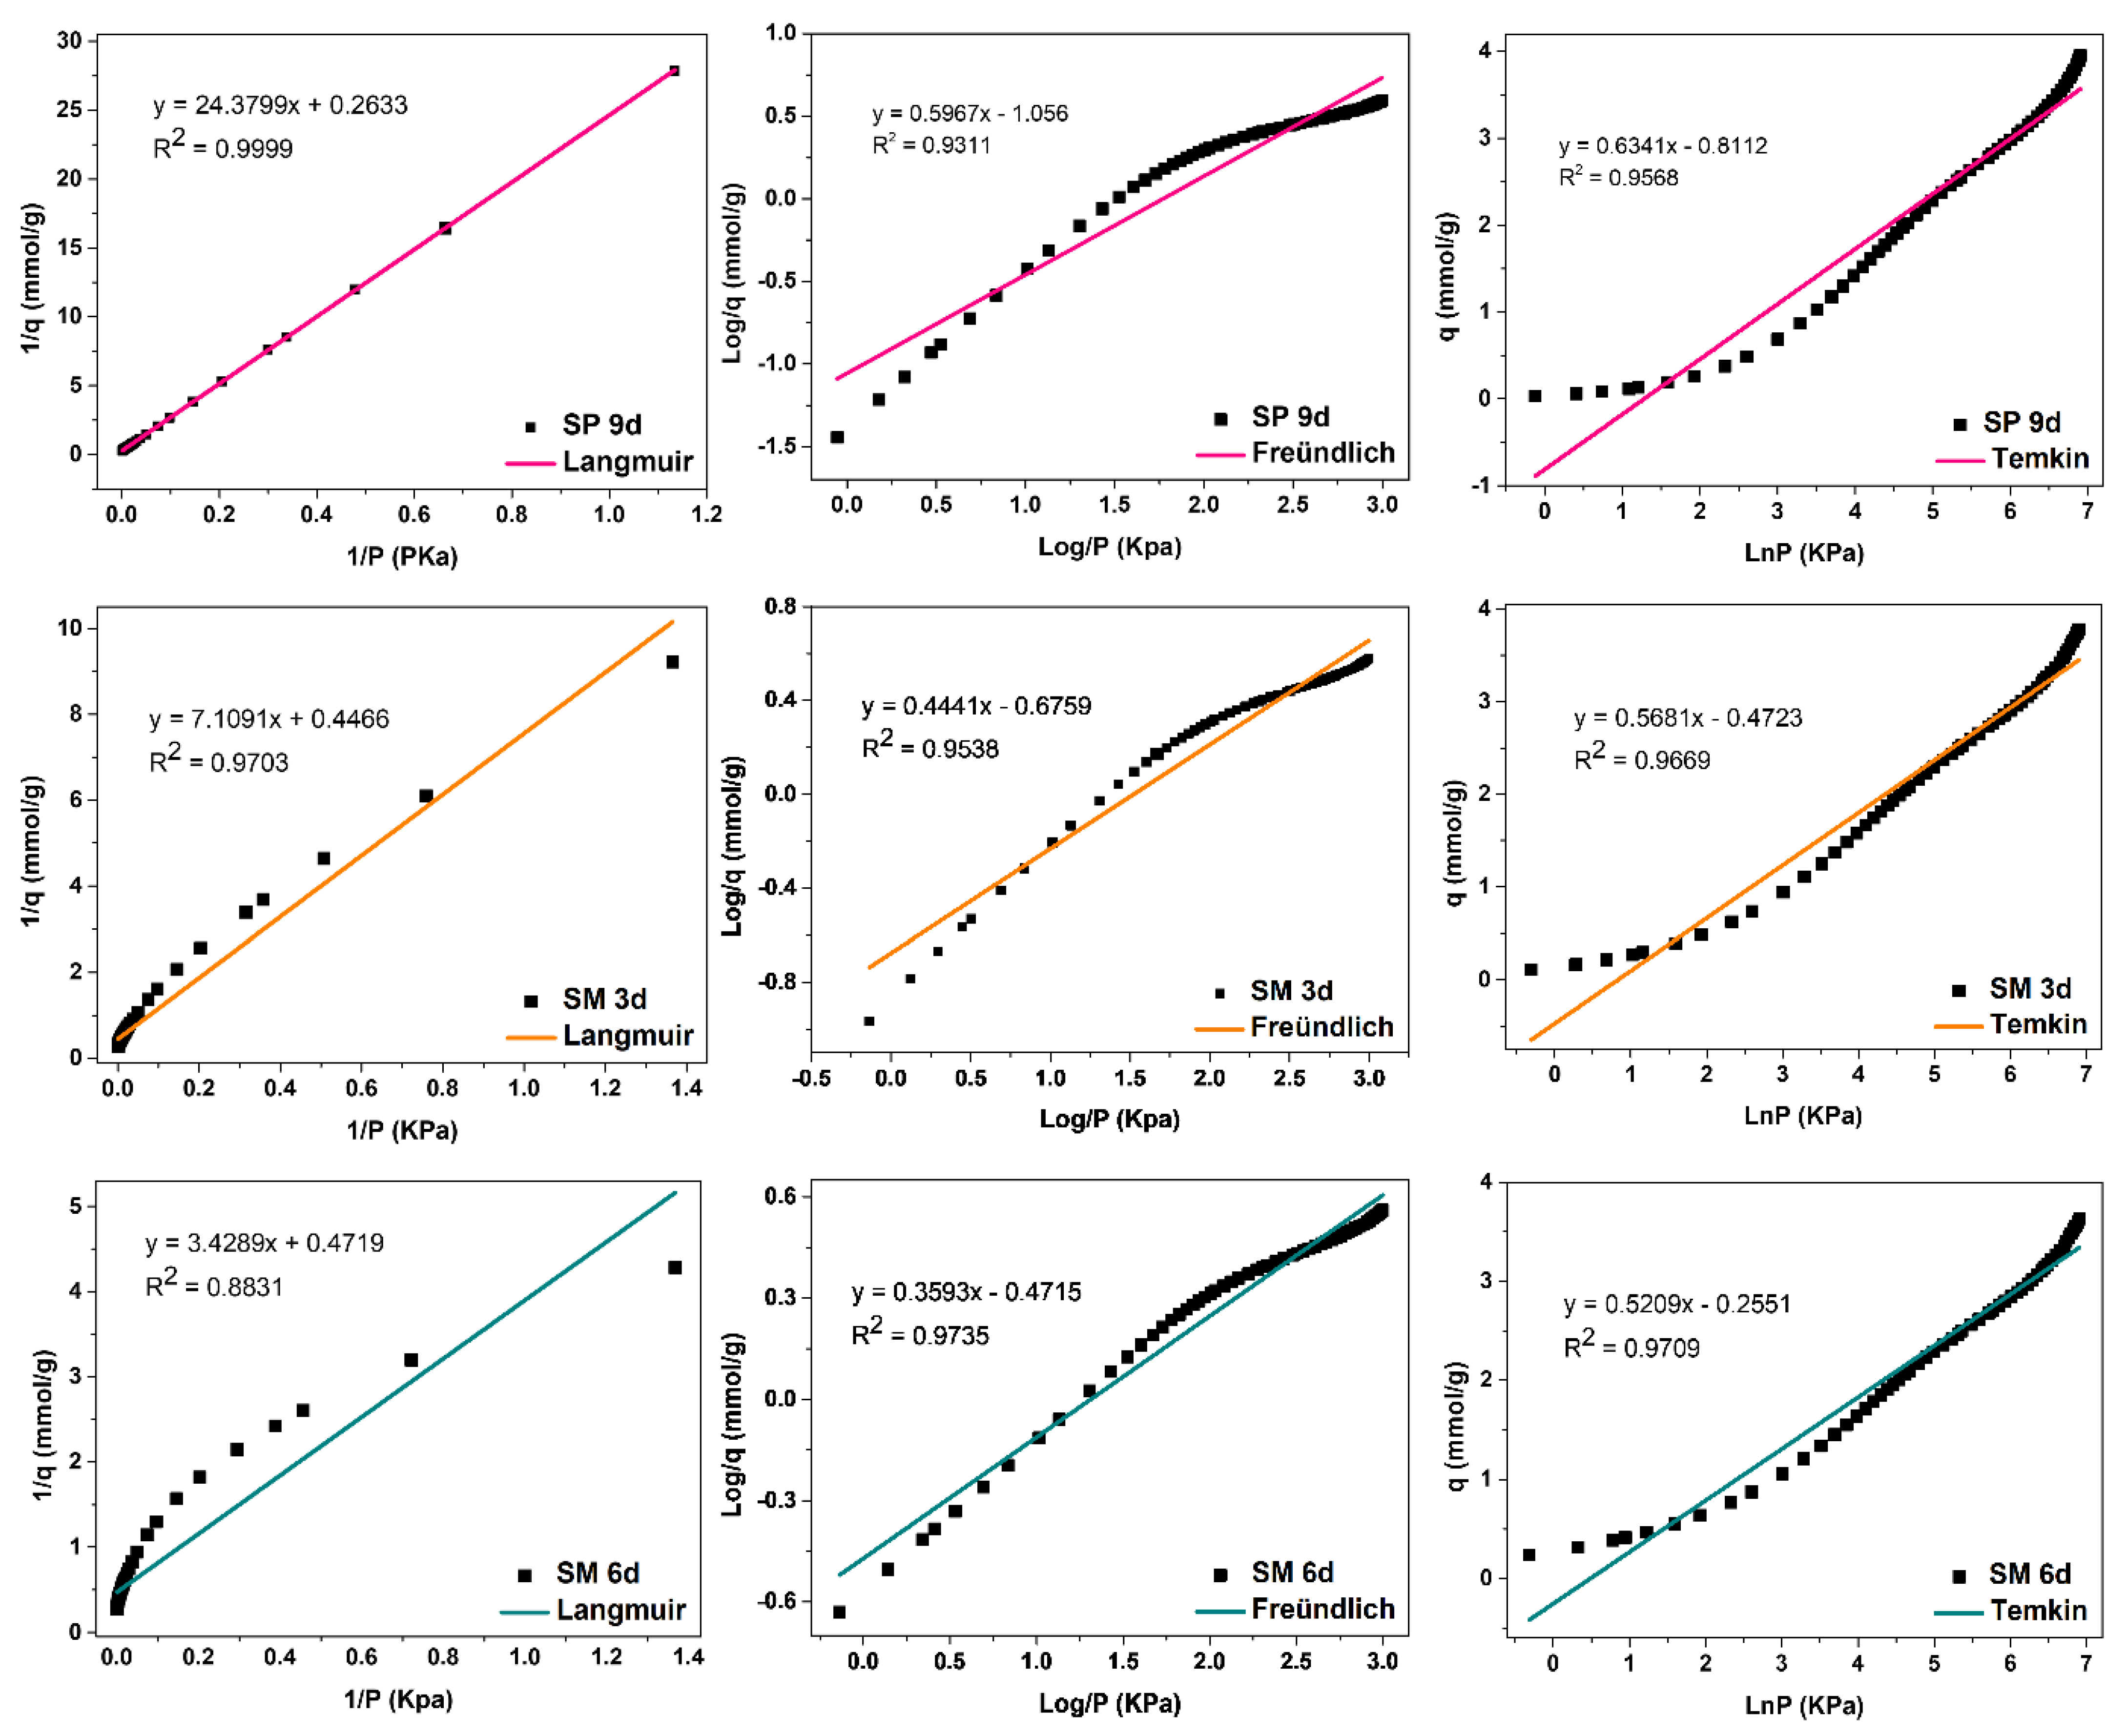
Silicalite SP 9 d and zeolites with MFI structures in the hydrofluoric medium with MPI silica SM 3 d,
Figure 14, obtained the best fit for the Langmuir model, with correlation coefficients of R
2 = 0.9999 and R
2 = 0.9703, respectively. This indicates that the predominant adsorption mechanism presents a homogeneous distribution across the surface, with a monolayer formation in a restricted number of adsorbent sites that are energetically equivalent. Furthermore, there is no interaction between the adsorbed molecules [
12,
13]. The Temkin model also had a good fit for these zeolites with the coefficients R
2 = 0.9568 and R
2 = 0.9669, respectively, indicating the contribution of the physisorption process in the adsorption mechanism, since the value of the Temkin constant (BT) was also less than 8000 Kj·mmol
−1. For Freündlich, the value of 1/n was greater than 0 and less than 1, indicating that the adsorption process is favorable [
18].
The SM 6 d zeolite,
Figure 14, had the best fit for the Temkin model, with a coefficient of R
2 = 0.9753, indicating that the predominant adsorptive mechanism is physical adsorption [
15]. The second-best fit was for the Freündlich model, with R
2 = 0.9735, indicating a greater contribution of the monolayer and multilayer in the adsorptive process. Furthermore, n values greater than 1 indicate that adsorption is favorable. The Langmuir model did not fit the experimental data for this material, with a coefficient R
2 = 0.8831 [
12,
18].


 ,
, 


