Article

Size-Independent Flexure Test Technique for the Mechanical Properties of Geocomposites Reinforced by Unidirectional Fibers

1
Faculty of Mechanical Engineering, Nha Trang University, 02 Nguyen Dinh Chieu, Nha Trang 650000, Vietnam
2
Faculty of Mechanical Engineering, Technical University of Liberec, Studentská 2, 461 17 Liberec, Czech Republic
3
Euro Support Manufacturing Czechia, s.r.o. Záluží 1, 436 70 Litvínov, Czech Republic
*
Authors to whom correspondence should be addressed.
Ceramics 2023, 6(4), 2053-2069; https://doi.org/10.3390/ceramics6040126
Submission received: 30 July 2023 / Revised: 30 September 2023 / Accepted: 5 October 2023 / Published: 17 October 2023
(This article belongs to the Special Issue The Production Processes and Applications of Geopolymers)

Abstract

:
In assessing the bending attributes for geopolymer composites augmented with uni-directional fibers, methodologies aligned with the established American and European standards yield quantifiable values for flexural strength, denoted as σm*, and its corresponding elasticity modulus, E*. Notably, these values exhibit a pronounced dependency on the size of the testing parameters. Specifically, within a judicious range of support span L relative to specimen height H, spanning a ratio of 10 to 40, these metrics can vary by a factor between 2 and 4. By conducting evaluations across an extensive array of H/L ratios and adhering to the protocols set for comparable composites with a plastic matrix, it becomes feasible to determine the definitive flexural elastic modulus E and shear modulus G, both of which can be viewed as size-neutral material traits. A parallel methodology can be employed to deduce size-agnostic values for flexural strength, σm. The established linear relationship between the inverse practical value E* (1/E*) and the squared ratio (H/L)2 is acknowledged. However, a congruent 1/σm* relationship has been recently corroborated experimentally, aligning primarily with Tarnopolsky’s theoretical propositions. The parameter T, defined as the inverse gradient of 1/σm* about (H/L)2, is integral to these findings. Furthermore, the significance of the loading displacement rate is underscored, necessitating a tailored consideration for different scenarios.

1. Introduction

In 1978, Joseph Davidovits pioneered the idea of creating binders through a polymeric reaction that combined alkaline solutions with geologically derived materials or industrial by-products such as fly ash and rice husk ash [1]. By 1979, these binders were known as “geopolymers”. Characterized as inorganic polymeric substances, geopolymers have a chemical profile similar to zeolites. They lack a distinct crystalline framework and display properties reminiscent of ceramics regarding their structural and functional attributes. The amorphous to semi-crystalline three-dimensional sialate matrix of geopolymers comprises SiO4 and AlO4 tetrahedra. These tetrahedra are cohesively linked by shared oxygen atoms, forming polymeric Si-O-Al bonds [2,3]. Currently, geopolymers are perceived as avant-garde materials, having potential for utilization in coatings, adhesives, fiber-reinforced composites, and viable substitutes for traditional types of cement in concrete mixtures [4]. For over thirty years, composites reinforced with fibers and employing a geopolymer matrix, commonly called geocomposites, have been acknowledged, tracing back to the seminal patent registered by Davidovits [5]. These cutting-edge materials can be fabricated and set either at ambient conditions or via a heat treatment at low temperature. After a brief curing time, these composites exhibit superior attributes, including being lightweight yet possessing remarkable strength. Additionally, they showcase commendable fire-resistant properties, characterized by the emission of benign fumes and minimal smoke, and demonstrate resilience against organic solvents [4,6,7,8,9]. Owing to these distinct characteristics, geopolymer matrix composites are highly beneficial for a spectrum of advanced industries such as aerospace, marine design, terrestrial transportation, and the automotive domain, especially in applications demanding resistance to elevated temperatures [4,6,8,10]. Geopolymer composites offer a cost-effective alternative to lightweight, high-strength composites composed of carbon or glass fibers with ceramic or organic matrices. The high costs associated with the specialized ceramic processing requirements and the limited applicability of most organic matrix composites at temperatures exceeding 200 °C make geopolymer composites a viable option [10,11]. Furthermore, geopolymer matrices can accommodate a wide range of reinforcement fibers, and specific matrices can protect carbon fibers from oxidation [10,12].
Typically, mineral clays enriched with silicon oxide (silica) and aluminum oxide (alumina) can be subjected to alkaline dilution, instigating an exothermic polycondensation mechanism that culminates in geopolymer formation. Notable raw materials employed in geopolymer synthesis encompass kaolin, metakaolin, fly ash, and furnace blast slag, to name a few. Nonetheless, using geopolymer resin as a foundational matrix for fiber-reinforced composites poses inherent difficulties for the efficient impregnation of fabrics or fiber rovings, which comprise individual filaments with diameters spanning 7 to 25 µm. A resin characterized by minimal viscosity and a predominant particle size less than the filament’s diameter is favored, typically approximately 5 µm [5,13]. As a result, traditional geopolymer resins, derived from metakaolin and analogous materials and typified by larger particles and augmented viscosity, are not optimally conducive for fiber impregnation unless subjected to elevated pressures to facilitate resin penetration in between individual filament fibers [14]. However, the adoption of a thermally processed silica-based geopolymer, with nanoscale amorphous silica as its chief constituent, can overcome these impediments, ensuring sufficient resin impregnation [13]. A subset of these materials is fabricated similarly to prevalent composites with a plastic matrix, utilizing the pultrusion technique: drawing fibers through a liquid geopolymer matrix reservoir (gel) followed by subsequent solidification (curing). Another relevant category includes geopolymers fortified with unidirectional fabrics. Beyond these applications, the unidirectional alignment of the fibers provides a platform to experiment with diverse fiber-matrix amalgamations uninfluenced by fabric weaving patterns.
Besides the strain to failure and proportional limit stress, their elasticity and strength are these high-tech construction materials’ most relevant mechanical properties. These properties are generally tested in all composites by applying a bending load. This is typical because of the standard manner of construction loading. Compared with tensile testing, more generally with a brittle matrix, it eliminates specific difficulties with gripping test specimens. It is much more critical, especially for research and development, to confront the existing standards of testing proposed for ceramic composites with the phenomena observed in this type of geopolymer matrix. For this comparison, we have exploited the American norm: Standard Test Method for Flexural Properties of Continuous Fiber-Reinforced Advanced Ceramic Composites—ASTM C 1341-06 [15]; the European norm from the ceramic group: Advanced Technical Ceramics—Mechanical properties of ceramic composites at room temperature—Part 3: Determination of flexural strength DIN V ENV 658-3:1993-02 [16]; and the European standards from the plastic group Fiber-reinforced plastic composites—Determination of flexural properties, BS IN ISO 14125:1998 [17]. The testing results are always presented with standard deviations denoted by error abscises. Given the ceramic-like attributes of geopolymer composites, assessing and interpreting them in line with ceramic standards might be intuitive. However, empirical data suggests that such standards are only sometimes applicable to this material class. Predominantly, the inherent brittleness of the geopolymer matrix, when combined with robust fibers and a notably high fiber volume content, approximately 50%, often results in test specimen failures characterized not by the breakage of the outer fiber layers but rather by delamination, leading to kink formations in the compression section of the profile. The American standard, ASTM C 1341-06, precludes testing materials that do not exhibit failure via tension or compression in the outer fibers, and its European counterpart puts forward a similar limitation. Notably, these “ceramic” standards neither explicitly address the computation of the elasticity modulus nor endorse the utilization of the derived flexural strength for design objectives. Given that the resultant composites exhibit properties that diverge from, and often surpass, conventional composites, applying standards tailored for organic matrix or ceramic matrix fiber composites might prove suboptimal. Consequently, geopolymer composite materials require a more precise articulation of their mechanical attributes [18]. Both standards require sufficiently long rectangular beams as specimens. An outer support span-to-height ratio ≥16 or 20 for three-point tests should be used. The desired target is eliminating shear as an influential factor; other methods are recommended for the evaluation of the latter. The ASTM C 1341-06 takes this complex behavior into consideration, and higher ratios (proposed as 32, 40, or 60) should be chosen to avoid typical shear failure patterns. The last guideline indicates DIN V ENV 658-3:1993-02. However, shear’s influence should never be indiscriminately neglected in ceramic composite testing. One cannot easily forecast when shear comes into effect.
This study’s primary objective is to evaluate the flexural properties of unidirectional fiber-reinforced geocomposites. Our observations highlighted that the impact of shear was invariably significant. However, adopting an exhaustive test reminiscent of approaches utilized for plastic composites could provide a more profound understanding of the material being studied.

2. Theory of Size-Independent Flexure-Test Technique

2.1. Modulus of Elasticity

The European standard BS EN ISO 14125 is aimed at the testing of plastic composite material specifically, so the rectangular beams of the recommended dimensions are required. The test results are not stated as physical definitions but only effective quantities applicable for comparison under invariant test conditions. An effective modulus E (written initially as Ef) is considered a measure of elasticity. It is evaluated from the force-deflection curve for three-point bending in terms of Equation (1), which is entirely valid only for isotropic materials (with high shear modulus).
E * = L 3 4 . B . H 3 × Δ F Δ s
where L is the span of the supports, B is the width, and H is the height of the sample profile. F is the force that loads the rectangular beam specimen in the center of the span; s is the deflection. Modulus E* should be generally lower than the classical Young’s modulus E because a simple evaluation does not allow for the tangential strain caused by shear stress. As the force-deflection curve may not be linear over the whole extent, the boundaries of deflections are appointed, wherein the slope ΔsF is evaluated, as s/L = 1/200 and s/L = 1/500. On the contrary, in the standard plastic composites reinforced with fibers—the determination of adequate interlaminar shear strength is via the short beam method EN ISO 14130—a tangent of the steepest straight-line portion of a force-deflection curve is used instead of ΔFs in Equation (1) [19].
The obtained E* values can be further treated. With plastic composites, correction factor has been introduced by the normative part of the standard Reinforced plastics composites—Specifications for pultruded profiles—Methods of test and general requirements [20] that should purge the influence of shear from the resulting effective elasticity modulus E*. The correction factor k with a constant value of k = 0.05 appears in the equation
E = ( 1 + k ) E *
where E* is calculated through Equation (1). Only the informative part of the standard EN 13706-2 2002 extends the evaluation to shear property, where the shear modulus G (under the tangential component of stress in the plane perpendicular to load direction) is defined. The proposed calculation is based theoretically on the works of Tarnopolsky [21,22,23], which presented a thorough survey of plastic composites. The basic assumption is that the additivity of effective deflection s is composed of two contributions; s σ caused by normal stress, and s τ caused by tangential stress. The theory provides formulas for the superposition:
s = s σ + s τ = F L 3 4 E B H 3 + α F L G B H = F L 3 4 E B H 3 1 + α H L 2 E G
Here, E is a virtual elasticity modulus; σ is another correction theory-based factor depending on the specimen profile. In the monograph [23], a ratio of virtual to effective modules E/E* is presented as a function of the coefficient of anisotropy κ, which is further defined as
κ = π 2 H L E G 1 / 2
Based on the theoretical considerations of Tarnopolsky [22], the mentioned ratio acquires the resulting shape for rectangular profiles:
E E * = κ 2 3 tanh κ κ tanh ( κ ) + π 2 8
The expression on the right side of Equation (5) is an almost linear function of κ2, which for κ2 < 4.5 gives
E E * 1 + 0.4761 κ 2
Within an error max of 1 %. Equations (1), (2), and (5) follow α = 0.4761 × π2/4 = 1.1747. In another practically aimed publication, Tarnopolsky rounds up to α = 1.2 [22]. The mutual difference is minimal; we have kept it to 1.175 in all our evaluations.
The correction factor k in (2) can thus be expressed as
k = α H L 2 E G
This implies that the dependency is twofold, encompassing both size and material aspects. Consequently, the approach that employs a consistent correction factor, denoted by k, and advocated in the standard EN 13706-2, may not be universally applicable.
The virtual flexural modulus E can be evaluated easily using the test arrangement recommended further in the informative part of EN 13706-2 [20]. Two or several better specimen sizes must be used, differentiated by height-to-span ratios H/L. The effective values E* are evaluated based on Equation (1), but now they are plotted as 1/E* vs. (H/L)2. The values of the virtual modulus E are obtained through linear regression, where
E 1 / 1 / E * ( H / L ) 2 0
The standard EN ISO 14,125 defines the “interlamellar shear modulus”, but does not bring in any method for its evaluation or interpretation [17]. The standard already does, though the resulting shear modulus value is again called effective [20]. From the differentiated theoretical expression (3), it was evident that the virtual shear modulus G is easily obtainable from the slope of the same linear regression as described above:
G α / d ( 1 / E * ) d ( H / L ) 2
The ratio of the virtual and effective values of G is expressed just by the coefficient α. The introduction of this coefficient for calculating genuine values of G according to Equation (9) is, in our opinion, fully qualified even for ceramic composites, and we have used it regularly.
A closer examination of the correction factor k = 0.05 value in the standard EN 13706-2 shows that it is acceptable only for specifically coordinated composite properties and specimen’s dimensions [20]. From Equations (3)–(6), it was found that keeping the normative value 0.05 in accordance with theory, it is necessary that the complex (H/L)2 × E*/G should amount to 0.0426. With L/H = 20 it is fulfilled if E*/G = 17, which can be approximately correct for Class III in standard EN ISO 14,125 (plastics reinforced, for example, with unidirectional glass fibers) and for Class IV (plastics reinforced for example with carbon fibers) with recommended L/H = 40 for this class it corresponds to E*/G = 68 [17]. These values seem to be around at the lower end of the actual values with geopolymer unidirectional fiber composites, as will be documented later.
Figure 1 shows that the effective values E* in geopolymer composites can be significantly lower than virtual modules E even in long specimens; the impact is more significant the higher the E/G value is.
An analogical plot in the standard EN 13706-2 has been proposed as exemplary. It needs to be mentioned that it has been constructed for a specific E/G and L/H to evoke the idea of general validity. Still worse would be the mere application of Equation (2), as in Figure 1. It would be represented by a single 95% value of E*/E.

2.2. Strength

Similar to the modulus of elasticity, flexural strength in composites is generally influenced by shear stress. The ratio between normal and tangential stresses controls the mode of the specimen failure and so determines the measured maximum failure force Fm. Theoretical analysis shows a more complicated pattern of stress dislocation across the specimen cross-section, formed from typically non-isotropic material [23]. The inhomogeneity of geopolymer composites is further largely influenced by minor irregularities in the preparation process, which causes considerable scattering of results.
All standards describe the primary evaluation of effective flexural strength σ m * , as calculated from the maximum force Fm according to the relationship valid for isotropic materials [15,16,17,19,20]. For rectangular profiles and three-point bending, the basic formula reads
σ m * = 3 2 F m L B H 2
Tarnopolsky’s work presented an analysis of the strength parameters of plastic composites in the quoted publications [21,22,23]. With a particular similarity to the formulation of the influence of shear on elasticity, he also defined adequate shear strength τ m * that is, however, fully bonded to flexural strength:
τ m * = 3 4 F m B H = 1 2 H L σ m *
Just as with elastic phenomena, the analysis of strength reflects the influence of the specimen sizes on σ m * . In order to find the virtual flexural strength σ m as a maximum normal stress, Tarnopolsky derived the relationships similarly to Equation (5) [22], in terms of which these stresses σ m (and, eventually τ m ) can be calculated from effective values as a function of the anisotropy coefficient κ . Theoretically based Equations (12) and (13), proposed as the first three terms of power expansions, are
σ m σ m * = 1 + 1 15 κ 2 1 525 κ 4
and
τ m τ m * = 1 1 60 κ 2 + 1 12600 κ 4
The first of these equations has primary significance, because it justifies the method of extraction of the virtual flexural strength σ m as a size-independent quantity. After substituting κ from Equation (4), Equation (12) acquires the form
1 σ m * = 1 σ m + π 2 60 E G 1 σ m H L 2 π 4 8400 E G 4 1 σ m H L 4
The dependence σ m / σ m * ratio vs. (H/L)2 according to Equation (14) is illustrated in Figure 2.
Generally, a non-linear regression 1 / σ m * vs. (H/L)2 over the test data would provide parameters σm and E/G. The last term of expansion Equation (14) is, however, relatively small at not too large (H/L)2 values; summary declinations from 5% linearity occur for L/H = 4.5 at E/G = 15 and for L/H = 20 at E/G = 1300. Even those declinations could have been lower if further terms (with alternating signs) had been included. Considering additional natural scatter, the curvature of the regression line could be neglected in the first approximation. The analysis thus shows that the application of the same pattern of straight-line regression as applied for elasticity is elementary justified even for strength. The reciprocal linear regression intercept
σ m 1 / 1 / σ m * ( H / L ) 2 0
should be similarly independent of size.
The significance of the slope has not yet been discussed. If we take only two terms from the expansion in Equation (14) and express the slope as a derivative, we can obtain the ratio of E/G:
E G = π 2 60 σ m T
where T is the reciprocal slope (dimensionally identical with σm) from
T 1 d 1 / σ m * d H L 2
Under the full validity of the theory, the ratio on the left side of Equation (16) should have the same value as that calculated from the evaluation of the elasticity parameters E and G. Or, after rearranging, product P
P = π 2 60 G E σ m T
should be equal to one.

2.3. Displacement Rate

There are remarkable differences in the recommended rates of flexural loading among individual standards relevant to fiber-reinforced composites with either plastic or ceramic matrices. The rates are generally characterized in two ways: by the time tm, within which the specimen should fail at a constant velocity ν of cross-head (displacement rate), or by a strain/deformation rate ε ˙ = dε/dt. For three-point loading, the interrelation of these paired quantities is
v = ε ˙ L 2 6 H
The range of 30 to 90 s is recommended for the time tm with plastic composites in the standard [20]; 60 s with ceramic composites [16]. By contrast, ASTM 1341-6 requires only 5 to 10 s for ceramic composites [15]. The higher speed is reasoned for as a “minimization of environmental and force application rate effects when testing in ambient air” [15]. As the product ε ˙ t m should be approximately constant with the same strain expected at failure, the standards in fact recommend rates ε ˙ numerically: 167 × 10−6 s−1 in EN 13706-2 [20] and 500 × 10−6 to 5000 × 10−6 s−1 in ASTM 1341-06 [15], resp., (recommended mean 1000 × 10−6 s−1).
From the quoted vague reasoning, just as from the tolerances and differences between the standards, one could have concluded that the results would be hardly rate-sensitive. A published article that came from the partner laboratory shows, however, that particularly with unidirectional geocomposites, both the effective flexural modulus and strength were changing remarkably when a wide range of displacement rates v = 0.02 to 2 mm/s were applied (the corresponding strain rates ε ˙ ≈ 250 × 10−6 to 25,000 × 10−6 s−1), no matter whether the composite was reinforced with carbon or AR-glass fibers [24]. The increases of modulus E* respective of strength σ m * due to the rate of acceleration over this scale amounted up to 100 and 50 per cent, resp.
It follows from preliminary considerations that such a kinetic behavior could be examined with the aid of the concept of shear stress composed from its static G0 and dynamic parts. On the basis of dimensional analysis, the dynamic component should have the shape of velocity squared divided by composite density. A reasonable assumption is that such a shear velocity is of a quantity proportional to the displacement rate ν and the ratio (L/H)2. The important conclusion is that under very high displacement rates there would be a size-independent limit on a curve 1/E* vs. the rate for ν → ∞, which equals 1/E. On the other hand, the limit for ν → 0 should lead to a primary relationship as in Equation (3). As discussed above, the same features for rate dependence as for elasticity can be anticipated for strength based on a similarity between both phenomena. Further elaboration is, of course, essential.

3. Experiments

Mechanical properties were tested on specimens prepared from geopolymer matrices of varied compositions. Matrix formulations included thermal silica, metakaolinitic or kaolinitic components, potassium hydroxide solution or potassium water glass, and other minor admixtures for improving application properties. The basic types presented in this work are denoted as M1 (with boron content) and M2 (with phosphorus content). The reinforcing fibers came from three groups: carbon (HTS 5631 1600tex 24k, Toho Tenax Europe GmbH), basalt (BCF13-2520tex KV12 Int, Basfiber®, Kamenny Vek, Russia) and E-glass (E2400P192, Saint-Gobain Vetrotex) [25].
Clippings of approximate length 150 mm were prepared from continuous fibers (rovings) using the technique of pultrusion. After pulling through the bath of geopolymer resin and wringing between rollers, the fibers were wound on pulling roller. Prepared clippings of the same length were removed from the coil after a cut along the roller length. They were squeezed into rubber molds with rectangular cross-sections. The molds were covered with a peel-ply fabric and suction tissue, evacuated in the plastic bag, and left under vacuum in an oven to harden at the preset temperature and time, and afterward left to dry at the same temperature. The upper surface was smoothed, and finally, shorter pieces were cut up with a diamond disc.
Preliminary bending tests were carried out in both co-working institutions on different equipment (VUAnCh: TMZ-3U Electronic, TUL: Instron Model 4202) in order to check reproducibility, either of the preparation of specimens or the test equipment action. The displacement rate was kept low (2 mm/min). In this series, carbon fiber with two different matrices was used. The height H of the profiles was between 3 and 4 mm, width B between 9 and 10 mm, and L was changed on the levels 38, 50, and 100 mm. The weight fractions of fibers in basalt, E-glass, and carbon dry composites were 60, 60, and 40%, respectively, with the volume fractions of fibers being 53, 55, and 43%. Optimistic results permitted the deployment of extensive tests, where the conditions of specimen preparation were changed.
Finally, several tests were performed with fabrics from the same basic fiber materials as the rovings: unidirectional carbon 100 g/m2 T700 800 tex (Toho Tenax Europe GmbH) and E-glass 250 g/m2 (Saint-Gobain Vetrotex) and twill (Weave (0/90) carbon 160 g/m2 with HTS 5631 400 tex (Toho Tenax Europe GmbH) and E-glass 163 g/m2 (Saint-Gobain Vetrotex). The slips of fabrics approx. 150 × 150 mm were saturated with matrix gel using a brush, laid into the mold; a roller pushed away the excess, and the composite was left to harden under vacuum at the same conditions as those of the fibers. Also, the final treatment was similar; the strip specimens were cut.

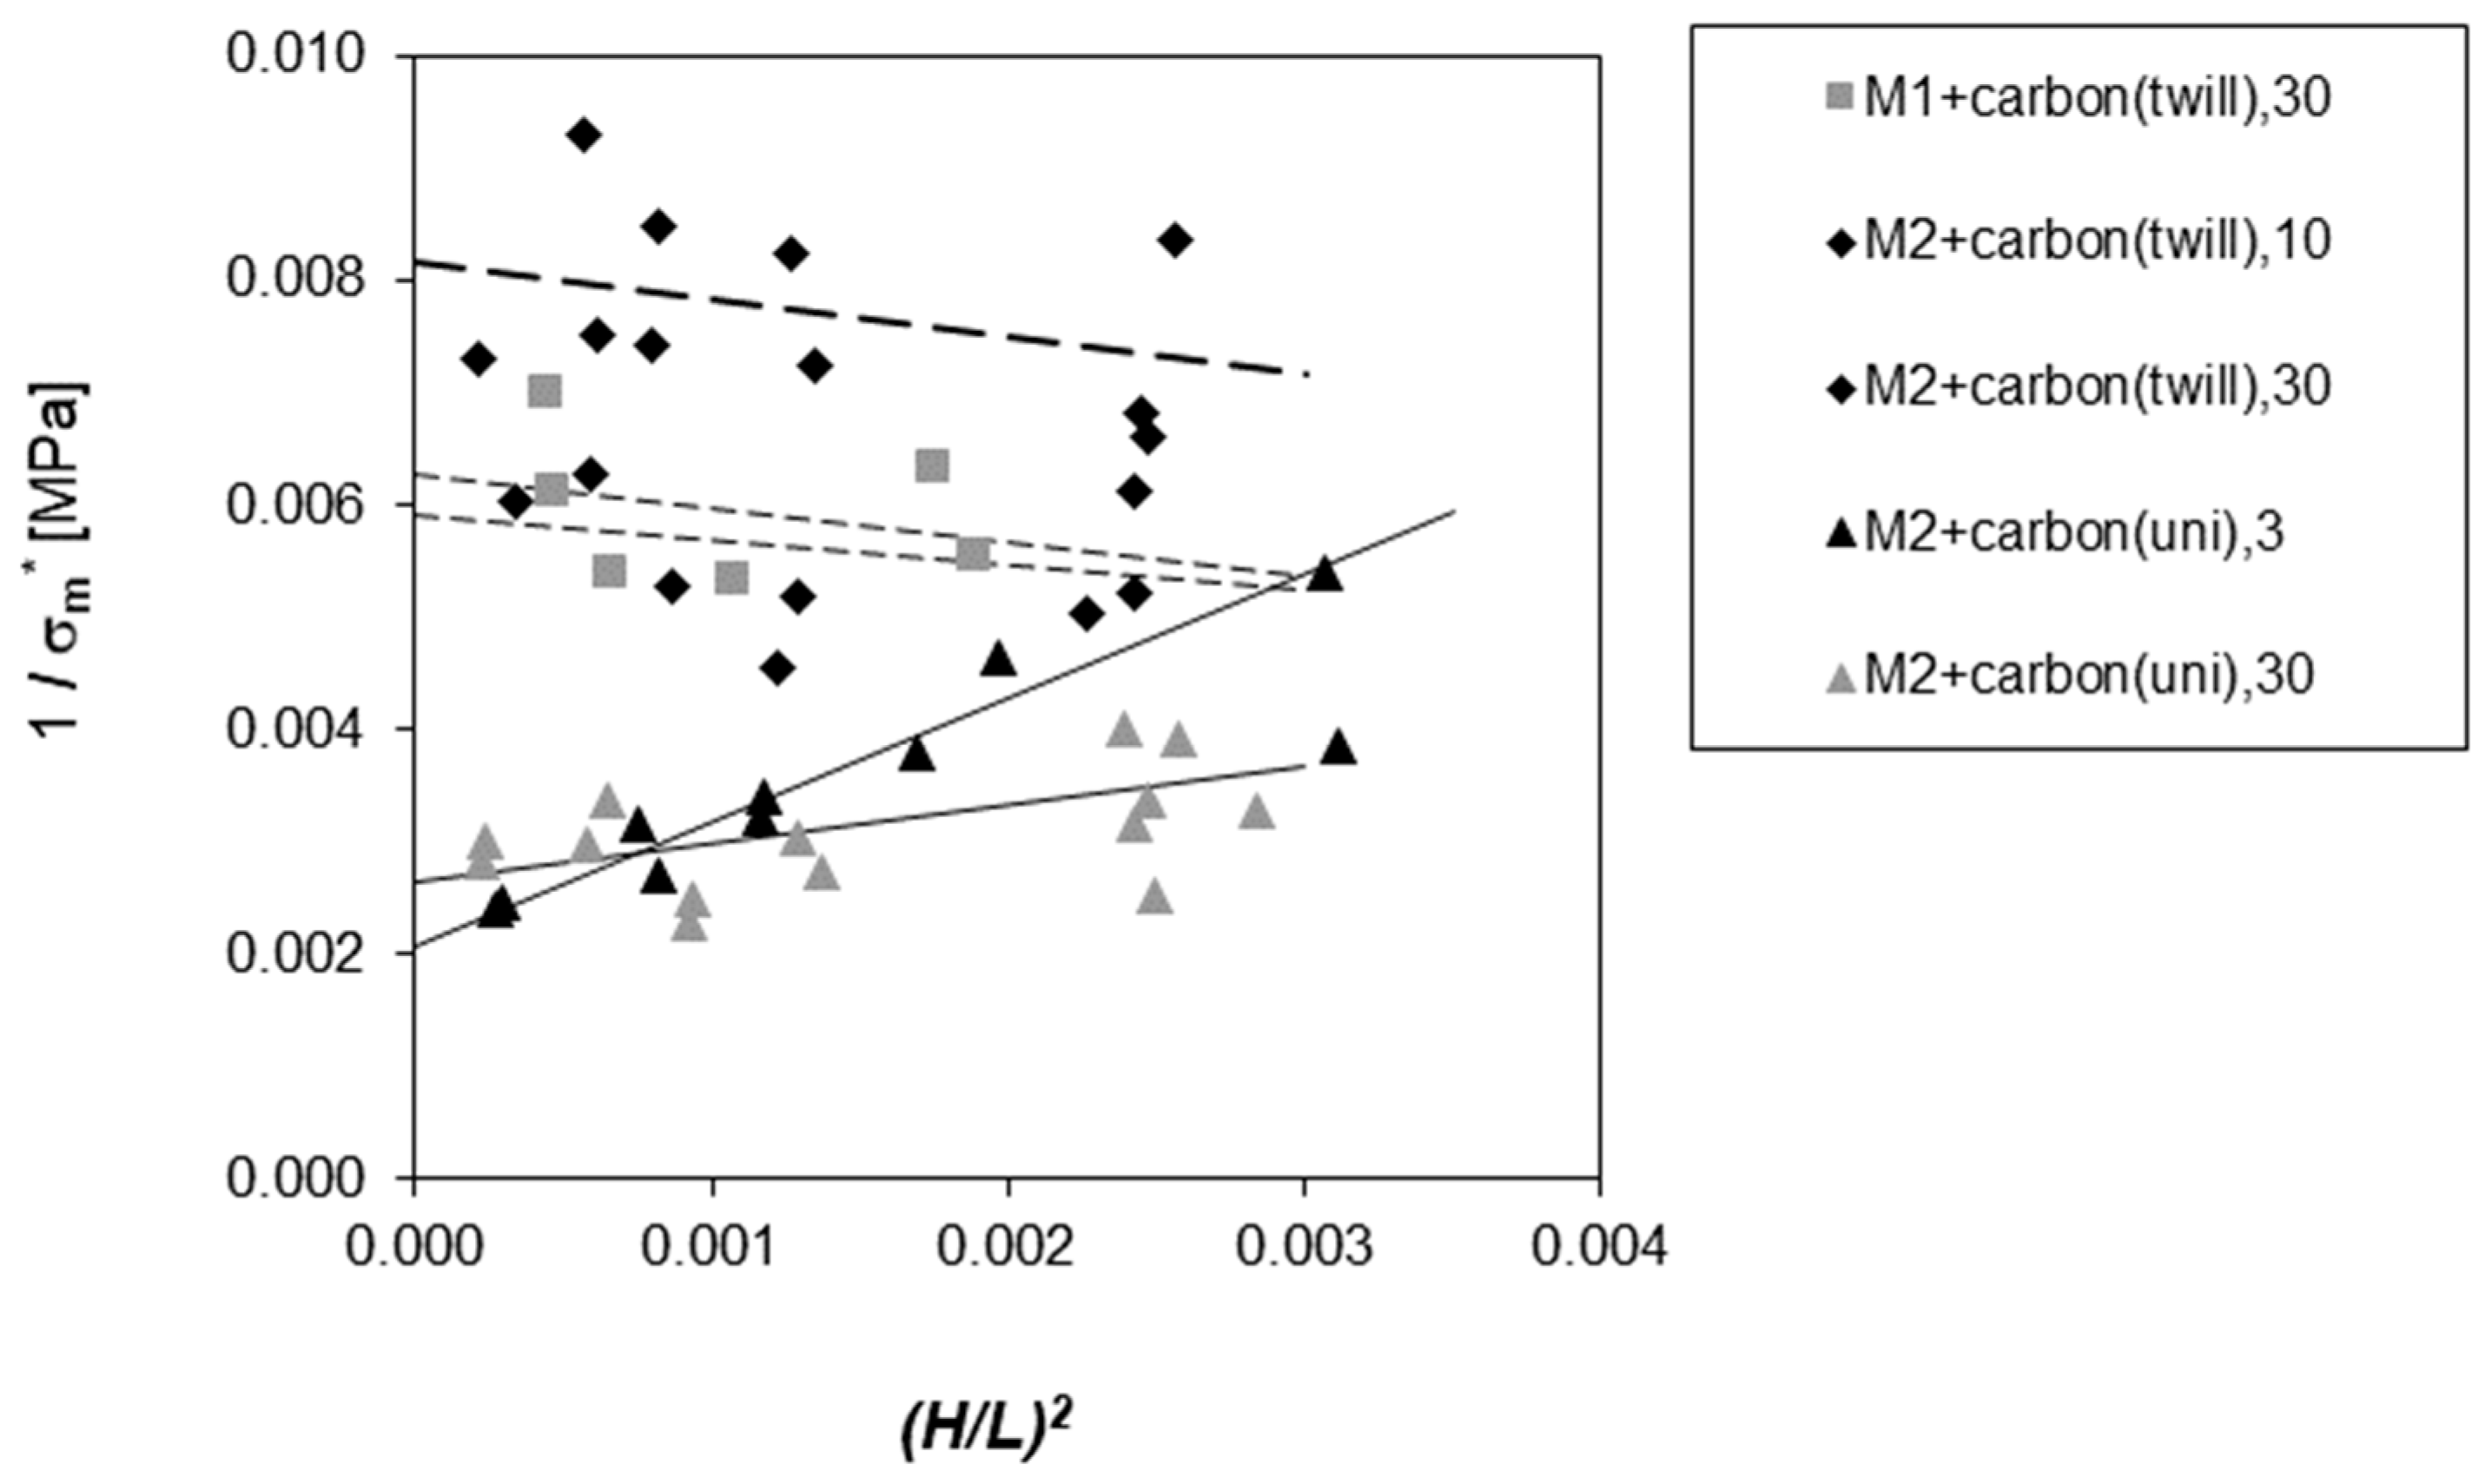
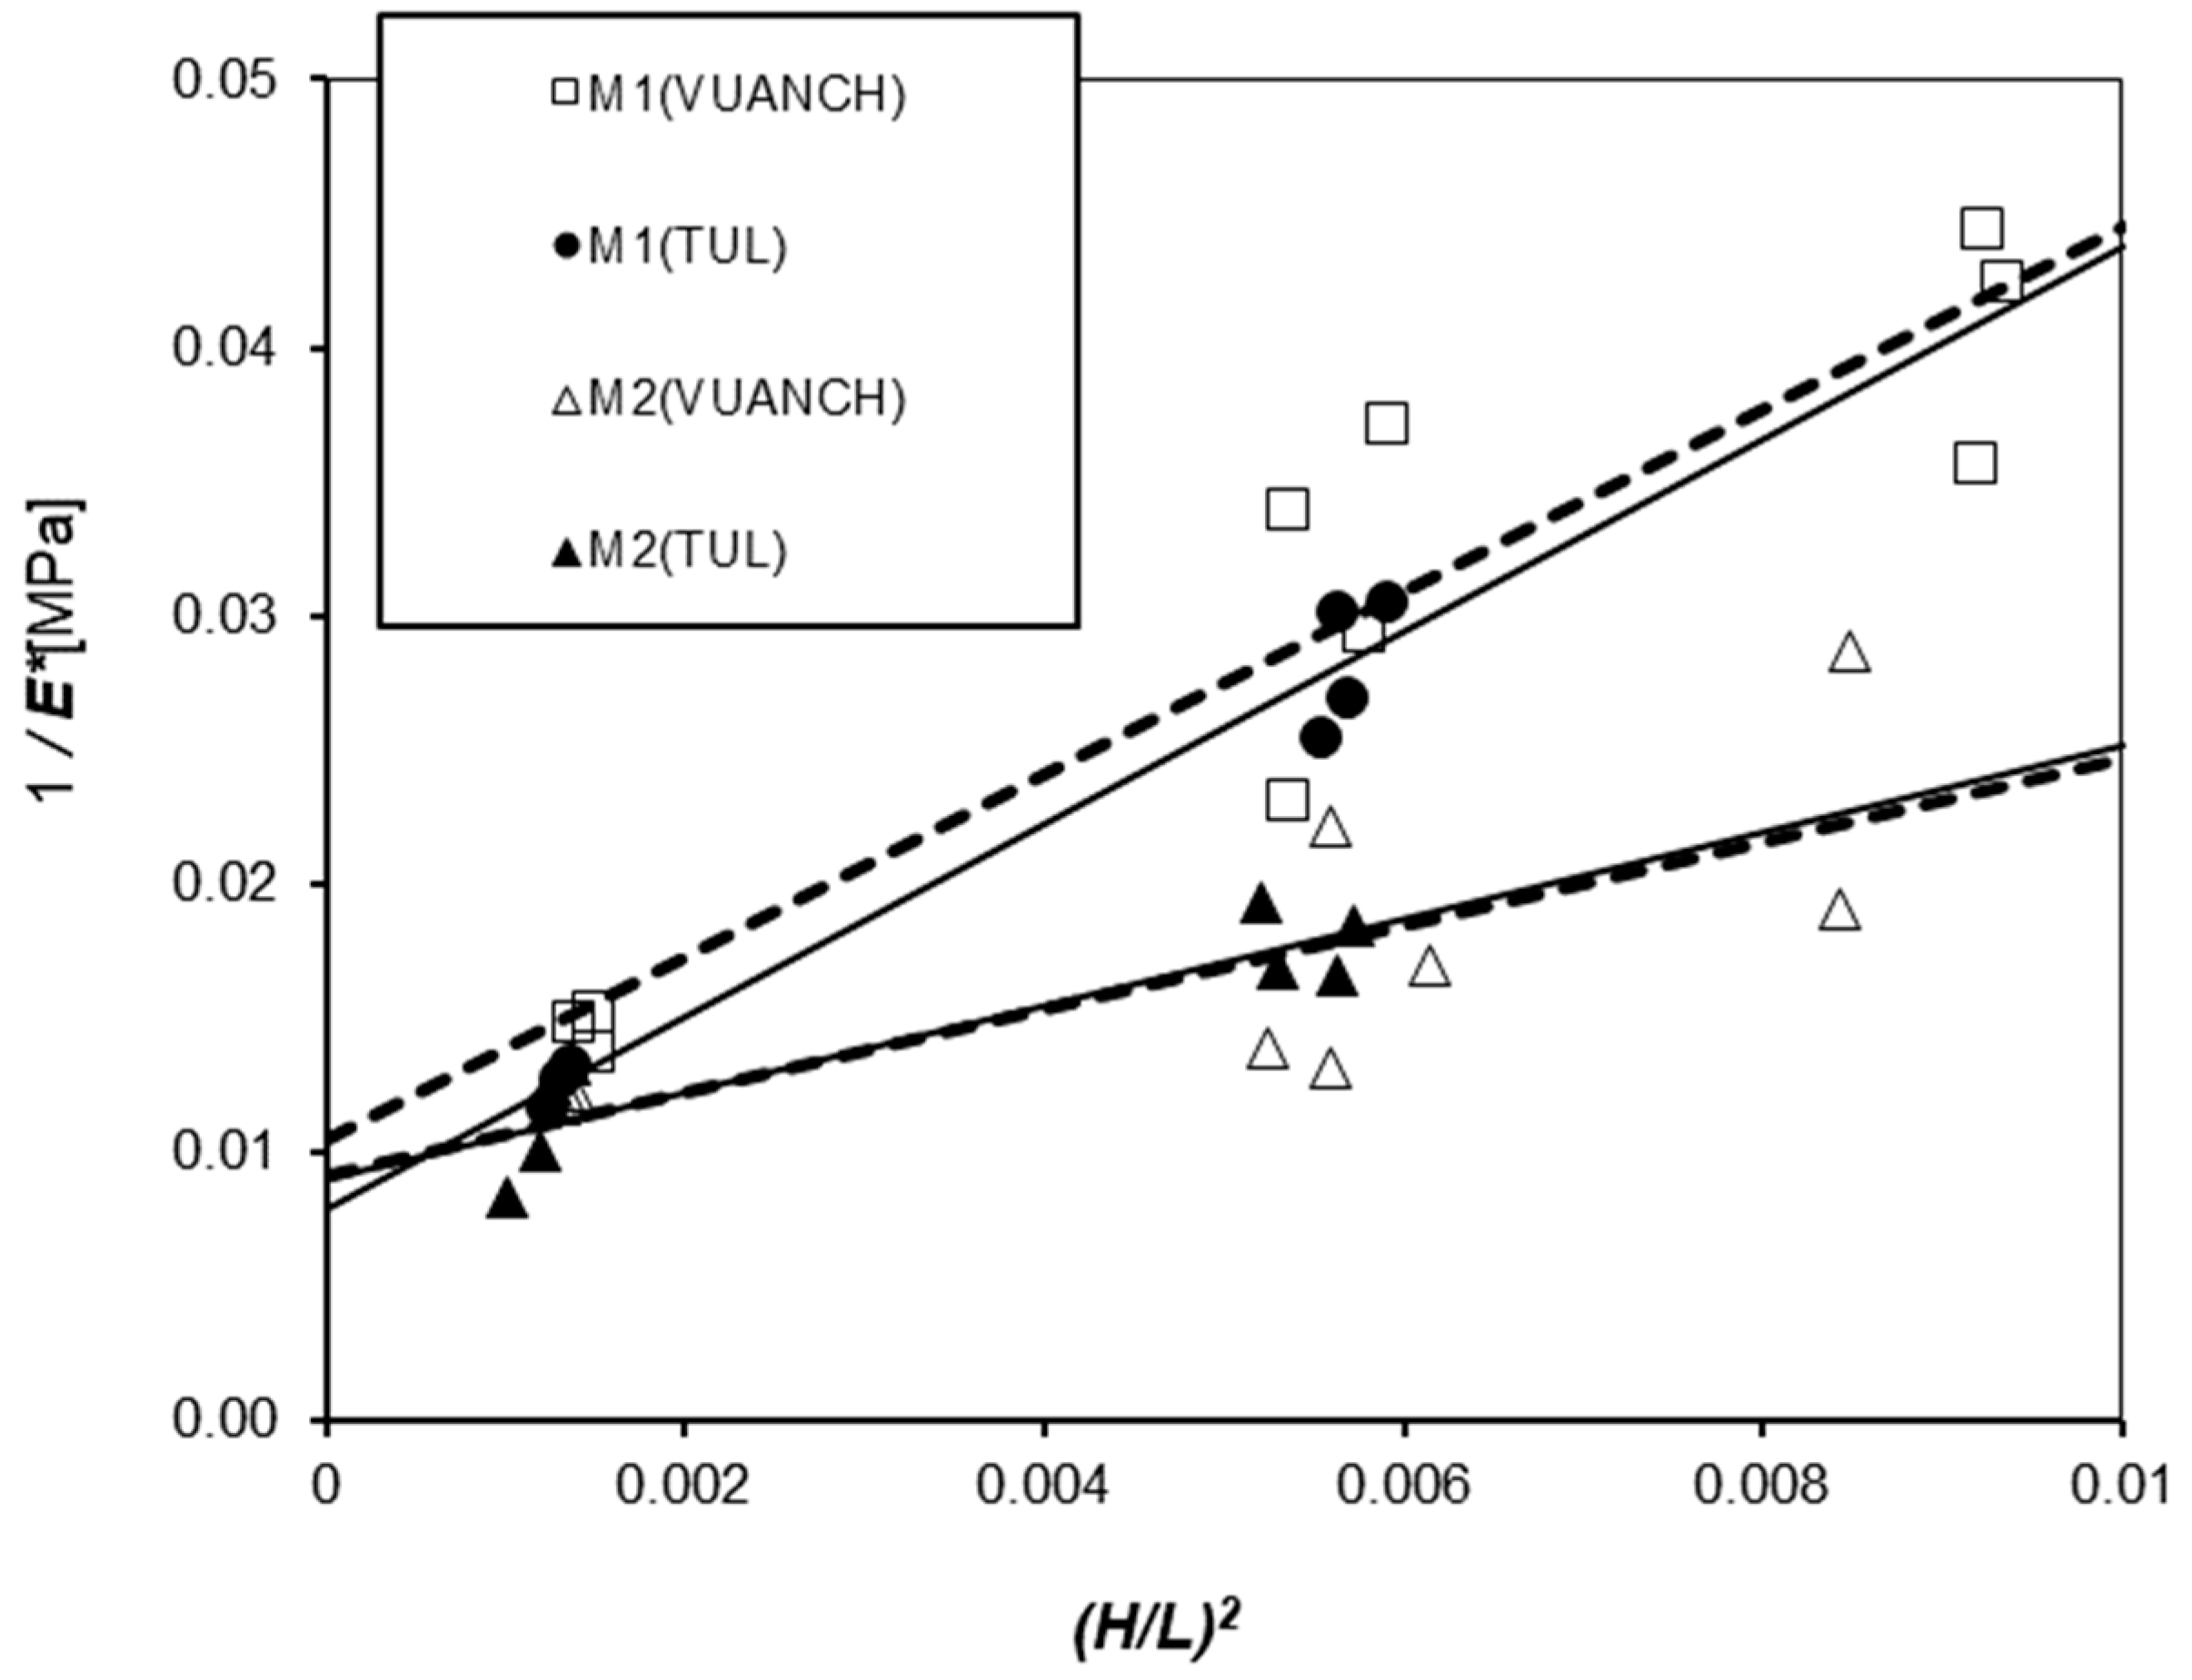
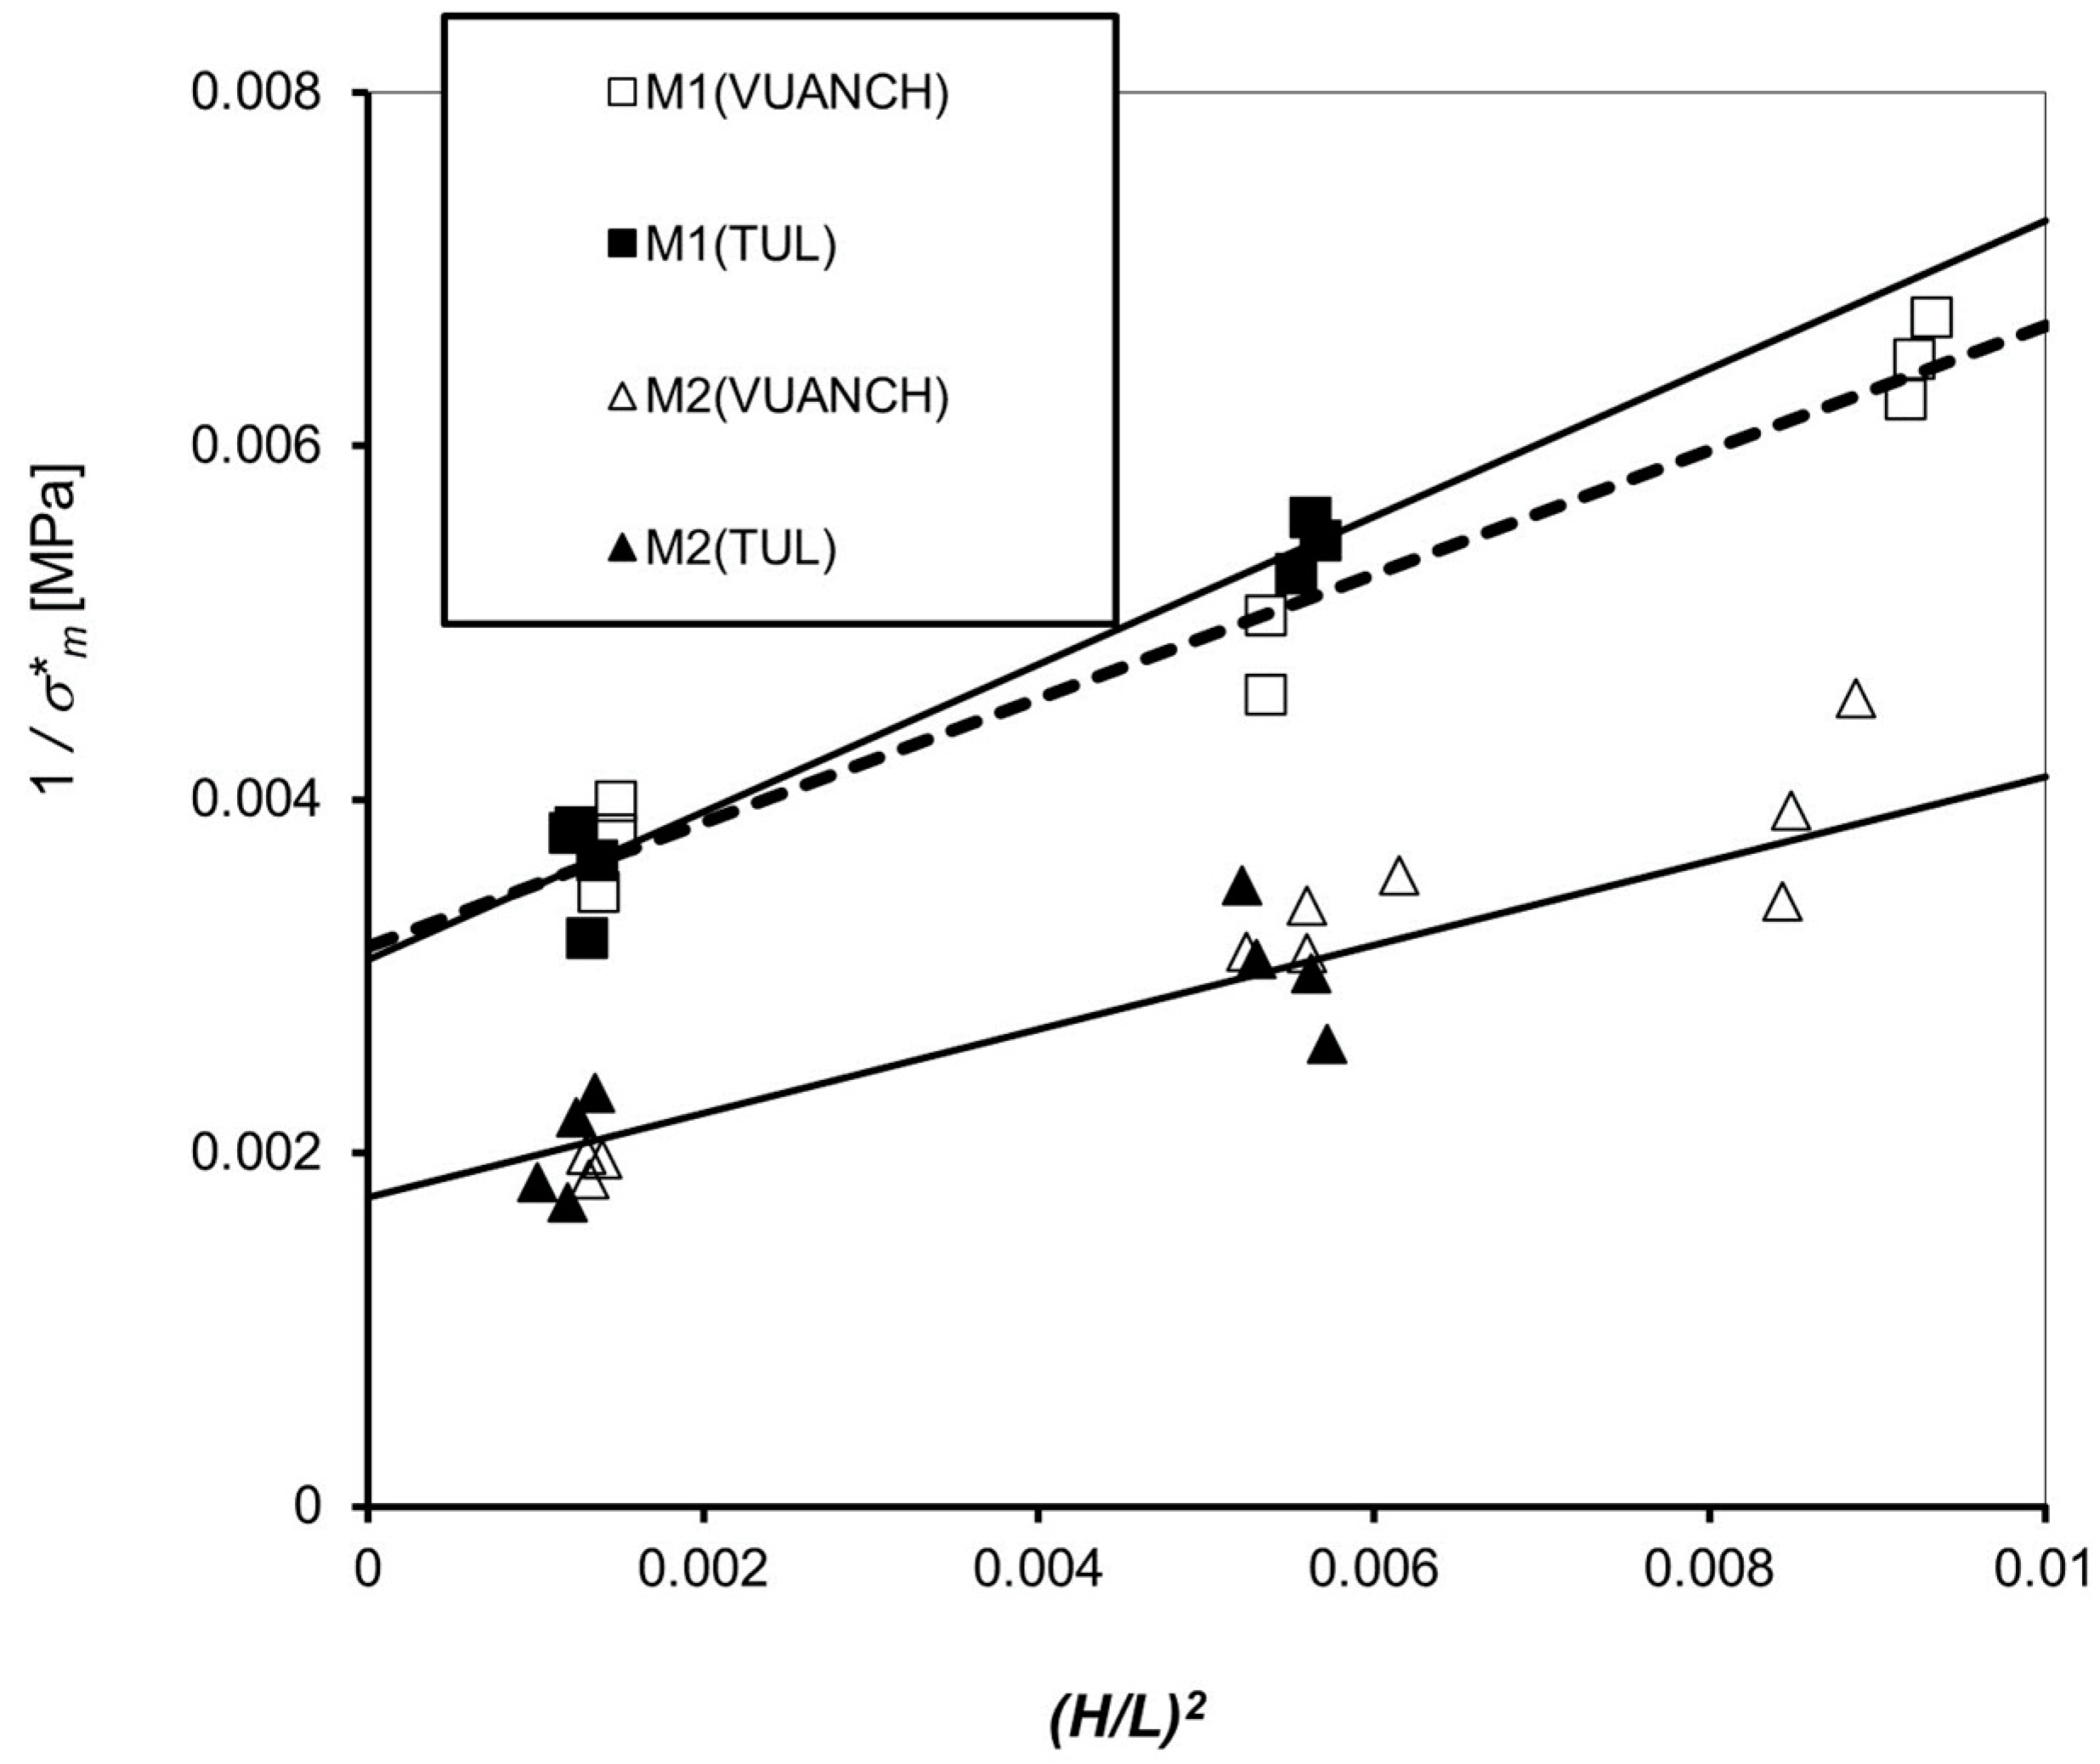
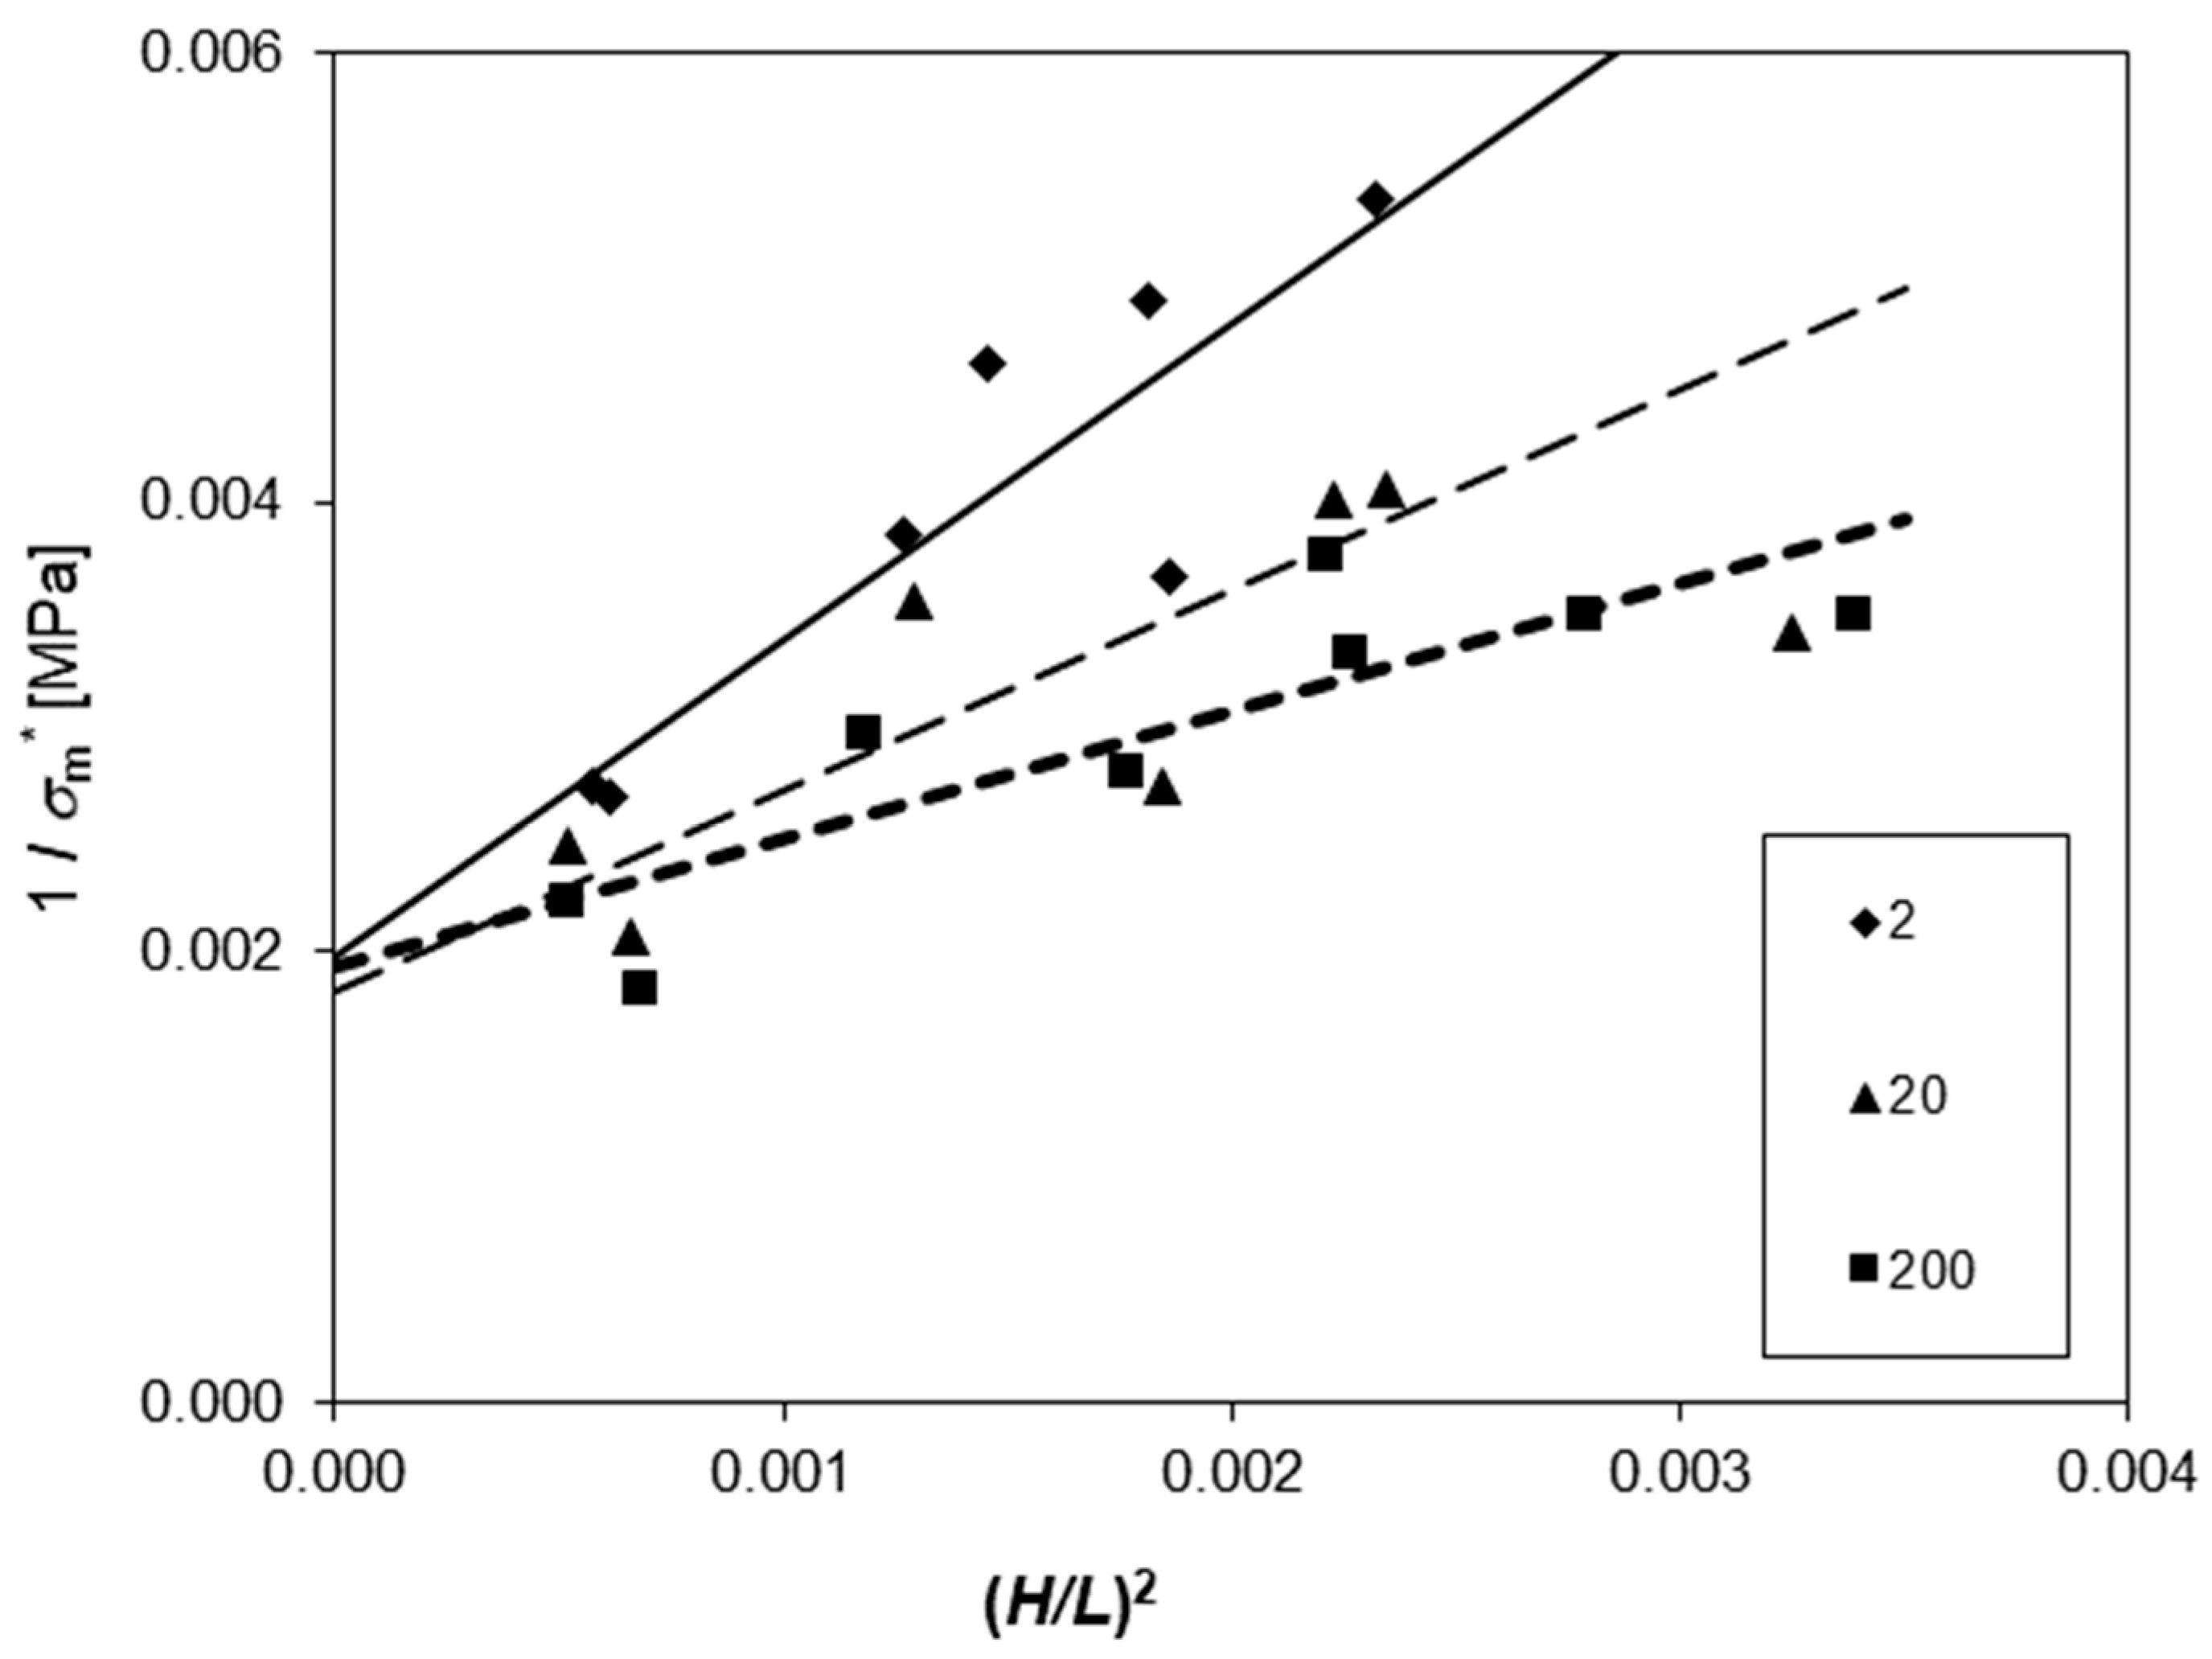
4. Results and Discussion

4.1. Compliance with Theory

The results of the preliminary tests are represented in Figure 3 and Figure 4 and Table 1. Standard deviations of both the basic qualities that are forming the reciprocal intercepts were calculated from the deviation of the intercepts as . σ m 2 . General coincidence between the two partner laboratories was fine: the difference between the averages fell within the interval of standard deviations. The higher scatter in VUANCH results is explainable by a poorer outfitted testing press (the supports fixed against were freely rolling and slightly barreled).
Attempts were made at the beginning to also test the flexure with a very short span of 20 mm; the radius of the supports was only 1 mm; (H/L)2 values above 0.2. The resulting values σ m * were deeply under the anticipated dependence on H/L. Evidently, the results were already affected by the clip. Diverse accidental defects in the prepared composite, particularly in shorter specimens, caused sometimes solitary points in the plot, characterized usually by abrupt shifting of the 1 / σ m * value upwards. Such an outlying point had to be sensibly eliminated from the regression.
After that, the results were entirely encouraging, so the research followed pursuing the optimization of matrix composition and the preparation of composites with various types of fibers and matrices. Extended experiments were carried out with exactly the same matrices M1 and M2, and three different reinforcing fibers: basalt, E-glass, and carbon, with the basic specimen sizes as mentioned above; L was changed on the levels 50, 64, and 120 mm. The assembly in Figure 5 shows excellent regular patterns of regression plots for composites prepared from the M1 matrix with carbon fibers at the curing temperatures 55 °C, 85 °C, and 105 °C.
The essential results in the group of over 500 individual tests are compiled in Table 2; they comprise the specimens, which were cured at 85 °C.
Attention was paid to the relationship between the elastic and strength properties from theory—Equation (18). The last but one column in Table 2 shows that the average values of P are far below the expected unity, and subsequently confirm the non-general validity of Tarnopolsky’s theory. On the other hand, the affinity of both regression plots invokes the idea of a simple similarity. That was tested by the constitution of a dimensionless complex:
Π = Τ σ m / G E
whose values are in the last column of Table 2. It can be seen that this complex performs much better than the anticipated magnitude of unity. This may be encouraging for previous assessments of geocomposite behavior in the future.
It was evident that the sensitivity to squared height—H2—requires taking each specimen as an individual with its actual sizes, to counteract the difference in this common trait with homogeneous specimens, which used to be machined so accurately that the results could be grouped, and as such statistically pre-treated. The overall deviations of the extrapolated values are usually in frames of values with the standard testing of brick and concrete materials.

4.2. Displacement Rate

Test series with basalt fiber composites performed at different displacement rates proved the independence of the overall shape of the 1/E* vs. (H/L)2 plots at low rates and low (H/L)2 values. An introductory series taken at 2 mm/min and 9.2 mm/min showed no difference. When applying a larger interval of 2 to 200 mm/min, however, characteristic regression lines appeared, as in Figure 6 and Figure 7.
Both flexural modulus and strength had approximately the same limits for (H/L)2 → 0, but the slopes of the lines started to differ. Table 3 shows that the evaluated shear modulus G increases with an increasing deformation rate. It supports, at least formally, the conception of a gross description with G composed of static and dynamic elements, while the limiting value of E stays constant as a static material property. The extrapolated value of flexural strength σm behaves similarly, but the quantity of T has unexpectedly reversed course. All these relationships need experimental verification with more significant rate spans concerning the dependence on sizes.

4.3. Unidirectional and Woven Fabrics

An important question arises regarding how the composite properties are influenced by using fabrics instead of individual fibers (rovings). Several experiments were performed to assess the behavior qualitatively. The results represented in Figure 8, Figure 9, Figure 10 and Figure 11 show that unidirectional fabrics exhibit substantially the same positive trend in both reciprocal effective quantities vs. (H/L)2, as did composites prepared from rovings. By contrast, woven fabrics (twill 1/90) express 1/E* vs. (H/L)2 slopes close to zero, and 1/ σ m * vs. (H/L)2 slopes even into negatives. Obviously, there is also a qualitative change in the mode of the weave composite failure.

5. Conclusions

This study aimed to propose a novel size-independent flexure-test technique for geocomposites, which involves testing specimens with a wide range of height-to-span ratios. The key results of this study can be summarized as follows:
The effective flexural modulus and flexural strength of geocomposites fortified with unidirectional fibers exhibit a pronounced dependency on both the sample size and testing parameters. The sheer magnitude of shear stress influence suggests that test outcomes deviate significantly from genuine material properties even when adhering to the L/H ratios prescribed in current standards, particularly when the E/G module ratio exceeds a threshold of 50. Given the consistent linear relationships of the reciprocal effective measures E* and σ m * with the squared ratio (H/L)2, an optimal approach would entail broadening the tests to encompass a variety of specimens with diverse L/H ratios. This methodology, albeit with lesser emphasis, has been previously endorsed in specific standards for evaluating plastic composites. In a refined approach, shear properties, specifically the modulus G and the reciprocal gradient T of the 1/ σ m *   in relation to (H/L)2, are concurrently derived as ancillary attributes. These enhance the precise evaluation of a geocomposite and hold potential utility in design computations.
The novel finding is that the linear correlation between reciprocal effective measures and the squared ratio (H/L)2 is not solely confined to the flexural modulus, as one might anticipate based on insights from plastic composites, but also extends to flexural strength. The theoretical foundation for this latter relationship is rooted in the earlier work of Tarnopolsky and his colleagues. However, for elevated E/G values, the theoretical trajectory tends to deviate from the empirically observed linearity.
The expansion of exploited calculations on the relationship between both ratios of E/G, obtained by evaluating either elastic or failure behavior according to Tarnopolsky’s theory, was not successful, as they mutually differ mainly by order. Instead, better similarity was found using the plain complex Π (Equation (20)) that keeps the anticipated order of unity.
Upon conducting additional preliminary investigations, it was observed that geocomposites, even those reinforced with fabrics, demonstrate the aforementioned linear relationship. While unidirectional fabrics consistently exhibit positive slopes, this trend alters with multidirectional woven fabrics, often approaching zero or manifesting negative values, particularly in the context of strengths.
This research was approached from a phenomenological perspective, thus did not delve into the specific mechanisms of the failures. However, given that all assessed attributes exhibited linearity within a plausible slenderness range, it suggests that any shifts between potential failure modes were statistically seamless. Consequently, the introduced methodology is universally applicable.
In the conducted research, a displacement rate of 2 mm/min was employed, which, based on the findings, offers a more holistic understanding of the material’s properties, particularly facilitating the examination of shear attributes. The material’s response to increased displacement rates, encompassing the transition to brief specimen evaluations and impact tests, warrants further investigation.

Author Contributions

Conceptualization, H.T.D. and O.B.; methodology, H.T.D. and O.B.; software, O.B.; validation, H.T.D. and O.B.; formal analysis, O.B.; investigation, H.T.D. and O.B.; resources, H.T.D. and O.B.; data curation, H.T.D. and O.B.; writing—original draft preparation, H.T.D. and O.B.; writing—review and editing, H.T.D., O.B. and D.K.; visualization, O.B.; supervision, D.K.; project administration, D.K.; funding acquisition, D.K. All authors have read and agreed to the published version of the manuscript.

Funding

This research was funded by the Ministry of Industry and Trade of the Czech Republic, grant number FT-TA4/068.

Institutional Review Board Statement

Not applicable.

Informed Consent Statement

Not applicable.

Data Availability Statement

The data presented in this study are available on request from the corresponding author.

Acknowledgments

This investigation would not have been possible without the financial support of the Ministry of Industry and Trade of the Czech Republic via grant number FT-TA4/068, the grant had created an ideal opportunity for us to cooperate with respectful colleagues who came from České lupkové závody, a.s., ORLEN UniCRE a.s., Ústav fyzikální chemie J. Heyrovského AV ČR, v. v. i., and Technická univerzita v Liberci/Fakulta strojní. I would like to express my respectful gratitude to Petr Louda for his interest and dedication to seeing me pursue my academic career. I have personally been inspired by Louda’s leadership, intelligence, generosity, and his passion for knowledge and business.

Conflicts of Interest

The authors certify that they have no affiliation with or involvement in any organization or entity with any financial or non-financial interest in the subject matter or materials discussed in this manuscript: “Size-Independent Flexure Test Technique for the Mechanical Properties of Geocomposites Reinforced by Unidirectional Fibers”.

References

  1. Davidovits, J. Chemistry of Geopolymeric systems, terminology. In Proceedings of the 2nd International Conference on Geopolymere, Sain-Quentin, France, 30 June—2 July 1999; pp. 9–22. [Google Scholar]
  2. Davidovits, J.; Sawyer, J.L. Early High-Strength Mineral Polymer. U.S. Patent 4,509,985, 9 April 1985. [Google Scholar]
  3. Davidovits, J. GEOPOLYMERS: Inorganic Polymeric New Materials. J. Therm. Anal. 1991, 37, 1633–1656. [Google Scholar] [CrossRef]
  4. Davidovits, J. Geopolymer—Fiber composites. In Geopolymer Chemistry & Applications; Joseph, D., Ed.; Geopolymer Institute: Saint-Quentin, France, 2008. [Google Scholar]
  5. Davidovits, N.; Davidovics, M.; Davidovits, J. Ceramic-ceramic composite material and production method. Composites 1991, 22, 4888311. [Google Scholar] [CrossRef]
  6. Davidovits, J. 30 Years of Successes and Failures in Geopolymer Applications—Market Trends and Potential breakthroughs. In Proceedings of the Geopolymer 2002 Conference, Melbourne, Australia, 28–29 October 2022; pp. 1–16. Available online: https://www.geopolymer.org/wp-content/uploads/30YearsGEOP.pdf (accessed on 15 July 2023).
  7. Davidovits, J. Geopolymer chemistry and sustainable Development—The Poly(sialate) terminologys: A very useful and simple model for the promotion and understanding of green-chemistry. In Proceedings of the Geopolymer 2005 World Congress, Saint-Quentin, France, 29 June–1 July 2005; Geopolymer Institute: Saint-Quentin, France, 2005; pp. 9–16. [Google Scholar]
  8. Lyon, R.E.; Balaguru, P.N.; Foden, A.; Sorathia, U.; Davidovits, J.; Davidovics, M. Fire resistant alumosilicate cemposites. Fire Mater. 1997, 21, 67–73. [Google Scholar] [CrossRef]
  9. Duxson, P.; Fernández-Jiménez, A.; Provis, J.; Lukey, G.; Palomo, A.; van Deventer, J. Geopolymer technology: The current state of the art. J. Mater. Sci. 2007, 42, 2917–2933. [Google Scholar] [CrossRef]
  10. Papakonstantinou, C.G.; Balaguru, P.; Lyon, R.E. Comparative study of high temperature composites. Compos. Part B Eng. 2001, 32, 637–649. [Google Scholar] [CrossRef]
  11. Papakonstantinou, C.G.; Balaguru, P.N. Use of Geopolymer Matrix for High Temperature Resistant Hybrid Laminates and Sandwich Panels. In Proceedings of the Geopolymer 2005 World Congress, Saint-Quentin, France, 29 June–1 July 2005; Geopolymer Institute: Saint-Quentin, France, 2005; pp. 201–207. Available online: http://books.google.com.vn/books?id=wIFo7L_zO8AC&pg=PA201&lpg=PA201&dq=Use+of+geopolymer+matrix+for+high+temperature+resistant+hybrid+laminates+and+sandwich+panels,+Geopolymer,+Green+Chemistry+and+Sustainable+Development+Solutions&source=bl&ots=Fk-tmE9Tb_ (accessed on 10 August 2023).
  12. Sheppar, L.M. Geopolymer Composites: A Ceramics Alternative to Polymer Matrices. In Proceedings of the The 105th Annual Meeting and Exposition of the American Ceramic Society, Nashville, TN, USA, 27–30 April 2003; Available online: http://composite.about.com/library/weekly/aa030529.htm (accessed on 10 August 2023).
  13. Bortnovsky, O.; Bezucha, P.; Dedeček, J.; Sobalík, Z.; Vodičková, V.; Kroisová, D.; Roubíček, P.; Urbanová, M. Properties of Phosphorus-Containing Geopolymer Matrix and Fiber-Reinforced Composite. Mech. Prop. Perform. Eng. Ceram. Compos. IV 2009, 283–299. [Google Scholar] [CrossRef]
  14. Bell, J.L.; Comrie, D.C.; Gordon, M.; Kriven, W.M. Graphite Fiber Reinforced Geopolymer Molds for Near Net Shape Casting of Molten Diferrous Silicide. In Proceedings of the GGC 2005: International Workshop On Geopolymers And Geopolymer Concrete, Perth, Australia, 28–29 September 2005; Curtin University of Technology: Bentley, WA, Australia, 2005. [Google Scholar]
  15. American Society for Testing & Materials. Standard Test Method for Flexural Properties of Continuous Fiber-Reinforced Advanced Ceramic Composites; ASTM: West Conshohocken, PA, USA, 2013; Volume 15. [Google Scholar]
  16. DIN V ENV 658-3:1993-02; Advanced Technical Ceramics—Mechanical Properties of Ceramic Composites at Room Temperature—Part 3: Determination of Flexural Strength. The European Committee for Standardisation: Bruxelles, Belgium, 1993.
  17. BS IN ISO 14125:1998; Fiber-Reinforced Plastic Composites—Determination of Flexural Properties. British Standard Institute: London, UK, 2003.
  18. Geopolymer Institute. Geopolymer Camp. Geopolymer Cement and Geopolymer Concrete—Geopolymer Institute. 2009. Available online: http://www.geopolymer.org/camp (accessed on 10 August 2023).
  19. EN ISO 14130; Plastic Composites Reinforced with Fibers—Determination of Effective Interlaminar Shear Strength by Short Beam Method. The International Organization for Standardization: London, UK, 1997.
  20. EN 13706-2; Reinforced Plastics Composites—Specifications for Pultruded Profiles—Method of Test and General Requirements. European Standard: Pilsen, Czech Republic, 2002.
  21. Tarnopolsky, Y.M.; Roze, A.V.; Polyakov, V.A. Shear effects in flexure of oriented glass-fiber laminates. Mech. Polim. 1965, 2, 38–46. (In Russian) [Google Scholar]
  22. Tarnopolsky, Y.M.; Roze, A.V. Specialties of Calculation of Reinforced Plastics Details; Zinatne Press: Riga, Latvia, 1969. (In Russian) [Google Scholar]
  23. Tarnopolsky, Y.M.; Kincis, T.Y. Static Test Methods for Composites (Translated from the Third, Revised and Supplemented Soviet Edition under the Editorship of George Lubin); Van Nostrand Reinhold Company: New York, NY, USA, 1985; pp. 285–298. [Google Scholar]
  24. Pernica, D.; Reis, P.; Ferreira, J.; Louda, P. Effect of test conditions on the bending strength of a geopolymer-reinforced composite. J. Mater. Sci. 2010, 45, 744–749. [Google Scholar] [CrossRef]
  25. Xiem, N.T.; Kroisová, D.; Louda, P.; Hung, T.D.; Rozek, Z. Effects of temperature and plasma treatment onmechanical properties of ceramic fibres. J. Achiev. Mater. Manuf. Eng. 2009, 37, 526–531. [Google Scholar]
Figure 1. Ratio of the effective value E to the virtual value E*; ratios of E*/G in the legend.
Ceramics 06 00126 g001
Figure 2. Theoretical size dependences of σ m / σ m * ratios at different E/G (in the legend).
Ceramics 06 00126 g002
Figure 3. Reciprocal effective elasticity modulus vs. (H/L)2 ratio.
Ceramics 06 00126 g003
Figure 4. Reciprocal effective flexural strength vs. (H/L)2 ratio.
Ceramics 06 00126 g004
Figure 5. Reciprocal effective flexural properties ((a,c,e) for flexural modulus and (b,d,f) for flexural strength) of composites carbon HTS 5631 1600tex 24k-M1 matrix at different temperatures of curing in legends.
Ceramics 06 00126 g005
Figure 6. Correlation of flexural modulus for geopolymer M2-basalt; rate of deformation in mm/min in the legend.
Ceramics 06 00126 g006
Figure 7. Correlation of flexural strength for geopolymer M2-basalt; rate of deformation in mm/min in the legend.
Ceramics 06 00126 g007
Figure 8. Comparison of E in carbon-woven (twill) and unidirectional fabrics, last numbers in the legend: days of cooled matrix storage.
Ceramics 06 00126 g008
Figure 9. Comparison of σm in carbon-woven (twill) and unidirectional fabrics, last numbers in the legend: days of cooled matrix storage.
Ceramics 06 00126 g009
Figure 10. Comparison of E in E-glass-woven (twill) and unidirectional fabrics, last numbers in the legend: days of cooled matrix storage.
Ceramics 06 00126 g010
Figure 11. Comparison of σm in E-glass-woven (twill) and unidirectional fabrics, last numbers in the legend: days of cooled matrix storage.
Ceramics 06 00126 g011
Table 1. Results of the comparative tests on the composites with matrices M2 and M1, and carbon fiber H1600 in two laboratories; ± sign marks standard deviation and variation.
MatrixLaboratoryFlexural
Modulus
Shear
Modulus
Flexural
Strength
E [GPa]G [GPa]E/Gσm[MPa]
M2VUANCH109 ± 32±29%0.76143631 ± 75±12%
M2TUL111 ± 14±13%0.73152571 ± 75±13%
M1VUANCH96 ± 26±27%0.35278316 ± 18±6%
M1TUL128 ± 21±17%0.33392323 ± 18±5%
Table 2. Compiled results of the estimation of basic mechanical properties E and σm of geocomposites cured at 85 °C.
MatrixFiberFlexural ModulusShear Modulus Flexural StrengthSlopeProduct
E [GPa]G [GPa]E/Gσm [MPa]T [MPa]P
M1basalt58.1 ± 3.10.45129400 ± 293.270.181.06
carbon179.5 ± 24.90.47380672 ± 682.950.281.66
E-glass61.1 ± 11.60.16388145 ± 140.940.422.53
M2basalt61.0 ± 4.00.50122306 ± 281.160.080.46
carbon138.5 ± 10.70.81171649 ± 751.580.080.42
E-glass65.0 ± 5.20.46142276 ± 501.190.120.61
Table 3. Basic flexural properties of geocomposite M2-basalt at different rates of deformation.
SpeedFlexural ModulusShear ModuleFlexural StrengthReciprocal Slope
[mm/min]E [GPa]G [GPa]σm [MPa]T [MPa]
269.7 ± 6.50.7505.2 ± 129.70.7
2073.3 ± 10.20.5546.0 ± 145.21.1
20083.4 ± 6.30.2518.1 ± 78.61.8
Disclaimer/Publisher’s Note: The statements, opinions and data contained in all publications are solely those of the individual author(s) and contributor(s) and not of MDPI and/or the editor(s). MDPI and/or the editor(s) disclaim responsibility for any injury to people or property resulting from any ideas, methods, instructions or products referred to in the content.

