Abstract
Geopolymer concrete is gaining recognition as an environmentally friendly alternative to traditional cement-based materials, offering potential solutions for reducing the carbon emissions of the construction industry. This study aims to develop GGBFS–FNS geopolymers utilising ferronickel slag (FNS) and ground-granulated blast-furnace slag (GGBFS). Ground FNS (GFNS) is a potential candidate for replacing fly ash in geopolymers. This research aims to develop for the first time a GGBFS–FNS alkali-activated concrete. Numerous trials were conducted including different GGBFS–FNS blend percentages, several chemical admixtures and varying activator concentrations to develop the optimal binder mix composition. The effects of different chemical admixtures on the properties of geopolymer pastes, mortars, and concretes were investigated. The study evaluated setting time, compressive strength, shrinkage, and physical and durability properties. The results indicate that conventional admixtures have limited impact on the setting time, while increasing the water/solid ratio and decreasing the GGBFS content could extend the initial and final setting times. The presence of FNS aggregate could improve the compressive strength of geopolymer mortars. The water absorber admixture was highly effective in reducing shrinkage and increasing chloride diffusion resistance. The geopolymer mix containing 50 wt.% GFNS and 50 wt.% GGBFS with the presence of the water absorber admixture presented high chloride diffusion resistance, non-reactivity to the alkali–silica reaction and high sulphate resistance. Overall, the GGBFS–FNS geopolymers exhibited promising potential for engineering applications as an environmentally friendly material, particularly in aggressive environments.
1. Introduction
Geopolymer concrete has gained considerable attention as a promising alternative to OPC-based materials for mitigating the environmental impacts of the construction materials sector [1,2]. The cement and concrete sector accounts for approximate 5% of anthropogenic carbon emissions. Consequently, decarbonisation of this sector plays a crucial role in achieving the net-zero target by 2050 [3]. Geopolymers are formed through the dissolution of aluminosilicate materials in alkali silicate solutions, resulting in the formation of polysialates by the combination of cross-linked alumina (AlO4−) and silica (SiO4). Common aluminosilicate precursors for geopolymers include fly ash, ground-granulated blast-furnace slag (GGBFS) and metakaolin. Low-calcium geopolymers primarily consist of fly ash or metakaolin, while high-calcium geopolymers are based on GGBFS. Geopolymers have proven their comparable mechanical and durability properties to conventional OPC-based materials [4,5]. Geopolymers exhibit high early strength, superior resistance to acid, a low creep coefficient and lower CO2 emissions than OPC materials [6,7]. In order to accelerate the adoption of geopolymers in the construction industry, the development of a one-part geopolymer, which only requires the addition of water, has been pursued [8].
The availability of fly ash is decreasing due to the closure of coal-fired power plants worldwide. In Australia and the Pacific region, ferronickel slag (FNS), which is a potential candidate to replace fly ash in geopolymers, is readily available, with current stockpiles exceeding 25 Mt and an annual production of 2 Mt by Societe Le Nickel (SLN) in New Caledonia. FNS is a low-calcium material, a by-product of nickel production obtained through the smelting of nickel ore in an electric furnace, followed by granulation using water or air [9]. According to the European Catalogue for Hazardous Wastes, FNS is classified as a non-hazardous material [10]. Furthermore, FNS has internal and external radiation indices close to zero, as indicated in a previous study [11]. FNS has been investigated for its potential use as fine aggregate and a supplementary cementitious material (SCM) in OPC-based concretes. It has been reported that the replacement of natural sand by FNS aggregate can improve the mechanical and durability properties of blended OPC–fly ash concrete due to the enhanced interface between the cement matrix and FNS aggregate [9,12]. The soundness of OPC-based materials incorporating ground FNS (GFNS) is comparable to conventional OPC–fly ash blends, as demonstrated by Le-Chatelier and autoclave tests [13].
GFNS has been investigated as a geopolymer precursor in previous studies. It has been used either as a sole precursor or in combination with metakaolin or fly ash to produce geopolymers. The presence of metakaolin in FNS-based geopolymers decreased the compressive strength due to an increased porosity [14]. Major crystalline phases detected in FNS geopolymers included sodalite, maghemite, thermonatrite, trona and calcite [15]. In GFNS and fly ash geopolymers, increasing the GFNS content and decreasing the fly ash content decreased the setting time and workability of geopolymers. In addition, the highest compressive strength was achieved in geopolymer samples containing 75% GFNS–25% fly ash content in the binder, up to 90 days after casting [16]. Successful fabrication of geopolymers using GFNS and fly ash activated by phosphoric acid was also reported in a previous study [17]. However, combining GFNS with GGBFS has not been investigated. Because the addition of GGBFS was reported to enhance the durability properties of geopolymers containing a low-calcium binder [18,19], investigating GFNS–GGBFS blends as a precursor for geopolymer concrete seems relevant. Furthermore, the utilisation of FNS aggregate can address the rarefaction of natural fine aggregates in metropolitan areas. This study aims to develop GGBFS–FNS geopolymers by blending GFNS and GGBFS as the precursor and examine the effects of natural sand replacement by FNS aggregate. Geopolymer pastes, mortars and concretes are considered in this study. The effects of different chemical admixtures on the properties of GGBFS–FNS geopolymers are also investigated. Fresh and hardened properties such as setting time, compressive strength, shrinkage, water absorption and chloride diffusion resistance are evaluated. Numerous trials are conducted including different GGBFS–FNS blend percentages, several chemical admixtures and varying activator concentrations. Only selected mix designs with suitable performance in terms of both fresh and hardened properties are presented in this paper. To the authors’ knowledge, this is the first study considering blends of GGBFS–FNS as a precursor for alkali-activated concretes, paving the way for the utilisation of FNS in the construction industry. Ultimately, geopolymer mix compositions that are suitable for replacing conventional OPC-based materials in engineering applications are proposed.
2. Materials and Mix Designs
2.1. Materials
GFNS and GGBFS were used as aluminosilicate precursors to create the geopolymer binder in this study. GFNS was ground from FNS aggregate supplied by Societe Le Nickel (SLN) in New Caledonia whilst GGBFS was branded as Enviro® from Boral Pty Ltd. in Sydney, Australia. The chemical composition identified by X-ray fluorescence (XRF) analysis (PANalytical AXIOS instrument in Sydney, Australia) and the particle size distribution measured by laser diffraction are shown in Table 1 and Figure 1, respectively. Furthermore, the X-ray diffraction (XRD) patterns of GFNS and GGBFS measured by Bruker D8 Discover X-ray diffractometer (Sydney, Australia) are presented in Figure 2.

Table 1.
Chemical compositions of GFNS and GGBFS by XRF.
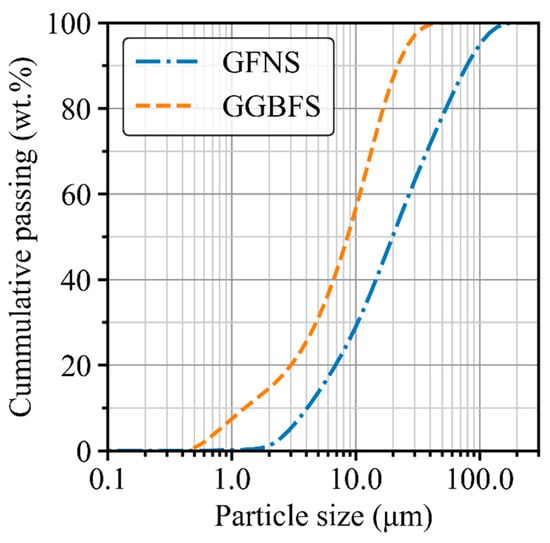
Figure 1.
Particle size distribution of GFNS and GGBFS.
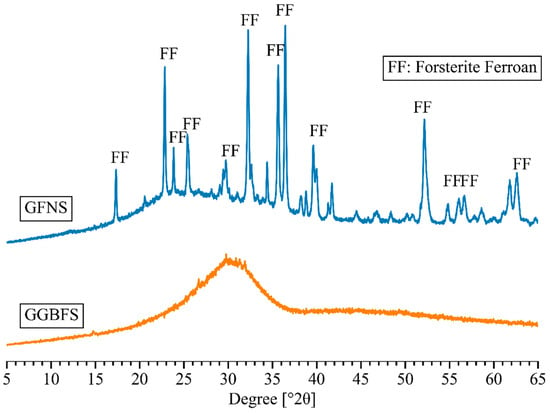
Figure 2.
XRD patterns of GFNS and GGBFS.
Two types of fine aggregate were used in this study: FNS aggregate as manufactured aggregate and Sydney sand as natural aggregate. The relative densities of FNS aggregate and Sydney sand are 2876 kg/m3 and 2650 kg/m3, respectively, along with a water absorption of 0.8% and 3.5%, respectively. The coarse aggregate was basalt, with maximum nominal sizes of 20 mm and 10 mm. The gradation of coarse and fine aggregates is showed in Figure 3.
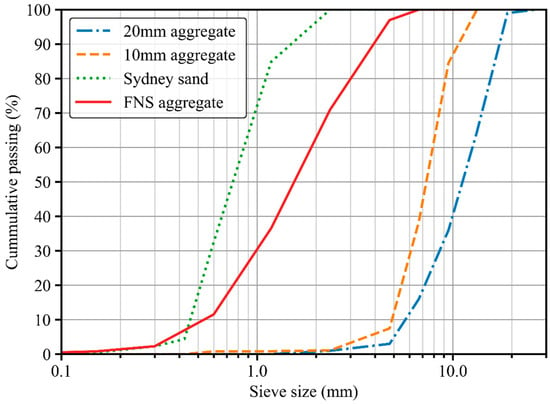
Figure 3.
Gradations of coarse and fine aggregates.
Sodium hydroxide and sodium silicate solutions were used to create the activator solution. The sodium hydroxide pellets with 98% purity have a specific gravity of 2.1 and a molecular weight of 40. The sodium silicate solution was supplied by PQ Australia Pty Ltd. comprising 14.7 wt.% Na2O, 29.4 wt.% SiO2 and 55.9 wt.% H2O. In addition, the sodium silicate solution has a molar ratio Ms (SiO2/Na2O) = 2 and a specific gravity of 1.53.
2.2. Mix Design
Geopolymer paste, mortar and concrete mix designs were developed in this study. The effects of the binder compositions including GFNS and GGBFS contents, activator concentrations and several chemical admixtures were investigated in this study. The effects of lignosulfonate-based (LS), polycarboxylate-based (PCE), sodium naphthalene formaldehyde sulphonate (SNS) and amino trimethylene phosphonic (ATMP) admixtures on the setting time were investigated. On the other hand, a water absorber (WA) admixture was added to evaluate its effects on shrinkage, compressive strength, and physical and durability properties of geopolymers. The silica fume was also considered, as the silica fume was reported to increase the setting time in fly ash–GGBFS geopolymers [20]. The details of paste, mortar and concrete mix compositions are presented in Table 2, Table 3 and Table 4, respectively.

Table 2.
Geopolymer paste mix compositions.

Table 3.
Geopolymer mortar mix compositions.

Table 4.
Geopolymer concrete mix compositions.
3. Experimental Programme
3.1. Setting Time of Geopolymer Pastes
The initial and final setting times of geopolymer pastes were determined following the ASTM C191 [21] using an automatic Vicat apparatus. The initial setting time was defined as the elapsed time between initial contact of precursor and activator and the needle penetration of 25 mm. The final setting time was determined as the elapsed time between initial contact of precursor and activator and the needle penetration of 0 mm. To ensure accuracy, two additional penetration measurements were conducted on different areas of the paste surface to validate the final setting time.
3.2. Compressive Strength and Shrinkage of Geopolymer Mortars
The compressive strength of geopolymer mortar M1 to M4 mixes was carried after 3, 7 and 28 days of casting, using 50 mm × 50 mm cube specimens. After demoulding at day 1, cube specimens were wrapped to prevent moisture loss and placed in a controlled chamber maintained at a temperature of 23 ± 2 °C. The test protocol complied with ASTM C109 [22], with a loading rate ranging from 0.9 to 1.8 kN/s.
Autogenous and total shrinkage measurements for mixes M5 to M10 were conducted by using prismatic test specimens 40 mm × 40 mm × 160 mm in size, according to EN 12617-4 and Australian Standard AS 2350.13 [23,24]. The prisms were demoulded after 1 day of casting. For the autogenous shrinkage specimens, all surfaces were covered by self-adhesive aluminium foil to prevent any moisture loss. Total shrinkage specimens, on the other hand, were left unsealed and exposed to a controlled environment at a temperature of 23 ± 2 °C and a relative humidity (RH) of 50 ± 3% after demoulding. The initial (reference) length of the shrinkage specimens was determined within 5 min after demoulding using a digital meter with an accuracy of ±1 μm/m. Subsequent shrinkage readings were recorded during the experimental period. Both compressive strength and shrinkage values are presented as the average of three measurements.
3.3. Compressive Strength and Total Shrinkage of Geopolymer Concretes
Following demoulding at day 1, 100 × 200 mm cylinders were wrapped to prevent any moisture loss and cured in a controlled chamber at a temperature of 23 ± 2 °C. The compressive strength of the geopolymer concretes was measured after 28 days of casting. The test loading rate of 20 ± 2 MPa/minute was applied, in accordance with Australian Standard AS 1012.9 and ASTM C39 [25,26].
Measurements of total shrinkage were conducted using prismatic specimens with a dimension of 75 mm × 75 mm × 280 mm, complying with ASTM C157 and Australian Standard AS 1012.13 [27,28]. The specimens were demoulded after 1 day of casting and exposed to the controlled environment for up to 430 days.
3.4. Physical Properties and Resistivity of Geopolymer Concretes
The physical properties of the geopolymers, including water absorption, volume of permeable void (VPV) and bulk density, were assessed after 28 days. These properties were determined in accordance with ASTM C642 [29] by using concrete discs with a diameter of 100 mm and a thickness of 50 mm, which were cut from concrete cylinders. Surface and bulk resistivity measurements were conducted after 28 days using water-saturated concrete cylinders (100 mm × 200 mm). The experimental procedures for surface and bulk resistivity tests followed AASHTO TP95 and ASTM C1876, respectively [30]. The details of the physical and resistivity tests are described in the previous studies of the authors [9,31].
3.5. Chloride Diffusion Resistance Tests
All chloride diffusion tests for geopolymer concretes were carried out at 28 days. The rapid chloride penetration test (RCPT) and the chloride migration test (CMT) were conducted, applying an external electrical voltage to accelerate the chloride penetration into the concrete specimens. The RCPT and CMT were in compliance with ASTM C1202 and Nordtest NT Build 492, respectively [32,33]. However, the RCPT was modified to 10 V instead of the original 60 V [34,35] while the test duration was kept at 6 h, denoted as a modified RCPT test. For both the modified RCPT and CMT, saturated concrete discs of 100 mm diameter and 50 mm thickness were utilised.
The bulk diffusion test is a non-steady-state diffusion test in accordance with ASTM C1556 and NT Build 443 [36]. After 28 days, concrete cylinders were cut into discs with a diameter of 100 mm and a thickness of 75 mm. All surfaces of the concrete discs, except for the top surface, were coated to ensure that the chloride diffusion occurred solely from the top surface. After 35 days of immersing in 165 g/L NaCl solution, concrete was powdered every 2 mm up to 25 mm depth. Subsequently, the total (acid-soluble) chloride content was measured from the concrete powder by utilising a potentiometric titration machine. The apparent chloride diffusion coefficient (Da) was determined using non-linear curve fitting, as described in ASTM C1556 or NT Build 443 [36].
3.6. Alkali–Silica Reaction and Length Change in Sulphate Solution
Alkali–silica reaction (ASR) testing was conducted using the accelerated mortar bar test (AMBT) method, based on the ASTM C1260 protocol similar to Australian Standard AS 1141.60.1) [37,38]. The length change of the specimens exposed to the sulphate solution was monitored in accordance with ASTM C1012 [39]. Prismatic specimens with dimensions of 25 mm × 25 mm × 285 mm were used for two tests. The mortar mix composition used to fabricate the mortar prisms was similar to concrete mix C3, as specified in Table 4, with the exclusion of the 20 mm and 10 mm coarse aggregates. Five specimens were created for each test. The expansion due to the ASR in the AMBT was monitored for up to 21 days, whilst the length change of the mortar prisms exposed to the sulphate solution was measured over a period of 1 year.
4. Results and Discussion
4.1. Setting Time of Geopolymer Pastes
Figure 4 presents the initial and final setting times of the geopolymer pastes in minutes. Mixes P1 to P5 exhibited significantly shorter setting times compared with mixes P6 to P8. Mixes P1 and P2 had the same GGBFS content, activator molar ratio (MR) and Na2O/binder ratio. The longer initial and final setting times of mix P2, as compared with mix P1, can be attributed to the higher water/solid ratio of P2. Pastes P3 and P4, which had similar mix compositions to P1, were fabricated to investigate the effects of LS-based and PCE-based admixtures on the setting time. The presence of LS-based and PCE-based admixtures in the mix composition produced no positive influence on the setting time, indicated by similar initial and final setting times among P1, P3 and P4 mixes.
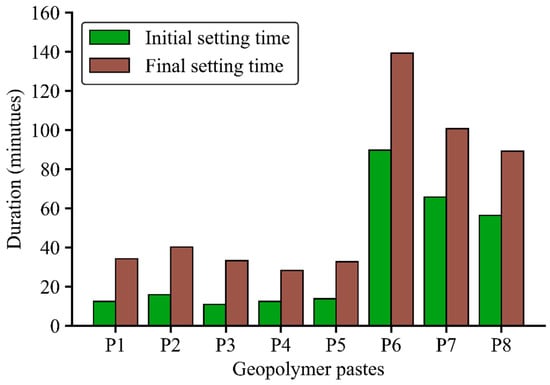
Figure 4.
Initial and final setting time of geopolymer pastes.
In geopolymer paste P5, SNS and ATMP admixtures were added to the mixtures and the GGBFS/binder ratio was reduced from 38.9 wt.%. However, the initial and final setting times of the P5 mix were similar to that of the P1 mix, indicating that the SNS and ATMP admixtures could not increase the setting time in GGBFS–FNS geopolymer paste. Among all the pastes, mix P6 exhibited the longest initial and final setting times, with an initial setting time of 90 min and a final setting time of 140 min. This can be attributed to the highest water/solid ratio of 0.40 and lowest GGBFS/binder ratio at 23.6 wt.%. When the water/solid ratio was decreased to 0.36 and the GGBFS/binder ratio was increased to 26.9 wt.% in paste P7, the initial and final setting times reduced to 65 min and 100 min, respectively. Mix P8 had the same water/solid ratio as P7 but a higher GGBFS/binder ratio than P7, at 32.9 wt.%, resulting in shorter initial and final setting times of 56 min and 90 min, respectively. In summary, a higher water/solid ratio extended the setting time whilst a higher GGBFS content reduced the setting time in the GGBFS–FNS geopolymers. Importantly, mixes P5 to P8 complied with the Australian Standard AS 3972 [40], as their initial setting times exceeded 45 min, making them suitable for practical applications.
4.2. Compressive Strength of Geopolymer Mortars
Based on the setting time results obtained with geopolymer pastes (Section 4.1), the mix compositions of the geopolymer mortars M1 to M4 were formulated. Mix M1 had a precursor and activator compositions similar to paste P6, with Sydney sand used as the fine aggregate. Mixes M2 to M4 had the same precursor and activator compositions to paste P7. In addition, 100 wt.% FNS aggregate as fine aggregate was utilised in mix M2, and 50 wt.% and 100 wt.% of FNS aggregate replaced Sydney sand in mixes M3 and M4, respectively, to investigate the influence of the FNS aggregate on the mortar compressive strength.
Figure 5 presents the development of the compressive strength for up to 28 days of mixes M1 to M4. M1 showed the lowest compressive strength among all mortar mixes, with only 13 MPa after 28 days. This can be attributed to the high water/solid ratio as well as the low Na2O/binder and GGBFS/binder ratios compared with mixes M2 to M4. In contrast, mix M2 exhibited the highest compressive strength, from 15 MPa at day 3 to more than 40 MPa after 28 days. Mix M3 had a similar compressive strength to M2 at 3 days. However, replacing 50 wt.% FNS aggregate with Sydney sand in mix M3 reduced the compressive strength at 7 and 28 days compared with mix M2. Specifically, the 3-day and 28-day compressive strength values of mix M3 were 15% and 9% lower, respectively, than those of mix M2,. Similarly, when 100 wt.% Sydney sand was used in mix M4, the compressive strength values were further reduced. The compressive strength of M4 developed from around 8.4 MPa at day 3 to 29 MPa at day 28, which was 28% lower than the 28-day M2 compressive strength. In conclusion, the presence of FNS aggregate in GGBFS–FNS geopolymers can enhance the compressive strength of mortar. Previous studies indicated the improved mechanical and durability properties of OPC-based concretes with the presence of FNS aggregate, attributed to the better interfacial transition zone of FNS aggregate and cement paste [9,12]. However, the effect of FNS aggregate on GGBFS–FNS geopolymer properties requires further research to draw a definitive conclusion.
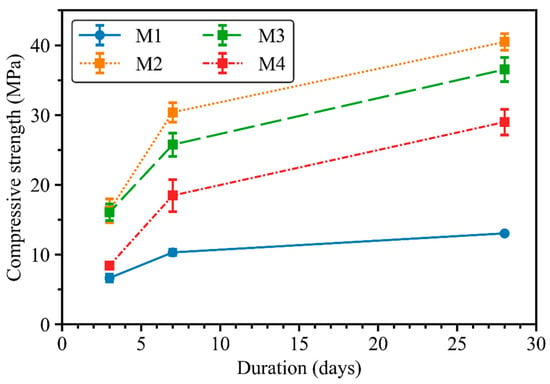
Figure 5.
Compressive strength development of geopolymer mortar mixes from M1 to M4.
4.3. Autogenous and Total Shrinkage of Geopolymer Mortars
Mortar mixes M5 to M10 were formulated to investigate the effects of the water/solid and GGBFS/binder ratios and the presence of the water absorber admixture on autogenous and total shrinkage. Figure 6 shows the development of autogenous (a) and total shrinkage (b) for mixes M5 to M10 over a period of 480 days. Regarding autogenous shrinkage in Figure 6a, the inclusion of the water absorber in mixes M6, M8 and M10 significantly reduced the autogenous shrinkage in comparison with M5, M7 and M9. To be specific, the autogenous shrinkage of M6, M8 and M10 presented an expansion (positive values) for up to 200 days after casting, following by shrinkage, reaching around −200 μm/m after 480 days. By contrast, all autogenous shrinkage values of M5, M7 and M9 exceeded −1000 μm/m just 14 days after casting. Among mortar mixes without the water absorber admixture (M5, M7 and M9), the highest development rate of autogenous shrinkage was observed in the first 50 days, followed by a modest increasing rate up to 480 days. Moreover, mix M7 with a 50 wt.% GGBFS/binder ratio and a water/solid ratio of 0.38 presented the lower autogenous shrinkage during the test duration compared with mixes M5 and M9 at approximate −2000 μm/m at 480 days. Increasing the GGBFS/binder ratio to 100 wt.% in mix M5 or decreasing the water/solid ratio to 0.29 in mix M9 resulted in higher autogenous shrinkage. The results revealed that replacing GGBFS with GFNS could reduce the autogenous shrinkage in GGBFS–FNS geopolymers. Mix M9 showed the highest autogenous shrinkage among all mortar mixes due to the high binder content and lowest water/solid ratio, with the autogenous shrinkage strain reaching more than −3000 μm/m after 480 days.
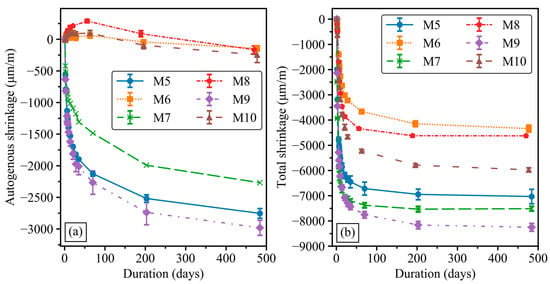
Figure 6.
Development of geopolymer mortar shrinkage. (a) Autogenous shrinkage. (b) Total shrinkage.
The total shrinkage results in Figure 6b show similar trends to autogenous shrinkage over 480 days. Mixes with the water absorber admixture (M6, M8 and M10) presented a remarkable reduction in total shrinkage compared with the M5, M7 and M9 mixes without the water absorber. However, M10 exhibited considerably higher total shrinkage than that of M6 and M8, whilst the variations in autogenous shrinkage were almost identical among the three mortar mixes. In all mixes, the total shrinkage also significantly increased in the first 50 days, constituting more than 90% of the final value, and then marginally increased until 480 days. The total shrinkage of M7 was higher than that of the M5 mix, whilst the autogenous shrinkage of M5 and M7 presented an opposite trend. This disparity may be attributed to the different effects of GFNS on the development of autogenous and drying shrinkage in GGBFS–FNS geopolymer blends. Similar to autogenous shrinkage, mix M9 exhibited the highest total shrinkage values throughout the test duration. The autogenous and total shrinkage values in this study were lower than in a previous study by Cao et al. [41], with varying proportions between GFNS and GGBFS.
4.4. Compressive Strength and Total Shrinkage of Geopolymer Concretes
Table 5 presents the 28-day compressive strength of the three concrete mixes. A combination of 50 wt.% FNS aggregate and 50 wt.% Sydney sand was utilised as fine aggregate in concrete mixes to obtain an optimal gradation, as revealed in previous studies [9,12,42]. Concrete C1 exhibited the lowest values among all concretes at 43.54 MPa. Mix C1 was developed with the same water/solid and GGBFS/binder ratios as paste P8. In mix C2 and C3, the GGBFS content was increased and the Na2O/binder was increased by adding NaOH pellets into the mix compositions. In addition, the water/solid ratio was reduced from 0.37 in mix C1 to 0.29 in mixes C2 and C3. Consequently, the compressive strength was improved to 64.37 MPa in mix C2. Concretes C2 and C3 had similar mix compositions but mix C3, with the presence of the water absorber admixture, exhibited a lower compressive strength at 55.91 MPa in comparison with mix C2. In general, all concretes satisfied the compressive strength requirement of exceeding 40 MPa for usage in marine environments, as described in Australian Standard AS 3600 [43].

Table 5.
Compressive strength of geopolymer concretes at 28 days after casting.
The total shrinkage of the three concrete mixes up to 450 days is presented in Figure 7. Mix C1 exhibited the highest total shrinkage over the test duration. The total shrinkage of concrete C1 increased significantly during the first 70 days and then stabilised at 450 days at around −2100 μm/m. The total shrinkage in concrete C2 was considerably lower than that of C1 concrete, due to adding NaOH pellets to the mix composition. Cao et al. [41] reported higher autogenous and total shrinkage of GGBFS–FNS geopolymers when using only sodium silicate solution as an activator in comparison with the addition of NaOH to the activator. The presence of the water absorber admixture in concrete C3 led to the lowest total shrinkage among the three GGBFS–FNS concretes. The effect of the water absorber admixture was the most significant at the early age. To be specific, the total shrinkage values of the C3 concrete decreased by about 90% and 80% compared with the C1 and C2 concretes, respectively, after 1 day of drying. After 6 days of drying, the water absorber admixture reduced the total shrinkage of mix C3 by 80% and 65% in comparison with the C1 and C2 concretes, respectively. Providing that the mix design of the C2 and C3 concretes are similar, along with the shrinkage results in Section 4.3, the water absorber admixture is very efficient in decreasing the autogenous and total shrinkage in GGBFS–FNS geopolymers.
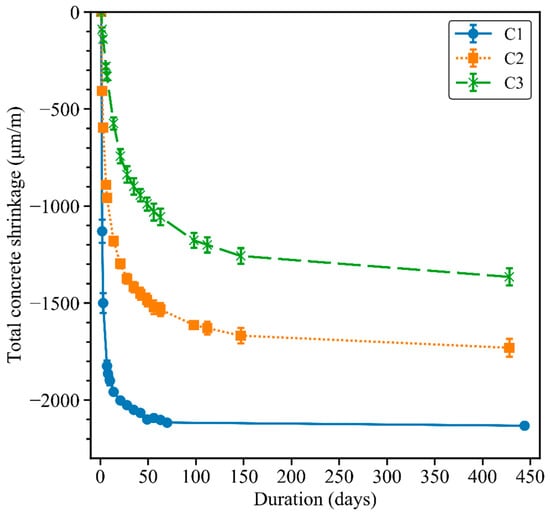
Figure 7.
Total shrinkage of concrete prisms.
4.5. Physical Properties and Resistivity of Geopolymer Concretes
Table 6 presents the physical properties and resistivity of the C1 and C3 concretes after 28 days of casting. The results of the C2 concrete are not available in Table 6. For comparison purposes, the results of the geopolymer concretes containing GGBFS and fly ash, denoted as GGBFS–FA concretes, are included in Table 6, obtained from a previous study [44]. The GGBFS content in GGBFS–FA concretes varies from 0 wt.% to 100 wt.%, as shown in Table 6. Overall, the physical properties and resistivity of GGBFS–FNS concretes fall within the range of common GGBFS–FA geopolymer concretes, indicating that GGBFS–FNS geopolymer concretes can replace GGBFS–FA geopolymer concretes in practical applications. Noticeably, the C3 concrete had the lowest water absorption and second-lowest VPV among all concretes listed in Table 6. In GGBFS–FA concretes (mixes F1 to F5), increasing the GGBFS content in the precursor resulted in higher water absorption and VPV values. By contrast, in GGBFS–FNS concretes, increasing the GGBFS content from 32.9 wt.% in C1 to 50 wt.% in C3 concrete led to the reduction of both water absorption and VPV. This can be attributed to the addition of the water absorber admixture in mix C3, acting as an internal curing agent, refining the microstructure of the GGBFS–FNS geopolymers compared with GGBFS–FA geopolymers. The C1 and C3 concretes exhibited negligible variations in bulk density values, falling within the normal concrete range of 2300–2400 kg/m3. Surface and bulk resistivity values were higher in the C3 concrete than in the C1 concrete, which is consistent with the increase in GGBFS content. The F1 to F5 concretes also exhibited an increase in resistivity when increasing the GGBFS content. These results indicate that the GGBFS content in the precursor significantly impacts the resistivity of geopolymer concretes.

Table 6.
Physical properties and resistivity of GGBFS–FNS and GGBFS–FA geopolymer concretes.
4.6. Chloride Diffusion Resistance Tests
Figure 8 shows the charge passed in Coulombs using modified-RCPT 10 V (a) and non-steady-state migration coefficients of CMT (b) for mixes C1 to C3. The results of GGBFS–FA concretes (F1 to F5) are included in Figure 8 for comparison purposes. The C1 concrete had the highest charged passed and migration coefficient among the three GGBFS–FNS concretes. This can be explained by the low GGBFS content and low Na2O/binder due to the absence of NaOH pellets in the mix composition. Previous studies reported that increasing GGBFS and NaOH content could enhance the chloride diffusion resistance of geopolymer concretes [18,35,45]. The effect of GGBFS content on the modified-RCPT and CMT test results observed for mixes C1 to C3 concretes is similar to that for the GGBFS–FA concrete mixes F1 to F5. Comparing the C2 and C3 concretes with the same GGBFS content and molar ratio, the C3 concrete exhibited lower values of charges passed and non-steady-state migration coefficient than the C2 concrete. This indicates that the presence of the water absorber admixture can reduce the chloride diffusion in GGBFS–FNS geopolymer concretes. To be specific, the C3 concrete had approximate 500 Coulombs of charge passed and a 10 × 10−12 m2/s non-steady-state migration coefficient in modified-RCPT and CMT, which is 31% and 61% lower than that of the C2 concrete, respectively.
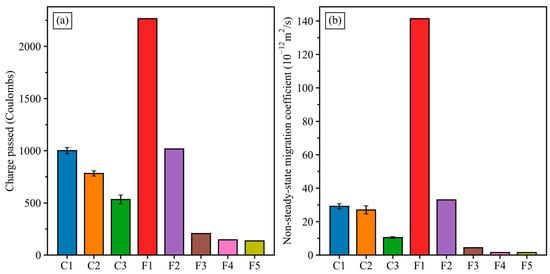
Figure 8.
Charge passed from modified-RCPT 10 V (a) and migration coefficients from CMT (b) of geopolymer concretes.
The total chloride profile and the apparent chloride diffusion coefficients from bulk diffusion tests are shown in Figure 9. Concrete C1 had the lowest chloride content of 0.22 wt.% at the surface, as shown in Figure 9a. The chloride content gradually decreased over the depth in the C1 concrete, with less than 0.05 wt.% at 25 mm depth. Concretes C2 and C3 exhibited a higher chloride content at the sample’s surface than concrete C1. However, the chloride content decreased significantly with the depth. Specifically, the C2 and C3 concretes had no chloride after 17 mm and 11 mm depth, respectively, showing a better performance against chloride diffusion than mix C1. As a result, concretes C2 and C3 had lower apparent chloride diffusion coefficients (Da) than that of concrete C1, as shown in Figure 9b. Consistent with the modified-RCPT and CMT results, the C3 concrete demonstrated the best chloride resistance performance among the three GGBFS–FNS concretes. Specifically, the Da values of the C3 concrete were 81% and 67% lower than the Da values of the C1 and C2 concretes, respectively. Noticeably, the C3 concrete had a similar apparent chloride diffusion coefficient Da to the GGBFS–FA concrete with 50 wt.% GGBFS (F3 concrete). This indicates that the GGBFS–FNS and GGBFS–FA concretes with the same GGBFS content can achieve similar chloride diffusion resistance by incorporating the water absorber admixture into the GGBFS–FNS geopolymers. The bulk diffusion test (ASTM C1556) has been proven to provide a better evaluation of the chloride diffusion resistance of geopolymer concrete, as a significant amount of mobile ions in the geopolymer pore solution can interfere with the results of the modified-RCPT and CMT [46,47,48]. Furthermore, the Da value of the C3 concrete was lower than the Da values obtained with 100% OPC-based concrete, as reported in previous studies [12,18,35]. In conclusion, for both compressive strength and chloride diffusion tests, the C3 geopolymer concrete with 50 wt.% GFNS and the inclusion of the water absorber admixture fulfilled the requirements for concrete to be utilised in marine environments.
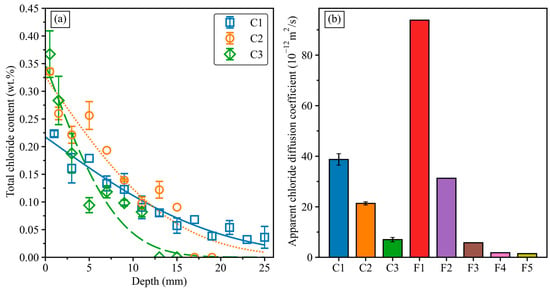
Figure 9.
(a) The variation of total chloride content in GGBFS–FNS geopolymer concretes. (b) Apparent chloride diffusion coefficient of geopolymer concretes.
A performance-based specification has been proposed to establish the correlation between RCPT, CMT and chloride bulk diffusion tests for geopolymer concretes using various precursor materials [18,35]. Figure 10 presents the correlations including the chloride test results of the GGBFS–FNS concretes. Figure 10a shows the correlation between the modified-RCPT 10 V and the bulk diffusion test, whilst Figure 10b shows the correlation between CMT and the bulk diffusion test. The relationship observed among the three chloride tests for GGBFS–FNS geopolymers was well aligned with other geopolymer concretes. In other words, the proposed performance-based specification is effectively applicable to GGBFS–FNS geopolymers, enabling the evaluation of their chloride diffusion resistance and their suitable usage in chloride (marine) environments.
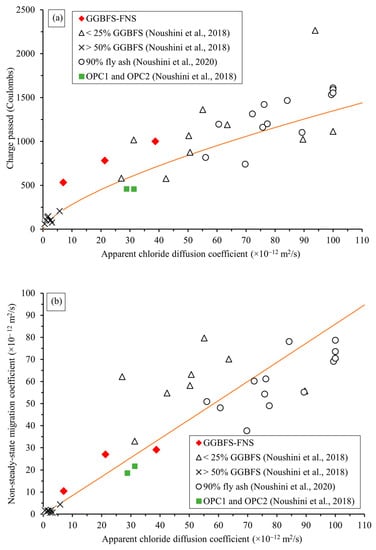
Figure 10.
(a) Performance-based specification between RCPT and bulk diffusion test [35]. (b) Performance-based specification between CMT and bulk diffusion test [18].
4.7. Alkali–Silica Reaction (ASR) and Length Change in Sulphate Solution
The expansion of the mortar bars caused by the ASR in the AMBT is presented in Figure 11. The expansion limits after 16 days and 21 days of exposure to NaOH 1 M solution at 80 °C, as defined by AS 1141.60.1 and ASTM C1260, respectively, are integrated in Figure 11. The expansion of GGBFS–FNS mortar bars due to the ASR was lower than the limits set by both AS 1141.60.1 and ASTM C1260. This indicates that the concrete C3 is non-reactive in terms of the risk of ASR-induced expansion. These findings are consistent with previous studies that have reported the non-reactivity of FNS aggregate in geopolymer materials [49].
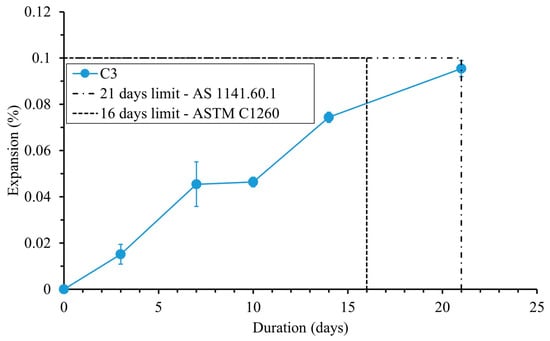
Figure 11.
ASR expansion of mortar bars [37,38].
Figure 12 shows the length change of mix C3 mortar bars exposed to sodium sulphate solution (50 g/L) for up to 1 year, following ASTM C1012. The compressive strength of the C3 mortar reached 37 MPa after 1 day of casting, exceeding the compressive strength requirement of 20 MPa for immersion in the sodium sulphate solution, as described in ASTM C1012. During the first 30 days of immersion, the C3 mortar bars presented a slight expansion of 0.02%, followed by a gradual reduction of the mortar bars’ length. After 1 year immersed in the sodium sulphate solution, the length change became negative, indicating shrinkage of the mortar bars. While ASTM C1012 provides no expansion limit, Figure 12 incorporates the 0.1% limit after 12 months of immersion for high sulphate-resistant binders, as outlined in ASTM C595 [50]. The length change of the C3 mortar bars remained significantly lower than the 0.1% expansion limit for up to 1 year. In conclusion, this result reveals the dimensional stability of mix C3 when immersed in a sodium sulphate solution, qualifying C3 as a high sulphate-resistance mortar, according to ASTM C595.
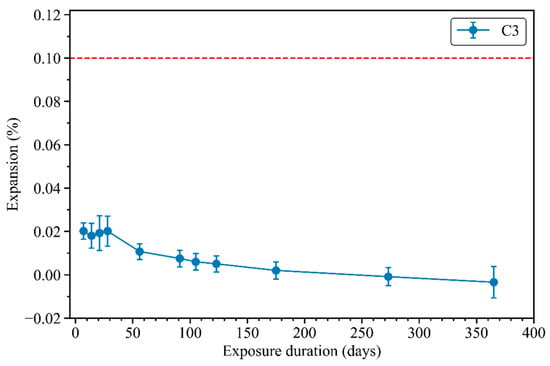
Figure 12.
Length change of mortar bars exposed to sodium sulphate solution.
5. Conclusions
This study aims to investigate the properties of GGBFS–FNS geopolymers with various mix compositions for engineering applications. In addition, investigations of the microstructure and porosity of GGBFS–FNS alkali-activated materials will be conducted in the second stage of this research programme. The main findings from this study are summarised as follows:
- The conventional admixtures (lignosulfonate-based, polycarboxylate-based, sodium naphthalene formaldehyde sulphonate and amino trimethylene phosphonic admixture) had no impact on the initial and final setting times of the GGBFS–FNS geopolymer pastes. The increase in the water/solid ratio extended the setting time, whilst the increased GGBFS content reduced the setting time. The initial and final setting times of the GGBFS–FNS geopolymers, with a GGBFS content ranging from 23.6 wt.% to 32.9 wt.% and a water/solid ratio ranging from 0.36 to 0.40, satisfy the requirements of Australian Standard AS 3972 for industry applications.
- The GGBFS–FNS geopolymer mortars achieved compressive strength values exceeding 30 MPa after 28 days of casting. The presence of FNS aggregate as fine aggregate increased the compressive strength of the GGBFS–FNS geopolymer mortars.
- The water absorber admixture significantly decreased the autogenous and total shrinkage of the geopolymer mortars up to 480 days after casting. The first 50 days of drying accounted for approximately 90% of the final total shrinkage value in all mortar mixes. The GGBFS–FNS mortars with the highest binder content and lowest water/solid ratio exhibited the highest shrinkage values.
- The increase in Na2O/binder by adding NaOH pellets increased the compressive strength of the GGBFS–FNS concretes. All concrete mixes in this study met the compressive strength requirement for usage in marine (chloride) environments.
- Similar to mortars, the water absorber admixture significantly reduced the total shrinkage of the GGBFS–FNS geopolymer concretes. The water absorber admixture was the most effective in reducing shrinkage during the first 7 days.
- Concrete C3, with the presence of the water absorber, exhibited the lowest water absorption in comparison with other GGBFS–FNS and GGBFS–FA concretes. Moreover, the inclusion of the water absorber admixture decreased the VPV and increased the surface and bulk resistivity.
- The charges passed (modified-RCPT 10 V), the non-steady-state migration coefficient (CMT) and the apparent chloride diffusion coefficient (bulk diffusion test) of the C3 concrete were also the lowest, indicating the benefit of the water absorber admixture in improving the chloride diffusion resistance of GGBFS–FNS geopolymer concretes. Additionally, the correlations between the three chloride tests for GGBFS–FNS concretes agreed well with the performance-based specifications proposed for fly ash/GGBFS geopolymer concretes.
- The expansion of the C3 mortar in the AMBT test was lower than both the AS 1141.60.1 and ASTM C1260 limits, indicating that the C3 mix composition is non-reactive in terms of the risk of the ASR. When immersed in the sodium sulphate solution, the length change of the C3 mortar bars was significantly lower than the 0.1% expansion limit for up to 1 year. This reveals that C3 is classified as a high sulphate resistance mortar according to ASTM C595.
In conclusions, GGBFS–FNS geopolymers demonstrate satisfactory performance for various engineering applications, meeting standard requirements for setting time and compressive strength. Furthermore, the durability properties indicate that GGBFS–FNS concretes can be suitable for using in aggressive environments including marine (chloride) environments and sulphate environments.
Author Contributions
Conceptualization, Q.D.N. and A.C.; methodology, Q.D.N. and A.C.; software, Q.D.N.; validation, Q.D.N. and A.C.; formal analysis, Q.D.N. and A.C.; investigation, Q.D.N. and A.C.; resources, Q.D.N. and A.C.; data curation, Q.D.N.; writing—original draft preparation, Q.D.N.; writing—review and editing, Q.D.N. and A.C.; visualization, Q.D.N.; supervision, Q.D.N. and A.C.; project administration, Q.D.N. and A.C.; funding acquisition, Q.D.N. and A.C. All authors have read and agreed to the published version of the manuscript.
Funding
This work was supported by Canasia Australia Pty Ltd.
Data Availability Statement
Data will be made available on request.
Acknowledgments
The assistance of the laboratory staff at UTS Tech Lab is acknowledged here.
Conflicts of Interest
The authors declare that they have no known competing financial interest or personal relationships that could have appeared to influence the work reported in this paper.
References
- Provis, J.L.; Palomo, A.; Shi, C. Advances in understanding alkali-activated materials. Cem. Concr. Res. 2015, 78, 110–125. [Google Scholar] [CrossRef]
- Grant Norton, M.; Provis, J.L. 1000 at 1000: Geopolymer technology—The current state of the art. J. Mater. Sci. 2020, 55, 13487–13489. [Google Scholar] [CrossRef]
- Marsh, A.T.M.; Velenturf, A.P.M.; Bernal, S.A. Circular Economy strategies for concrete: Implementation and integration. J. Clean. Prod. 2022, 362, 132486. [Google Scholar] [CrossRef]
- Shi, C.J.; Qu, B.; Provis, J.L. Recent progress in low-carbon binders. Cem. Concr. Res. 2019, 122, 227–250. [Google Scholar] [CrossRef]
- Provis, J.L. Alkali-activated materials. Cem. Concr. Res. 2018, 114, 40–48. [Google Scholar] [CrossRef]
- Amran, Y.H.M.; Alyousef, R.; Alabduljabbar, H.; El-Zeadani, M. Clean production and properties of geopolymer concrete: A review. J. Clean. Prod. 2020, 251, 119679. [Google Scholar] [CrossRef]
- Habert, G.; Ouellet-Plamondon, C. Recent update on the environmental impact of geopolymers. RILEM Tech. Lett. 2016, 1, 17–23. [Google Scholar] [CrossRef]
- Luukkonen, T.; Abdollahnejad, Z.; Yliniemi, J.; Kinnunen, P.; Illikainen, M. One-part alkali-activated materials: A review. Cem. Concr. Res. 2018, 103, 21–34. [Google Scholar] [CrossRef]
- Nguyen, Q.D.; Khan, M.S.H.; Castel, A.; Kim, T. Durability and Microstructure Properties of Low-Carbon Concrete Incorporating Ferronickel Slag Sand and Fly Ash. J. Mater. Civ. Eng. 2019, 31, 04019152. [Google Scholar] [CrossRef]
- Katsiotis, N.S.; Tsakiridis, P.E.; Velissariou, D.; Katsiotis, M.S.; Alhassan, S.M.; Beazi, M. Utilization of Ferronickel Slag as Additive in Portland Cement: A Hydration Leaching Study. Waste Biomass Valorization 2015, 6, 177–189. [Google Scholar] [CrossRef]
- Liu, X.; Li, T.; Tian, W.; Wang, Y.; Chen, Y. Study on the durability of concrete with FNS fine aggregate. J. Hazard. Mater. 2020, 381, 120936. [Google Scholar] [CrossRef] [PubMed]
- Nguyen, Q.D.; Castel, A.; Kim, T.; Khan, M.S.H. Performance of fly ash concrete with ferronickel slag fine aggregate against alkali-silica reaction and chloride diffusion. Cem. Concr. Res. 2021, 139, 106265. [Google Scholar] [CrossRef]
- Rahman, M.A.; Sarker, P.K.; Shaikh, F.U.A.; Saha, A.K. Soundness and compressive strength of Portland cement blended with ground granulated ferronickel slag. Constr. Build. Mater. 2017, 140, 194–202. [Google Scholar] [CrossRef]
- Komnitsas, K.; Zaharaki, D.; Perdikatsis, V. Effect of synthesis parameters on the compressive strength of low-calcium ferronickel slag inorganic polymers. J. Hazard. Mater. 2009, 161, 760–768. [Google Scholar] [CrossRef]
- Komnitsas, K.; Zaharaki, D.; Perdikatsis, V. Geopolymerisation of low calcium ferronickel slags. J. Mater. Sci. 2007, 42, 3073–3082. [Google Scholar] [CrossRef]
- Kuri, J.C.; Khan, M.N.N.; Sarker, P.K. Fresh and hardened properties of geopolymer binder using ground high magnesium ferronickel slag with fly ash. Constr. Build. Mater. 2021, 272, 121877. [Google Scholar] [CrossRef]
- Li, J.; Sun, Z.; Wang, L.; Yang, X.; Zhang, D.; Zhang, X.; Wang, M. Properties and mechanism of high-magnesium nickel slag-fly ash based geopolymer activated by phosphoric acid. Constr. Build. Mater. 2022, 345, 128256. [Google Scholar] [CrossRef]
- Noushini, A.; Nguyen, Q.D.; Castel, A. Assessing alkali-activated concrete performance in chloride environments using NT Build 492. Mater. Struct. 2021, 54, 57. [Google Scholar] [CrossRef]
- Tennakoon, C.; Shayan, A.; Sanjayan, J.G.; Xu, A. Chloride ingress and steel corrosion in geopolymer concrete based on long term tests. Mater. Des. 2017, 116, 287–299. [Google Scholar] [CrossRef]
- Elyamany, H.E.; Abd Elmoaty, A.E.M.; Elshaboury, A.M. Setting time and 7-day strength of geopolymer mortar with various binders. Constr. Build. Mater. 2018, 187, 974–983. [Google Scholar] [CrossRef]
- ASTM C191−19; Standard Test Methods for Time of Setting of Hydraulic Cement by Vicat Needle. ASTM International: Conshohocken, PA, USA, 2019.
- ASTM C109/C109M-16a; Standard Test Method for Compressive Strength of Hydraulic Cement Mortars (Using 2-in. or [50-mm] Cube Specimens). ASTM International: Conshohocken, PA, USA, 2016.
- AS 2350.13; Methods of Testing Portland, Blended and Masonry Cements Determination of Air Content of Masonry Cement. Australian Standard: Sydney, Australia, 2006.
- BS EN 12617-4; Products and Systems for the Protection and Repair of Concrete Structures—Test Methods-Part 4: Determination of Shrinkage and Expansion. British Standards Institution: London, UK, 2002.
- ASTM C39/C39M-18; Standard Test Method for Compressive Strength of Cylindrical Concrete Specimens. ASTM International: Conshohocken, PA, USA, 2018.
- AS 1012.9; Methods of Testing Concrete Compressive Strength Tests-Concrete, Mortar and Grout Specimens. Australian Standard: Sydney, Australia, 2014.
- ASTM C157/C157M-17; Standard Test Method for Length Change of Hardened Hydraulic-Cement Mortar and Concrete. ASTM International: Conshohocken, PA, USA, 2017.
- AS 1012.13; Methods of Testing Concrete: Determination of the Drying Shrinkage of Concrete for Samples Prepared in the Field or in the Laboratory. Australian Standard: Sydney, Australia, 2015.
- ASTM C642-13; Standard Test Method for Density, Absorption, and Voids in Hardened Concrete. ASTM International: Conshohocken, PA, USA, 2013. [CrossRef]
- ASTM C1876-19; Standard Test Method for Bulk Electrical Resistivity or Bulk Conductivity of Concrete. ASTM International: Conshohocken, PA, USA, 2019.
- Nguyen, Q.D.; Castel, A. Long-term durability of underground reinforced concrete pipes in natural chloride and carbonation environments. Constr. Build. Mater. 2023, 394, 132230. [Google Scholar] [CrossRef]
- ASTM C1202-17a; Standard Test Method for Electrical Indication of Concrete’s Ability to Resist Chloride Ion Penetration. ASTM International: Conshohocken, PA, USA, 2017.
- NT Build 492 (1999-11); Concrete, Mortar and Cement-Based Repair Materials: Chloride Migration Coefficient from Non-Steady-State Migration Experiments. Nordtest Standard, Nordic Council of Ministers: Copenhagen, Denmark, 1999.
- Nguyen, Q.D.; De Carvalho Gomes, S.; Alnahhal, M.F.; Li, W.; Kim, T.; Castel, A. Testing Geopolymer Concrete Performance in Chloride Environment. In Proceedings of the International RILEM Conference on Synergising Expertise towards Sustainability and Robustness of Cement-Based Materials and Concrete Structures; Springer Nature Switzerland: Cham, Switzerland, 2023; pp. 1197–1203. [Google Scholar]
- Noushini, A.; Castel, A. Performance-based criteria to assess the suitability of geopolymer concrete in marine environments using modified ASTM C1202 and ASTM C1556 methods. Mater. Struct. 2018, 51, 146. [Google Scholar] [CrossRef]
- ASTM C1556-11a(2016); Standard Test Method for Determining the Apparent Chloride Diffusion Coefficient of Cementitious Mixtures by Bulk Diffusion. ASTM International: Conshohocken, PA, USA, 2016.
- ASTM C1260-14; Standard Test Method for Potential Alkali Reactivity of Aggregates (Mortar-Bar Method). ASTM International: Conshohocken, PA, USA, 2014. [CrossRef]
- AS 1141.60.1; Methods for Sampling and Testing Aggregates Potential Alkali-Silica Reactivity-Accelerated Mortar Bar Method. Australian Standard: Sydney, Australia, 2014.
- ASTM C1012/C1012M; Standard Test Method for Length Change of Hydraulic-Cement Mortars Exposed to a Sulfate Solution. ASTM International: Conshohocken, PA, USA, 2018.
- AS 3972; General Purpose and Blended Cements. Australian Standard: Sydney, Australia, 2010.
- Cao, R.; Li, B.; You, N.; Zhang, Y.; Zhang, Z. Properties of alkali-activated ground granulated blast furnace slag blended with ferronickel slag. Constr. Build. Mater. 2018, 192, 123–132. [Google Scholar] [CrossRef]
- Saha, A.K.; Sarker, P.K. Sustainable use of ferronickel slag fine aggregate and fly ash in structural concrete: Mechanical properties and leaching study. J. Clean. Prod. 2017, 162, 438–448. [Google Scholar] [CrossRef]
- AS 3600; Concrete Structures. Australian Standard: Sydney, Australia, 2018.
- Noushini, A. Durability of Geopolymer Concrete in Marine Environment. Ph.D. Thesis, University of New South Wales (UNSW), Sydney, Australia, 2018. [Google Scholar]
- Zhang, J.; Ma, Y.; Zheng, J.; Hu, J.; Fu, J.; Zhang, Z.; Wang, H. Chloride diffusion in alkali-activated fly ash/slag concretes: Role of slag content, water/binder ratio, alkali content and sand-aggregate ratio. Constr. Build. Mater. 2020, 261, 119940. [Google Scholar] [CrossRef]
- Lloyd, R.R.; Provis, J.L.; van Deventer, J.S.J. Pore solution composition and alkali diffusion in inorganic polymer cement. Cem. Concr. Res. 2010, 40, 1386–1392. [Google Scholar] [CrossRef]
- Hu, X.; Shi, C.; Shi, Z.; Zhang, L. Compressive strength, pore structure and chloride transport properties of alkali-activated slag/fly ash mortars. Cem. Concr. Compos. 2019, 104, 103392. [Google Scholar] [CrossRef]
- Bernal, S.A.; Mejía de Gutiérrez, R.; Pedraza, A.L.; Provis, J.L.; Rodriguez, E.D.; Delvasto, S. Effect of binder content on the performance of alkali-activated slag concretes. Cem. Concr. Res. 2011, 41, 1–8. [Google Scholar] [CrossRef]
- Thompson, A.; Saha, A.K.; Sarker, P.K. Comparison of the alkali-silica reactions of ferronickel slag aggregate in fly ash geopolymer and cement mortars. Eur. J. Environ. Civ. Eng. 2022, 26, 891–904. [Google Scholar] [CrossRef]
- C595/C595M−21; Standard Specification for Blended Hydraulic Cements. ASTM International: Conshohocken, PA, USA, 2021.
Disclaimer/Publisher’s Note: The statements, opinions and data contained in all publications are solely those of the individual author(s) and contributor(s) and not of MDPI and/or the editor(s). MDPI and/or the editor(s) disclaim responsibility for any injury to people or property resulting from any ideas, methods, instructions or products referred to in the content. |
© 2023 by the authors. Licensee MDPI, Basel, Switzerland. This article is an open access article distributed under the terms and conditions of the Creative Commons Attribution (CC BY) license (https://creativecommons.org/licenses/by/4.0/).