Article

Influence of Alkali Metal Ions on the Structural and Spectroscopic Properties of Sm3+-Doped Silicate Glasses

by
Israel R. Montoya Matos
Department of Civil Engineering, Universidad de Lima, Av. Javier Prado Este 4600, Lima 15023, Peru
Ceramics 2023, 6(3), 1788-1798; https://doi.org/10.3390/ceramics6030109
Submission received: 11 July 2023 / Revised: 4 August 2023 / Accepted: 17 August 2023 / Published: 21 August 2023
(This article belongs to the Special Issue Advanced Glasses and Glass-Ceramics)

Abstract

:
In the present work, the influence of alkali ions (Li, Na, K) on the structural and spectroscopic properties of silica glasses doped with Sm3+ was investigated. Infrared and Raman spectroscopy techniques were used to investigate the structural properties of the alkali silicate glasses. The optical absorption showed bands characteristic of Sm3+ ions in alkali silicate glasses, and this was investigated. The Judd–Ofelt theory was applied to evaluate the phenomenological intensity parameters (Ω2, Ω4, and Ω6) of the optical absorption measurements. The multi-channel visible and near infrared emission transitions originating from the 4G5/2-emitting state of the Sm3+ in alkali silicate glasses with a maximum phonon energy of ~1050 cm−1 were investigated. From the evaluated Judd–Ofelt parameters, radiative parameters such as spontaneous emission probabilities, radiative lifetimes, branching ratios, and stimulated emission cross-sections were calculated. The recorded luminescence spectra regions revealed intense green, orange, red, and near-infrared emission bands, providing new traces for developing tunable laser and optoelectronic devices.

Graphical Abstract

1. Introduction

Due to their potential for use as lasers and phosphors in a variety of hosts, including glasses, crystals, and transparent vitro-ceramics that exhibit luminescent transitions in the VIS and NIR spectra regions, Ln3+-doped ions have attracted considerable technological interest [1]. According to research, the optical spectra of the rare earth ions can be used as structural probes to determine the local field parameters within a specific host glass because the energy levels, profiles, and intensities of the absorption and emission bands depend on how charges are distributed in the first coordination shells of the rare earth ions [2,3]. In oxide glasses, silicate glasses are one of the most popular glass hosts for making optical fiber lasers and amplifiers. Several papers have been published on the optical properties of rare earth ions in different glasses [4,5,6], but only a few of them have been concerned with Sm3+ [7,8,9,10]. The significant energy gap (less non-radiative decay) between the 4G5/2 level and the next lower-lying energy level, 6F11/2, which is roughly 7200 cm−1, causes glasses doped with Sm3+ ions to have relatively high quantum efficiencies. It has been known for a long time that Sm3+ ion provide very strong luminescence in the orange and red spectral regions in a variety of lattices [11,12]. However, only a few attempts have been made to explore the possibility of using the orange-red luminescence of Sm3+ ions for the development of visible optical devices. The main reason for not carrying out spectral studies on Sm3+ ions doped in glasses is the complicated structure of the 4f6 configuration of this ion because these glasses show different channels that lead to luminescence-quenching and have strong phosphorescent intensities [13].
In the present work, the spectroscopic properties of Sm3+ ions were used to investigate the local structures of alkali (i.e., Li, Na, and K) oxides in silica. It has been known for a long time that the gradual replacement of one alkali oxide by another induces nonlinear changes in certain physical properties of glasses [14,15], and the explanation for this effect in terms of the atomic structure is not simply due to the amorphous nature of the glass.

2. Materials and Methods

Silicate glasses have the following composition: 33.0 R2O + 66.0 SiO2 + 1.0 Sm2O3 (mol%), where R = Li, Na, and K. The glasses were prepared using the traditional melting quenching technique. The laboratory chemicals used included purified sand Li2CO3, Na2CO3, K2CO3, SiO2, and Sm2O3 (99.99% purity grade from Sigma-Aldrich (St. Louis, MO, USA)), and these were used for sample preparation. Since carbonates and silica are highly hygroscopic, they were dried at 200 °C for 1–2 h. The mixture was placed in a platinum crucible and heated at 700 to 800 °C to eliminate CO2 [16], and then it was melted at 1550 °C for 2 h in air. The melted mixture was quickly poured into a preheated stainless steel mold and annealed at 350 °C for 4 h. After that, it was cooled down slowly to room temperature at a rate of 5 °C/min. Table 1 shows the compositions, appearances, and melting temperatures of the prepared samples.
The densities of the prepared samples were measured using the Archimedes method (with an analytical balance Shimadzu AUW220D, 0.1 mg/0.01 mg) using distilled water as the immersion liquid. The refractive index was measured using a SOPRA GES-5E ellipsometer. The FTIR transmittance spectra were measured using a Bomem MB100 spectrometer using KBr pellets. The Raman spectra were measured using an HeNe laser as the excitation source. The absorption spectra in the UV-Vis-Nir region were recorded using a high-performance spectrometer (PerkinElmer model LAMBDA 1050) with a spectral resolution of 0.2 nm. The photoluminescence (PL) data were measured using a CryLas GmbH 488 nm CW laser as a pumping source. The PL signal was dispersed by an Acton SP 2300 monochromator and detected by a Pixis 256E CCD. The detected signal was fed to an SR 430 multichannel analyzer and transferred to a computer running acquisition software (OriginPro).

3. Results and Discussions

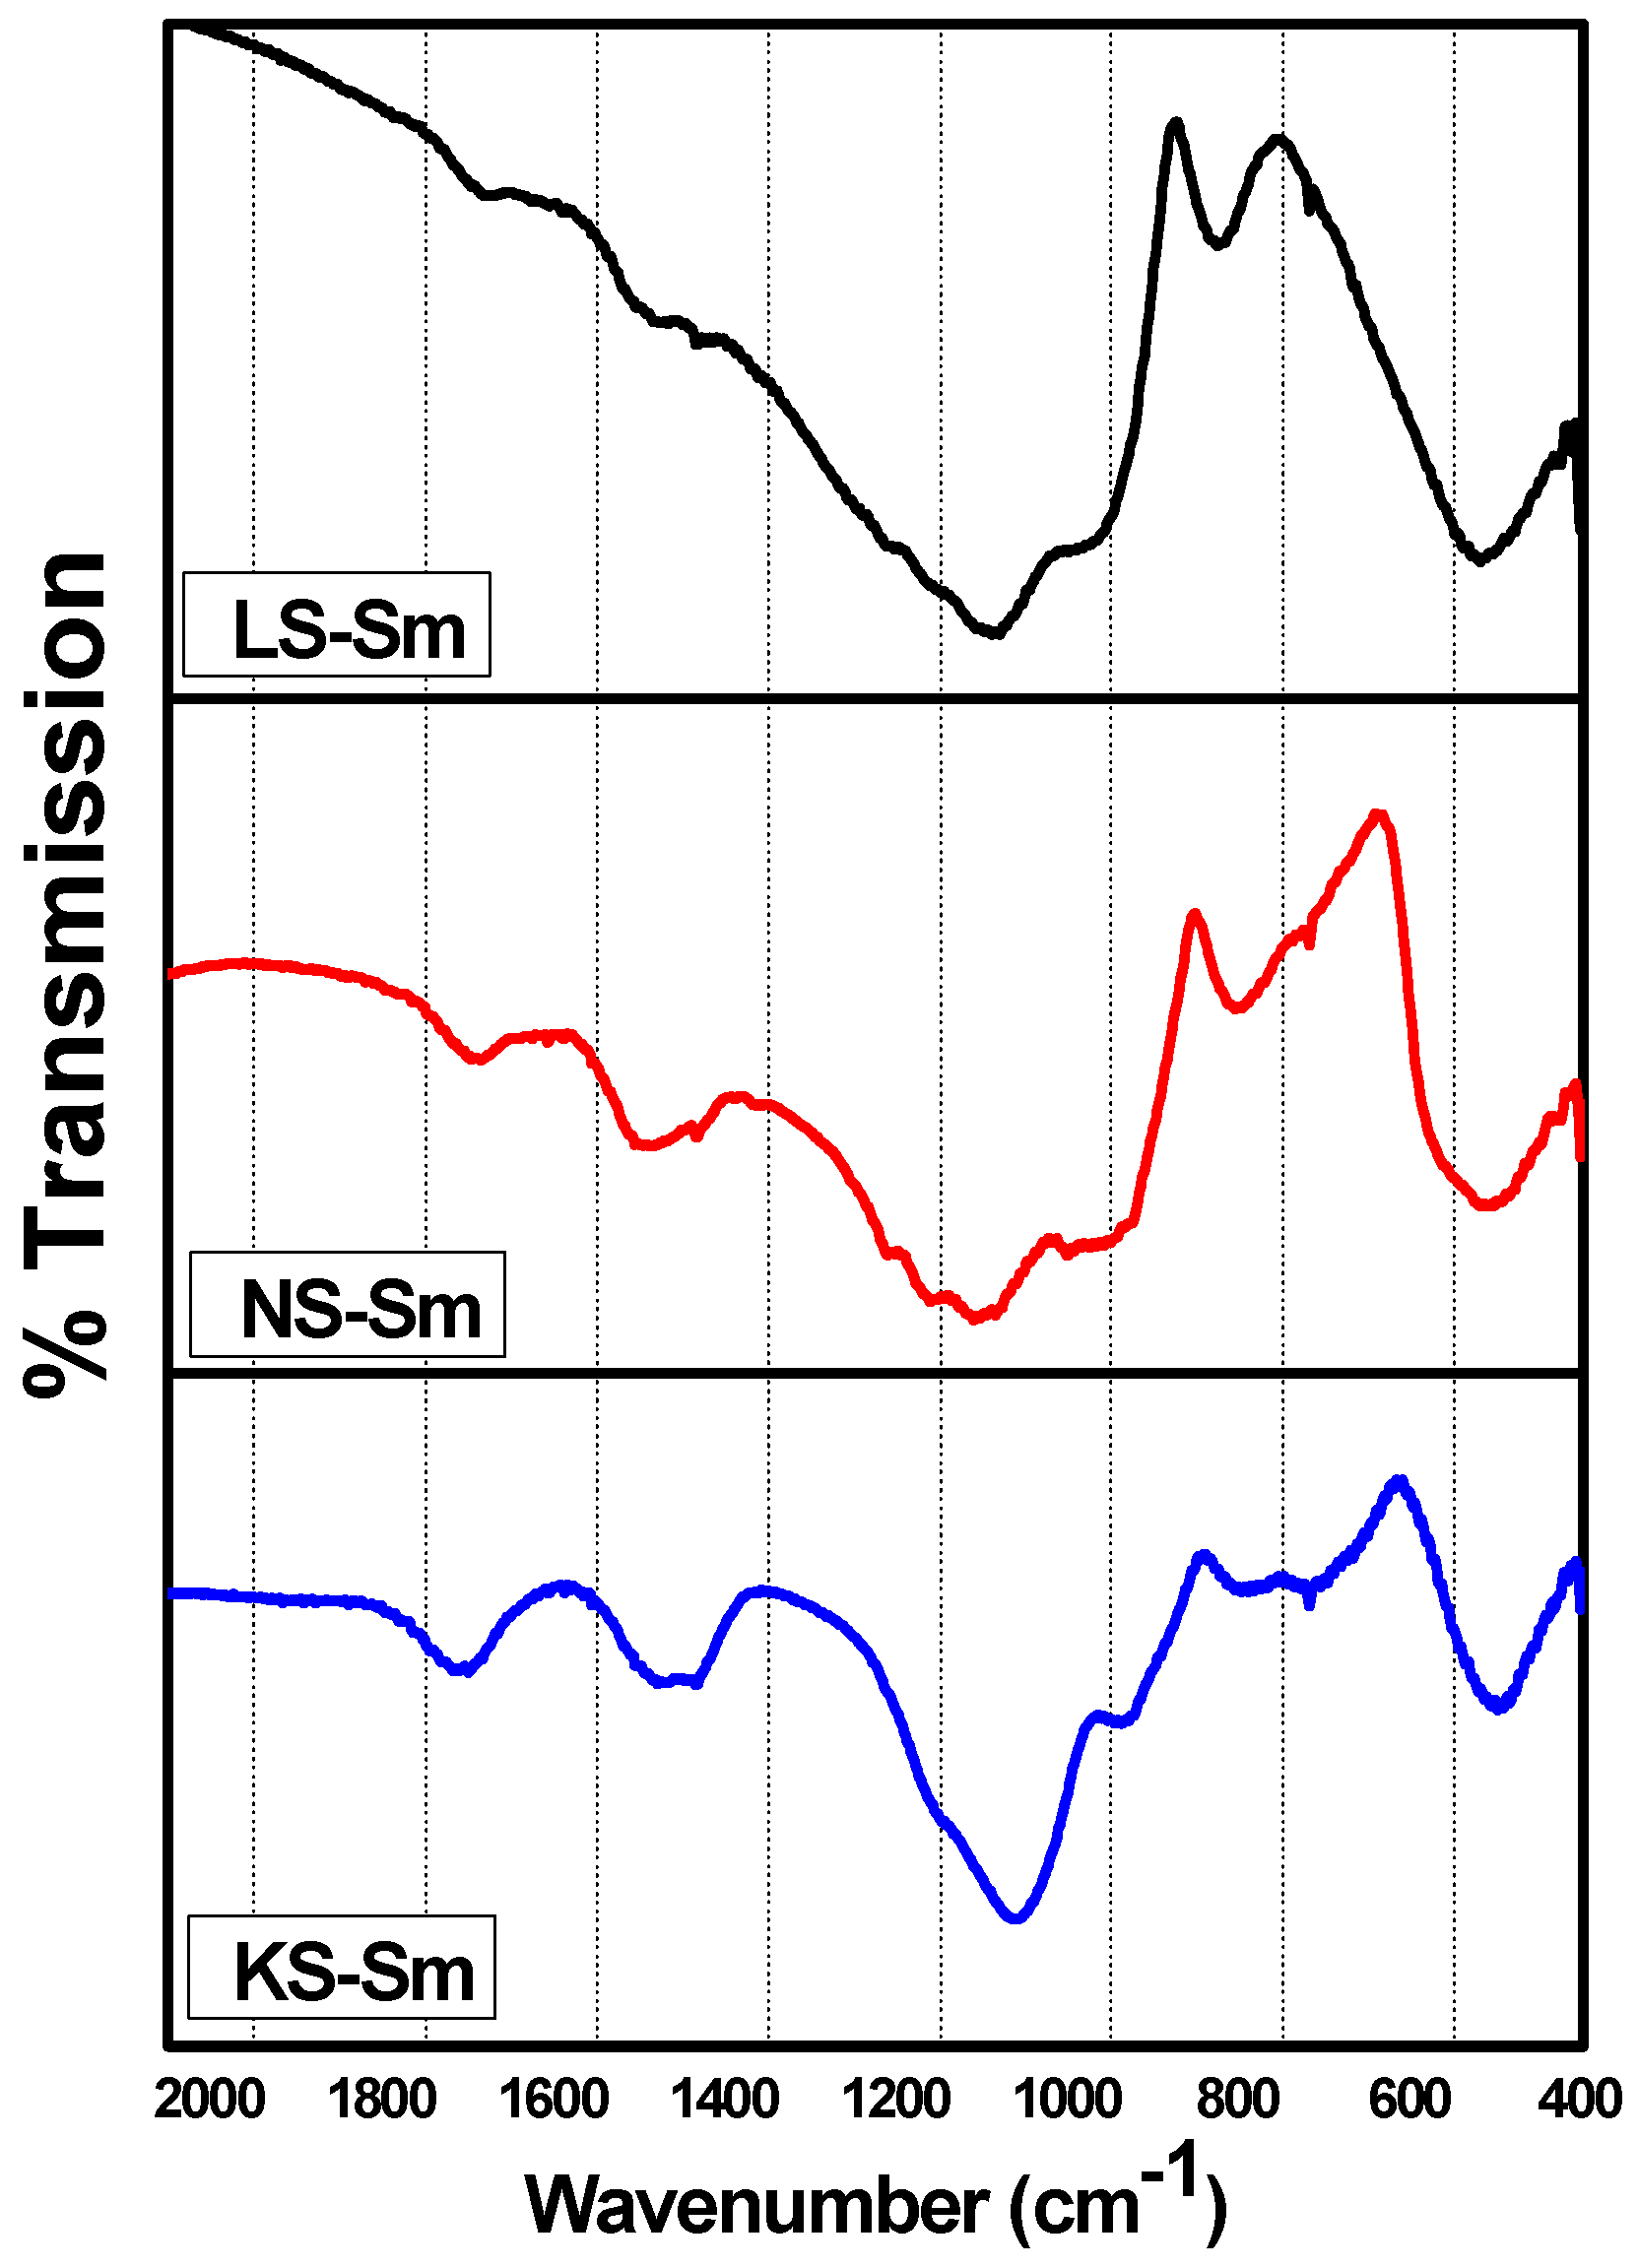
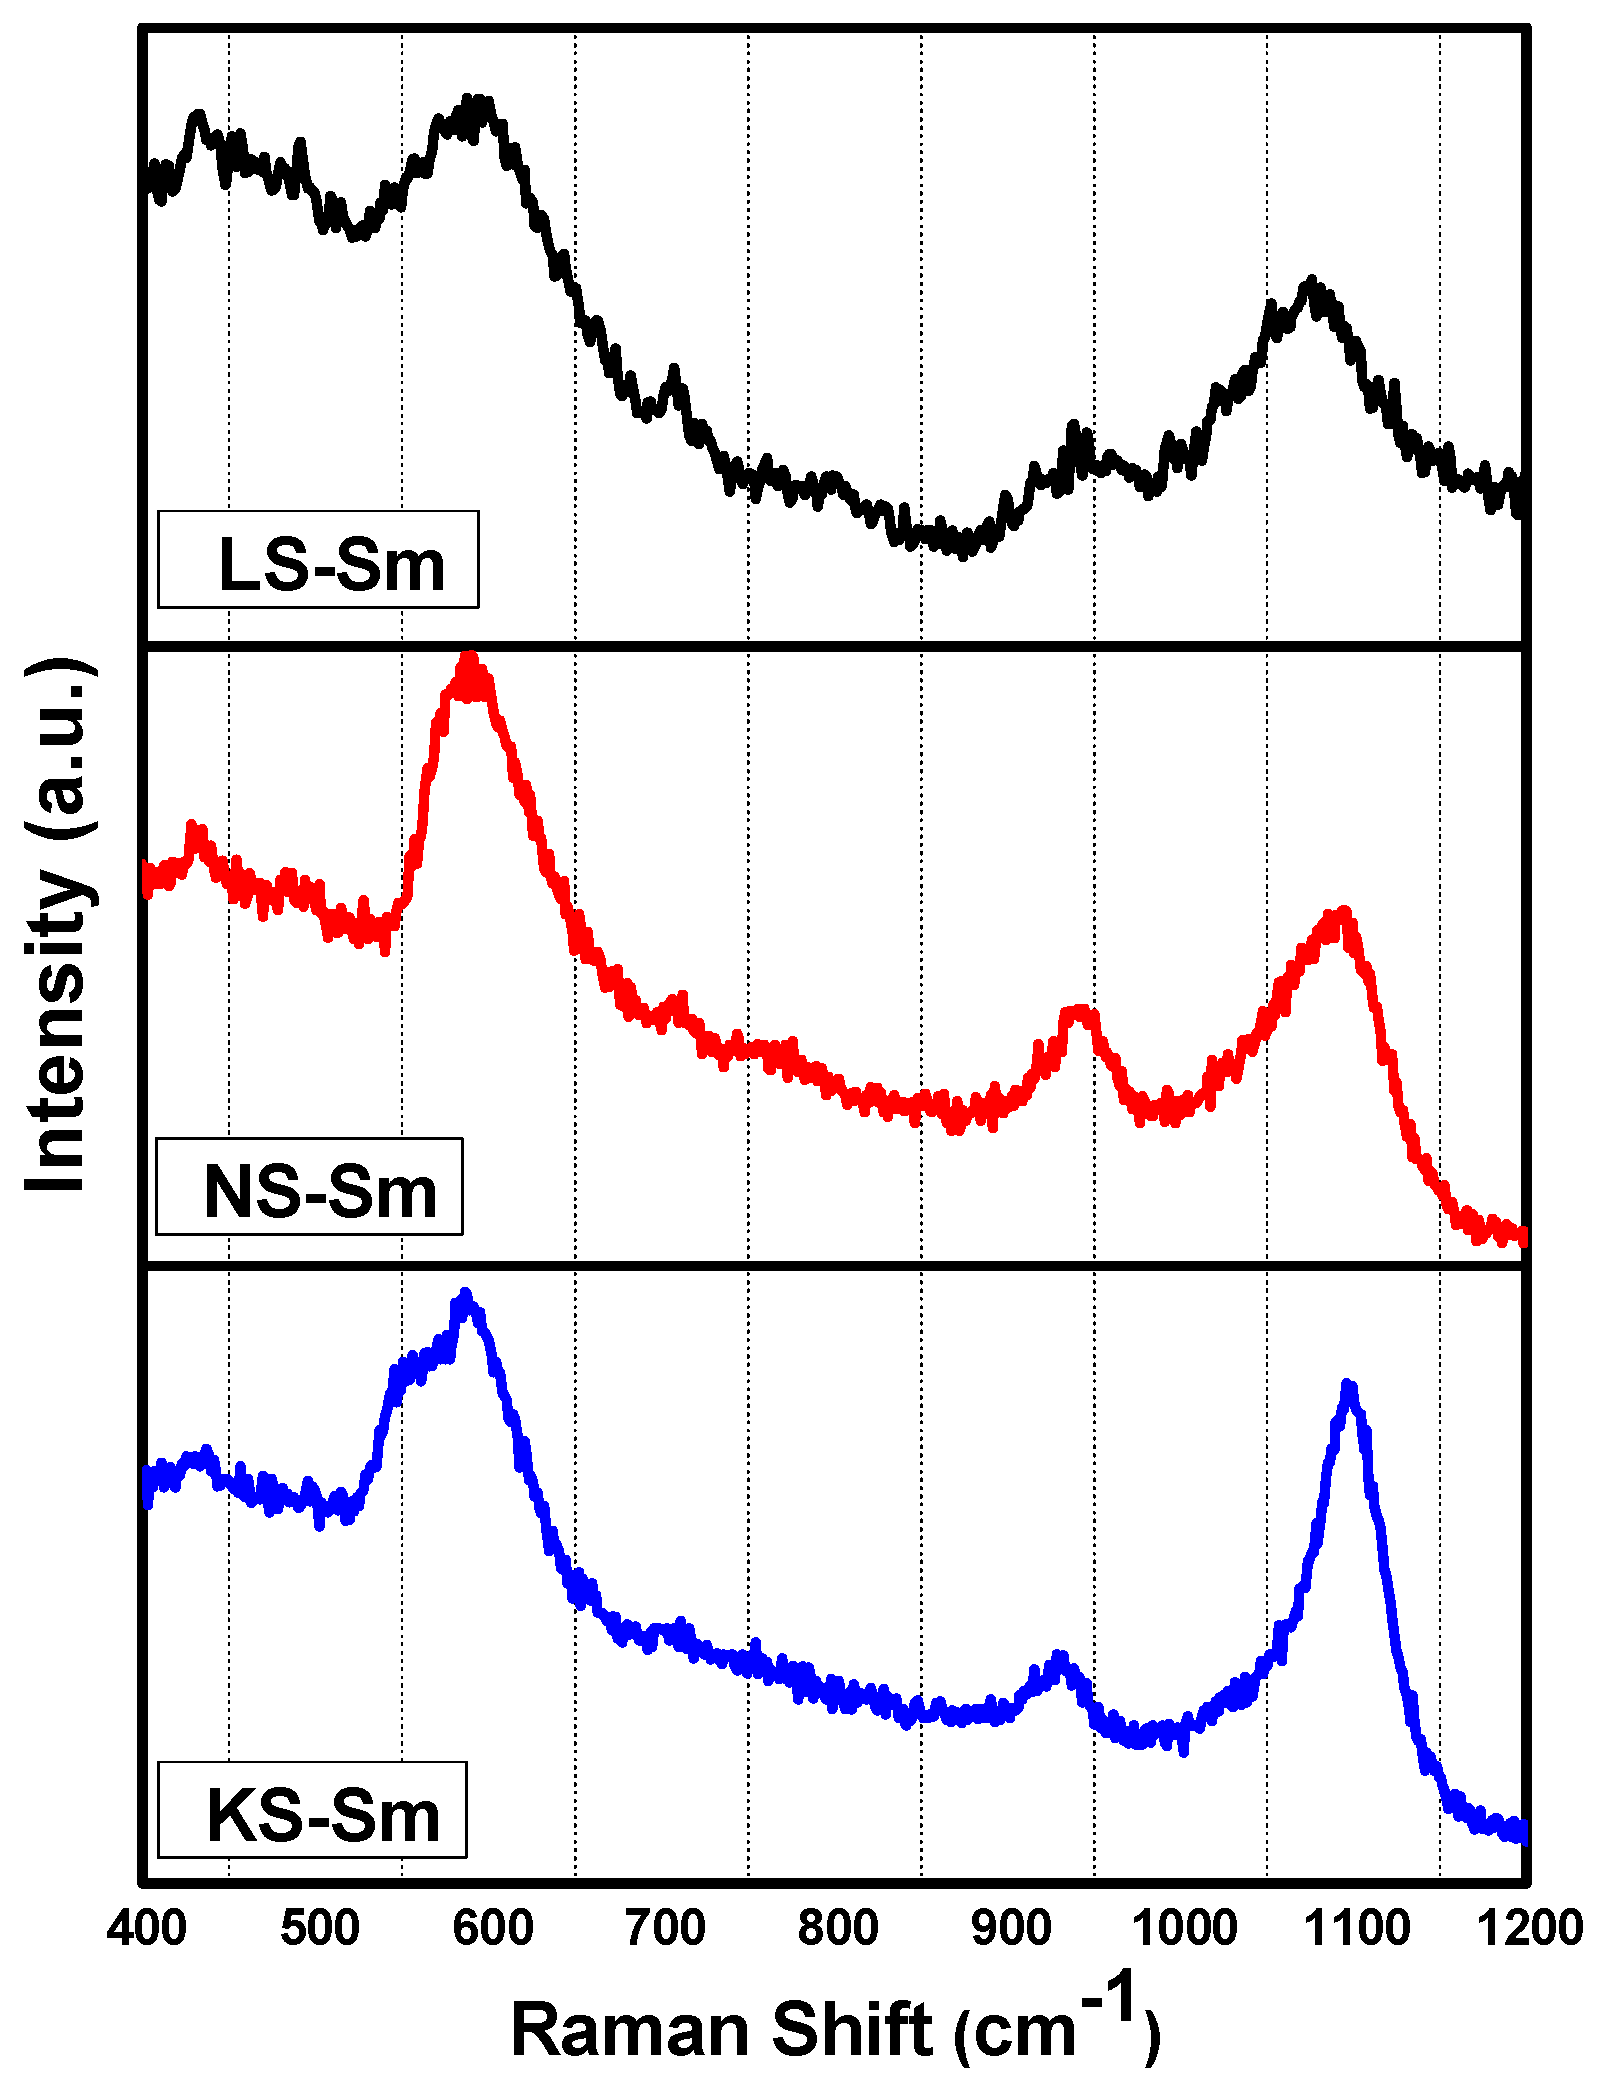
3.1. Structural Analysis

One of the most successful techniques for structural analysis is infrared spectroscopy, which makes it possible to identify structural features related to both the anionic sites containing the modifying cations and the local units that form the glass network [17]. Figure 1 shows the vibrational spectra of the alkali silicate glasses, which exhibit prominent bands at ~1037 cm−1 for LS, ~1060 cm−1 for NS, and ~1013 cm−1 for KS due to Si–O–Si stretching within the tetrahedral by the presence of alkali ions. These bands are sharpened by the addition of rare earth ions. The introduction of rare earth ions in the matrix will alter the environment of the defect centers in the silica [18]. Also, the relative intensities of the peaks corresponding to the Si–O stretching from the tetrahedral and the non-bridged Si–O were nearly the same for the LS and NS samples, but for the KS sample, it was possible to observe a shift in the band at ~1013 cm−1 to lower wavenumbers, suggesting that the effect of K on the Si–O stretching within the tetrahedral was slightly different from that of Li and Na. The bands at ~916 cm−1 for LS, ~891 cm−1 for NS, and 884 cm−1 for KS were due to the stretching of the non-bridged terminal Si–O. The addition of alkali ions would decrease the local symmetry due to the formation of non-bridging oxygen bonds, giving rise to a stretching mode at ~900 cm−1 [19]. Comparing the spectra shown in Figure 1 and described in Table 2, all of them presented shoulders at ~900 cm−1, though they were more pronounced for LS and NS samples, indicating the formation of non-bridged terminal Si–O. The bands at ~774 cm−1 for LS, ~752 cm−1 for NS, and ~745 cm−1 for KS were due to the stretching of the bridged Si–O–Si symmetric vibrations; more precisely, they were due to the bending mode of the bridging oxygen perpendicular to the Si–Si axis within the Si–O–Si plane and were at ~470 cm−1 for LS and NS and ~450 cm−1 for KS due to the Si–O rocking motion.
Figure 2 shows the Raman spectra of the samples. These spectra consisted of three intense peaks as representative cases, and the band assignments are presented in Table 3. Prominent features of the silica glass Raman spectrum were shown in Matson et al. [20]. The Raman spectrum of silica contains a large and asymmetric band near ~440 cm−1 and a sharp band at ~492 cm−1 related to the SiO4 tetrahedra. A broad band at ~800 cm−1 is related to the network of the SiO2 glass, a band at ~600 cm−1 is related to defects, bands at 1060 and 1190 cm−1 are related to Si–O–Si vibrations, and a band at ~950 cm−1 is related to crystalline metasilicates containing chains of SiO4 tetrahedra. According to Matson et al. [20], the introduction of alkali ions in the silica network induces changes in the Raman spectrum depending on the ion type and concentration. The stretching of non-bonding oxygen on SiO4 tetrahedra due to the alkali ion appeared at ~1100 cm−1 [20]. The results shown in Figure 2 showed that intense bands were observed for all samples at close to 600 cm−1, and they were related to defects in the silica network and were likely induced by the alkali ions (the creation of non-bonding oxygen atoms). Consistently, the bands close to ~1100 cm−1 and ~950 cm−1 were also observed for all samples while the band at ~800 cm−1, related to the silica network, was not observed. This suggested that the incorporation of the rare earth oxides studied in the alkali silicate glasses caused more non-bridging oxygen to occur, and consequentially, it led to more polymerization in the network. It is expected that the presence of rare earth oxides as modifiers contribute three NBO (non-bridging-oxygen) atoms to a glass system while traditional modifiers (Li2O, Na2O, and K2O) contribute only one NBO (non-bridging-oxygen) atom [21].
Physical parameters such as the densities, refractive indexes, concentrations of Sm3+ ions, polaron radii, inter-ionic distances, field strengths, reflection losses, optical dielectrics, and dielectric constants of the glasses were calculated using standard equations [22,23] and are presented in Table 4.

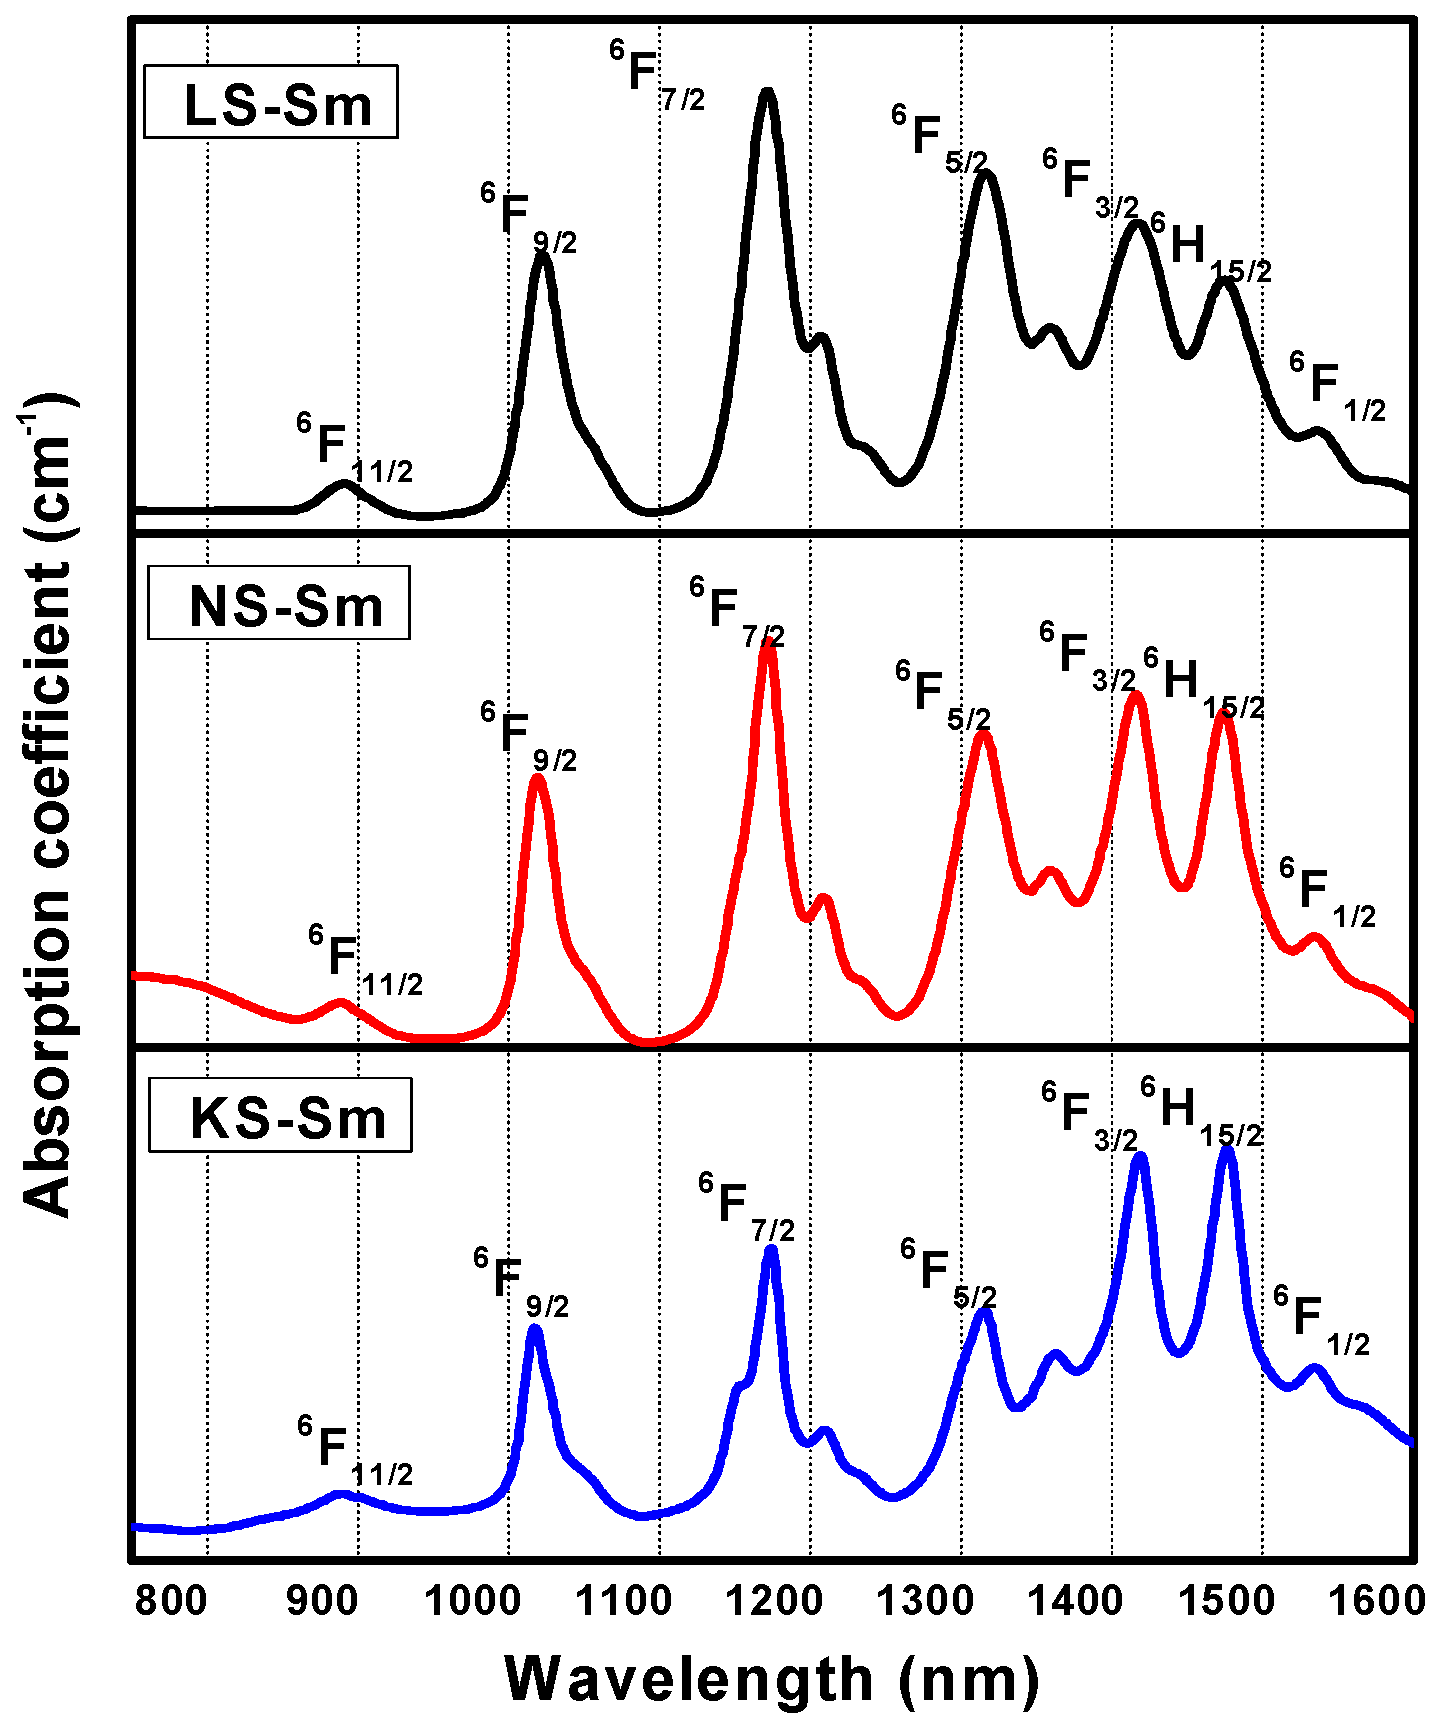
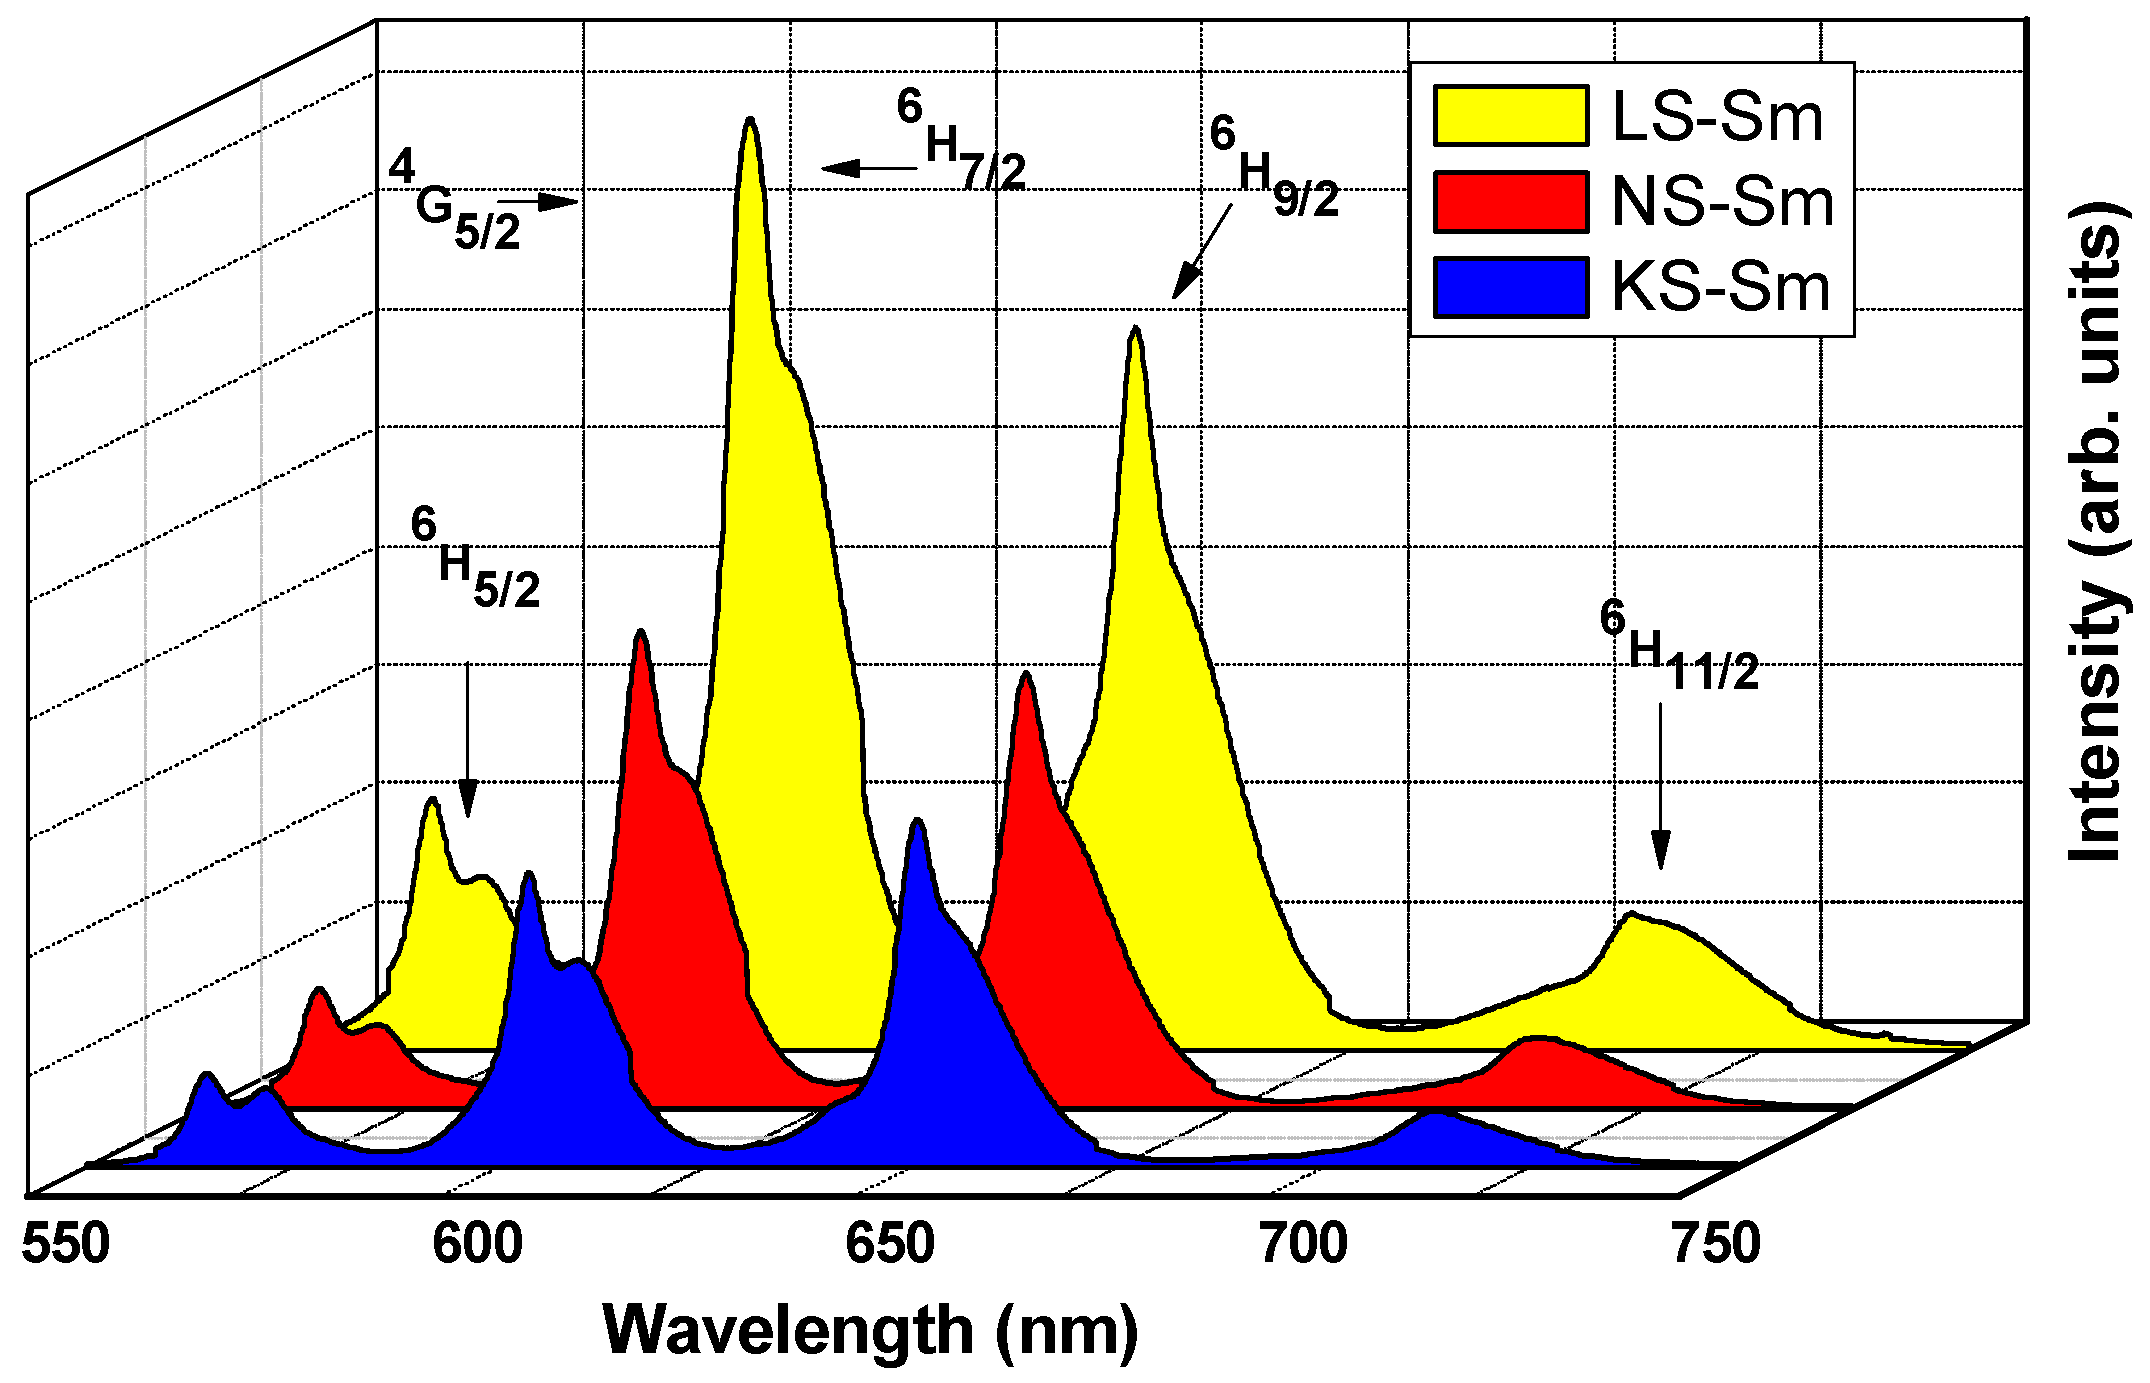
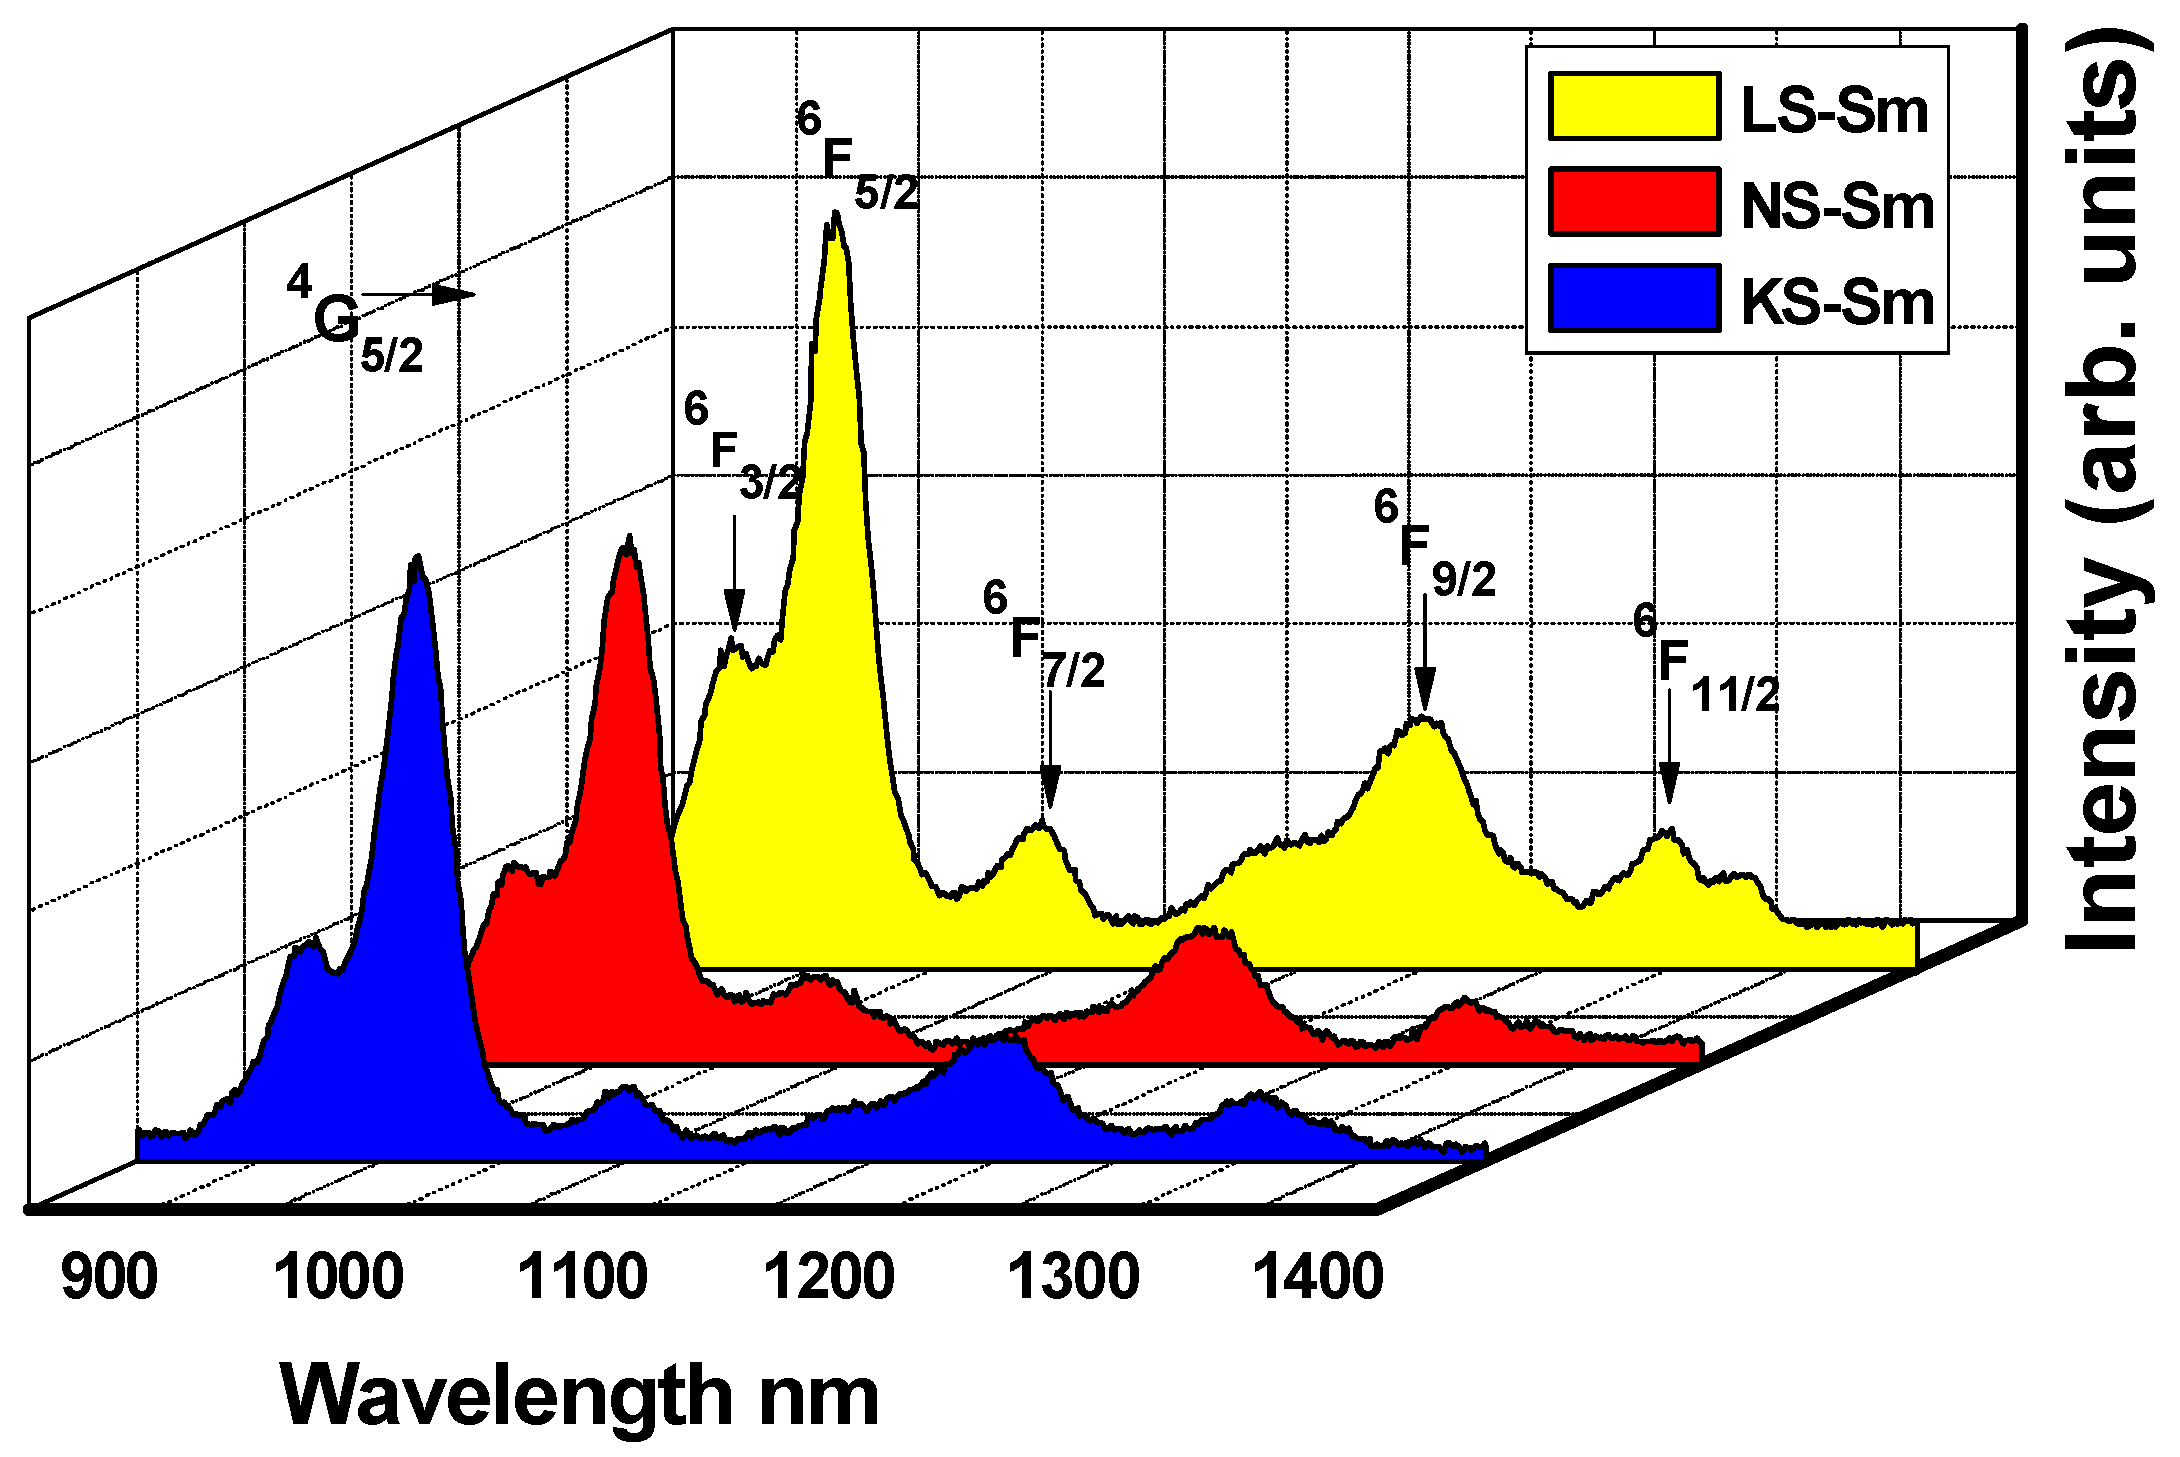
3.2. Optical Properties

The absorption bands of the RE ions in a host glass can be expressed as oscillator strengths, and the electronic transitions can be calculated using the expression:
f e x p = 4.318 × 10 9 ε ( ν ) d ν
where the integral represents the area under the absorption curve and ε(ν) is the molar extinction coefficient. According to the Judd–Ofelt (JO) theory [24,25], which defines a set of three parameters (Ω2, Ω4, and Ω6) susceptible to the environment of the RE ion, the parameter Ω2 is related to the covalence of the metal-ligand bond while Ω4 and Ω6 are related to the rigidity of the host matrix. In the Judd–Ofelt theory, the oscillator strength, f c a l , of the spectral intensity of an electric dipole absorption transition from the initial state, aJ, to the final state, bJ’,
f c a l a J , b J = 8 π 2 m c ν 3 h ( 2 J + 1 ) ( n 2 + 2 ) 2 9 n x λ = 2,4 , 6 Ω λ a J U λ b J 2
where m is the mass of an electron, c is the velocity of the light, h is the Planck’s constant, v is the wavenumber of the absorption peak, n is the refractive index, and Uλ is the doubly reduced matrix element.
The optical absorption spectra of the Sm3+-doped different alkali silicate glasses (Li, Na, and K) recorded at temperature room are shown in Figure 3. The spectral behavior of the Sm3+ in the glasses was very similar to that found in fluorophosphate [26], borosulphate [27], and germanate [28] glasses. Seven absorption bands were shown for each sample, as described in Table 5, which were associated with the absorption transitions from the 6H5/2 ground state to the excited states, as labeled in Figure 3. The observed band positions of different absorption peaks of the samples were due to the interactions between the alkali ions and the crystal field. The band shapes of the ions in all three alkali silicate glasses were similar, with small differences in the half-band widths and peak positions. These results suggested that the Sm3+ ions resided in essentially the same sites as the three alkali ions. The calculated β ¯ and δ values of the glasses are presented in Table 5. The observed the nephelauxetic effect [29,30] was increased with the increase in the alkali ions as follows: K > Na > Li. The negative results demonstrated that the Sm3+ ions and their surrounding ligands were primarily ionic in character. Sm3+ has a 4f5 electron configuration which is characterized by 2S+1LJ free-ion levels. With knowledge of the Sm3+ concentrations, sample thicknesses, peaks positions, and peak areas, the experimental oscillator strengths were obtained by using Equation (1). From the experimentally measured oscillator strengths and doubly reduced matrix elements [31], the J–O intensity parameters were obtained using Equation (2). The measured, as well calculated, oscillator strengths and J–O intensity parameters of the Sm3+ in the alkali silicate glasses are presented in Table 6 and Table 7, respectively. The magnitudes of J–O intensity parameters are important for investigations of glass structures and transition properties of rare earth ions. In general, the Ω2 parameter is an indicator of the covalence of a metal–ligand bond (short-range effect) and the Ω4 and Ω6 parameters provide information about the rigidity of a host glass’s matrix (long-range effects) [32].
In the values for Ω2, Ω4, and Ω6 in Table 7 for the Sm3+-doped alkali silicate glasses, we observed variations in the intensities of the parameters as follows: Ω6 > Ω4 > Ω2. The lithium silicate glass matrix exhibited higher Ω2 values and the potassium silicate glass matrix was minimal, indicating lower covalence values for these compositions. It has been proposed that in oxide glasses, a rare earth ion is surrounded by eight neighboring oxygen atoms belonging to the corners of SiO4, forming a tetrahedral. Normally, the intensity parameter Ω2, which indicates covalence, decreases with decreases in the intensity of the hypersensitive transition.
The hypersensitive transitions for the Sm3+ ions were 6H5/26F1/2 and 6F3/2. The hypersensitivity of a transition is proportional to the nephelauxetic ratio, indicating the RE–O bond’s ionic nature [33]. The Ω6 parameter was the largest in the glasses, showing that the Sm–O bond was more ionic in these glasses than in other glasses and indicating the higher rigidity of the glasses. The shift in the peak wavelengths of the hypersensitive transitions towards shorter wavelengths increased with the size of the alkali ions in the glass matrix, indicating decreases in the ionic nature of the RE–O bonds. Also, these changes were not the result of a large-scale structural rearrangement of the local glass network, but rather, they were primarily caused by the interactions between the alkali ions and the matrix.
Table 7. A comparison of the Judd–Ofelt parameters (Ωλ) (×10−20 cm2) in different hosts.
Host Matrix Ω 2 Ω 4 Ω 6 χ = Ω 4 / Ω 6 Order
LS-Sm3+ (present work)1.283.144.530.69 Ω 6 > Ω 4 > Ω 2
LCN borate [34]0.844.005.020.79 Ω 6 > Ω 4 > Ω 2
30Li2O:70B2O3-Pr3+ [35]0.104.715.280.89 Ω 6 > Ω 4 > Ω 2
NS-Sm3+ (present work)1.272.693.150.85 Ω 6 > Ω 4 > Ω 2
NaZnBS-Sm3+ [27]0.559.689.770.99 Ω 6 > Ω 4 > Ω 2
30Na2O:70B2O3-Pr3+ [35]0.984.764.860.97 Ω 6 > Ω 4 > Ω 2
KS-Sm3+ (present work)1.041.121.610.69 Ω 6 > Ω 4 > Ω 2
KZnBS-Sm3+ [27]0.1811.3711.450.99 Ω 6 > Ω 4 > Ω 2
LKG [11]0.634.054.690.86 Ω 6 > Ω 4 > Ω 2

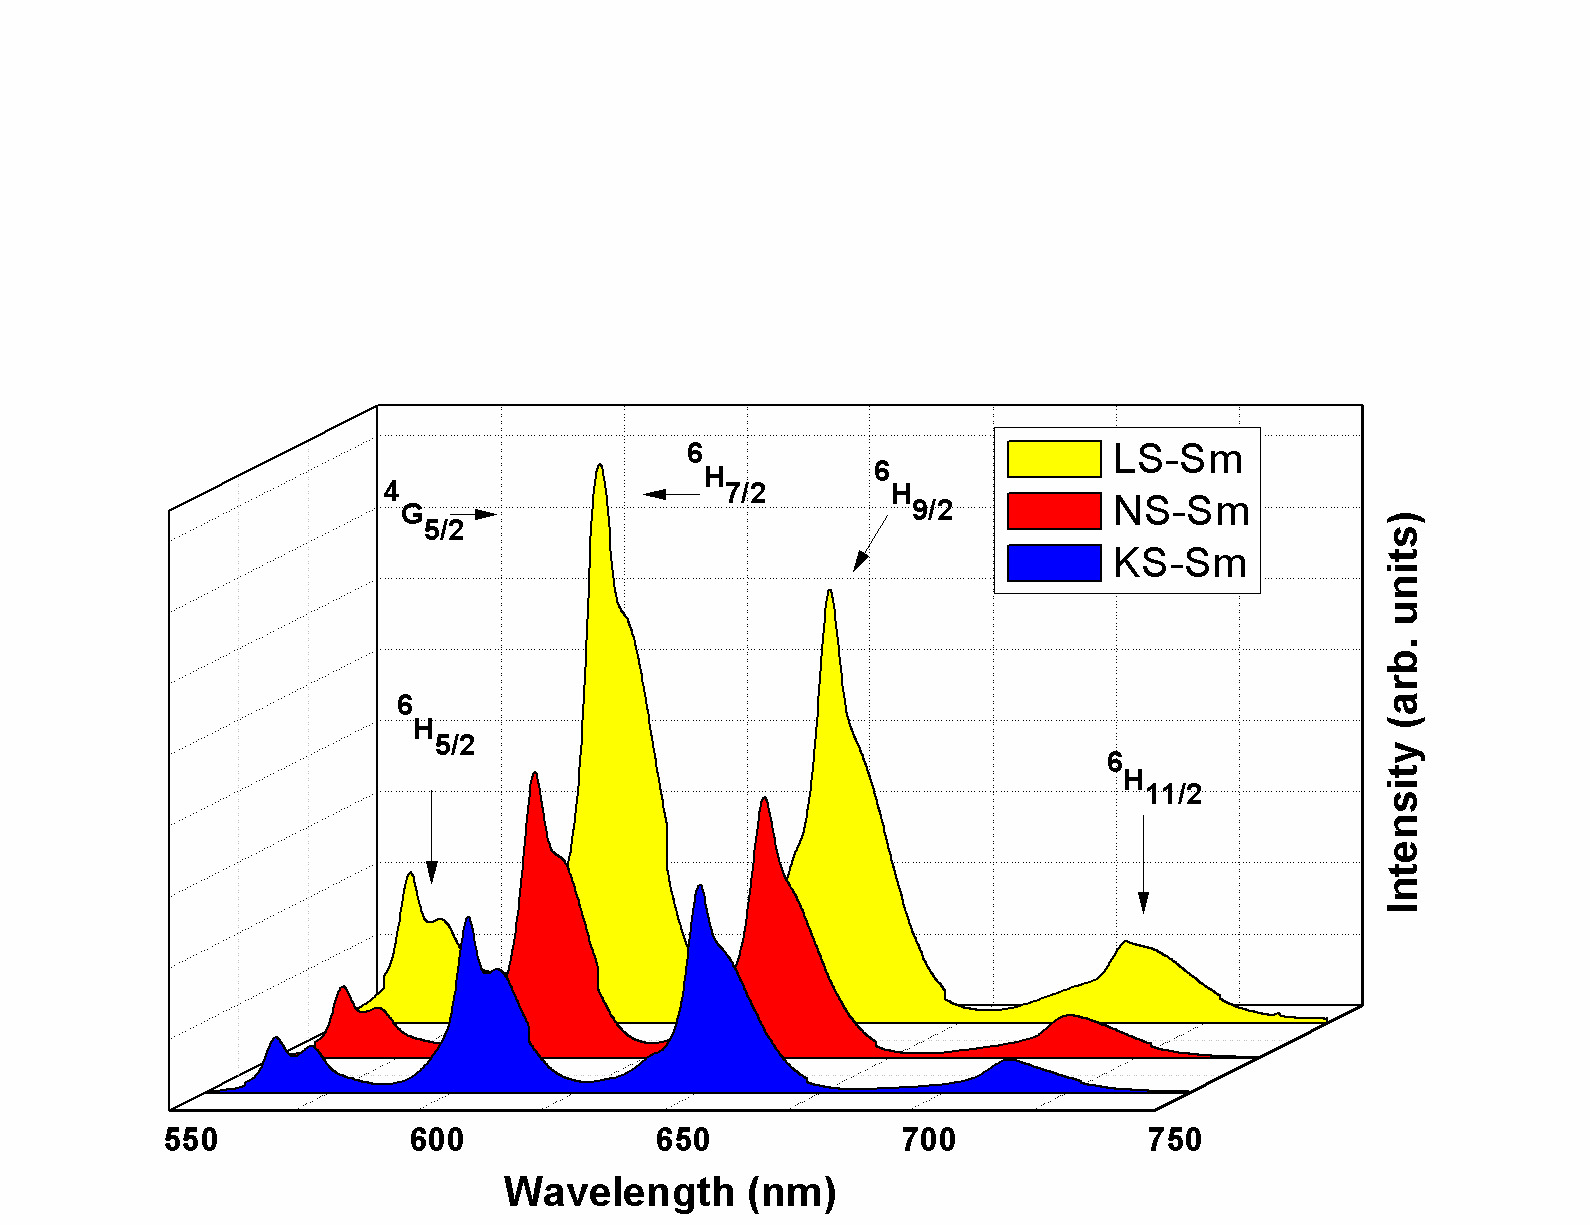
3.3. Emission Spectra and Radiative Properties

The emission spectra under the 488 nm excitation wavelength consisted of potential green, yellow, and orange-reddish emissions at ~565 nm (4G5/26H5/2 magnetic dipole (MD) transition), ~600 nm (4G5/26H7/2 mixed magnetic-electric dipole transition), ~650 nm (4G5/26H9/2 electric dipole transition), and ~710 nm (4G5/26H11/2 electronic dipole transition), all of which were recorded at room temperature in the VIS regions, as shown in Figure 4. The peaks in the NIR region centered at ~915 nm (4G5/26F3/2), ~960 nm (4G5/26F5/2), ~1045 nm (4G5/26F7/2), ~1200 nm (4G5/26F9/2), and ~1300 nm (4G5/26F11/2) are presented in Figure 5. It is important to note the largest number of transitions observed, including the one at 1300 nm, indicated that the alkali silicate glasses were very efficient systems.
The radiative transition probability Arad (aJ and bJ’) is given by the expression:
A r a d a J , b J = 64 π 4 υ 3 e 2 3 h ( 2 J + 1 ) n ( n 2 + 2 ) 2 9 S e d
where Sed and Smd are electric and magnetic dipole line-strengths, respectively. From these values, it is possible to calculate the branching ratio and radiative lifetime of an emitting state, aJ, which is calculated from:
β r a d a J , b J = A r a d ( a J , b J ) b J A r a d ( a J , b J )
and
1 τ r a d = b J A r a d ( a J , b J )
In addition, another important radiative parameter property, the fluorescent integrated emission cross-section (σp) for stimulated emissions, is estimated from the following equation:
σ p a J , b J = λ p 4 8 π c n 2 Δ λ e f f A r a d ( a J , b J )
Due to the characteristic lack of long-range order in glasses, the local environment of RE ions is expected to be slightly different from one site to another, resulting in broad absorption bands. The crystal field splitting is also responsible for the broadening of these bands [26]. It has been assumed that in oxide glasses, an RE ion has eight neighboring oxygen atoms that are shared with the corners of the glass, forming a tetrahedral. In lanthanides, there are certain f–f transitions that are exceptionally sensitive to the local environment, and they are known as hypersensitive transitions (∆J ≤ 2, ∆L ≤ 2, and ∆S = 0). For Sm+3, they corresponded to the 6H5/26F3/2 and 6F1/2 transitions, which were in the visible range. The addition of alkali ions as network modifiers in oxide glasses induced the formation of non-bridging oxygen atoms, changing the forming cation coordination number. This effect induced changes in the lanthanide–oxygen distances and, therefore, should affect the optical properties of the RE ion in the oxide glass [26].
Using the phenomenological intensity parameters, one can estimate the radiative transition probability values for Arad(s−1) (Equation (3)). From these values, it is possible to calculate the branching ratio βR (Equation (4)) and radiative lifetime τrad (ms) (Equation (5)) from the 4G5/2 excited level to all its lower-lying levels for alkali silicate glasses, as shown in Table 8. The stimulated emission cross-section (Equation (6)) is an important parameter for predicting a better laser performance and high quantum efficiency of glass matrices. Table 9 reports the emission band positions, the effective bandwidths, and the values of emission cross-section σ ( λ p ) for some of the transitions originating from the 4G5/2 level of the Sm3+ ions in the silicate glasses. Even though the magnitudes of the intensity parameters obtained in the present work were low, the measured σ ( λ p ) values for the 4G5/26H7/2, 9/2 transitions were relatively higher than those reported for other glasses [36,37,38,39]. The highest values were observed for the 4G5/2-6H7/2 transitions (6.14 × 10⁻²² cm2, 4.97 × 10⁻²² cm2, and 2.31 × 10⁻²² cm2 for the LS, NS, and KS samples, respectively). Despite the values of σ ( λ p ) for the NIR emissions being lower than those of the VIS emissions, they were of the same order of magnitude. Therefore, the novel NIR emissions of the alkali silicate glasses provided a new clue for developing potential NIR optoelectronic devices.

4. Conclusions

The present work detailed the influence of alkali ions on the structural and spectroscopic properties of Sm3+ ion-doped silicon glasses. The FTIR spectra of the doped silica showed that the Si–O–Si bending modes were sharpened with the introduction of rare earth ions. The addition of alkali ions decreased the local symmetry due to the formation of non-bridging oxygen bonds, giving rise to a stretching mode at ~900 cm−1. The optical properties of the Sm3+ alkali silicates were measured and analyzed using the Judd–Ofelt theory. The Ω6 parameter was the largest in the glasses, showing that the Sm–O bonds were more ionic in these glasses than in other glasses and indicating the higher rigidity of these glasses. The intensities of the emission bands in the VIS and NIR regions of the samples containing Li were relatively high compared to those of the samples containing Na and K. The emission spectra showed potential for green, yellow, and orange-reddish emissions. The branching ratios were larger for the 4G5/26H7/2 (VIS region) transition and decreased from the Li and Na to the K silicates, and the ratios for the 4G5/26F5/2 (NIR region) transition decreased as follows: Li > Na > K. The stimulated emission cross-sections obtained were similar to the values reported in the literature for Sm3+ in different glasses.

Funding

The author is grateful for the financial support of the Brazilian agencies CAPES, CNPq, and FAPERGS.

Institutional Review Board Statement

Not applicable.

Informed Consent Statement

Not applicable.

Data Availability Statement

Not applicable.

Conflicts of Interest

The author declares no conflict of interest.

References

  1. Goodwin, D.W. Spectra and Energy Levels of Rare Earth Ions in Crystals. Phys. Bull. 1969, 20, 525. [Google Scholar] [CrossRef]
  2. Gatterer, K.; Pucker, G.; Jantscher, W.; Fritzer, H.P.; Arafa, A. Suitability of Nd (III) absorption spectroscopic to probe the structure of glasses from the ternary system Na2O-B2O3-SiO2. J. Non-Cryst. Solids 1998, 231, 189–199. [Google Scholar] [CrossRef]
  3. Sailaja, B.; Joyce Stella, R.; Thitumala Rao, G.; Jaya Raja, B.; Pushpa Manjari, V.; Ravikumar, R.V.S.S.N. Physical, structural and spectroscopic investigations of Sm3+ doped ZnO mixed alkali borate glass. J. Mol. Struct. 2015, 1096, 129–235. [Google Scholar] [CrossRef]
  4. Cases, R.; Chamarro, M.A. Judd-Ofelt analysis and multiphonon relaxations of rare earth ions in fluorohafnate glasses. J. Solid State Chem. 1991, 90, 313. [Google Scholar] [CrossRef]
  5. Basiev, T.; Dergachev, A.Y.; Orlavskii, Y.V.; Prohkorov, A.M. Multiphonon nonradiative relaxation from high-lying levels of Nd3+ ions in flouride and oxide laser materials. J. Lumin. 1992, 53, 19. [Google Scholar] [CrossRef]
  6. Broer, M.M.; Bruce, A.J.; Grodkiewicz, W.H. Resonantly induced refractive index changes in Eu3+-and Er3-doped silicate and phosphate glasses. J. Lumin. 1992, 53, 15. [Google Scholar] [CrossRef]
  7. Reisfeld, R.; Bornstein, A.; Boehm, L. Optical characteristics and intensity parameters of Sm3+ in GeO2, ternary germanate, and borate glasses. J. Solid State Chem. 1975, 14, 14. [Google Scholar] [CrossRef]
  8. Rodriguez, V.D.; Martin, I.R.; Alcala, R.; Cases, R. Optical properties and cross relaxation among Sm3+ ions in fluorzincate glasses. J. Lumin. 1992, 54, 231. [Google Scholar] [CrossRef]
  9. Ratnakaram, Y.C.; Thirupathi Naidu, D.; Vijaya Kumar, A.; Gopal, N.O. Influence of mixed alkalies on absorption and emission properties of Sm3+ ions in borate glasses. Phys. B 2005, 358, 296–307. [Google Scholar] [CrossRef]
  10. Annapurna, K.; Dwivedi, R.N.; Kumar, A.; Chaudhuri, A.K.; Buddhudu, S. Temperature dependent luminescence characteristic of Sm3+-doped silicate glass. Spectrochim. Acta A Mol. Biomol. Spectrosc. 2000, 56, 103–109. [Google Scholar] [CrossRef]
  11. Jayasimhadri, M.; Chon, E.-J.; Jang, K.-W.; Lee, H.S.; Kim, S. Spectroscopic properties and Judd-Ofelt analysis of Sm3+ doped lead-germanate-tellurite glasses. J. Phys. D Appl. Phys. 2008, 41, 175101. [Google Scholar] [CrossRef]
  12. Sharma, Y.K.; Surana, S.S.L.; Singh, R.K. Spectroscopic investigation and luminescence spectra of soda lime silicate glasses. J. Rare Earths 2009, 27, 773. [Google Scholar] [CrossRef]
  13. Basavapoornima, C.; Jayasankar, C.K. Spectroscopic and photoluminescence properties of Sm3+ ions in Pb-K-Al-Na phosphate glasses for efficient visible lasers. J. Lumin. 2014, 153, 233–241. [Google Scholar] [CrossRef]
  14. Isard, J.O. The mixed alkali effect in glass. J. Non-Cryst. Solids 1969, 1, 235–261. [Google Scholar] [CrossRef]
  15. Day, D.E. Mixed alkali glasses—Their properties and uses. J Non-Cryst. Solids 1976, 21, 343–372. [Google Scholar] [CrossRef]
  16. Kracek, F.C. The ternary system K2SiO3-Na2SiO3-SiO2. J. Phys. Chem. 1932, 36, 2529–2542. [Google Scholar] [CrossRef]
  17. Selvi, S.; Marimuthu, K.; Muralidharan, G. Structural and luminescence behavior of Sm3+ ions doped lead boro-telluro-phosphate glasses. J. Lumin. 2015, 159, 207–218. [Google Scholar] [CrossRef]
  18. Muralidharan, M.N.; Rasmitha, C.A.; Rateesh, R. Photoluminescence and FTIR studies of pure and rare earth doped silica xerogels and aerogels. J. Porous Mater. 2009, 16, 635–640. [Google Scholar] [CrossRef]
  19. Sanders, D.M.; Person, W.B.; Hench, L.L. Quantitative-analysis of glass structure with the use of infrared reflection spectra. Appl. Spectrosc. 1974, 28, 247–255. [Google Scholar] [CrossRef]
  20. Matson, D.W.; Sharma, S.K.; Philpotts, J.A. The structure of high-silica alkali-silicate glasses—A Raman spectroscopy investigation. J. Non-Crystal. Solids 1983, 58, 323–352. [Google Scholar] [CrossRef]
  21. El-Okr, M.; Ibrahem, M.; Farouk, M. Structure and properties of rare-earth-doped glassy systems. J. Non-Cryst. Solids 2008, 69, 2564–2567. [Google Scholar] [CrossRef]
  22. Srinvasa Rao, C.; Srikumar, T.; Rao, M.C. Physical and optical absorption studies on LIF/NaF/KF- P2O5-B2O3 glasses doped with Sm2O3. IJCRGG 2014, 7, 420–425. [Google Scholar]
  23. Bhatia, B.; Meena, S.L.; Parihar, V.; Poonia, M. Optical basicity and polarizability of Nd3+-doped bismuth borate glasses. New J. Glass Ceram. 2015, 5, 44–52. [Google Scholar] [CrossRef]
  24. Judd, B.R. Optical absorption intensities of rare earth ions. Phys. Rev. 1962, 127, 750–761. [Google Scholar] [CrossRef]
  25. Ofelt, G.S. Intensities of crystal spectra of rare earth ions. J. Chem. Phys. 1962, 37, 511–520. [Google Scholar] [CrossRef]
  26. Jayasimhadri, M.; Moorthy, L.R.; Saleem, S.A.; Ravikumar, R.V.S.S. Spectroscopic characteristics of Sm3+-doped alkali fluorophosphate glasses. Spectrochim. Acta Part A 2006, 64, 939–944. [Google Scholar] [CrossRef]
  27. Jayasankar, C.K.; Rukmini, E. Optical properties of Sm3+ ions in zinc and alkali zinc borosulphate glasses. Opt. Mater. 1997, 8, 193–205. [Google Scholar] [CrossRef]
  28. Chen, B.J.; Shen, L.F.; Pun, E.Y.B.; Lin, H. Sm3+-doped germanate glass channel waveguide as light source for minimally invasive photodynamic therapy surgery. Opt. Express 2012, 20, 879–889. [Google Scholar] [CrossRef]
  29. Jorgenson, C.K. Orbitals Atoms and Molecules; Academic Press: London, UK, 1962. [Google Scholar]
  30. Sinha, S.P. Complexes of the Rare Earth; Pergamon Press: Oxford, UK, 1966. [Google Scholar]
  31. Carnall, W.T.; Crosswhite, H.; Crosswhite, H.M. Energy Level Structure and Transition Probabilities of the Trivalent Lanthanides in LaF3; Report ANL–78–XX–95; Argonne National Laboratory: Lemont, IL, USA, 1978. [Google Scholar]
  32. Sudhakar, K.S.V.; Srinivasa Reddy, M.; Srinivasa Rao, L.; Veeraiah, N. Influence of modifier oxide on spectroscopic and thermoluminescence characteristics of Sm3+ion in antimony borate glass system. J. Lumin. 2008, 128, 1791–1798. [Google Scholar] [CrossRef]
  33. Rajesh, D.; Balakrishna, A.; Ratnakaram, Y.C. Luminescence, structural and dielectric properties of Sm3+ impurities in strontium lithium bismuth borate glasses. Opt. Mater. 2012, 35, 108–116. [Google Scholar] [CrossRef]
  34. Ratnakaram, Y.C.; Thirupathi Naidu, D.; Chakradhar, R.P.S. Spectral studies of Sm3+ and Dy3+ doped lithium cesium mixed alkali borate glasses. J. Non-Cryst. Solids 2006, 353, 3914–3922. [Google Scholar] [CrossRef]
  35. Takebe, H.; Nageno, Y.; Morinaga, K. Compositional dependence of Judd-Ofelt parameters in silicate, borate, and phosphate glasses. J. Am. Ceram. Sot. 1995, 78, 1161–1168. [Google Scholar] [CrossRef]
  36. Shanmuga Sundari, S.; Marimuthu, K.; Sivraman, M.; Surendra Babu, S. Composition dependent structural and optical properties of Sm3+-doped sodium borate and sodium fluoroborate glasses. J. Lumin. 2010, 130, 1313–1319. [Google Scholar] [CrossRef]
  37. Arul Rayappan, I.; Selvaraju, K.; Marimuthu, K. Structural and luminescence investigations on Sm3+ doped sodium fluoroborate glasses containing alkali/alkaline earth metal oxides. Phys. B 2011, 406, 548–555. [Google Scholar] [CrossRef]
  38. Herrera, A.; Fernandes, R.G.; de Camargo, A.S.S.; Hernandes, A.C.; Buchner, S.; Jacinto, C.; Balzaretti, N.M. Visible–NIR emission and structural properties of Sm3+ doped heavy-metal oxide glass with composition B2O3–PbO–Bi2O3–GeO2. J. Lumin. 2016, 171, 106–111. [Google Scholar] [CrossRef]
  39. Montoya, I.M.; Balzaretti, N.M. High pressure effect on structural and spectroscopic properties of Sm3+ doped alkali silicate glasses. High-Press. Res. 2017, 37, 296–311. [Google Scholar] [CrossRef]
Figure 1. FTIR absorption spectra of the different alkali silicate glasses.
Ceramics 06 00109 g001
Figure 2. Raman spectra of the different alkali silicate glasses.
Ceramics 06 00109 g002
Figure 3. Optical absorption spectra of the Sm3+-doped alkali silicate glasses recorded at room temperature in the NIR region.
Ceramics 06 00109 g003
Figure 4. VIS region emission spectra for the alkali silicate glasses under excitation at 488 nm.
Ceramics 06 00109 g004
Figure 5. NIR region emission spectra for the alkali silicate glasses under excitation at 488 nm.
Ceramics 06 00109 g005
Table 1. Chemical compositions of the glass samples.
Sample NotationGlass Compositions (mol%)Glass AppearancesMelting Temperatures (°C)
LS-Sm33.0 Li2O + 66.0 SiO2 + 1.0 Sm2O3Transparent glass1550
NS-Sm33.0 Na2O + 66.0 SiO2 + 1.0 Sm2O3Transparent glass1550
KS-Sm33.0 K2O + 66.0 SiO2 + 1.0 Sm2O3Transparent glass1550
Table 2. Vibration mode FTIR spectra of the alkali silicate glasses.
Vibration ModeLS-Sm
Wavenumber (cm−1)
NS-Sm
Wavenumber (cm−1)
KS-Sm
Wavenumber (cm−1)
Si–O–Si bending vibration472468447
O–Si–O bending vibration774752745
Si–O–Si symmetric stretching916891884
Si–O–Si asymmetric stretching103710601013
Table 3. Vibration-mode Raman spectra of the alkali silicate glasses.
Vibration modeLS-Sm
Wavenumber (cm−1)
NS-Sm
Wavenumber (cm−1)
KS-Sm
Wavenumber (cm−1)
Si–O591589587
Si–O–Si symmetric stretching939942930
Si–O–Si antisymmetric stretching107310941097
Table 4. Physical properties of the Sm3+-doped alkali metal ion silicate samples.
Physical PropertiesLS-SmNS-SmKS-Sm
Density, ρ (gm/cm3) (± 0.0005)2.45522.53962.5598
Refractive index (n) (585 nm)1.49301.44901.4310
Concentration of Sm3+, N
(×1020 ions/cm3)
2.18961.88541.7370
Molar volume (Vm) (cm3/mol)27.502431.940434.6697
Polaron radius, rp (Å)6.68467.02647.2211
Interionic distance, ri (nm)1.65911.74391.7923
Field strength, F (×1016 cm−2)6.71396.07665.7533
Reflection losses (RL) (×10−2)3.91073.36143.1433
Molar refraction (Rm) (cm3/mol)7.99288.56718.9742
Optical dielectric constant (P t / P )1.22901.09961.0478
Dielectric constant (ε)2.22902.09962.0478
Molar polarizability (αm) × 10−22 cm33.16873.39643.5578
Table 5. Bands positions (cm−1) and their assignments for the Sm3+-doped alkali silicates.
Transitions 6H5/2LS-SmNS-SmKS-Sm
6F11/210,626.9910,655.7310,672.36
6F9/29325.819353.919369.21
6F7/28185.958183.338169.19
6F5/27316.947325.957322.03
6F3/26815.186821.166806.60
6H15/26558.676560.536549.88
6F1/26288.496306.046309.73
β ¯ 1.014361.015691.01573
δ −0.01416−0.01544−0.01548
Table 6. Experimental ( f e x p ) and calculated ( f c a l ) oscillator strengths (×10−6) and rms ( σ r m s ) for the Sm3+ alkali silicate glasses.
Transitions 6H5/2LS-SmNS-SmKS-Sm
f e x p f c a l f e x p f c a l f e x p f c a l
6F11/20.6020.5680.3630.4070.3090.205
6F9/24.7203.4403.3902.4701.6401.230
6F7/23.4904.6602.4903.331.2201.610
6F5/22.3601.8901.6301.3700.6480.595
6F3/21.2101.0601.1700.8740.7600.475
6H15/2 + 6F1/20.8970.3261.0910.3830.8060.307
σ r m s 0.98560.83100.5036
Table 8. Radiative transition probability values (Arad (s−1)), branching ratio values (βR), and radiative lifetime values (τrad (ms)) for the Sm3+-doped alkali silicate glasses.
Transitions from 4G5/2 toLS-SmNS-SmKS-Sm
Δ E ( c m 1 ) A r a d ( s 1 ) β R τ r a d Δ E ( c m 1 ) A r a d ( s 1 ) β R τ r a d Δ E ( c m 1 ) A r a d ( s 1 ) β R τ r a d
6H5/217,74045.400.18123.9917,73136.280.19515.3717,72817.190.190611.08
6H7/216,608110.6180.4415 16,58476.3180.4104 16,56834.3720.3808
6H9/215,40758.3140.2327 15,40846.0000.2473 15,36925.5100.2827
6H11/214,10126.2560.1048 14,06518.9450.1019 14,0258.0740.0895
6F3/210,8900.8000.0032 10,9050.7050.0038 10,8340.5020.0056
6F5/210,4245.9250.0236 10,3955.2570.0283 10,3733.4050.0377
6F7/295781.9650.0078 96061.5050.0081 95330.6060.0067
6F9/283240.8600.0034 83260.7010.0038 83210.4580.0051
6F11/276860.4190.0017 76690.2710.0015 76450.1290.0014
Table 9. Stimulated emission cross-sections (σ(λp) × 10−22 cm2) for the emission peak wavelengths (λp) in the infrared with the effective line width values (λeff) for the Sm3+-doped alkali silicate glasses.
Transitions from 4G5/2 toLS-SmNS-SmKS-Sm
λ p ( n m ) Δ λ e f f ( n m ) σ ( λ p ) λ p ( n m ) Δ λ e f f ( n m ) σ ( λ p ) λ p ( n m ) Δ λ e f f ( n m ) σ ( λ p )
6H5/256410.142.6956411.012.1156512.280.92
6H7/260214.166.1460312.824.9760412.682.31
6H9/264914.764.1765014.833.4965113.732.16
6H11/271022.911.7371121.631.4271318.750.72
6F3/291919.030.1891917.740.1892119.600.12
6F5/295927.371.0996228.361.0196422.920.83
6F7/2104427.250.51104332.190.35105224.680.19
6F9/2119970.610.15120160.990.15120461.820.10
6F11/2130139.590.18130933.350.15130741.090.06
Disclaimer/Publisher’s Note: The statements, opinions and data contained in all publications are solely those of the individual author(s) and contributor(s) and not of MDPI and/or the editor(s). MDPI and/or the editor(s) disclaim responsibility for any injury to people or property resulting from any ideas, methods, instructions or products referred to in the content.

