Article

Tuning the Coefficient of Thermal Expansion of Transparent Lithium Aluminosilicate Glass-Ceramics by a Two-Stage Heat Treatment

by
Andrey S. Naumov
*,
Georgiy Yu. Shakhgildyan
,
Nikita V. Golubev
,
Alexey S. Lipatiev
,
Sergey S. Fedotov
,
Roman O. Alekseev
,
Elena S. Ingat’eva
,
Vitaliy I. Savinkov
and
Vladimir N. Sigaev
Department of Glass and Glass-Ceramics, Mendeleev University of Chemical Technology, 125047 Moscow, Russia
*
Author to whom correspondence should be addressed.
Ceramics 2024, 7(1), 1-14; https://doi.org/10.3390/ceramics7010001
Submission received: 1 October 2023 / Revised: 18 December 2023 / Accepted: 20 December 2023 / Published: 22 December 2023
(This article belongs to the Special Issue Advanced Glasses and Glass-Ceramics)

Abstract

:
Transparent glass-ceramics with a Li2O–Al2O3–SiO2 (LAS) system have been extensively utilized in optical systems in which thermal stability is of utmost importance. This study is aimed to develop thermal treatment routes that can effectively control the structure of transparent LAS glass-ceramics and tune its thermal expansion coefficient within a wide range for novel applications in photonics and integrated optics. The optimal conditions for the nucleation and crystallization of LAS glass were determined by means of differential scanning calorimetry and a polythermal analysis. XRD, Raman spectroscopy, and TEM microscopy were employed to examine the structural changes which occurred after heat treatments. It was found that the second stage of heat treatment promotes the formation of β-eucryptite-like solid solution nanocrystals, which enables effective control of the coefficient of thermal expansion of glass-ceramics in a wide temperature range of −120 to 500 °C. This work provides novel insights into structural rearrangement scenarios occurring in LAS glass, which are crucial for accurately predicting its crystallization behavior and ultimately achieving transparent glass-ceramics with desirable properties.

1. Introduction

Transparent glass-ceramics in the Li2O–Al2O3–SiO2 (LAS) system have been demonstrated to have notable importance in the field of optical instrument engineering, particularly in applications in which thermal stability plays a crucial role [1,2]. This is primarily attributed to their extremely low coefficient of thermal expansion (CTE) and their manufacturability, which allows for the production of large material blanks with outstanding optical homogeneity. Such materials have provided a significant impetus to the development of such areas as astronomy [3,4], ultra-precision metrology [5], the fabrication of navigation devices [6,7], and novel nanometer precision manufacturing techniques, such as extreme ultraviolet lithography [8,9]. The unique thermo-mechanical characteristics exhibited by LAS glass-ceramics can be ascribed to the carefully regulated process of crystallization, facilitating the formation of β-eucryptite LiAlSiO4 solid solutions [10,11]. The β-eucryptite crystal phase exhibits a negative average CTE along the c-axis, with values reaching as low as −6.2 ppm/K in the temperature range of 20–1000 °C [12,13]. By combining the thermal expansion of the crystalline phase with the residual amorphous glass phase, LAS glass-ceramics can be engineered to achieve near-zero CTE values, resulting in thermally stable materials. On the other hand, the ability to finely adjust thermomechanical properties through the temperature treatment of initial glasses shows potential for novel applications of LAS glass-ceramics in photonics and integrated optics [14,15,16]. However, this also calls for more comprehensive studies of the phase separation processes within the LAS glass-forming system.
The controlled crystallization method for LAS glass-ceramics is not unique and typically involves two consecutive stages of glass thermal treatment: (i) nucleation, during which crystalline nuclei form within the amorphous phase; and (ii) crystallization, when the desired crystalline phase grows at the sites of nucleus formation [17,18,19]. Despite the methodological simplicity of obtaining LAS glass-ceramics, there are numerous factors that influence the properties of the final material, including the chemical composition of the initial glass, the presence of nucleation agents and their quantity, the synthesis method of the glass, and subsequent thermal treatments [20,21]. In this regard, LAS glass-ceramics are involved in a wide scope of research, including investigations into the effect of different types and amounts of nucleating agents [22,23,24], the determination of nucleation mechanisms and crystallization kinetics [25,26,27], and the development of various heat-treatment routes to initiate crystal growth [28].
Burgeoning interest in the spatially selective modification of materials through the use of femtosecond laser pulses has illuminated another potential application for transparent glass-ceramics [29]. Direct ultrafast laser writing has opened up new possibilities for the creation of 3D integrated optical and photonic components and devices [30]. Previous research in this field has demonstrated the success of the spatially selective crystallization of nonlinear optical crystals, metallic nanoparticles, and quantum dots [31,32,33]. The object under investigation in this area of research is glass-ceramics with unique thermal and mechanical properties. Recently, the direct laser writing of functional structures, such as waveguides and directional couplers, in glass-ceramics was demonstrated [15,16]. It is believed that the use of LAS glass-ceramics would enable the production of integrated optical devices and the miniaturization of large optical systems used in space astronomy and navigation, for which size and weight parameters are crucial [14,16,34]. For the fabrication of temperature-insensitive waveguides, not only the CTE of the material but also the temperature dispersion of its refractive index should be taken into account. Thus, the tuning of glass-ceramics’ CTE is required, which can help to partially compensate for the change in the refractive index within the temperature. In line with that, the optical transparency of glass-ceramics must remain high, because light scattering can lead to increased optical losses [35].
For the first time, this study aims to explore the potential of wide-range tuning the structure and properties of LAS glass-ceramics, for which we previously demonstrated the possibility of writing integrated optical waveguides using femtosecond laser radiation [16]. The outcomes of this research could pave the way for the development of transparent LAS glass-ceramics with enhanced properties, featuring specified CTE values, and enabling the subsequent creation of complex photonic structures within these materials. This could simplify the manufacturing process of integrated optical devices and facilitate the miniaturization of large optical systems.

2. Materials and Methods

2.1. Glass Synthesis and Crystallization

Reagent grade raw materials were weighed, mixed, and used for the preparation of the batch, which was calculated to produce 500 g of glass. Reagent grade Li2CO3 (Lanhit, Moscow, Russia), Al(OH)3 (Labhimos-S, Moscow, Russia), SiO2 (Lanhit, Moscow, Russia), Al(PO3)3 (Ekotek, Moscow, Russia), MgCO3 (Spectr-Him, Moscow, Russia), Ba(NO3)2 (Reahim, Moscow, Russia), TiO2 (Lanhit, Moscow, Russia), ZrO2 (Lanhit, Moscow, Russia), ZnO (Spectr-Him, Moscow, Russia), Sb2O3 (CT Lantan, Moscow, Russia), and As2O3 (Himpromkomplekt, Penza, Russia) were used as raw materials. Batch composition of LAS glass is given in Table 1. The same glass composition was previously used in a work studying the direct laser writing of depressed-cladding optical waveguides in glass-ceramics [16]. The glass batch was loaded into the corundum crucible and placed in the chamber of the bottom-loading electrical furnace equipped with MoSi2 heating elements (Promtermo Ltd., Moscow, Russia). The furnace was heated up to 1600 °C and kept at this temperature for 4 h to homogenize and refine the glass melt. After that, the melt was poured into the preheated mold, which was subsequently transferred into the electric muffle furnace (Termokeramika Ltd., Moscow, Russia) for annealing of the glass cast at 600 °C for 4 h. The fabricated glass block of the size ~150 mm × 90 mm × 15 mm shown in Figure S1 was visually transparent and homogeneous.
During the glass melting process, the composition of the glass can undergo changes as a result of the evaporation of volatile components and partial dissolution of the crucible. To evaluate the chemical composition of the glass after the synthesis, a 5800 VDV ICP-OES inductively coupled plasma optical emission spectrometer equipped with an Ar flow atmosphere plasma sample injection system (Agilent Technologies Inc., Santa Clara, CA, USA) was employed. The instrumental settings for this technique and the measured elements are presented in Table S1. Complete dissolution of the powdered glass sample was achieved through a combination of HF/HCl/HNO3 acids. The results of the chemical analysis are presented in Table 1 and indicate good agreement between calculated and analyzed glass composition. Mass losses during the glass melting did not exceed 1.5%. The slight increase in Al2O3 content is presumably due to degradation of the corundum crucible.
The glass block was cut into ~10 mm × 10 mm × 2 mm plates and subsequently heat-treated in a muffle furnace with different regimes to produce the glass-ceramics. Polythermal crystallization of the bulk glass samples was also performed using the technique described previously [35].

2.2. Glass and Glass-Ceramics Characterization

The densities of glass and glass-ceramics were measured at room temperature by the Archimedes method with distilled water as an immersing liquid. Bulk samples of initial and nucleated glasses in the form of thin disks (15 ± 1 mg) were used for thermal analysis carried out using the Netzsch STA 449 F3 Jupiter simultaneous thermal analyzer (NETZSCH, Waldkraiburg, Germany). The heating of samples was performed in a Pt crucible at 10 °C/min rate in Ar flow atmosphere. The glass transition temperature (Tg) was determined as the extrapolated onset of the transition, while the crystallization peak temperature (TP) was defined as the peak extremum temperature in differential scanning calorimetry (DSC) curves. Length changes (∆L) during heating of the bulk glass and glass-ceramic samples with a size of 20 mm × 4 mm × 4 mm were investigated using a Netzsch DIL 402 SE dilatometer (NETZSCH, Waldkraiburg, Germany), which was equipped with a cooling system allowing for measurements in two temperature ranges: from −180 °C to 25 °C and from 25 °C to 500 °C at a heating rate of 5 °C/min. The CTE values calculated from the elongation curves of ∆L /L0 = f(T) function are valid up to 10−8 K−1.
Powder X-ray diffraction (XRD) analysis of the initial glass and glass-ceramics was carried out on a D2 Phaser diffractometer (Bruker, Germany) employing nickel-filtered CuKα radiation in 2θ range from 10° to 60°. Crystalline phases were identified by comparing the peak positions and relative intensities in XRD patterns with the ICDD PDF-2 database (released in 2011). The crystallite size was estimated from broadening of the XRD peak at about 26°, without correction for the instrumental broadening, according to Scherrer’s equation as follows:
D = K λ c o s θ ,
where λ is the wavelength of the X-ray radiation (1.5406 Å), θ is the diffraction angle, Δ is the width of the peak at half of its maximum and K is the constant assumed to be 1 [36]. The crystallized fraction was evaluated as 100·(Ap/Ax), where Ax and Ap are, respectively, the area of the whole XRD pattern (without background) and the area of the peaks considered as the area outside of the broad amorphous XRD pattern (Figure S2). The instrumental background profile was determined from the X-ray scan of an empty silicon-made low-background specimen holder. Indicated areas were calculated (in cps × degrees) using DIFFRAC.EVA software version 5.0.
NTegra Spectra Raman spectrometer (NT-MDT Co., Zelenograd, Moscow, Russia) with an Ar laser beam (with a 488 nm excitation wavelength) was used to record Raman spectra from the studied samples in the form of polished plates. Bulk samples of the obtained glass-ceramics were subjected to investigation by transmission electron microscopy (TEM) using Tecnai Osiris transmission electron microscope (Thermo Fisher Scientific, Waltham, MA, USA) equipped with a spherical aberration corrector. TEM images were obtained in 200 kV mode. To calculate the particle size distribution, 150 particles from the TEM image were analyzed using the ImageJ software version 1.53t.
The refractive index (nD) of the initial glass was measured with an Abbe DR-M4 refractometer (ATAGO Co., Ltd., Tokyo, Japan) at 589 nm at ~25 °C. The transmission optical spectra of the fabricated samples with thickness of 2 mm were recorded in the visible spectral range using UV-3600 spectrophotometer (Shimadzu, Kyoto, Japan).

3. Results and Discussion

The DSC curve of the initial glass (Figure 1a) shows a single exothermic peak, which is attributed to the crystallization of the β-quartz solid solution, typical for LAS glass compositions in the investigated temperature range [37]. Only the broad halo centered at around 23° was observed in the XRD pattern of the initial glass (Figure 1b), pointing to the absence of any crystalline phase. The main properties of the LAS glass are presented in Table 1.
The attainment of zero CTE values in LAS glass-ceramics is the outcome of an extensive and systematic investigation into the crystallization characteristics of LAS glasses [38,39]. The crystalline phase content that allows us to maintain the transparency of glass-ceramics is in the range from approximately 50% to 90%, in which the crystals are a few tens of nanometers [40]. To achieve a high level of crystallinity, nucleating agents are introduced into the initial glass composition. Additionally, an appropriate temperature treatment route must be adjusted to optimize the kinetics of the glass crystallization process, ensuring the desired ratio between the nucleation and crystal growth rates [9,40].
It is known that a two-stage crystallization approach is generally employed to obtain a fine nanocrystalline structure in transparent glass-ceramics. The first stage promotes the formation of a maximum number of crystal nuclei, while the second stage facilitates the growth of the primary crystalline phase. The nucleation stage has the most significant influence on the ultimate structure and uniform distribution of the crystalline phase throughout the glass-ceramic material [41]. So, indirect methods of monitoring the changes in the physical properties of the material strongly connected with nucleation and crystal growth were employed in this study to ascertain the nucleation temperature of the LAS glass.

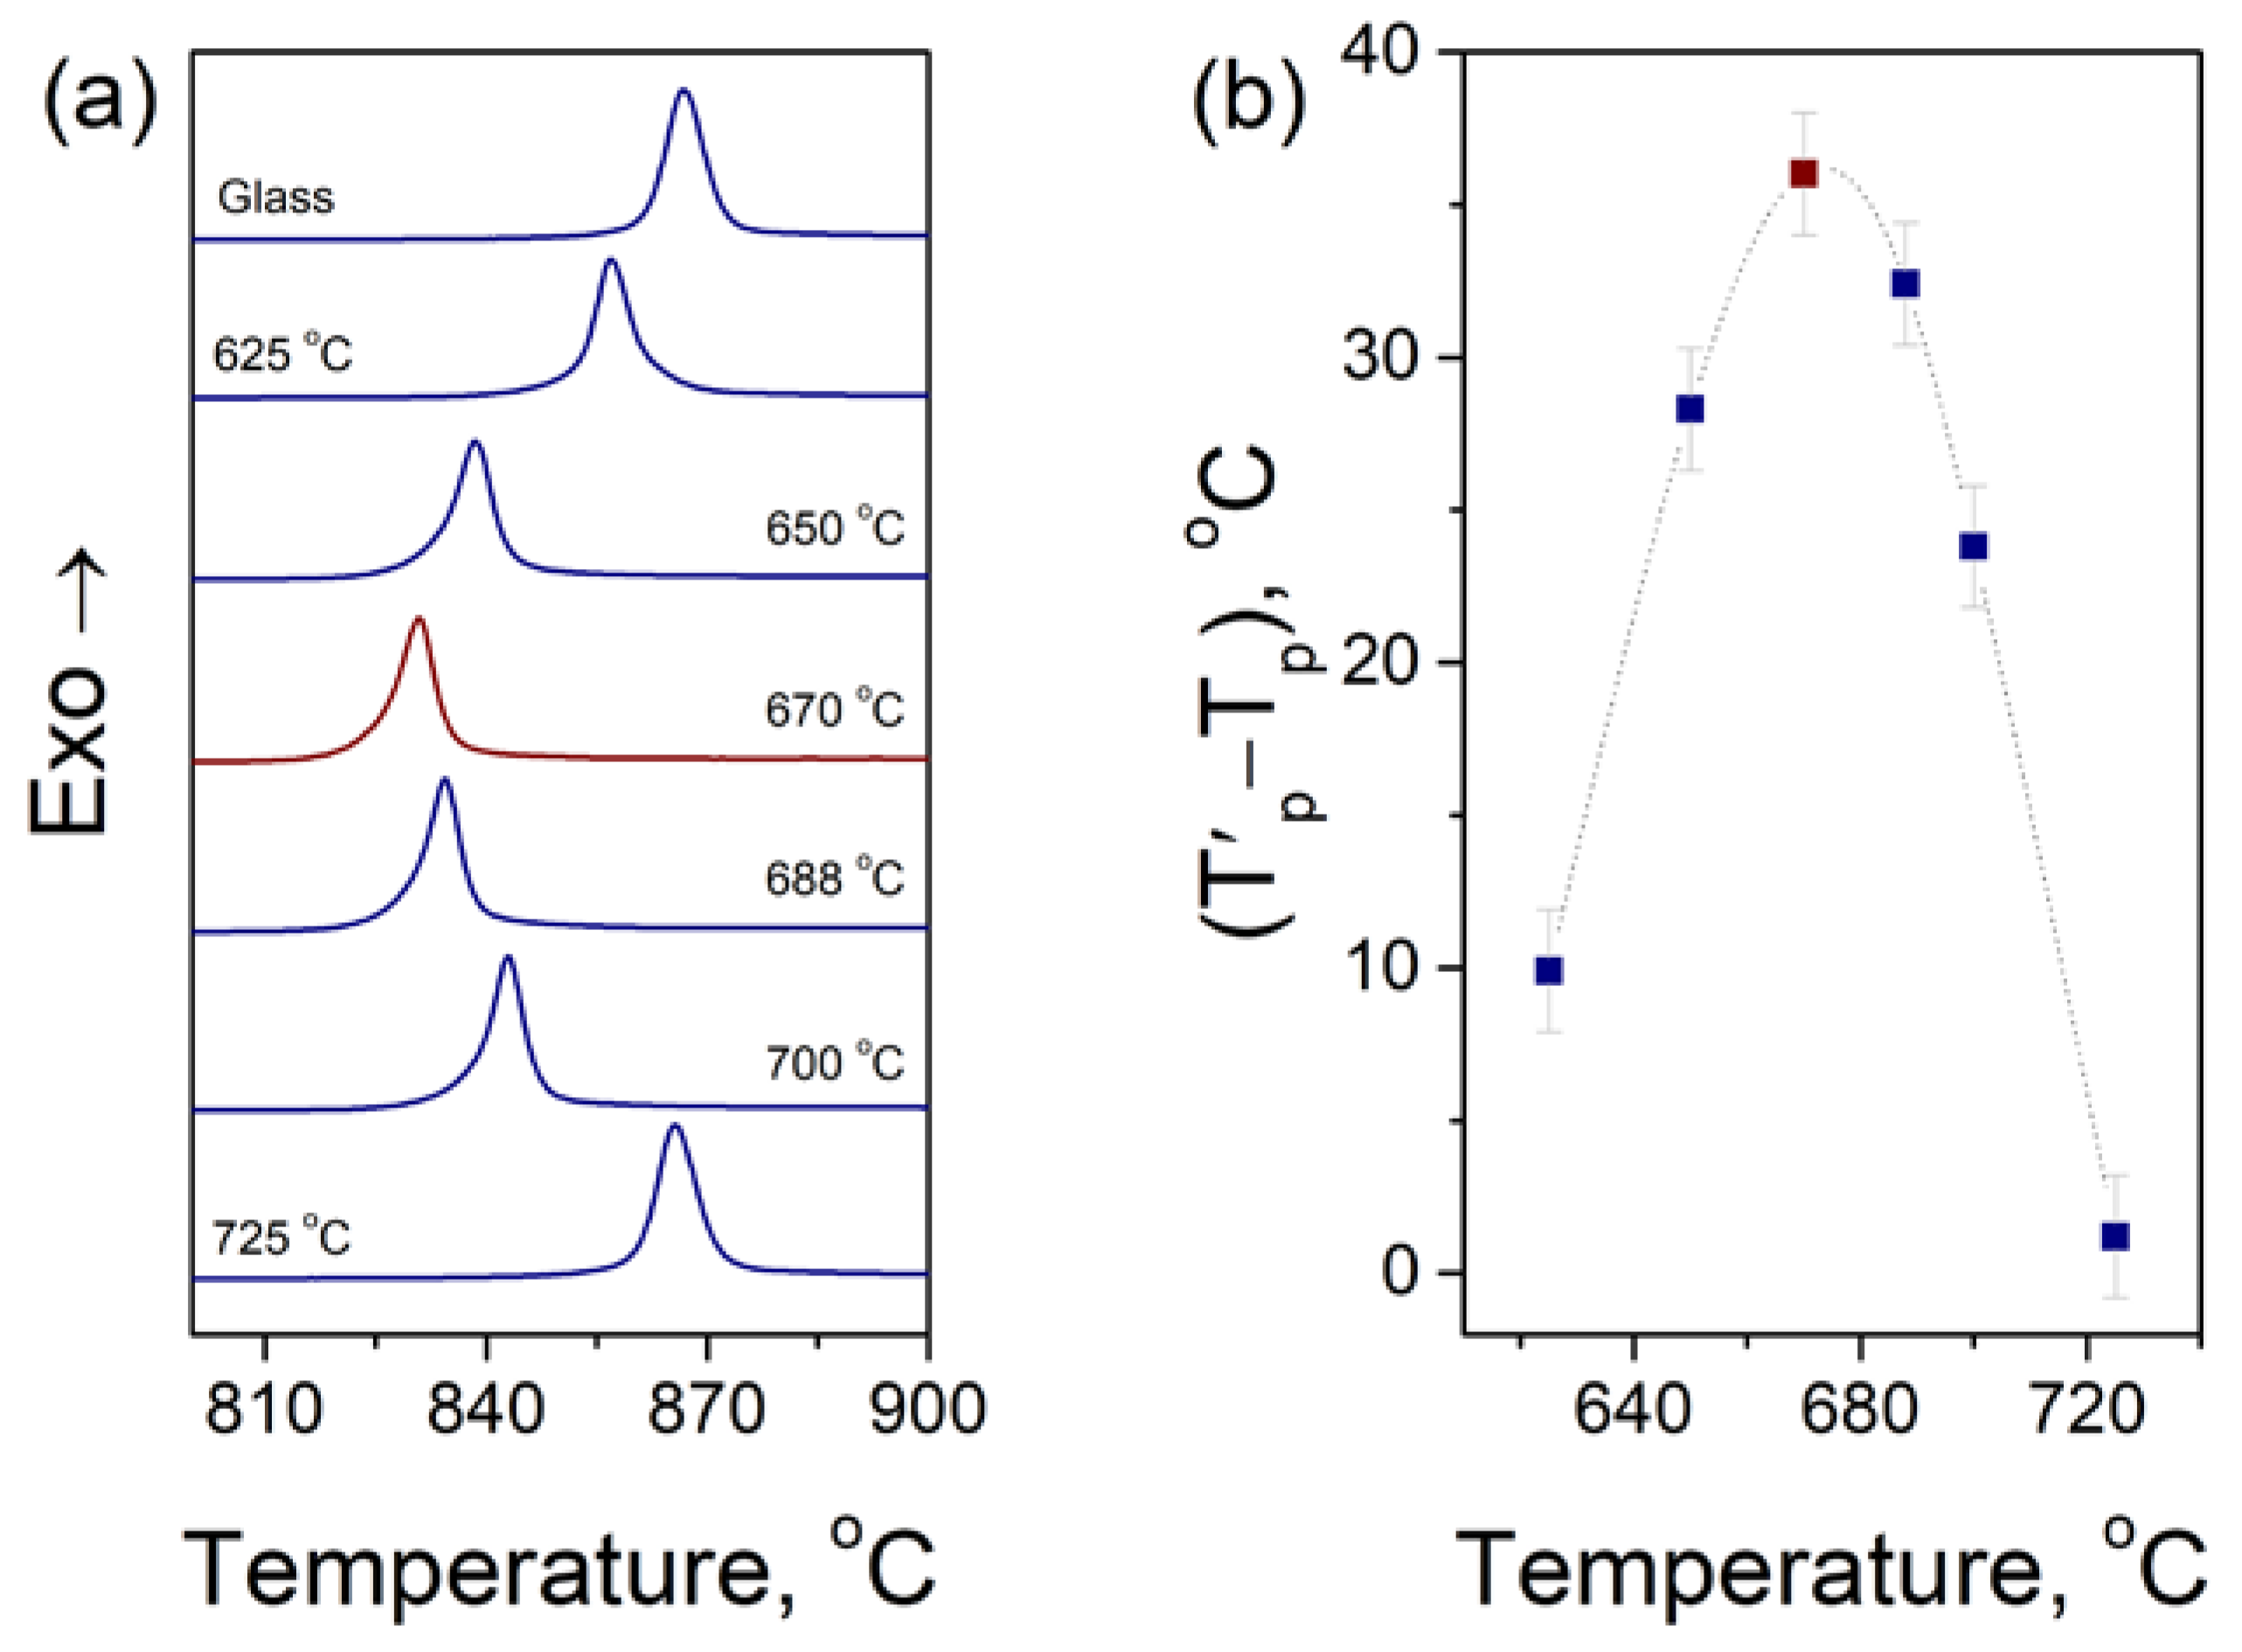
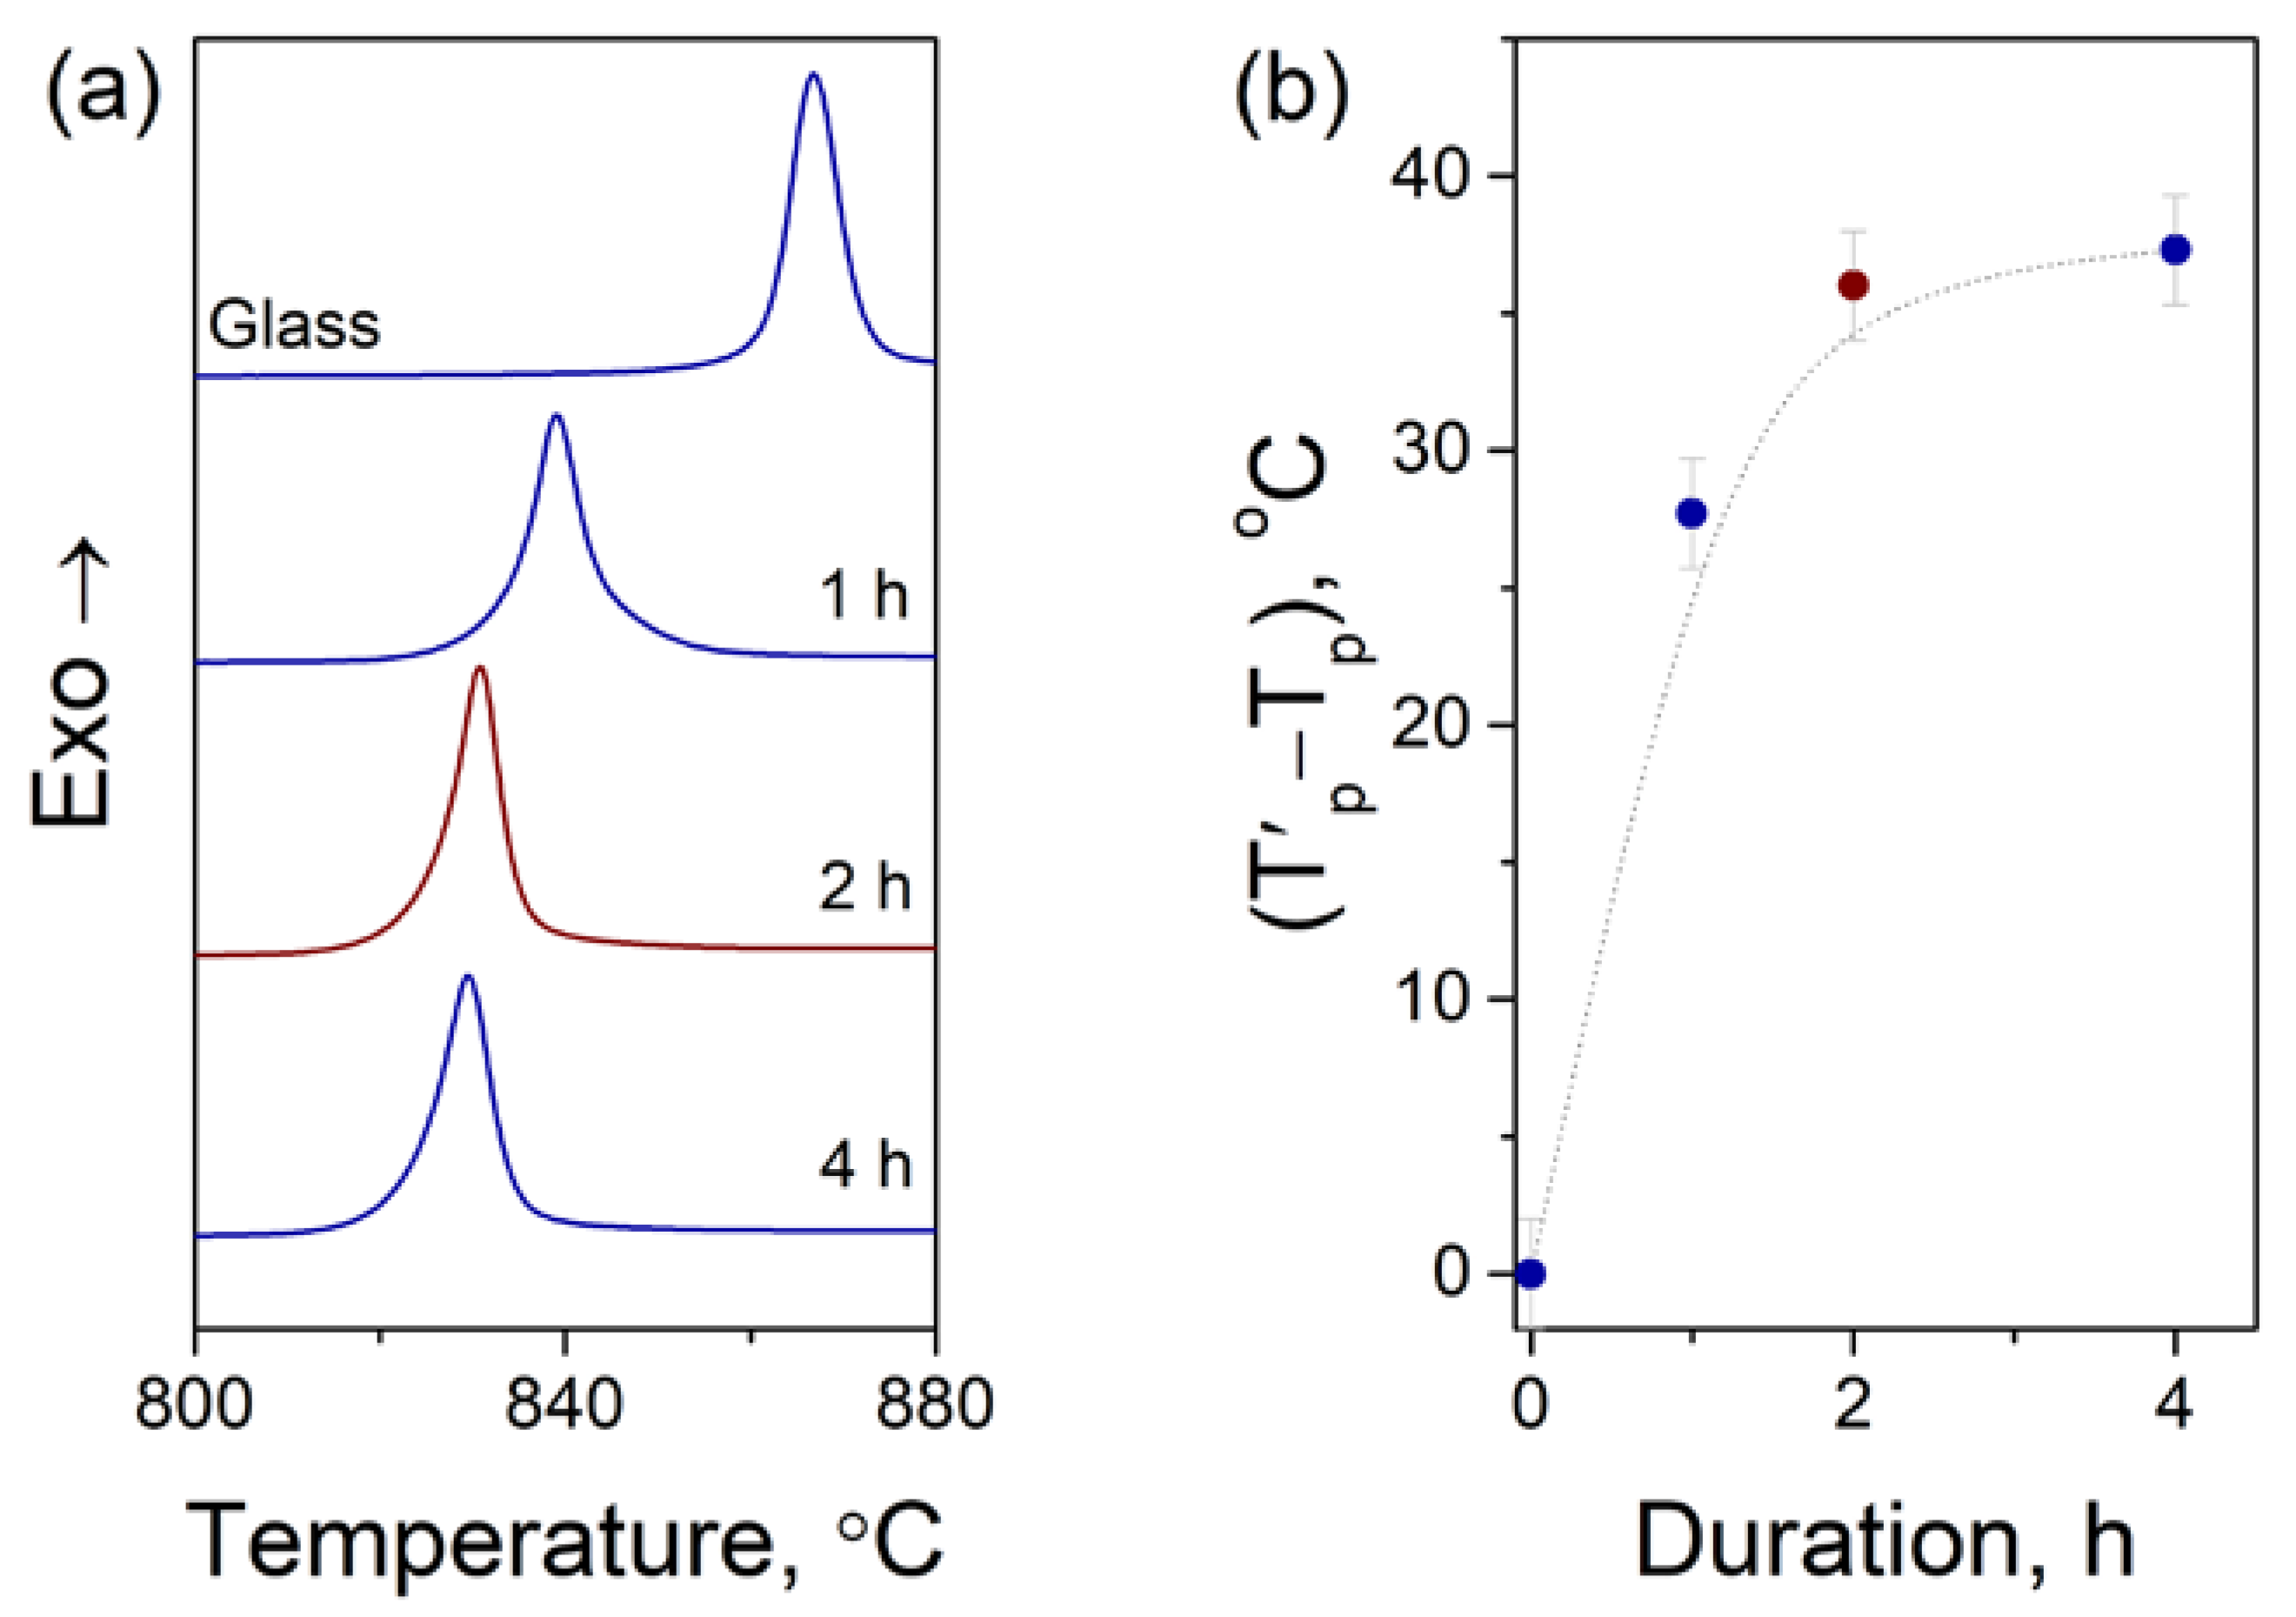
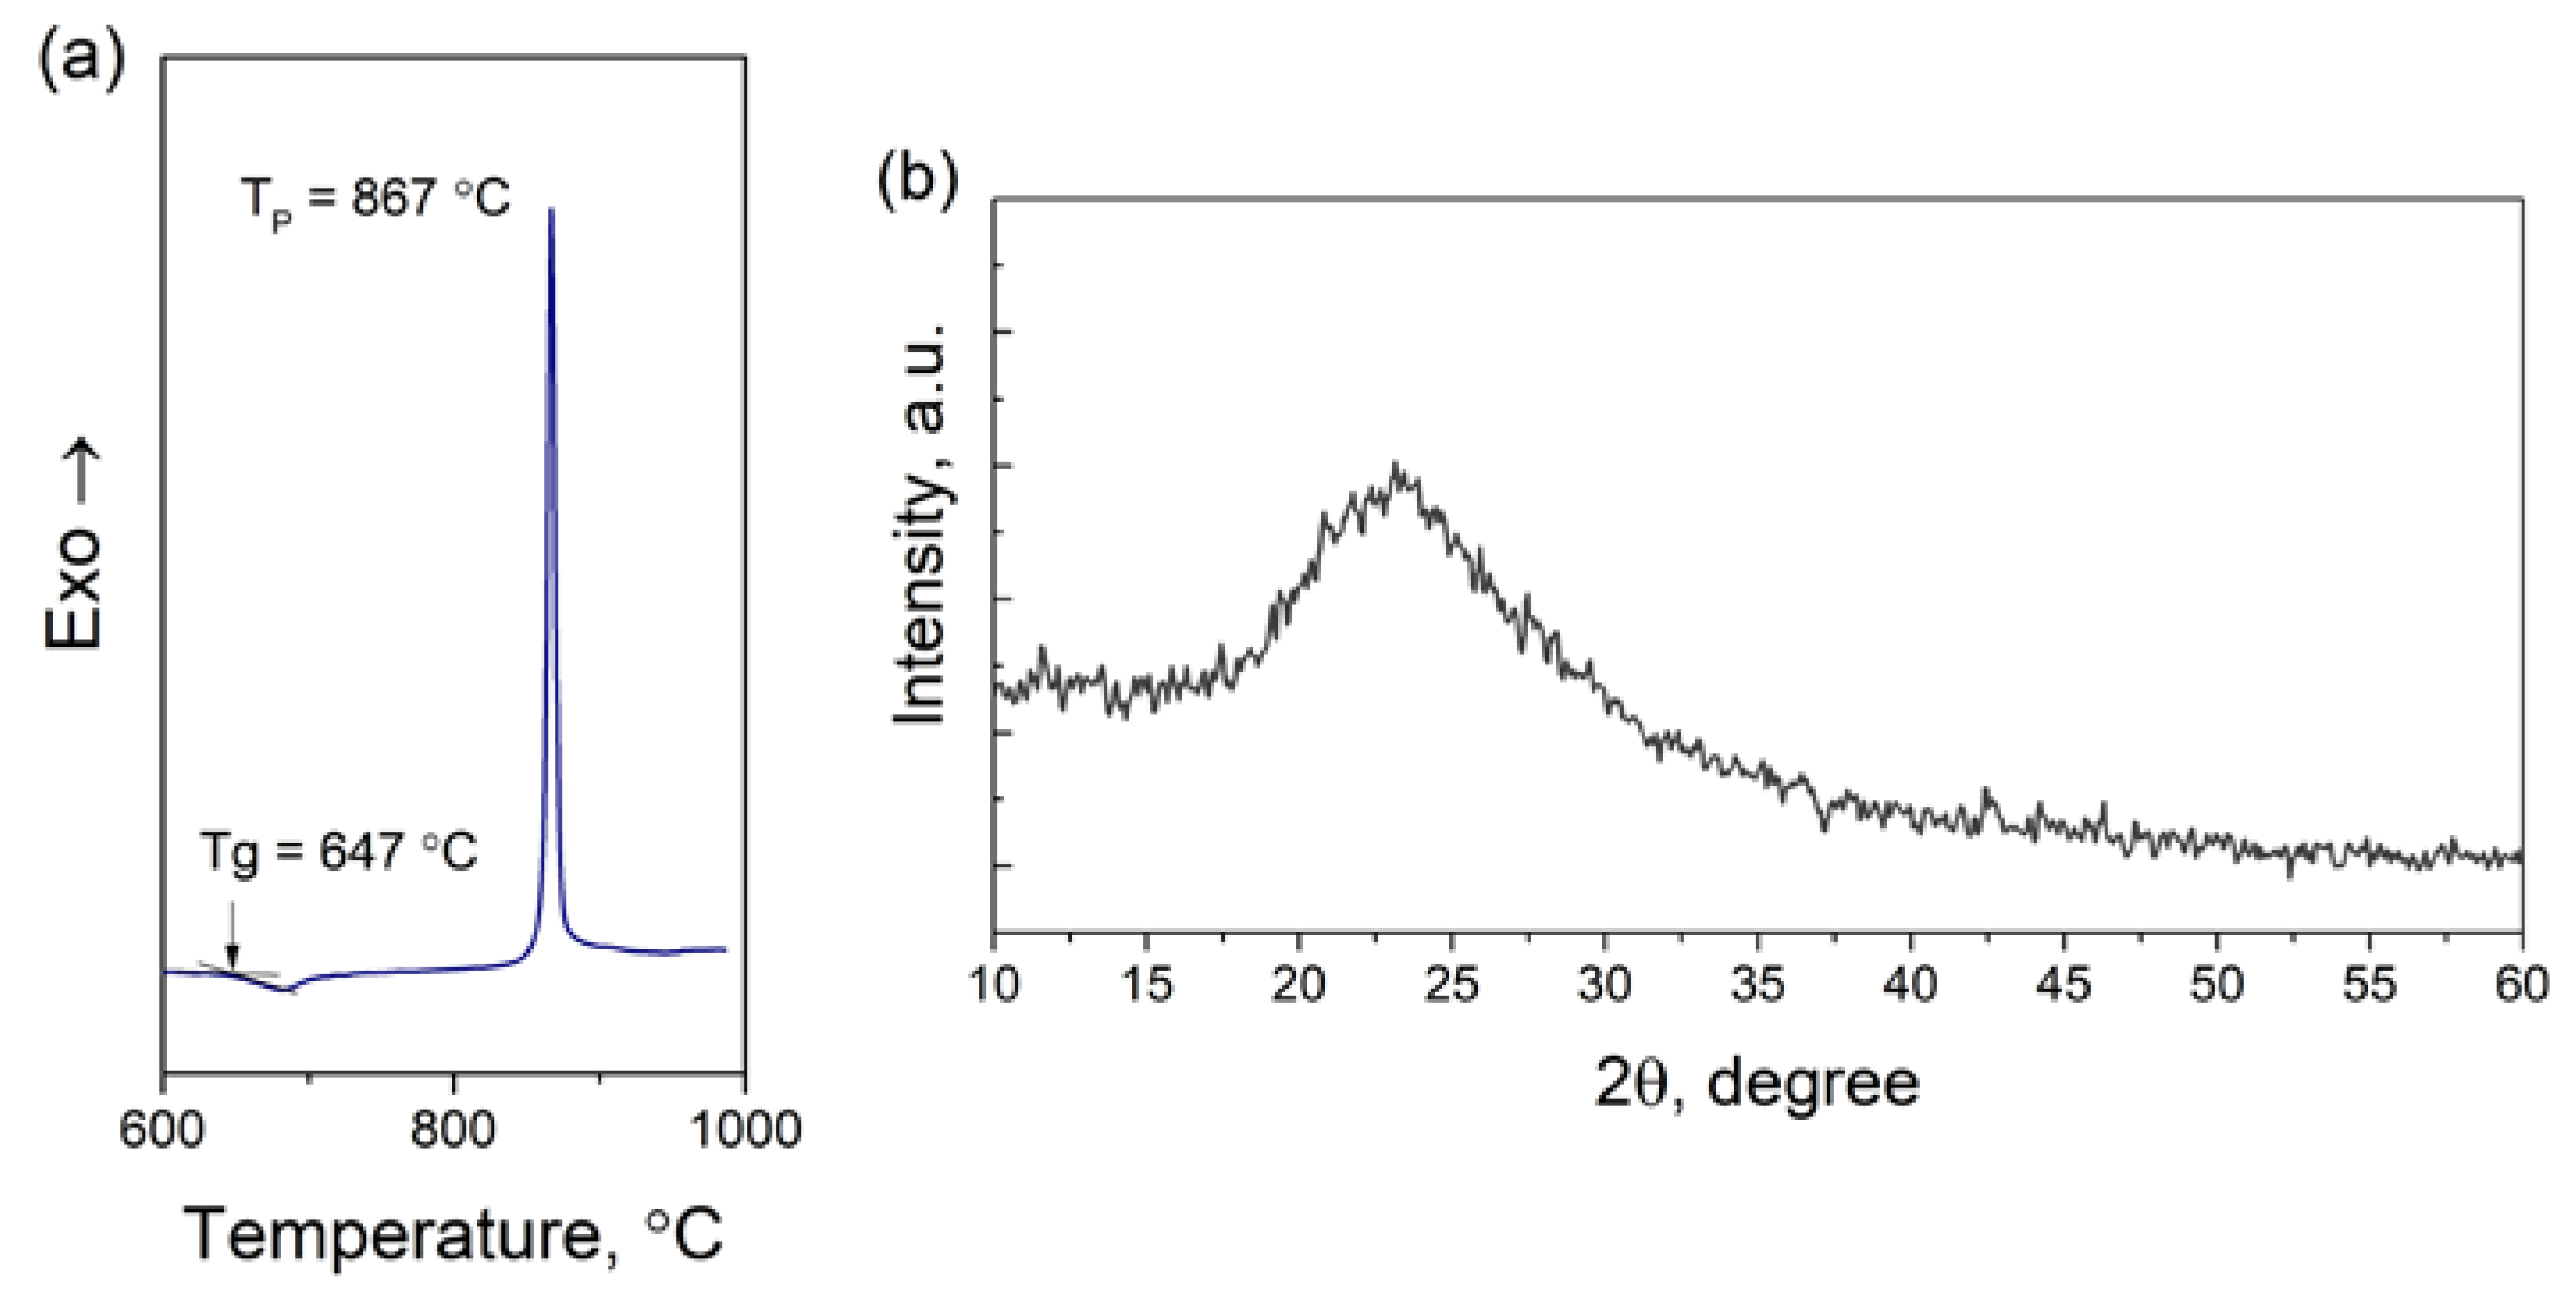
3.1. Determination of the Nucleation Temperature

The technique chosen for the evaluation of the nucleation temperature during the production of glass-ceramics was proposed by A. Marotta et al. [42]. This technique involves determining the heat treatment conditions that result in the downward shift of the exothermic peak on the DSC curve, which indicates the facilitation of the crystallization process through the formation of nuclei during the glass pretreatment stage. The most effective nucleation temperature, according to this technique, is determined by monitoring the peak on the curve of the (T’P − TP) parameter versus the glass heat treatment temperature. The (T’P − TP) parameter represents the difference between the maximum exothermic temperature values for the initial glass (T’P) and the glass subjected to nucleation pretreatment (TP).
The DSC curves of the glasses pre-treated near the Tg for a fixed holding time of 2 h are presented in Figure 2a. The evident extremum of (T’P − TP) is observed due to the non-linear shift of the position of the exothermic peak under the increase in the heat treatment temperature. The temperature corresponding to this extremum was selected as the nucleation temperature for the fabricated LAS glass.
To optimize the holding time at the nucleation temperature, a comparable method was used, which includes assessing the maximum displacement of the (T’P − TP) parameter in relationship to the holding time [42]. The DSC curves of the glasses after treatments at 670 °C for various holding times are presented in Figure 3a. Our analysis of the (T’P − TP) dependence reveals that a plateau is reached after a holding time of 2 h. This suggests that the formation of new crystallization nuclei reaches its maximum and does not continue to increase with longer holding times. A similar phenomenon has been observed in studies on the formation and evolution of nanoinhomogeneities in lithium and magnesium aluminosilicate glasses using small-angle neutron scattering [18,43]. Consequently, a holding time of 2 h is believed to be sufficient for the nucleation of synthesized glass, ensuring the formation of the largest possible number of crystal nuclei. The data on the crystallization peak temperatures are summarized in Table S2.
Hence, the nucleation process for obtaining transparent glass-ceramics in our study involves the pre-treatment of the glass at 670 °C for 2 h. A comparison of the XRD patterns and Raman spectra of the initial glass with those of the glasses after the nucleation pre-treatment indicates no visible changes (Figure S3). However, previous studies on LAS glasses with similar compositions revealed that during nucleation, ZrTiO4 nanocrystals with sizes around a few nm form in glass [44,45]. These nanocrystals serve as a platform for the epitaxial growth of crystal phases based on quartz and lithium aluminosilicates [46,47]. The small size and limited number of crystal nuclei make it challenging to detect them using common techniques such XRD and Raman spectroscopy. Nevertheless, modern TEM methods can provide detailed insights into the mechanism of the formation of such crystal nuclei. It was established that the nucleation mechanism involves liquid–liquid phase separation, resulting in the formation of TiO2- and ZrO2-enriched zones, followed by the formation of ZrTiO4 nanocrystals with a core-shell structure [46,47,48]. The shell consists of an amorphous phase enriched in Al2O3, which further inhibits the growth of ZrTiO4. The optimized temperature–time regime of nucleation allows us to move forward in studying the possibilities of the variation in the structure and properties of glass-ceramics by the control of crystallization conditions during the second stage of heat treatment.

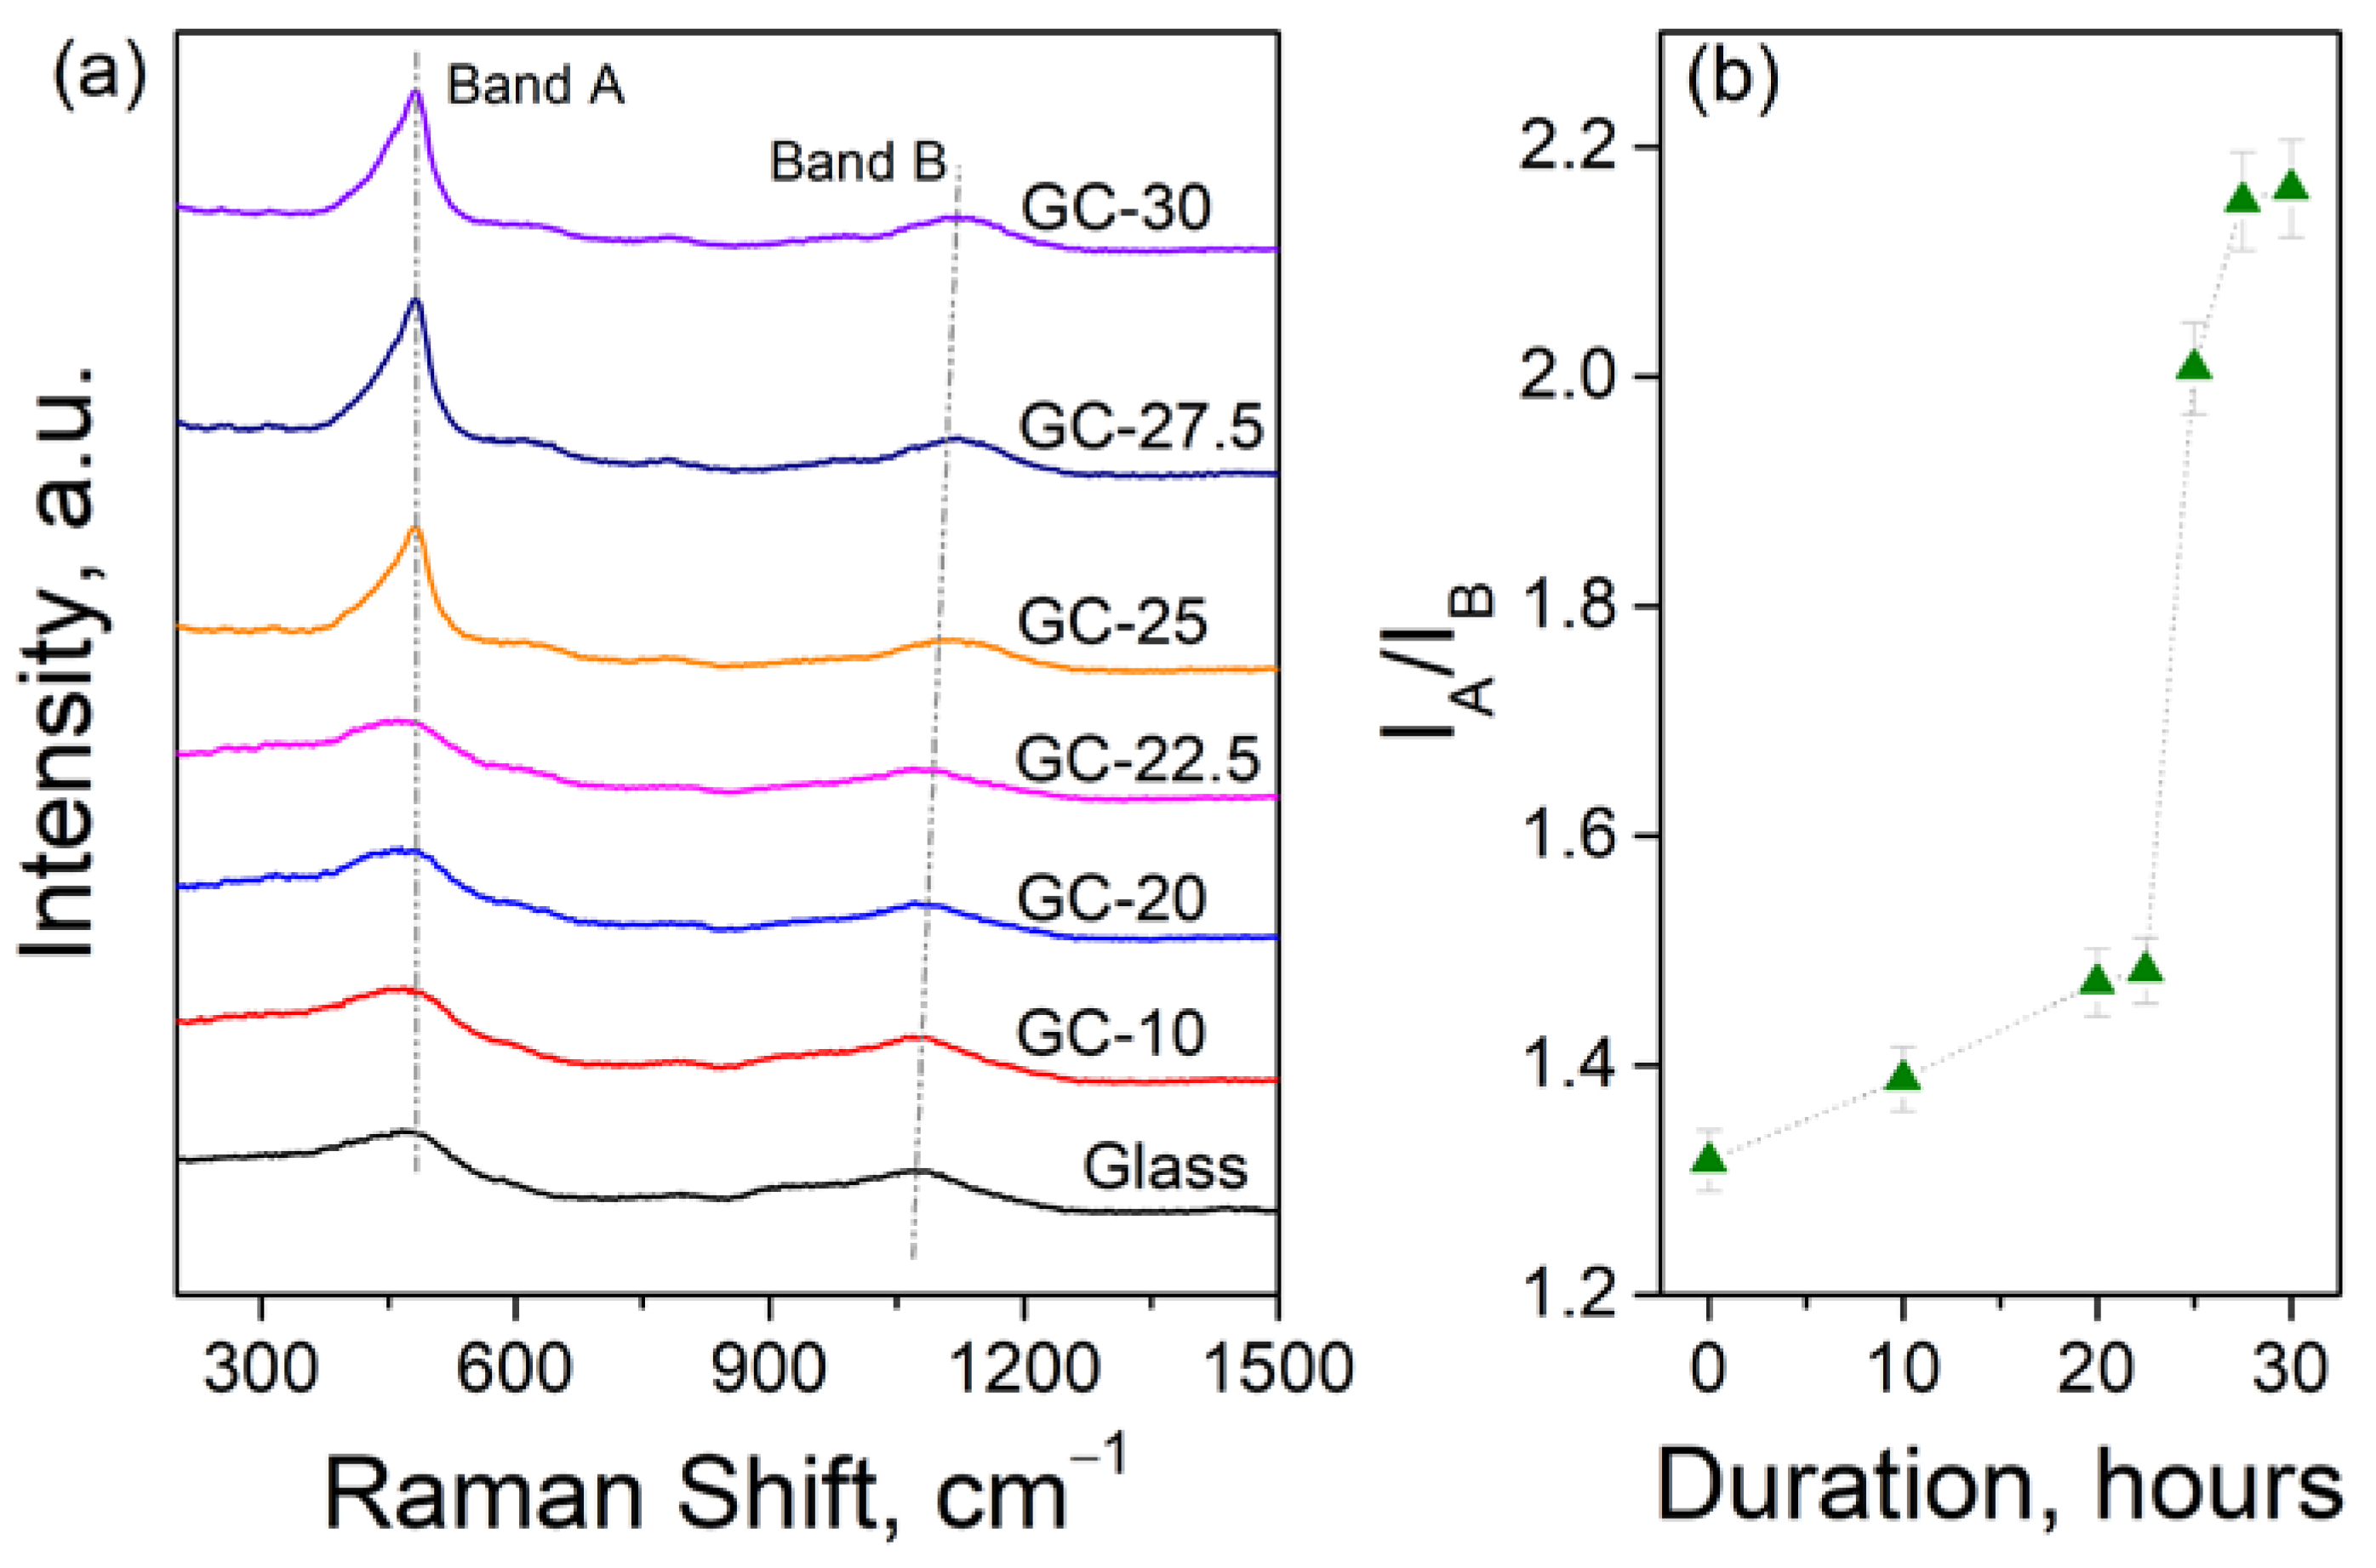
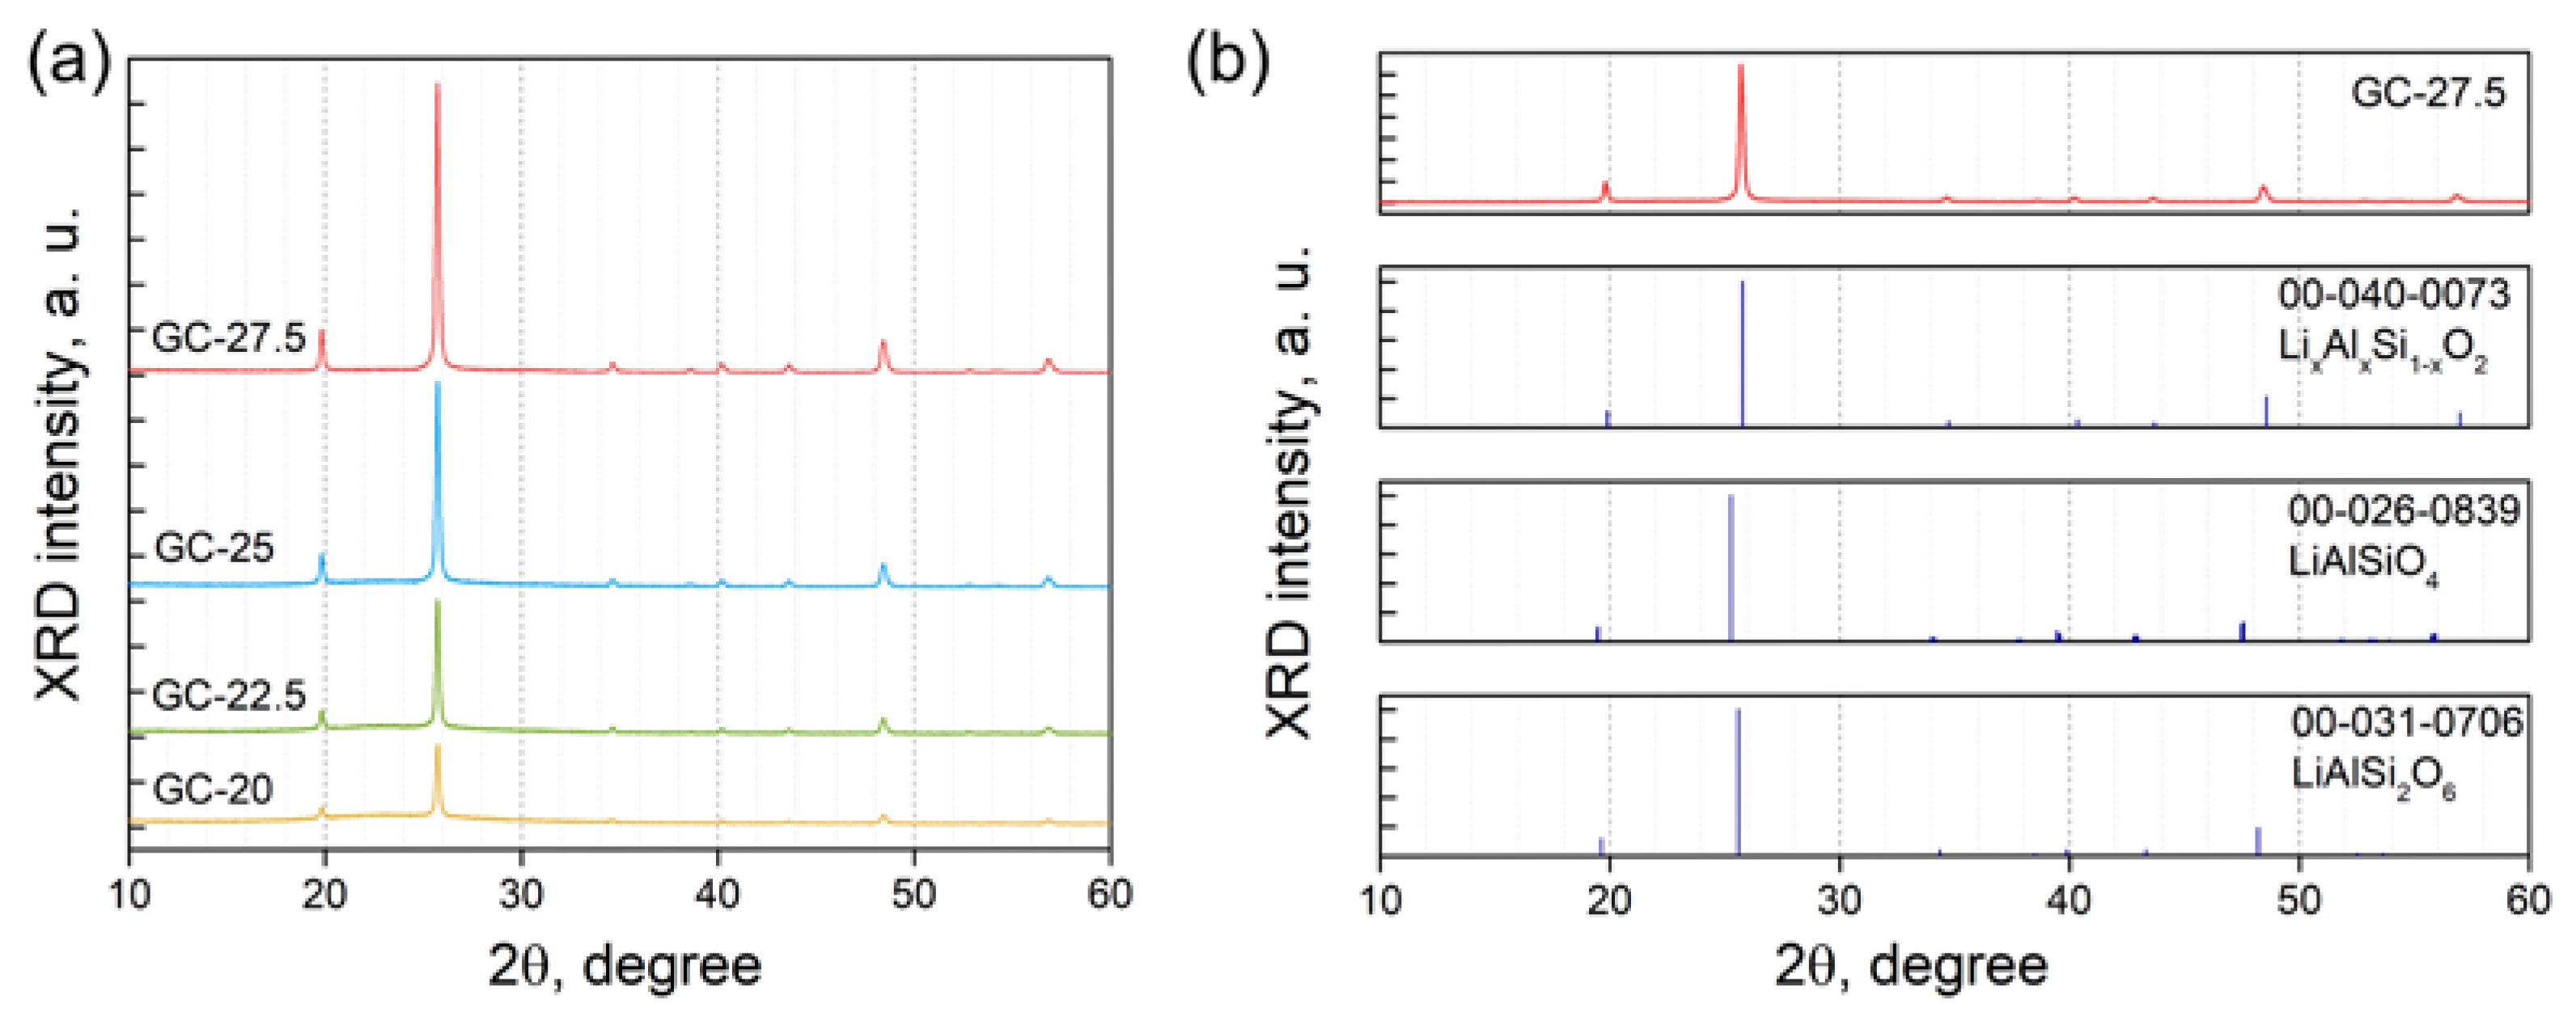
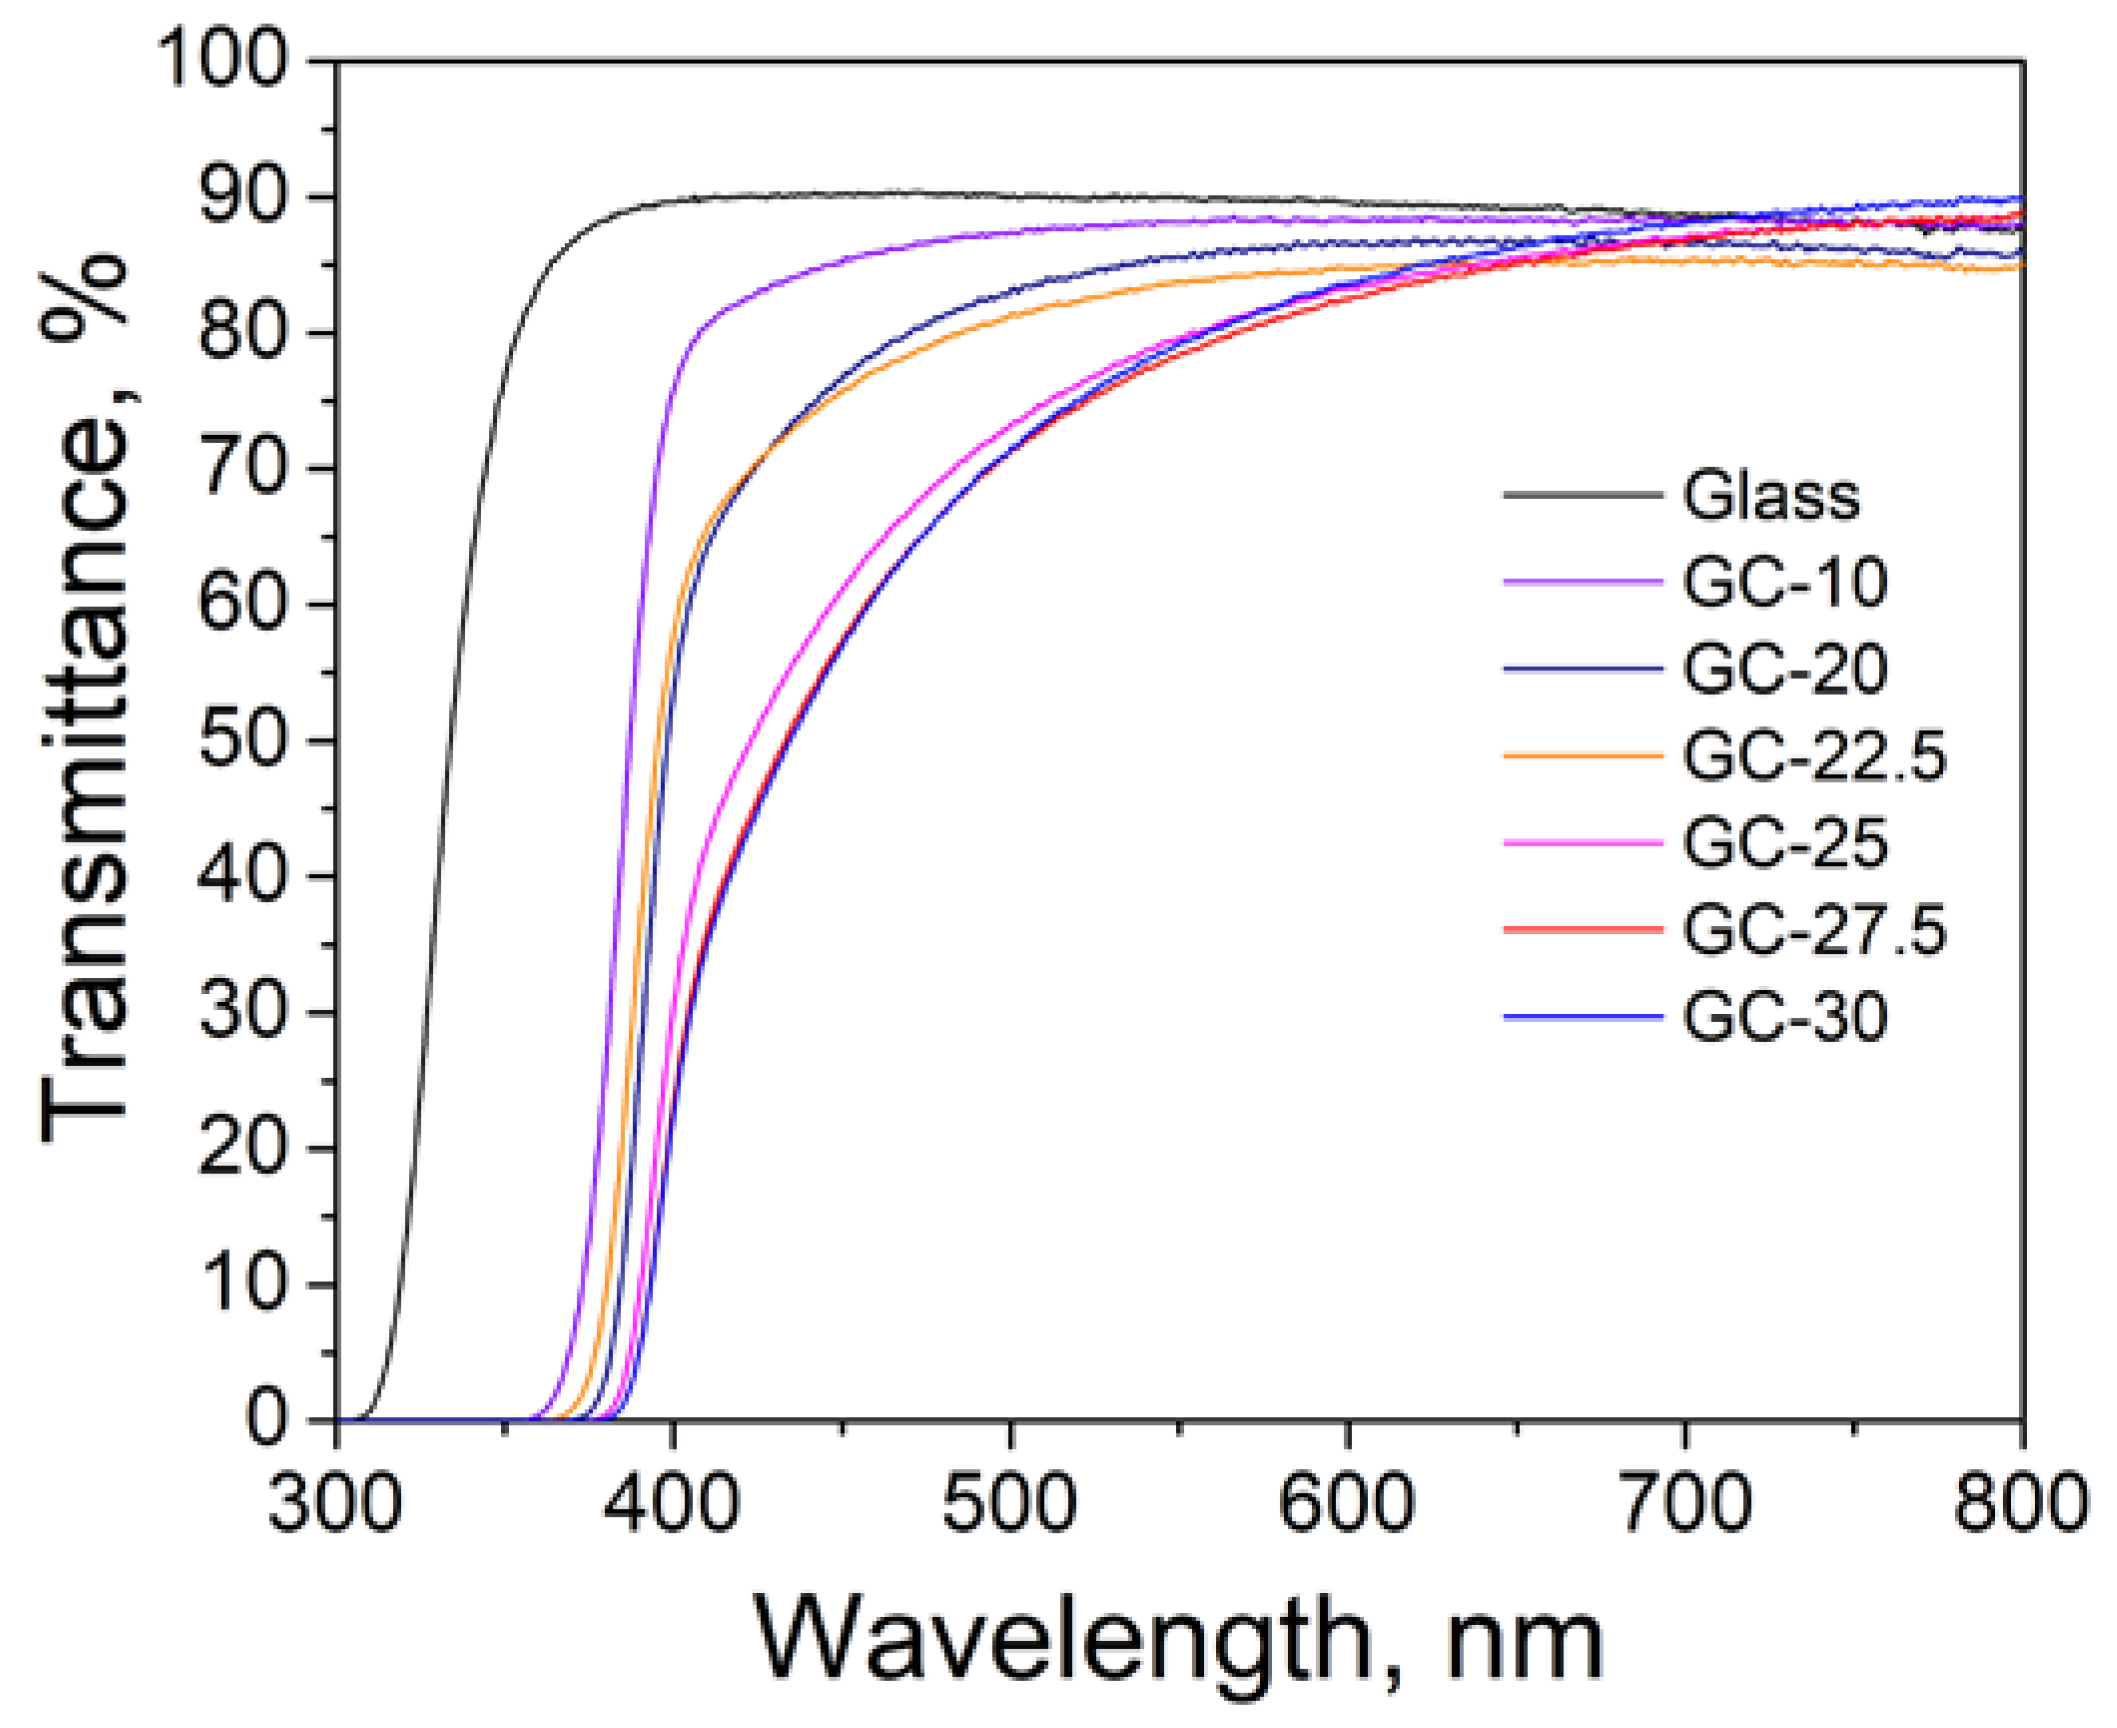
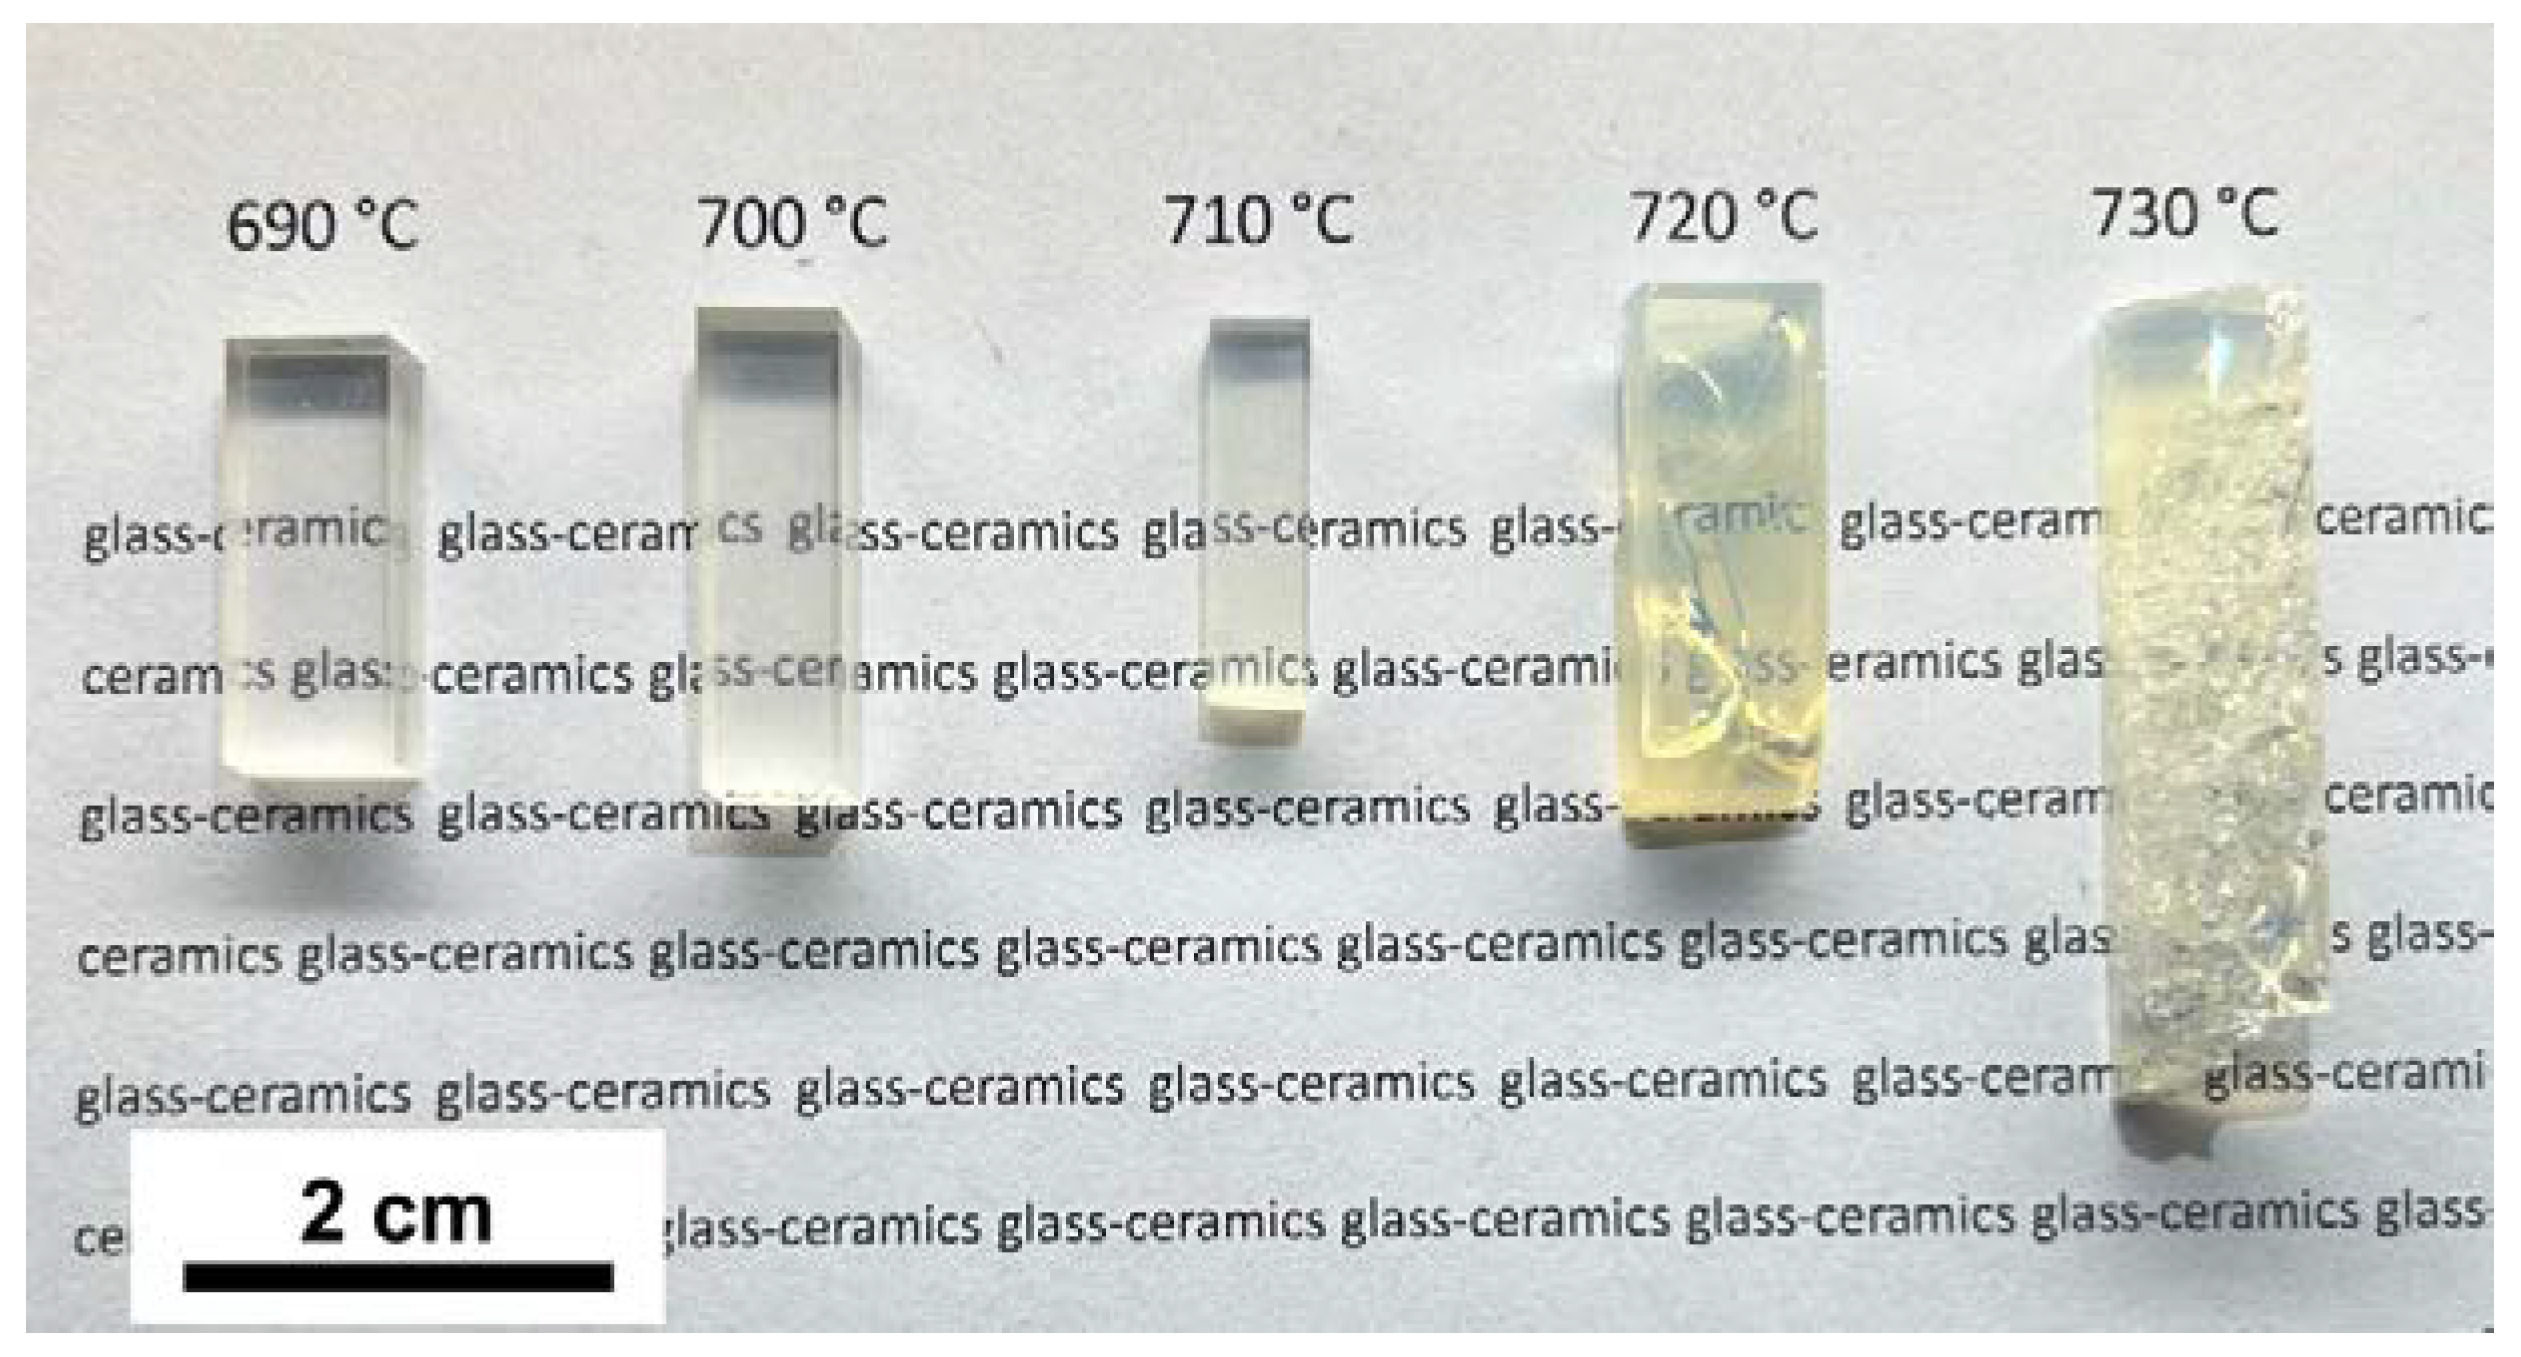
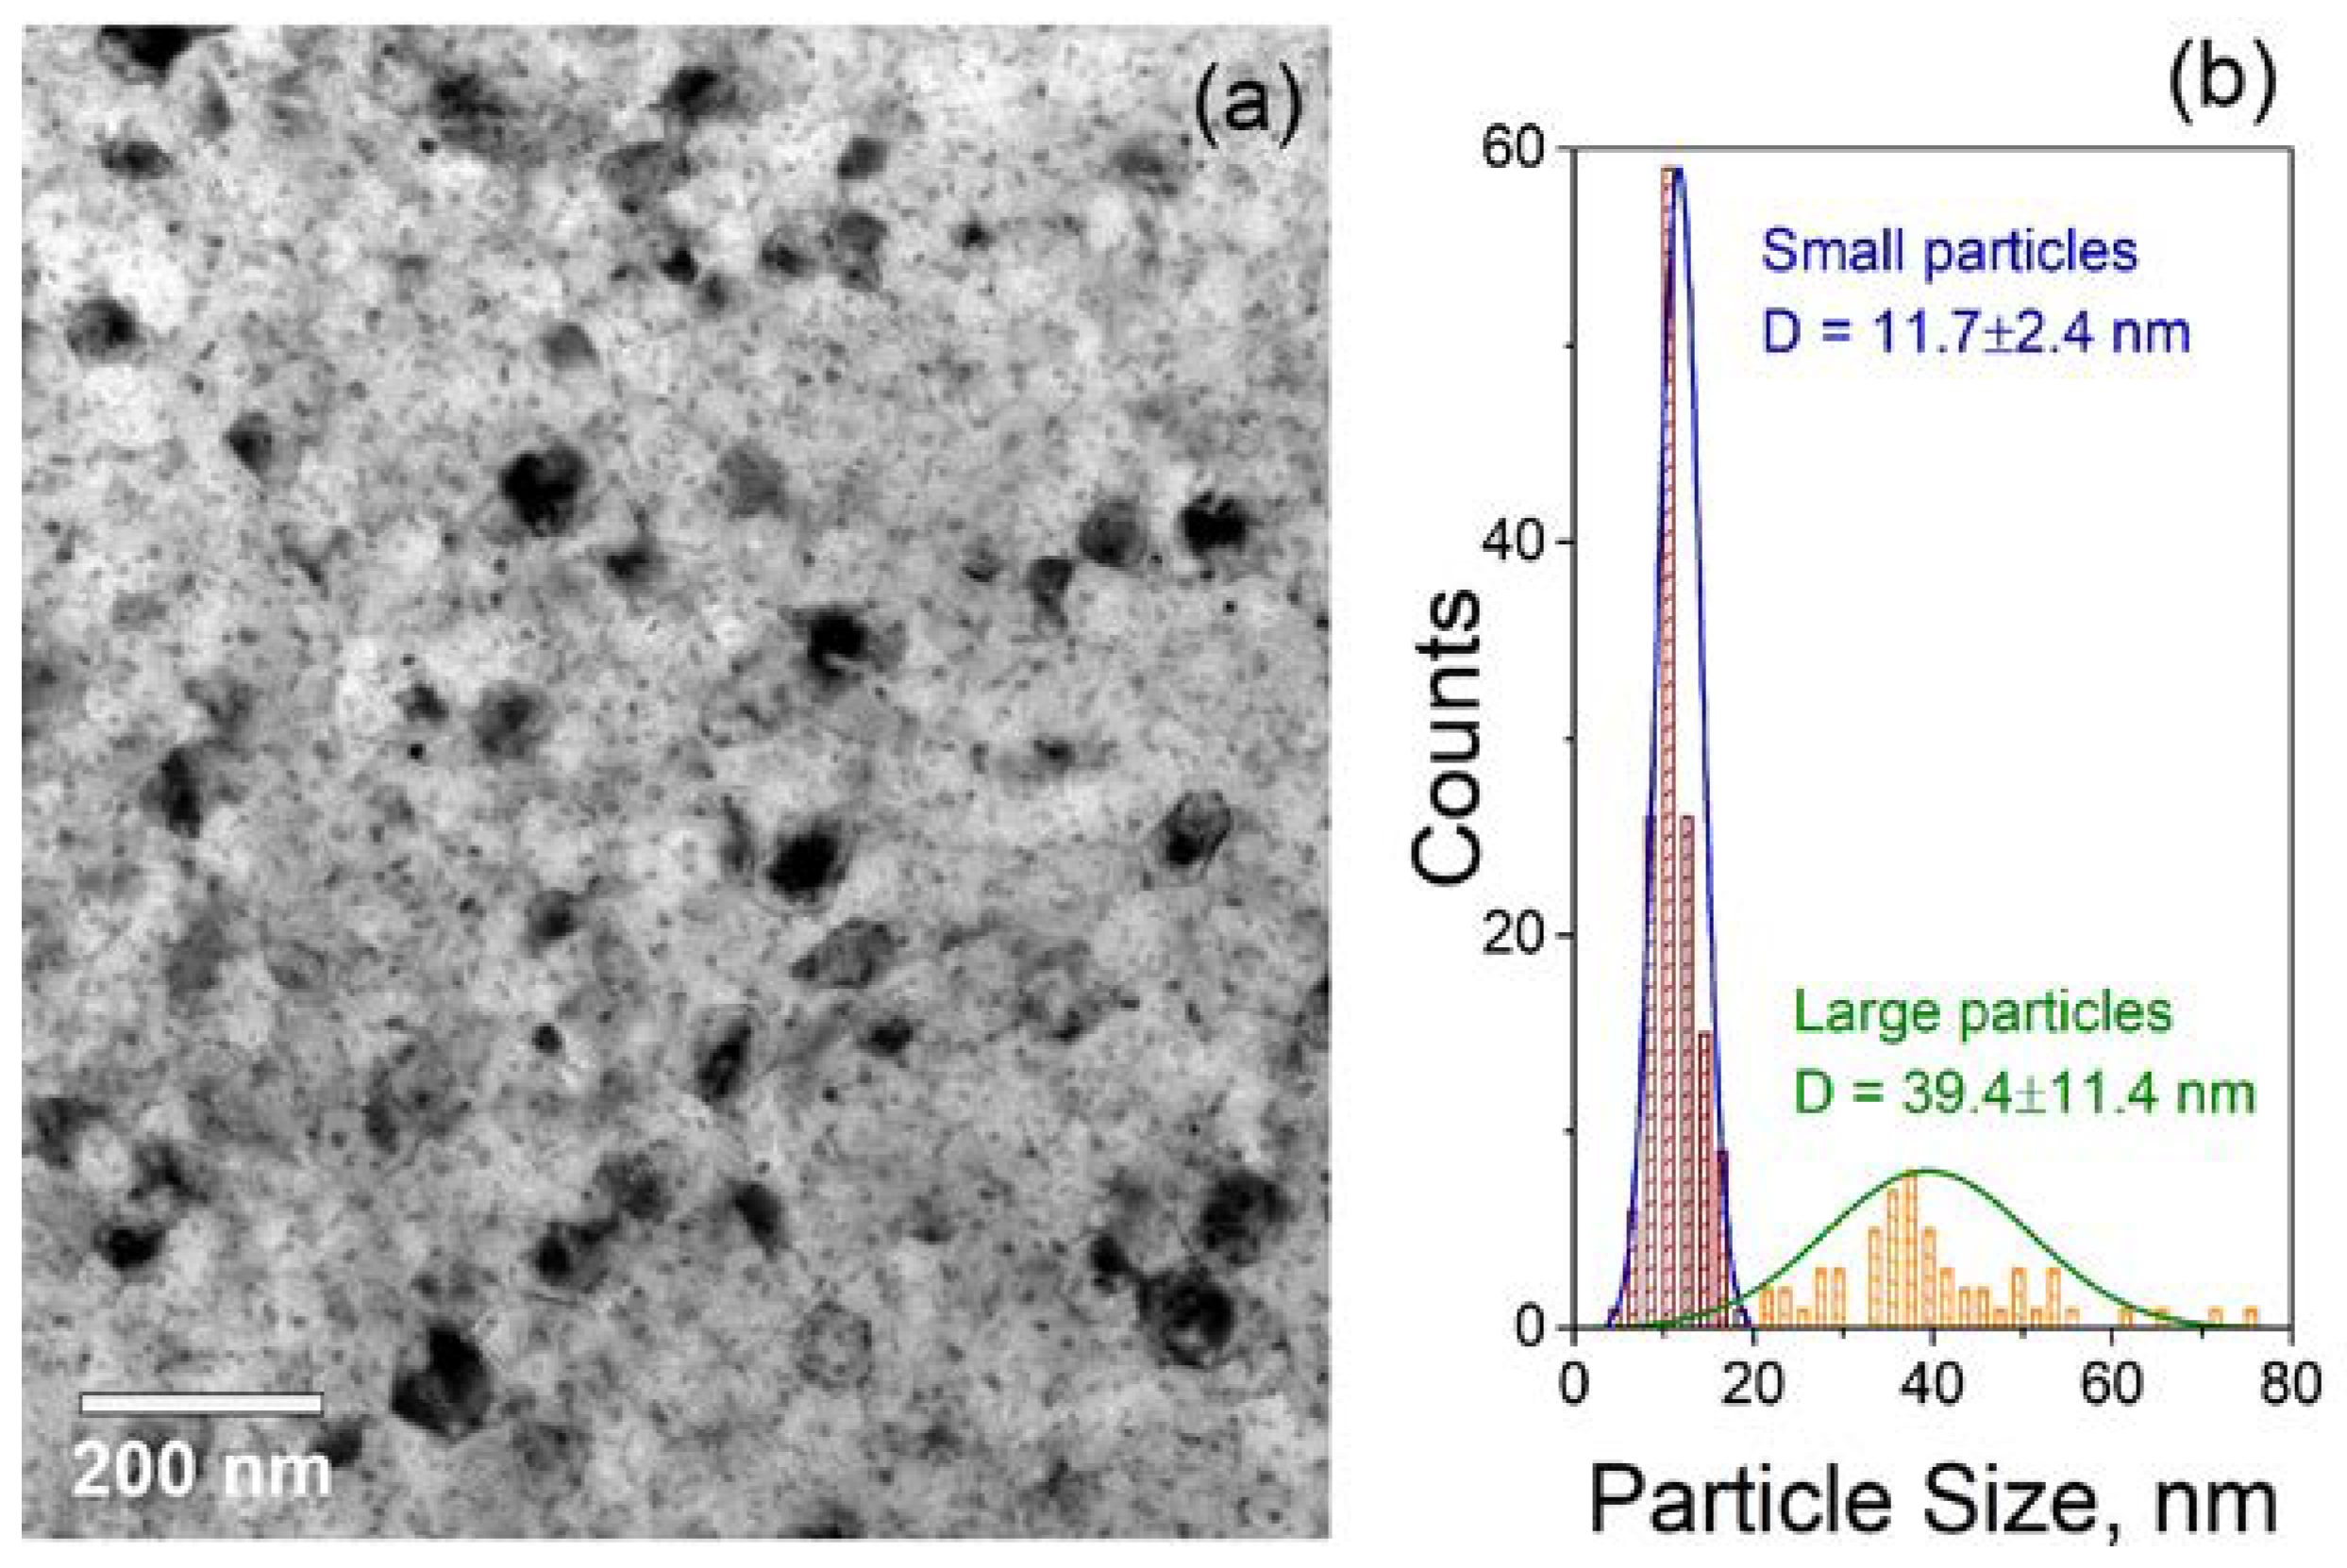
3.2. Effect of Crystallization Conditions on the Microstructure and Properties of Glass-Ceramics

A polythermal analysis in the gradient furnace was performed for glass samples to obtain a preliminary view of the crystallization behavior. The main aim of this analysis was to identify the temperature range at which the glass-ceramics maintain their transparency after crystal growth [35]. The hot end temperature of the gradient furnace was varied between 800 and 1000 °C, while the holding times used were 1 or 6 h. It was observed that at temperatures above 900 °C, intense crystallization took place, resulting in the complete opacity of the glass-ceramics. However, when the hot end temperature was reduced to 800 °C, three distinct zones (transparent, opalescent, and completely opaque) can be seen in the samples. No visible changes were observed up to 710 °C, but higher temperatures led first to the appearance of strong opalescence and then to a loss of transparency in the material. It is important to note that the described polythermal analysis was performed on the initial glass samples without a nucleation pre-treatment, resulting in the uncontrolled growth of the crystalline phase. This caused a loss of transparency and the cracking of the glass-ceramic samples at temperatures above 720 °C, which is more than 100 °C lower than the temperature of the exopeak maximum for glass (TP = 867 °C). Thus, it is impractical to use only the temperature of the crystallization peak for the production of transparent glass-ceramics since the excessively high growth rate of crystals makes it difficult to control the nanocrystals’ size [26].
A series of heat treatments in the temperature range of 690–730 °C for a duration of 20 h were carried out on the pre-nucleated glass samples. The results obtained from the polythermal analysis indicated the presence of both transparent and opalescent glass-ceramics in this temperature range (Figure 4). A visual examination of the samples revealed their cracking at temperatures exceeding 720 °C. The cracking occurs due to microstresses arising from the difference in CTEs between the precipitated crystalline phase and residual glass phase (−6.2 ppm/K and 6.0 ppm/K, respectively) when their magnitude exceeds the material strength [49,50]. Therefore, a temperature of 710 °C was selected as the optimal temperature for crystal growth during the second stage of crystallization, resulting in the production of transparent glass-ceramics with no visible defects.
The duration of the crystal growth stage has a direct impact on the final structure and therefore the properties of the synthesized glass-ceramics. Thus, the next series of two-stage heat treatments included a holding time of the second stage up to 30 h. Further, the samples of the glass-ceramics are designated as GC-X, where X is the duration of the second stage of crystallization at 710 °C. Figure 5a presents the Raman spectra of the initial glass and glass-ceramic samples after the performed heat treatments. The spectra exhibit two distinct bands: band A in the range of 470–480 cm−1 and band B in the range of 1070–1120 cm−1. Variations in the holding time of the second stage of the heat treatment result in shifts in the position of the maxima of both bands. Notably, band A demonstrates a significant increase in intensity, whereas the increase in band B is less pronounced. Band A registered for the initial glass reaches its maximum at 472 cm−1, indicating transverse vibration modes [51] associated with the Si–O–Si bond of the bridging oxygen during the bonding of [SiO4] tetrahedrons. Additionally, band B in the original glass is observed at 1073 cm−1, representing the antisymmetric stretching vibration of the Si–O bond within the Qn structures, where n denotes the number of bridging oxygens [52]. As the exposure time exceeds 22.5 h, band A becomes narrower and its maximum shifts to the region of 480 cm−1. This shift may be attributed to a decrease in the Si–O–Si bond angles caused by the crystallization of the silicate phase.
The shift of the maximum of band B to the region of 1120 cm−1, which is also observed with the increasing holding time of the heat treatment, may be attributed to the enhanced binding of the residual silicate glass phase. This can be explained by the fact that a significant portion of the Li2O glass modifier enters the crystalline phase, resulting in a reduction in non-bridging oxygen in the glass network. Previous studies have associated the bands in the mentioned regions in the Raman spectra of crystalline phases in the LAS system with SiO2-β-quartz, LiAlSi2O6, and LiAlSiO4-β-eucryptite phases. However, due to the overlapping of the bands and their broadening in glasses, it is challenging to provide an accurate interpretation of the phases. Nevertheless, the obtained data tentatively indicate that the observed change in the Raman spectra is related to the crystallization of β-quartz solid solutions, which is typical for LAS glasses.
To describe the scenario of the temporal evolution of crystalline phases in the samples during the second stage of the heat treatment, we examined the variations in the IA/IB intensity ratios, as depicted in Figure 5b. It is evident that at the duration of up to 22.5 h, the IA/IB ratio gradually increases. However, at 25 h, the stepped, nearly twofold increase in IA/IB was found with further plateaus at 27.5 and 30 h. This distinctive pattern indirectly signifies a possible significant change in the thermomechanical characteristics of the glass-ceramics.
The XRD patterns of the glass-ceramic samples, obtained after the nucleation and subsequent crystallization at a temperature of 710 °C with varying holding times, are presented in Figure 6a. It is noteworthy that all the XRD patterns exhibit distinct reflexes, whose position remains virtually unchanged as the holding time of the heat treatment increases. The longer the holding time, the higher the intensity of the reflexes. The primary XRD peak, located at an angle of 2θ = 25.7°, could potentially correspond to multiple crystalline phases, as displayed in Figure 6b. It is plausible that the predominant crystalline phase formed in this glass under the applied heat treatment conditions is a β-quartz solid Li2O·Al2O3·nSiO2-type solution. The diffraction peaks of this solid solution are shifted by approximately 0.5–1° towards larger angles compared to the reflections of β-eucryptite (PDF card #00-026-0839), with the magnitude of deviation being proportional to the angle. This shift can be attributed to the non-stoichiometric SiO2 content in the solid solution and due to the complex multicomponent composition of the initial glass.
Increasing the duration of the holding time at a temperature of 710 °C up to 27.5 h results in a substantial increase in the content of the crystalline phase and a decrease in the fraction of the amorphous phase, which cannot be evidently observed in the XRD patterns. The evaluation of the crystalline phase content and crystallite size is presented in Table 2. The crystallite size remains relatively constant at 33–35 nm regardless of the holding time. However, the degree of crystallization of the samples increases from approximately 14% to 49% after 20 h and 27.5 h of the second stage of the thermal treatment, respectively. It is worth noting that β-eucryptite exhibits a negative CTE coefficient (α), with the average values of α = −6.2 ppm/K in the c-axis direction within the temperature range of 20–1000 °C. Therefore, significant changes in the thermomechanical properties can be expected for the samples subjected to heat treatment at 710 °C within the specified time range. These findings are consistent with the results obtained from the Raman spectroscopy, in which an increase in the holding time leads to a notable enhancement in the intensities of the bands associated with the formation of the crystalline phase (Figure 5).
TEM microscopy was used to investigate the microstructure of the glass-ceramics obtained after the two-stage thermal treatment of glass. The TEM image shown in Figure 7a depicts the microstructure of the GC-27.5 sample, which is typical for LAS glass-ceramics. A comprehensive analysis of the TEM images reveals that the microstructure of the sample consists of crystallites of varying sizes, referred to as small and large particles, which converge with the data regarding the microstructures of other LAS glasses [9,44].
The size of the small particles was determined from a few TEM images and found to be approximately 12 ± 2 nm, while the size of the large particles was calculated to be around 40 ± 11 nm (Figure 7b). The small particles are most likely the nucleation centers for the growth of LAS-phase crystals in the form of large particles. These small particles can be described as nanocrystals of ZrTiO4 and a mixed form of Zr1−xTi1+xO4, a finding that has been confirmed by numerous researchers [44,45,46,47]. It is worth noting that the electron beam used during TEM imaging did have an impact on the glass-ceramic sample. However, the size measurements obtained from the TEM images for the LAS crystals (40 ± 11 nm) coincide well with the estimation (33–35 nm) using the XRD analysis.
Dilatometric curves were recorded over a wide temperature range (−120 to 500 °C) to investigate the effect of the heat treatment duration during the second stage of crystallization on the thermomechanical properties of glass-ceramics. Figure 8 displays the relative elongation curves and the corresponding CTE values as a function of temperature. By varying the holding times at 710 °C, it was possible to smoothly adjust the positions of the relative elongation curves for the samples. The CTE values at 100 °C for the GC-20 and GC-22.5 samples exhibited only minor differences and are equal to 4.0 and 3.5 ppm/K, respectively. The most significant changes in the thermomechanical properties of the heat-treated specimens were observed within a range of holding times between 25 and 27.5 h, as indicated by a transition in the CTE value from positive (0.5 ppm/K) for the GC-25 sample to negative (−0.5 ppm/K) for the GC-27.5 sample. Increasing the holding time up to 30 h resulted in negligible changes in the CTE, with the elongation curve closely resembling the one of the GC-27.5 sample.
It can be hypothesized that at a temperature of 710 °C and a holding time of 27.5 h, the primary crystallization processes have already finalized, and prolonging the heat treatment duration does not substantially affect the structure and properties of the LAS glass-ceramics. Thus, by manipulating the duration of the holding time during the temperature treatment of the investigated samples within the confined range of 25 to 27.5 h, it becomes feasible to fine-tune the CTE curve and, moreover, to alter its sign while preserving the stability of the CTE values in close proximity to zero.
The observed variations in the ∆L/L0 curves as the holding time increases are consistent with the changes observed in the Raman spectra, where an increase in band intensity is registered (Figure 5), as well as with the XRD results showing an increase in the intensity of major peaks (Figure 6). The comparative values of the CTE for different temperature ranges are presented in Table 2. It is demonstrated that an increase in the degree of crystallization leads to a decrease in CTE for all cases. These findings pave the way to finely adjust the CTE values of LAS glass-ceramics by manipulating the holding time during the second stage of the heat treatment.
The optical transmission spectra of the obtained glass-ceramic samples with a thickness of 2 mm are shown in Figure 9. Importantly, all of the samples possess optical transparency, with transmittance (T) values ranging from 70% to 85% in the visible region.

4. Conclusions

This study presents a comprehensive investigation into the influence of heat treatment on the structural characteristics of LAS glass-ceramics, which enables the fine-tuning of their thermal expansion coefficient. The temperature–time regime for efficient glass nucleation was determined, and a two-stage heat treatment route was developed to produce transparent glass-ceramics with a relatively high crystalline-phase content. The optimal crystal growth temperature is found to be 710 °C, as this temperature effectively prevents sample cracking caused by internal mechanical stresses during the formation of the crystalline phase. Furthermore, it is demonstrated that the variation in the duration of the heat treatment in the second stage in the range of 20–30 h allows us to precisely control the crystallization of a β-eucryptite-like solid solution as well as the CTE of the glass-ceramics in the range from 0.5 ppm/K to −0.5 ppm/K. The size of crystallites remains relatively unchanged at approximately 33–35 nm, while the degree of crystallization reaches 49%. The results of the study are of interest for researchers for the advancement of integrated optical devices based on temperature-insensitive materials.

Supplementary Materials

The following supporting information can be downloaded at: https://www.mdpi.com/article/10.3390/ceramics7010001/s1, Figure S1: Photo of the synthesized LAS glass block; Figure S2: XRD patterns of one of the glass-ceramic samples and an empty silicon-made low-background specimen holder used to estimate the instrumental background profile; Figure S3: (a) Raman spectra and (b) XRD patterns of initial glass and glass obtained after the nucleation at 670 °C for 2 h; Table S1: Detailed ICP-OES instrumental settings; Table S2: Crystallization peak temperatures determined from the DSC curves (Figure 2 and Figure 3) and calculated T’P − TP parameter.

Author Contributions

Conceptualization, A.S.N. and G.Y.S.; methodology, A.S.N. and V.I.S.; investigation, N.V.G., R.O.A., V.I.S., S.S.F. and E.S.I.; writing—original draft preparation, A.S.N. and G.Y.S.; writing—review and editing, A.S.L., N.V.G. and V.N.S.; supervision, V.N.S.; funding acquisition, V.N.S. All authors have read and agreed to the published version of the manuscript.

Funding

This research was funded by the Russian Science Foundation under grant no. 19-19-00613-П.

Institutional Review Board Statement

Not applicable.

Informed Consent Statement

Not applicable.

Data Availability Statement

The data presented in this study are available on request from the corresponding author. The data are not publicly available due to privacy.

Acknowledgments

The authors are grateful to the Center for Collective Use of the Mendeleev University of Chemical Technology for its help with the chemical analysis of the glass.

Conflicts of Interest

The authors declare no conflict of interest.

References

  1. Venkateswaran, C.; Sreemoolanadhan, H.; Vaish, R. Lithium aluminosilicate (LAS) glass-ceramics: A review of recent progress. Int. Mater. Rev. 2022, 67, 620–657. [Google Scholar] [CrossRef]
  2. Dymshits, O.; Shepilov, M.; Zhilin, A. Transparent glass-ceramics for optical applications. MRS Bull. 2017, 42, 200–205. [Google Scholar] [CrossRef]
  3. Döhring, T.; Jedamzik, R.; Thomas, A.; Hartmann, P. Forty years of ZERODUR mirror substrates for astronomy: Review and outlook. In Proceedings of the SPIE 7018, Advanced Optical and Mechanical Technologies in Telescopes and Instrumentation, Marseille, France, 23–28 June 2008; Volume 7018, pp. 1154–1165. [Google Scholar] [CrossRef]
  4. Semenov, A.P.; Abdulkadyrov, M.A.; Ignatov, A.N.; Patrikeev, V.E.; Pridnya, V.V.; Polyanchikov, A.V.; Sharov, Y.A. Fabrication of blanks, figuring, polishing and testing of segmented astronomic mirrors for SALT and LAMOST projects. In Proceedings of the SPIE 5494, Optical Fabrication, Metrology, and Material Advancements for Telescopes, Glasgow, UK, 21–25 June 2004; Volume 10315, pp. 34–37. [Google Scholar] [CrossRef]
  5. Flügge, J.; Köning, R.; Schötka, E.; Weichert, C.; Köchert, P.; Bosse, H.; Kunzmann, H. Improved measurement performance of the Physikalisch-Technische Bundesanstalt nanometer comparator by integration of a new Zerodur sample carriage. Opt. Eng. 2014, 53, 122404. [Google Scholar] [CrossRef]
  6. Beverini, N.; Di Virgilio, A.; Belfi, J.; Ortolan, A.; Schreiber, K.U.; Gebauer, A.; Klügel, T. High-accuracy ring laser gyroscopes: Earth rotation rate and relativistic effects. J. Phys. Conf. Ser. 2016, 723, 012061. [Google Scholar] [CrossRef]
  7. Kuznetsov, A.G.; Molchanov, A.V.; Chirkin, M.V.; Izmailov, E.A. Precise laser gyroscope for autonomous inertial navigation. Quantum Electron. 2015, 45, 78–88. [Google Scholar] [CrossRef]
  8. Manske, E.; Fröhlich, T.; Füßl, R.; Ortlepp, I.; Mastylo, R.; Blumröder, U.; Dontsov, D.; Kuehnel, M.; Köchert, P. Progress of nanopositioning and nanomeasuring machines for cross-scale measurement with sub-nanometre precision. Meas. Sci. Technol. 2020, 31, 085005. [Google Scholar] [CrossRef]
  9. Mitra, I. ZERODUR: A glass-ceramic material enabling optical technologies. Opt. Mater. Express 2022, 12, 3563–3576. [Google Scholar] [CrossRef]
  10. Schulz, H. Thermal expansion of beta eucryptite. J. Am. Ceram. Soc. 1974, 57, 313–318. [Google Scholar] [CrossRef]
  11. Lichtenstein, A.I.; Jones, R.O.; Xu, H.; Heaney, P.J. Anisotropic thermal expansion in the silicate β-eucryptite: A neutron diffraction and density functional study. Phys. Rev. B 1998, 58, 6219–6223. [Google Scholar] [CrossRef]
  12. Roy, R.; Agrawal, D.K.; McKinstry, H.A. Very low thermal expansion coefficient materials. Annu. Rev. Mater. Sci. 1989, 19, 59–81. [Google Scholar] [CrossRef]
  13. Gillery, F.H.; Bush, E.A. Thermal contraction of β-eucryptite (Li2O⋅Al2O3⋅2SiO2) by X-ray and dilatometer methods. J. Am. Ceram. Soc. 1959, 42, 175–177. [Google Scholar] [CrossRef]
  14. Guan, J. Femtosecond-laser-written integrated photonics in bulk glass-ceramics Zerodur. Ceram. Int. 2021, 47, 10189–10192. [Google Scholar] [CrossRef]
  15. Ferreira, P.H.D.; Fabris, D.C.N.; Boas, M.V.; Bezerra, I.G.; Mendonça, C.R.; Zanotto, E.D. Transparent glass-ceramic waveguides made by femtosecond laser writing. Opt. Laser Technol. 2021, 136, 106742. [Google Scholar] [CrossRef]
  16. Lipatiev, A.; Fedotov, S.; Lotarev, S.; Naumov, A.; Lipateva, T.; Savinkov, V.; Shakhgildyan, G.; Sigaev, V. Direct laser writing of depressed-cladding waveguides in extremely low expansion lithium aluminosilicate glass-ceramics. Opt. Laser Technol. 2021, 138, 106846. [Google Scholar] [CrossRef]
  17. Khodakovskaya, R.Y. Chemistry of Titanium-Containing Glasses and Glass Ceramics; Khimiya: Moscow, Russia, 1978. [Google Scholar]
  18. Khodakovskaya, R.Y.; Sigaev, V.N.; Plutalov, N.F. Phase separation of Li2O–Al2O3–SiO2–TiO2 glass at the initial stages of crystallization. Fiz. Khim. Stekla. 1979, 5, 134–140. [Google Scholar]
  19. Sakamoto, A.; Yamamoto, S. Glass-ceramics: Engineering principles and applications. Int. J. Appl. Glas. Sci. 2010, 1, 237–247. [Google Scholar] [CrossRef]
  20. Bach, H.; Krause, D. (Eds.) Low Thermal Expansion Glass Ceramics; Springer: Berlin/Heidelberg, Germany, 2005; pp. 121–235. [Google Scholar]
  21. Liu, X.; Zhou, J.; Zhou, S.; Yue, Y.; Qiu, J. Transparent glass-ceramics functionalized by dispersed crystals. Prog. Mater. Sci. 2018, 97, 38–96. [Google Scholar] [CrossRef]
  22. Kleebusch, E.; Patzig, C.; Höche, T.; Rüssel, C. A modified B2O3 containing Li2O-Al2O3-SiO2 glass with ZrO2 as nucleating agent-crystallization and microstructure studied by XRD and (S)TEM-EDX. Ceram. Int. 2018, 44, 19818–19824. [Google Scholar] [CrossRef]
  23. Wu, J.; Lin, C.; Liu, J.; Han, L.; Gui, H.; Li, C.; Liu, T.; Lu, A. The effect of complex nucleating agent on the crystallization, phase formation and performances in lithium aluminum silicate (LAS) glasses. J. Non-Cryst. Solids 2019, 521, 119486. [Google Scholar] [CrossRef]
  24. Dymshits, O.; Bachina, A.; Alekseeva, I.; Golubkov, V.; Tsenter, M.; Zapalova, S.; Bogdanov, K.; Danilovich, D.; Zhilin, A. Phase transformations upon formation of transparent lithium alumosilicate glass-ceramics nucleated by yttrium niobates. Ceramics 2023, 6, 1490–1507. [Google Scholar] [CrossRef]
  25. Maier, V.; Muller, G. Mechanism of oxide nucleation in lithium aluminosilicate glass-ceramics. J. Am. Ceram. Soc. 1987, 70, 176–178. [Google Scholar] [CrossRef]
  26. Venkateswaran, C.; Sharma, S.C.; Pant, B.; Chauhan, V.S.; Vaish, R. Crystallisation studies on site saturated lithium aluminosilicate (LAS) glass. Thermochim. Acta 2019, 679, 178311. [Google Scholar] [CrossRef]
  27. Kumar, A.; Chakrabarti, A.; Shekhawat, M.S.; Molla, A.R. Transparent ultra-low expansion lithium aluminosilicate glass-ceramics: Crystallization kinetics, structural and optical properties. Thermochim. Acta 2019, 676, 155–163. [Google Scholar] [CrossRef]
  28. Zhang, R.; Yi, L.; Kong, F.; Liang, X.; Yin, Z.; Rao, Y.; Wang, D.; Chen, Z.; Yu, X.; Jiang, H.; et al. Rapid preparation of low thermal expansion transparent LAS nanocrystalline glass by one-step thermoelectric treatment. Ceram. Int. 2021, 47, 34380–34387. [Google Scholar] [CrossRef]
  29. Komatsu, T.; Honma, T. Laser patterning and growth mechanism of orientation designed crystals in oxide glasses: A review. J. Solid State Chem. 2019, 275, 210–222. [Google Scholar] [CrossRef]
  30. Wang, X.; Yu, H.; Li, P.; Zhang, Y.; Wen, Y.; Qiu, Y.; Liu, Z.; Li, Y.; Liu, L. Femtosecond laser-based processing methods and their applications in optical device manufacturing: A review. Opt. Laser Technol. 2021, 135, 106687. [Google Scholar] [CrossRef]
  31. Zhang, B.; Wang, L.; Chen, F. Recent advances in femtosecond laser processing of LiNbO3 crystals for photonic applications. Laser Photonics Rev. 2020, 14, 1900407. [Google Scholar] [CrossRef]
  32. Lei, Y.; Wang, H.; Skuja, L.; Kühn, B.; Franz, B.; Svirko, Y.; Kazansky, P.G. Ultrafast laser writing in different types of silica glass. Laser Photonics Rev. 2023, 17, 2200978. [Google Scholar] [CrossRef]
  33. Stoian, R.; Colombier, J.-P. Advances in ultrafast laser structuring of materials at the nanoscale. Nanophotonics 2020, 9, 4665–4688. [Google Scholar] [CrossRef]
  34. Khalil, A.A.; Bérubé, J.-P.; Danto, S.; Desmoulin, J.-C.; Cardinal, T.; Petit, Y.; Vallée, R.; Canioni, L. Direct laser writing of a new type of waveguides in silver containing glasses. Sci. Rep. 2017, 7, 11124. [Google Scholar] [CrossRef]
  35. Shakhgildyan, G.Y.; Alekseev, R.O.; Golubev, N.V.; Savinkov, V.I.; Naumov, A.S.; Presnyakova, N.N.; Sigaev, V.N. One-step crystallization of gahnite glass-ceramics in a wide thermal gradient. Chemengineering 2023, 7, 37. [Google Scholar] [CrossRef]
  36. Langford, J.I.; Wilson, A.J.C. Scherrer after sixty years: A survey and some new results in the determination of crystallite size. J. Appl. Crystallogr. 1978, 11, 102–113. [Google Scholar] [CrossRef]
  37. Kleebusch, E.; Patzig, C.; Höche, T.; Rüssel, C. The evidence of phase separation droplets in the crystallization process of a Li2O-Al2O3-SiO2 glass with TiO2 as nucleating agent—An X-ray diffraction and (S)TEM-study supported by EDX-analysis. Ceram. Int. 2018, 44, 2919–2926. [Google Scholar] [CrossRef]
  38. Hartmann, P.; Jedamzik, R.; Carré, A.; Krieg, J.; Westerhoff, T. Glass ceramic ZERODUR®: Even closer to zero thermal expansion: A Review, Part 1. J. Astron. Telesc. Instrum. Syst. 2021, 7, 020901. [Google Scholar] [CrossRef]
  39. Hartmann, P.; Jedamzik, R.; Carré, A.; Krieg, J.; Westerhoff, T. Glass ceramic ZERODUR®: Even closer to zero thermal expansion: A Review, Part 2. J. Astron. Telesc. Instrum. Syst. 2021, 7, 020902. [Google Scholar] [CrossRef]
  40. Wurth, R.; Muñoz, F.; Müller, M.; Rüssel, C. Crystal growth in a multicomponent lithia aluminosilicate glass. Mater. Chem. Phys. 2009, 116, 433–437. [Google Scholar] [CrossRef]
  41. Li, M.; Xiong, C.; Ma, Y.; Jiang, H. Study on crystallization process of Li2O–Al2O3–SiO2 glass-ceramics based on in situ analysis. Materials 2022, 15, 8006. [Google Scholar] [CrossRef]
  42. Marotta, A.; Buri, A.; Branda, F. Nucleation in glass and differential thermal analysis. J. Mater. Sci. 1981, 16, 341–344. [Google Scholar] [CrossRef]
  43. Loshmanov, A.A.; Sigaev, V.N.; Khodakovskaya, R.Y.; Pavlushkin, N.M.; Yamzin, I.I. Small-angle neutron scattering on silica glasses containing titania. J. Appl. Crystallogr. 1974, 7, 207–210. [Google Scholar] [CrossRef]
  44. Kleebusch, E.; Patzig, C.; Höche, T.; Rüssel, C. Effect of the concentrations of nucleating agents ZrO2 and TiO2 on the crystallization of Li2O–Al2O3–SiO2 glass: An X-ray diffraction and TEM investigation. J. Mater. Sci. 2016, 51, 10127–10138. [Google Scholar] [CrossRef]
  45. Kleebusch, E.; Thieme, C.; Patzig, C.; Höche, T.; Rüssel, C. Crystallization of lithium aluminosilicate and microstructure of a lithium alumino borosilicate glass designed for zero thermal expansion. Ceram. Int. 2023, 49, 21246–21254. [Google Scholar] [CrossRef]
  46. Bhattacharyya, S.; Höche, T.; Jinschek, J.R.; Avramov, I.; Wurth, R.; Müller, M.; Rüssel, C. Direct evidence of Al-rich layers around nanosized ZrTiO4 in glass: Putting the role of nucleation agents in perspective. Cryst. Growth Des. 2010, 10, 379–385. [Google Scholar] [CrossRef]
  47. Höche, T.; Patzig, C.; Gemming, T.; Wurth, R.; Rüssel, C.; Avramov, I. Temporal evolution of diffusion barriers surrounding ZrTiO4 nuclei in lithia aluminosilicate glass-ceramics. Cryst. Growth Des. 2012, 12, 1556–1563. [Google Scholar] [CrossRef]
  48. Höche, T.; Mäder, M.; Bhattacharyya, S.; Henderson, G.S.; Gemming, T.; Wurth, R.; Rüssel, C.; Avramov, I. ZrTiO4 crystallisation in nanosized liquid–liquid phase-separation droplets in glass—A quantitative XANES study. CrystEngComm 2011, 13, 2550–2556. [Google Scholar] [CrossRef]
  49. Serbena, F.C.; Zanotto, E.D. Internal residual stresses in glass-ceramics: A review. J. Non-Cryst. Solids 2012, 358, 975–984. [Google Scholar] [CrossRef]
  50. Serbena, F.C.; Soares, V.O.; Peitl, O.; Pinto, H.; Muccillo, R.; Zanotto, E.D. Internal residual Stresses in sintered and commercial low expansion Li2O-Al2O3-SiO2 glass-ceramics. J. Am. Ceram. Soc. 2011, 94, 1206–1214. [Google Scholar] [CrossRef]
  51. Ross, S.; Welsch, A.-M.; Behrens, H. Lithium conductivity in glasses of the Li2O–Al2O3–SiO2 system. Phys. Chem. Chem. Phys. 2015, 17, 465–474. [Google Scholar] [CrossRef]
  52. Wei, A.; Liu, Z.; Zhang, F.; Ma, M.; Chen, G.; Li, Y. Thermal expansion coefficient tailoring of LAS glass-ceramic for anodic bondable low temperature co-fired ceramic application. Ceram. Int. 2020, 46, 4771–4777. [Google Scholar] [CrossRef]
Figure 1. (a) DSC curve and (b) XRD pattern of the synthesized glass.
Ceramics 07 00001 g001
Figure 2. (a) DSC curves (vertically shifted for clarity) of the initial glass and after nucleation pre-treatment at the indicated temperatures for 2 h; (b) Shift of the crystallization peak temperature TP in pretreated samples (with respect to TP’ of the initial glass) vs. nucleation pretreatment temperature.
Ceramics 07 00001 g002
Figure 3. (a) DSC curves (vertically shifted for clarity) of initial glass and after nucleation pre-treatment at 670 °C for the indicated duration; (b) Shift of the crystallization peak temperature TP in pretreated samples (with respect to TP’ of the initial glass) vs. nucleation pretreatment duration.
Ceramics 07 00001 g003
Figure 4. Photo of glass samples obtained after the nucleation at 670 °C for 2 h and crystallization in the range of 690–730 °C for 20 h.
Ceramics 07 00001 g004
Figure 5. (a) Raman spectra of the glass and glass-ceramic samples; (b) Intensity ratio of band A and B vs. the crystallization duration.
Ceramics 07 00001 g005
Figure 6. (a) XRD patterns of the glass-ceramic samples; (b) Standard PDF cards of LixAlxSi1−xO2, LiAlSiO4, and LiAlSi2O6 for comparison.
Ceramics 07 00001 g006
Figure 7. (a) TEM image of the glass-ceramic sample GC-27.5; (b) Particle size distribution as extracted from the TEM image in (a).
Ceramics 07 00001 g007
Figure 8. (a) ∆L/L0 and (b) CTE curves of the bulk glass and glass-ceramic samples.
Ceramics 07 00001 g008
Figure 9. Optical transmittance of 2 mm thick samples before and after crystallization.
Ceramics 07 00001 g009
Table 1. Batched and analyzed compositions as well as some properties of synthesized glass.
Glass Composition
OxidesSiO2Al2O3Li2OP2O5TiO2ZrO2ZnOMgOBaOCaOAs2O3Sb2O3
Batch composition, mol. %61.115.911.14.92.10.90.42.00.80.40.20.2
Analytical composition, mol. %60.019.210.14.61.90.80.41.90.70.30.10.1
Glass properties
Glass transition temperature Tg, °CCrystallization peak TP, °CTP − Tg, °CCTE20…500 °C, ppm/KDensity, g/cm3Refractive
index (nD)
6478672205.172.461.52
Table 2. Calculated crystallized fraction, crystallite size, and CTE values in different temperature ranges (CTET1…T2) for the glass-ceramic samples.
SampleDuration, hCrystallized Fraction, %Crystallite Size, nmCTE 0…50 °C, ppm/KCTE −50…400 °C, ppm/KCTE 20…500 °C, ppm/K
GC-202014333.644.344.73
GC-22.522.524333.133.884.25
GC-252532350.510.750.94
GC-27.527.54935−0.77−0.49−0.34
Disclaimer/Publisher’s Note: The statements, opinions and data contained in all publications are solely those of the individual author(s) and contributor(s) and not of MDPI and/or the editor(s). MDPI and/or the editor(s) disclaim responsibility for any injury to people or property resulting from any ideas, methods, instructions or products referred to in the content.

