
Possibilities of Mechanochemical Synthesis of Apatites with Different Ca/P Ratios


 , , , and
Abstract
:1. Introduction
2. Materials and Methods
3. Results
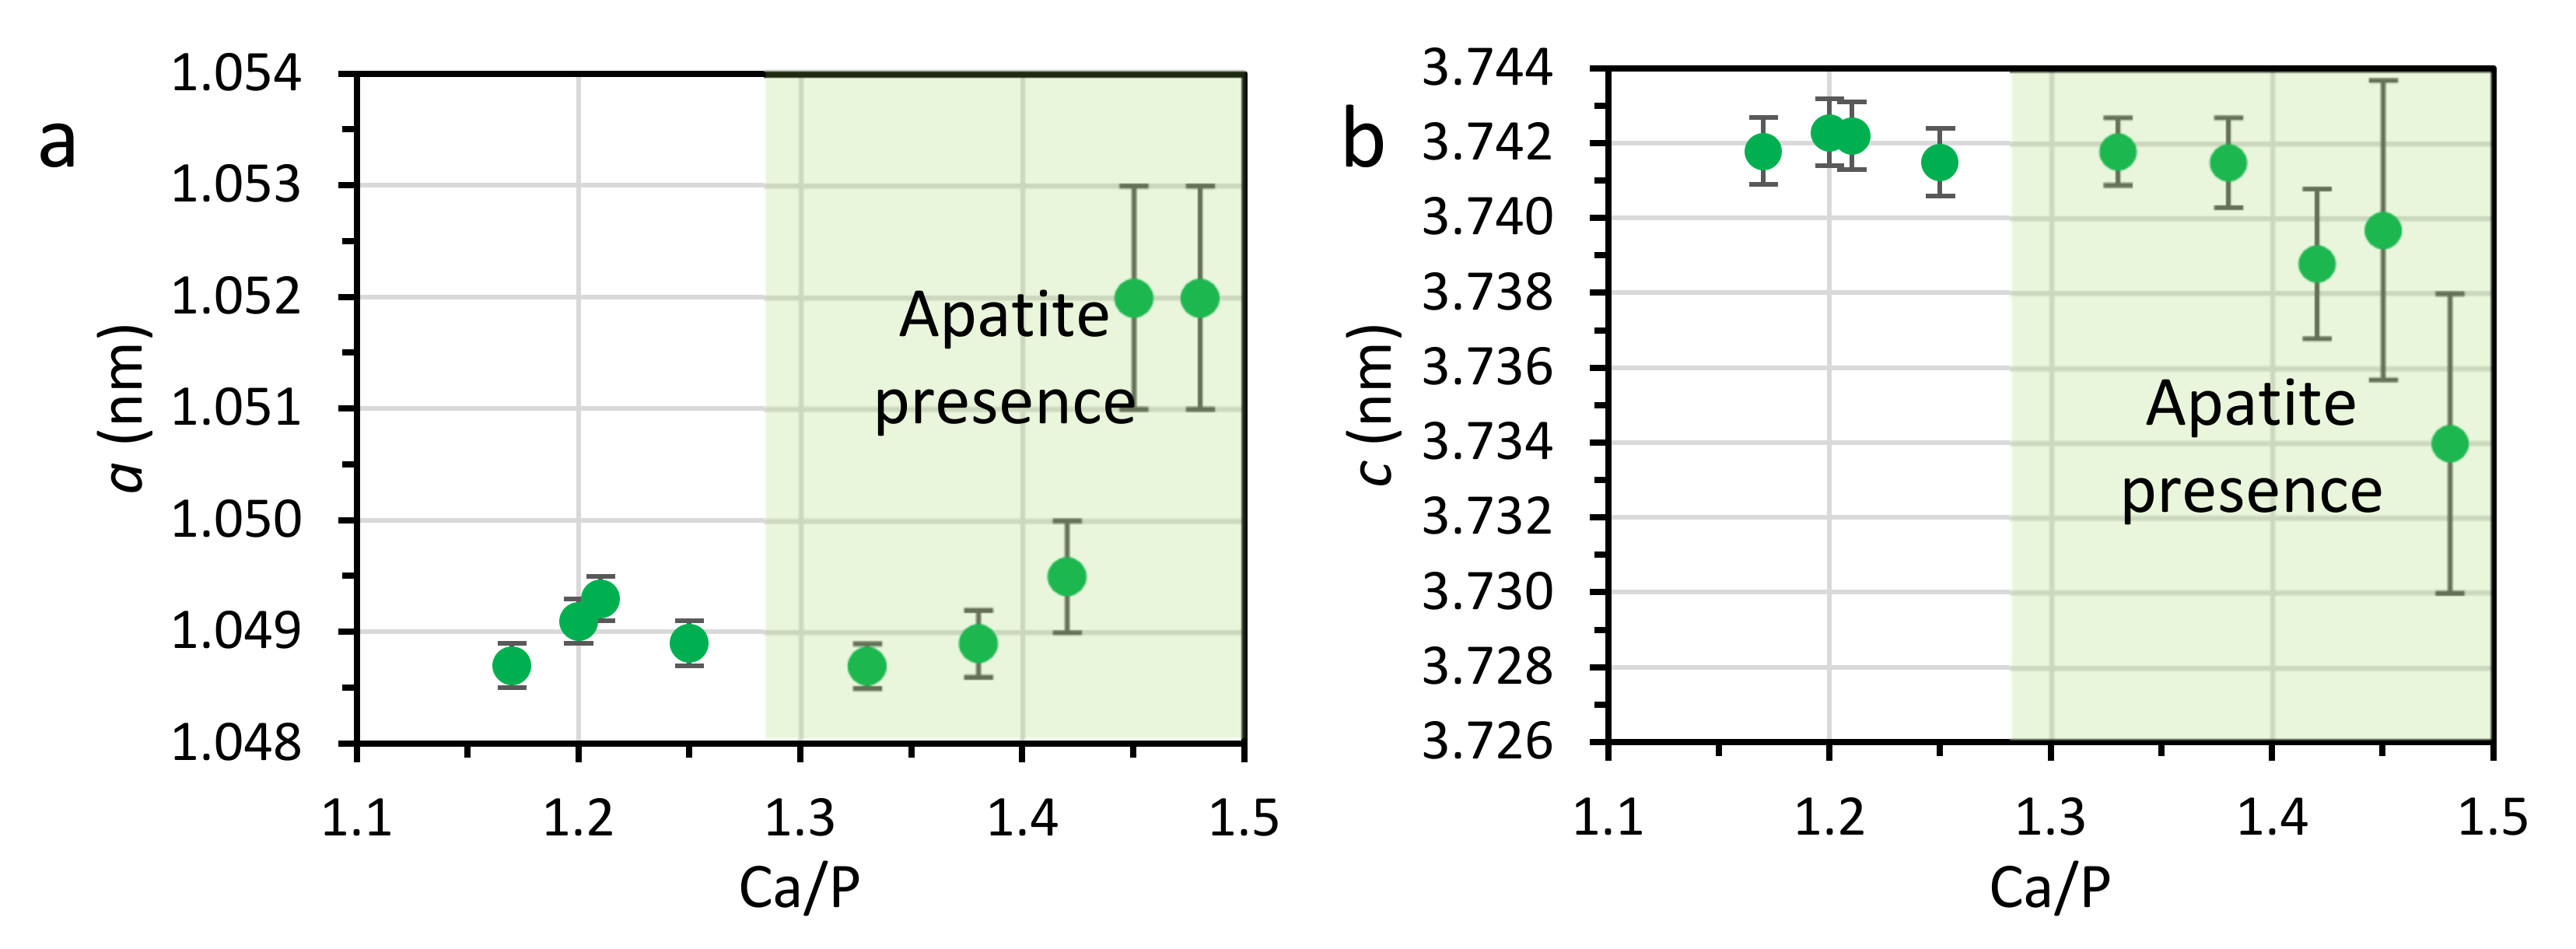
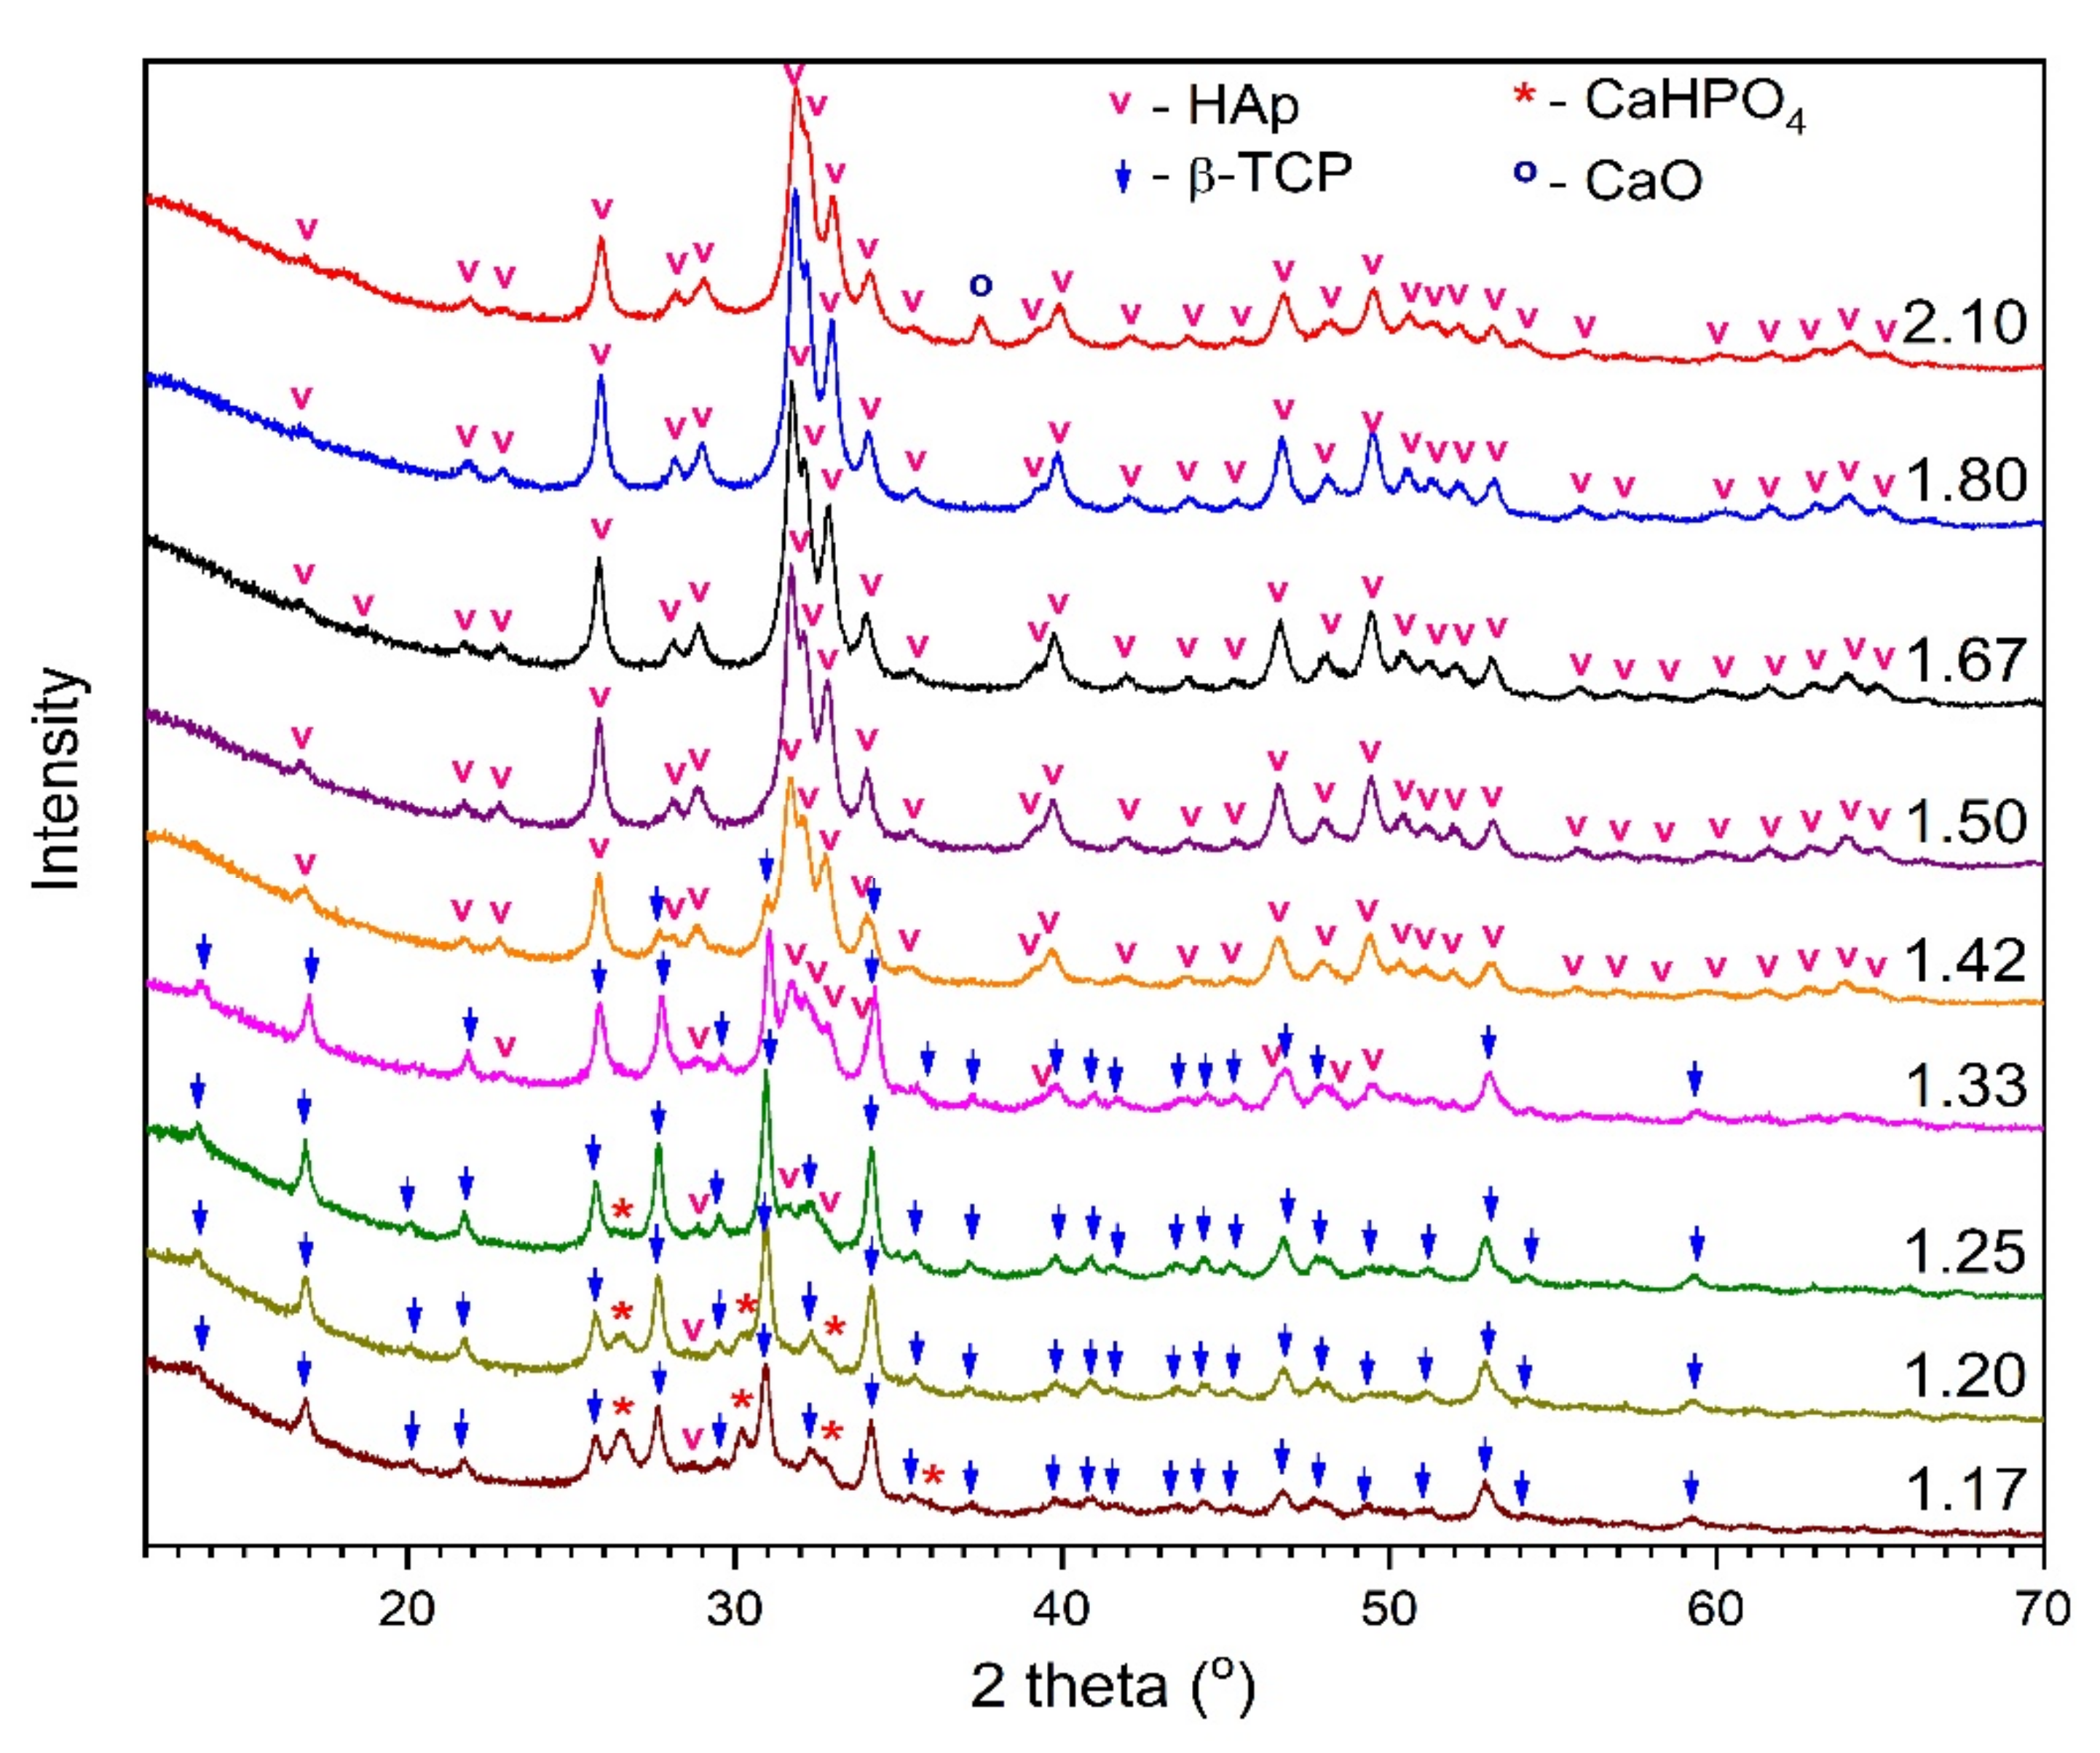
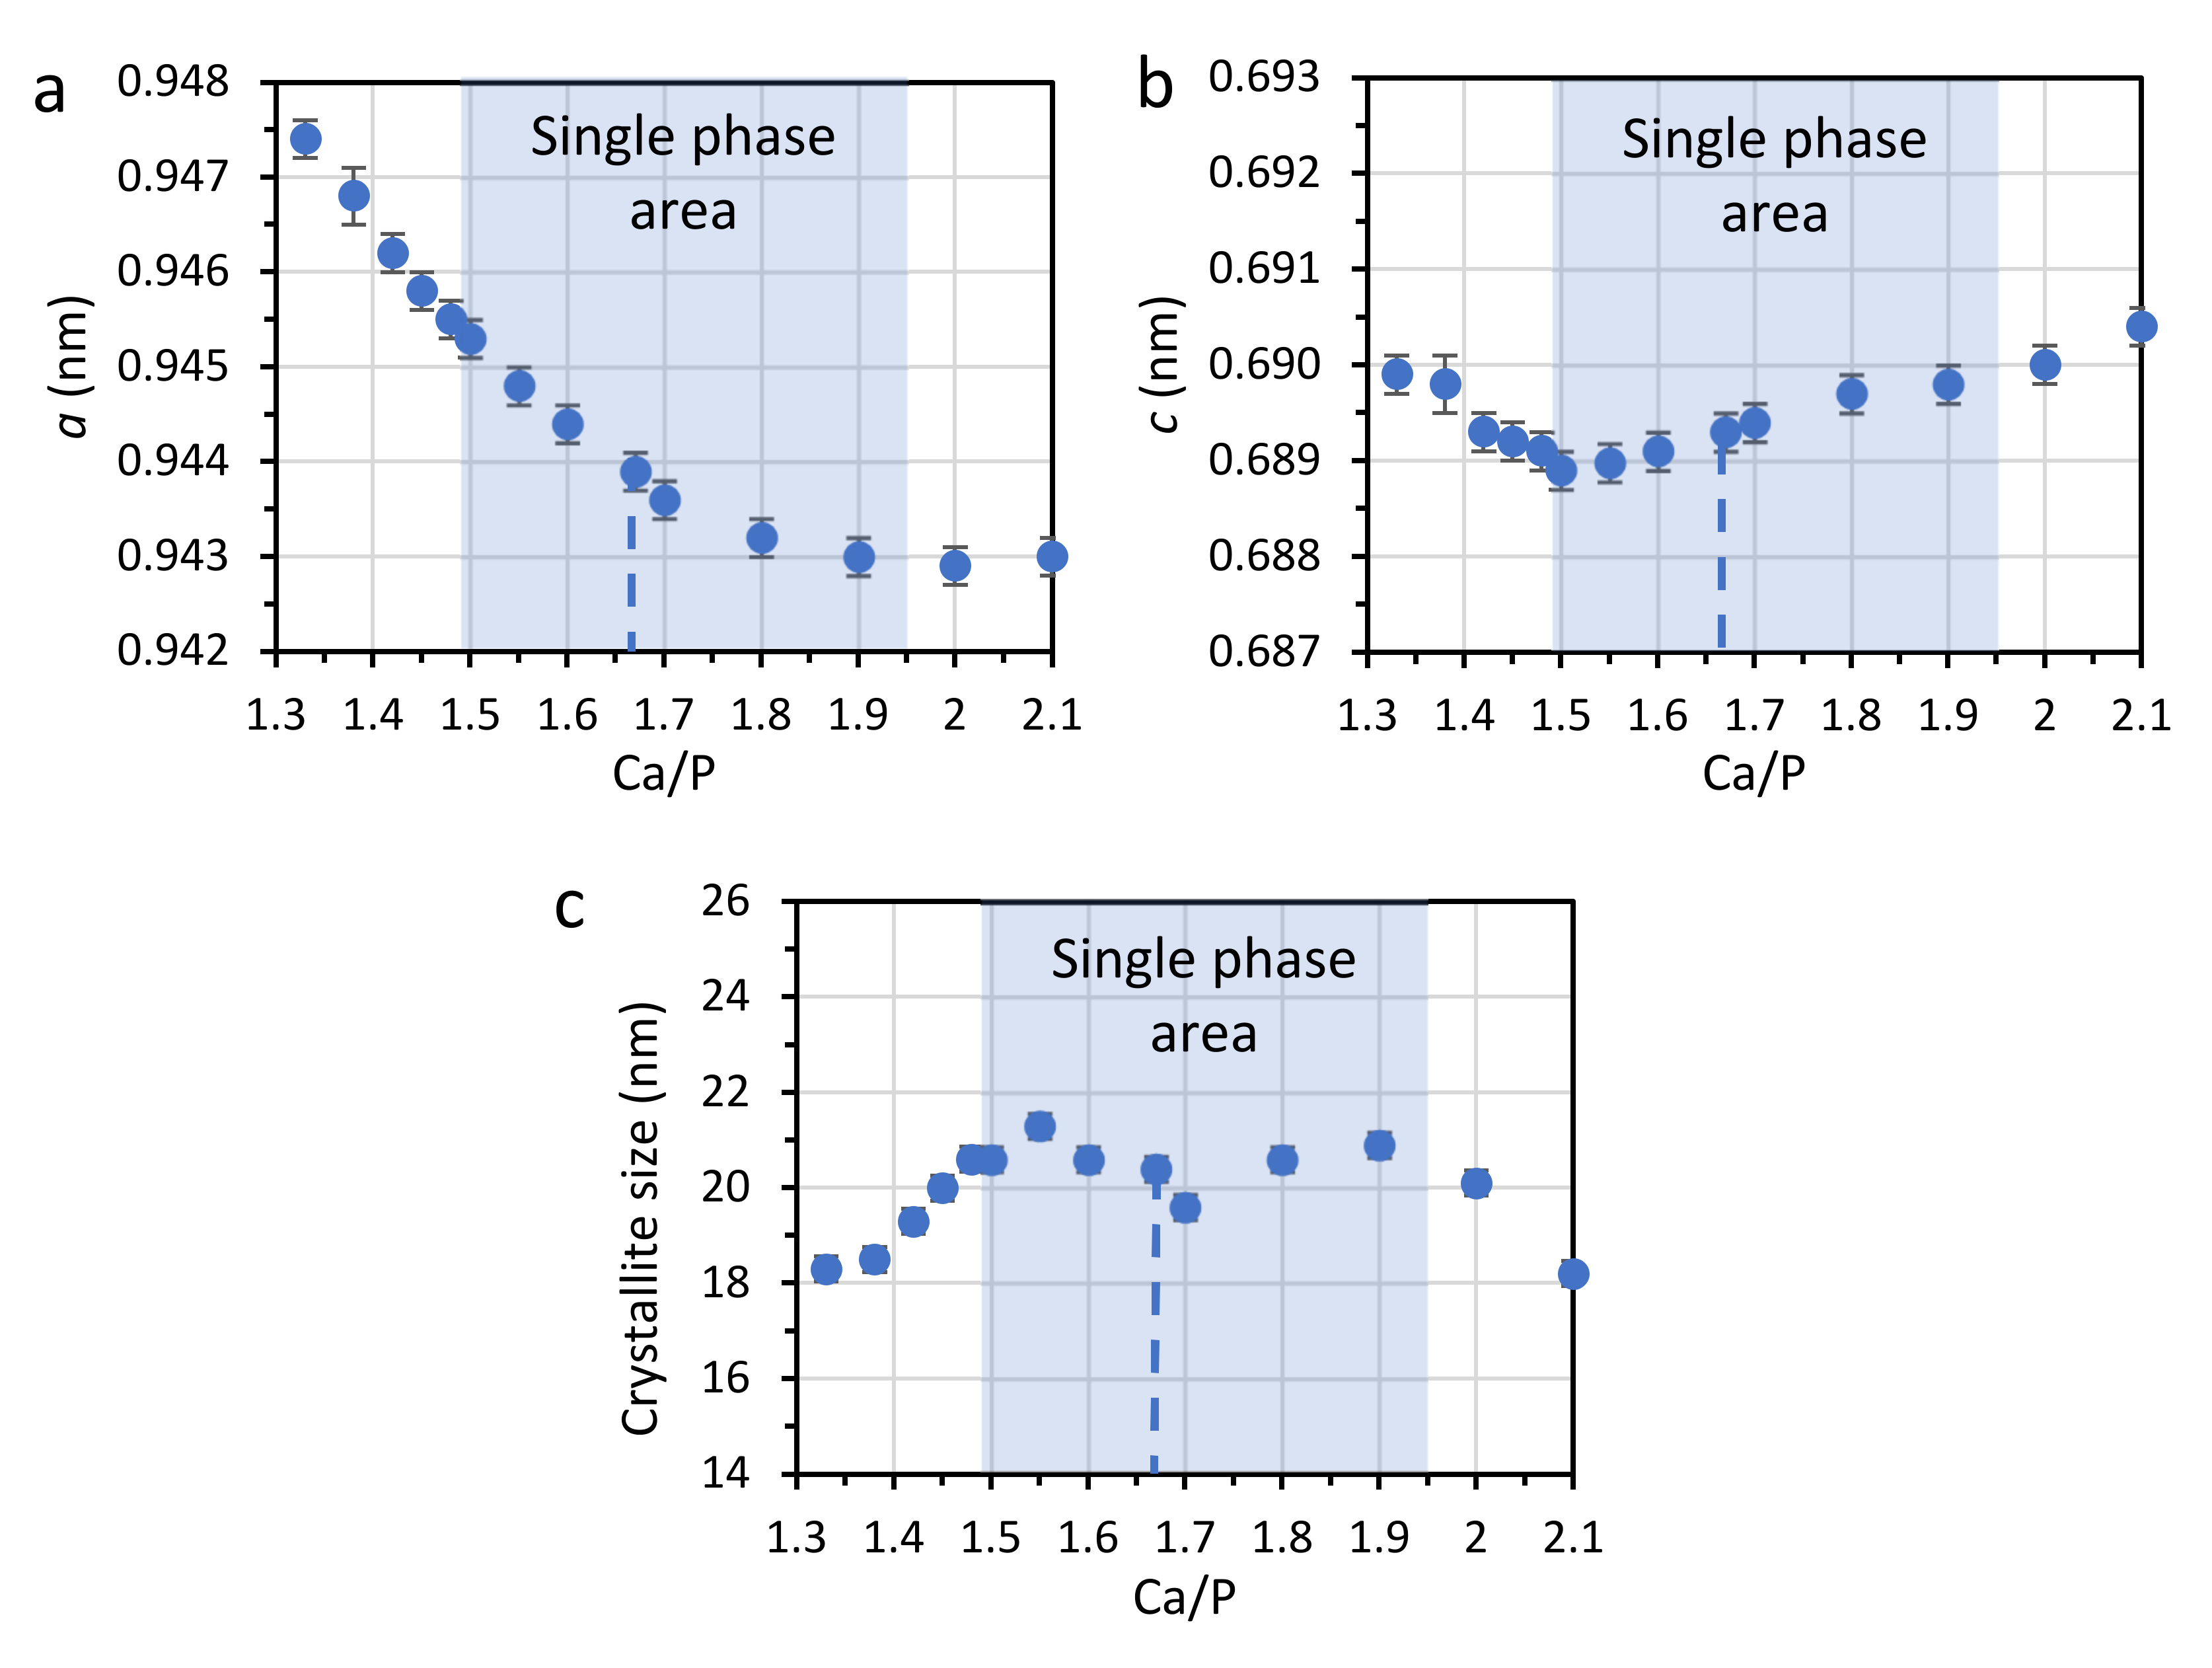
3.1. PXRD
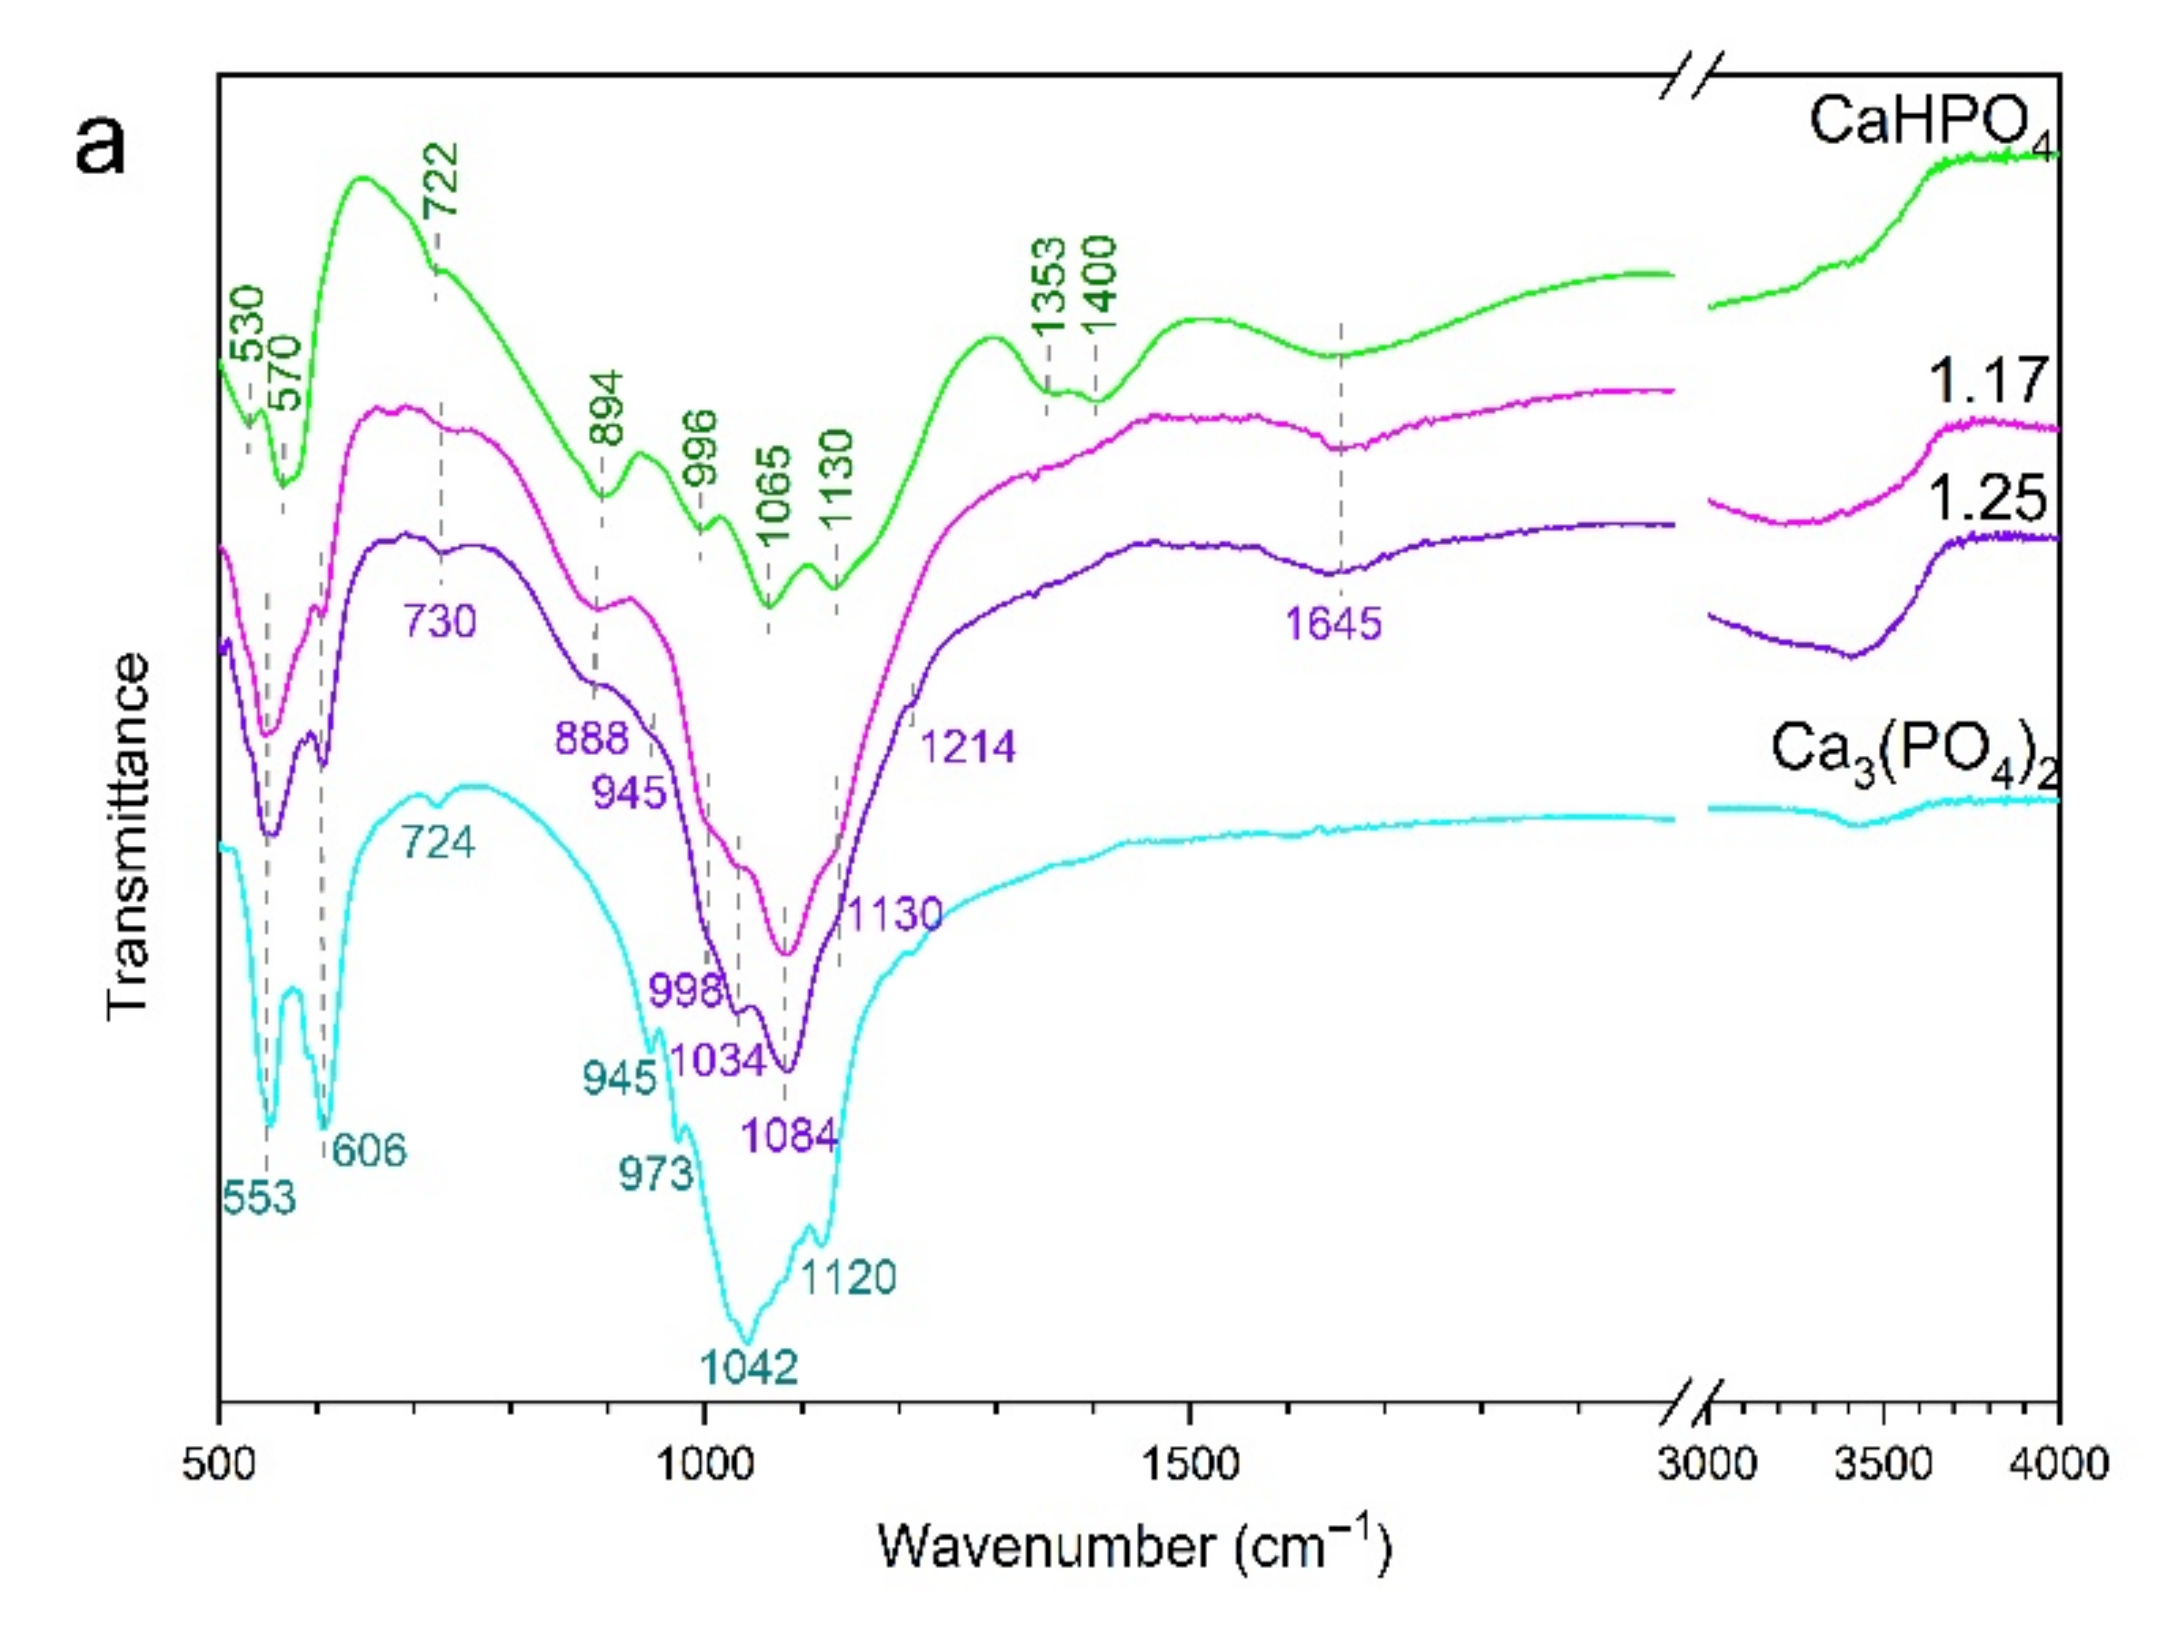
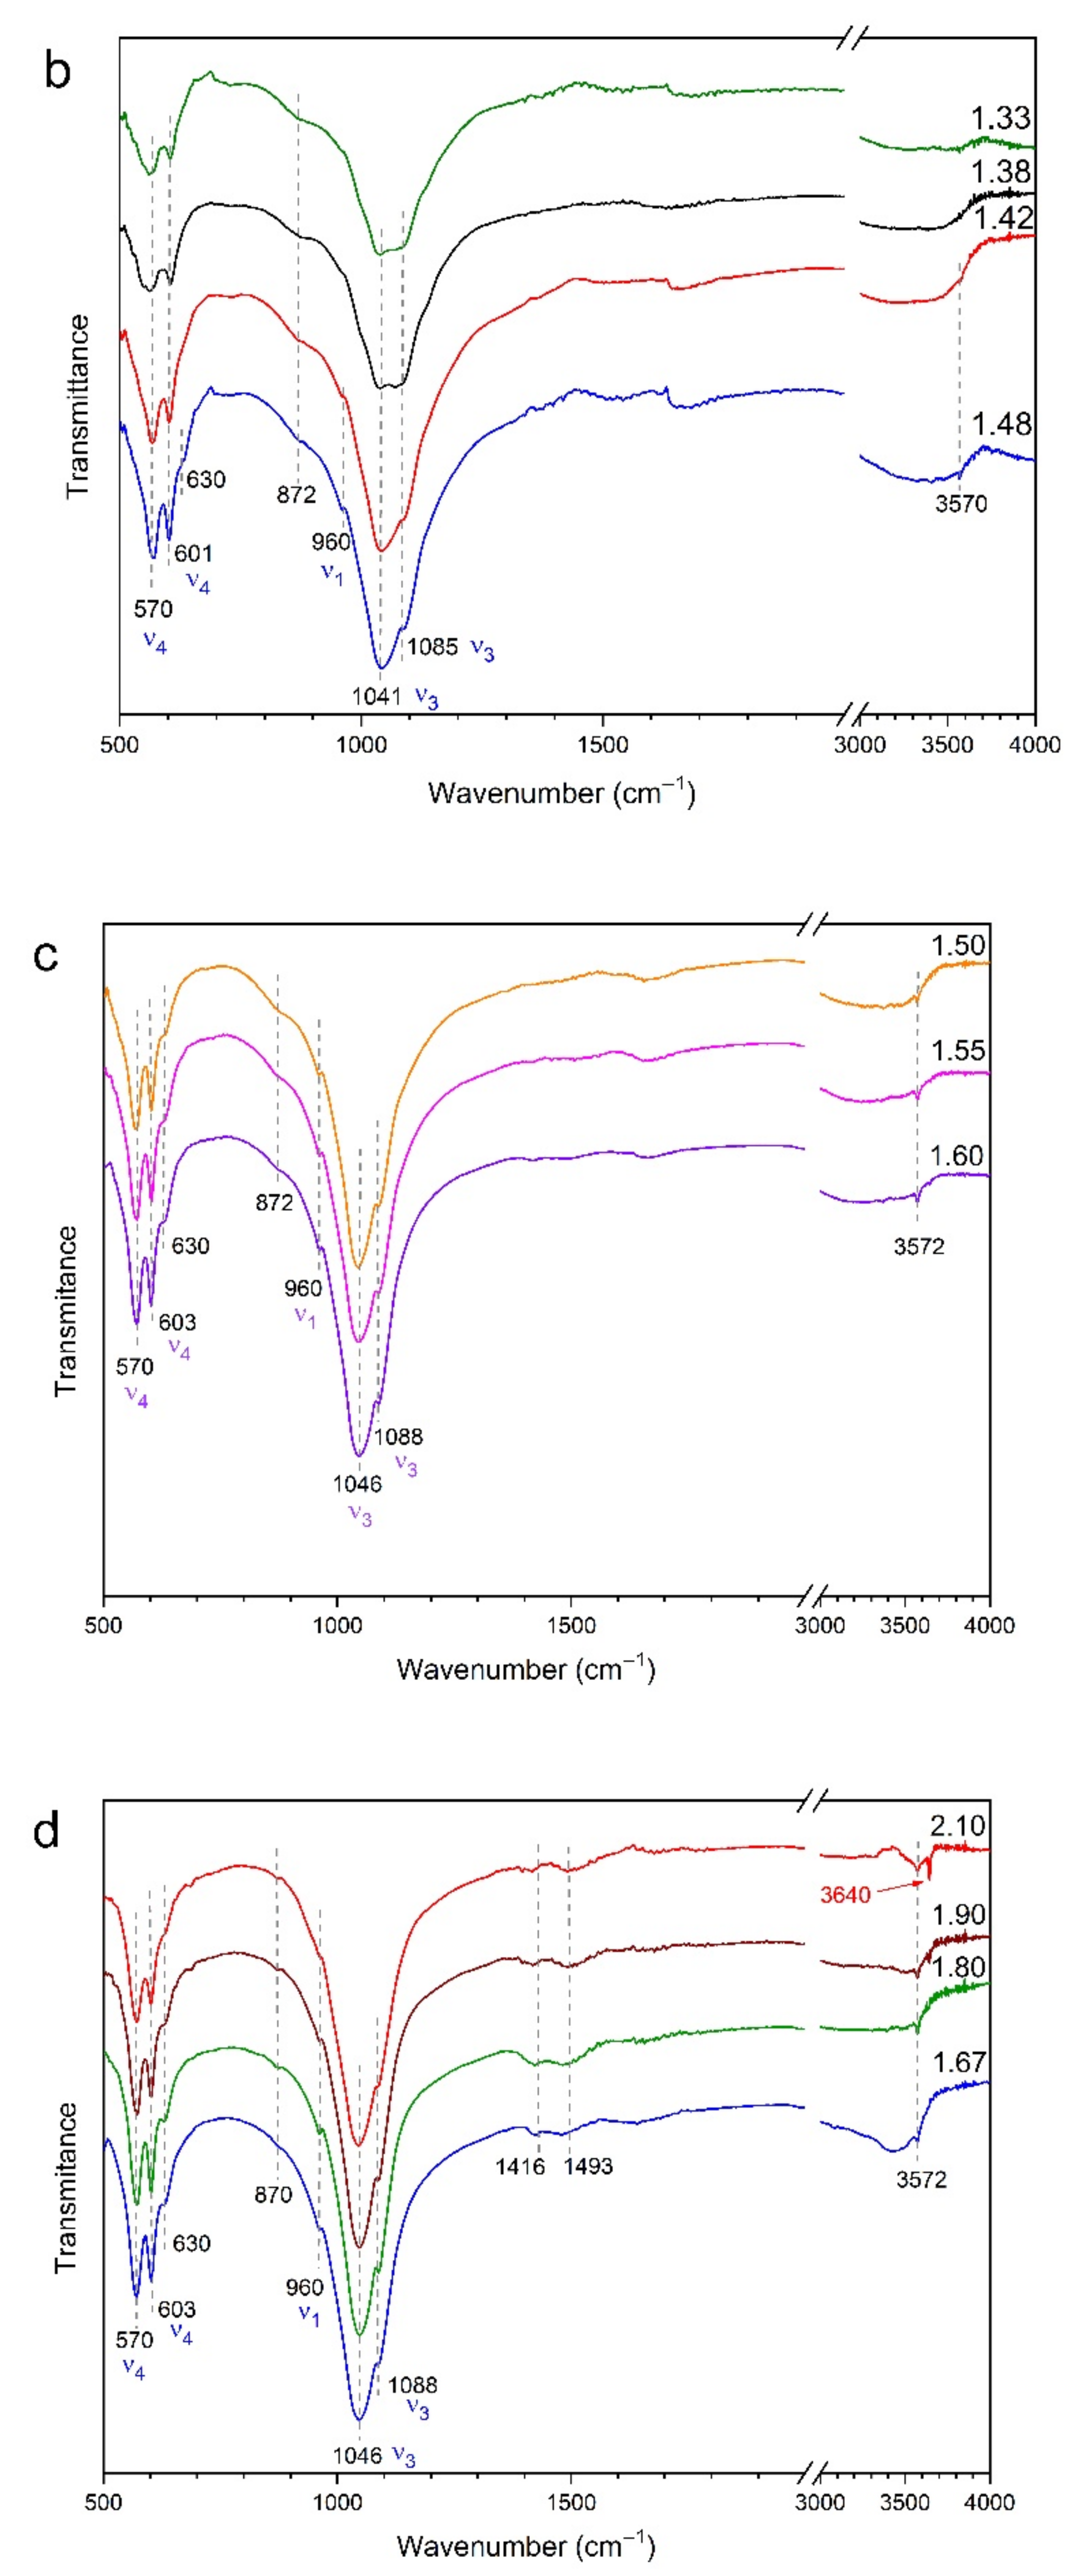
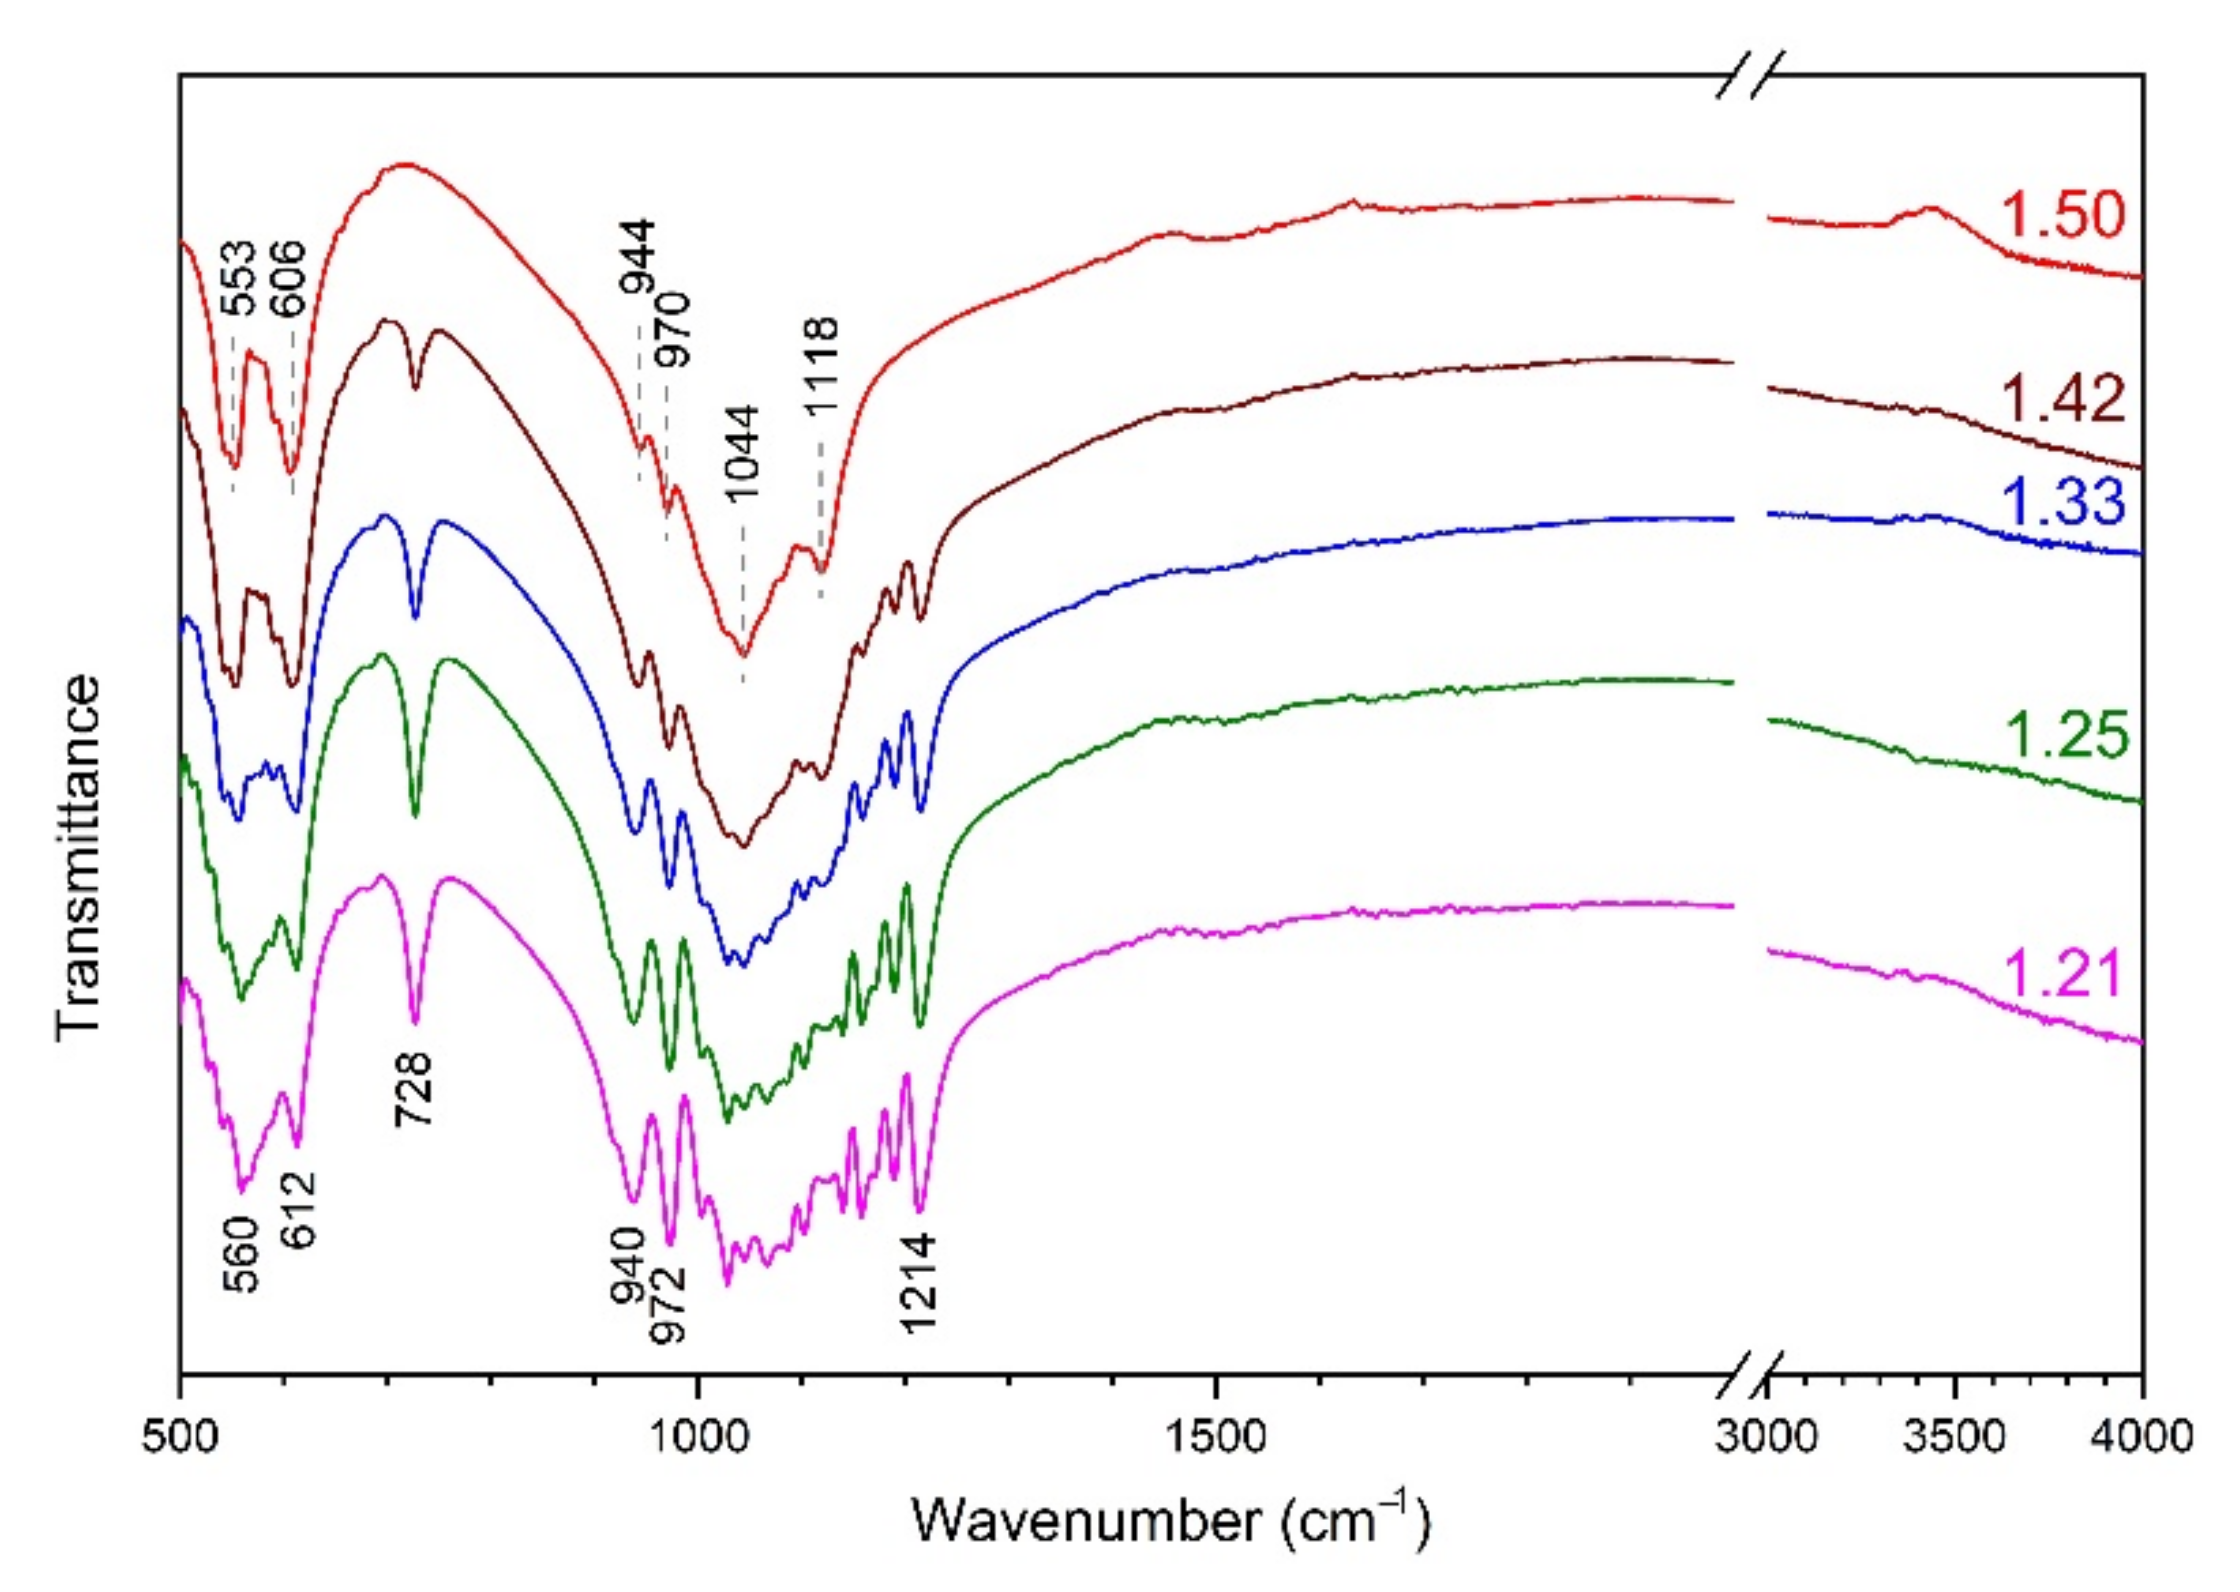
3.2. FTIR Spectroscopy
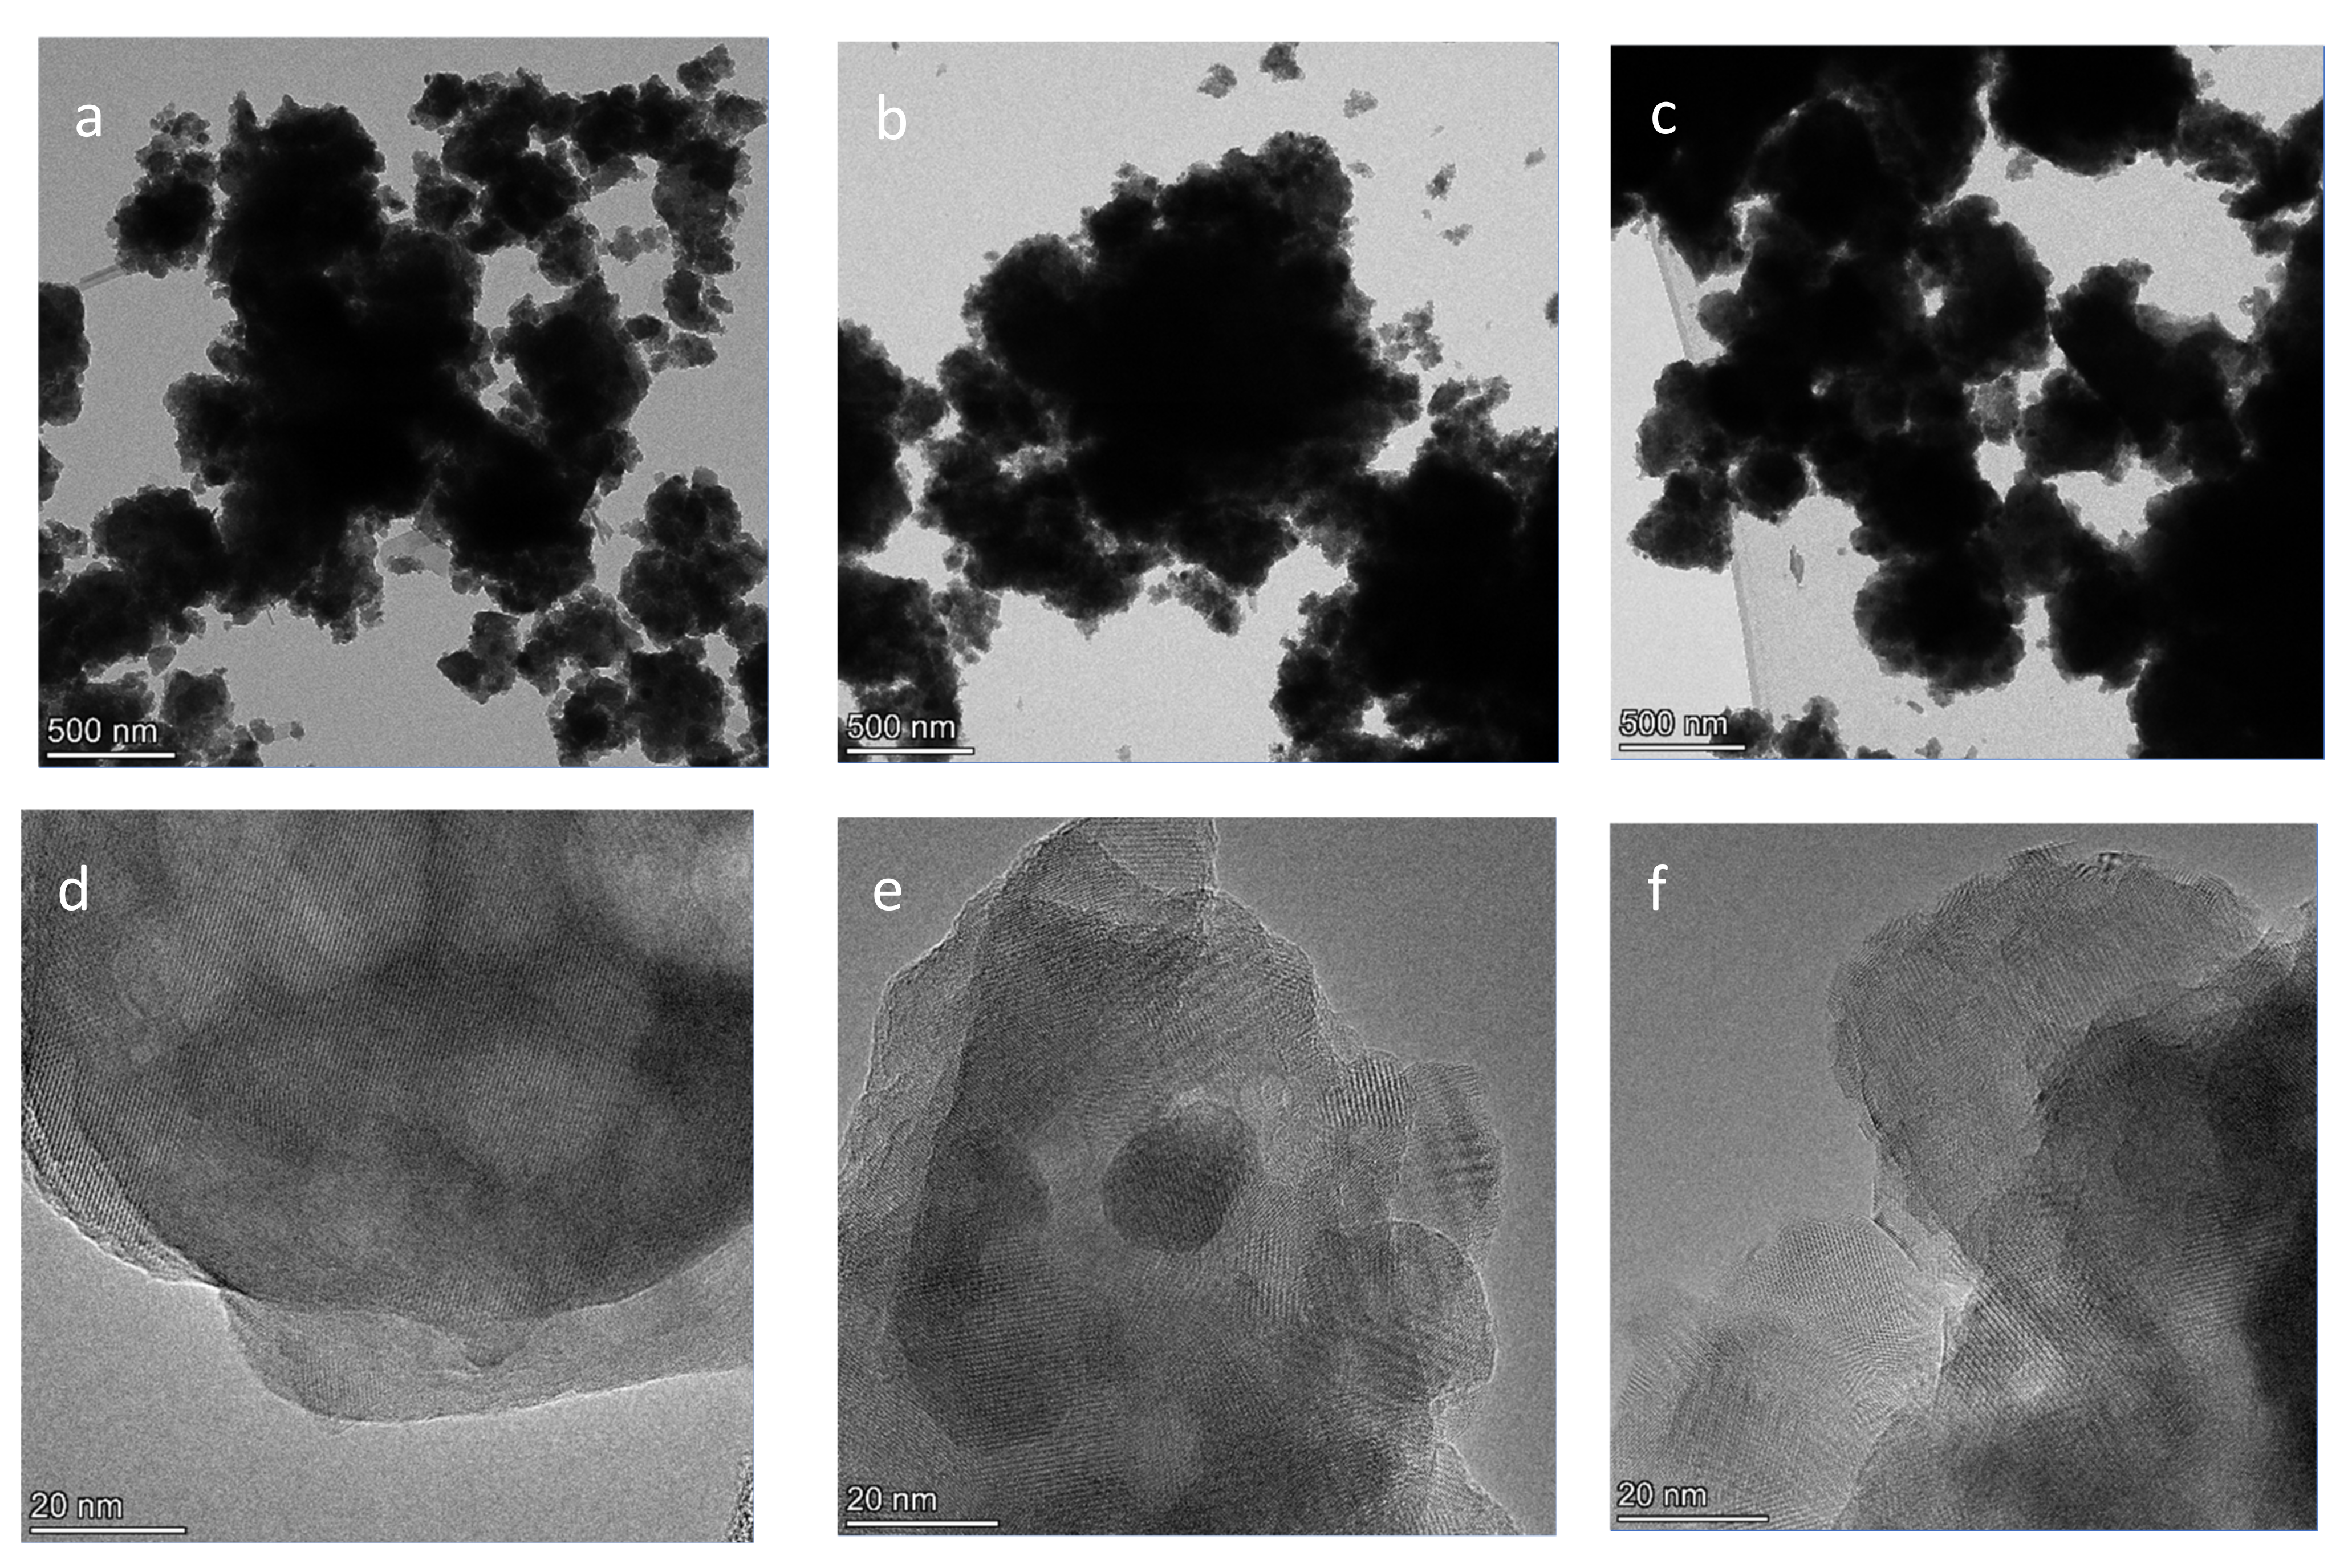
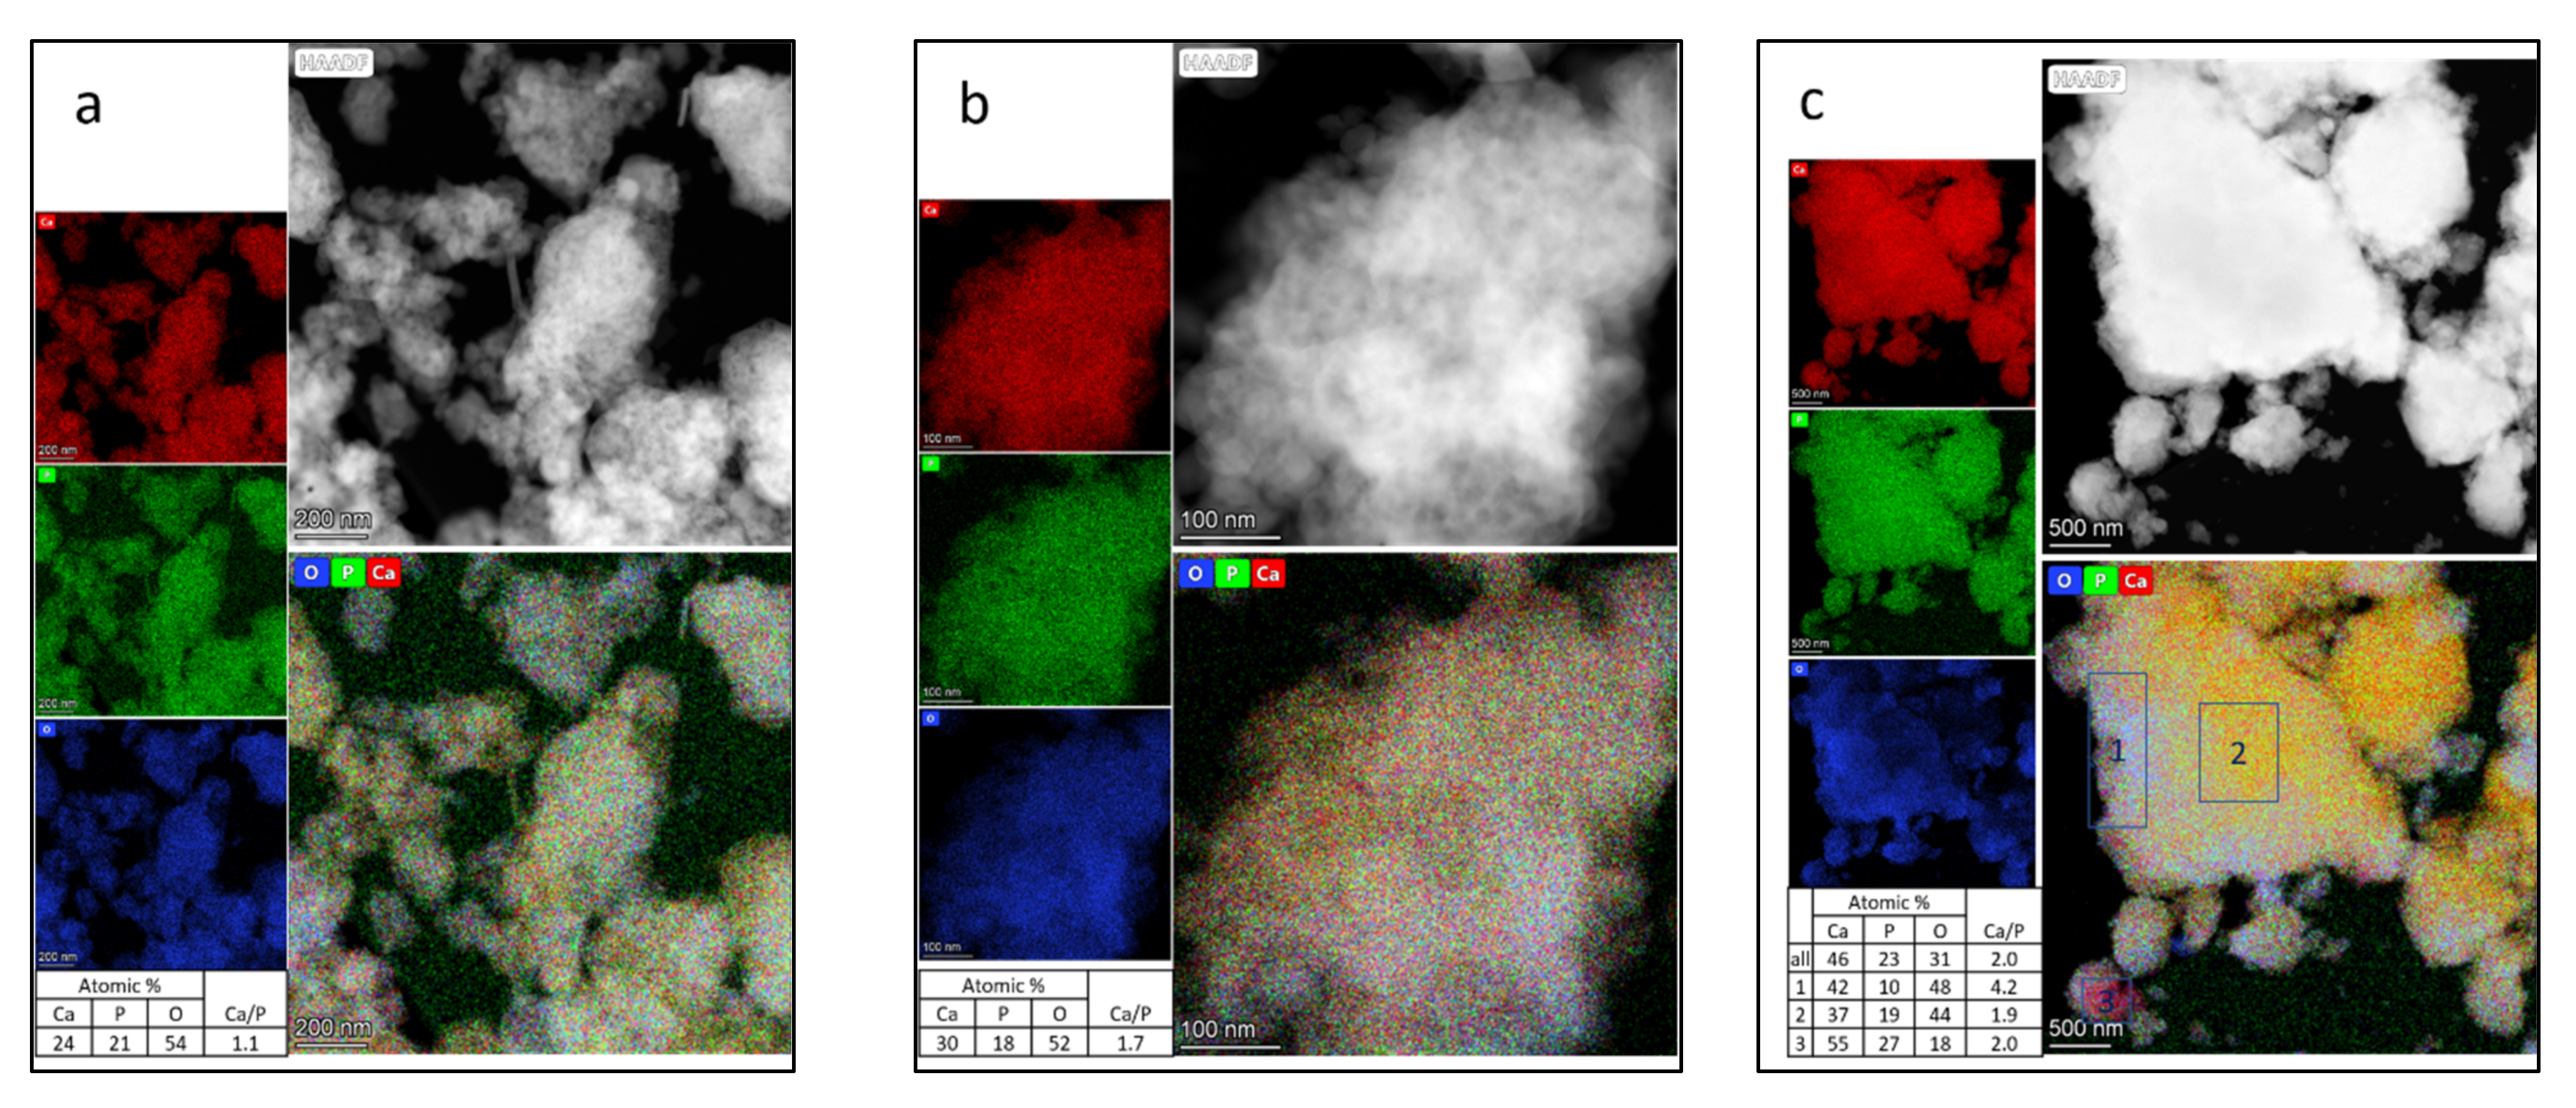
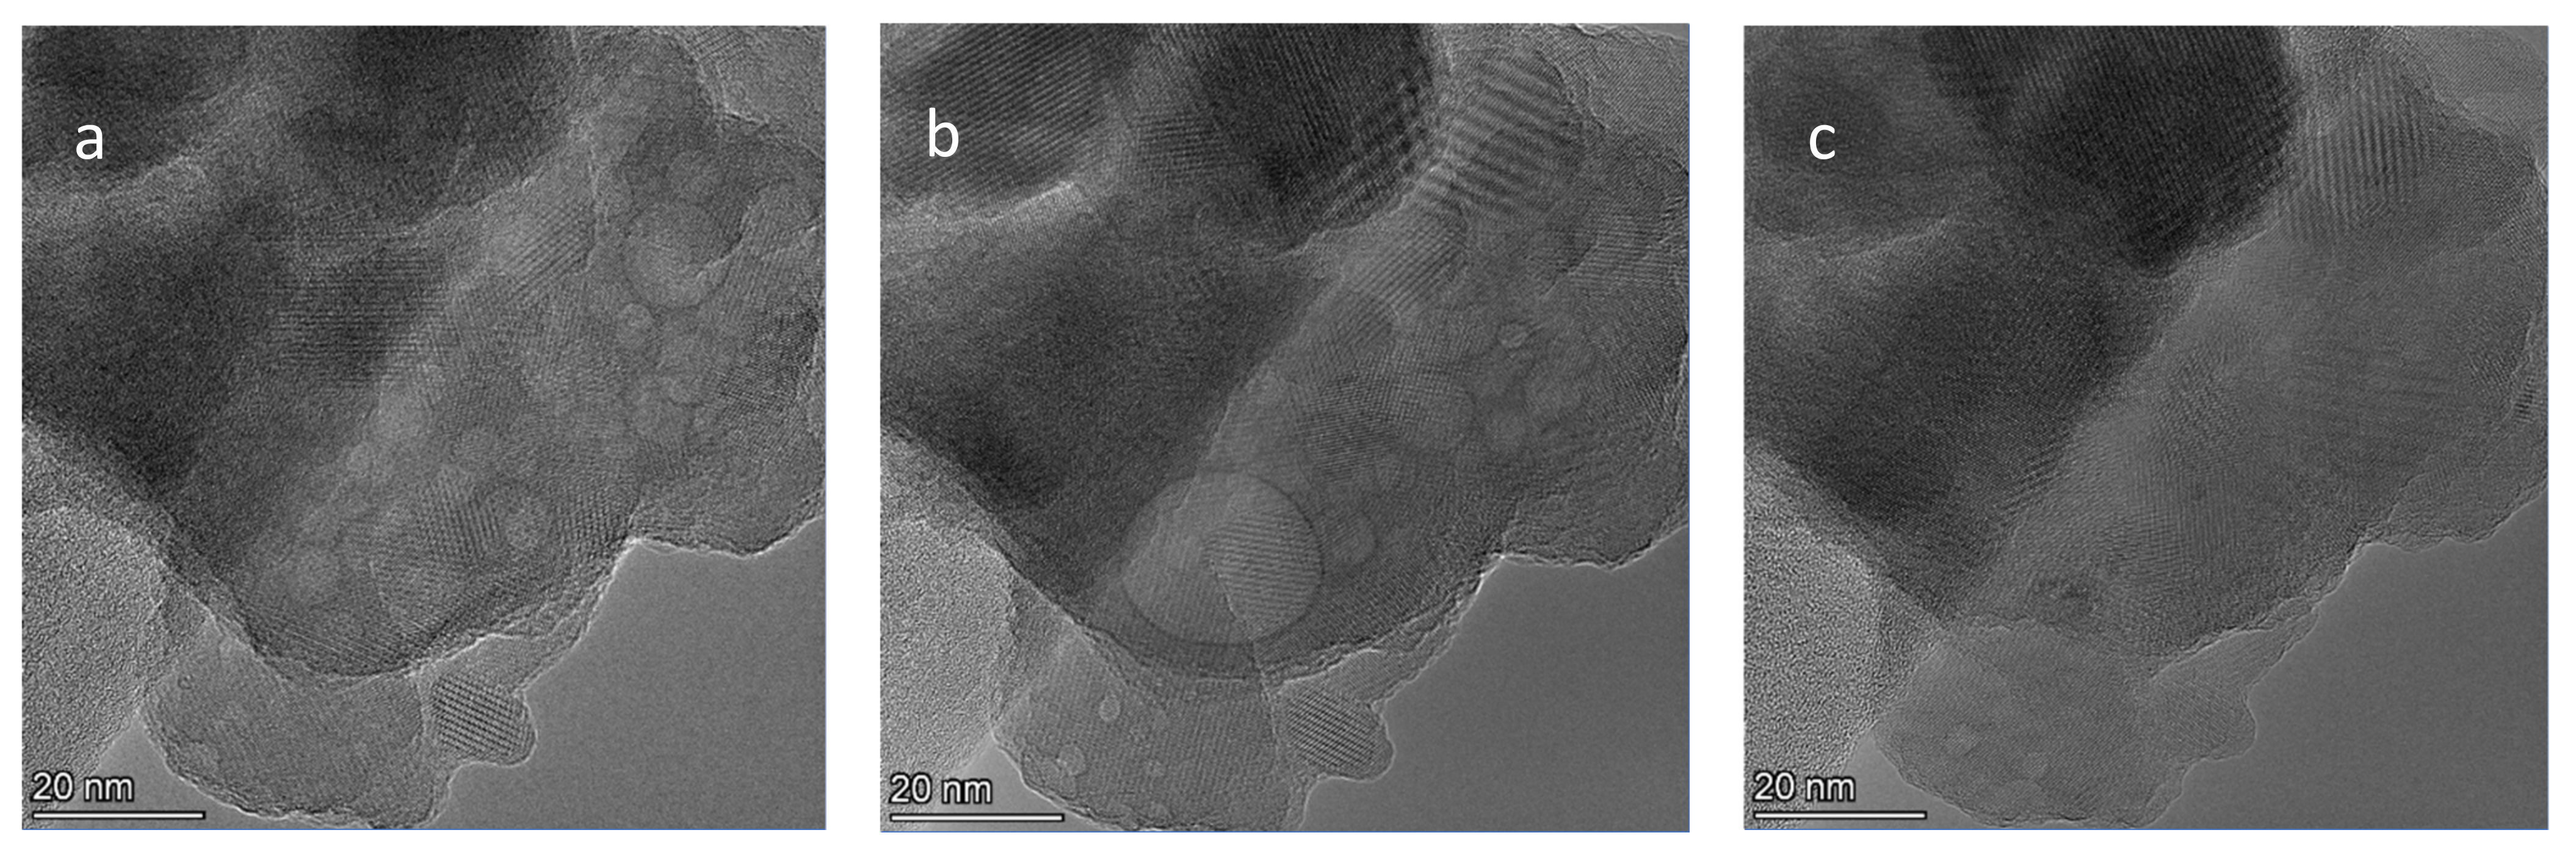
3.3. TEM
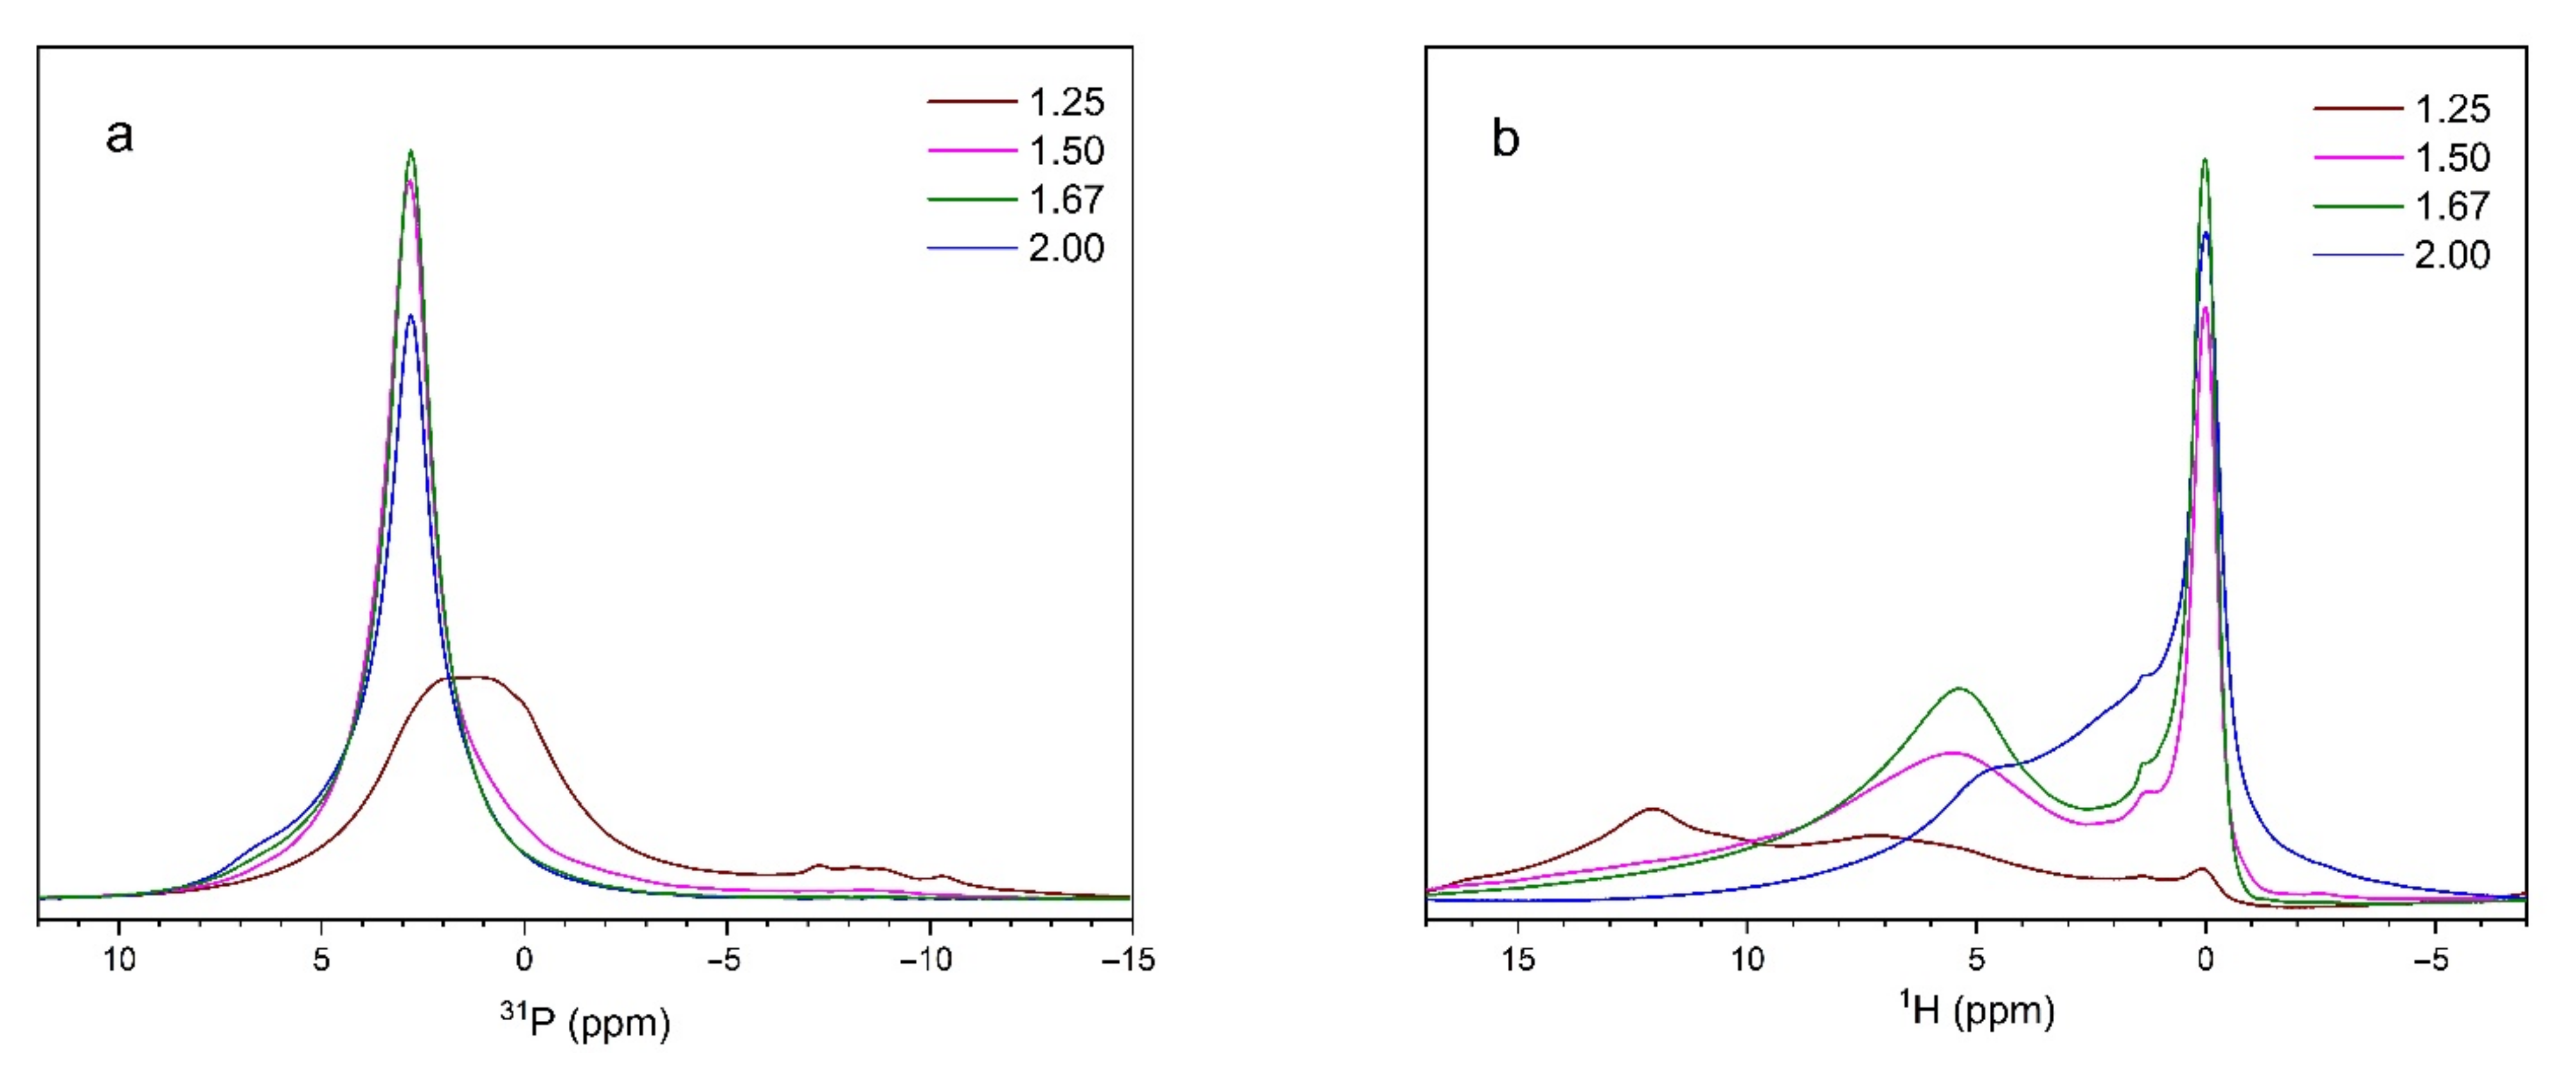
3.4. NMR
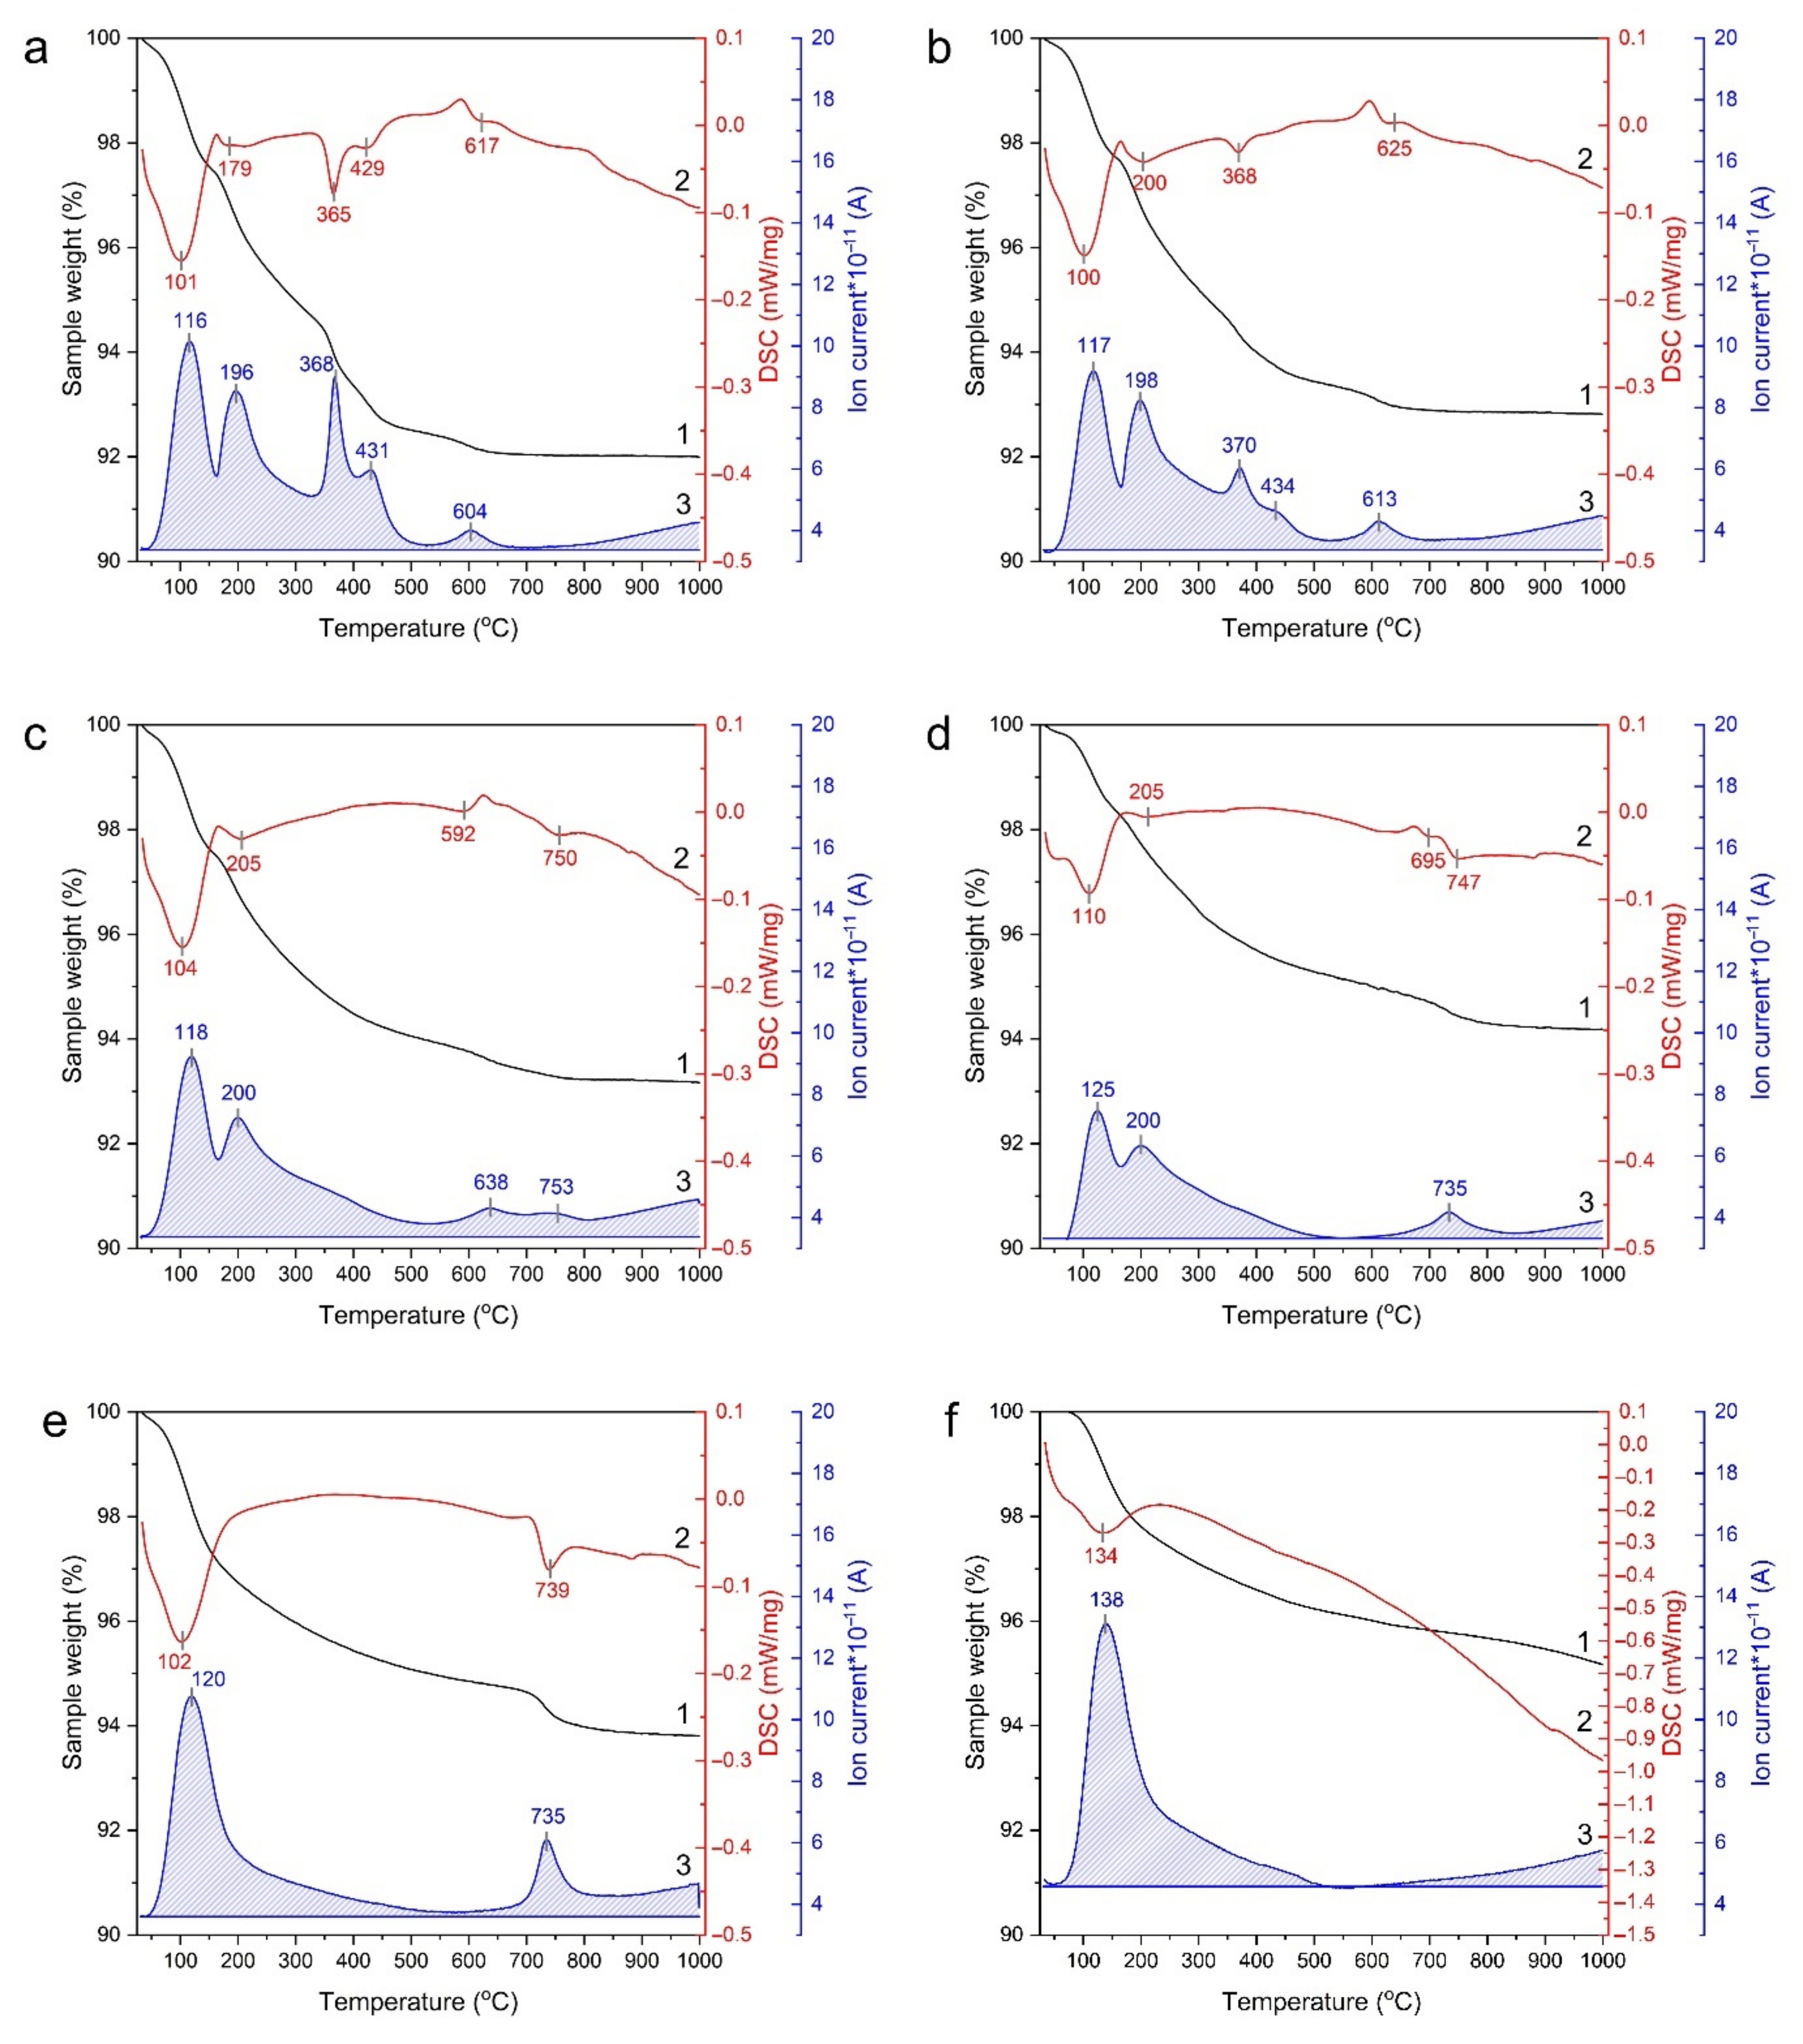
3.5. STA
4. Discussion
4.1. Range Ca/P ≤ 1.25
4.2. Range 1.33 ≤ Ca/P ≤ 1.48
4.3. Range 1.50 ≤ Ca/P ≤ 1.60
4.4. Range 1.67 ≤ Ca/P < 1.90
4.5. Range Ca/P > 1.90
5. Conclusions
Supplementary Materials
Author Contributions
Funding
Institutional Review Board Statement
Informed Consent Statement
Data Availability Statement
Acknowledgments
Conflicts of Interest
References
- Elliott, J.C. Structure and Chemistry of Apatite and Other Calcium Orthophosphates; Studies in Inorganic Chemistry; Elsevier: Amsterdam, The Netherlands, 1994; pp. 1–404. ISBN 0-444-81582-1. [Google Scholar]
- Pataquiva-Mateus, A.Y.; Ferraz, M.P.; Monteiro, F.J. Nanoparticles of hydroxyapatite: Preparation, characterization and cellular approach—An Overview. Mutis 2013, 3, 43–57. [Google Scholar] [CrossRef] [Green Version]
- Ptáček, P. (Ed.) Synthetic Phase with the Structure of Apatite. In Chemistry: Apatites and their Synthetic Analogues—Synthesis, Structure, Properties and Applications; InTech: Rijeka, Croatia, 2016; pp. 177–244. ISBN 978-953-51-2265-4. [Google Scholar] [CrossRef] [Green Version]
- Turon, P.; del Valle, L.J.; Alemán, C.; Puiggalí, J. Biodegradable and Biocompatible Systems Based on Hydroxyapatite Nanoparticles. Appl. Sci. 2017, 7, 60. [Google Scholar] [CrossRef] [Green Version]
- Suchanek, W.; Yoshimura, M. Processing and properties of hydroxyapatite-based biomaterials for use as hard tissue replacement implants. J. Mater. Res. 1998, 13, 94–117. [Google Scholar] [CrossRef]
- Liu, Q.; Huang, S.; Matinlinna, J.P.; Chen, Z.; Pan, H. Insight into Biological Apatite: Physiochemical Properties and Preparation Approaches. BioMed Res. Int. 2013, 2013, 929748. [Google Scholar] [CrossRef] [PubMed] [Green Version]
- Combes, C.; Rey, C. Amorphous calcium phosphates: Synthesis, properties and uses in biomaterials. Acta Biomater. 2010, 6, 3362–3378. [Google Scholar] [CrossRef] [PubMed] [Green Version]
- Dorozhkin, S.V. Calcium orthophospates (CaPO4): Occurrence and properties. Prog. Biomater. 2016, 5, 9–70. [Google Scholar] [CrossRef] [PubMed] [Green Version]
- Mucalo, M. Hydroxyapatite (HAp) for Biomedical Applications; Woodhead Publishing Limited: Waltham, MA, USA, 2015; pp. 1–364. ISBN 978-1-78242-033-0. [Google Scholar] [CrossRef]
- Kenny, S.M.; Buggy, M. Bone cements and fillers: A review. J. Mater. Sci. Mater. Med. 2003, 14, 923–938. [Google Scholar] [CrossRef]
- Gibson, I.R.; Rehman, I.; Best, S.M.; Bonfield, W. Characterization of the transformation from calcium-deficient apatite to β-tricalcium phosphate. J. Mater. Sci. Mater. Med. 2000, 11, 799–804. [Google Scholar] [CrossRef]
- Ghosh, R.; Sarkar, R. Synthesis and characterization of sintered beta-tricalcium phosphate: A comparative study on the effect of preparation route. Mater. Sci. Eng. C 2016, 67, 345–352. [Google Scholar] [CrossRef]
- Brown, W.E.; Eidelman, N.; Tomazic, B. Octacalcium phosphate as a precursor in biomineral formation. Adv. Dent. Res. 1987, 1, 306–313. [Google Scholar] [CrossRef]
- Tung, M.S.; Brown, W.E. The role of octacalcium phosphate in subcutaneous heterotopic calcification. Calcif. Tissue Int. 1985, 37, 329–331. [Google Scholar] [CrossRef]
- Vallet-Regi, M.; Navarrete, D.A. (Eds.) Biological Apatites in Bone and Teeth. In Nanoceramics in Clinical Use: From Materials to Applications, 2nd ed.; Royal Society of Chemistry: London, UK, 2015; pp. 1–29. ISBN 978-1-78262-255-0. [Google Scholar] [CrossRef]
- Massit, A.; El Yacoubi, A.; Rezzouk, A.; El Idrissi, B.C. Thermal Behavior of Mg-Doped Calcium-Deficient Apatite and Stabilization of beta Tricalcium Phosphate. Biointerface Res. Appl. Chem. 2020, 10, 6837–6845. [Google Scholar] [CrossRef]
- Nakahira, A.; Nakata, K.; Numako, C.; Murata, H.; Matsunaga, K. Synthesis and Evaluation of Calcium-Deficient Hydroxyapatite with SiO2. Mater. Sci. Appl. 2011, 2, 1194–1198. [Google Scholar] [CrossRef] [Green Version]
- Andrés-Vergés, M.; Fern, C.; Martínez-Gallego, M.; Solier, J.D.; Cachadiña, I.; Matijević, E. A new route for the synthesis of calcium-deficient hydroxyapatites with low Ca/P ratio: Both spectroscopic and electric characterization. J. Mater. Res. 2000, 15, 2526–2533. [Google Scholar] [CrossRef]
- Ergun, C.; Evis, Z.; Webster, T.J.; Sahin, F.C. Synthesis and microstructural characterization of nano-size calcium phosphates with different stoichiometry. Ceram. Int. 2010, 37, 971–977. [Google Scholar] [CrossRef]
- Bonel, G.; Heughebaert, J.C.; Heughebaert, M.; Lacout, J.L.; Lebugle, A. Apatite calcium orthophosphates and related compounds for biomaterials preparation. Ann. N. Y. Acad. Sci. 1988, 523, 115–130. [Google Scholar] [CrossRef]
- Ansari, M.; Naghib, S.M.; Moztarzadeh, F.; Salati, A. Synthesis and characterization of hydroxyapatite calcium hydroxide for dental composites. Ceramucs-Silikáty 2011, 55, 123–126. [Google Scholar]
- Tamai, M.; Nakamura, M.; Isshiki, T.; Nishio, K.; Endoh, H.; Nakahira, A. A metastable phase in thermal decomposition of Ca-deficient hydroxyapatite. J. Mater. Sci. Mater. Med. 2003, 14, 617–622. [Google Scholar] [CrossRef]
- Chaikina, M.V.; Bulinaa, N.V.; Vinokurova, O.B.; Prosanov, I.Y.; Dudina, D.V. Interaction of calcium phosphates with calcium oxide or calcium hydroxide during the “soft” mechanochemical synthesis of hydroxyapatite. Ceram. Int. 2019, 45, 16927–16933. [Google Scholar] [CrossRef]
- Patent of Russian Federation; №975068; Bull. Inv.: Moscow, Russia, 1982; p. 43.
- Chaikina, M.V.; Bulina, N.V.; Vinokurova, O.B.; Prosanov, I.Y. Synthesis of Stoichiometric and Substituted β-Tricalciumphosphate using Mechanochemistry. Chem. Sustain. Dev. 2020, 28, 73–78. [Google Scholar] [CrossRef]
- Sakka, S.; Bouaziz, J.; Ben, F. Mechanical Properties of Biomaterials Based on Calcium Phosphates and Bioinert Oxides for Applications in Biomedicine. In Advances in Biomaterials Science and Biomedical Applications; Pignatello, R., Ed.; InTech: Rijeka, Croatia, 2013; pp. 23–50. ISBN 978-953-51-1051-4. [Google Scholar] [CrossRef] [Green Version]
- Trandafir, D.L.; Mirestean, C.; Turcu, R.V.F.; Frentiu, B.; Eniu, D.; Simon, S. Structural characterization of nanostructured hydroxyapatite–iron oxide composites. Ceram. Int. 2014, 40, 11071–11078. [Google Scholar] [CrossRef]
- Legrand, A.P.; Bresson, B.; Guidoin, R.; Famery, R. Mineralization followup with the use of NMR spectroscopy and others. J. Biomed. Mater. Res. 2002, 63, 390–395. [Google Scholar] [CrossRef]
- Boanini, E.; Gazzano, M.; Nervi, C.; Chierotti, M.R.; Rubini, K.; Gobetto, R.; Bigi, A. Strontium and Zinc Substitution in β-Tricalcium Phosphate: An X-ray Diffraction, Solid State NMR and ATR-FTIR Study. J. Funct. Biomater. 2019, 10, 20. [Google Scholar] [CrossRef] [PubMed] [Green Version]
- Yashima, M.; Sakai, A.; Kamiyama, T.; Hoshikawa, A. Crystal structure analysis of β-tricalcium phosphate Ca3(PO4)2 by neutron powder diffraction. J. Solid State Chem. 2003, 175, 272–277. [Google Scholar] [CrossRef]
- Konishi, T.; Yamashita, K.; Nagata, K.; Lim, P.N.; Thian, E.S.; Aizawa, M. Solid-state nuclear magnetic resonance study of setting mechanism of β-tricalcium phosphate-inositol phosphate composite cements. J. Phys. Mater. 2019, 2, 034007. [Google Scholar] [CrossRef]
- Jäger, C.; Welzel, T.; Meyer-Zaika, W.; Epple, M. A solid-state NMR investigation of the structure of nanocrystalline hydroxyapatite. Magn. Reson. Chem. 2006, 44, 573–580. [Google Scholar] [CrossRef] [PubMed]
- Mathew, R.; Gunawidjaja, P.N.; Izquierdo-Barba, I.; Jansson, K.; García, A.; Arcos, D.; Vallet-Regí, M.; Edén, M. Solid-State 31 P and 1 H NMR Investigations of Amorphous and Crystalline Calcium Phosphates Grown Biomimetically from a Mesoporous Bioactive Glass. J. Phys. Chem. C. 2011, 115, 20572–20582. [Google Scholar] [CrossRef] [PubMed]
- Tõnsuaadu, K.; Gross, K.A.; Plūduma, L.; Veiderma, M. A review on the thermal stability of calcium apatites. J. Therm. Anal. Calorim. 2012, 110, 647–659. [Google Scholar] [CrossRef]
- Calvo, C.; Gopal, R. The Crystal Structure of Whitlockite from the Palermo Quarry. Am. Mineral. 1975, 60, 120–133. [Google Scholar]
- Britvin, S.N.; Pakhomovskii, Y.A.; Bogdanova, A.N.; Skiba, V.I. Strontiowitlockite, Sr9Mg(PO3OH)(PO4)6, a new mineral species from the Kovdor deposit, Kola Peninsula, USSR. Can. Mineral. 1991, 29, 87–93. [Google Scholar]
- Kostiner, E.; Rea, J.R. The crystal structure of manganese-whitlockite, Ca18Mn2H2(PO4)14. Acta Crystallogr. Sect. B Struct. Crystallogr. Cryst. Chem. 1976, 32, 250–253. [Google Scholar] [CrossRef]
- Deyneko, D.V.; Aksenov, S.M.; Morozov, V.A.; Stefanovich, S.Y.; Dimitrova, O.V.; Barishnikova, O.V.; Lazoryak, B.I. A new hydrogen-containing whitlockitetype phosphate Ca9(Fe0.63Mg0.37)H0.37(PO4)7: Hydrothermal synthesis and structure. Z. Kristallographie-Cryst. Mater. 2014, 229, 823–830. [Google Scholar] [CrossRef]
- Destainville, A.; Champion, E.; Bernache-Assollant, D.; Laborde, E. Synthesis, characterization and thermal behavior of apatitic tricalcium phosphate. Mater. Chem. Phys. 2003, 80, 269–277. [Google Scholar] [CrossRef]
- Bohner, M.; Santoni, B.L.G.; Döbelin, N. β-tricalcium phosphate for bone substitution: Synthesis and properties. Acta Biomater. 2020, 113, 23–41. [Google Scholar] [CrossRef]
- Kwon, Y.S.; Gerasimov, K.B.; Yoon, S.K. Ball temperatures during mechanical alloying in planetary mills. J. Alloys Compd. 2002, 346, 276–281. [Google Scholar] [CrossRef]
- Boldyrev, V.V. Hydrothermal reactions under mechanochemical action. Powder Technol. 2002, 122, 247–254. [Google Scholar] [CrossRef]
- Bulina, N.V.; Chaikina, M.V.; Andreev, A.S.; Lapina, O.B.; Ishchenko, A.V.; Prosanov, I.Y.; Gerasimov, K.B.; Solovyov, L.A. Mechanochemical Synthesis of SiO44−-Substituted Hydroxyapatite, Part II—Reaction Mechanism, Structure, and Substitution Limit. Eur. J. Inorg. Chem. 2014, 2014, 4810–4825. [Google Scholar] [CrossRef]
- Christoffersen, J.; Christoffersen, M.R.; Kibalczyc, W.; Andersen, F.A. A contribution to the understanding of the formation of calcium phosphates. J. Cryst. Growth 1989, 94, 767–777. [Google Scholar] [CrossRef]


| Preset Ca/P Ratio | Composition of Initial Mixture | Possible Products of Synthesis |
|---|---|---|
| 1.17 | 6CaHPO4 + 1.02CaO | TCP, CaHPO4 |
| 1.20 | 6CaHPO4 + 1.19CaO | TCP, CaHPO4 |
| 1.21 | 6CaHPO4 + 1.23CaO | TCP, CaHPO4 |
| 1.25 | 6CaHPO4 + 1.50CaO | TCP, CaHPO4 |
| 1.33 | 6CaHPO4 + 2CaO + 3H2O | OCP |
| 1.38 | 6CaHPO4 + 2.28CaO | CDAp |
| 1.42 | 6CaHPO4 + 2.52CaO | CDAp |
| 1.45 | 6CaHPO4 + 2.70CaO | CDAp |
| 1.48 | 6CaHPO4 + 2.88CaO | CDAp |
| 1.50 | 6CaHPO4 + 3.00CaO | CDAp |
| 1.55 | 6CaHPO4 + 3.30CaO | CDAp |
| 1.60 | 6CaHPO4 + 3.60CaO | CDAp |
| 1.67 | 6CaHPO4 + 4.00CaO | OHAp |
| 1.70 | 6CaHPO4 + 4.20CaO | HAp, Ca(OH)2 |
| 1.80 | 6CaHPO4 + 4.80CaO | HAp, Ca(OH)2 |
| 1.90 | 6CaHPO4 + 5.40CaO | HAp, Ca(OH)2 |
| 2.00 | 6CaHPO4 + 6.00CaO | HAp, Ca(OH)2 |
| 2.10 | 6CaHPO4 + 6.60CaO | HAp, Ca(OH)2 |
| Ca/P | Concentration (wt.%) | Structural Data for HAp | Rwp | |||||||
|---|---|---|---|---|---|---|---|---|---|---|
| CaHPO4 | CaO | Ca(OH)2 | HAp | β-TCP | Amorphous Apatite | a (nm) | c (nm) | Crystallite Size (nm) | ||
| 1.17 | 32 | – | – | – | 51 | ~17 | 0.9504 | 0.6911 | 10 | 5.2 |
| 1.20 | 24 | – | – | – | 62 | ~14 | 0.9504 | 0.6911 | 14 | 5.5 |
| 1.21 | 19 | – | – | – | 63 | ~18 | 0.9504 | 0.6911 | 15 | 6.1 |
| 1.25 | 10 | – | – | 24 | 66 | – | 0.9504(4) | 0.6911(4) | 16.1(9) | 5.9 |
| 1.33 | – | – | – | 49 | 51 | – | 0.9474(2) | 0.6899(2) | 18.3(8) | 4.5 |
| 1.38 | – | – | – | 49 | 51 | – | 0.9468(2) | 0.6898(3) | 18.5(4) | 5.3 |
| 1.42 | – | – | – | 83 | 17 | – | 0.9462(2) | 0.6893(2) | 19.3(4) | 4.9 |
| 1.45 | – | – | – | 95 | 5 | – | 0.9458(2) | 0.6892(2) | 20.0(4) | 4.9 |
| 1.48 | – | – | – | 91 | 9 | – | 0.9455(2) | 0.6891(2) | 20.6(4) | 4.7 |
| 1.50 | – | – | – | 100 | – | – | 0.9453(2) | 0.6889(2) | 20.6(2) | 4.6 |
| 1.55 | – | – | – | 100 | – | – | 0.9448(2) | 0.68898 | 21.3(2) | 4.6 |
| 1.60 | – | – | – | 100 | – | – | 0.9444(2) | 0.6891(1) | 20.6(2) | 4.5 |
| 1.67 | – | – | – | 100 | – | – | 0.9439(1) | 0.6893(1) | 20.4(2) | 4.4 |
| 1.70 | – | – | – | 100 | – | – | 0.9436(1) | 0.6894(1) | 19.6(2) | 4.3 |
| 1.80 | – | – | – | 100 | – | – | 0.9432(1) | 0.6897(1) | 20.6(2) | 4.4 |
| 1.90 | – | – | – | 100 | – | – | 0.9430(1) | 0.6898(1) | 20.9(2) | 4.3 |
| 2.00 | – | 1 | – | 99 | – | – | 0.9429(1) | 0.6900(1) | 20.1(2) | 3.5 |
| 2.10 | – | 3 | 3 | 94 | – | – | 0.9430(2) | 0.6904(2) | 18.2(2) | 3.4 |
| Ca/P | PO43− | PO43− (HAp) | HPO42− | Q1− | |
|---|---|---|---|---|---|
| 1.25 | (ppm) | – | – | 1.20 | −7.99 |
| Width (Hz) | – | – | 823 | 670 | |
| Content | – | – | 0.89 | 0.11 | |
| 1.50 | (ppm) | – | 2.88 | – | −7.33 |
| Width (Hz) | – | 345 | – | 884 | |
| Content | – | 0.96 | – | 0.04 | |
| 1.67 | (ppm) | 4.81 | 2.85 | – | – |
| Width (Hz) | 566 | 273 | – | – | |
| Content | 0.11 | 0.89 | – | – | |
| 2.00 | (ppm) | 5.60 | 2.98 | – | – |
| Width (Hz) | 466 | 332 | – | – | |
| Content | 0.11 | 0.89 | – | – |
| Ca/P | HPO42− | HPO42− | H2O | H-Bonded OH− (HAp) | OH− (HAp) | |
|---|---|---|---|---|---|---|
| 1.25 | (ppm) | 16.0 | 12.26 | 6.98 | 1.28 | 0.08 |
| Width (Hz) | 1300 | 1550 | 3400 | 810 | 317 | |
| Content | 0.08 | 0.33 | 0.54 | 0.03 | 0.02 | |
| 1.50 | (ppm) | – | – | 5.14 | 1.35 | −0.06 |
| Width (Hz) | – | – | 2023 | 170 | 289 | |
| Content | – | – | 0.56 | 0.01 | 0.43 | |
| 1.67 | (ppm) | – | – | 5.59 | 0.99 | 0 |
| Width (Hz) | – | – | 2100 | 710 | 238 | |
| Content | – | – | 0.63 | 0.10 | 0.27 | |
| 2.00 | (ppm) | – | – | 4.50 | 1.63 | 0 |
| Width (Hz) | – | – | 1693 | 1153 | 351 | |
| Content | – | – | 0.30 | 0.32 | 0.37 |
| Ca/P | Concentration (wt%) | ||
|---|---|---|---|
| HAp | β-TCP | Ca2P2O7 | |
| 1.21 | – | 47 | 53 |
| 1.25 | – | 56 | 44 |
| 1.33 | – | 76 | 24 |
| 1.42 | – | 90 | 10 |
| 1.50 | 8 | 92 | – |
| 1.67 | 100 | – | – |
Publisher’s Note: MDPI stays neutral with regard to jurisdictional claims in published maps and institutional affiliations. |
© 2022 by the authors. Licensee MDPI, Basel, Switzerland. This article is an open access article distributed under the terms and conditions of the Creative Commons Attribution (CC BY) license (https://creativecommons.org/licenses/by/4.0/).
Share and Cite
Chaikina, M.V.; Bulina, N.V.; Vinokurova, O.B.; Gerasimov, K.B.; Prosanov, I.Y.; Kompankov, N.B.; Lapina, O.B.; Papulovskiy, E.S.; Ishchenko, A.V.; Makarova, S.V. Possibilities of Mechanochemical Synthesis of Apatites with Different Ca/P Ratios. Ceramics 2022, 5, 404-422. https://doi.org/10.3390/ceramics5030031
Chaikina MV, Bulina NV, Vinokurova OB, Gerasimov KB, Prosanov IY, Kompankov NB, Lapina OB, Papulovskiy ES, Ishchenko AV, Makarova SV. Possibilities of Mechanochemical Synthesis of Apatites with Different Ca/P Ratios. Ceramics. 2022; 5(3):404-422. https://doi.org/10.3390/ceramics5030031
Chicago/Turabian StyleChaikina, Marina V., Natalia V. Bulina, Olga B. Vinokurova, Konstantin B. Gerasimov, Igor Yu. Prosanov, Nikolay B. Kompankov, Olga B. Lapina, Evgeniy S. Papulovskiy, Arcady V. Ishchenko, and Svetlana V. Makarova. 2022. "Possibilities of Mechanochemical Synthesis of Apatites with Different Ca/P Ratios" Ceramics 5, no. 3: 404-422. https://doi.org/10.3390/ceramics5030031
APA StyleChaikina, M. V., Bulina, N. V., Vinokurova, O. B., Gerasimov, K. B., Prosanov, I. Y., Kompankov, N. B., Lapina, O. B., Papulovskiy, E. S., Ishchenko, A. V., & Makarova, S. V. (2022). Possibilities of Mechanochemical Synthesis of Apatites with Different Ca/P Ratios. Ceramics, 5(3), 404-422. https://doi.org/10.3390/ceramics5030031