Article

Structural Modification of Jackfruit Leaf Protein Concentrate by Enzymatic Hydrolysis and Their Effect on the Emulsifier Properties

by
Carolina Calderón-Chiu
1,
Montserrat Calderón-Santoyo
1,
Julio César Barros-Castillo
1,
José Alfredo Díaz
2 and
Juan Arturo Ragazzo-Sánchez
1,*
1
Laboratorio Integral de Investigación en Alimentos, Tecnológico Nacional de México/Instituto Tecnológico de Tepic, Av. Tecnológico #2595, Colonia Lagos del Country, Tepic C.P. 63175, Nayarit, Mexico
2
Departamento de Química Física e Inorgánica, Facultad de Ciencias Naturales y Matemáticas, Ciudad Universitaria, Escuela de Química, Universidad de El Salvador, San Salvador C.P. 01101, El Salvador
*
Author to whom correspondence should be addressed.
Colloids Interfaces 2022, 6(4), 52; https://doi.org/10.3390/colloids6040052
Submission received: 24 August 2022 / Revised: 21 September 2022 / Accepted: 21 September 2022 / Published: 28 September 2022
(This article belongs to the Special Issue Recent Advances in Emulsions and Applications)

Abstract

:
Jackfruit leaf protein concentrate (LPC) was hydrolyzed by pepsin (H–Pep) and pancreatin (H–Pan) at different hydrolysis times (30–240 min). The effect of the enzyme type and hydrolysis time of the LPC on the amino acid composition, structure, and thermal properties and its relationship with the formation of O/W emulsions were investigated. The highest release of amino acids (AA) occurred at 240 min for both enzymes. H–Pan showed the greatest content of essential and hydrophobic amino acids. Low β-sheet fractions and high β-turn contents had a greater influence on the emulsifier properties. In H–Pep, the β-sheet fraction increased, while in H–Pan it decreased as a function of hydrolysis time. The temperatures of glass transition and decomposition were highest in H–Pep due to the high content of β-sheets. The stabilized emulsions with H–Pan (180 min of hydrolysis) showed homogeneous distributions and smaller particle sizes. The changes in the secondary structure and AA composition of the protein hydrolysates by the effect of enzyme type and hydrolysis time influenced the emulsifying properties. However, further research is needed to explore the use of H–Pan as an alternative to conventional emulsifiers or ingredients in functional foods.

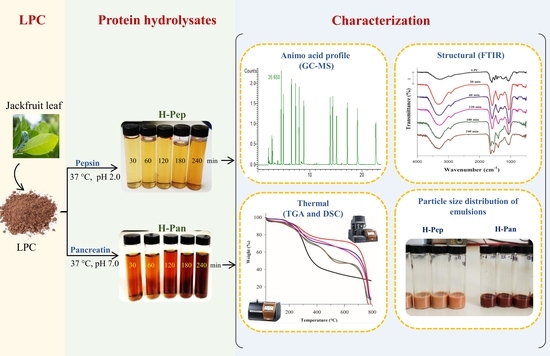
Graphical Abstract

1. Introduction

Oil-in-water (O/W) emulsions are widely used in the food, pharmaceutical, and cosmetic industries [1]. They are commonly stabilized by proteins such as whey protein, casein, soy, egg white proteins, gelatin, bovine serum albumin, collagen, etc., which are of animal origin [2,3]. However, the high cost and the negative environmental impacts of animal protein production are opening new opportunities for the exploration of alternative proteins from nonconventional sources [4,5]. Plant proteins are a green trend that could be applied in the pharmaceutical, cosmetic, and food industries [6]. The partial or total replacement of animal proteins for new plant proteins obtained from food by-products has been driven by the assurance of sustainability in food production, which is due to the lower CO2 emission associated with their primary production [4,7,8].
In that sense, the exploration of the emulsifying properties of proteins is one of the most interesting areas of current research, as it focuses on the identification of proteins of plant origin and their hydrolysates as possible emulsifiers [9]. For this reason, studies on protein hydrolysates with emulsifying properties from plant proteins such as chickpea [10,11], fava bean [12], rice bran [13], and navy bean [14], among others, have increased. These protein hydrolysates have shown a higher rate of diffusion into the oil/water interface and greater coverage at the interface than the native protein. Hence, they could be a suitable alternative to animal proteins and be used as emulsifiers.
Recently, the LPC (leaf protein concentrate) obtained from the leaves (generated during the pruning) of jackfruit (Artocarpus heterophyllus L.) trees in Nayarit, México, was considered an alternative source of protein (65.82% in d.b.) with potential for food applications. However, the low solubility of LPC (~15% at pH 8.0) limits its application as an emulsifier in food formulations. Thus, to expand the application of LPC as a functional ingredient, LPC was modified by enzymatic hydrolysis with pepsin and pancreatin [15,16].
Similarly, protein hydrolysates of LPCs have been obtained with Flavourzyme, Protamex, Neutrase, Alcalase, Trypsin, and Chymotrypsin [16,17]. However, these protein hydrolysates have been evaluated for their biological activities such as their antioxidant, antidiabetic, antihypertensive, and antimicrobial activities. Nonetheless, the study of the functional properties of leaf protein hydrolysates such as emulsifying properties has been little explored. In a previous study [15], the ability to produce functional protein hydrolysates from jackfruit LPC with pepsin (H–Pep) and pancreatin (H–Pan) at different hydrolysis times was evaluated. The H–Pep and H–Pan showed functional properties such as solubility, foaming, and emulsifying properties, and antioxidant properties significantly improved concerning the LPC, which demonstrates its dual functionality.
The improvement in functional and antioxidant properties is due to enzymatic hydrolysis. The enzymatic hydrolysis has been used to improve the functionality of plant protein in a safe, simple, and relatively inexpensive way [12]. The breakdown of peptide bonds during the hydrolysis of LPC causes an increase in the number of free amino and carboxyl groups, exposes hydrophobic patches hidden inside the protein structure, and releases short-chain peptides [5]. This results in the release of soluble peptides and the removal of antinutritional factors while improving the antioxidant activity, solubility, and adsorption at the O/W interface [18]. Besides the intrinsic changes in the primary structure of the protein, the reduction in the protein chain due to enzymatic hydrolysis also affects the secondary structure. The modification of the secondary structure produces changes in the hydrophilicity, hydrophobicity, and structural stability of the protein, which are related to functional properties such as emulsifying properties [19]. The above could indicate that the changes in amino acid composition, secondary structure, and thermal properties of jackfruit leaf protein hydrolysates by the effect of enzymatic hydrolysis influence the emulsifying properties.
Although the possible potential of jackfruit leaf protein hydrolysates as alternative emulsifiers has been demonstrated [15], the utilization of new protein sources from plants as emulsifiers requires a thorough investigation for application in foods. The elucidation of the structure–function relationship is a prerequisite for developing new food materials, which is critical for replacing conventional animal-based proteins with plant protein [20].Consequently, it is essential to know the structural and thermal properties of these hydrolysates, since this would allow them to be handled properly in such a way that they function correctly in a food system and improve their applicability [21].
Nevertheless, knowledge of the structure and thermal properties of LPC and protein hydrolysates from jackfruit leaf is still unidentified. Thus, this study aimed to evaluate the effect of the enzyme type and hydrolysis time of LPC on the amino acid profile, structural and thermal properties, and its relationship with the formation of oil-in-water (O/W) emulsions. Therefore, the determination of the amino acid profile by GC-MS and the characterization by FTIR, TGA, and DSC techniques of LPC and protein hydrolysates were carried out. Subsequently, the use of protein hydrolysates (0.5% w/v) from jackfruit leaf as an emulsifier was explored, to select the one with the best emulsifying capacity, which in successive studies can be used to formulate an emulsion with the desirable characteristics in the food industry.

2. Materials and Methods

2.1. Materials

The leaves of jackfruit were obtained from the “Tierras Grandes” orchard (Zacualpan, Compostela, Nayarit, Mexico) in February 2019. The leaves were washed and dried at 60 °C in a convective drying oven (Novatech, HS60-AID, Guadalajara, Jalisco, Mexico) for 24 h. Subsequently, they were ground (NutriBullet® SERIE 900, Los Angeles, CA, USA) and sieved (No. 100 mesh, 150 μm diameter). The flour (protein content of 24.06%) was packed in vacuum-sealed bags and stored at room temperature until use [15].

2.2. Chemical Substances

Pepsin (EC 3.4.23.1), pancreatin (EC 232-468-9), amino acid standards (AA-S-18), L-Norleucine (Nor), N-tert-Butyldimethylsilyl-N-methyltrifluoroacetamide (MTBSTFA), and other chemicals used in the experiments of GS-MS (highest purity available) were purchased from Sigma-Aldrich (St. Louis, MO, USA). Sodium hydroxide (NaOH) and hydrochloric acid (HCl) were of analytical grade purchased from Thermo Fisher Scientific Inc. (Waltham, MA, USA).

2.3. Extraction and Hydrolysis of the LPC of Jackfruit

The extraction and hydrolysis of the LPC were carried out following that described by Calderón-Chiu et al. [15]. For extraction, the leaf flour (30 g) was mixed with distilled water (563 mL) and 0.2 M NaOH (188 mL). The mixture was placed in the high hydrostatic pressure (HHP) equipment (Avure Technologies AB, Middletown, OH, USA) at 300 MPa for 20 min (25 °C). The mixture was centrifuged at 15,000× g for 20 min at 4 °C (Hermle Z 326 K, DEU). The supernatant was recovered and adjusted to pH 4.0 with 1 N HCl to precipitate proteins, which were recuperated by centrifugation. Finally, the precipitate was diafiltered through a 1 kDa membrane and lyophilized at −50 °C and 0.12 mbar in a freeze-dried (Labconco FreeZone 4.5, USA).
Subsequently, the LPC was hydrolyzed with pepsin and pancreatin for 30, 60, 120, 180, and 240 min. Briefly, the LPC was suspended in distilled water (1% w/v) and incubated in a shaking water bath (Shaking Hot Tubs 290200, Boekel Scientific, Feasterville-Trevose, PA, USA) at 37 °C, 115 rpm (30 min). Then, the pH solutions were adjusted to 2.0 (for pepsin) and 7.0 (for pancreatin) with 1 N HCl and NaOH, respectively. The enzyme: substrate ratio was 1:100 (w/w) and the pH was maintained with HCl or NaOH if necessary. The reaction was terminated by heating at 95 °C (15 min), followed by centrifugation at 10,000× g for 15 min at 4 °C (Hermle Z, 326 K, DEU), and the pH adjustment to 7.0 for both enzymes. The protein hydrolysates were filtered (0.45 μm) and freeze dried. Protein hydrolysates of pepsin (H–Pep) and pancreatin (H–Pan) at different hydrolysis times were obtained with DHs (degree of hydrolysis) from 1.78–3.44% and 6.12–9.21%, respectively [15].

2.4. Amino Acid Profile

The determination of the amino acids was carried out with the methodology described by Brion-Espinoza et al. [16]. Samples of flour, LPC, and hydrolysates were subjected to acid hydrolysis with 6 M HCl for 24 h at 110 °C. Then, the hydrolyzed samples were derivatized with MTBSTFA. Briefly, 100 µL of hydrolysate and 10 µL of Nor (internal standard, concentration 0.2 mg/mL) were evaporated under nitrogen gas to dry residue. The resulting precipitate was dissolved in 100 µL of acetonitrile and 100 µL of MTBSTFA. This solution was incubated at 100 °C for 2.5 h in a glycerol bath. The derivatization reaction was carried out into a 2 mL PTFE-lined screw-capped vial. For the L-amino acids standards mixture, the same procedure mentioned above was followed. Then, 1 µL of the test solution was injected into a gas chromatograph. The analysis of CG-MS was carried out using GC equipment 7890A (Agilent Technologies; Palo Alto, CA, USA) coupled with mass spectrometry (MS) 240 Ion Trap (Agilent Technologies; Palo Alto, CA, USA). The amino acid profile was reported as g of amino acid/100 g of protein. Cysteine, arginine, and tryptophan were not quantified.

2.5. Fourier Transform Infrared Spectroscopy

Infrared spectra were recorded using a spectrometer (Thermo Scientific, Nicolet iS5 FT-IR, USA) equipped with an iD7 ATR accessory with ZnSe crystal (4000–400 cm−1) at 25 °C. Automatic signals were collected in 16 scans at a resolution of 4 cm−1. Then, all spectra were corrected with a linear baseline using spectroscopy software Knowitall (v.8.2 Bio-Rad Inc., USA). Subsequently, interpretations of the changes in the overlapping amide I band (1600–1700 cm−1) and curve-fitting procedure (second-derivative analysis) to quantify the protein secondary structure was carried out using Peak-Fit software (v4.12, SPSS Inc., Chicago, IL, USA) Then, the relative contents of α-helix, β-Sheet, β-turn, and random coil were determined from the fitted peak areas [22].

2.6. Thermal Properties

Thermogravimetric analysis (TGA) and differential scanning calorimetry (DSC) of LPC and protein hydrolysates were performed [23]. For TGA (TGA 550 equipment, TA Instruments, New Castle, DE, USA), the lyophilized samples (3–5 mg) were heated from 25 to 800 °C at a heating rate of 10 °C/min under a nitrogen flow. The first decomposition stage in the TGA curve was assigned to moisture loss and the midpoint temperature of the second decomposition stage was assumed as the decomposition temperature (Tdec, [24]). As for the DSC (DSC 250 equipment, TA Instruments, New Castle, DE, USA), lyophilized samples (3–5 mg) were hermetically sealed in aluminum pans. Subsequently, they were heated from 0 to 300 °C at a heating rate of 10 °C/min under a nitrogen flow. An empty pan was used as a reference. Thermograms obtained by DSC and TGA were analyzed by the software TRIOS 5.0.0.44616. Then, the derivative thermogravimetric (DTG, obtained from the TGA curve), the glass transition (Tg) and decomposition (Tdec) temperatures, and denaturation enthalpy (Δh) were obtained.

2.7. Preparation of Emulsions with LPC and Protein Hydrolysates

To demonstrate the effect of the hydrolysis time and type of enzyme on the emulsifying properties of the hydrolysates, emulsions were formulated with the different hydrolysates and LPC at 0.5% (w/v). Then, particle size distribution was determined and related to the emulsifying activity index (EAI, m2/g) and emulsion stability index (ESI, min) of the protein hydrolysates previously evaluated [15]. Briefly, the emulsions were formulated as described by Zang et al. [13] with modifications. The aqueous phase was prepared by dissolving LPC or protein hydrolysates (0.5%, w/v) in distilled water at pH 7.0. The solution was stirred in a magnetic plate stirrer at 700 rpm for 2 h at room temperature, followed by centrifugation (Hermle Z, 326 K, Wehingen, Germany) at 2350× g for 30 min (25 °C). A homogenizer basic ultra turrax (IKA T10, IKA, Staufen, Germany) was used to obtain the pre-emulsion, which consisted of 10 wt% olive oil (oil phase) and 90 wt% LPC or protein hydrolysate solutions (aqueous phase). After mixing at 16,000 rpm for 2 min (ultra turrax), the pre-emulsion was processed by a Digital Sonifier® Unit (Model S-150D, Branson Ultrasonics Corporation, Danbury, CT, USA) at 24 kHz for 5 min and the particle size distribution was determined.
Subsequently, to investigate in more detail the emulsifying capacity of H–Pan (hydrolyzed with better emulsifying properties), emulsions were prepared and adjusted to pH 5.0, 7.0, and 9.0 to evaluate the effect of pH on the particle size distribution as an indication of the stability of the emulsion.

2.8. Particle Size Distribution of Emulsions

The emulsion particle size distribution was measured in a Mastersizer 3000 (Hydro EV, Malvern, Worcestershire, UK). In brief, the emulsion was added dropwise in the Hydro EV unit until a laser obscuration of 8–12% was obtained [23]. The emulsions were analyzed five successive times in the diffractometer at 25 °C. Then, the volume-weighted mean particle diameter (D [4,3]) and polydispersity index (PDI) were calculated automatically with the Mastersizer software (version 3.60, Worcestershire, UK). The refractive index was set as 1.46 for the dispersed phase (olive oil) and 1.33 for the dispersant (water).

2.9. Statistical Analysis

All the samples were analyzed by triplicate. The data were analyzed with a one-way analysis of variance (ANOVA), followed by the post-hoc LSD (Least Significant Difference) for the mean comparison (p < 0.05) with the Statistica v10.0 software (StatSoft, Inc., Tulsa, OK, USA).

3. Results and Discussion

3.1. Amino Acid Composition

The total amino acid (TAA), essential amino acids (EAA), and hydrophobic amino acids (HAA) of the LPC were higher (p < 0.05) than in the flour (Table 1). This behavior means that the extraction by HHP allowed an appropriate recovery of amino acids and could constitute a suitable method for obtaining the LPC of jackfruit. The LPC presented a high content of leucine, valine, alanine, isoleucine, aspartic acid, and glutamic acid. For protein hydrolysates, a gradual release of amino acids during the enzymatic process was observed. The protein hydrolysates showed a lower content of TAA, EAA, and HAA than the LPC (p < 0.05).H–Pan showed high levels of TAA, EAA, and HAA (p < 0.05). Previous studies by Calderón-Chiu et al. [15] showed that H–Pan (6.12–9.21%) presented a higher degree of hydrolysis (DH) than H–Pep (1.78–3.44%), which would explain the higher content of amino acids in H–Pan.
On the other hand, the highest release of amino acids occurred after 240 min of hydrolysis with both enzymes. The H–Pep was rich in leucine, valine, aspartic acid, alanine, and threonine, whereas H–Pan presented high amounts of proline, leucine, valine, isoleucine, and phenylalanine. Tyrosine was not detected in any protein hydrolysates. The absence of tyrosine in the hydrolysates may be due to its degradation during hydrolysis with 6 M HCL [25], which is necessary for amino acid determination. This behavior could be due to the low levels of tyrosine released during the enzymatic hydrolysis by both enzymes, which caused its loss in the samples during the treatment with HCL. Glycine was in very low concentrations or was not detected in some H–Pep. The differences in amino acid composition can be attributed to the type of enzyme used.
The content of the EAA of LPC, H–Pep, and H–Pan was lower than reported for the LPCs of amaranth, eggplant, and pumpkin [21], as well as for amaranth leaf protein hydrolysate [26]. These differences in amino acid content are attributed to the type of plant (species and age), and the environmental and cultivation conditions [27]. Moreover, amaranth leaf protein hydrolysates presented a higher DH than those reported in this study. However, the EAA such as isoleucine, leucine, threonine, valine, and phenylalanine of the LPC and protein hydrolysates obtained at the extended hydrolysis are at levels that are recommended in adults by the WHO/FAO [28]. This suggests that jackfruit LPC and those protein hydrolysates are good sources of high-quality protein and could be used to supplement foods with deficiencies in these amino acids. The composition of AA in protein hydrolysates could contribute to the functionality of LPCs and protein hydrolysates [21].

3.2. FTIR Spectra Analysis

The FTIR spectra of protein hydrolysates showed bands of greater intensity than the LPC (Figure 1A,B), which suggests that the LPC structure changed with the enzymatic hydrolysis. The IR spectral bands were assigned and described in Table 2. In general, the spectrum of LPC and hydrolysates showed bands between 3323–3241 cm−1 and 2917–2061 cm−1 corresponding to band amide A (stretching vibration of the NH bond coupled to the O–H stretching vibration of water during the hydrolysis [29]) and amide B (asymmetric stretching vibration of C−H that was found in the aliphatic side chain of proteins, [30]), respectively.
Compared with the LPC, the protein hydrolysates showed shifting in the peak position of the amide A and B bands (Table 2). The intensity of amide A and B were dependent on the hydrolysis time and enzyme used. The H–Pan showed a lower intensity in these bands (Figure 1) and the extended hydrolysis time caused the absence of signals in band amide B (Table 2). This behavior has been attributed to the destruction of hydrogen bonds of hydroxyl (–OH) groups during enzymatic hydrolysis, which reduced the density and strength of those bands [22]. The shifting to a higher wavenumber in amide B after hydrolysis by pancreatin (from 2923 cm−1 in LPC to 2925–2936 cm−1 in H–Pan, Table 2) can be due to the exposure of buried hydrophobic patches with more aliphatic side chains. This suggests that there was a greater exposure of buried hydrophobic patches in H–Pan as a function of time, which also coincides with the high level of HAA in these samples (Table 1). Similarly, the above could also explain the high DHs reported for these samples [15]. H–Pan (6.12–9.21%) showed higher DHs than H–Pep (1.78–3.44%), which would also explicate the apparent low intensity in the bands of H–Pan.
On the other hand, three characteristic protein bands at 1605.0, 1517.2, and 1235.2 cm−1 were observed in the LPC and are attributed to amide I (1600–1700 cm−1), amide II (1600–1500 cm−1), and amide III (1220–1300 cm−1), respectively [18]. After enzymatic hydrolysis, the amide I, II, and III regions of the protein hydrolysates shifted the peak positions to higher wavenumbers than the LPC (Table 2) and with less intensity in H–Pan. This could indicate greater structural changes due to hydrolysis with pancreatin. Additionally, at 1438.2 cm−1 a band was detected in the LPC and was assigned to CH2 bending vibration [31]. However, that band shifted the peak position to lower wavenumbers in the protein hydrolysates at 1395.3–1399.1 cm−1 for H–Pep and 1387.1–1388.9 cm−1 for H–Pan, which corresponds to the CH3 bending vibration. Additionally, signals at 1062.1–1069.3 cm−1, both for the LPC and hydrolysates, could correspond to the C−O group of α-anomer [31].
Subsequently, the amide I band region was divided into β-sheet (1610–1640 cm−1 and 1680-1695 cm−1), random coil (1640–1650 cm−1), α-helix (1650–1660 cm−1), and β-turn (1660–1700 cm−1) structures [32]. The results of the secondary structure fractions revealed that the LPC showed 4.49% of α-helix, 56.24% of β-sheet, 38.24% of β-turn, and 1.02% random coil (Figure 1). These fractions were different from those reported in the LPC of Diplazium esculentum, which presented a high content of α-helix (69.16%) and β-turn (35.68%) and a low β-sheet (17.02%, [31]). The differences between these two LPCs could be attributed to the composition of the matrices studied and to the conditions of extraction.
The protein hydrolysates showed a increase in the contents of α-helix (from 4.76–13%) and random coil (from 1.02–6.20%) in comparison to the LPC. In H–Pep (Figure 1C), the β-sheet fraction showed a considerable increase during the enzymatic hydrolysis (from 56.24–75.74). However, the β-turn decreased (from 38.24–15.38%) considerably with a possible rearrangement to α–helical and random coil structures as a function of hydrolysis time. Meanwhile, in H–Pan (Figure 1D), the decrease in the β-sheet from 56.24–47.55% was observed with an apparent rearrangement to α-helical (0.14–9.13%), β-turn (38.24–40.94%), and random coil (0–4.27%) fractions. The increase in these structures at the extended hydrolysis time was also a trend found in the protein hydrolysates of rice glutelin [33] and Cinnamomum camphora seed kernel [34].
The β-sheet is a structure present in the internal parts of the folded protein, maintaining hydrophobic amino acids. Then, the unfolding of protein molecules during hydrolysis with pancreatin exposed buried hydrophobic residues, which caused the β-sheet structure to loosen and its proportions to reduce [22], releasing greater amounts of HAA as shown in Table 1. This might suggest that the β-sheet fraction was more opened by hydrolysis with pancreatin, whereas the β-turn fraction was more susceptible to hydrolysis with pepsin, which caused the reduction in this fraction in H–Pep. On the contrary, the β-turn fraction was increased in H–Pan, which agrees with the high contents of glycine and proline in these hydrolysates (Table 1), since it has been established that glycine and proline amino acid residues contribute to the formation of these fractions [35]. On the other side, the low content of β-sheets in H–Pan could describe the high solubility and DHs that were reported in previous studies [15]. This suggests that the changes in the secondary structure of the protein hydrolysates could affect the functionality of these hydrolysates.

3.3. Thermal Properties

3.3.1. Thermogravimetric Analysis

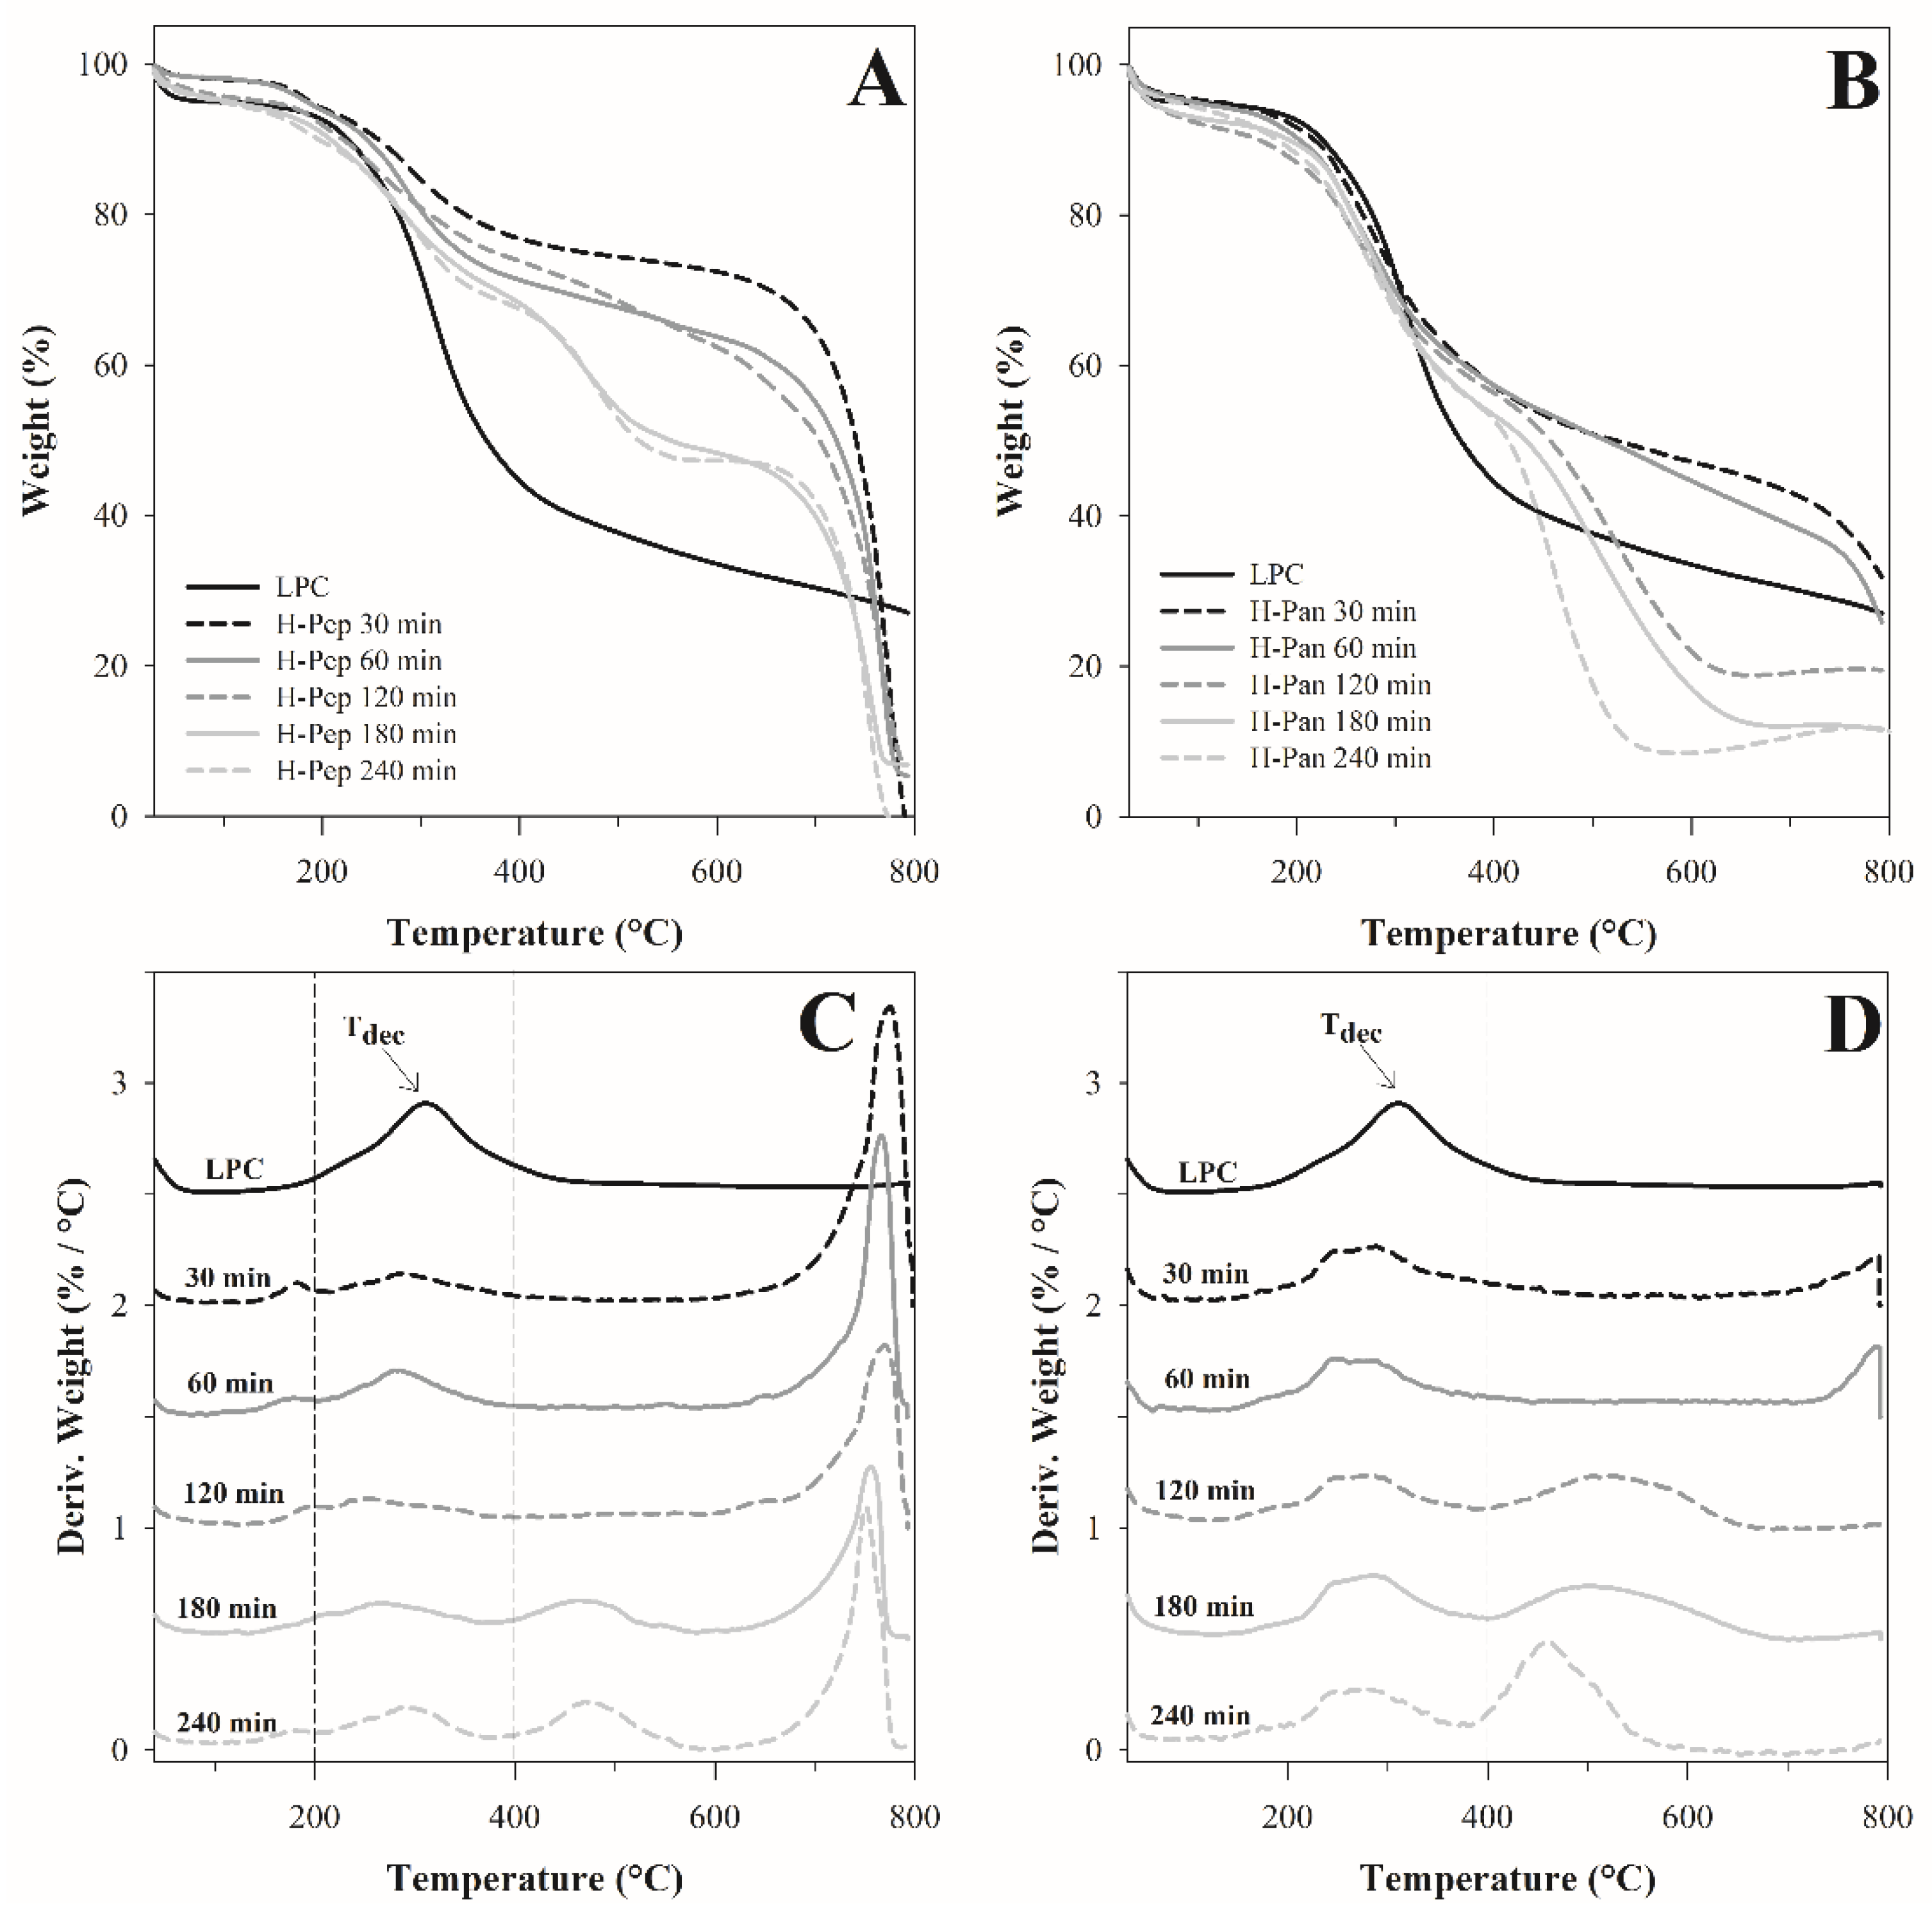
Curves of TGA and DTG of the LPC and protein hydrolysates obtained at different hydrolysis times showed that the thermal decomposition profiles of H–Pep (Figure 2A) and H–Pan (Figure 2B) were different from the LPC. The LPC showed two weight losses, while H–Pep (Figure 2C) showed three weight losses up to 120 min of hydrolysis. The extension of hydrolysis at 180 and 240 min showed four weight losses. On the contrary, in H–Pan (Figure 2D), only three weight losses were observed. In general, the LPC and hydrolysates showed a first weight loss (from 25–100 °C) attributed to the release of free water or water weakly bound to protein molecules [36].
The analysis of the decomposition stages of the LPC and its hydrolysates (Table 3) showed that the moisture content (stage I) in all samples ranged between 1.93–7.94%, with H–Pep being the samples with the (p < 0.05) lowest moisture content. The low moisture content indicates a lower hydrophilic character [24], which is consistent with the low solubility reported for H–Pep (19–41%) compared to H–Pan (60–98%, [15]). The second weight loss (stage II) of LPC was 61.6% and occurred between 252.4 and 370.4 °C, which coincides with the content of protein in LPC (65.8%) previously reported [15], indicating that this stage corresponds to the decomposition of protein in LPC. Meanwhile, in hydrolysates, the second weight loss started around 230.7 °C for H–Pep and at 218.5 °C for H–Pan, and these temperatures decreased significantly (p < 0.05) with the progress of hydrolysis (Table 3). The weight loss at this stage could be attributed to the volatilization of protein fragments that were generated during enzymatic hydrolysis [24].
The third weight loss started (stage III) around 736.5 °C for H–Pep-30 and decreased at 725.2 °C in H–Pep-120 (p < 0.05). Similarly in H–Pan-30, this stage of decomposition started at 746.53 °C and reduced at 763.5 °C (p < 0.05) in H–Pan-60 (Table 3). Subsequently, the increase in the hydrolysis time for both enzymes reduced (p < 0.05) the onset temperatures to around 439.1 for H–Pep-240 and 429.4 °C for H–Pan-240. Additionally, the H–Pep at 180 and 240 min of hydrolysis showed a fourth weight loss (stage IV), which began at 719.7 and 727.4 °C, respectively (Table 3). The additional weight loss steps could be the result of the slow decomposition of peptides (with different thermal stability) from the previous step since with increasing temperature complex decomposition reactions can occur [36]. Thus, this suggests that H–Pep presented larger protein fragments than H–Pan that were degraded more slowly, causing more decomposition stages. The reduction in the onset temperatures of the different stages as a function of time could indicate the reduction in the stability of the hydrolysates due to the increase in smaller peptides in the long hydrolysis time.
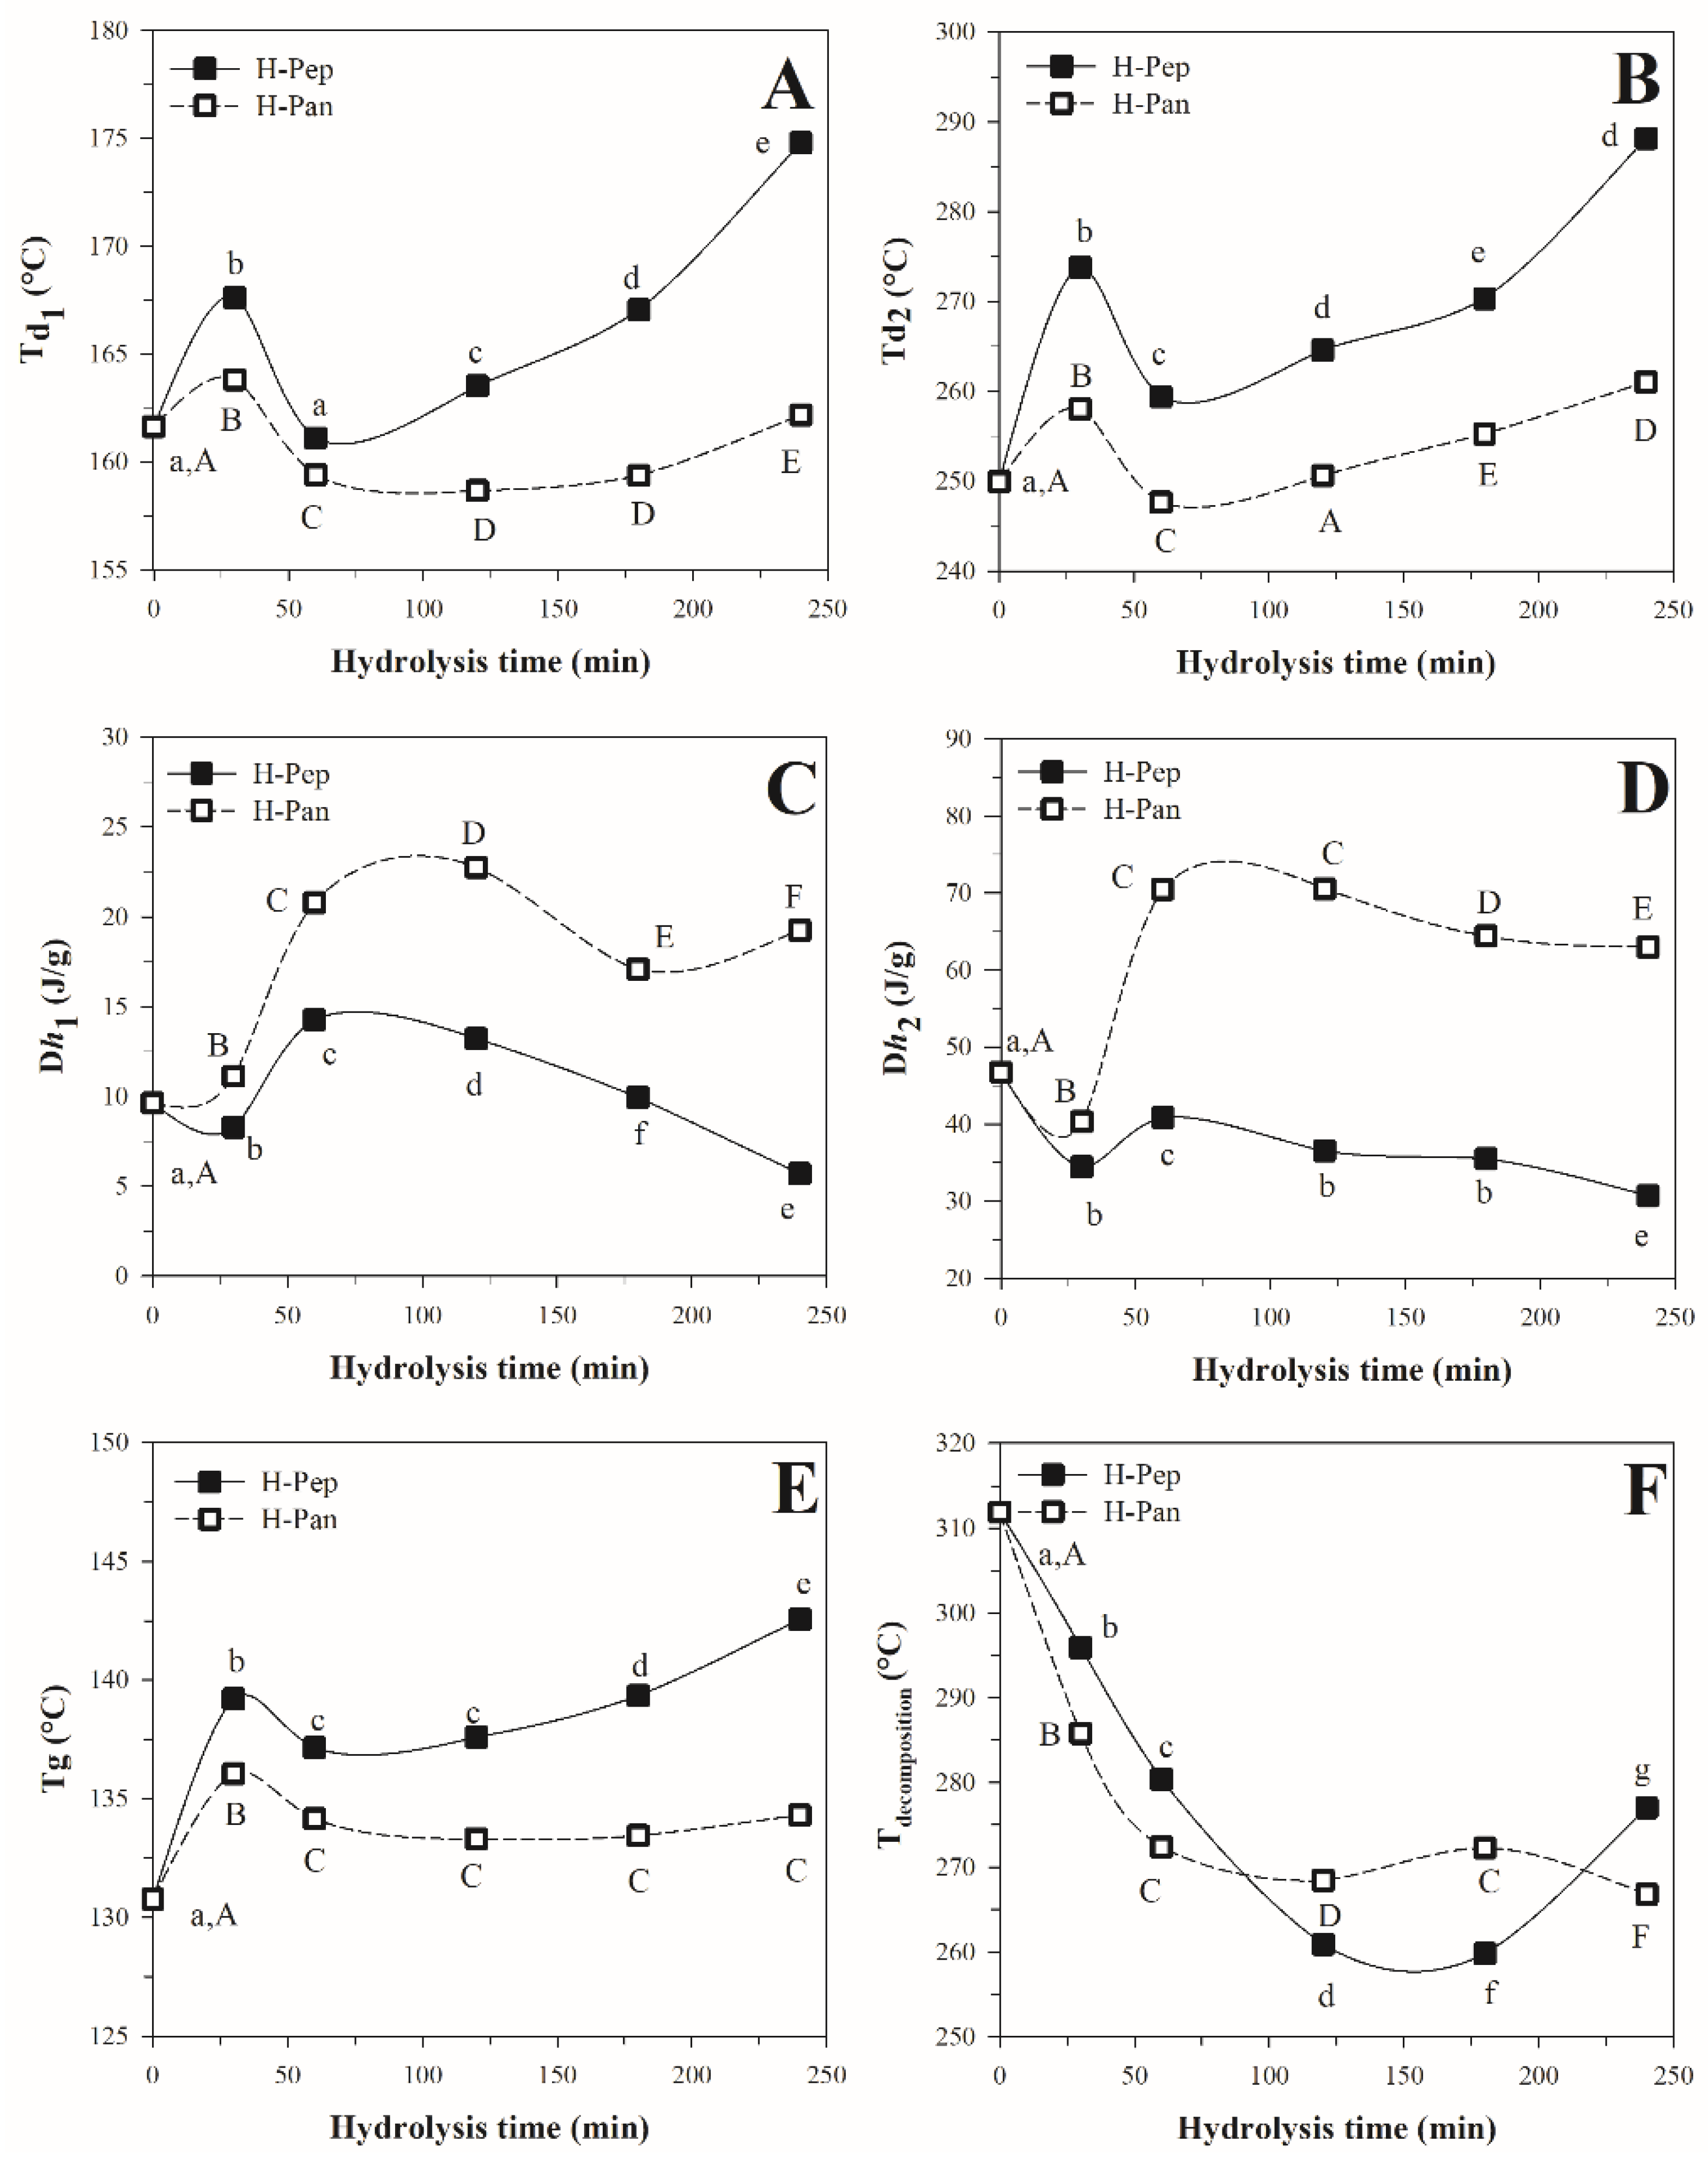
On the other hand, the decomposition temperature (Tdec) of the LPC (Figure 3F) was 311.9 °C. After hydrolysis, a decrease in Tdec was observed. Although the results of the Tdec of the protein hydrolysates showed certain variations, it could be said that apparently, H–Pep presents higher Tdec, which is probably caused by the high content of β-sheets in these samples, which gives it greater stability. The differences in the decomposition profiles and thermogravimetric curves of the protein hydrolysates were affected by enzymatic treatment, which caused changes in the protein structure and led to marked differences in the loss of absorbed water, stages of decomposition, weight loss, and residual materials.

3.3.2. Differential Scanning Calorimetry Analysis

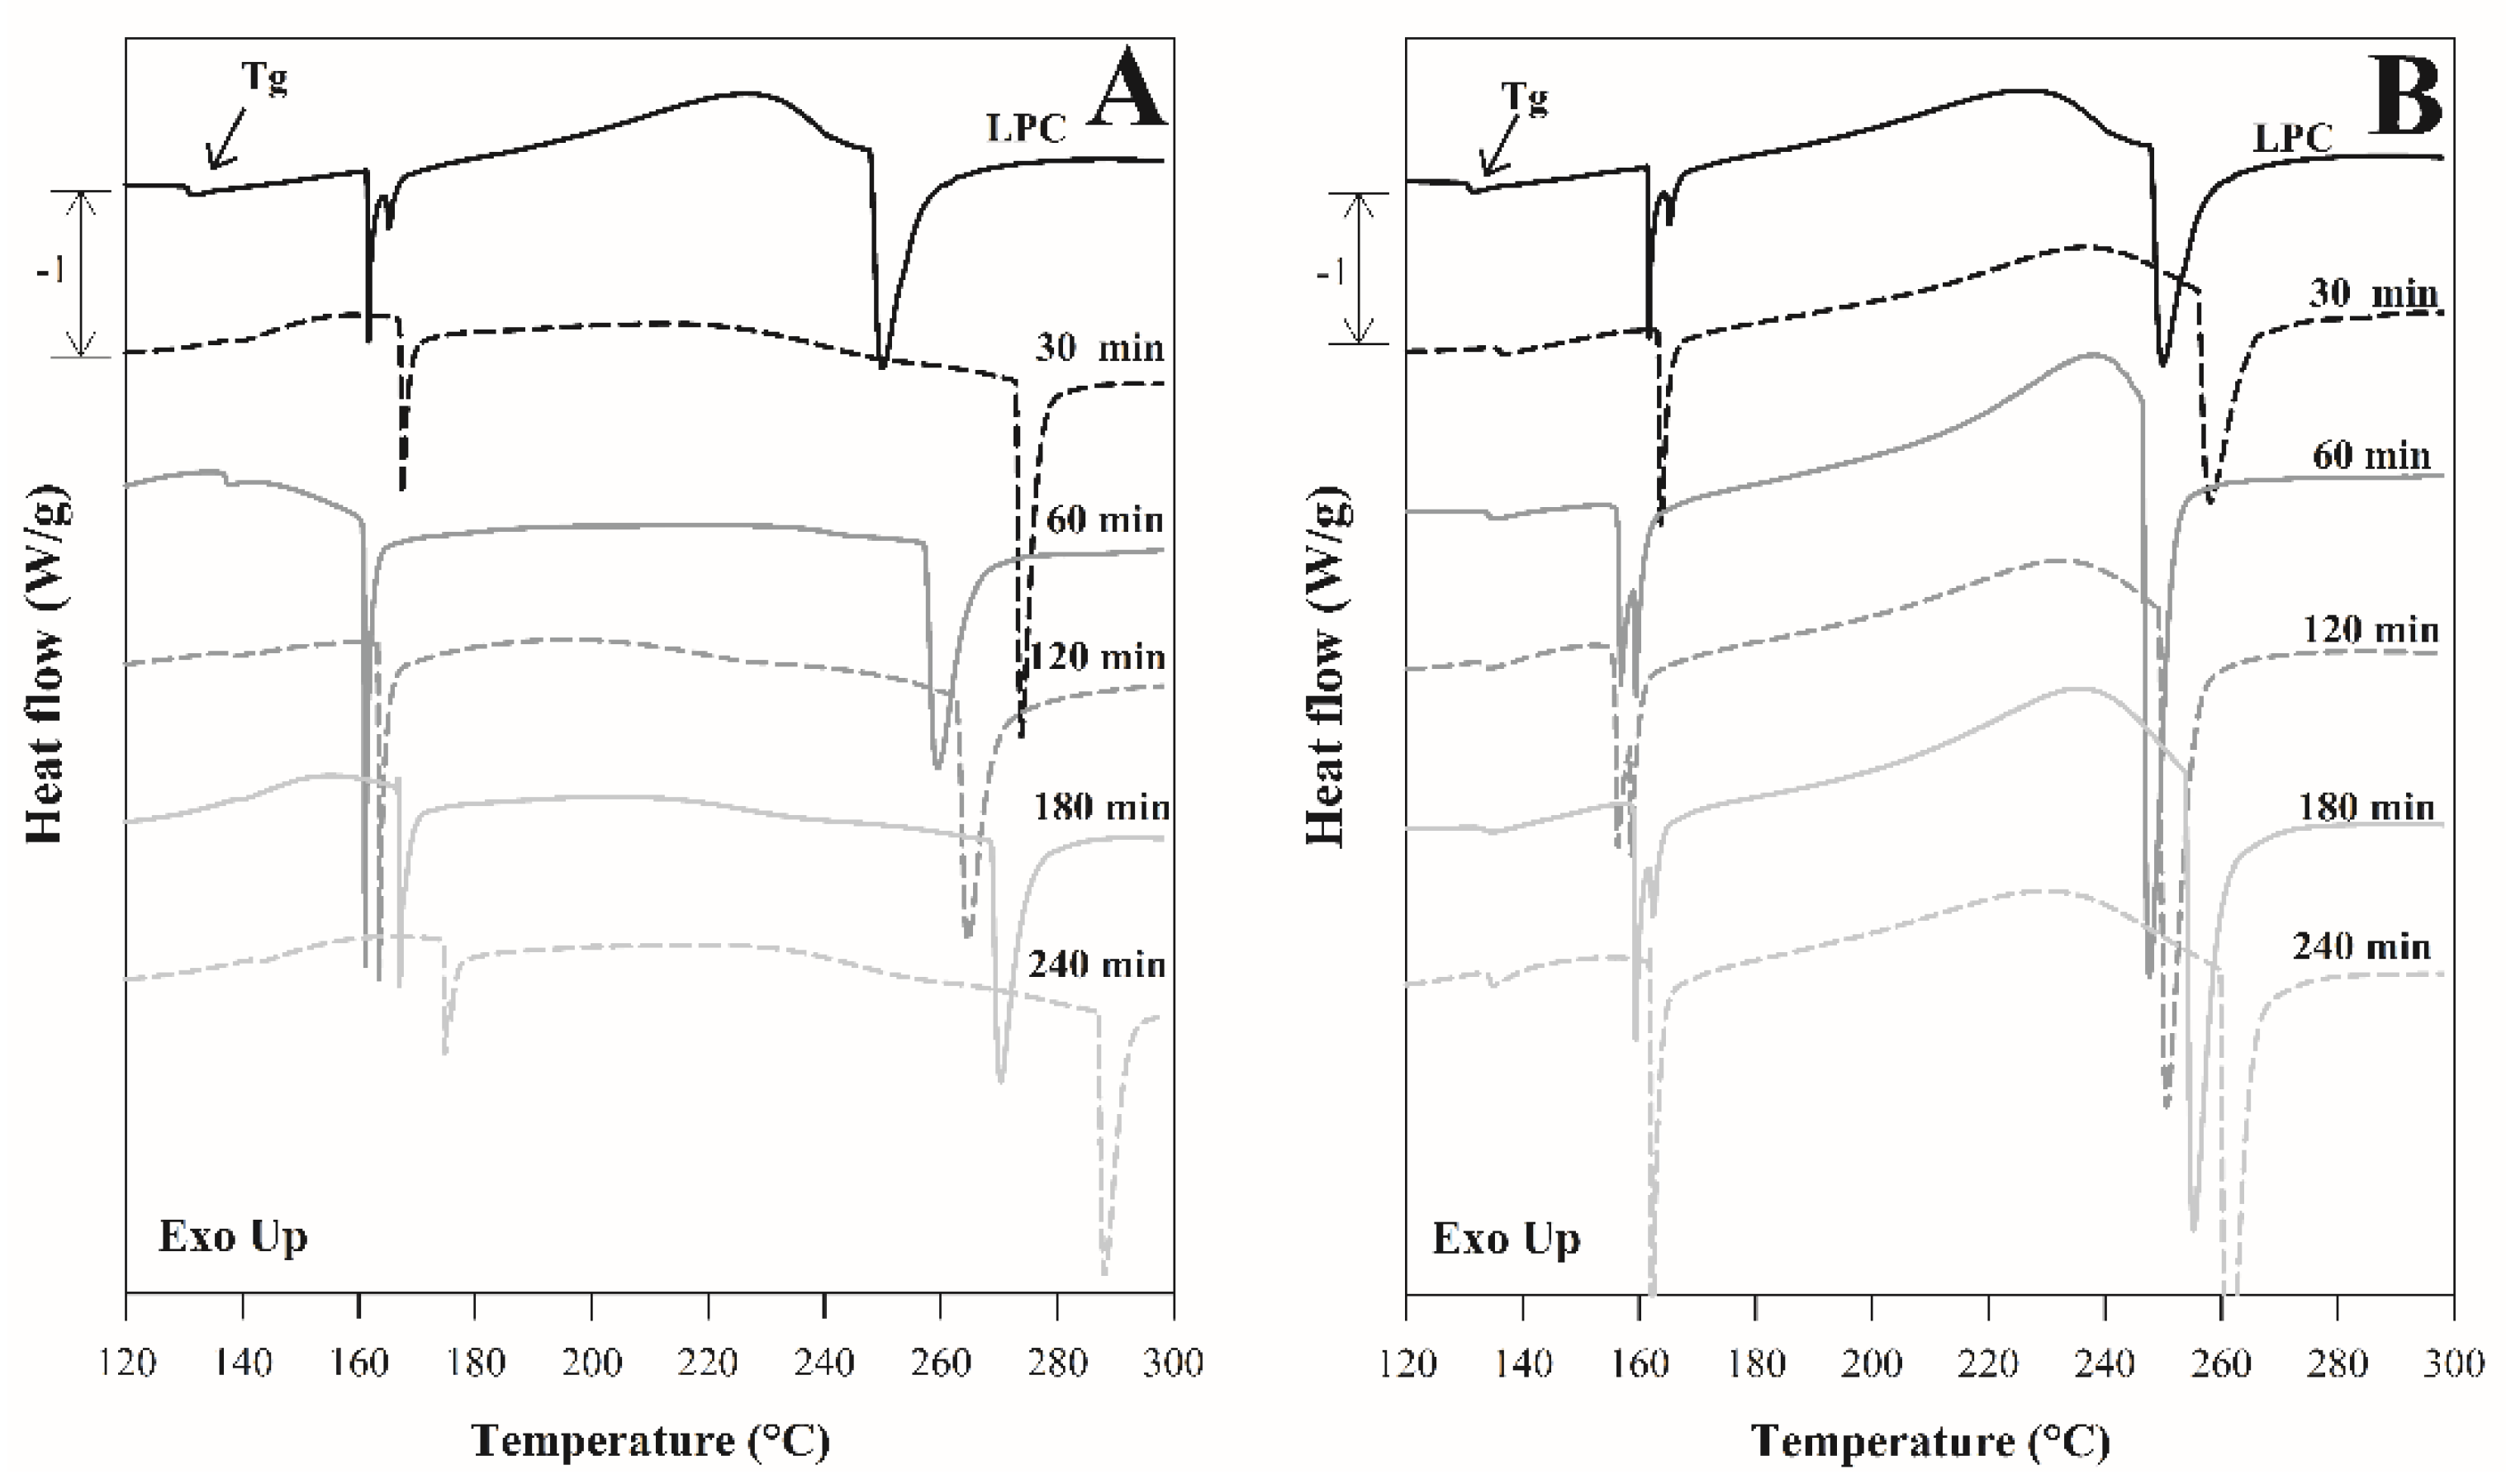
DSC provides information on the structural stability of a protein based on the endothermic and exothermic events [37]. The Δh represents the enthalpy changes that occur during the denaturation process and reflects the extent of the ordered secondary structure of a protein [38], while Td is a measurement of its thermal stability. After this temperature, irreversible changes occur in the structure of the protein. A higher Td value is associated with higher thermal stability [5]. Thermographs of LPC, H–Pep (Figure 4A), and H–Pan (Figure 4B) displayed two endothermic peaks. The presence of two peaks in the DSC profiles of proteins has been associated with the denaturation of major proteins that have different stability [39]. LPC of jackfruit shows majority fractions of glutenin (69.33%) and prolamin (17.34%). Therefore, these endothermic peaks could be attributed to the denaturation of these protein fractions, since when analyzed by DSC, they presented a profile similar to LPC [40].
The first endothermic peak in LPC had a Td1 and Δh1 of 161.6 °C and 9.6 J/g, respectively. The Td1 of protein hydrolysates increased considerably (p < 0.05) as a function of time (Figure 3A), in H–Pep from 167.6–174.8 °C and H–Pan from 163.8–162.2 °C. Regarding their Δh1, H–Pep (from 14.3–5.7 J/g) and H–Pan (from 20.8–19.3 J/g) showed a considerable increase in Δh1 in the first 60 min of hydrolysis concerning LPC (p < 0.05), which decreased as the enzymatic process progressed (Figure 4C). Concerning to second endothermic peak, the Td2 and Δh2 of the LPC were 249.9 °C and 46.7 J/g, respectively. Similar behavior of Td1 was observed in Td2 since an increased markedly as a function of hydrolysis time (p < 0.05) in H–Pep (from 273.8–288.2 °C) and H–Pan (from 258.0–261.0 °C) was observed (Figure 4B). In what refers to the Δh2 (Figure 4D), different behaviors were observed depending on the enzyme used. The Δh2 decreased considerably in H–Pep as a function of hydrolysis (p < 0.05), while in H–Pan an increase in Δh2 was observed in the first 60 min but decreased with an increase in the hydrolysis time.
The increase in Δh in some protein hydrolysates is attributed to the unfolding of the protein which produced polypeptides with stronger protein-protein interactions concerning the LPC [38]. During the hydrolysis process, there could be a rearrangement or reassociation of the released protein fragments, which form rigid particles and more compact conformations, especially at the beginning of hydrolysis [41]. However, as hydrolysis progresses, the reduction in Δh as a function of time indicates the decrease in the ordered structure and aggregation [39], which indicate that the protein aggregates were held together mainly by the noncovalent hydrophobic bonds [38]. On the other hand, the high Δh1 and Δh2 in H–Pan (regarding H–Pep) could be caused by the high contents of β-turn in this protein hydrolysates. The β-turn is a structure mainly formed by proline and glycine residues. These amino acids reduce the steric strain of protein hydrolysates, which decreases the entropy of the denatured state [42].
As for Td, both Td1 and Td2 of H–Pep were notably higher (p < 0.05) than in H–Pan (Figure 3A,B). This indicates that these hydrolysates had more hydrophobic interactions, which are the main interactive forces responsible for the formation of the protein aggregates [38]. Additionally, the high denaturation temperatures have also been attributed to the high percentages of β-sheet in these hydrolysates (Figure 1C). Proteins with large fractions of β-sheet structure usually exhibit high denaturation temperatures [43]. This behavior would explain why these hydrolysates had more decomposition stages in DTG (Figure 2C). Similar trends have been reported in protein hydrolysates of glutelin [44] peanut [39], and chickpea [10].
On the other hand, the Tg of the LPC was 130.8 °C. In protein hydrolysates, this temperature was dependent on the hydrolysis time and the enzyme used (Figure 3E). H–Pep (from 139.2–142.0 °C) showed an increase in Tg as a function of hydrolysis time (p < 0.05), while in H–Pan (from 136.1–134.0 °C) contrary comportment was observed. The H–Pep showed higher Tg and Tdec (p < 0.05), indicating that the β-sheet fraction significantly influences the thermal stability of these hydrolysates. Then, the results clearly show that the thermal events and the shape of the endothermic peaks in the different DSC curves depend on the secondary structure.

3.4. Particle Size Distribution of Emulsions Stabilized with LPC and Hydrolysates

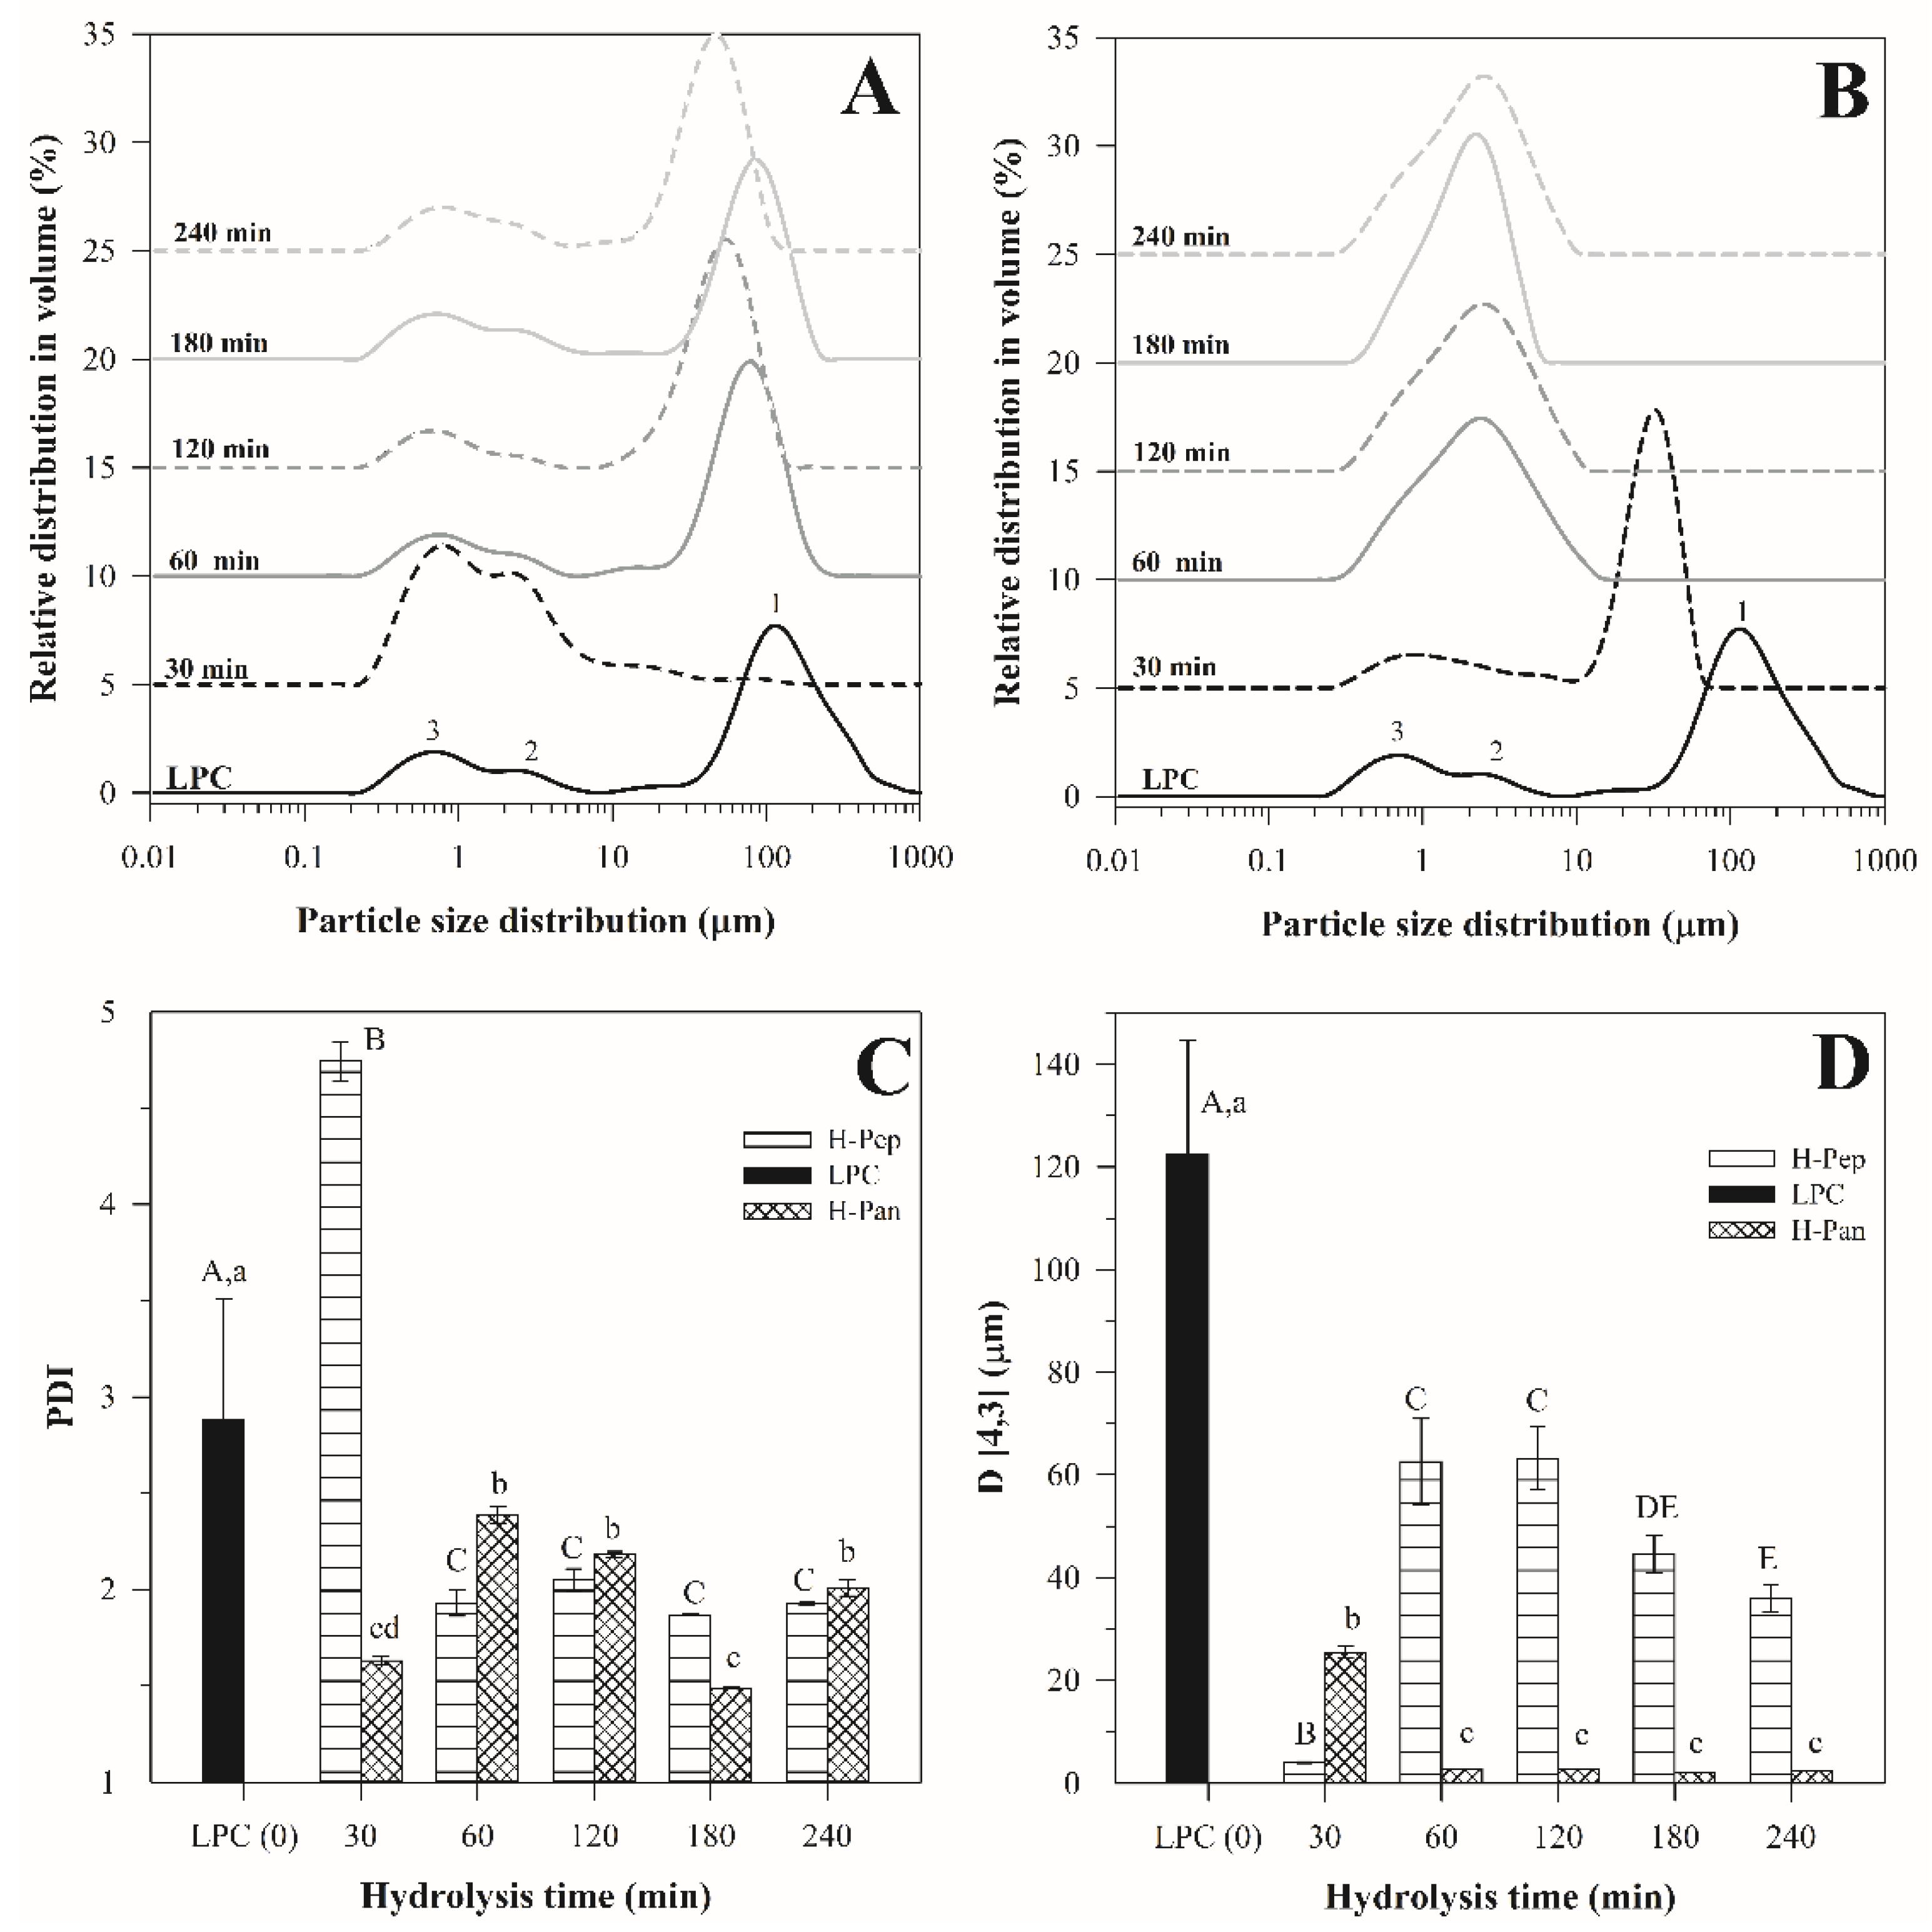
The LPC stabilized emulsion exhibited a trimodal size distribution (Figure 5) with high PDI (2.88 ± 0.63, Figure 5C) and D [4,3] (122.33 ± 22.23, Figure 5D). These results indicate the poor capacity of LPC to form a stable emulsion, which coincides with the low emulsifying activity index (EAI, 32.38 m2/g) and emulsion stability index (ESI, 30.24 min) for the LPC reported in a previous study [15]. After enzymatic hydrolysis, considerable changes in particle size distributions, PDI, and D [4,3] were observed. Emulsions stabilized with H–Pep showed very similar distributions to LPC but with a shift in the distribution towards smaller particles (first peak) than LPC and with greater magnitude (Figure 5A). In the case of emulsions stabilized with H–Pan, monomodal distributions were observed after 60 min of hydrolysis. These emulsions showed narrower distributions (Figure 5B) and lowered PDI (Figure 5C) and D [4,3] (Figure 5D) than emulsions stabilized by LPC and H–Pep.
Both the emulsions stabilized with H–Pep and H–Pan showed a reduction in PDI (Figure 5C) and D [4,3] (Figure 5D) with increasing hydrolysis time. In emulsions stabilized with H–Pep, the PDI decreases from 4.75–1.93 and the D [4,3] from 62.6–35.9 µm. The lowest values of PDI and D [4,3] for H–Pep were obtained in 240 min of hydrolysis.
Whereas in emulsions stabilized with H Pan the PDI decreased from 2.38–1.49 and the D [4,3] from 20.7–2.78 µm up to 180 min of hydrolysis. H–Pan with 180 min of hydrolysis showed the lowest PDI and D [4,3]. However, the increase in time of hydrolysis caused a rise in PDI and D [4,3] in these emulsions, although the increase in D [4,3] was not significant (p > 0.05). This behavior coincides with the results of EAI and ESI reported for these hydrolysates. The best EAI (6.25 m2/g) and ESI (88.79 min) were determined after 180 min of hydrolysis for H–Pan and the subsequent increase in time caused the decrease in these properties [15].
In general, the decrease in particle size in emulsions stabilized with protein hydrolysates could be attributed to the release of shorter protein chains during enzymatic hydrolysis and the exposure of hidden hydrophobic residues that improved the solubility. Enzymatic hydrolysis reduced the HAA content in LPC (Table 1), which improved the hydrophobic-hydrophilic balance of the protein hydrolysates. LPC showed a high HAA content, which explains its low solubility in water (15% at pH 8.0, [15]). The low solubility reduced the adsorption of protein at the interface and minimized protein-oil interactions, causing the aggregation of oil droplets and leading to nonhomogeneous emulsions [22].
Nevertheless, the best results based on smaller particle sizes and homogeneous distributions were obtained in emulsions stabilized with H–Pan, which was attributed to the low Td and β-sheet contents of these hydrolysates compared to H–Pep. The high Td of H–Pep indicates a greater amount of protein aggregates that reduced the adsorption of protein at the interface. As for the H–Pan, the decrease in the β-sheet caused the increase in the β-turn structures (Figure 1D), revealing buried hydrophobic patches that led to a greater hydrophobicity of the surface. This has been associated with the improvement of emulsifying properties [22]. Moreover, the α-helix, β-turn, and random coil are structures that are relatively flexible and open, while β-sheet structures are more stable [33]. Hence, the decreasing of the β-sheets and the increasing of the β-turns in H–Pan indicate that the hydrolysis by pancreatin produced more flexible protein fragments that can spread rapidly at oil–water interfaces [45]. The same trend was reported in protein hydrolysates of rice glutelin [33] and potatoes [22].

Effect of pH on the Particle Size Distribution of Emulsions Stabilized with H–Pan

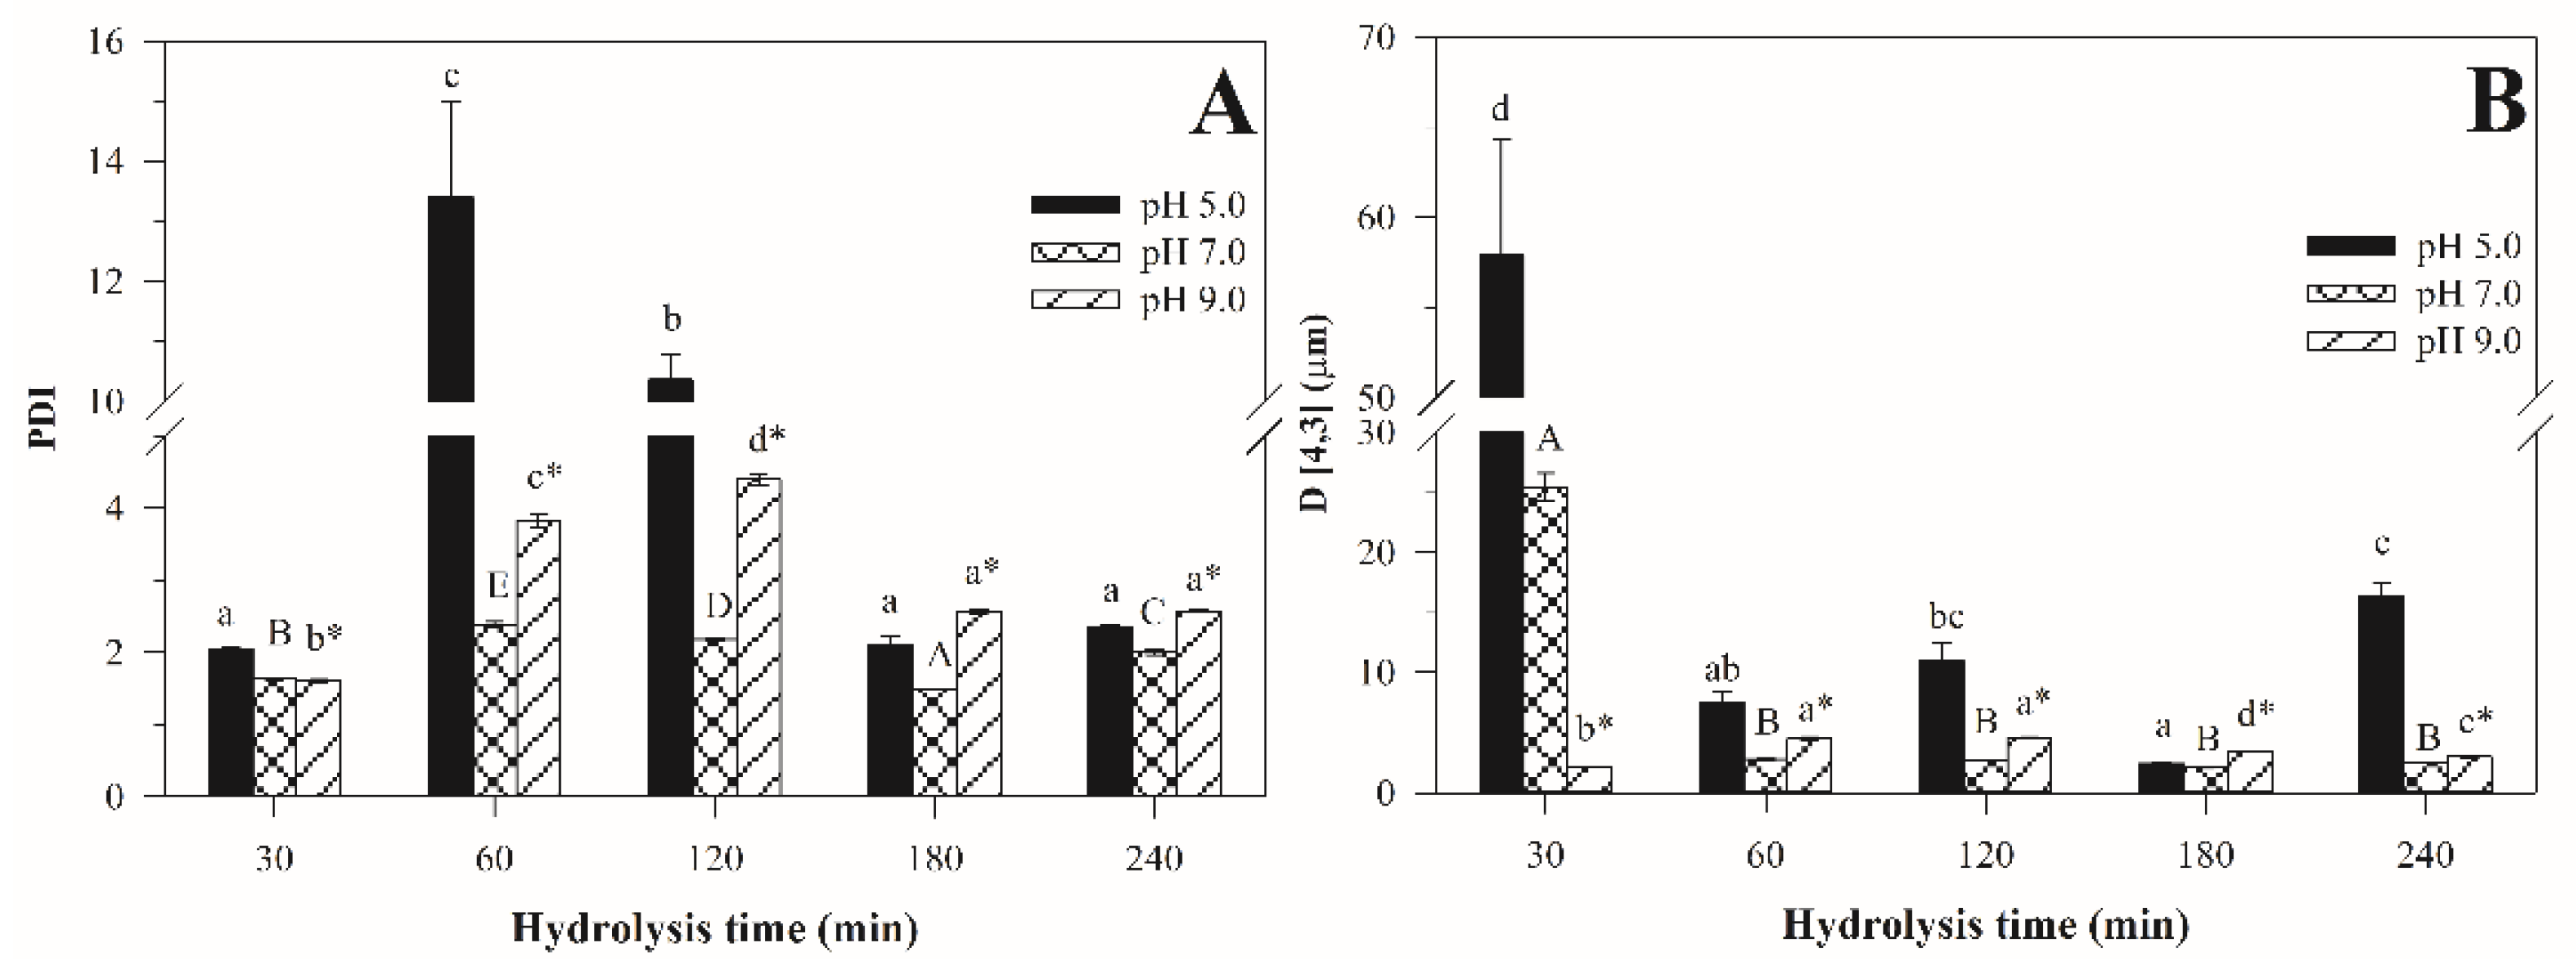
The effect of pH on the PDI (Figure 6A) and D [4,3] (Figure 6B) of emulsions stabilized with protein hydrolysates obtained at different hydrolysis times was evaluated only with H–Pan. This is because emulsions stabilized with H–Pep showed significantly higher PDI and D [4,3], as well as nonhomogeneous particle size distributions. In all the pH values tested, high values of PDI and D [4,3] in emulsions stabilized with H–Pan obtained in a short hydrolysis time (60–120 min) were observed. However, the progress of hydrolysis at 180 min led to the reduction in these values, followed by an increase in PDI and D [4,3] at an extended hydrolysis time (240 min), indicating that excessive hydrolysis reduced the ability of hydrolysate to stabilize the emulsion [46]. This would explain the reduction in EAI (from 56.24–51.18) and ESI (from 88.79–67.18 min) of the protein hydrolysates obtained from 180–240 min of hydrolysis, respectively [15].
Hence, moderate hydrolysis could produce flexible peptides with greater hydrophobicity, which could facilitate anchoring to the O/W interface and improve their emulsifying properties. Conversely, protein hydrolysates obtained at an extended hydrolysis time could release smaller peptides and this increase in low molecular weight peptides could increment peptide–peptide interactions instead of peptide–oil interactions. Then, the excess of the unabsorbed peptides can lead to depletion flocculation, thereby increasing particle size and PDI [22]. Similar trends were reported in protein hydrolysates of chickpea [10], fava bean [12], and oat [46].
Regarding the pH, the highest PDI and D [4,3] values were obtained in emulsions at pH 5.0, indicating extensive droplet aggregation. This is because at pHs close to the isoelectric point (acidic pH), the net charge of the droplets is very low. Then, the electrostatic repulsion is not enough to overcome the Van der Waals forces, which promote the flocculation of the droplets and the consequent increase in particle size.
The low pH led to a reduction in the solubility of hydrolysate; therefore, it could not move quickly to the interface [47,48]. However, increasing the pH to 7.0–9.0 significatively reduced (p < 0.05) the PDI and the particle size. This reduction in particle size coincides with the solubility increase in protein hydrolysates as a function of pH reported in a previous study [15]. The increase in the solubility improved the absorption and reorientation of peptides on the surfaces of the oil droplets [47,48]. During the hydrolysis of proteins, carboxyl and amino groups are released due to the cleavage of peptide bonds, which increase as the hydrolysis time increases. These carboxyl groups acquire a negative charge when the pH of the medium is increasing. Therefore, the increase in pH in the emulsions led to a greater negative charge on the surface of the emulsion droplets, which has been related to strong electrostatic repulsions between the oil droplets, thus preventing the physical destabilization of the emulsions by coagulation, flocculation, and the increase in particle size [22,49].
Finally, the emulsions stabilized with H–Pep and H–Pan showed a PDI greater than 1.0, indicating that current protein hydrolysates are not suitable for stabilizing emulsions. However, the results indicate that H–Pan at 180 min presented a lower PDI (near 1.0) and D [4,3], and monomodal distributions (compared with H–Pep). These results suggest that H–Pan could be used as an alternative emulsifier. However, additional studies are required to confirm its potential use in the food industry.

4. Conclusions

This study showed that the hydrolysis of LPC with pepsin and pancreatin modified the amino acid composition, secondary structure, and thermal properties of leaf protein hydrolysates, which influence the emulsifying capacity. This modification was dependent on the hydrolysis time and the type of enzyme. Both H–Pep and H–Pan showed slightly different amino acid patterns, with higher amounts of HAA and EAA at 240 min. The lower β-sheet fractions and high β-turn contents had a greater influence on the emulsifier properties of H–Pan, which improved the flexibility of these hydrolysates. The high content of β-sheets in H–Pep caused high decomposition and glass transition temperatures, as well as a low emulsifying capacity. These results showed that H–Pan at 180 min of hydrolysis produced emulsions with monomodal distributions, a low PDI (near to 1.0), and D [4,3], resulting in more-stable emulsions. Then, the hydrolysis with pancreatin can be used to improve the emulsifier properties of LPC.
However, this study explored the ability of H–Pan (at 180 min of hydrolysis) of jackfruit leaf as a possible emulsifier using a concentration of 0.5% (w/v). Therefore, a further study exploring different concentrations of H–Pan (at 180 min of hydrolysis) and blends with other polymers is recommended. In addition, the protein hydrolysate is a mixture of peptides with different molecular weights, so the influence of molecular weight on the emulsifying properties will continue to be investigated to improve the stability of the emulsions in future research.

Author Contributions

Conceptualization, C.C.-C., M.C.-S. and J.A.R.-S.; data curation, C.C.-C. and J.C.B.-C.; formal analysis, C.C.-C.; funding acquisition, J.A.R.-S.; investigation, C.C.-C.; methodology, C.C.-C., M.C.-S., J.C.B.-C., J.A.D. and J.A.R.-S.; project administration, J.A.R.-S.; resources, J.A.R.-S.; supervision, J.A.R.-S.; visualization, C.C.-C., M.C.-S., J.C.B.-C., J.A.D. and J.A.R.-S.; writing—original draft, C.C.-C. and J.A.R.-S.; writing—review and editing, C.C.-C., M.C.-S., J.C.B.-C., J.A.D. and J.A.R.-S. All authors have read and agreed to the published version of the manuscript.

Funding

Thanks to project code 316948 of the CYTED thematic network code 319RT0576.

Institutional Review Board Statement

Not applicable.

Informed Consent Statement

Not applicable.

Data Availability Statement

Not applicable.

Acknowledgments

The authors thank CONACYT (Consejo Nacional de Ciencia y Tecnología-Mexico) for their support through scholarship number 713740 granted to Carolina Calderón-Chiu.

Conflicts of Interest

The authors declare no conflict of interest.

References

  1. Drapala, K.P.; Mulvihill, D.M.; O’Mahony, J.A. A Review of the Analytical Approaches Used for Studying the Structure, Interactions and Stability of Emulsions in Nutritional Beverage Systems. Food Struct. 2018, 16, 27–42. [Google Scholar] [CrossRef]
  2. Dapčević-Hadnađev, T.; Dizdar, M.; Pojić, M.; Krstonošić, V.; Zychowski, L.M.; Hadnađev, M. Emulsifying Properties of Hemp Proteins: Effect of Isolation Technique. Food Hydrocoll. 2019, 89, 912–920. [Google Scholar] [CrossRef]
  3. Burger, T.G.; Zhang, Y. Recent Progress in the Utilization of Pea Protein as an Emulsifier for Food Applications. Trends Food Sci. Technol. 2019, 86, 25–33. [Google Scholar] [CrossRef]
  4. Pojić, M.; Mišan, A.; Tiwari, B. Eco-Innovative Technologies for Extraction of Proteins for Human Consumption from Renewable Protein Sources of Plant Origin. Trends Food Sci. Technol. 2018, 75, 93–104. [Google Scholar] [CrossRef]
  5. Galves, C.; Galli, G.; Miranda, C.G.; Kurozawa, L.E. Improving the Emulsifying Property of Potato Protein by Hydrolysis: An Application as Encapsulating Agent with Maltodextrin. Innov. Food Sci. Emerg. Technol. 2021, 70, 102696. [Google Scholar] [CrossRef]
  6. Chang, C.; Nickerson, M.T. Encapsulation of Omega 3-6-9 Fatty Acids-Rich Oils Using Protein-Based Emulsions with Spray Drying. J. Food Sci. Technol. 2018, 55, 2850–2861. [Google Scholar] [CrossRef]
  7. Grasberger, K.F.; Gregersen, S.B.; Jensen, H.B.; Sanggaard, K.W.; Corredig, M. Plant-Dairy Protein Blends: Gelation Behaviour in a Filled Particle Matrix. Food Struct. 2021, 29, 100198. [Google Scholar] [CrossRef]
  8. Fernández-Sosa, E.I.; Chaves, M.G.; Henao Ossa, J.S.; Quiroga, A.V.; Avanza, M.V. Protein Isolates from Cajanus cajan L. as Surfactant for o:W Emulsions: PH and Ionic Strength Influence on Protein Structure and Emulsion Stability. Food Biosci. 2021, 42, 101159. [Google Scholar] [CrossRef]
  9. Ozturk, B.; McClements, D.J. Progress in Natural Emulsifiers for Utilization in Food Emulsions. Curr. Opin. Food Sci. 2016, 7, 1–6. [Google Scholar] [CrossRef]
  10. Ghribi, A.M.; Gafsi, I.M.; Sila, A.; Blecker, C.; Danthine, S.; Attia, H.; Bougatef, A.; Besbes, S. Effects of Enzymatic Hydrolysis on Conformational and Functional Properties of Chickpea Protein Isolate. Food Chem. 2015, 187, 322–330. [Google Scholar] [CrossRef]
  11. Tamm, F.; Herbst, S.; Brodkorb, A.; Drusch, S. Functional Properties of Pea Protein Hydrolysates in Emulsions and Spray-Dried Microcapsules. Food Hydrocoll. 2016, 58, 204–214. [Google Scholar] [CrossRef]
  12. Liu, C.; Bhattarai, M.; Mikkonen, K.S.; Heinonen, M. Effects of Enzymatic Hydrolysis of Fava Bean Protein Isolate by Alcalase on the Physical and Oxidative Stability of Oil-in-Water Emulsions. J. Agric. Food Chem. 2019, 67, 6625–6632. [Google Scholar] [CrossRef] [PubMed]
  13. Zang, X.; Yue, C.; Wang, Y.; Shao, M.; Yu, G. Effect of Limited Enzymatic Hydrolysis on the Structure and Emulsifying Properties of Rice Bran Protein. J. Cereal Sci. 2019, 85, 168–174. [Google Scholar] [CrossRef]
  14. Zhang, Y.; Romero, H.M. Exploring the Structure-Function Relationship of Great Northern and Navy Bean (Phaseolus vulgaris L.) Protein Hydrolysates: A Study on the Effect of Enzymatic Hydrolysis. Int. J. Biol. Macromol. 2020, 162, 1516–1525. [Google Scholar] [CrossRef] [PubMed]
  15. Calderón-Chiu, C.; Calderón-Santoyo, M.; Herman-Lara, E.; Ragazzo-Sánchez, J.A. Jackfruit (Artocarpus heterophyllus Lam) Leaf as a New Source to Obtain Protein Hydrolysates: Physicochemical Characterization, Techno-Functional Properties and Antioxidant Capacity. Food Hydrocoll. 2021, 112, 106319. [Google Scholar] [CrossRef]
  16. Brion-Espinoza, I.A.; Iñiguez-Moreno, M.; Ragazzo-Sánchez, J.A.; Barros-Castillo, J.C.; Calderón-Chiu, C.; Calderón-Santoyo, M. Edible Pectin Film Added with Peptides from Jackfruit Leaves Obtained by High-Hydrostatic Pressure and Pepsin Hydrolysis. Food Chem. X 2021, 12, 100170. [Google Scholar] [CrossRef]
  17. Zhang, Y.; Shen, Y.; Zhang, H.; Wang, L.; Zhang, H.; Qian, H.; Qi, X. Isolation, Purification and Identification of Two Antioxidant Peptides from Water Hyacinth Leaf Protein Hydrolysates (WHLPH). Eur. Food Res. Technol. 2018, 244, 83–96. [Google Scholar] [CrossRef]
  18. Yan, X.; Liang, S.; Peng, T.; Zhang, G.; Zeng, Z.; Yu, P.; Gong, D.; Deng, S. Influence of Phenolic Compounds on Physicochemical and Functional Properties of Protein Isolate from Cinnamomum camphora Seed Kernel. Food Hydrocoll. 2020, 102, 105612. [Google Scholar] [CrossRef]
  19. Böcker, U.; Wubshet, S.G.; Lindberg, D.; Afseth, N.K. Fourier-Transform Infrared Spectroscopy for Characterization of Protein Chain Reductions in Enzymatic Reactions. Analyst 2017, 142, 2812–2818. [Google Scholar] [CrossRef]
  20. del Mar Contreras, M.; Lama-Muñoz, A.; Manuel Gutiérrez-Pérez, J.; Espínola, F.; Moya, M.; Castro, E. Protein Extraction from Agri-Food Residues for Integration in Biorefinery: Potential Techniques and Current Status. Bioresour. Technol. 2019, 280, 459–477. [Google Scholar] [CrossRef]
  21. Famuwagun, A.A.; Alashi, A.M.; Gbadamosi, S.O.; Taiwo, K.A.; Oyedele, D.J.; Adebooye, O.C.; Aluko, R.E. Comparative Study of the Structural and Functional Properties of Protein Isolates Prepared from Edible Vegetable Leaves. Int. J. Food Prop. 2020, 23, 955–970. [Google Scholar] [CrossRef]
  22. Akbari, N.; Mohammadzadeh Milani, J.; Biparva, P. Functional and Conformational Properties of Proteolytic Enzyme-modified Potato Protein Isolate. J. Sci. Food Agric. 2020, 100, 1320–1327. [Google Scholar] [CrossRef] [PubMed]
  23. Miss-Zacarías, D.M.; Iñiguez-Moreno, M.; Calderón-Santoyo, M.; Ragazzo-Sánchez, J.A. Optimization of Ultrasound-Assisted Microemulsions of Citral Using Biopolymers: Characterization and Antifungal Activity. J. Dispers. Sci. Technol. 2022, 43, 1373–1382. [Google Scholar] [CrossRef]
  24. Ricci, L.; Umiltà, E.; Righetti, M.C.; Messina, T.; Zurlini, C.; Montanari, A.; Bronco, S.; Bertoldo, M. On the Thermal Behavior of Protein Isolated from Different Legumes Investigated by DSC and TGA. J. Sci. Food Agric. 2018, 98, 5368–5377. [Google Scholar] [CrossRef] [PubMed]
  25. Sanger, F.; Thompson, E.O.P. Halogenation of Tyrosine during Acid Hydrolysis. Biochim. Biophys. Acta 1963, 71, 468–471. [Google Scholar] [CrossRef]
  26. Famuwagun, A.A.; Alashi, A.M.; Gbadamosi, O.S.; Taiwo, K.A.; Oyedele, D.; Adebooye, O.C.; Aluko, R.E. Antioxidant and Enzymes Inhibitory Properties of Amaranth Leaf Protein Hydrolyzates and Ultrafiltration Peptide Fractions. J. Food Biochem. 2021, 45, e13396. [Google Scholar] [CrossRef]
  27. Tenorio, A.T.; Kyriakopoulou, K.E.; Suarez-Garcia, E.; van den Berg, C.; van der Goot, A.J. Understanding Differences in Protein Fractionation from Conventional Crops, and Herbaceous and Aquatic Biomass—Consequences for Industrial Use. Trends Food Sci. Technol. 2018, 71, 235–245. [Google Scholar] [CrossRef]
  28. WHO/FAO. Report of a Joint WHO/FAO/UNU Expert Consultation 2007; World Health Organization/Food and Agricultural Organization: Geneva, Switzerland, 2007.
  29. Kchaou, H.; Jridi, M.; Benbettaieb, N.; Debeaufort, F.; Nasri, M. Bioactive Films Based on Cuttlefish (Sepia Officinalis) Skin Gelatin Incorporated with Cuttlefish Protein Hydrolysates: Physicochemical Characterization and Antioxidant Properties. Food Packag. Shelf Life 2020, 24, 100477. [Google Scholar] [CrossRef]
  30. Trigui, I.; Yaich, H.; Zouari, A.; Cheikh-Rouhou, S.; Blecker, C.; Attia, H.; Ayadi, M.A. Structure-Function Relationship of Black Cumin Seeds Protein Isolates: Amino-Acid Profiling, Surface Characteristics, and Thermal Properties. Food Struct. 2021, 29, 100203. [Google Scholar] [CrossRef]
  31. Saha, J.; Deka, S.C. Functional Properties of Sonicated and Non-Sonicated Extracted Leaf Protein Concentrate from Diplazium esculentum. Int. J. Food Prop. 2017, 20, 1051–1061. [Google Scholar] [CrossRef] [Green Version]
  32. Gómez, A.; Gay, C.; Tironi, V.; Avanza, M.V. Structural and Antioxidant Properties of Cowpea Protein Hydrolysates. Food Biosci. 2021, 41, 101074. [Google Scholar] [CrossRef]
  33. Xu, X.; Liu, W.; Liu, C.; Luo, L.; Chen, J.; Luo, S.; McClements, D.J.; Wu, L. Effect of Limited Enzymatic Hydrolysis on Structure and Emulsifying Properties of Rice Glutelin. Food Hydrocoll. 2016, 61, 251–260. [Google Scholar] [CrossRef]
  34. Yan, X.; Zhang, G.; Zhao, J.; Ma, M.; Bao, X.; Zeng, Z.; Gong, X.; Yu, P.; Wen, X.; Gong, D. Influence of Phenolic Compounds on the Structural Characteristics, Functional Properties and Antioxidant Activities of Alcalase-Hydrolyzed Protein Isolate from Cinnamomum camphora Seed Kernel. LWT 2021, 148, 111799. [Google Scholar] [CrossRef]
  35. Marcelino, A.M.C.; Gierasch, L.M. Roles of β-Turns in Protein Folding: From Peptide Models to Protein Engineering. Biopolymers 2008, 89, 380–391. [Google Scholar] [CrossRef] [PubMed]
  36. López, D.N.; Ingrassia, R.; Busti, P.; Bonino, J.; Delgado, J.F.; Wagner, J.; Boeris, V.; Spelzini, D. Structural Characterization of Protein Isolates Obtained from Chia (Salvia hispanica L.) Seeds. LWT 2018, 90, 396–402. [Google Scholar] [CrossRef]
  37. Li, C.; Yang, J.; Yao, L.; Qin, F.; Hou, G.; Chen, B.; Jin, L.; Deng, J.; Shen, Y. Characterisation, Physicochemical and Functional Properties of Protein Isolates from Amygdalus pedunculata Pall Seeds. Food Chem. 2020, 311, 125888. [Google Scholar] [CrossRef]
  38. Asen, N.D.; Aluko, R.E. Physicochemical and Functional Properties of Membrane-Fractionated Heat-Induced Pea Protein Aggregates. Front. Nutr. 2022, 9, 852225. [Google Scholar] [CrossRef] [PubMed]
  39. Zhao, G.; Liu, Y.; Zhao, M.; Ren, J.; Yang, B. Enzymatic Hydrolysis and Their Effects on Conformational and Functional Properties of Peanut Protein Isolate. Food Chem. 2011, 127, 1438–1443. [Google Scholar] [CrossRef]
  40. Calderón-Chiu, C.; Instituto Tecnológico de Tepic, Tepic, Mexico; Ragazzo-Sánchez, J.A.; Instituto Tecnológico de Tepic, Tepic, Mexico; Calderón-santoyo, M.; Instituto Tecnológico de Tepic, Tepic, Mexico. Personal Communication, Non-Published Material. 2022.
  41. Tang, C.-H.; Ma, C.-Y. Heat-Induced Modifications in the Functional and Structural Properties of Vicilin-Rich Protein Isolate from Kidney (Phaseolus vulgaris L.) Bean. Food Chem. 2009, 115, 859–866. [Google Scholar] [CrossRef]
  42. Fu, H.; Grimsley, G.R.; Razvi, A.; Scholtz, J.M.; Pace, C.N. Increasing Protein Stability by Improving Beta-Turns. Proteins Struct. Funct. Bioinforma 2009, 77, 491–498. [Google Scholar] [CrossRef] [Green Version]
  43. Damodaran, S. Amino Acids, Peptides, and Protein. In Fennema’s Food Chemistry; CRC Press: Boca Raton, FL, USA, 2017; pp. 235–356. ISBN 9781315372914. [Google Scholar]
  44. Zheng, X.; Wang, J.; Liu, X.; Sun, Y.; Zheng, Y.; Wang, X.; Liu, Y. Effect of Hydrolysis Time on the Physicochemical and Functional Properties of Corn Glutelin by Protamex Hydrolysis. Food Chem. 2015, 172, 407–415. [Google Scholar] [CrossRef] [PubMed]
  45. Fu, X.; Huang, X.; Jin, Y.; Zhang, S.; Ma, M. Characterization of Enzymatically Modified Liquid Egg Yolk: Structural, Interfacial and Emulsifying Properties. Food Hydrocoll. 2020, 105, 105763. [Google Scholar] [CrossRef]
  46. Zheng, Z.; Li, J.; Liu, Y. Effects of Partial Hydrolysis on the Structural, Functional and Antioxidant Properties of Oat Protein Isolate. Food Funct. 2020, 11, 3144–3155. [Google Scholar] [CrossRef] [PubMed]
  47. Chen, C.; Chi, Y.-J.; Zhao, M.-Y.; Xu, W. Influence of Degree of Hydrolysis on Functional Properties, Antioxidant and ACE Inhibitory Activities of Egg White Protein Hydrolysate. Food Sci. Biotechnol. 2012, 21, 27–34. [Google Scholar] [CrossRef]
  48. Chang, C.; Tu, S.; Ghosh, S.; Nickerson, M.T. Effect of PH on the Inter-Relationships between the Physicochemical, Interfacial and Emulsifying Properties for Pea, Soy, Lentil and Canola Protein Isolates. Food Res. Int. 2015, 77, 360–367. [Google Scholar] [CrossRef]
  49. Ruiz-Álvarez, J.M.; del Castillo-Santaella, T.; Maldonado-Valderrama, J.; Guadix, A.; Guadix, E.M.; García-Moreno, P.J. PH Influences the Interfacial Properties of Blue Whiting (M. Poutassou) and Whey Protein Hydrolysates Determining the Physical Stability of Fish Oil-in-Water Emulsions. Food Hydrocoll. 2022, 122, 107075. [Google Scholar] [CrossRef]
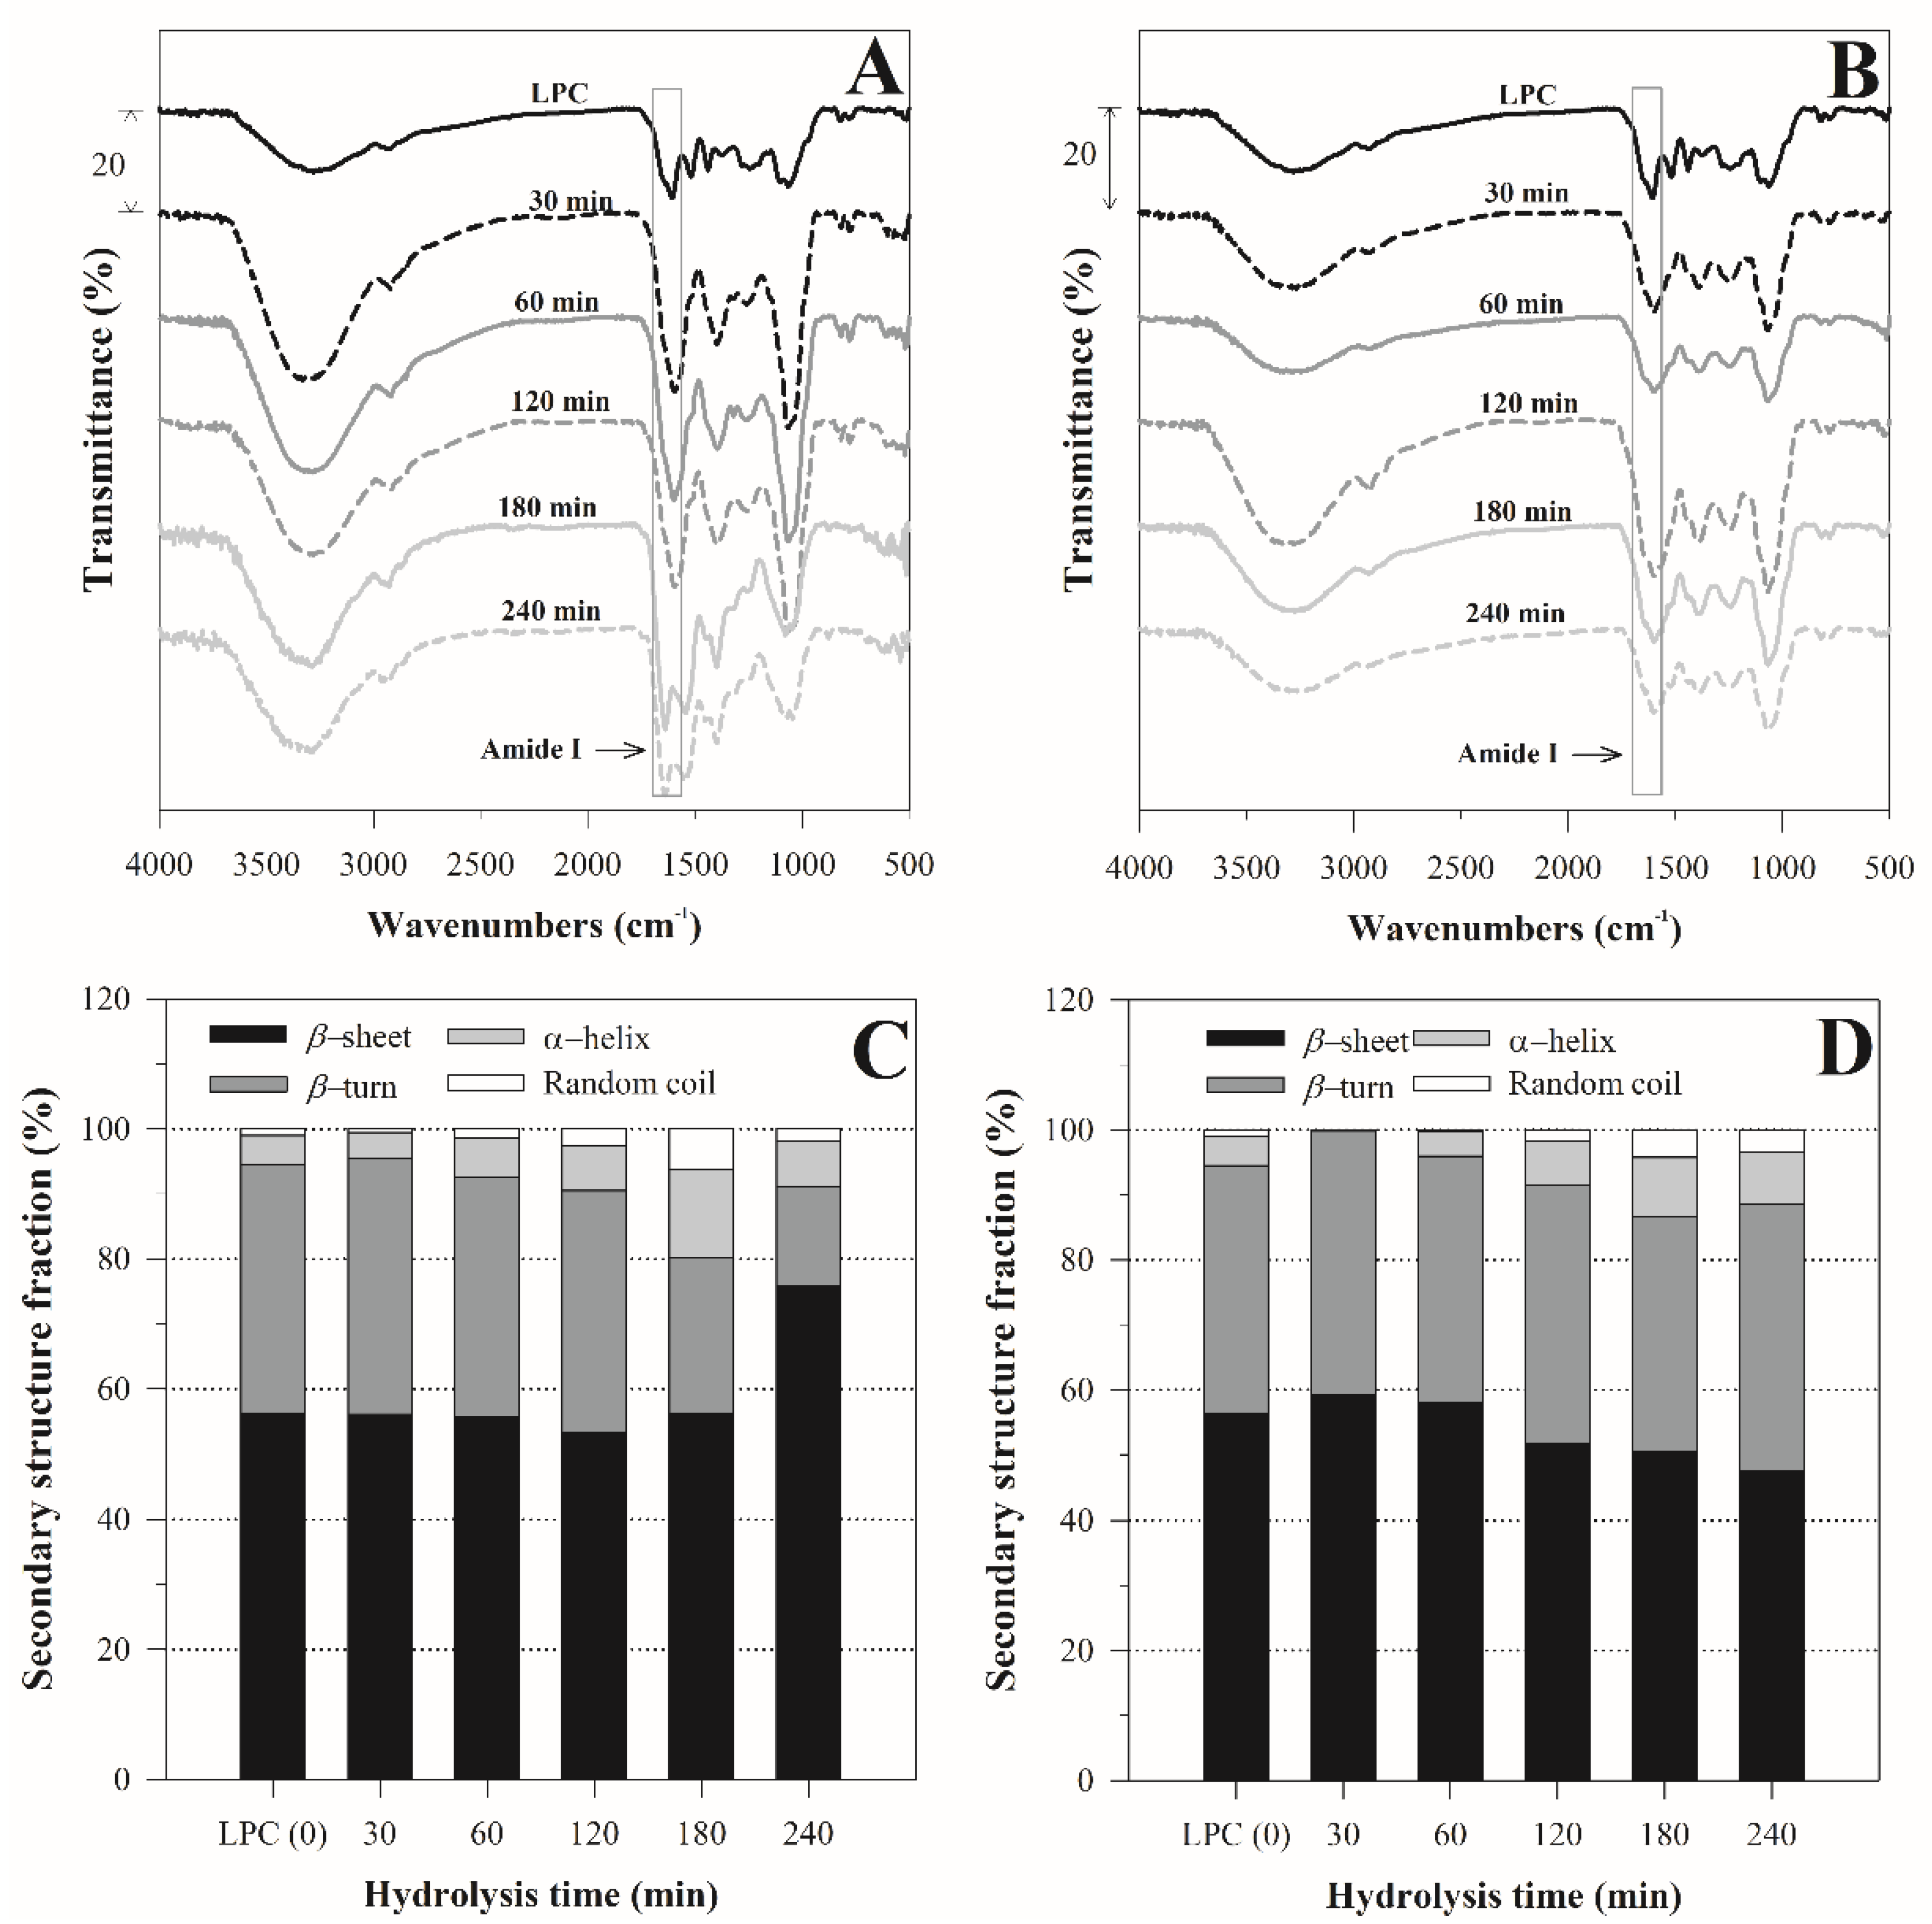
Figure 1. FTIR spectra (A,B) and secondary structure fractions (C,D) of leaf protein concentrate (LPC) and protein hydrolysates obtained with pepsin (A,C) and pancreatin (B,D) at different hydrolysis times.
Colloids 06 00052 g001
Figure 2. Curves of TGA (A,B) and DTG (C,D) of leaf protein concentrate (LPC) and protein hydrolysates obtained with pepsin (A,C) and pancreatin (B,D) at different hydrolysis times.
Colloids 06 00052 g002
Figure 3. Thermal properties of leaf protein concentrate (LPC) and its hydrolysates. (A) and (B) show the denaturation temperature (Td), while (C) and (D) the denaturation enthalpy (Δh) corresponding to the first (Td1 and Δh1) and second (Td2 and Δh2) endothermic peak, respectively. (E) and (F) are the glass transition temperature (Tg) and decomposition temperature of LPC and protein hydrolysates as a function of time, respectively. Different letters in the same treatment indicate a significant difference (p < 0.05) with respect to time.
Colloids 06 00052 g003
Figure 4. Curves of DSC of leaf protein concentrate (LPC) and protein hydrolysates obtained with pepsin (A) and pancreatin (B) at different hydrolysis times.
Colloids 06 00052 g004
Figure 5. Effect of hydrolysis time and type of enzyme on the particle size distribution (A,B), polydispersity index (PDI, C), and volume-weighted mean particle diameter (D [4,3], D) of emulsions stabilized (pH = 7.0) with H–Pep (A) and H–Pan (B) obtained at different hydrolysis time. LPC, Leaf protein concentrate. Different letters indicate significant differences (p < 0.05) between the hydrolysis time in a specified sample.
Colloids 06 00052 g005
Figure 6. Effect of pH on polydispersity index (PDI, A) and volume-weighted mean particle diameter (D [4,3], B) of emulsions stabilized with H–Pan obtained at different hydrolysis times. Different letters indicate significant differences (p < 0.05) between the hydrolysis time at a specified pH. *: Visual guide for the reader in treatments at pH 9.
Colloids 06 00052 g006
Table 1. Amino acids profile (g/100 g protein) of LPC and protein hydrolysates obtained after treatment with pepsin and pancreatin.
H–Pep at Different Hydrolysis Times (min)
Amino AcidLeaf FlourLPC3060120180240
Alanine1.68 ± 0.17 b6.55 ± 0.19 e3.1 ± 0.12 a2.57 ± 0.1 ac2.29 ± 0.68 bc3.19 ± 0.06 a4.22 ± 0.42 d
Glycine0.32 ± 0.15 c0.97 ± 0.05 d0 ± 0 a0.13 ± 0.01 ab0.13 ± 0.04 ab0.17 ± 0 bc0 ± 0 a
Valine1.77 ± 0.2 d8.62 ± 0.42 e5.58 ± 0.8 c3.77 ± 0.11 a3.53 ± 0.72 a4.25 ± 0.27 ab5.17 ± 0.84 bc
Leucine2.52 ± 0.14 c11.26 ± 0.13 e6.9 ± 0.65 d4.44 ± 0.05 ab3.87 ± 0.29 ac4.8 ± 0.15 ab5.77 ± 1.33 bd
Isoleucine1.36 ± 0.12 d6.02 ± 0.01 e3.91 ± 0.3 c2.56 ± 0.08 a2.38 ± 0.41 a2.83 ± 0.22 ab3.67 ± 0.93 bc
Proline1.46 ± 0.08 a2.68 ± 0.06 b1.11 ± 0.15 a1.28 ± 0.12 a1.04 ± 0.79 a1.01 ± 0.01 a0.89 ± 0.03 a
Serine0.28 ± 0.03 e2.87 ± 0.11 d1.49 ± 0.01b c1.27 ± 0.05 bc1.06 ± 0.05 a1.73 ± 0.05 c2.72 ± 0.23 d
Threonine0.76 ± 0.05 a5.02 ± 0.05 b2.66 ± 0.11 c2.14 ± 0.23 d1.7 ± 0.42 e3.22 ± 0.01 f4.05 ± 0.04 g
Phenylalanine1.27 ± 0.06 c5.27 ± 0.11 d3.43 ± 0.03 a2.62 ± 0.91 ab1.95 ± 0.13 bc2.77 ± 0.01 ab2.89 ± 0.07 a
Aspartic acid1.65 ± 0.11 a5.87 ± 0.08 f2.85 ± 0.15 c2.55 ± 0.01 bc2.05 ± 0.45 ab3.81 ± 0.27 d4.68 ± 0.08 e
Glutamic acid1.06 ± 0.12 a5.66 ± 0.07 d1.94 ± 0.12 ac2.71 ± 0.04 bc1.43 ± 1.27 a3.38 ± 0.02 b3.4 ± 0.06 b
Tyrosine3.34 ± 0.36 a3.41 ± 0.08 a0 ± 0 b0 ± 0 b0 ± 0 b0 ± 0 b0 ± 0 b
HAA13.41 ± 0.43 a43.81 ± 0.16 b24.02 ± 0.13 c,A17.24 ± 0.5 d,A15.07 ± 0.33 e,A18.84 ± 0.11 f,A22.62 ± 0.28 g,A
AAA4.62 ± 0.86 c8.68 ± 0.23 d3.43 ± 0.15 b,A2.62 ± 0.31 ab1.95 ± 0.45 a,A2.77 ± 0.27 ab,A2.89 ± 0.13 ab,A
EAA7.69 ± 0.11 b36.19 ± 0.17 f22.47 ± 0.2 a,A15.54 ± 0.23 d,A13.44 ± 1.8 c,A17.87 ± 0.41 e,A21.56 ± 1.27 a,A
TAA17.48 ±1.03 b64.19± 0.1 f32.96 ± 0.23 a,A26.04 ± 0.82 d,A21.45 ± 1.41 c,A31.15 ± 0.44 a,A37.47 ± 1.24 e,A
Alanine1.68 ± 0.17 a6.55 ± 0.19 e2.91 ± 0.26 bc1.92 ± 0.17 a3.04 ± 0.06 c3.61 ± 0.19 d2.54 ± 0.12 b
Glycine0.32 ± 0.15 b0.97 ± 0.05 c3.13 ± 0.27 d0.79 ± 0.15 ac0.65 ± 0.03 ac0.59 ± 0.05 ab0.48 ± 0.08 ab
Valine1.77 ± 0.2 c8.62 ± 0.42 e3.07 ± 0.3 a3.07 ± 0.2 a4.75 ± 0.65 b4.99 ± 0.71 b6.73 ± 0.8 d
Leucine2.52 ± 0.14 c11.26 ± 0.13 e3.84 ± 0.33 a3.59 ± 0.14 a5.89 ± 0.86 b5.86 ± 0.13 b7.18 ± 0.65 d
Isoleucine1.36 ± 0.12 c6.02 ± 0.01 e2.09 ± 0.18 a2.19 ± 0.12 a3.41 ± 0.47 b3.61 ± 0.01 b4.31 ± 0.3 d
Proline1.46 ± 0.08 b2.68 ± 0.06 c4.62 ± 0.24 d3.29 ± 0.08 a3.26 ± 0.01 a3.31 ± 0.06 a7.57 ± 0.15 e
Serine0.28 ± 0.03 b2.87 ± 0.11 f2.23 ± 0.08 e0.62 ± 0.03 c1.04 ± 0.11 a1.62 ± 0.11 d1.03 ± 0 a
Threonine0.76 ± 0.05 b5.02 ± 0.05 f2.65 ± 0.12 a1.39 ± 0.05 c2.49 ± 0.03 a2.95 ± 0.2 d3.3 ± 0.11 e
Phenylalanine1.27 ± 0.06 b5.27 ± 0.11 d1.97 ± 1.48 ab1.67 ± 0.06 ab3.15 ± 0.37 ac2.9 ± 0.74 ac4.21 ± 0.03 cd
Aspartic acid1.65 ± 0.11 c5.87 ± 0.08 e3.73 ± 0.45 a0.71 ± 0.11 b2.54 ± 0.57 d3.65 ± 0.4 a3.64 ± 0.15 a
Glutamic acid1.06 ± 0.12 b5.66 ± 0.07 c3.28 ± 0.71 a0.64 ± 0.12 b2.83 ± 1.19 a3.99 ± 0.08 a2.8 ± 0.69 a
Tyrosine3.34 ± 0.36 a3.41 ± 0.08 a0 ± 0 b0 ± 0 b0 ± 0 b0 ± 0 b0 ± 0.73 b
HAA13.41 ±0.43 b43.81 ± 0.16 f18.51 ± 0.1 d,B15.73 ± 0.43 c,B23.5 ± 0.43 a,B24.28 ± 0.25 a,B32.54 ± 1.34 e,B
AAA4.62 ± 0.86 b8.68 ± 0.23 a1.97 ± 0.08 b,B1.67 ± 0.06 b,B3.15 ± 0.09 c,B2.9 ± 0.02 c,A4.21 ± 0.15 b,B
EAA7.69 ± 0.11 b36.19 ± 0.17 f13.63 ± 0.27 d,B11.9 ± 0.11 c,B19.69 ± 0.57 a,B20.31 ± 0.01 a,B25.73 ± 1.61 e,B
TAA17.48 ±1.03 b64.19 ± 0.1 f33.53 ± 0.33 a,A19.88 ± 1.03 c,B33.04 ± 0.1 a,B37.08 ± 0.23 d,B43.8 ± 0.17 e,B
LPC, leaf protein concentrate; H–Pep, hydrolysate of pepsin; H–Pan, hydrolysate of pancreatin; HAA, hydrophobic amino acids; AAA, aromatic amino acids; EAA, essential amino acids; TAA; total amino acid. Different lowercase letters in the same row indicate significant differences (p < 0.05) between treatments. Different capital letters in the same column indicate significant differences (p < 0.05) between H–Pep and H–Pan at a given time.
Table 2. FTIR analysis of LPC and its hydrolysates.
IR Spectral Bands (cm−1)
SampleHydrolysis Time (min)Amide AAmide BAmide IAmide IICH3
Bending
Amide IIIC-O
LPC03280.32923.01605.01517.2nd1235.21062.1
H–Pep303305.92918.01636.01594.81398.61257.41065.0
603289.02919.01635.01598.71395.31258.81065.0
120ndnd1636.01596.31399.11253.51064.0
1803283.22917.01636.01596.31395.31255.91062.1
2403289.02961.41636.81540.81399.61260.21078.0
H–Pan303247.12936.01635.01599.21387.11242.41069.3
603288.02925.01636.31599.71388.51235.21069.3
1203323.22925.01636.01598.71389.91242.91068.4
1803239.0nd1636.01596.31388.11238.11068.9
2403262.0nd1636.01598.21388.01243.91067.4
LPC, leaf protein concentrate; H–Pep, hydrolysate of pepsin; H–Pan, hydrolysate of pancreatin. nd: not detected.
Table 3. Thermogravimetric analysis of the stages of decomposition of LPC and its hydrolysates.
SampleHydrolysis Time (min)Stages
IIIIIIIVFinal Residue (%)
Temperature Range (°C)Weight Loss (%)Temperature Range (°C)Weight Loss (%)Temperature Range (°C)Weight Loss (%)Temperature Range (°C)Weight Loss (%)
LPC028.3–39.2 ± 0.23 a3.93 ± 0.03 a252.4–370.4 ± 0.18 a61.65 ± 0.80 a************34.42 ± 0.12 a
H–Pep3034.5–47.0 ± 0.13 b,A1.97 ± 0.02 b,A230.7–357.2 ± 0.07 b,A23.60 ± 0.03 b,A736.5–774.6 ± 0.26 a,A67.58 ± 0.21 a,A******6.85 ± 0.07 b,A
6035.3–36.9 ± 0.22 c,A1.93 ± 0.13 b,A228.2–334.8 ± 0.43 c,A28.92 ± 0.12 c,A736.6–764.8 ± 0.15 b,A57.33 ± 0.41 b,A******11.82 ± 0.18 c,A
12030.2–47.6 ± 0.16 d,A4.33 ± 0.02 c,A192.2–295.8 ± 0.32 d,A27.50 ± 0.14 d,A725.2–767.7 ± 0.08 c,A64.27 ± 0.26 c,A******3.90 ± 0.23 d,A
18030.8–42.4 ± 0.25 e,A5.11 ± 0.10 d,A202.0–318.4 ± 0.13 e,A24.61 ± 0.22 e,A426.4–515.5 ± 0.23 d,A21.79 ± 0.05 d,A719.7–762.6 ± 0.33 a42.32 ± 0.21 a6.18 ± 0.17 e,A
24030.3–37.1 ± 0.06 c,A4.94 ± 0.07 e,A227.2–328.6 ± 0.26 f,A25.54 ± 0.32 f,A439.1–524.1 ± 0.29 e,A21.36 ± 0.39 d,A727.4–761.6 ± 0.27 a47.60 ± 0.32 b0.56 ± 0.05 f,A
H–Pan3035.2–45.2 ± 0.02 b,B5.13 ± 0.12 b,B218.5–353.8 ± 0.11 b,B44.27 ± 0.07 b,B746.6–785.3 ± 0.39 a,B18.61 ± 0.12 a,B******31.99 ± 0.12 b,B
6035.0–45.8 ± 0.17 b,B5.55 ± 0.15 b,B210.4–334.1 ± 0.34 c,A44.13 ± 0.14 b,B763.5–784.9 ± 0.23 a,B23.82 ± 0.19 b,B******26.51 ± 0.18 c,B
12031.6–47.1 ± 0.09 c,B7.94 ± 0.13 c,B211.3–322.9 ± 0.18 d,B34.74 ± 0.21 c,B461.8–605.0 ± 0.36 c,B37.50 ± 0.07 c,B******19.82 ± 0.11 d,B
18032.0–46.8 ± 0.18 d,B7.32 ± 0.28 d,B220.8–327.0 ± 0.25 e,B38.94 ± 0.56 d,B456.1–595.4 ± 0.19 d,B41.92 ± 0.11 d,B******11.83 ± 0.15 e,B
24032.8–41.9 ± 0.21 e,B6.54 ± 0.02 e,B213.2–321.3 ± 0.71 f,B37.73 ± 0.97 e,B429.4–518.8 ± 0.22 e,B44.27 ± 0.16 e,B******11.46 ± 0.45 e,B
LPC, leaf protein concentrate; H–Pep, hydrolysate of pepsin; H–Pan, hydrolysate of pancreatin. Different lowercase letters in the same column indicate significant differences (p < 0.05) between hydrolysis time for the same enzyme. Different capital letters indicate significant differences (p < 0.05) between H–Pep and H–Pan at a given time. ***: not detected.
Publisher’s Note: MDPI stays neutral with regard to jurisdictional claims in published maps and institutional affiliations.