Article

Electrical Conductivity and Viscosity in Binary Organic Liquid Mixtures: Participation of Molecular Interactions and Nanodomains

Department of Chemistry, University of Surrey, Guildford, Surrey GU2 7XH, UK
*
Author to whom correspondence should be addressed.
Colloids Interfaces 2020, 4(4), 44; https://doi.org/10.3390/colloids4040044
Submission received: 22 August 2020 / Revised: 22 September 2020 / Accepted: 6 October 2020 / Published: 14 October 2020

Abstract

:
The present work aims to shed light on recent literature reports suggesting that ionic species are implicated in the electrical conductivity of 1-octanol and its mixtures with hydrocarbons. Other workers have questioned this interpretation, and herein, based on new experimentation and with reference to various literature studies, we consider that molecular interactions are more likely to be responsible. To investigate this, we have studied mixtures of 1-octanol and either silicone oil (SO) or n-dodecane as nonpolar components, using dielectric (in particular electrical conductivity) and viscometric measurements. With reference to the literature, the self-association of alcohols is known to create microheterogeneity in the neat liquids and in mixtures with nonpolar, low dielectric constant liquids, and it has previously been considered to be responsible for the particular solvent properties of alcohols. The present results suggest that the electrical conductivity of alkane/alcohol systems may have similar origins, with percolating pathways formed from octanol-rich nanodomains comprising polar regions containing hydrogen-bonded hydroxyl groups and nonpolar regions dominated by alkyl chains. The percolation threshold found for dodecane/octanol mixtures, in which interactions between the component molecules are found from viscosity measurements to be repulsive, agrees well with results from experimental and theoretical studies of disordered arrangements of packed spheres, and moreover, it is consistent with other published alkane/alcohol results. On the other hand, the situation is more complex for SO/octanol mixtures, in which interactions between the two components are attractive, based on viscosity data, and in which the phase separation of SO occurs at high octanol concentrations. Overall, we have concluded that electrical conductivity in octanol (and potentially all liquid alcohols) and its mixtures with nonpolar molecules, such as alkanes, is consistent with the presence of conducting networks comprising octanol-rich nanodomains formed by self-association, and not as a result of ionic conduction.

Graphical Abstract

1. Introduction

The present work considers how molecular interactions in binary organic liquid systems containing polar and nonpolar components influence physical properties such as electrical conductivity and viscosity. In addition to ongoing fundamental interest in the composition–property relationships of mixtures, there is relevance to applications, such as the formulation of liquid fuels, which variously contain hydrocarbons, alcohols, and esters [1], and predicting the efficiency of heat transfer fluids [2,3].
Previous studies on associating liquids [4] have employed a variety of techniques to investigate, for example, hydrogen bonding [5], nanostructuring and self-assembly [6], and microheterogeneity [7,8]; of particular focus has been to understand the solvent properties of alcohols [9]. 1-Octanol has been a prime candidate in this regard owing to its importance as a biomembrane surrogate and its adoption as a means of characterizing hydrophobicity as a measure of pharmacological activity through octanol/water partition coefficients [10].
Herein, we use electrical conductivity (determined using dielectric spectroscopy) and viscometric measurements to obtain molecular and nanostructural information on mixtures of 1-octanol with two different hydrophobic liquids, n-dodecane and silicone oil. In these liquids and liquid mixtures, dielectric properties are governed by molecular association, principally involving hydrogen bonding. Viscometry is sensitive to intermolecular interactions in liquid mixtures, leading to deviations from ideal mixing behavior [11,12,13,14]. Dielectric studies relating to alkane/alcohol mixtures, thereby also probing liquid microstructure, have largely involved the determination of relaxation phenomena and dipole moments using permittivity and impedance measurements [15,16,17,18,19,20,21,22,23,24,25].

1.1. Electrical Conduction in Non-Aqueous Liquids

Research into the electrical conductivity (σ) of non-aqueous liquids began largely around the turn of the 20th century, following on from studies of ionic conduction in aqueous solutions. Early studies by Kahlenberg and Lincoln [26], and extended by Lincoln [27], demonstrated that the electrical conduction of salts increased with the increasing dielectric constant of the solvent, emphasizing the importance of dissociation and ionic conduction, even in non-aqueous environments. Subsequent researchers, for example Shaw [28] and Kraus and Fuoss [29], considered the electrical conductivity of organic salts in organic liquids from experimental and theoretical viewpoints. More recent developments have shown that the same theories can also be applied to the advancing area of ionic liquids (ILs) [30], although in these systems, the bulky ions make liquid viscosity (η) a more important consideration than is normally encountered in aqueous systems, fitting well with the Walden relationship σ ~ 1/ηα, where α ≈ 1 [31].
A recent study by Bombard and Dukhin [32] showed that the electrical conductivity of poly(α-olefin) (PAO)/1-octanol mixtures increased by five orders of magnitude between 100% PAO and 100% octanol. This prompted the authors to propose an ionization mechanism, involving alcohol autoprotolysis above a “critical micelle concentration” (≈20 wt% octanol), as being responsible. In a subsequent investigation of toluene mixtures with several different alcohols, Dukhin and Parlia [33] suggested that electrical conductivity depends on the concentration of ion pairs, which varies with the dielectric constant of the mixtures. However, others have subsequently questioned these explanations, on the grounds that they do not adhere to classical thermodynamics [34,35]. In addition, Gourdin-Bertin and Chassagne [34] reasoned that autoprotolysis would not account for the observed electrical conductivity behavior because only very low concentrations of ionic species would be present. Moreover, the role of composition-dependent ion pairing was also questioned [34]. However, on the whole, even though the previous studies have presented accompanying theories that apparently give acceptable fits to the experimental data, the overall picture is confusing, with impurities also being implicated, including water [34,35,36], with the overall conclusion being that further work was required [34].
It was findings such as given above that provided the motivation for the present investigation. Our particular concern is that previous studies have paid little attention to the relatively extensive literature on molecular interactions and nanostructural features of alcohols in their neat states and diluted with nonpolar solvents. In the context of electrical conductivity, this led us to hypothesize that conduction in low dielectric constant molecular liquids is consistent with the present knowledge of molecular organization in these systems.

1.2. Evidence for Liquid Nanostructure

The nanostructure of 1-octanol in both liquid and glassy states has been studied using various analytical techniques over the past 25 years. One of the earliest investigations using X-ray diffraction (or small-angle X-ray scattering, SAXS) revealed the presence of molecular aggregates (clusters) in dry 1-octanol, with estimated aggregation numbers of ≈12; it was suggested that these comprise hydroxyl groups surrounded by extended C8 hydrocarbon chains, similar to reverse micelles [37]. More recent studies indicate the presence of larger, linear structures [6,38], which Cevc et al. [6] have termed “inverse bilayers” occupying “a thermally distorted lattice”. As will be seen, this is relevant to the potential role that nanodomains could play in charge conduction in octanol. Additionally, the concentration dependence of the dipole moment of octanol in solvents such as cyclohexane and n-hexane are consistent with this [16]. Thus, Figure 1a shows that the dipole moment increases at the highest concentrations [16], which is attributed to an increase in the concentration of associated species, such as chains of octanol molecules (e.g., Figure 1b [39]). Furthermore, it is found that the addition of n-octane to octanol (6:1 octanol:octane, i.e., 87 wt% octanol, equivalent to ≈0.86 mole fraction) results in the formation of a mesophase [6,40], thereby relieving the nanocluster packing stress. Assuming that the same mole ratio is applicable to other alkanes, this would be equivalent to 82 wt% dodecane, which is relevant to the present work.
Further support for the presence of nanostructures has been derived from a number of Fourier-transform infrared (FTIR) spectroscopy investigations. FTIR spectroscopy has been used to identify free and associated O-H stretching bands for the monomer and oligomeric species, allowing, for example, the identification of dimeric, trimeric, and tetrameric species [41,42,43,44,45,46]. In particular, cyclic tetramers are generally considered to be the most abundant of the aggregated species in pure octanol and decanol and their solutions in alkanes, although linear polymeric structures are indicated through viscosity and dipole moment determinations [9,12,16,47].
Much of the foregoing is also consistent with computational results. Molecular dynamics studies indicate that the structure of 1-octanol consists of fluctuating polar (hydroxyl groups) and nonpolar (hydrocarbon) regions, including inverted micellar aggregates [48]. In a separate study, the hydroxyl regions were reported to cluster into long chains, an example of which is shown in Figure 1b [39]. Likewise, quantum–chemical calculations have also indicated the presence of chain-like structures (as opposed to cyclic, closed-ring structures) in 1-octanol, as steric repulsion competes with hydrogen bonding to control the structure in the liquid phase [49].
Therefore, on the basis of the above, it seemed reasonable to us that nanodomains providing molecular connectivity in alcohols, such as 1-octanol, could also be implicated in electrical conduction, as well as suggesting how this may be influenced by dilution.

2. Materials and Methods

Three binary liquid systems were chosen for study: n-dodecane/1-octanol, because of its similarity to the PAO/1-octanol system of Bombard and Dukhin [32]; silicone oil/1-octanol, which from preliminary observation was found to exhibit a phase transition within the composition range at ambient temperature; and silicone oil/1-octanoic acid, to contrast with the corresponding alcohol system. The possibility of autoprotolysis is potentially greater for 1-octanoic acid, but it is also known to exist as self-assembled hydrogen-bonded dimers in the liquid state at ambient temperature, thus preventing the formation of an extensive network structure [50]. Therefore, we reasoned that including this liquid in the study would be valuable in understanding the alcohol conduction mechanisms. By comparing activation enthalpies from viscosity and self-diffusion (by NMR) measurements for octanol and octanoic acid in n-decane, Iwahashi et al. [51] identified additional restrictions (due to more extensive hydrogen bonding) in the octanol system, the values being −27 and −18 kJ/mol, respectively, from both techniques. The octanol value compares well with the cooperative hydrogen bond enthalpy of −22 kJ/mol obtained by Palombo et al. [52].

2.1. Materials

Silicone oil (SO; nominal kinematic viscosity = 20 cSt) was a generous gift from S. Black Ltd. (now Azelis, Hertford, UK). All other liquids were obtained from Sigma-Aldrich (Gillingham, Dorset, UK). 1-Octanol (“octanol”) was of analytical grade (99.5% purity) and was dried over activated molecular sieves 5 Å. The SO was used as-received, whilst the n-dodecane (“dodecane”) was ≥99% purity and was passed through an activated alumina column to remove surface-active impurities before use. 1-Octanoic acid (“octanoic acid”) was used as-received. Binary liquid mixtures were prepared on a wt/wt basis, as adopted elsewhere [32]. Each mixture was shaken immediately before making measurements at ambient temperature (24.0 ± 0.5 °C). Some phase separation was seen on standing in the SO/octanol mixtures above ≈40 wt% octanol, as is evident in Figure 2.

2.2. Methods

Dielectric measurements were made using a broadband dielectric spectrometer from Novocontrol Technologies GmbH (Montabaur, Germany). The system consists of a frequency response analyzer with a sine wave and DC (direct current)-bias generator and two AC (alternating current) voltage input channels enabling a range of dielectric parameters to be determined, primarily the real component of electrical conductivity (σ′) and impedance (Z′ and Z″). Typically, 115 measurements per sample (≈2 mL) contained in a parallel plate cell (effective dimensions: diameter = 20 mm, thickness = 4.55 mm) were recorded at ambient temperature (24 ± 0.5 °C) over the frequency (f) range 10−2 to 107 Hz. DC electrical conductivity (σDC) values were determined, in some cases (e.g., at low octanol concentrations) by extrapolating the linear portion of the σ′-f data as f → 0; these measurements approximate well to values at 1 Hz, as used by Bombard and Dukhin [32].
However, unlike in Bombard and Dukhin’s study [32], the pairs of liquids used herein were not viscosity-matched, and therefore, in order to consider its possible influence on electrical conductivity, mixture viscosity was also determined. Thus, the dynamic (shear) viscosity of each mixture was measured as a function of shear rate using a Low Shear 30 rheometer (Contraves A.G., Zürich, Switzerland, but now available as the ProRheo LS 300 (ProRheo GmbH, Althengstett, Germany) at the same (ambient) temperature as the electrical conductivity measurements. Although the mixtures exhibited near-Newtonian behavior throughout the shear rate range studied (≈1–150 s−1), in the following analysis, dynamic viscosities (η) are quoted at a shear rate of 20 s−1.

3. Results

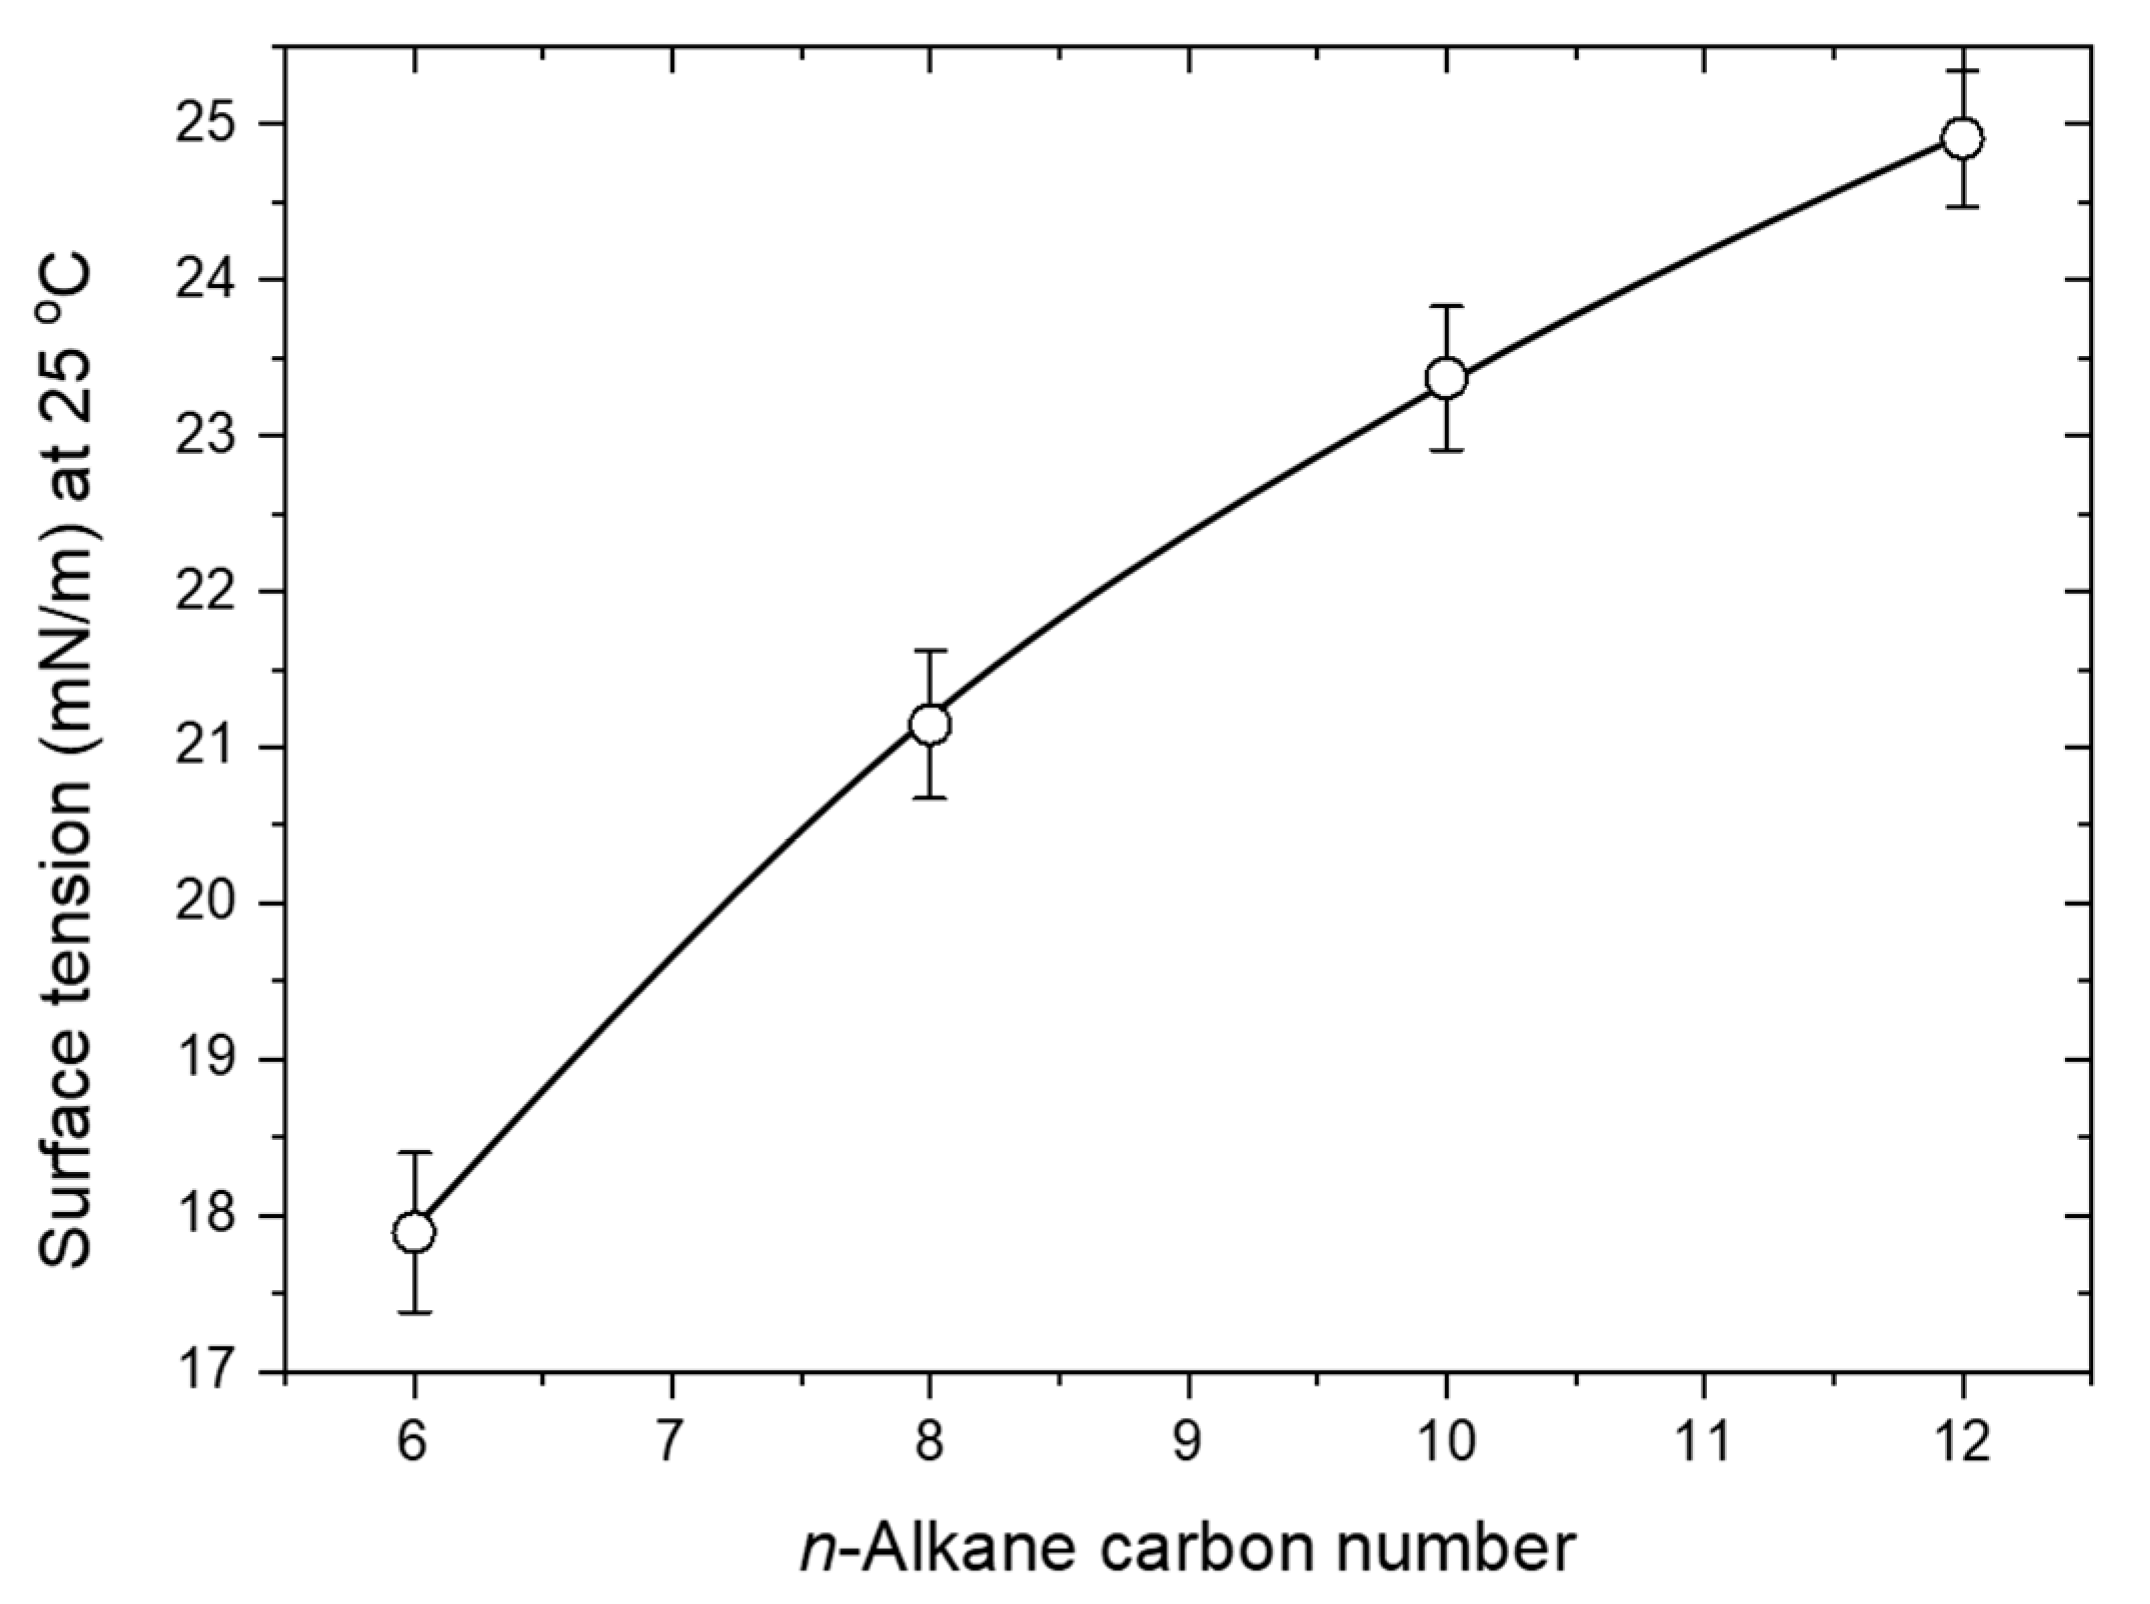
3.1. Properties of the Liquids

The electrical conductivity, relative permittivity, surface tension, and viscosity of the individual liquids are given in Table 1. It can be seen that the electrical conductivity and permittivity are low for n-dodecane, silicone oil, and 1-octanoic acid. It is important to note that the electrical conductivity of 1-octanol is around four to five orders of magnitude greater than the other liquids. The dynamic viscosity is highest for silicone oil, which comprises approximately 30 dimethylsiloxane (DMS) repeat units, i.e., H3C-[Si(CH3)2-O]n–CH3, with a molecular weight of ≈2000 [53]. The surface tensions of the liquids are all similar, the relatively low values indicating that the liquids are dominated by dispersion interactions; the slightly higher surface tension for 1-octanol indicates a relatively small degree of polar (including hydrogen bonding) character (also consistent with its dielectric constant value of ≈10 and dipole moment ≈1.7 D in dilute solution [16].
As mentioned above, Bombard and Dukhin [32] suggested that ionic species derived from autoprotolysis (self-ionization) are responsible for the observed increase in electrical conductivity seen in their PAO/octanol system. In the present study, octanoic acid was chosen for comparison with 1-octanol, since we reasoned that self-ionization of the acid would be more favorable. Although relevant self-ionization data are scarce in the literature, autoprotolysis constants, Kap = a S H 2 + a S a S H 2 , for the general self-ionization reaction SH + SH ↔ SH2+ + S have been reported to be ≈10−20 for octanol, compared with higher values for fatty acids (e.g., 10−7 and 10−15 for formic and acetic acids, respectively) [56]. However, as Table 1 shows, the intrinsic electrical conductivity of the alcohol is ≈14,000 times greater than that of the acid. The low electrical conductivity of the acid is also consistent with the observation by Guo et al. [57] that the dosing of oleic acid into oleate surfactants produced no significant effect on this property. It is also evident that the viscosities of octanol and octanoic acid are very similar, discounting this property as being implicated in the difference in conductivity. Therefore, on the basis of this, the electrical conductivity of these liquids is likely to be a consequence of molecular properties, rather than involving free ions, the dielectric behavior generally being governed by dispersion and absorption characteristics, following Debye’s theory [24].
Table 1 shows that the relative permittivity (dielectric constant, ε) of the alcohol is higher than for the acid. In fact, the dielectric responses of these polar components, which are evident in the electrical conductivity (σ) and permittivity measurements, will in part reflect hydrogen bonding characteristics. In this connection, FTIR spectroscopic evidence has been used to identify different hydrogen bonding behaviors in alcohols and fatty acids, although the subject with respect to alcohols is still under some debate. In the case of carboxylic acids, dimerization through hydrogen bonding leads to closed-ring structures that are sufficiently long-lived to be observable spectroscopically [58]. Therefore, dimer formation, as mentioned above, serves to restrict the formation of an extensive hydrogen bonding network throughout the liquid.
Therefore, it is evident from these comments that the alcohol will have different propensities to store charge (i.e., ε), as well as to conduct charge (i.e., σ), possibly through a proton hopping mechanism or by electron transport within the hydrogen bonded network [59]. Without such extensive conduction pathways, as in the case of the acid, the liquid will be more insulating. (Note that the complex permittivity is given by ε * = ε′ + ″, and σε *ω, where i = 1 and the angular frequency, ω = 2πf.)

3.2. Dynamic Viscosity of Binary Mixtures

Figure 3 shows the dynamic viscosity–composition behavior for the three binary systems. Expressed as functions of volume fraction in Figure 3a, it can be seen that dodecane/octanol and SO/octanoic acid mixtures each show smooth, non-linear transitions between the viscosities of the pure components. On the other hand, SO/octanol exhibits a discontinuity at an octanol volume fraction of ≈0.5–0.6, which is most likely due to immiscibility, since this appears to correspond to the region of phase separation evident in Figure 2b.
The solid curves drawn through the mixture viscosity (ηm) data for dodecane/octanol and SO/octanoic acid show good fits to Equation (1), in which η1 and η2 are the viscosities of the two liquids and ϕ1 (taken here to be the more polar component) and ϕ2 (= 1 − ϕ1) are their respective volume fractions.
Φ12 is a term reflecting deviations from linearity. The red short-dashed line also uses Equation (1) and is based on the low concentration SO/octanol data only (ϕ1 < 0.2); this has been used to estimate the behavior of this system assuming complete miscibility, which predicts that octanol behaves similarly to octanoic acid at low concentrations. The observed deviations from this curve shown by the experimental data highlight the effects of miscibility in the SO/octanol system. Fitting parameters for Equation (1) are summarized in Table 2.
ln η m = ϕ 1 ln η 1 + ϕ 2 ln η 2 + Φ 12 ϕ 1 ϕ 2
The excellent fits to Equation (1) shown by dodecane/octanol and SO/octanoic acid are perhaps a little surprising, since this is a variant of the well-known Grunberg–Nissan relationship [60] which is based on mole fraction (x), rather than volume fraction, i.e., Equation (2),
ln η m = x 1 ln η 1 + x 2 ln η 2 + G 12 x 1 x 2
in which x1 and x2 (= 1 − x1) are the corresponding mole fractions, and G12 is an interaction parameter that is sometimes referred to as the interchange energy and is considered to be related to the strength of the molecular interactions responsible for non-ideal behavior [61].
In addition, for the SO/octanol system at ϕ1 > 0.6 in Figure 3a a computed curve based on Equation (3), the Krieger–Dougherty (K-D) relationship [62] which is frequently used to predict the viscosity of dispersions over a wide concentration range is also shown (as the long-dashed line).
η η c = ( 1 ϕ ϕ m a x ) [ η ] ϕ m a x
In Equation (3), η and ηc are the respective viscosities of the disperse and continuous phases, ϕ is the volume fraction of the disperse phase, ϕmax is a maximum packing volume fraction (at which point the viscosity becomes infinite as the dispersion jams), and [η] is the intrinsic viscosity for SO droplets. In the SO/octanol system, as ϕ1 → 1, we assume that SO is immiscible with octanol (i.e., ηc = η1) and the mixtures become SO-in-octanol dispersions, as seen in Figure 2b (although we cannot exclude the possibility that there may be some octanol solubility in SO in this concentration region). Therefore, unlike for miscible mixtures, we are able to calculate volume fractions from weight fractions and the respective liquid densities in order to fit the high concentration data with Equation (3).
Therefore, with reference to Figure 3a, it is evident that there is good agreement between the experimental data and the K-D prediction from Equation (3) using ϕmax and [η] values of 0.46 and 0.80, respectively. We note that, although [η] is lower than the value of 2.5 for rigid spheres, other factors, such as the viscosity ratio and capillary number ( C a = η c r γ ˙ / γ , where r is the droplet radius, γ is the interfacial tension, and γ ˙ is the shear rate), can reduce [η] for emulsion droplets [63] under the conditions of the present viscosity determinations for which Ca ≈ 10−5–10−4. Thus, this suggests that the viscosity behavior observed at higher octanol concentrations for SO/octanol mixtures is consistent with the presence of dispersed SO droplets.
In Figure 3b, the viscosity results are plotted as a function of mole fraction. Here, differences between the systems become evident in different ways, but specifically in relation to deviations from ideal behavior. However, compared to dodecane/octanol mixtures, data for SO mixtures become displaced toward larger values of x1 owing to the high molecular mass of silicone oil. In the case of the SO/octanol system, the greatest changes in viscosity are seen in the region x1 ≈ 0.90–0.95.
The solid lines shown in Figure 3b are based on the single-parameter Grunberg and Nissan model, Equation (2), for dodecane/octanol mixtures over the entire concentration range and SO/octanol mixtures for 0 ≤ x1 ≤ 0.65. Fitting parameters are given in Table 2. For x1 → 1, the experimental data are dominated by the Krieger–Dougherty behavior, indicating that the SO/octanol system is characterized by both miscible and dispersed (SO-in-octanol) regions.
Owing to the similarity of the physical properties of the two components, the viscosity data for the dodecane/octanol mixtures shown in Figure 3a,b show excellent agreement with both Equations (1) and (2) over the whole composition range (for volume and mole fractions, respectively). In the case of the mole fraction data, as with the volume fraction data, the respective interaction parameters are both negative, as shown in Table 2. Negative G12 values have previously been attributed to the disruption of hydrogen bonding in alcohols [61,64].
On the other hand, the Grunberg–Nissan analysis for SO/octanol mixtures at x1 < 0.65 yields a positive G12 value, indicating increased association within this concentration range, even though the fits of the volume fraction data to Equation (1) for SO/octanol and SO/octanoic acid yield negative Φ12 values. However, the SO phase separation observed at the highest octanol concentrations (Figure 2b) is consistent with a positive G12 value, suggesting that the association of SO molecules may occur progressively throughout the octanol concentration range.
Interactions in the three binary systems can also be analyzed through the excess viscosity plots shown in Figure 4. Typically, this analysis is used to demonstrate non-ideality in the study of liquid mixtures. Excess viscosity, Δη, is defined in Equation (4).
Δ η = η m ( x 1 η 1 + x 2 η 2 )
In Figure 4a, the results from this study for n-dodecane are compared with other n-alkane/1-octanol excess viscosity data [12]. It is evident that the Δη—mole fraction curves for these binary liquid mixtures are consistently negative throughout the entire composition range. As is customary in this type of analysis, the curves are fitted with a Redlich–Kister polynomial function, which is generalized as:
Δ η = x 1 x 2 i = 1 m B i ( x 1 x 2 ) i 1
where m is the number of terms and Bi are the polynomial coefficients obtained from a least-squares fit to the excess viscosity data. For the binary liquid systems considered here, for which x2 = (1 − x1), Equation (3) becomes
Δ η = x 1 ( 1 x 1 ) i = 1 m B i ( 2 x 1 1 ) i 1
Figure 4a shows that the influence of mixture composition on Δη decreases in the order: n-hexane > n-octane > n-decane > n-dodecane, the largest deviations occurring for all alkanes at x1 between 0.6 and 0.7 [12], the minimum for n-dodecane being x1 ≈ 0.67. The weakening effect seen as the carbon number increases is probably a result of stronger alkane–alkane interactions, thus reducing the ability of the alkane molecules to disrupt hydrogen bonding between octanol molecules. Consistent with the Grunberg–Nissan analysis, negative deviations of this type are indicative of the breaking of interactions between the self-associated alcohols, replacing them with weaker interactions between unlike molecules [65].
Figure 4b shows the corresponding excess viscosity plots for SO mixtures with octanol and octanoic acid. Again, it is apparent that these systems produce the opposite effect on viscosity, compared with the dodecane/octanol system, with Δη being positive throughout the entire composition range. However, in this case, a Redlich–Kister analysis on the SO/octanol data failed to produce a satisfactory result, which is presumably due to the additional contributions of phase separation. Instead, the curve shown has been derived for the SO/octanoic acid system in order to illustrate comparative behavior expected in the absence of phase separation. Interestingly, once again, this shows a maximum displacement at a mole ratio, x1 ≈ 0.67.
Accordingly, on the basis of the differences seen in the viscosity analyses and the implications for molecular structuring in the mixtures, it would be anticipated that this would also be reflected in the electrical conductivity behavior of the different binary systems.

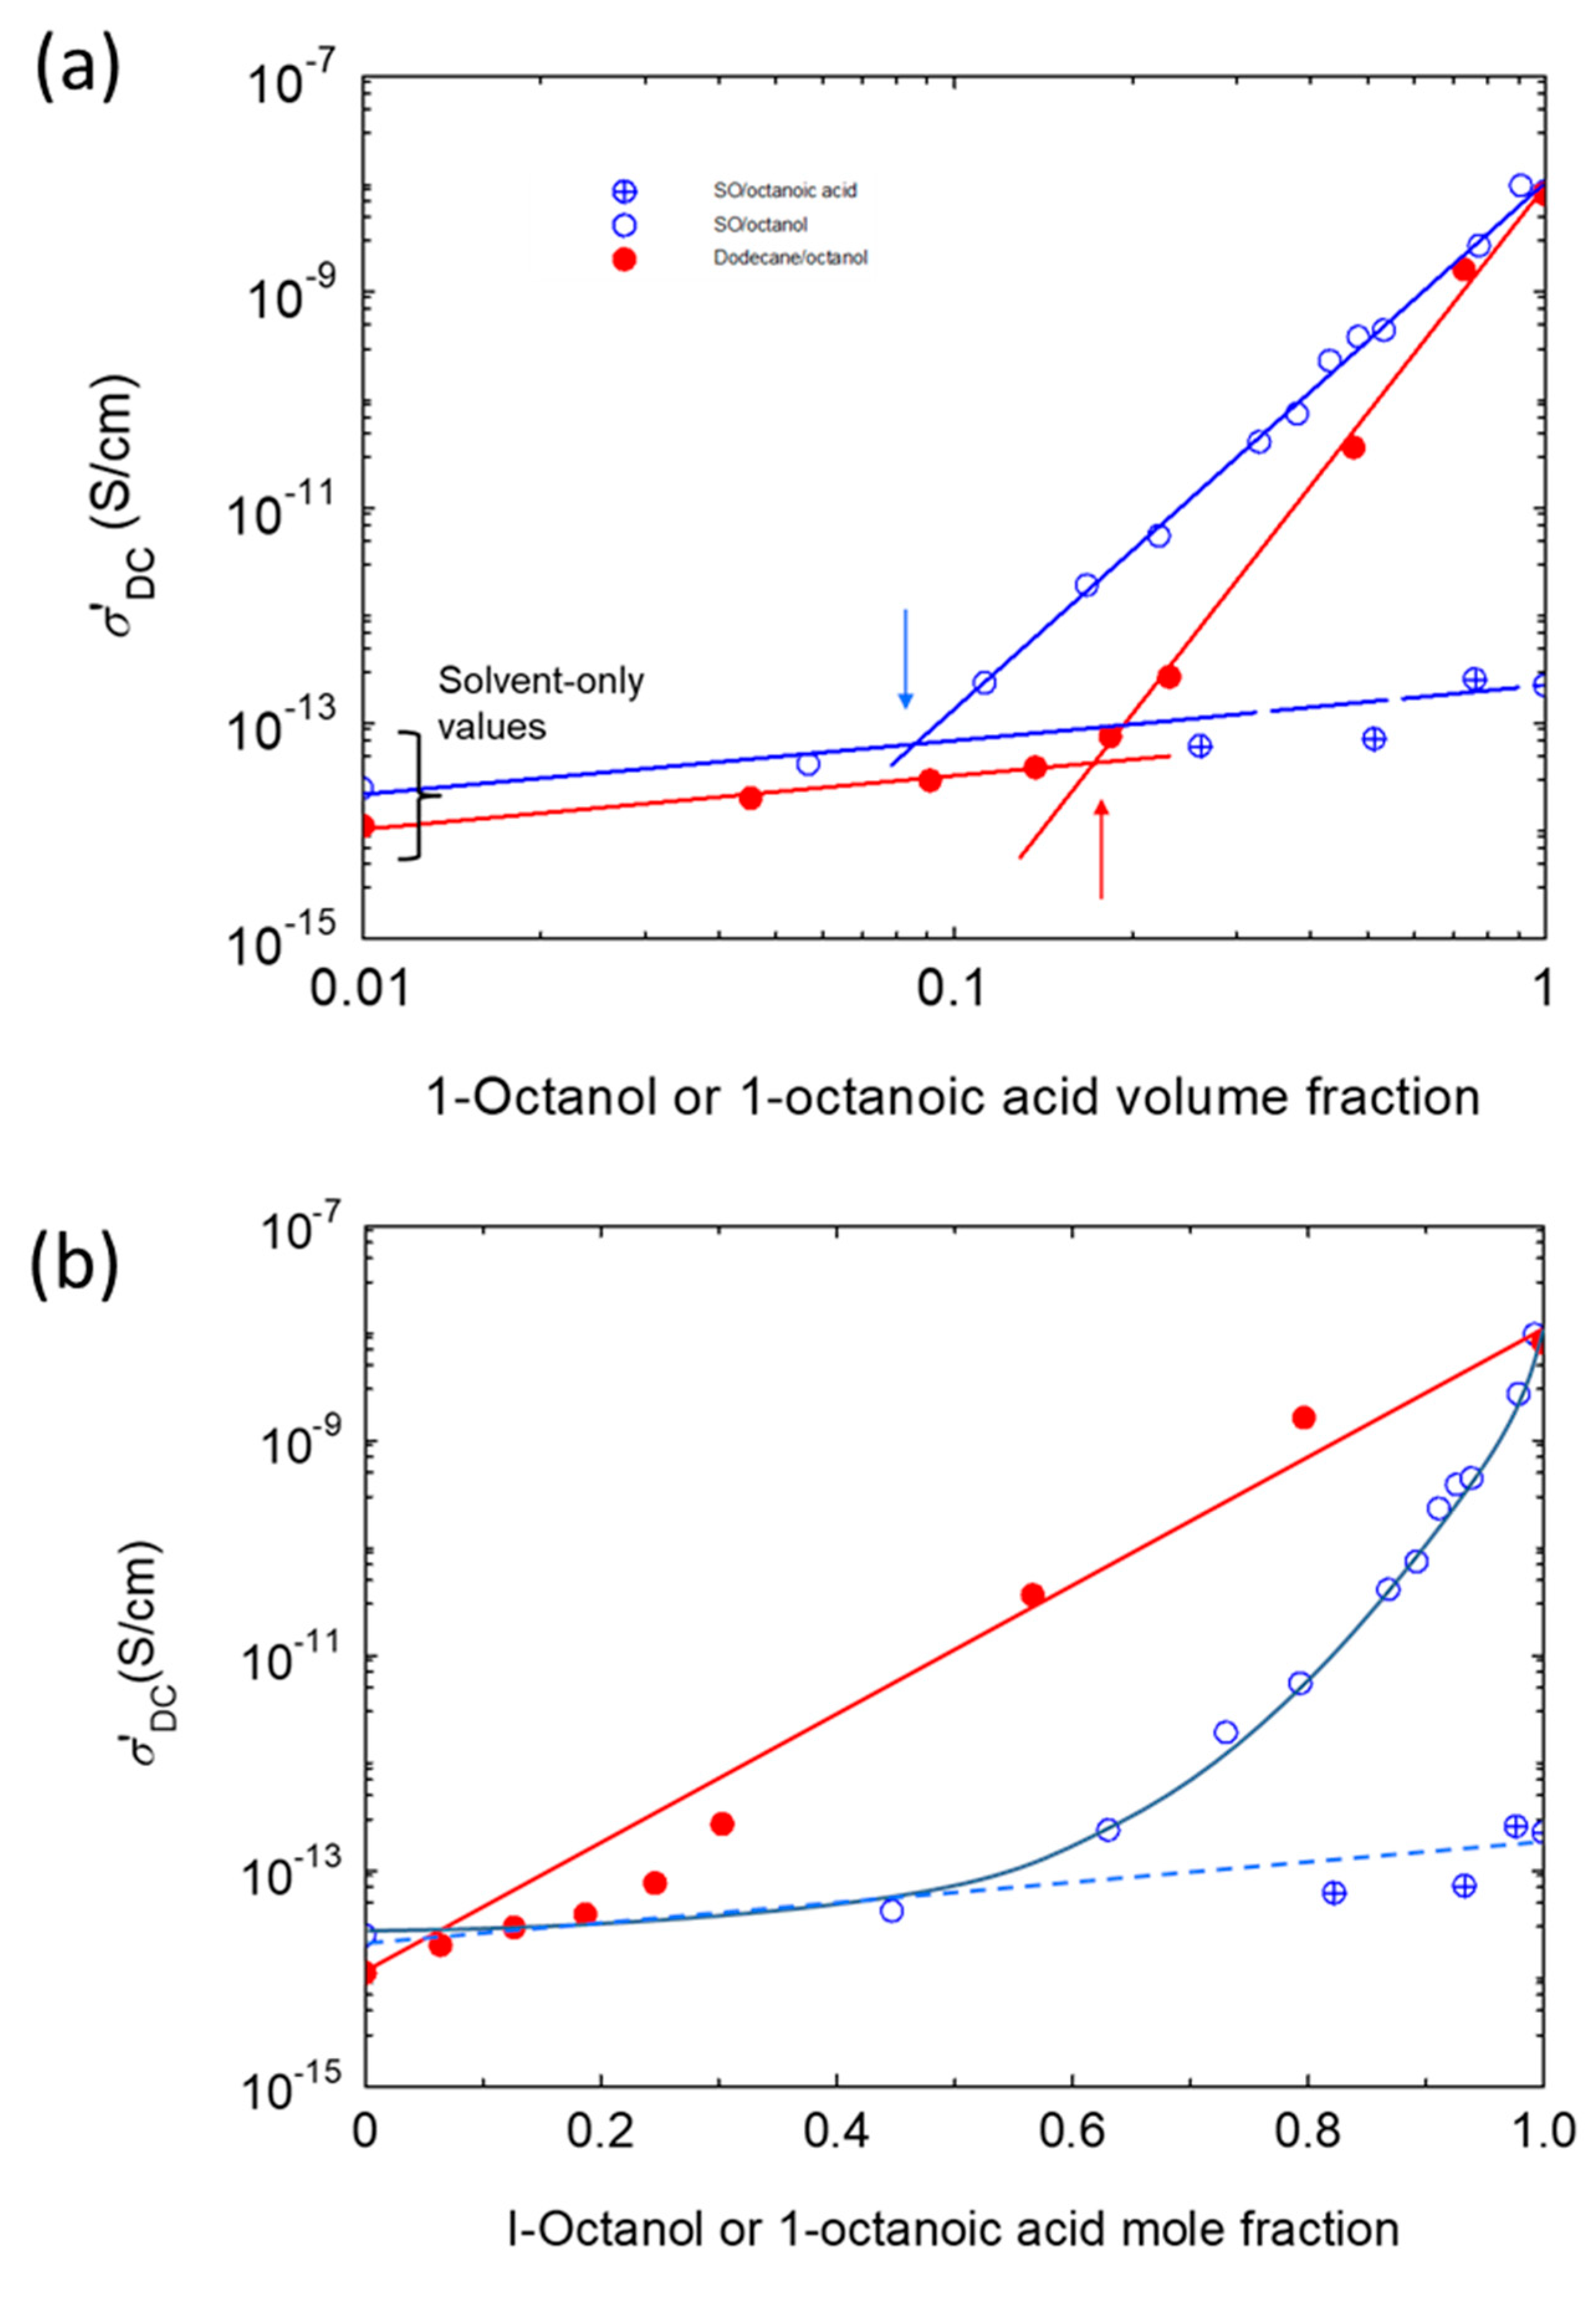
3.3. Dielectric and Electrical Conductivity Behavior of n-Dodecane/1-Octanol Mixtures

As well as permittivity, mentioned earlier, electrical conductivity is also a complex quantity (σ * = σ′ + ″, where σ *, σ′, and σ″ are the complex electrical conductivity and its real and imaginary components, respectively). Figure 5 shows the effect of measurement frequency on the real part of the electrical conductivity for dodecane/octanol (Figure 5a) and SO/octanol (Figure 5b) mixtures. Generally, it is seen that σ′ increases with increasing octanol concentration, spanning the range 10−14 to 10−8 S/cm, the approximate electrical conductivities of the component liquids. For both sets of mixtures, above ≈15 wt% octanol, σ′ is independent of frequency in the range 10−2–104 Hz, which is the DC (zero frequency) electrical conductivity, σDC. In contrast, at lower octanol concentrations, σ′ is frequency-dependent, and σDC is obtained by extrapolating the linear region, typically for f < 2 Hz, to zero frequency (shown for each system in Figure 5). From these data, which are more extensive for SO/octanol mixtures in Figure 5b, there is a suggestion that the transition from frequency-dependent to frequency-independent behavior occurs progressively within the indicated octanol concentration range, rather than necessarily occurring at a specific concentration.
σDC values for the dodecane/octanol system are plotted in Figure 6 as a function of concentration (expressed here as wt% on log–log axes to be consistent with literature data for the similar PAO/n-octanol system [32], also included in this figure). As presented, the trends observed in these two sets of data are very similar (compare the red data points and continuous black line), taking into account the different measurement conditions. In our system, the electrical conductivity remains below ≈10−13 S/cm and close to the dodecane value up to an octanol concentration of ≈20 wt%. The inset in Figure 6 shows the linearity of the low concentration dodecane/octanol data (i.e., ≤15 wt%) plotted on linear axes. In addition, by way of comparison, data from Gourdin–Bertin and Chassagne [35] for n-heptane/1-dodecanol mixtures in the presence and absence of an excess of solid potassium chloride are also indicated in this figure. It is clear that, notwithstanding the uncertainties associated with differences in the conditions under which the low conductivities of liquid hydrocarbons were measured (we estimate uncertainties in our data to be within ±5% of the indicated values), there is general consistency between the different sets of data.
Specifically, it can be seen that above a certain (wt%) concentration on log–log axes, the electrical conductivity increases from the low dodecane value toward the higher value for octanol. As we have said, our data compare very well in this respect with the results for the PAO/octanol system [32], allowing for a small effect arising from different measurement frequencies (zero and 1 Hz, respectively). However, the interpretation by the previous authors [32] that the break in the data at ≈10–20 wt% octanol represents a critical micelle concentration is unlikely. We propose to develop and discuss further explanations.
Figure 7 shows σDC results for the SO mixtures with octanol and octanoic acid as well as for the dodecane/octanol system by way of comparison. As presented on double-logarithmic axes as a function of volume fraction in Figure 7a, it can be seen that two straight lines, representing high and low concentration behavior, can be drawn through the data for the octanol-containing systems. These lines intersect at volume fractions of 0.085 and 0.173 for SO and dodecane mixtures, respectively. Results for the SO/octanoic acid system show no discernible deviation from the extrapolated low concentration line for the SO/octanol system, owing to the low electrical conductivity of the acid (Table 1).
The concentrations at which the lines intersect indicate changes in the conduction process for each system. In the case of dodecane/octanol mixtures, the linear dependence of σDC on concentration below 15 wt% (see the inset to Figure 6) suggests that octanol may be acting as a simple (conducting) solute within this concentration range.
In Figure 7b, the electrical conductivity data are shown as a function of mole fraction of the alcohol or acid. The results for the dodecane/octanol mixtures can be seen to follow a reasonable linear trend between the two extremes (on a log scale), albeit with some negative deviation toward lower octanol concentrations. On the other hand, the SO/octanol system shows considerable negative deviations throughout the entire composition range. Owing to the low electrical conductivity of octanoic acid, the behavior of SO/octanoic acid mixtures appears to be linear over the whole composition range, which tangentially matches the low concentration SO/octanol data. Characteristic data such as that shown in Figure 7b have been reported previously by Choudhary and Sengwa [66] for mixtures of higher electrical conductivity polar liquids. Straight lines drawn between the respective electrical conductivities of the components (i.e., from x1 = 0 to x1 = 1) plotted on a logarithmic scale represent “ideal mixing”, in which intermolecular interactions are weak over the whole composition range, although no explanation was given for why the dependence should be logarithmic [66]. At the present time, we are also unable to provide a theoretical justification of this treatment.
As can be seen in Figure 7b, the dodecanol/octanol and SO/octanoic acid systems appear to behave approximately ideally based on this definition, although this is trivial in the latter system owing to the small difference in electrical conductivity between the components (see Table 1). In contrast, the electrical conductivity of SO/octanol mixtures is lower than expected on a molar composition basis throughout the entire composition range. This can also be expressed in terms of a logarithmic excess molar electrical conductivity, ΔlnσDC, which is given by
Δ ln σ D C = ln σ D C 2 m ( x 1 ln σ D C 1 + x 2 ln σ D C 2 )
where σDC1, σDC2, and σDC2m are the respective DC conductivities of the polar and nonpolar components and of the mixture. The excess conductivity data are shown in Figure 8, in which the most notable feature is the large negative deviation in Δln σDC for the SO/octanol system for all compositions. This is in contrast to the dodecane/octanol plot, which shows variations around the ideal line seen in Figure 7b, decreasing in the lower concentration range and increasing at a higher mole fraction. Again, little can be learned from the SO/octanoic acid data, also shown in Figure 7b, although it is to be expected that the data would lie close to the y-axis. The curves drawn in Figure 8 for completeness are Redlich–Kister polynomials, as used above for excess viscosity.

4. Discussion

The present study was undertaken for several reasons, although, primarily, we were interested in addressing the electrical conductivity of binary mixtures of alcohols and hydrocarbons. It is evident from recent studies [32,34,35] that a satisfactory understanding of this area is incomplete. In particular, we were motivated to investigate how molecular interactions and liquid nanostructure may relate to electrical conduction in non-aqueous liquid mixtures containing alcohols and alkanes. Additionally, we were interested to determine whether a relationship existed between electrical conductivity and viscosity in binary liquid mixtures of this type, in the light of the recent interest being given specifically to ionic conduction [31]. We were influenced initially by the work of Bombard and Dukhin [32], who reported the electrical conductivity of mixtures of equiviscous PAO and 1-octanol, in order to circumvent effects due to changes in viscosity. However, viscosity changes are almost inevitable in associating systems [12], and therefore, we have considered the effects of mixture composition on both viscosity and electrical conductivity. We believe that the combination of these measurements allows a better understanding of the structure and interactions occurring in the systems under study.

4.1. Evidence of Molecular Interactions from Mixture Viscosity

The viscosity behavior as a function of mixture composition shown in Figure 3 and Figure 4 provides strong evidence for intermolecular interactions. For example, negative deviations from ideal behavior are evident in the case of dodecane/octanol mixtures, as shown in the excess viscosity plot in Figure 4a. As described above, this behavior is consistent with literature data for other n-alkanes with 1-octanol [12], albeit that deviations for n-dodecane are shown here to be smaller.
The excess viscosity plots shown in Figure 4a indicate that the maximum deviation corresponds to an octanol mole fraction of ≈0.6–0.7, which is ascribed to the disruption of octanol–octanol hydrogen bonding interactions by n-alkane molecules, which are not compensated by weaker octanol–alkane interactions [12]. As the alkane chain length increases, the cohesive forces between the alkane molecules also increase, as is evident, for example, in the trend of the respective liquid surface tensions [67] shown in Figure 9. For example, if n-dodecane (surface tension ≈ 25 mN/m) and n-hexane (surface tension ≈ 18 mN/m) are compared, the former would be expected to be less able to disrupt the octanol hydrogen bonding interactions.
For the dodecane/octanol system of our study, the maximum effect on Δη occurs at an octanol mole fraction of ≈0.67, corresponding to a mole ratio of octanol-to-dodecane of ≈2:1. At this point, octanol–octanol contacts are minimized [12], and it is tempting to suggest that the system resembles a random close-packed arrangement of alternating mutually repulsive dodecane and octanol molecules, for example, which is consistent with the negative Grunberg–Nissan G12 interaction parameter (−0.94, Table 2).
In the dodecane/octanol mixtures, the polar component is more viscous, but the opposite is the case for the SO-containing systems. Additionally, in the latter, the smaller polar components dominate in terms of the respective molar contributions, which accounts for fewer experimental points at low mole fractions. With reference to Figure 3 and Figure 4, the SO/octanol system is seen to be more complex than SO/octanoic acid. This is particularly evident in Figure 3a, from which derived curves have been generated for SO/octanoic acid (Figure 3b and Figure 4b), which we suggested could be used to simplify the behavior of the SO/octanol system for comparison purposes. The data in Figure 4b indicate that excess viscosities are positive for the SO mixtures, the derived curve for SO/octanoic acid producing a maximum positive value of Δη at the same mole fraction of the polar component as found for dodecane/octanol. Therefore, once again, it is tempting to suggest that the viscosity behavior is an indication of molecular structuring in the binary mixtures, with the mole ratio of ≈0.67 again indicating the optimum packing of the components to achieve the greatest change in viscosity. The Grunberg–Nissan G12 parameter obtained from the low octanol mole fraction region for SO/octanol mixtures in Figure 3b (i.e., before phase separation) is +0.34 (Table 2), indicating weak association of the components, in contrast to that found in the dodecane/octanol system. Therefore, this augments the viscosity in the case of the SO systems. Thus, the schematic in Figure 10a shows intercalated octanoic acid molecules within the silicone oil (polydimethylsiloxane, PDMS) matrix, hindering the flow of polymer molecules past each other. (Note that the molecular weight of PDMS comprising the 20 cSt silicone oil (≈2000 g/mol [53]) used in this study is well below the molecular weight at which chain entanglement is first observed, ≈27,500 [68]).
On the basis of the SO/octanoic acid system, the viscosity behavior of SO/octanol mixtures is suggested to contain contributions from two different mechanisms. At low octanol mole fractions, as illustrated by the octanoic acid surrogate, the increase in Δη most likely results from intercalated octanol molecules restricting the flow of polymer molecules past each other. However, the depiction in Figure 10b indicates that, unlike octanoic acid, various aggregated octanol species are also likely to be present (tetramers possibly being the most abundant, as described above). However, whether present as single molecules or aggregates, the introduction of polar species into the SO structure once again hinders the flow of the polymer chains. Thereafter, for SO/octanol mixtures containing > 0.94 mole fraction octanol, as outlined above, the decrease in viscosity (Figure 3b) is due to inversion of the SO-continuous mixture to an octanol-continuous mixture containing dispersed SO droplets (Figure 10c). Left to stand, the droplets coalesce to form a separate phase, as has already been noted with reference to Figure 2. Therefore, in the range 0.94 ≤ x1 ≤ 1, the presence of dispersed SO droplets would be expected to increase the viscosity with respect to octanol as the continuous phase, which is consistent with the Krieger–Dougherty equation (Equation (3)).

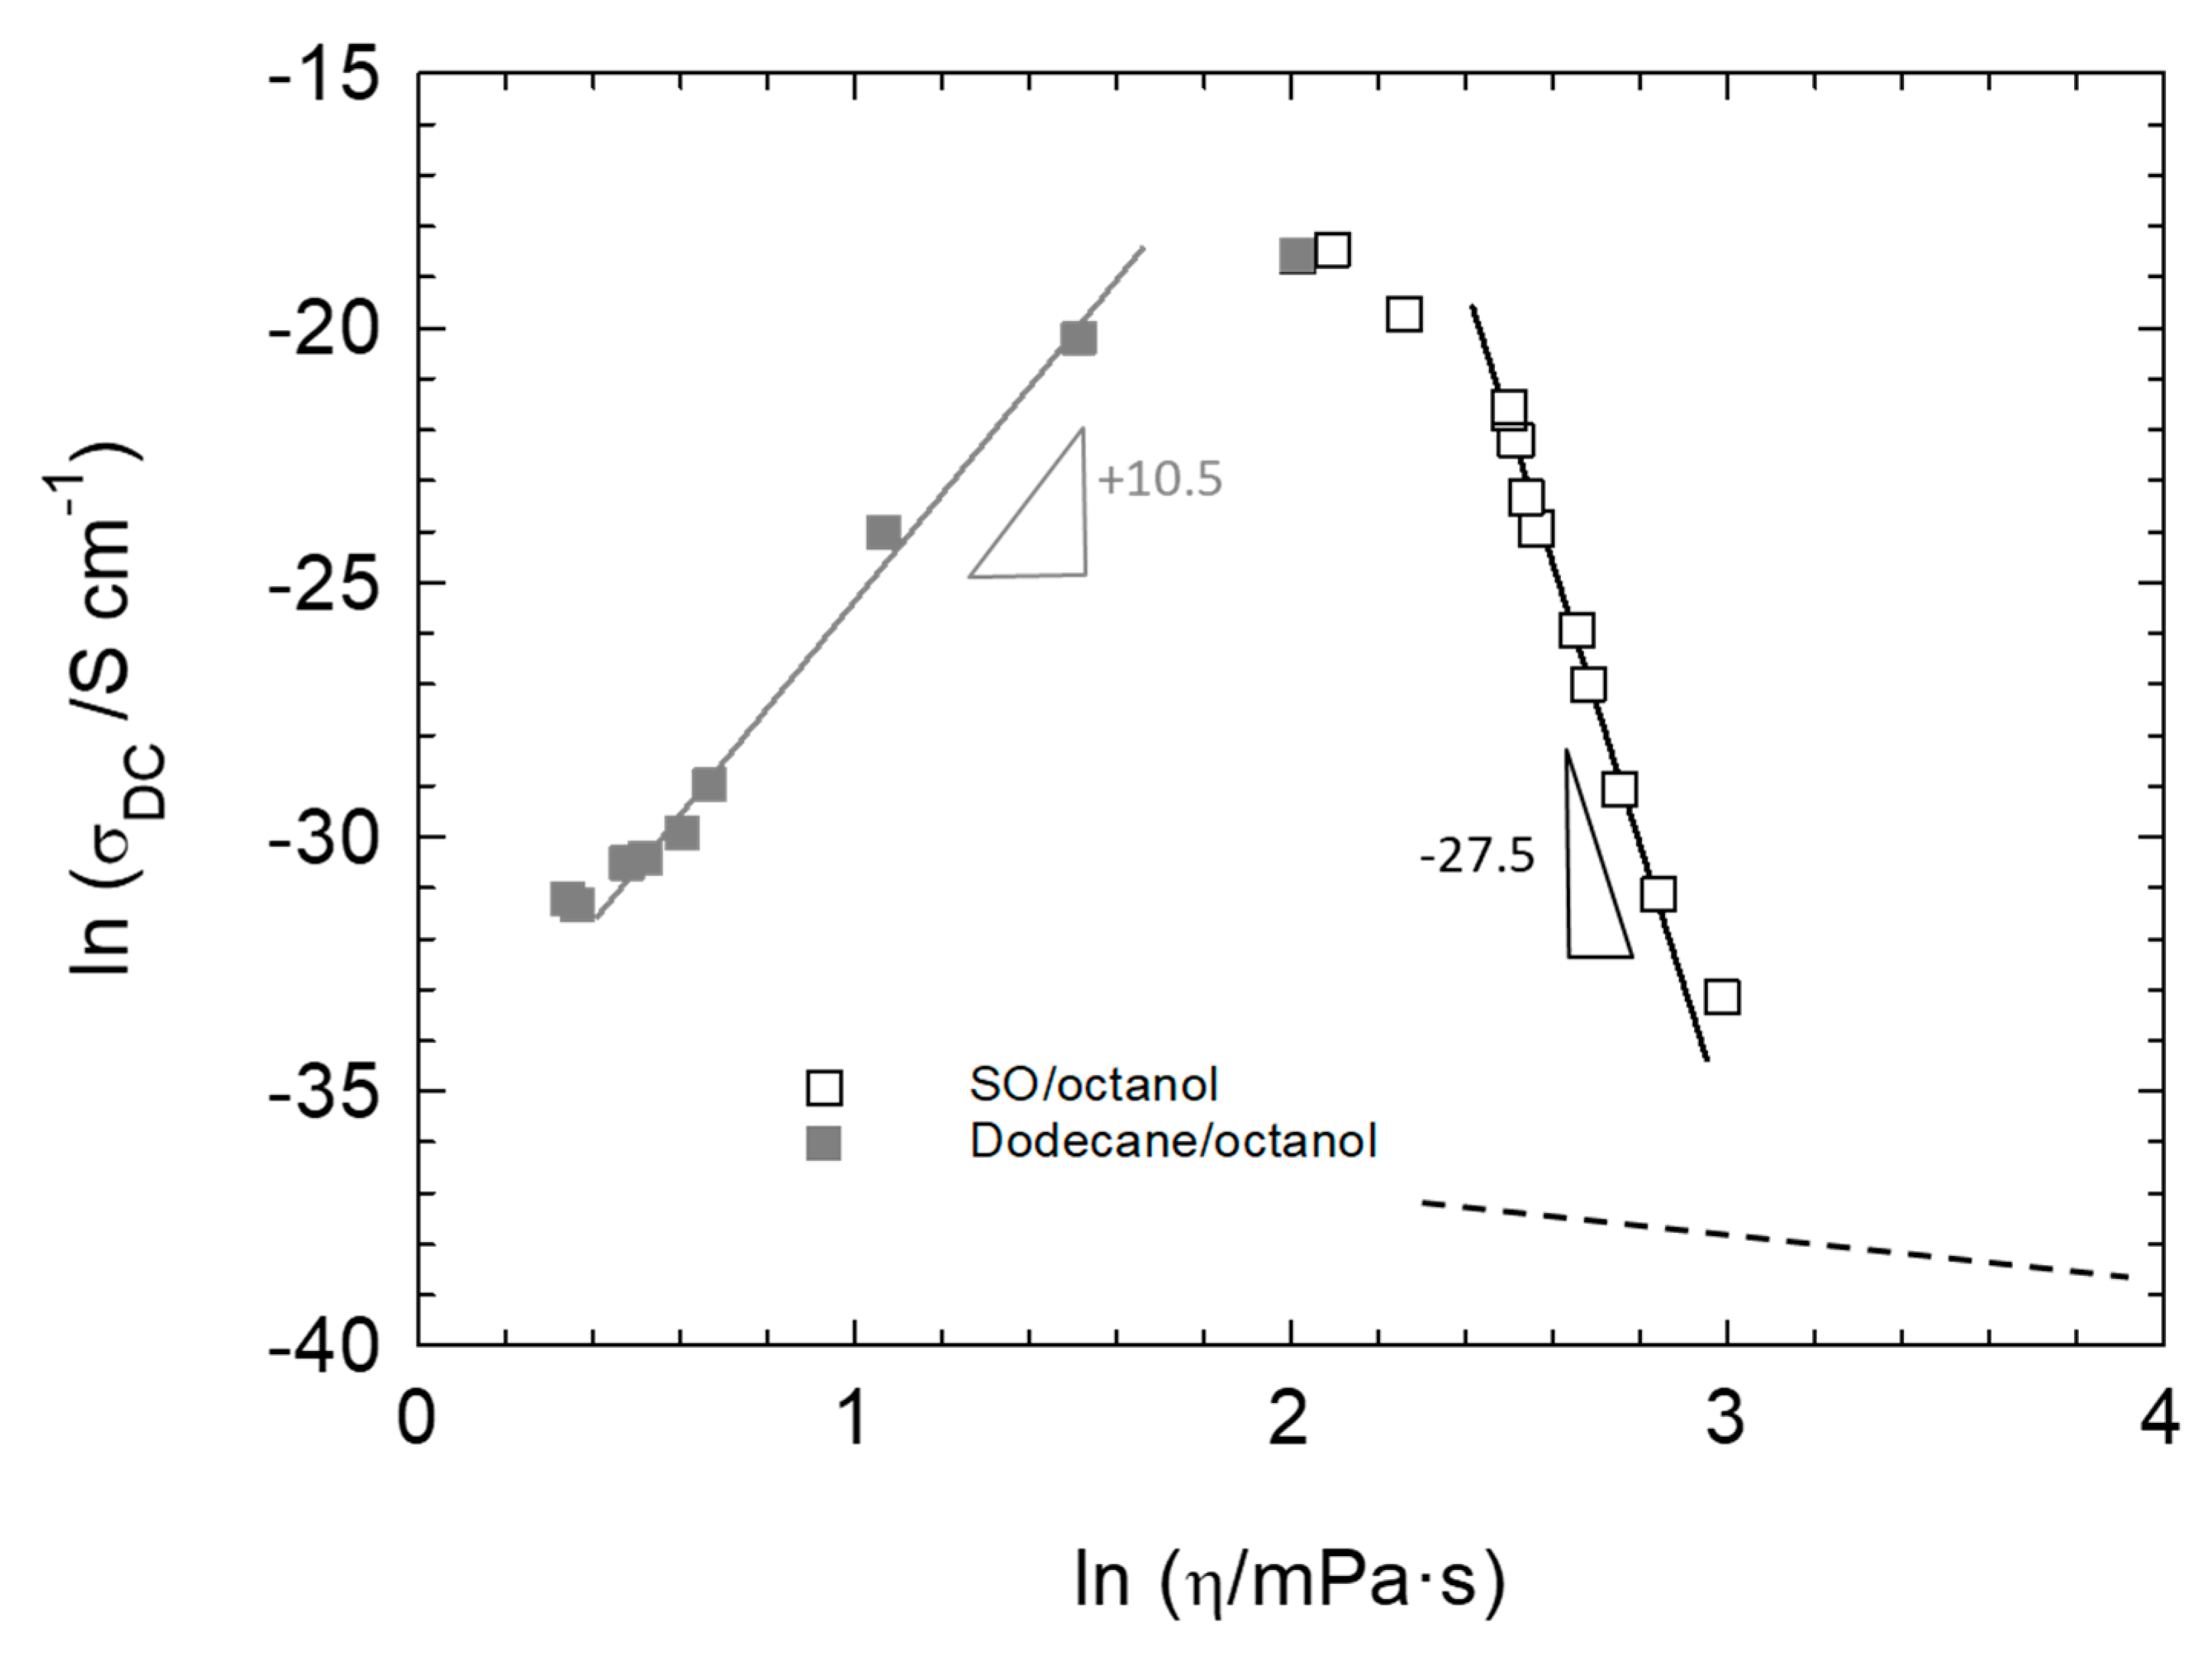
4.2. Electrical Conductivity Considerations

Using the viscosity analysis described above has enabled the development of representative models of the binary liquid mixtures in order to understand the corresponding electrical conductivity behavior. Thus, from the plots shown in Figure 6, it is seen that increasing the concentration of alcohol in dodecane (expressed as wt%) results initially in a slight increase in electrical conductivity, followed by a more rapid increase until the alcohol value is attained.
The double-logarithmic plots shown in Figure 7a highlight the change in behavior, and in particular, the concentrations at which this occurs for two of the systems. In these cases, changes in slope for dodecane/octanol and SO/octanol are apparent at volume fractions of 0.173 and 0.085 (octanol mole fractions of 0.23 and 0.55), respectively. We have already indicated that on physicochemical grounds, it is unreasonable to consider such concentrations as representing the formation of micelles (in their usual sense), although they do suggest a structural change at the molecular/nano-scale.
As demonstrated by the viscosity data and discussed above, the dodecane/octanol system behaves as simple mixtures of randomly distributed, weakly repulsive individual dodecane and octanol molecules. At a mole ratio of 3.3 (dodecane:octanol), i.e., the percolation threshold [69], the electrical conductivity starts to rise sharply with the increased growth of octanol–octanol contacts.
However, for the SO/octanol mixtures, the onset of increased conduction occurs at a lower volume fraction than for dodecane (Figure 7a), and in molar terms (Figure 7b), this corresponds to a critical SO:octanol mole ratio of ≈0.8, above which octanol conduction is effectively “screened”, as shown schematically in Figure 10b. The different mole ratios for the two octanol-containing systems reflect the comparative molecular sizes of dodecane and SO and their respective interactions with octanol. Therefore, the gradual increase in electrical conductivity within the low octanol concentration ranges for both dodecane and SO can be ascribed to a gradual reduction in the effective solvency of octanol molecules.
Interestingly, in the dodecane/octanol system, the critical octanol mole fraction of 0.23 occurs in the vicinity of the site percolation threshold found by packing conducting and non-conducting, but otherwise identical, spheres [70,71]. For three-dimensional models, cubic and face-centered cubic lattices exhibit percolation thresholds of 0.31 and 0.20, respectively, in which the coordination numbers, representing average sphere–sphere contact points, are between 6 and 12 [72]. (Percolation conditions could also be estimated for the other binary mixtures shown in Figure 6, taking into account the absence of lower concentration data.)
Therefore, the percolation composition is consistent with contact occurring between initially free octanol molecules in a close-packed structure containing dodecane molecules. This interpretation is supported by a near-IR study reported by Wrzeszcz et al. [7] showing that the highest population of free hydroxyl groups in the hexane/hexanol system occurs at 0.23 mole fraction, indicating that alcohol hydrogen bonding (i.e., octanol–octanol contact in our case) is not fully established below this composition. Exceeding this concentration results in increased alcohol–alcohol contacts, as also observed in other studies [6,42,45,51], leading to more extensive hydrogen bonding and aggregation (see Figure 1b), which enables more effective conduction. The corresponding effect of composition on viscosity in the dodecane/octanol system, which shows a maximum reduction at an octanol mole fraction of 0.67, indicates the sensitivity of this property to breaking octanol–octanol contacts, rather than their creation, as required in the case of electrical conductivity.
For the SO/octanol mixtures, the critical mole fraction of 0.55 for the onset of electrical conductivity does not lead to an exactly analogous interpretation, since SO is polymeric and consequently would not be expected to follow such simple packing concepts. Indeed, the higher critical mole fraction points to a very low percolation coordination number of ≈3 [72], as depicted in Figure 10b. In addition, direct comparisons with the viscosity analysis are complicated by phase separation. However, if we consider the SO/octanoic acid system as once again being analogous to the SO/octanol system but excluding intermolecular interactions responsible for phase separation, with reference to Figure 3a we see that the SO/octanol viscosity data begins to deviate at ~0.1 volume fraction. This is in the approximate region of the critical concentration obtained from the electrical conductivity measurements (i.e., 0.085 volume fraction). Therefore, in this region, octanol–octanol contacts are possible within the PDMS polymeric structure (shown in Figure 10b). As with the dodecane/octanol system, the apparent consistency of the results for the SO/octanol system supports the idea that octanol–octanol interactions, initially suppressed at low octanol concentrations, become increasingly important, both for viscosity and electrical conductivity. However, unlike the dodecane/octanol system, ln σ′DC is suppressed in SO/octanol mixtures (Figure 7b), since octanol is intercalated within the SO framework (Figure 10b), which is consistent with its positive G12 value. In effect, the dodecane/octanol system differs from the SO/octanol system because it is structurally “fluid”, and the close-packed structures readily reorganize. It is interesting to note that Kaatze and Behrends [23] also observed such “dynamic microheterogenity” within similar alkane/alcohol systems as a result of hydrogen bond fluctuations.
With reference to Figure 5, the frequency dependence of σ′ suggests that structural reorganization is taking place at low concentrations in both octanol-containing systems, until octanol becomes the dominant contributor to the electrical conductivity.

4.3. Relationship between Structure and Interactions, Viscosity, and Electrical Conductivity

Also under consideration in this study is how a combination of viscosity and electrical conductivity measurements can aid an understanding of the structure of binary alkane/octanol systems. For example, as discussed, it has been shown above that the viscosity of mixtures provides a strong indication of intermolecular interactions [12,51]. In addition, other techniques have identified apolar (hydrocarbon) and polar (hydrogen-bonded) nanodomains in octanol-containing systems [6,37,38,40].
Surprisingly, it appears that the two hydrophobic liquids used in this study interact with octanol in different ways, as indicated in the respective viscosity and electrical conductivity behavior. Specifically, it became apparent that the viscosity of the dodecane/octanol system is governed by the hydrophobic component disrupting the hydrogen bonding of self-assembled octanol molecules, whereas electrical conductivity relies on creating conducting octanol-rich nanodomains that extend throughout the mixtures. As discussed above, we suggest that the concentration and connectivity of the nanodomains dictate the mixture electrical conductivity beyond the percolation threshold.
At low octanol concentrations, the same mechanism is likely to be operative in mixtures with SO, as extensive hydrogen bonding in octanol is restricted (Figure 10b). However, at higher octanol concentrations, the phase separation of SO (Figure 10c) occurs, which is therefore less effective in disrupting octanol aggregates. This is seen in both the viscosity and electrical conductivity behavior.
An inverse relationship between viscosity and ionic conductivity is often seen in liquid mixtures, known as Walden’s rule [73], which we generalize here as
σ η 1
The rationale underlying this relationship is the Stokesian movement of ions under an electric field in a viscous medium [74], which should produce a linear relationship between lnσ and ln(1/η) with a unit slope. However, as can be seen in the log–log plot shown in Figure 11, this condition does not apply here. Instead, the slopes determined for the intermediate concentration data are significantly higher, and of opposite signs for the two systems. Clearly, in this case, Walden’s rule is not applicable, which lends support to the assertion that conduction in these systems does not involve the physical transport of ionic species through the fluid. Indeed, in the dodecane/octanol system, the electrical conductivity increases with increasing viscosity, implying that the structuring process assists conduction. However, in general terms, Figure 11 does suggest that both viscosity and electrical conductivity are influenced by common features within the liquid mixtures, albeit to different extents. Therefore, rather than conforming to Walden’s rule (Equation (8)), the behavior may be better represented as
σ η α
where α is an exponent reflecting the disparity between the respective effects of mixture composition on viscosity and electrical conductivity. Plotted in this way, it can be seen that electrical conductivity is more sensitive than viscosity on the basis of the original Walden/Stokes concept [74], for which a slope of −1 (indicated by the dashed line in Figure 11) would be anticipated.
On a molecular level, at concentrations below ≈10–20 wt% octanol, at least ≈3–4 dodecane molecules “solvate” the alcohol. Increasing the alcohol concentration leads to desolvation and a greater propensity for alcohol–alcohol interactions to occur via the -OH groups. Other studies using FTIR and NMR spectroscopy and X-ray diffraction (SAXS) have generally concluded that di-, tri-, and tetrameric aggregates are present in non-aqueous solutions’ longer-chain alcohols. The present evidence appears to be consistent with this.
Figure 6 also shows data for n-heptane/1-dodecanol mixtures taken from ref. [35]. These examples show a displacement from the octanol data along the x-axis, with the presence of KCl apparently increasing the electrical conductivity. However, from the foregoing discussion, the effects seen can also be interpreted in terms of the onset of percolation. In particular, consider the system without KCl, which if the same arguments are used, would be expected to be equivalent to the present dodecane/octanol system, after taking into account differences in molecular weights. Thus, from Figure 6, the onset of percolation is presumed to occur at ≈42 wt% dodecanol (compared with 18.5 wt% octanol for dodecane/octanol), assuming for the sake of this calculation that n-dodecane and n-heptane have approximately similar baseline conductivities. In volume and mole fraction terms, this corresponds to 0.17 and 0.28, respectively, from which it is evident that the volume fraction of the alcohol agrees with the present data for dodecane/octanol and suggests, once again, a critical mole ratio of ≈3–4 (heptane:dodecanol). However, whilst this agreement is very gratifying, and in accord with the variety of associated data discussed above, we are unfortunately unable to use this explanation to comment on the corresponding data in the presence of excess solid KCl.

5. Conclusions

The electrical conductivity of alkane/alcohol mixtures has received recent attention in the literature. Specifically, the conduction in alcohols has been variously linked to self-ionization (autoprotolysis) [32], micelle formation [32], ion-pair formation [36], and the presence of impurities in the bulk liquid and on container surfaces [35]. However, herein, based on the new viscosity and electrical conductivity results for three binary liquid systems, we provide evidence that charge conduction in 1-octanol is a consequence of the molecular organization of liquid alcohols, which provides conducting pathways. As recently expounded by Henkel et al. [9], liquid alcohols are more polar solvents than expected based on their molecular properties, which is considered to be a result of self-association into various aggregated species driven by hydrogen bonding. Here, we propose that the same aggregated species, including various cyclic aggregates and, perhaps more significantly, linear polymeric chains (Figure 1b), are responsible for the intrinsic electrical conductivity of alcohols, such as 1-octanol used in the present study. Therefore, as for the solvation behavior [9], we consider that electrical conductivity is based on the polarity of octanol aggregates as opposed to the monomers, as it is also reflected in the concentration dependence of the dipole moment (Figure 1a). Inferences made from our study are consistent with results from other investigations, including FTIR [43,45,46,51,52], NMR [21,51], SAXS [37,38], computational studies [38,39], and dielectric analyses [15,16,17,18,19,20,22,24,46,59].
Therefore, our findings rule out arbitrary processes, such as contamination, as being responsible for the electrical conductivity of alkane/alcohol mixtures and offers a more rational explanation based on a large body of evidence on molecular aggregation and microheterogeneity of these systems. This explanation may be useful in understanding the properties of other mixed liquid systems.

Author Contributions

Conceptualization, methodology and data curation, S.E.T. and H.Z.; formal analysis, S.E.T.; writing—original draft preparation, S.E.T.; writing—review and editing, S.E.T. and H.Z. All authors have read and agreed to the published version of the manuscript.

Funding

This research received no external funding.

Acknowledgments

H.Z. acknowledges the support of Dulcie Mulholland and the Department of Chemistry (University of Surrey) as a visiting scholar during the course of this work.

Conflicts of Interest

The authors declare no conflict of interest.

References

  1. Berman, P.; Meiri, N.; Colnago, L.A.; Moraes, T.B.; Linder, C.; Levi, O.; Parmet, Y.; Saunders, M.; Wiesman, Z. Study of liquid-phase molecular packing interactions and morphology of fatty acid methyl esters (biodiesel). Biotechnol. Biofuels 2015, 8, 12. [Google Scholar] [CrossRef] [PubMed] [Green Version]
  2. Cai, G.; Zong, H.; Yu, Q.; Lin, R. Thermal conductivity of alcohols with acetonitrile and N,N-dimethylformamide. J. Chem. Eng. Data 1993, 38, 332–335. [Google Scholar] [CrossRef]
  3. Tobitani, A.; Tanaka, T. Predicting thermal conductivity of binary liquid mixtures on basis of coordination number coordination model. Can. J. Chem. Eng. 1987, 65, 321–328. [Google Scholar] [CrossRef]
  4. Apelblat, A. The concept of associated solutions in historical development. Part 1. The 1884–1984 period. J. Mol. Liq. 2006, 128, 1–31. [Google Scholar] [CrossRef]
  5. Palombo, F.; Sassi, P.; Paolantoni, M.; Morresi, A.; Cataliotti, R.S. Comparison of hydrogen bonding in 1-octanol and 2-octanol as probed by spectroscopic techniques. J. Phys. Chem. B 2006, 110, 18017–18025. [Google Scholar] [CrossRef]
  6. Cevc, G.; Berts, I.; Fischer, S.F.; Rädler, J.O.; Nickel, B. Nanostructures in n-octanol equilibrated with additives and/or water. Langmuir 2018, 34, 6285–6295. [Google Scholar] [CrossRef]
  7. Wrzeszcz, W.; Tomza, P.; Kwasniewicz, M.; Mazurek, S.; Czarnecki, M.A. Microheterogeneity in binary mixtures of aliphatic alcohols and alkanes: ATR-IR/NIR spectroscopic and chemometric studies. RSC Adv. 2016, 6, 94294–94300. [Google Scholar] [CrossRef] [Green Version]
  8. Hu, K.; Zhou, Y.; Shen, J.; Ji, Z.; Cheng, G. Microheterogeneous structure of 1-octanol in neat and water-saturated state. J. Phys. Chem. B 2007, 111, 10160–10165. [Google Scholar] [CrossRef]
  9. Henkel, S.; Misuraca, M.C.; Troselj, P.; Davidson, J.; Hunter, C.A. Polarisation effects on the solvation properties of alcohols. Chem. Sci. 2018, 9, 88–99. [Google Scholar] [CrossRef] [Green Version]
  10. Hermens, J.L.M.; de Bruijn, J.H.M.; Brooke, D.N. The octanol-water partition coefficient: Strengths and limitations. Environ. Toxicol. Chem. 2013, 32, 732–733. [Google Scholar] [CrossRef]
  11. Dzida, M.; Marczak, W. Thermodynamic and acoustic properties of binary mixtures of alcohols and alkanes. II. Density and heat capacity of (ethanol + n-heptane) under elevated pressures. J. Chem. Thermodyn. 2005, 37, 826–836. [Google Scholar] [CrossRef]
  12. Dubey, G.P.; Sharma, M. Study of molecular interactions in binary liquid mixtures of 1-octanol with n-hexane, n-octane, and n-decane using volumetric, viscometric, and acoustic properties. J. Chem. Thermodyn. 2008, 40, 991–1000. [Google Scholar] [CrossRef]
  13. Estrada-Baltazar, A.; Iglesias-Silva, G.A.; Caballero-Cerón, C. Volumetric and transport properties of binary mixtures of n-octane + ethanol, +1-propanol, +1-butanol, and +1-pentanol from (293.15 to 323.15) K at atmospheric pressure. J. Chem. Eng. Data 2013, 58, 3351–3363. [Google Scholar] [CrossRef]
  14. Guzmán-López, A.; Iglesias-Silva, G.A.; Reyes-García, F.; Estrada-Baltazar, A. Densities and viscosities for binary liquid mixtures of n-undecane + 1-heptanol, 1-octanol, 1-nonanol, and 1-decanol from 283.15 to 363.15 K at 0.1 MPa. J. Chem. Eng. Data 2017, 62, 780–795. [Google Scholar] [CrossRef]
  15. Dannhauser, W. Dielectric relaxation in isomeric octyl alcohols. J. Chem. Phys. 1968, 48, 1918–1923. [Google Scholar] [CrossRef]
  16. Campbell, C.; Brink, G.; Glasser, L. Dielectric studies of molecular association. Concentration dependence of dipole moment of 1-octanol in solution. J. Phys. Chem. 1975, 79, 660–665. [Google Scholar] [CrossRef]
  17. Schwerdtfeger, S.; Köhler, F.; Pottel, R.; Kaatze, U. Dielectric relaxation of hydrogen bonded liquids: Mixtures of monohydric alcohols with n-alkanes. J. Chem. Phys. 2001, 115, 4186–4194. [Google Scholar] [CrossRef]
  18. Daruich, Y.; Magallanes, C.; Catenaccio, A. Dependence of permittivity of diluted octanol on temperature. Mol. Phys. 2001, 99, 1607–1611. [Google Scholar] [CrossRef]
  19. Kaatze, U.; Behrends, R.; Pottel, R. Hydrogen network fluctuations and dielectric spectrometry of liquids. J. Non Cryst. Solids 2002, 305, 19–28. [Google Scholar] [CrossRef]
  20. Wang, L.-M.; Shahriari, S.; Richert, R. Diluent effects on the Debye-type dielectric relaxation in viscous monohydroxy alcohols. J. Phys. Chem. B 2005, 109, 23255–23262. [Google Scholar] [CrossRef]
  21. Gainaru, C.; Meier, R.; Schildmann, S.; Lederle, C.; Hiller, W.; Rössler, E.A.; Böhmer, R. Nuclear-magnetic-resonance measurements reveal the origin of the Debye process in monohydroxy alcohols. Phys. Rev. Lett. 2010, 105, 258303. [Google Scholar] [CrossRef] [PubMed] [Green Version]
  22. Yomogida, Y.; Sato, Y.; Nozaki, R.; Mishina, T.; Nakahara, J. Comparative dielectric study of monohydric alcohols with terahertz time-domain spectroscopy. J. Mol. Struct. 2010, 981, 173–178. [Google Scholar] [CrossRef]
  23. Kaatze, U.; Behrends, R. Hydrogen bond fluctuations and dispersive interactions of alcohol/alkane mixtures. An ultrasonic relaxation study. Chem. Phys. Lett. 2011, 510, 67–72. [Google Scholar] [CrossRef]
  24. Power, G.; Nagaraj, M.; Vij, J.K.; Johari, G.P. Debye process and dielectric state of an alcohol in a nonpolar solvent. J. Chem. Phys. 2011, 134, 044525. [Google Scholar] [CrossRef] [PubMed]
  25. Jadżyn, J.; Świergiel, J. The viscous consequence of different trends in clustering of 1,2-diol and 1,n-diol molecules. Phys. Chem. Chem. Phys. 2018, 20, 21640–21646. [Google Scholar] [CrossRef] [PubMed]
  26. Kahlenberg, L.; Lincoln, A.T. The dissociative power of solvents. J. Phys. Chem. 1899, 3, 12–35. [Google Scholar] [CrossRef] [Green Version]
  27. Lincoln, A.T. The electrical conductivity of non-aqueous solutions. J. Phys. Chem. 1899, 3, 457–494. [Google Scholar] [CrossRef] [Green Version]
  28. Shaw, L.I. Studies on the electrical conductance of non-aqueous solutions. J. Phys. Chem. 1913, 17, 162–176. [Google Scholar] [CrossRef]
  29. Kraus, C.A.; Fuoss, R.M. Properties of electrolytic solutions. I. Conductance as influenced by the dielectric constant of the solvent medium. J. Am. Chem. Soc. 1933, 55, 21–36. [Google Scholar] [CrossRef]
  30. Freemantle, M. Introduction to Ionic Liquids; RSC Publishing: Cambridge, UK, 2010; p. 36. [Google Scholar]
  31. Harris, K.R. On the use of the Angell−Walden equation to determine the “ionicity” of molten salts and ionic liquids. J. Phys. Chem. B 2019, 123, 7014–7023. [Google Scholar] [CrossRef]
  32. Bombard, A.J.F.; Dukhin, A. Ionization of a nonpolar liquid with an alcohol. Langmuir 2014, 30, 4517–4521. [Google Scholar] [CrossRef] [PubMed]
  33. Dukhin, A.; Parlia, S. Ion-pair conductivity theory fitting measured data for various alcohol-toluene mixtures across entire concentration range. J. Electrochem. Soc. 2015, 162, H256–H263. [Google Scholar] [CrossRef]
  34. Gourdin-Bertin, S.; Chassagne, C. Application of classical thermodynamics to the conductivity in non-polar media. J. Chem. Phys. 2016, 144, 244501. [Google Scholar] [CrossRef] [PubMed] [Green Version]
  35. Gourdin-Bertin, S.; Chassagne, C. Application of classical thermodynamics to conductivity in nonpolar media: Experimental confirmation. J. Phys. Chem. B 2018, 122, 1223–1227. [Google Scholar] [CrossRef] [PubMed]
  36. Parlia, S.; Dukhin, A.; Somasundaram, P. Ion-pair conductivity theory: Mixtures of butanol with various non-polar liquids and water. J. Electrochem. Soc. 2016, 163, H570–H575. [Google Scholar] [CrossRef]
  37. Franks, N.P.; Abraham, M.H.; Lieb, W.R. Molecular organization of liquid n-octanol: An X-ray diffraction analysis. J. Pharm. Sci. 1993, 82, 466–470. [Google Scholar] [CrossRef]
  38. Tomšič, M.; Jamnik, A.; Fritz-Popovski, G.; Glatter, O.; Vlček, L. Structural properties of pure simple alcohols from ethanol, propanol, butanol, pentanol, to hexanol: Comparing Monte Carlo simulations with experimental SAXS data. J. Chem. Phys. B 2007, 111, 1738–1751. [Google Scholar] [CrossRef]
  39. MacCallum, J.L.; Tieleman, D.P. Structures of neat and hydrated 1-octanol from computer simulations. J. Am. Chem. Soc. 2002, 124, 15085–15093. [Google Scholar] [CrossRef]
  40. Tikhonov, A.M.; Pingali, S.V.; Schlossman, M.L. Molecular ordering and phase transitions in alkanol monolayers at the water–hexane interface. J. Chem. Phys. 2004, 120, 11822–11838. [Google Scholar] [CrossRef]
  41. Fletcher, A.N.; Heller, C.A. Self-association of alcohols in nonpolar solvents. J. Phys. Chem. 1967, 71, 3742–3756. [Google Scholar] [CrossRef]
  42. Aveyard, R.; Briscoe, B.J.; Chapman, J. Activity coefficients and association of n-alkanols in n-octane. J. Chem. Soc. Faraday Trans. I 1973, 69, 1772–1778. [Google Scholar] [CrossRef]
  43. Czarnecki, M.A. Effect of temperature and concentration on self-association of octan-1-ol studied by two-dimensional Fourier Transform near-infrared correlation spectroscopy. J. Phys. Chem. A 2000, 104, 6356–6361. [Google Scholar] [CrossRef]
  44. Ohta, A.; Murakami, R.; Urata, A.; Asakawa, T.; Miyagishi, S.; Aratono, M. Aggregation behavior of fluorooctanols in hydrocarbon solvents. J. Phys. Chem. B 2003, 107, 11502–11509. [Google Scholar] [CrossRef] [PubMed]
  45. Reilly, J.T.; Thomas, A.; Gibson, A.R.; Luebehusen, C.Y.; Donohue, M.D. Analysis of the self-association of aliphatic alcohols using Fourier Transform infrared (FT-IR) spectroscopy. Ind. Eng. Chem. Res. 2013, 52, 14456–14462. [Google Scholar] [CrossRef]
  46. Orzechowski, K.; Czarnecki, M.A. Association of 1-hexanol in mixtures with n-hexane: Dielectric, near-infrared and DFT studies. J. Mol. Liq. 2019, 279, 540–547. [Google Scholar] [CrossRef]
  47. Amenta, V.; Cook, J.L.; Hunter, C.A.; Low, C.M.R.; Sun, H.; Vinter, J.G. Interplay of self-association and solvation in polar liquids. J. Am. Chem. Soc. 2013, 135, 12091–12100. [Google Scholar] [CrossRef]
  48. DeBolt, S.E.; Kollman, P.A. Investigation of structure, dynamics, and solvation in 1-octanol and its water-saturated solution: Molecular Dynamics and free-energy perturbation studies. J. Am. Chem. Soc. 1995, 117, 5316–5340. [Google Scholar] [CrossRef]
  49. Golub, P.; Pogorelov, V.; Doroshenko, I. The structural peculiarities of liquid n-heptanol and n-octanol. J. Mol. Liq. 2012, 169, 80–86. [Google Scholar] [CrossRef]
  50. Czarnecki, M.A. Near-infrared spectroscopic study of self-association of octanoic acid. Chem. Phys. Lett. 2003, 368, 115–120. [Google Scholar] [CrossRef]
  51. Iwahashi, M.; Hayashi, Y.; Hachiya, N.; Matsuzawa, H.; Kobayashi, H. Self-association of octan-1-ol in the pure liquid state and in decane solutions as observed by viscosity, self-diffusion, nuclear magnetic resonance and near-infrared spectroscopy measurements. J. Chem. Soc. Faraday Trans. 1993, 89, 707–712. [Google Scholar] [CrossRef]
  52. Palombo, F.; Tassaing, T.; Danten, Y.; Besnard, M. Hydrogen bonding in liquid and supercritical 1-octanol and 2-octanol assessed by near and mid infrared spectroscopy. J. Chem. Phys. 2006, 125, 094503. [Google Scholar] [CrossRef] [PubMed]
  53. Roberts, C.; Graham, A.; Nemer, M.; Phinney, L.; Garcia, R.; Stirrup, E. Physical Properties of Low-Molecular Weight Polydimethylsiloxane Fluids; Sandia Report SAND2017-1242; Sandia National Laboratories: Albuquerque, NM, USA, 2017.
  54. Lide, D.R. CRC Handbook of Chemistry and Physics; CRC Press: Boca Raton, FL, USA, 2005; Available online: http://www.hbcpnetbase.com (accessed on 22 August 2020).
  55. Nunes, R.J.; Saramago, B.; Marrucho, I.M. Surface tension of DL-menthol:octanoic acid eutectic mixtures. J. Chem. Eng. Data 2019, 64, 4915–4923. [Google Scholar] [CrossRef]
  56. Rondinini, S.; Longhi, P.; Mussini, P.R.; Mussini, T. Autoprotolysis constants in nonaqueous solvents and aqueous organic solvent. Pure Appl. Chem. 1987, 59, 1693–1702. [Google Scholar] [CrossRef] [Green Version]
  57. Guo, Q.; Singh, V.; Behrens, S.H. Electric charging in nonpolar liquids because of nonionizable surfactants. Langmuir 2009, 26, 3203–3207. [Google Scholar] [CrossRef] [PubMed]
  58. Chen, J.-S.; Yeh, K.-T.; Wu, C.-C.; Kao, D.-Y. IR study of monomer–dimer self-association of 2,2-dimethyl-3-ethyl-3-pentanol in n-octane: Determination of the molar absorptivities of monomer and dimer bands, and dimerization constants using novel equations. J. Solut. Chem. 2013, 42, 2269–2280. [Google Scholar] [CrossRef] [Green Version]
  59. Czarnecki, M.A.; Orzechowski, K. Effect of temperature and concentration on self-association of octan-3-ol studied by vibrational spectroscopy and dielectric measurements. J. Phys. Chem. A 2003, 107, 1119–1126. [Google Scholar] [CrossRef]
  60. Marczak, W.; Adamczyk, N.; Łęźniak, M. Viscosity of associated mixtures approximated by the Grunberg-Nissan model. Int. J. Thermophys. 2012, 33, 680–691. [Google Scholar] [CrossRef]
  61. El Hammami, N.; Bouanz, M.; Toumi, A. Thermodynamic properties of cyclohexane–methanol liquid from shear viscosity measurements. Fluid Phase Equilib. 2014, 384, 25–35. [Google Scholar] [CrossRef]
  62. Papir, Y.S.; Krieger, I.M. Rheological studies on dispersions of uniform colloidal spheres. II. Dispersions in nonaqueous media. J. Colloid Interface Sci. 1970, 34, 126–130. [Google Scholar] [CrossRef]
  63. Pal, R. Fundamental rheology of disperse systems based on single-particle mechanics. Fluids 2016, 1, 40. [Google Scholar] [CrossRef]
  64. Oswal, S.L.; Desai, H.S. Studies of viscosity and excess molar volume of binary mixtures. 1. Propylamine + 1-alkanol mixtures at 303.15 and 313.15 K. Fluid Phase Equilib. 1998, 149, 359–376. [Google Scholar] [CrossRef]
  65. Yang, C.; Xu, W.; Ma, P. Thermodynamic properties of binary mixtures of p-xylene with cyclohexane, heptane, octane, and N-methyl-2-pyrrolidone at several temperatures. J. Chem. Eng. Data 2004, 49, 1794–1801. [Google Scholar] [CrossRef]
  66. Choudhary, S.; Sengwa, R.J. Ionic conduction in binary mixtures of dipolar liquids. J. Mol. Liq. 2012, 175, 33–37. [Google Scholar] [CrossRef]
  67. Jasper, J.J.; Kring, E.V. The isobaric surface tensions and thermodynamic properties of the surfaces of a series of n-alkanes, C5 to C18, 1-alkenes, C6 to C16, and of n-decylcyclopentane, n-decylcyclohexane and n-decylbenzene. J. Phys. Chem. 1955, 59, 1019–1021. [Google Scholar] [CrossRef]
  68. Bell, W.; Daly, J.; North, A.M.; Pethrick, R.A.; Teik, P.B. Chain entanglement and normal mode motions in poly(dimethylsi1oxane) + toluene mixtures. J. Chem. Soc. Faraday Trans. II 1979, 75, 1452–1464. [Google Scholar] [CrossRef]
  69. Basta, M.; Picciarelli, V.; Stella, R. An introduction to percolation. Eur. J. Phys. 1994, 15, 97–101. [Google Scholar] [CrossRef]
  70. Ottavi, H.; Clerc, J.; Giraud, G.; Roussenq, J.; Guyon, E.; Mitescu, C.D. Electrical conductivity of a mixture of conducting and insulating spheres: An application of some percolation concepts. J. Phys. C Solid State Phys. 1978, 11, 1311–1328. [Google Scholar] [CrossRef]
  71. Ziff, R.M.; Torquato, S. Percolation of disordered jammed sphere packings. J. Phys. A Math. Theor. 2017, 50, 085001. [Google Scholar] [CrossRef] [Green Version]
  72. Domb, C.; Dalton, N.W. Crystal statistics with long-range forces. II. Asymptotic behavior of the equivalent neighbour model. Proc. Phys. Soc. 1966, 89, 859–871. [Google Scholar] [CrossRef]
  73. Walden, P. Über organische Lösungs- und Ionisierungsmittel. III. Teil: Innere Reibung und deren zusammenhang mit dem Leitvermögen. Z. Phys. Chem. 1906, 55, 207–246. [Google Scholar]
  74. Fuoss, R.M. Dependence of the Walden product on dielectric constant. Proc. Natl. Acad. Sci. USA 1959, 45, 807–813. [Google Scholar] [CrossRef] [PubMed] [Green Version]
Publisher’s Note: MDPI stays neutral with regard to jurisdictional claims in published maps and institutional affiliations.
Figure 1. (a) Concentration dependence of the square of the dipole moment of 1-octanol (in n-hexane), after Campbell et al. [16]; (b) chain-like structure of clustered molecules in neat 1-octanol, after MacCallum et al. [39], showing interacting hydroxyl groups (oxygen—dark red, hydrogen—pink).
Colloids 04 00044 g001
Figure 2. Appearance of the silicone oil/octanol mixtures (1-octanol content indicated in wt%): (a) shows the mixtures after a period of standing interfaces following phase separation (where observable) are indicated by the arrows; (b) the same mixtures immediately after hand-shaking: cloudiness is obvious for octanol concentrations ≥ 50 wt%.
Colloids 04 00044 g002
Figure 3. Dynamic (shear) viscosity plots for the binary mixtures. (a) Data plotted against volume fraction of polar component. The red long-dashed curve is derived using the Krieger–Dougherty equation (Equation (3)) as described in the text; solid blue and black curves are fitted using Equation (1), and the red short-dashed curve is fitted using Equation (1) based solely on the low concentration silicone oil (SO)/octanol data. (b) Data plotted as a function of mole fraction of the polar components, in which the blue solid curve is the best fit using Equation (2) for dodecane/octanol, and the red solid curve is the best fit to SO/octanol data in the range 0 ≤ x1 ≤ 0.65. The red long-dashed line is from the Krieger–Dougherty equation, which is converted from (a).
Colloids 04 00044 g003
Figure 4. Excess viscosity plots for binary mixtures as a function of the mole fraction of the polar component, x1. (a) 1-Octanol mixtures with different n-alkanes: curves for n-hexane, n-octane, and n-decane are based on data from Ref. [12], and data for n-dodecane are from the present study. The drawn curves are Redlich–Kister polynomial fits (Equation (6)). (b) SO mixtures with octanol and octanoic acid. The curve for the SO/octanoic acid mixtures is the Redlich–Kister polynomial fit to data from Figure 3a, as a guide to predicted behavior in the absence of phase separation.
Colloids 04 00044 g004
Figure 5. The effects of measurement frequency on the real part of the electrical conductivity, σ′, for octanol mixtures (wt% concentrations indicated in the plots to the left) with (a) dodecane, and (b) silicone oil. The dashed lines represent linear extrapolations to the σDC values at zero frequency (as shown in the respective plots to the left).
Colloids 04 00044 g005
Figure 6. Electrical conductivity of dodecane/octanol mixtures (filled red circles). The red dashed line is the value for n-dodecane. The solid line is for poly(α-olefin) (PAO)/1-octanol mixtures from Bombard and Dukhin [32], which were measured at 1 Hz. The open and filled squares are from Gourdin–Bertin and Chassagne [35] for the n-heptane/1-dodecanol system in the presence and absence of excess solid potassium chloride, respectively. The inset shows low concentration data for the dodecane/octanol system on linear axes.
Colloids 04 00044 g006
Figure 7. Direct current (DC) electrical conductivity of SO mixtures with octanol and octanoic acid as a function of concentration. (a) Log–log plot of σDC against volume fraction. The arrows indicate the points of intersection of the lines drawn through data in high and low concentration regions. Data for dodecane/octanol (in red) have been included for comparison. (b) The same σDC data as in (a) plotted logarithmically against the mole fraction of the polar component. All lines have been drawn to guide the eye.
Colloids 04 00044 g007
Figure 8. Excess logarithmic molar electrical conductivity plots for the binary mixtures as a function of the polar component mole fraction.
Colloids 04 00044 g008
Figure 9. Effect of n-alkane chain length on surface tension. Values quoted at 25 °C as the mean of data from Jasper and Kring [67] at 20 and 30 °C.
Colloids 04 00044 g009
Figure 10. Viscosity-inspired (not to scale) schematic representations of silicone oil (in red) mixtures, showing the intercalation of (a) octanoic acid molecules (in black) and (b) octanol molecules and tetramers (each shown in blue). In (c), phase-separated silicone oil droplets (red) in octanol (blue) are shown.
Colloids 04 00044 g010
Figure 11. Log–log relationships between DC electrical conductivity (σDC) and viscosity (η) for the two octanol-containing mixtures. The solid lines are least squares fits of the intermediate data with the slopes (α) indicated. The dashed line represents the Walden slope of −1.
Colloids 04 00044 g011
Table 1. Physical properties of the neat liquids (present data at 24.0 ± 0.5 °C; literature data at 25 °C).
LiquidElectrical Conductivity
(S/cm) a
Relative PermittivityDynamic Viscosity at 20 s−1 Shear Rate
(mPa·s)
Surface Tension
(mN/m)
n-Dodecane1.10 × 10−142.01 [54]1.4125.4 [54]
Silicone oil (20 cSt)2.47 × 10−142.73 b19.819.0 [54]
1-Octanol8.51 × 10−910.3 [54]7.5027.1 [54]
1-Octanoic acid6.33 × 10−132.85 [54]5.5331 [55]
a Direct current (DC) values (i.e., at zero frequency) from the present work. b Present work at 106 Hz.
Table 2. Grunberg–Nissan analyses of the viscosity of the binary liquid mixtures (24.0 ± 0.5 °C).
Binary SystemEquation (1)Equation (2)
η1 (mPa·s)η2 (mPa·s)Φ12η1 (mPa·s)η2 (mPa·s)G12
Dodecane/
octanol
7.501.38−0.2367.491.42−0.940
Silicone oil/
octanol
7.50 a19.6 a−1.08 a12.3 b,c19.8 b,c0.34 b,c
Silicone oil/
octanoic acid
5.6319.8−0.621bbb
a Extrapolated values based on ϕ1 < 0.2 assuming miscible components. b No satisfactory fits to Equation (2) over the entire mole fraction range. c Fitted for 0 ≤ x1 ≤ 0.65.

