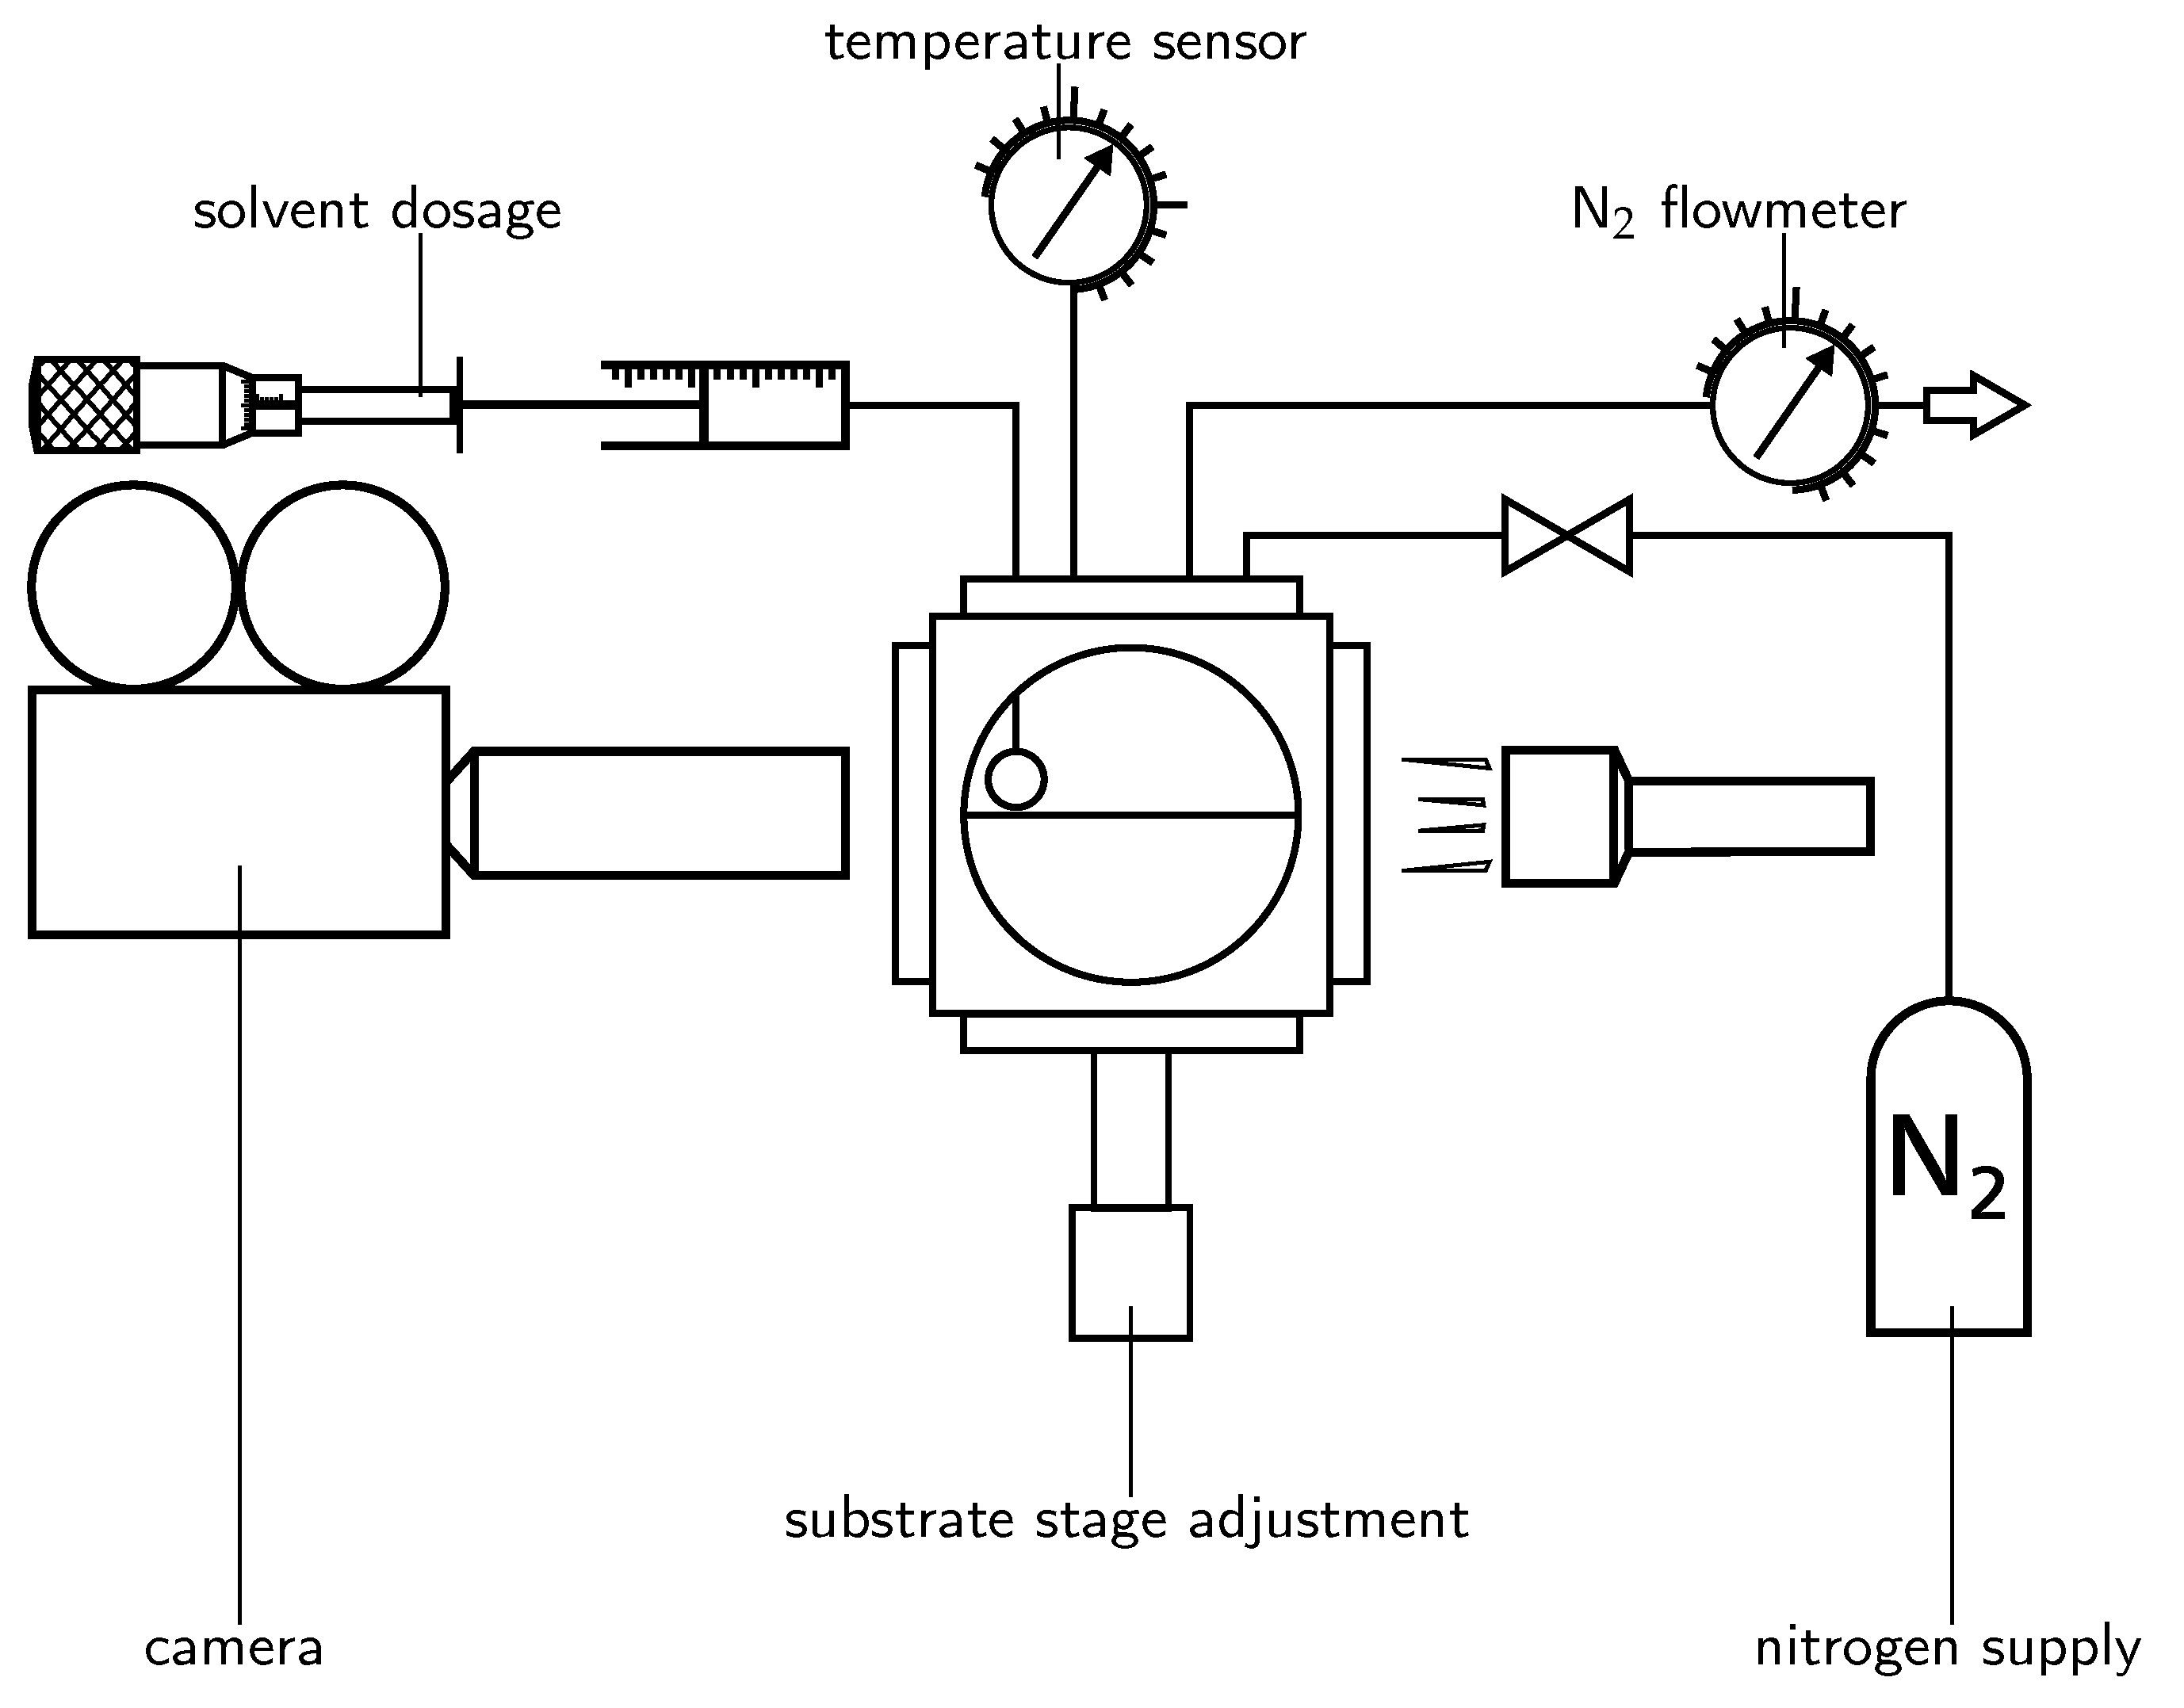
3.1. Wetting
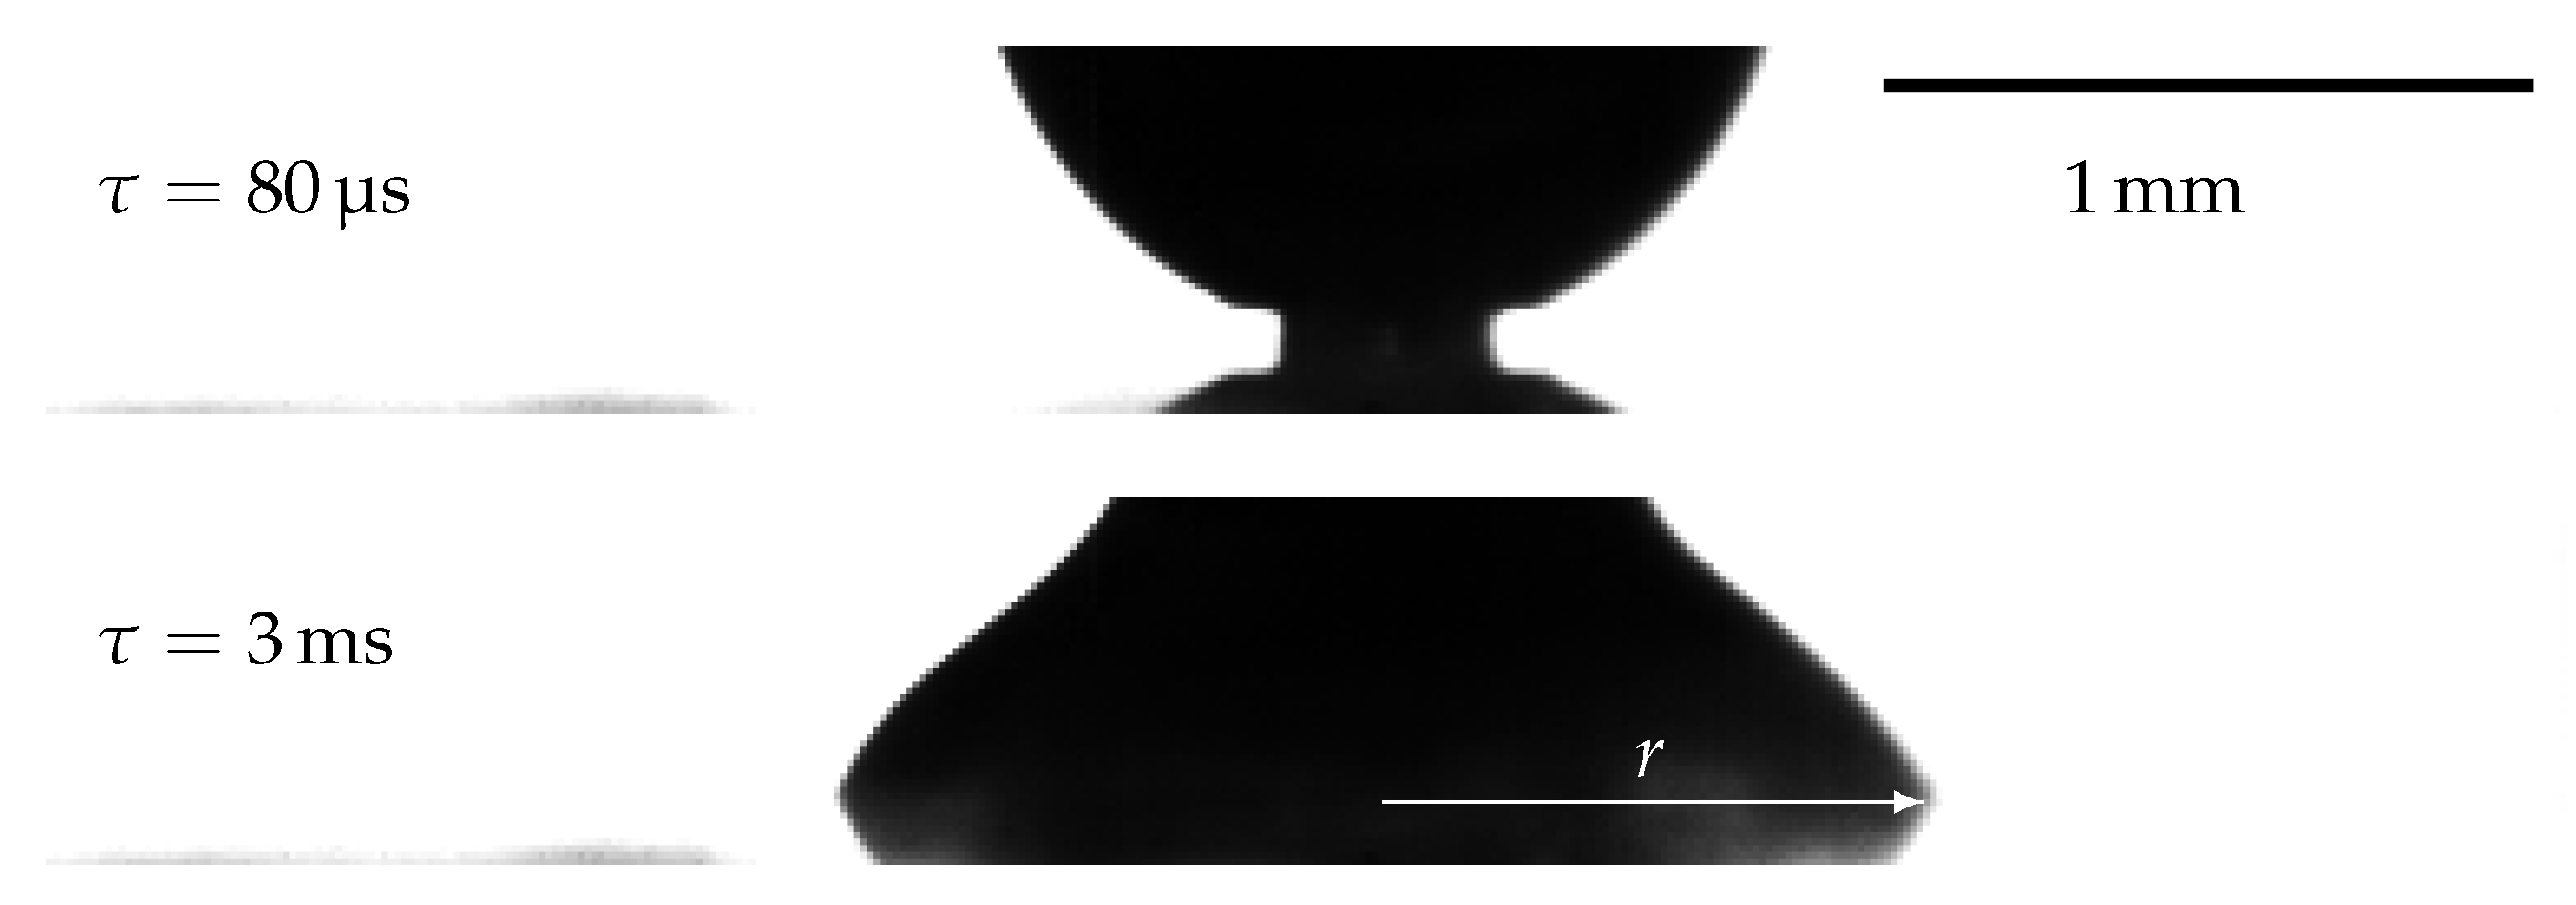
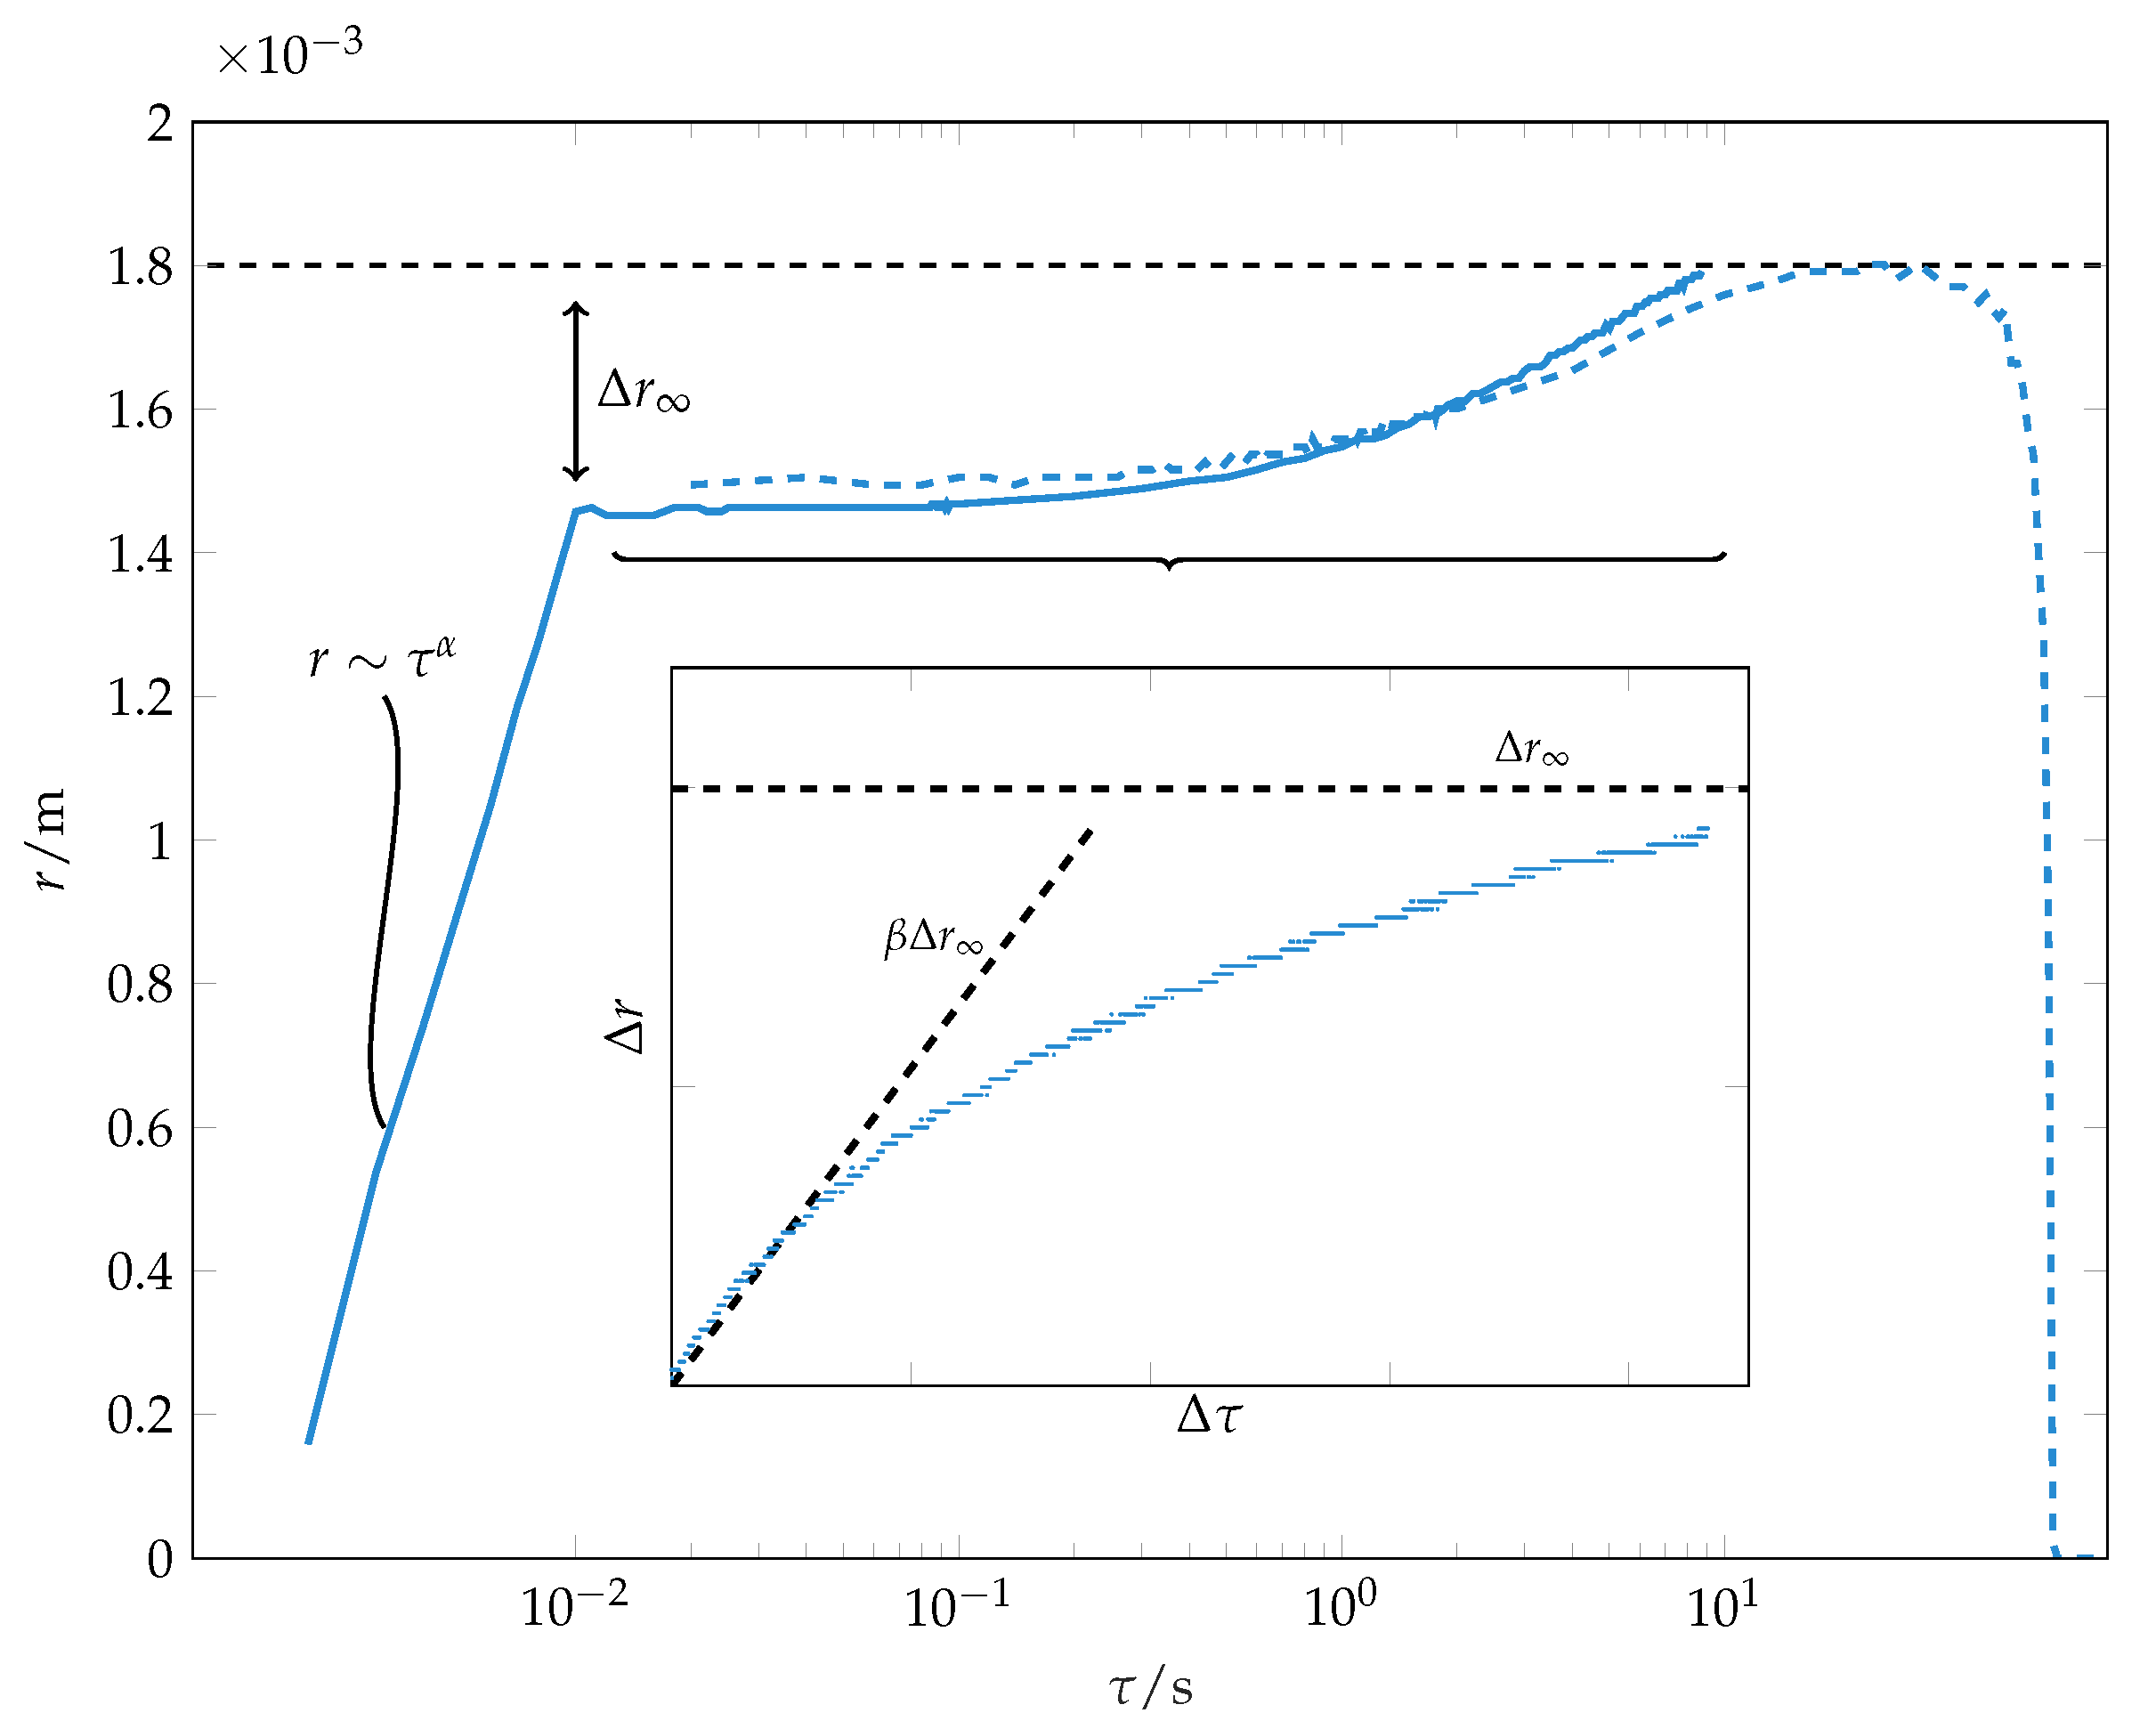
The evolution of wetting radius during spreading and evaporation of a solvent droplet is depicted in
Figure 3. After
, the first stage of wetting finishes. This agrees with the results of Muralidhar et al. [
10] and with the characteristic time of initial wetting estimated by Equation (
2), which corresponds to
for toluene. It has been reported that even a small inclination of a side view camera results in wrong contact radius measurements for small times with
in spontaneous spreading, since the actual droplet foot is concealed by the droplet surface [
26]. Typically (1–2) ms before the end of initial spreading, surface waves propagate towards the three phase contact line, which interfere with the spreading mechanics taken into account in scaling laws like Equation (
1). In order to suppress the influence of these phenomena on the final result and therefore to minimise the error in experimental determination of
, we discard the first microseconds of wetting as well as the last
for fitting the wetting exponents
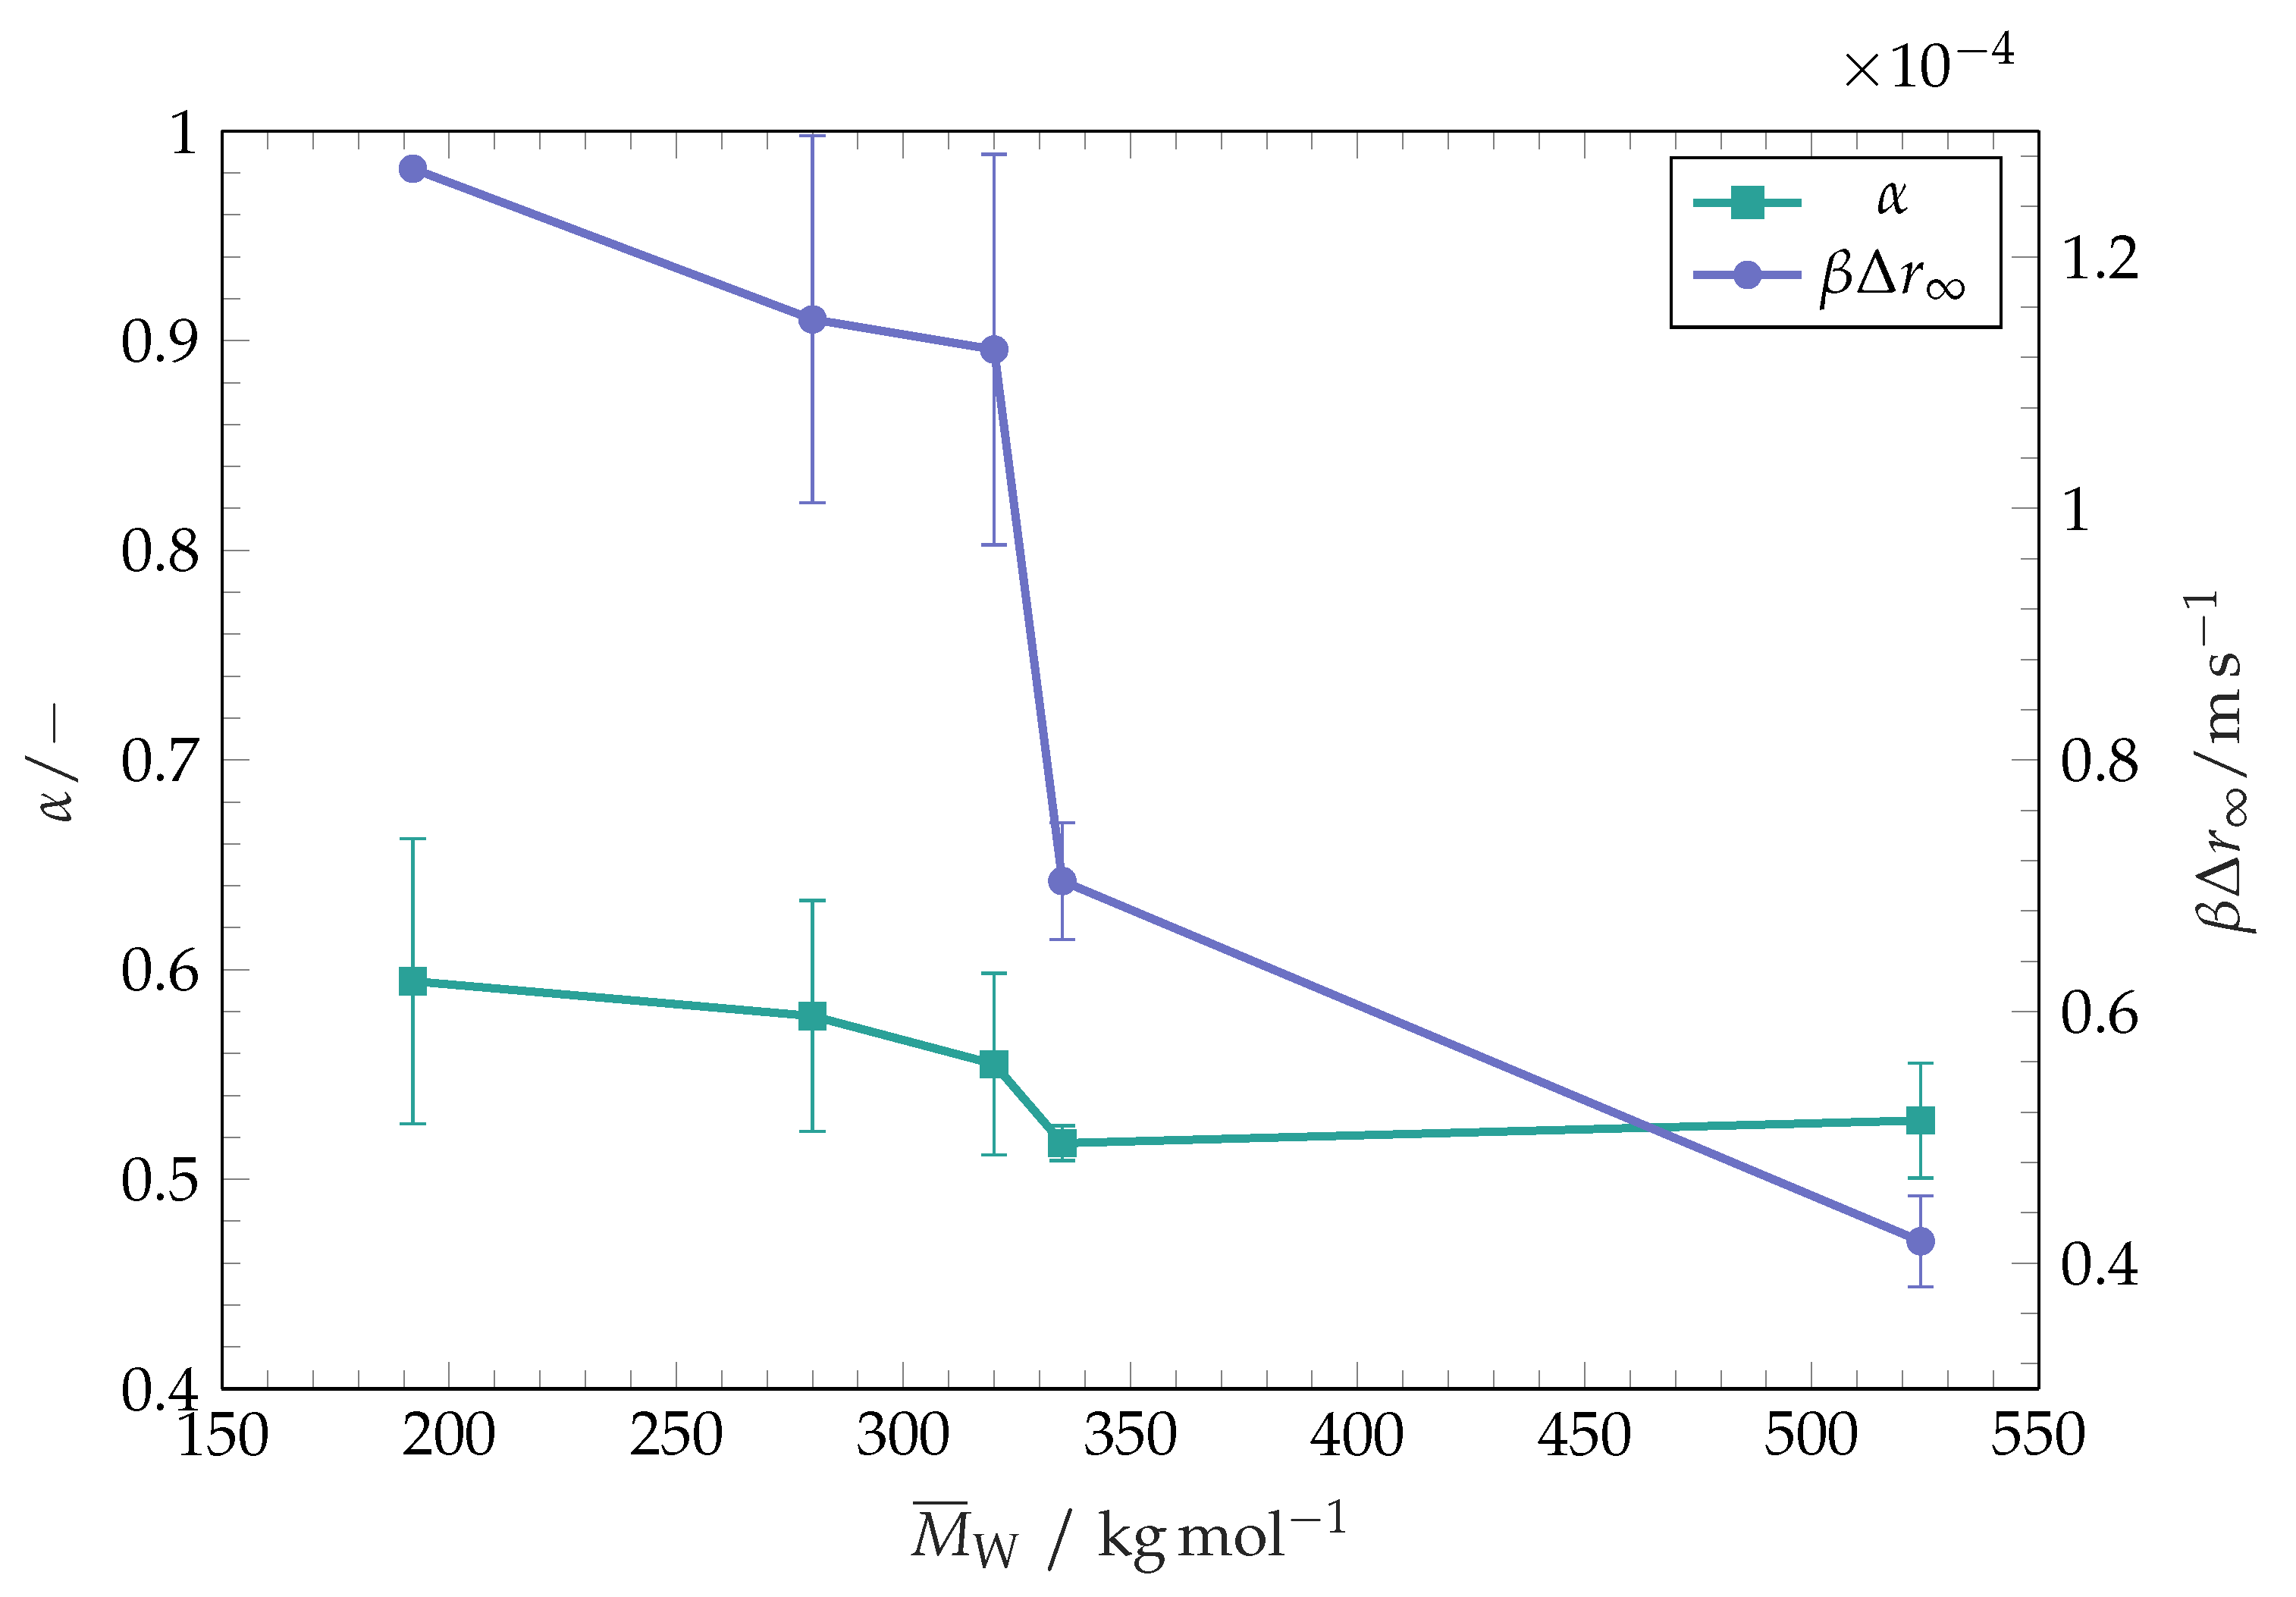
. For the initial stage of wetting, we observe the wetting exponents of
. They only weakly depend on the substrate polymer within the range of polymer molar masses used in the experiments (
Figure 4). From our experiments, we observe a slight decrease in
for increasing polymer molar masses, especially for polymers with
−1. As the molar mass determines the solubility of the polymer, this result also indicates that the dissolution process does not significantly affect the initial stage spreading and that the time scale for dissolution processes of our coatings is larger than
. Wetting exponents
exceed the prediction of Biance et al. [
3] for liquids on inert surfaces. As already pointed out by Muralidhar et al. [
10], a possible release of Gibbs free energy during spreading on non-inert surfaces generates an additional driving force for wetting [
27]. The difference in free Gibbs energy for solution processes of polymers in solvents can be expressed by Flory–Huggins theory [
28,
29]. Accordingly, free Gibbs energy varies with the degree of polymerisation. If the additional release of Gibbs free energy were a dominant mechanism for initial stage wetting, we would have observed a strong dependency of
on
. This is not the case: the variation of
with
is comparable with the error bars in
Figure 4. The weak dependence of
on
supports our hypothesis that solution processes do not affect initial stage wetting. Muralidhar et al. [
10] reported
for the same solvent–substrate combination on thick polymer substrates, which is close to our findings. The trend reported here, however is inverse to the findings of Muralidhar et al. who found a slight increase in
with increasing of polymer molar mass.
Beyond the initial wetting stage, we observe further spreading, which is characterised by a much slower dynamics compared to the initial stage spreading (see
Figure 3). This stage has not been observed in previous investigations of wetting of thick (
) polymer soluble substrates [
10]. In our experiments, the second spreading phase is responsible for 15% of the final wetting radius, thus approximately for 30% of the wetted area. For this late stage wetting, the spreading does not follow the power law (
1).
The spreading during the second phase can be described by an empirical law:
In this,
is the difference between wetting radius and the wetting radius at the end of the initial wetting stage.
corresponds to a final wetting radius. Note that this is a fitting parameter and not the actual measured final wetting radius. However, this fitting parameter is usually very close to the measured difference between the final wetting radius and the wetting radius at the end of the initial wetting stage, as seen in
Figure 3. The parameter
characterises the inverse time scale of spreading and has to be fitted empirically. The time instant
corresponds to the end of the early wetting stage. The initial contact line speed of this late stage wetting
can be used to characterise the late stage wetting dynamics.
The initial wetting speed at the second wetting stage strongly decreases with increasing of the polymer molar mass, as seen in
Figure 4. It is known that the dissolution rate of polymers decreases with increasing molar mass [
23]. The trend presented in
Figure 4 indicates that the initial wetting speed in the second wetting phase increases with increasing of the substrate dissolution rate. An especially sharp decrease in wetting speed for polymers with
−1 is observed, with a prominent difference between the substrates having close values of
(
−1 and
−1). The substrate coatings with
−1 and
−1 differ from each other in two respects (see
Table 1): the molar mass distribution of the polymer (or polydispersity) and thickness. Both of these parameters can affect the total lateral dissolution rates of the substrate coating and therefore the wetting dynamics. The substrate coatings with
−1 have a narrower distribution of molar mass than the substrates with
−1. As reported by Körner et al. [
30], the molar mass distribution affects the dissolution rate of polymers. A broader molar mass distribution is accompanied by the presence of long polymer chains which reportedly dominate the dissolution process and limit the polymer dissolution rate [
31]. This effect would lead to a higher dissolution rate of the substrate coating with
−1 in comparison to the substrate coating with
−1 and promote a faster spreading for the polymer with
−1, as the polymer with
−1 is expected to contain a higher fraction of long polymer chains. However, the substrate with a narrower molar mass distribution (
−1) is characterised by a much slower initial wetting speed, which indicates that the presence of long polymer chains does not dominate the dissolution and spreading process in this case. Yet, a broader molar mass distribution is also accompanied by the presence of short polymer chains. Although they do not dominate the overall dissolution process, single chains are prone to enter the bulk solvent early. Those chains affect the viscosity near their original position in the substrate. It has been established that for semi-dilute polystyrene solutions in benzene, which is a non-polar solvent, the viscosity of solutions scales as
with
c being the volume concentration of the polymer and
the dynamic viscosity of the pure solvent [
32]. It can be expected that a similar trend is followed by the viscosity of polystyrene solutions in toluene. Therefore, we suggest that the presence of short polymer chains in the liquid does not lead to the change of the wetting behaviour. As seen from
Figure 1, the substrate coating with (
−1) used in these experiments is thicker than all other coatings (700
thick in comparison to approximately 600
). We suggest that this difference could be responsible for longer absolute dissolution times of the coating and lower late stage wetting speeds. We note that the qualitative behaviour of lower late stage wetting speed for high molar mass substrates holds for both groups (narrow and broad molar mass distribution) of polymers presented within this work.
From the results presented in
Figure 4, it is evident that the late wetting stage is governed by the dissolution rate of the polymer coating. Although this stage has not been observed by spreading of toluene over thick polystyrene substrates [
10], a solubility-governed wetting dynamics has been reported for wetting of substrates coated with thin maltodextrin layers [
11,
12,
33] and thin poly(dimethylacrylamide) layers [
34,
35,
36] by water. In these works, however, no correlations for the spreading radius as a function of time during the solubility-governed wetting stage have been suggested, such as an empirical law suggested in our work (Equation (
3)). Instead, Tay et al. [
35] and Dupas et al. [
11] present their results in terms of the contact angle dependence on the contact line velocity, or on the product of the contact line velocity and the coating thickness. The relationship between the dynamic contact angle and the dimensionless contact line speed (capillary number) during the late stage wetting derived from our experiments is plotted in
Figure 5. It is seen that the relationship is approximately linear in the studied parameter range. Dupas et al. [
11] and Tay et al. [
35] report dynamic contact angles over three orders of magnitude of contact line velocity. Within this wide range of velocities, Dupas et al. [
33] report a kink in contact angles versus contact line velocity dependence for high contact line velocities in a dry atmosphere. Dupas et al. [
33] relate this kink to the glass transition which takes place in front of the contact line for low contact line velocities in a dry atmosphere and is not observed within our late stage wetting experiments. Further contact angle investigations at high wetting speeds can be performed in the future to check whether the system toluene-polystyrene shows similar behaviour. Additionally, future experiments on polystyrene coatings with multiple thicknesses would elucidate if the system polystyrene-toluene shows a scaling of contact angle in
, as it does for the system water–maltodextrin [
11,
12,
33]. The case studied by Muralidhar et al. [
10] would correspond to the limit of thick substrates.
The vertical position of the lines in
Figure 5 and their slopes are different for different substrates. However, the results do not allow to derive any clear trend.
The late stage of spreading is accompanied by evaporation of the toluene [
10,
37,
38]. The mass loss by evaporation is expected to affect the wetting dynamics [
14], in addition to the influence of the dissolution process on wetting and spreading. The dissolution of coating polymer into the drop together with evaporation of solvent cause a change in properties of the liquid. These changes are expected to be differently pronounced at different positions within the droplet. From studies on evaporation of sessile droplets on inert surfaces, it is known that the evaporation mass flux is nonuniformly distributed across a droplet’s surface [
39]. Especially for droplets with low contact angles, the region close to the contact line shows a high evaporation flux. This drives an internal flow which transports bulk fluid to the contact line [
40]. Both the high evaporation flux itself and the accompanied Deegan flow can lead to an accumulation of polymer near the contact line [
15]. As a consequence, the influence of dissolution on late stage wetting dynamics is supposed to be especially strong. The exemplary literature data presented in
Table 2 demonstrate that the polymer concentration has a weak impact on surface tension for concentrations of up to 30
, but a distinct influence on the viscosity of the spreading liquid for polystyrene of chain lengths within the range used in this work. It should be noted that the capillary number in
Figure 5 has been computed based on the properties of pure solvent. Using a capillary number based on (presently unknown) local properties could affect the dependencies shown in
Figure 5.
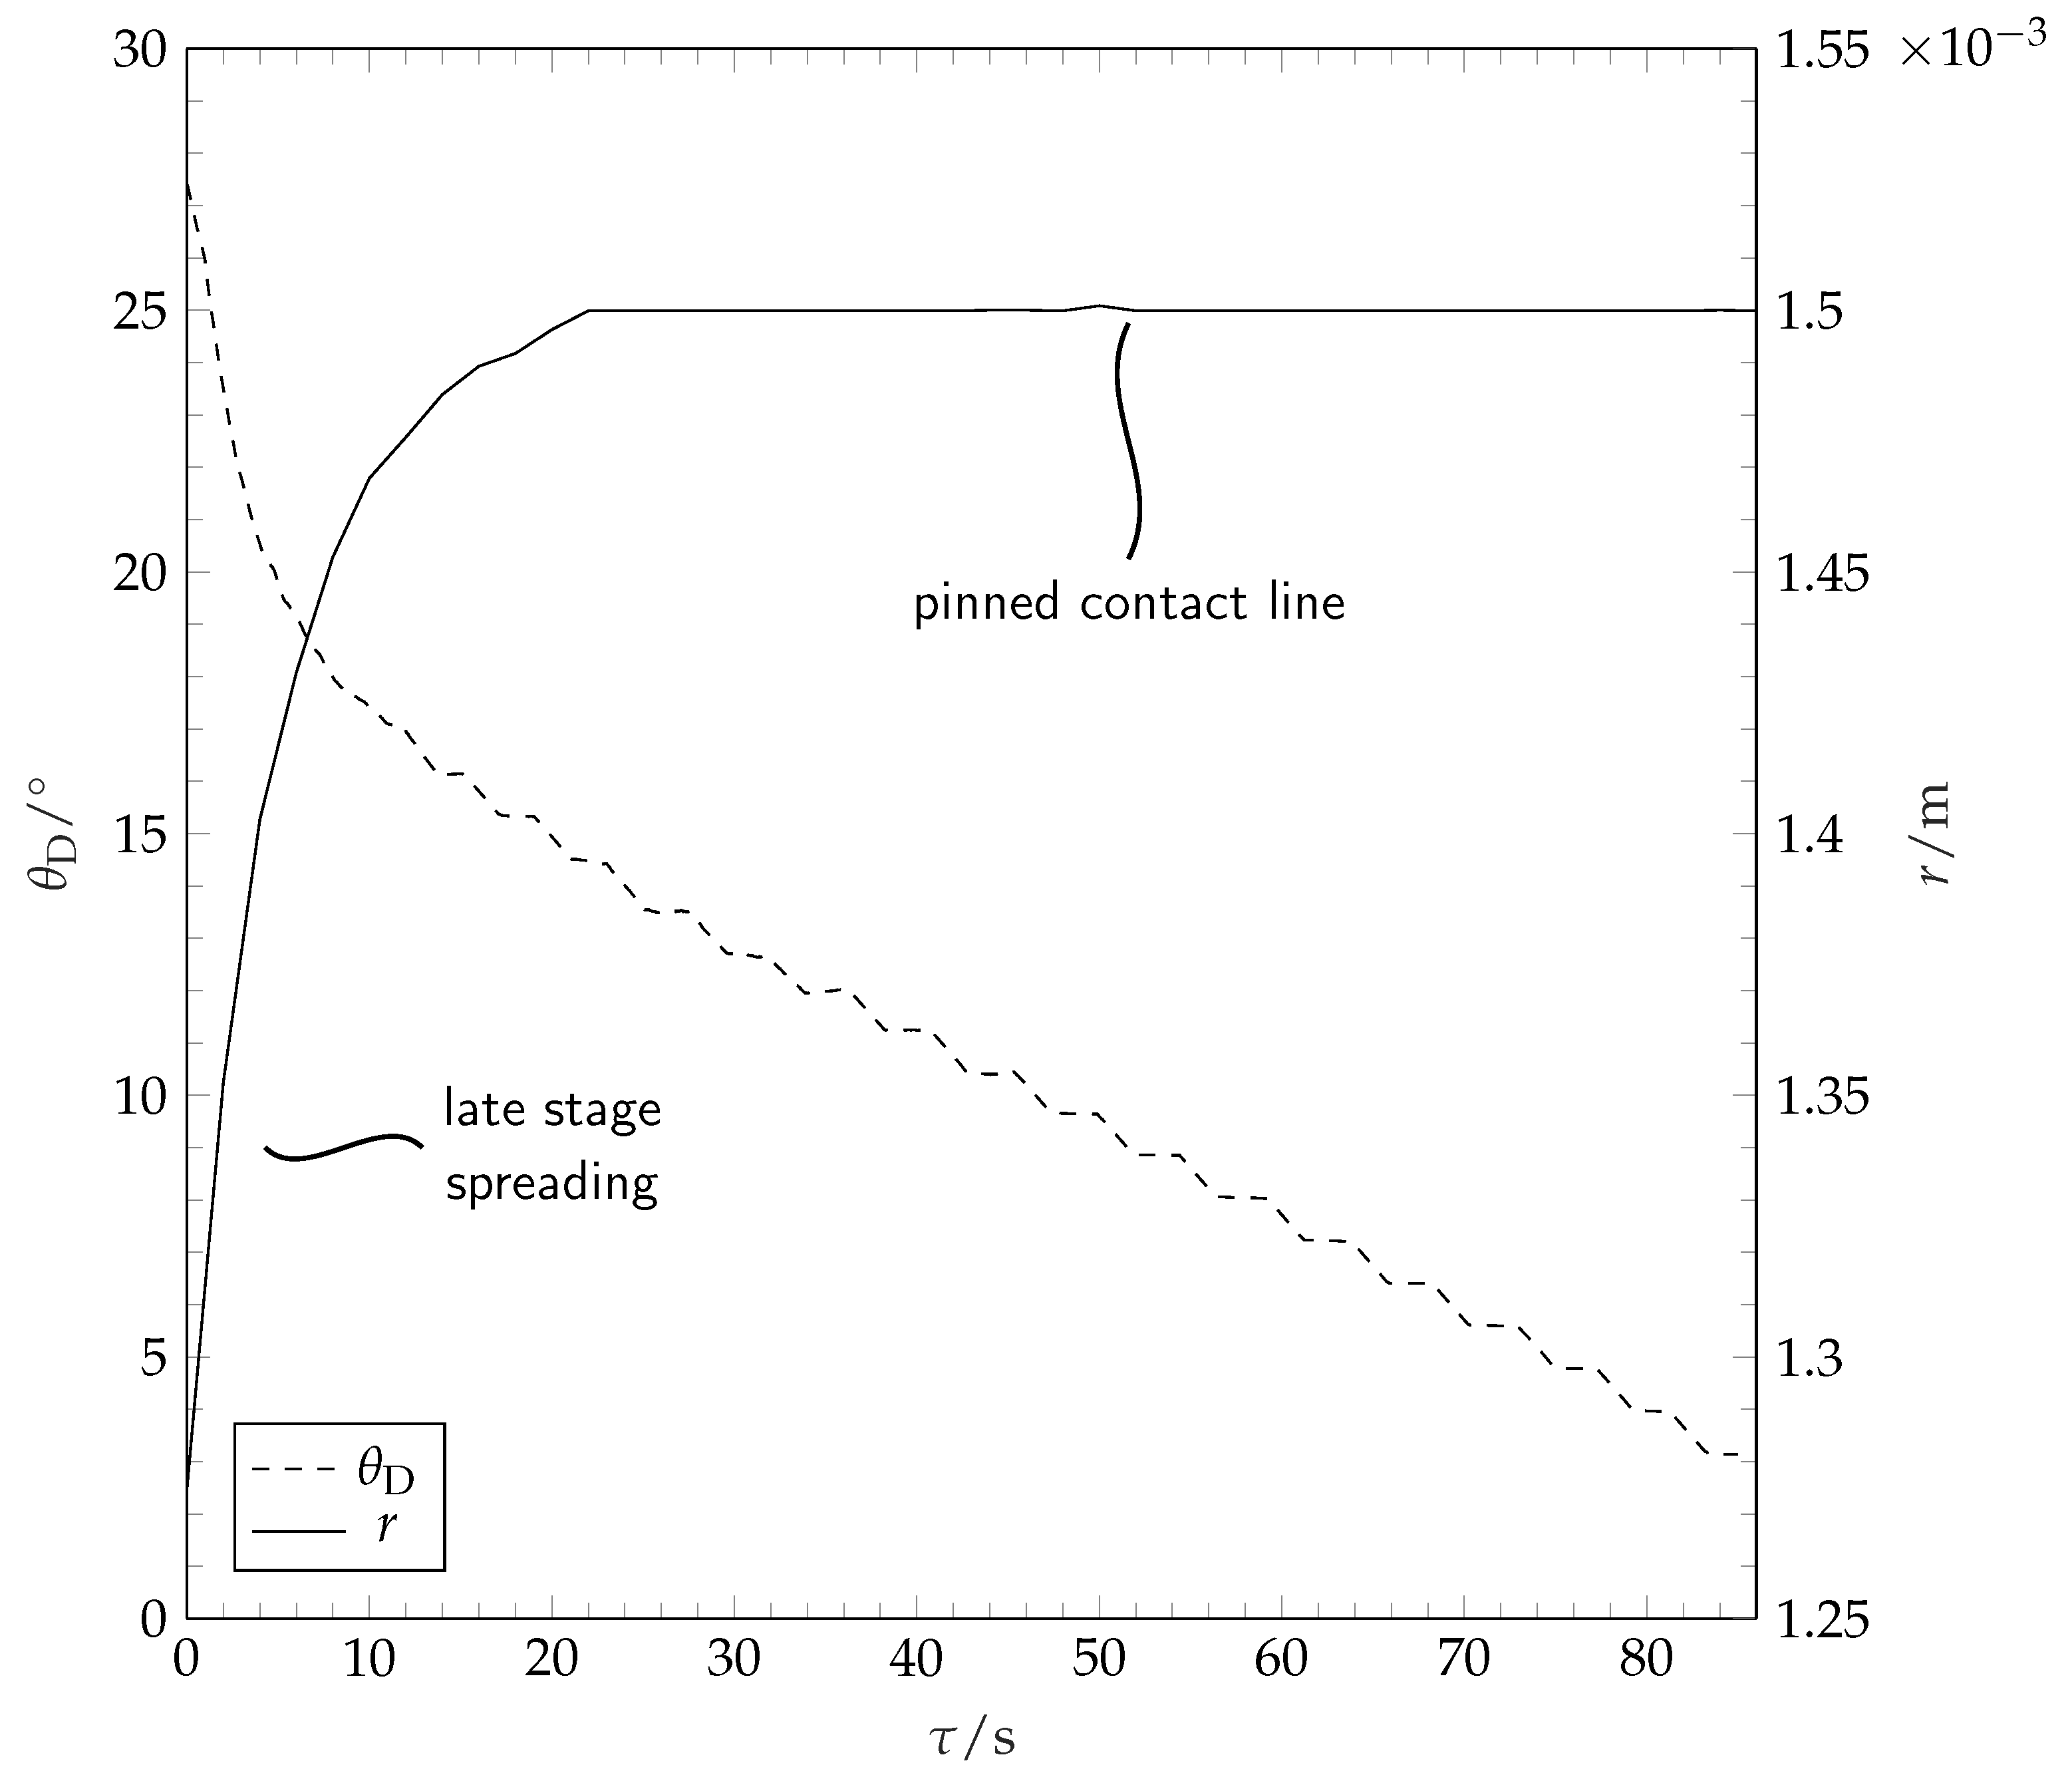
3.2. Evaporation
During and after spreading, the solvent droplet evaporates into the dry nitrogen atmosphere. The contact radius and the contact angle during these stages are depicted in
Figure 6.
After reaching the maximum spreading, the solvent droplet contact line remains pinned. The decrease in solvent droplet volume during this stage of constant contact radius results in a linear decrease in contact angle until the contact line depins. The contact angle prior to depinning lies well below 2
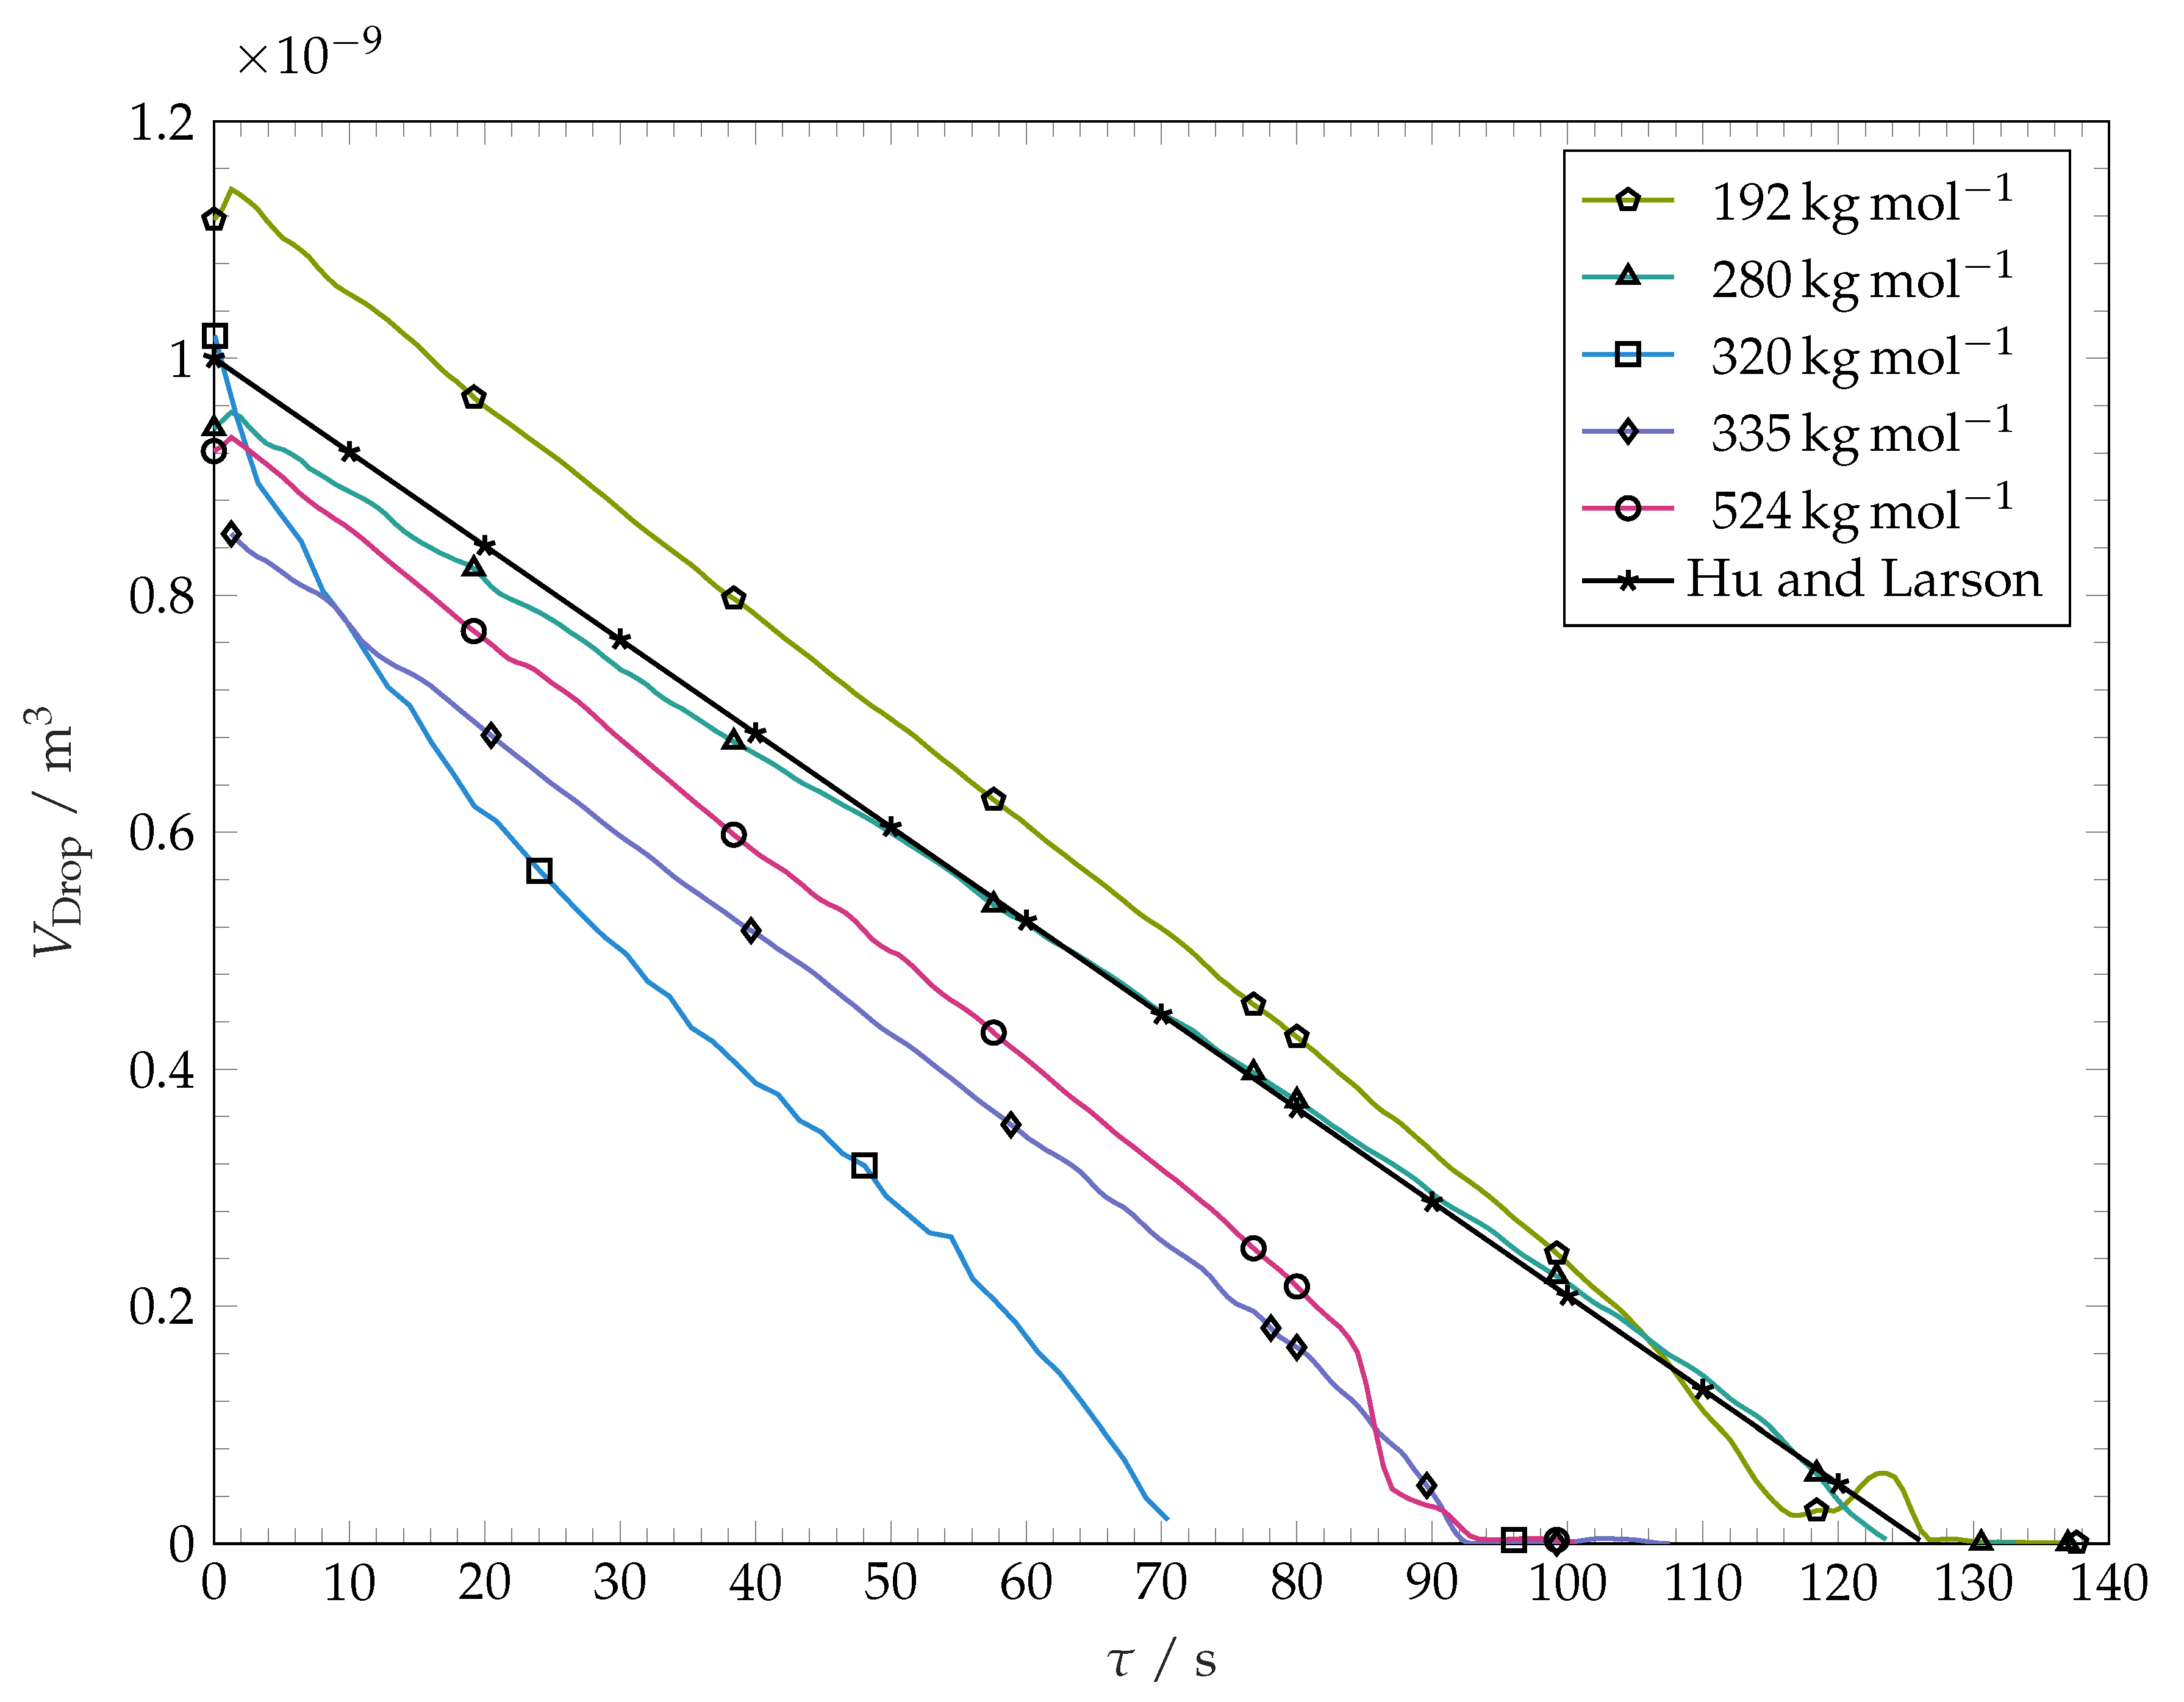
. During the final stages of evaporation, the droplet contact radius shrinks. Because of optical limitations, the receding contact angles, as well as the contact angle and the contact radius during the final stages of evaporation cannot be measured by our method and are not reported in this work. The volume evolution of the drop during evaporation is shown in
Figure 7. It is seen that the volume decreases approximately linearly with time. The evaporation rate does not vary substantially with variation of the molar mass of the coating. The curve for
−1 is an example for the sensitivity of droplet evaporation experiments on droplet spreading. The drop spreading over this substrate resulted in an unusually high spreading radius within this particular experiment, leading to a higher surface area of the droplet and therefore higher total mass loss per time.
For contact angles below 40
, the rate of the evaporation mass loss for sessile droplets of pure liquids is nearly independent from the contact angle and can be predicted using the relation [
39]
with
D,
H and
being the wetting fluid’s vapour diffusivity in the gas, the relative vapour pressure in the ambient air, and the vapour saturation concentration at the temperature of the liquid–gas interface, respectively. The black line in
Figure 7 represents the computed volume of evaporating sessile droplet having an initial volume of 1 mm
3. with the evaporation rate determined from Equation (
4). We use the material properties of pure toluene at
:
m
2s
−1 and
as derived from the work in [
37]. As the test cell is flushed with nitrogen before and during experiments, we set
. Equation (
4) predicts a linear decrease of droplet mass (and thereby volume) with time. This prediction agrees well with our experimental findings. Within
Figure 7, it can be seen that evaporation kinetics predicted from Equation (
4) is close to our experimental findings. This confirms that the presence of polymer inside our droplets does not influence the evaporation strongly. Additionally, this serves as evidence that the weak nitrogen flow through the test cell does not enact a strong convective evaporation. However, the most of our evaporating drops show a slightly larger rate of the volume loss than predicted by Equation (
4). This could be due to the chosen coefficient
D, which according to [
37] fluctuates within 4
by up to 10%.
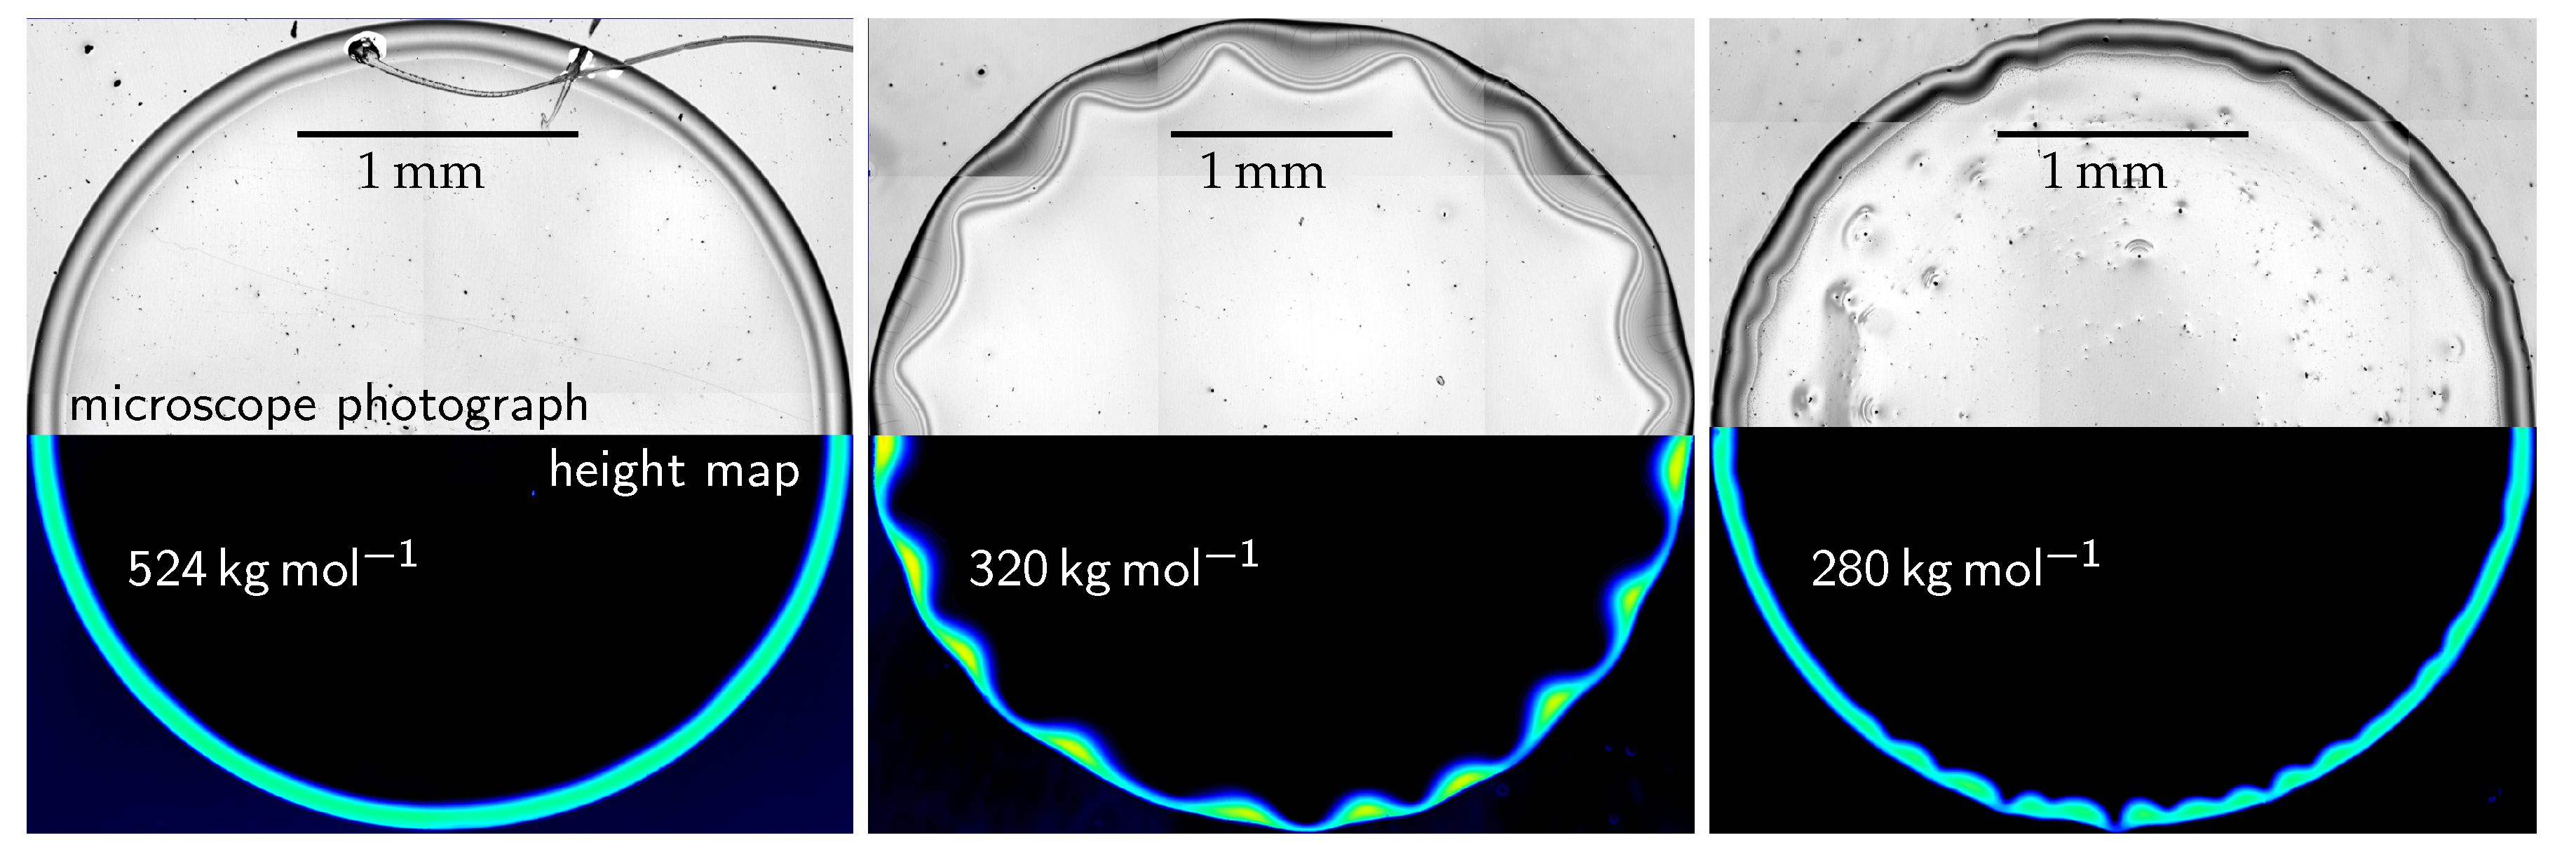
3.3. Surface Structure
The late stage of spreading and evaporation processes are accompanied by mass transport between the solvent and polymer coating. Solvent molecules penetrate into the polymer matrix and swell it, thereby softening the substrate. Single polymer chains or clusters dissolve into the bulk fluid. Evaporation induced flow inside the droplet transports the dissolved polymer molecules through the solvent. Evaporation of solvent leads to an increase of the local concentration of polymer. If the rate of evaporation overcomes the diffusion of bulk solvent into the areas of increased local polymer concentration, that local polymer solution becomes highly viscous and eventually solid (glassy). As Corneliussen et al. [
42] report the interaction parameters of
for the system toluene-polystyrene, the process of solidification is assumed to be smooth. Sudden changes in phase or physical state (as seen in precipitation processes or spinodal segregation, e.g.,) are not expected [
43]. This smooth solidification process is assumed to occur mainly within areas of high evaporation rates and can therefore lead to a local increase of coating thickness. The structure of the polymer coating after complete drop evaporation for different molar masses is shown in
Figure 8. Within our experiments, we observe the formation of circular structures which resemble coffee rings. For the well known experiments with volatile droplets of suspensions on inert surfaces, such structures result from a radial flow towards the contact line, where the evaporation rate is the highest [
40].
In context of soluble surfaces, further mechanisms can contribute to the formation of the resulting structure. Bonaccurso et al. [
15] observe an overall increase of solid phase volume after deposition and drying of toluene drops on thick plates of polystyrene. They relate this observation to an increase in polymer radius of gyration, which is a measure for the mean distance of monomers to the centre of gravity within a polymer chain. Gonuguntla and Sharma [
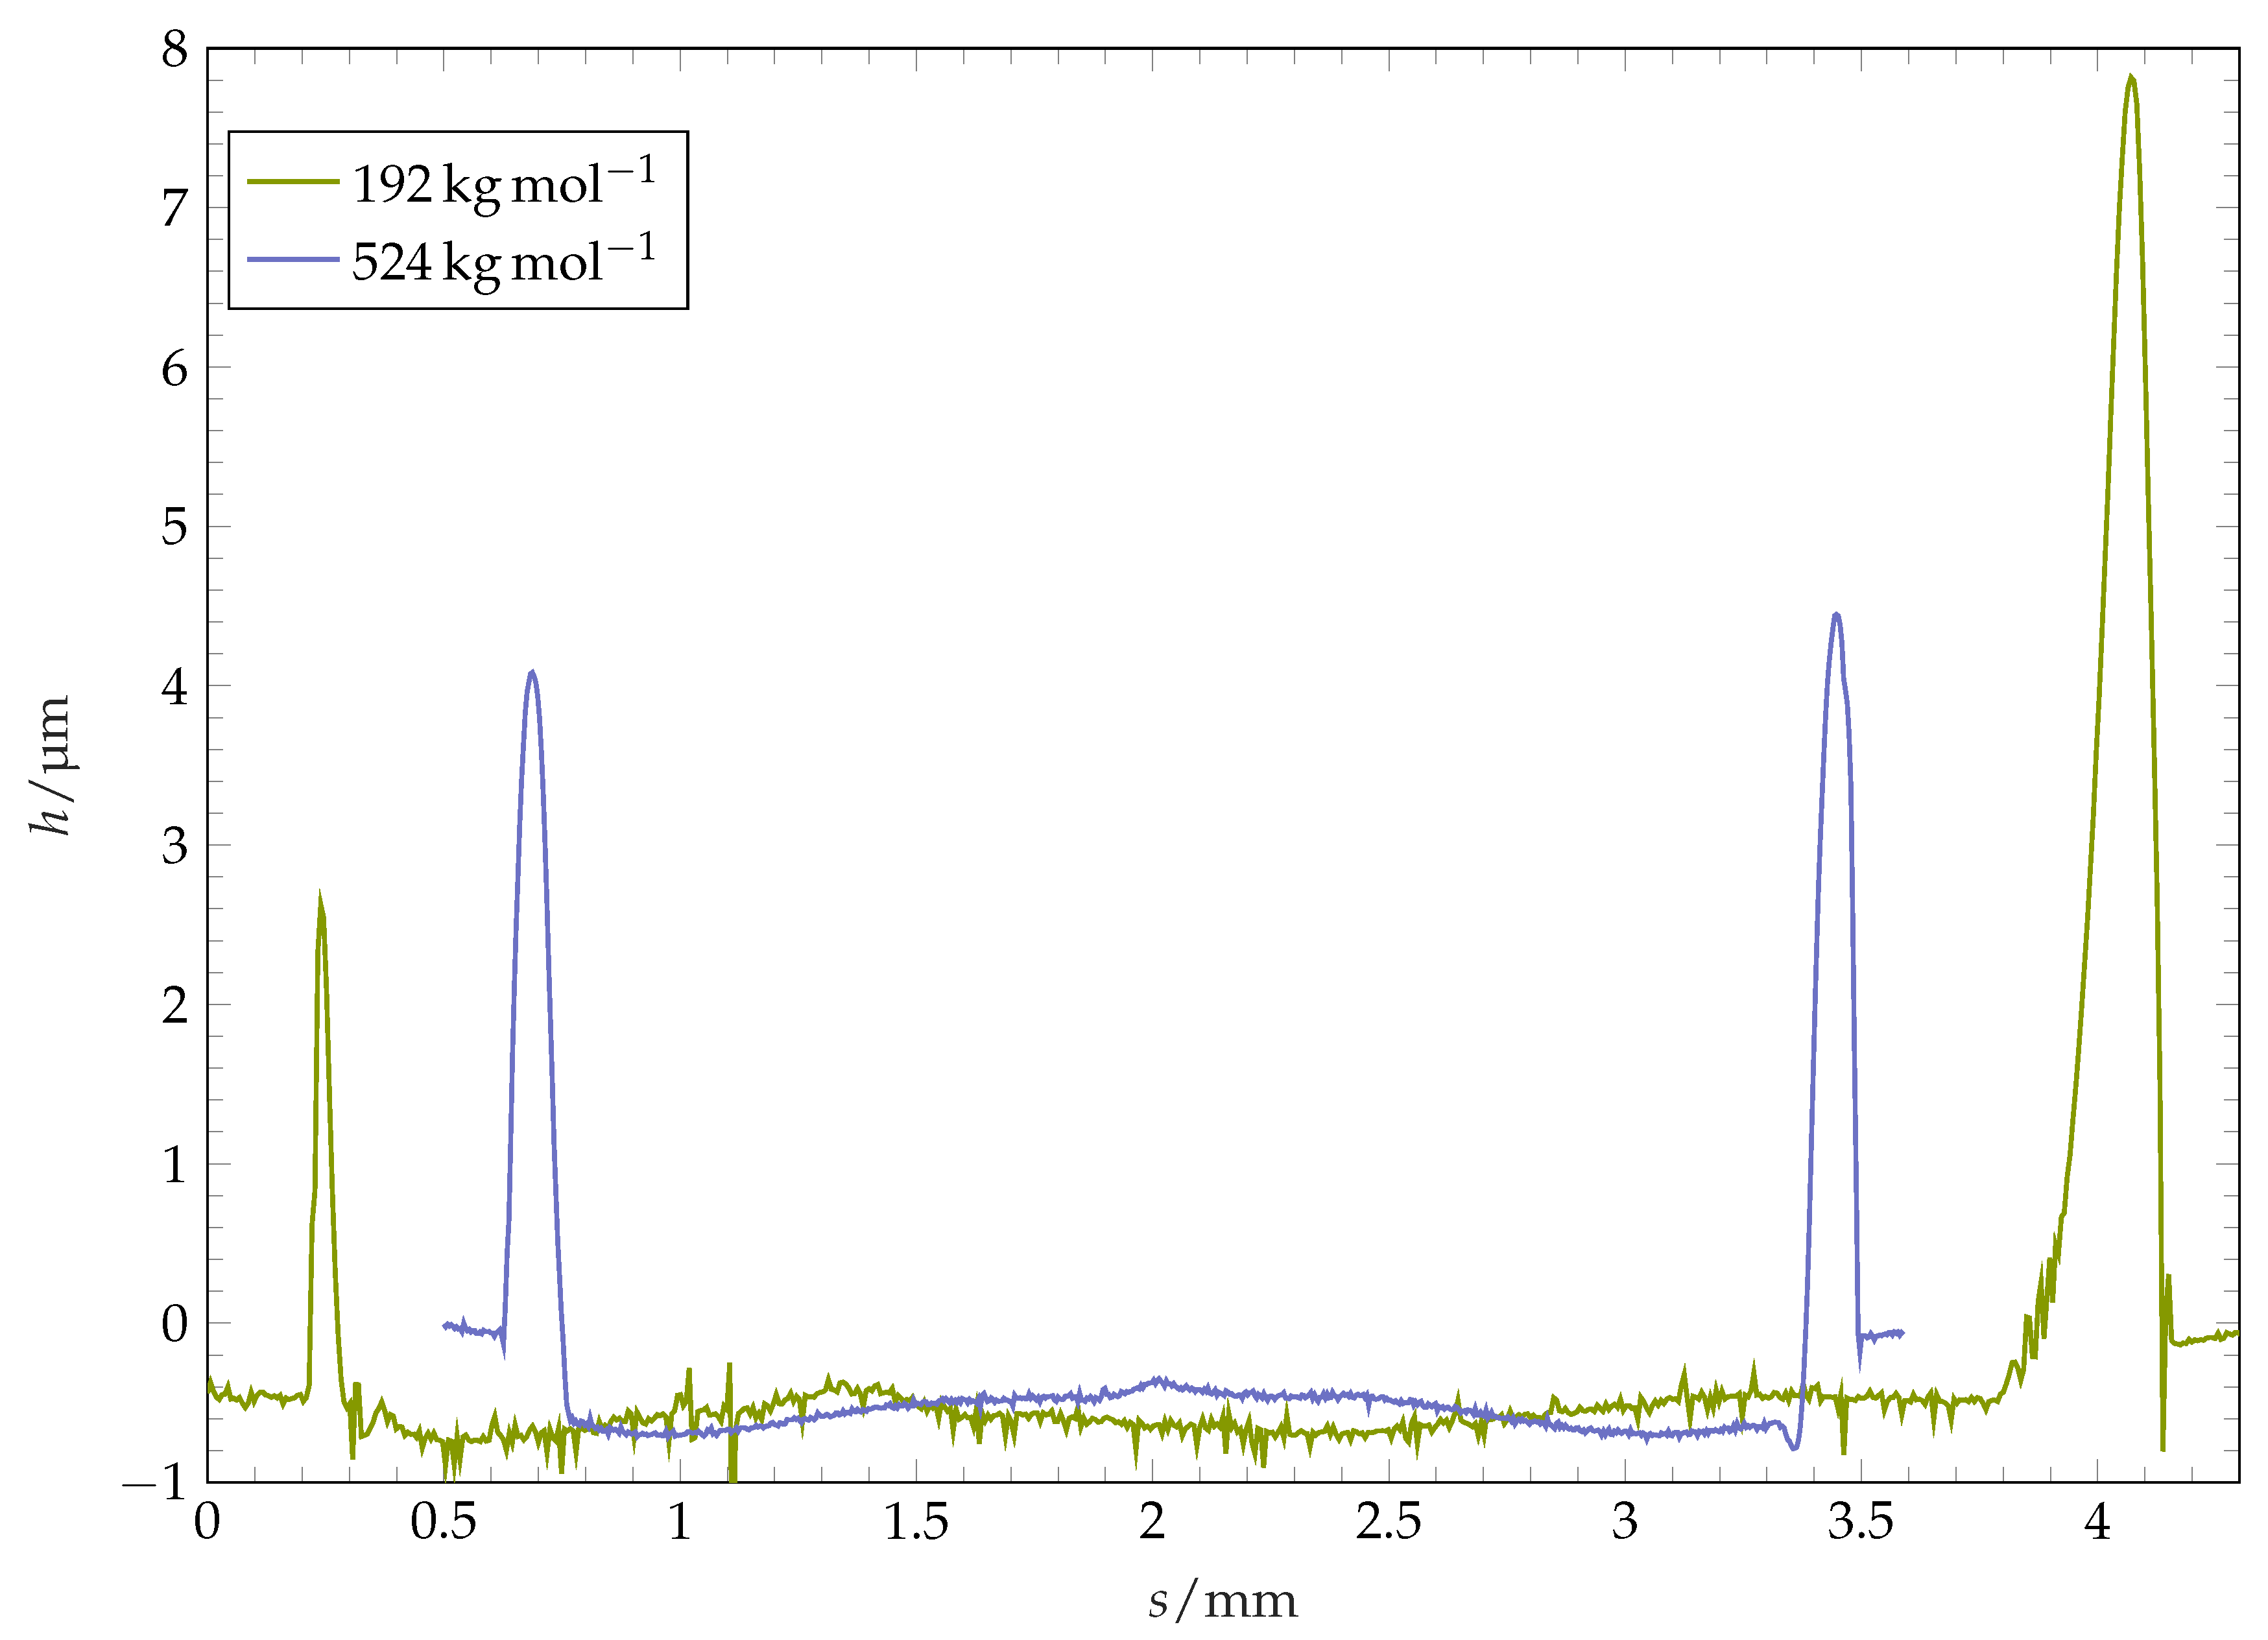
17] suggest Marangoni- and osmotic pressure-driven flows and the presence of Rayleigh–Benard cells as a cause for their observed poly(methyl methacrylate) surfaces after wetting with multiple solvents. Our circular structures formed at the pinning position have a shape of a ridge. The typical cross-sectional form of the ridge is visualised in
Figure 9, where the height profile of the coating along its diameter after the complete evaporation of a drop is plotted. For some of the coatings, this ridge is axially symmetric: the ridge radial position and the ridge height are almost constant over the circumference (see
Figure 8, left image). For other coatings, the shape of ridge after the complete drop evaporation is highly perturbed (see
Figure 8, image in the middle). The width of the ridge in these cases is distributed highly inhomogeneously along the perimeter, with agglomerates protruding towards the centre of the structure. The polymer mass is highly accumulated within these perturbed regions, which can be observed in form of local maxima of ridge height within the agglomerates. Aside from the fingers, the ridge consists of thin, comparably low strands.
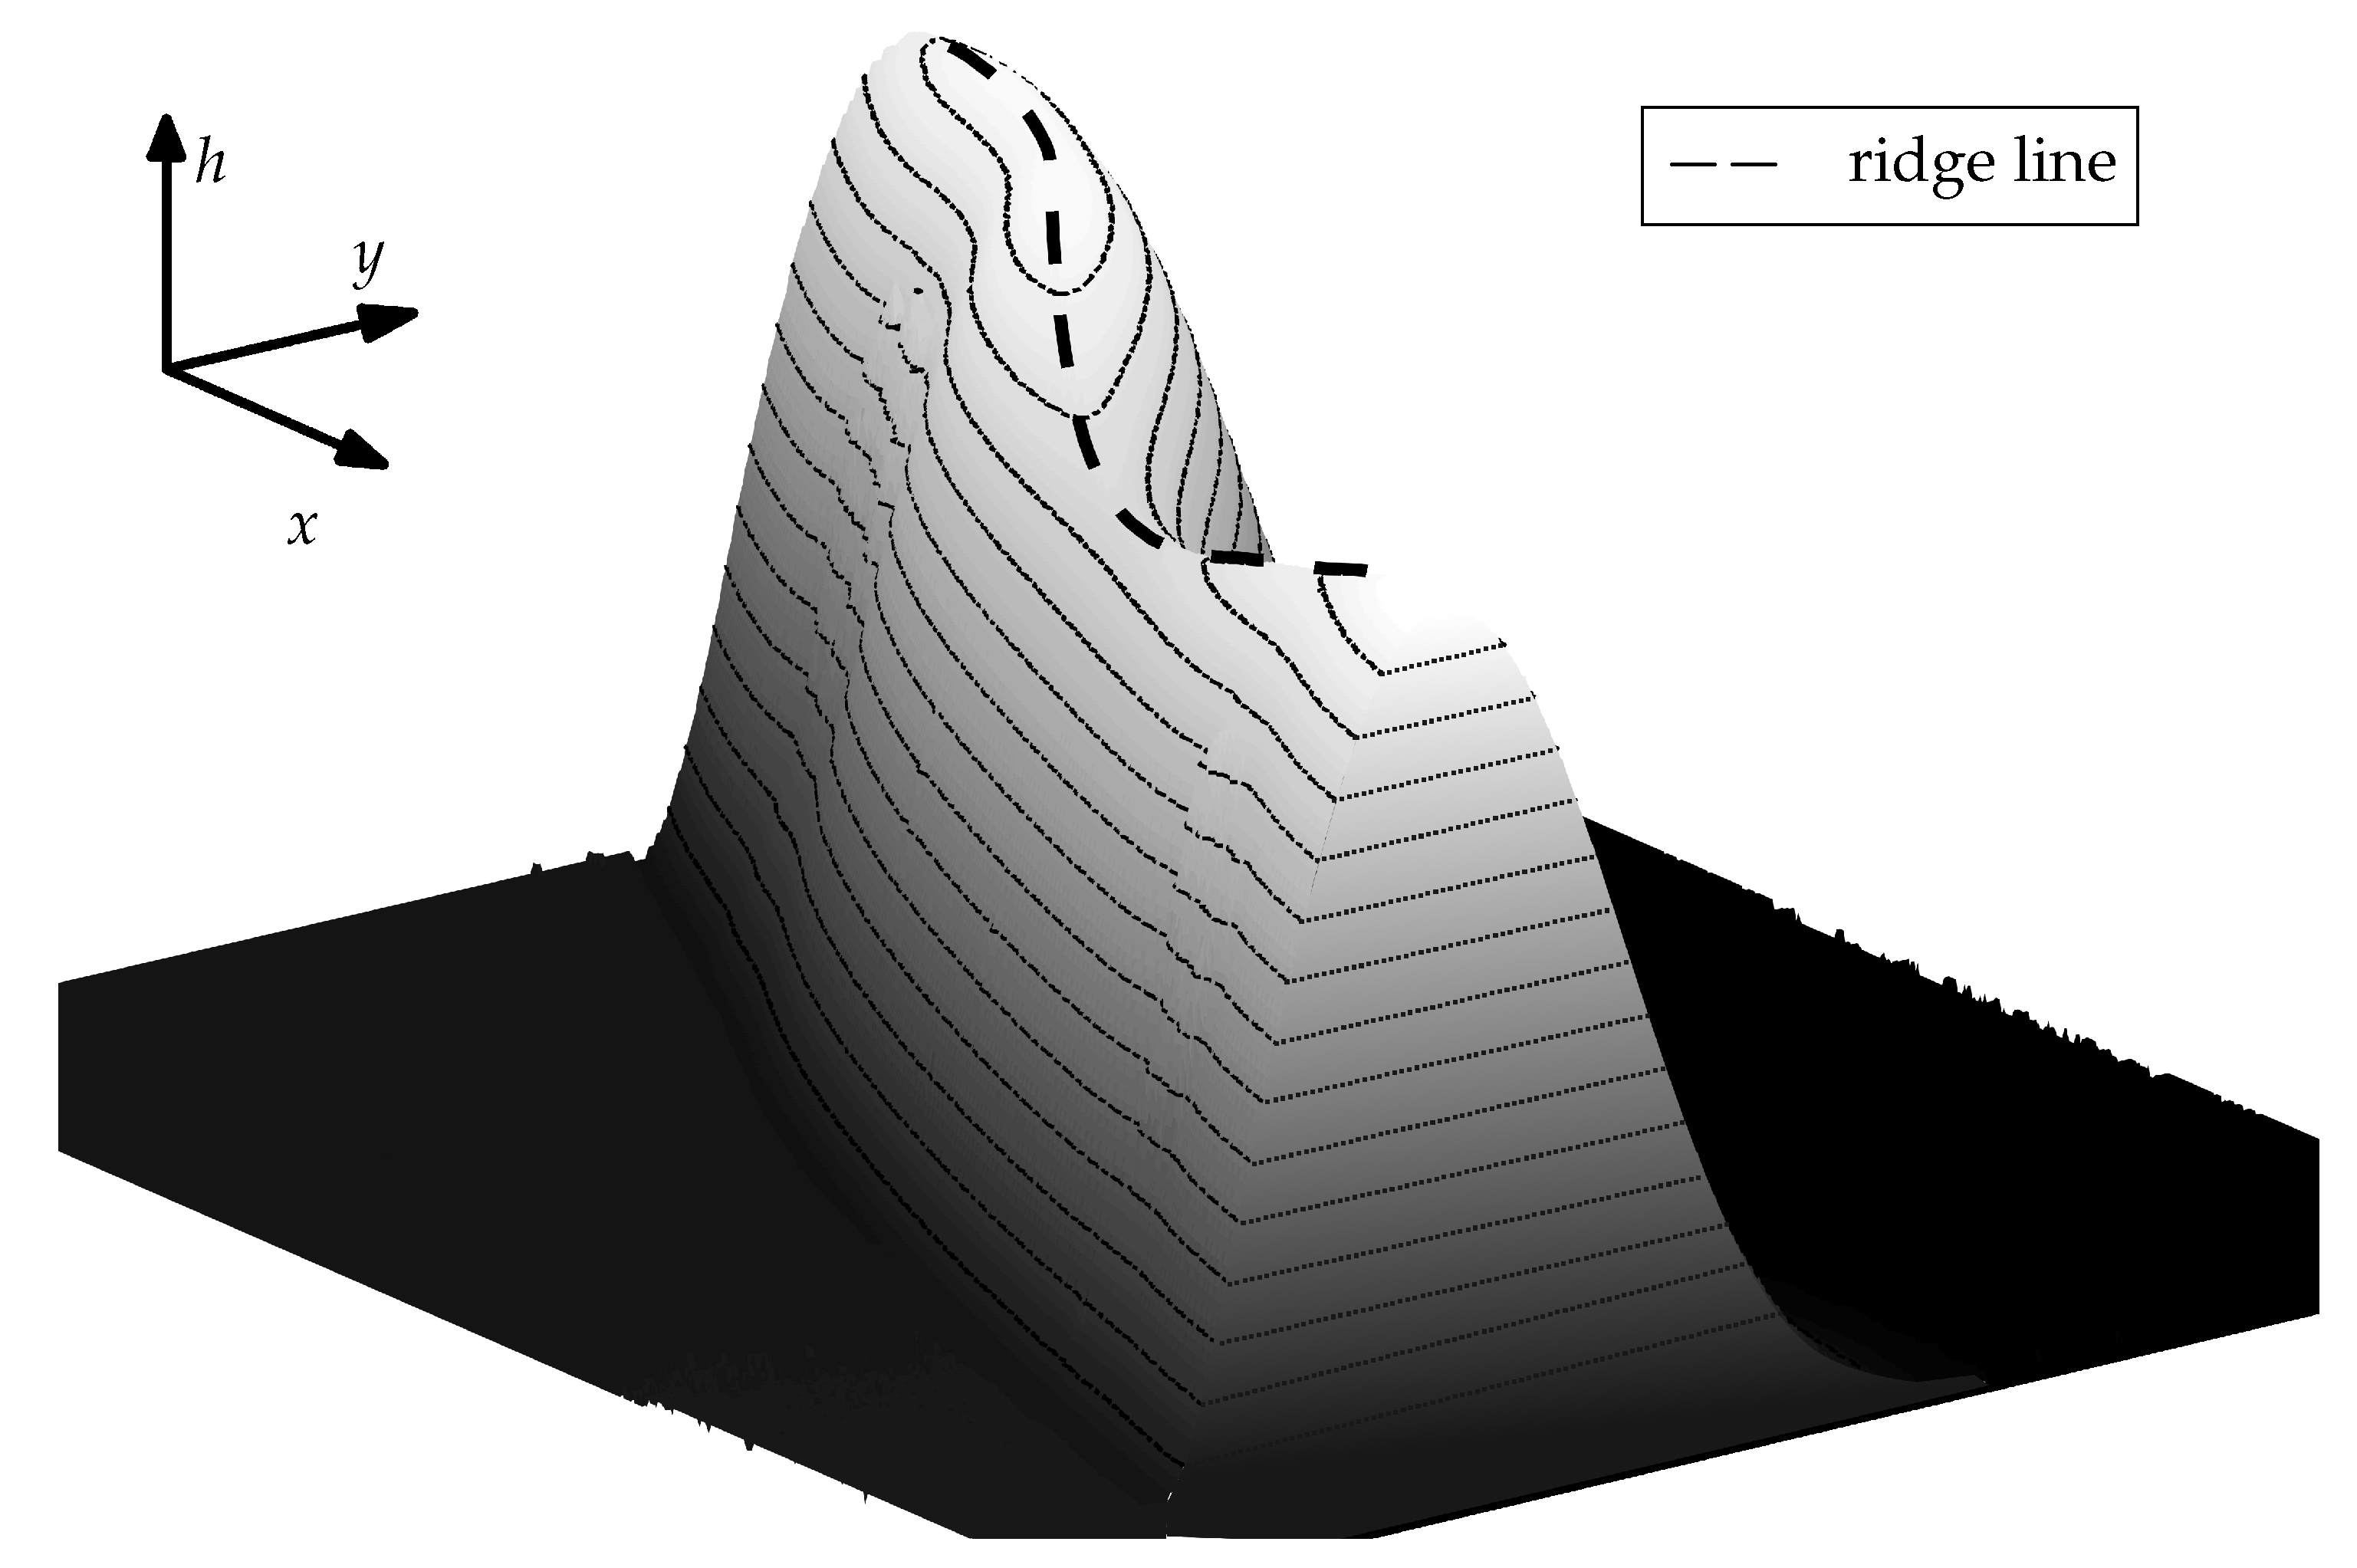
In the following we shall refer to the closed curve connecting the points on the top of the ridge as a
ridge line. The course of the ridge line over a small section of the ridge is illustrated in
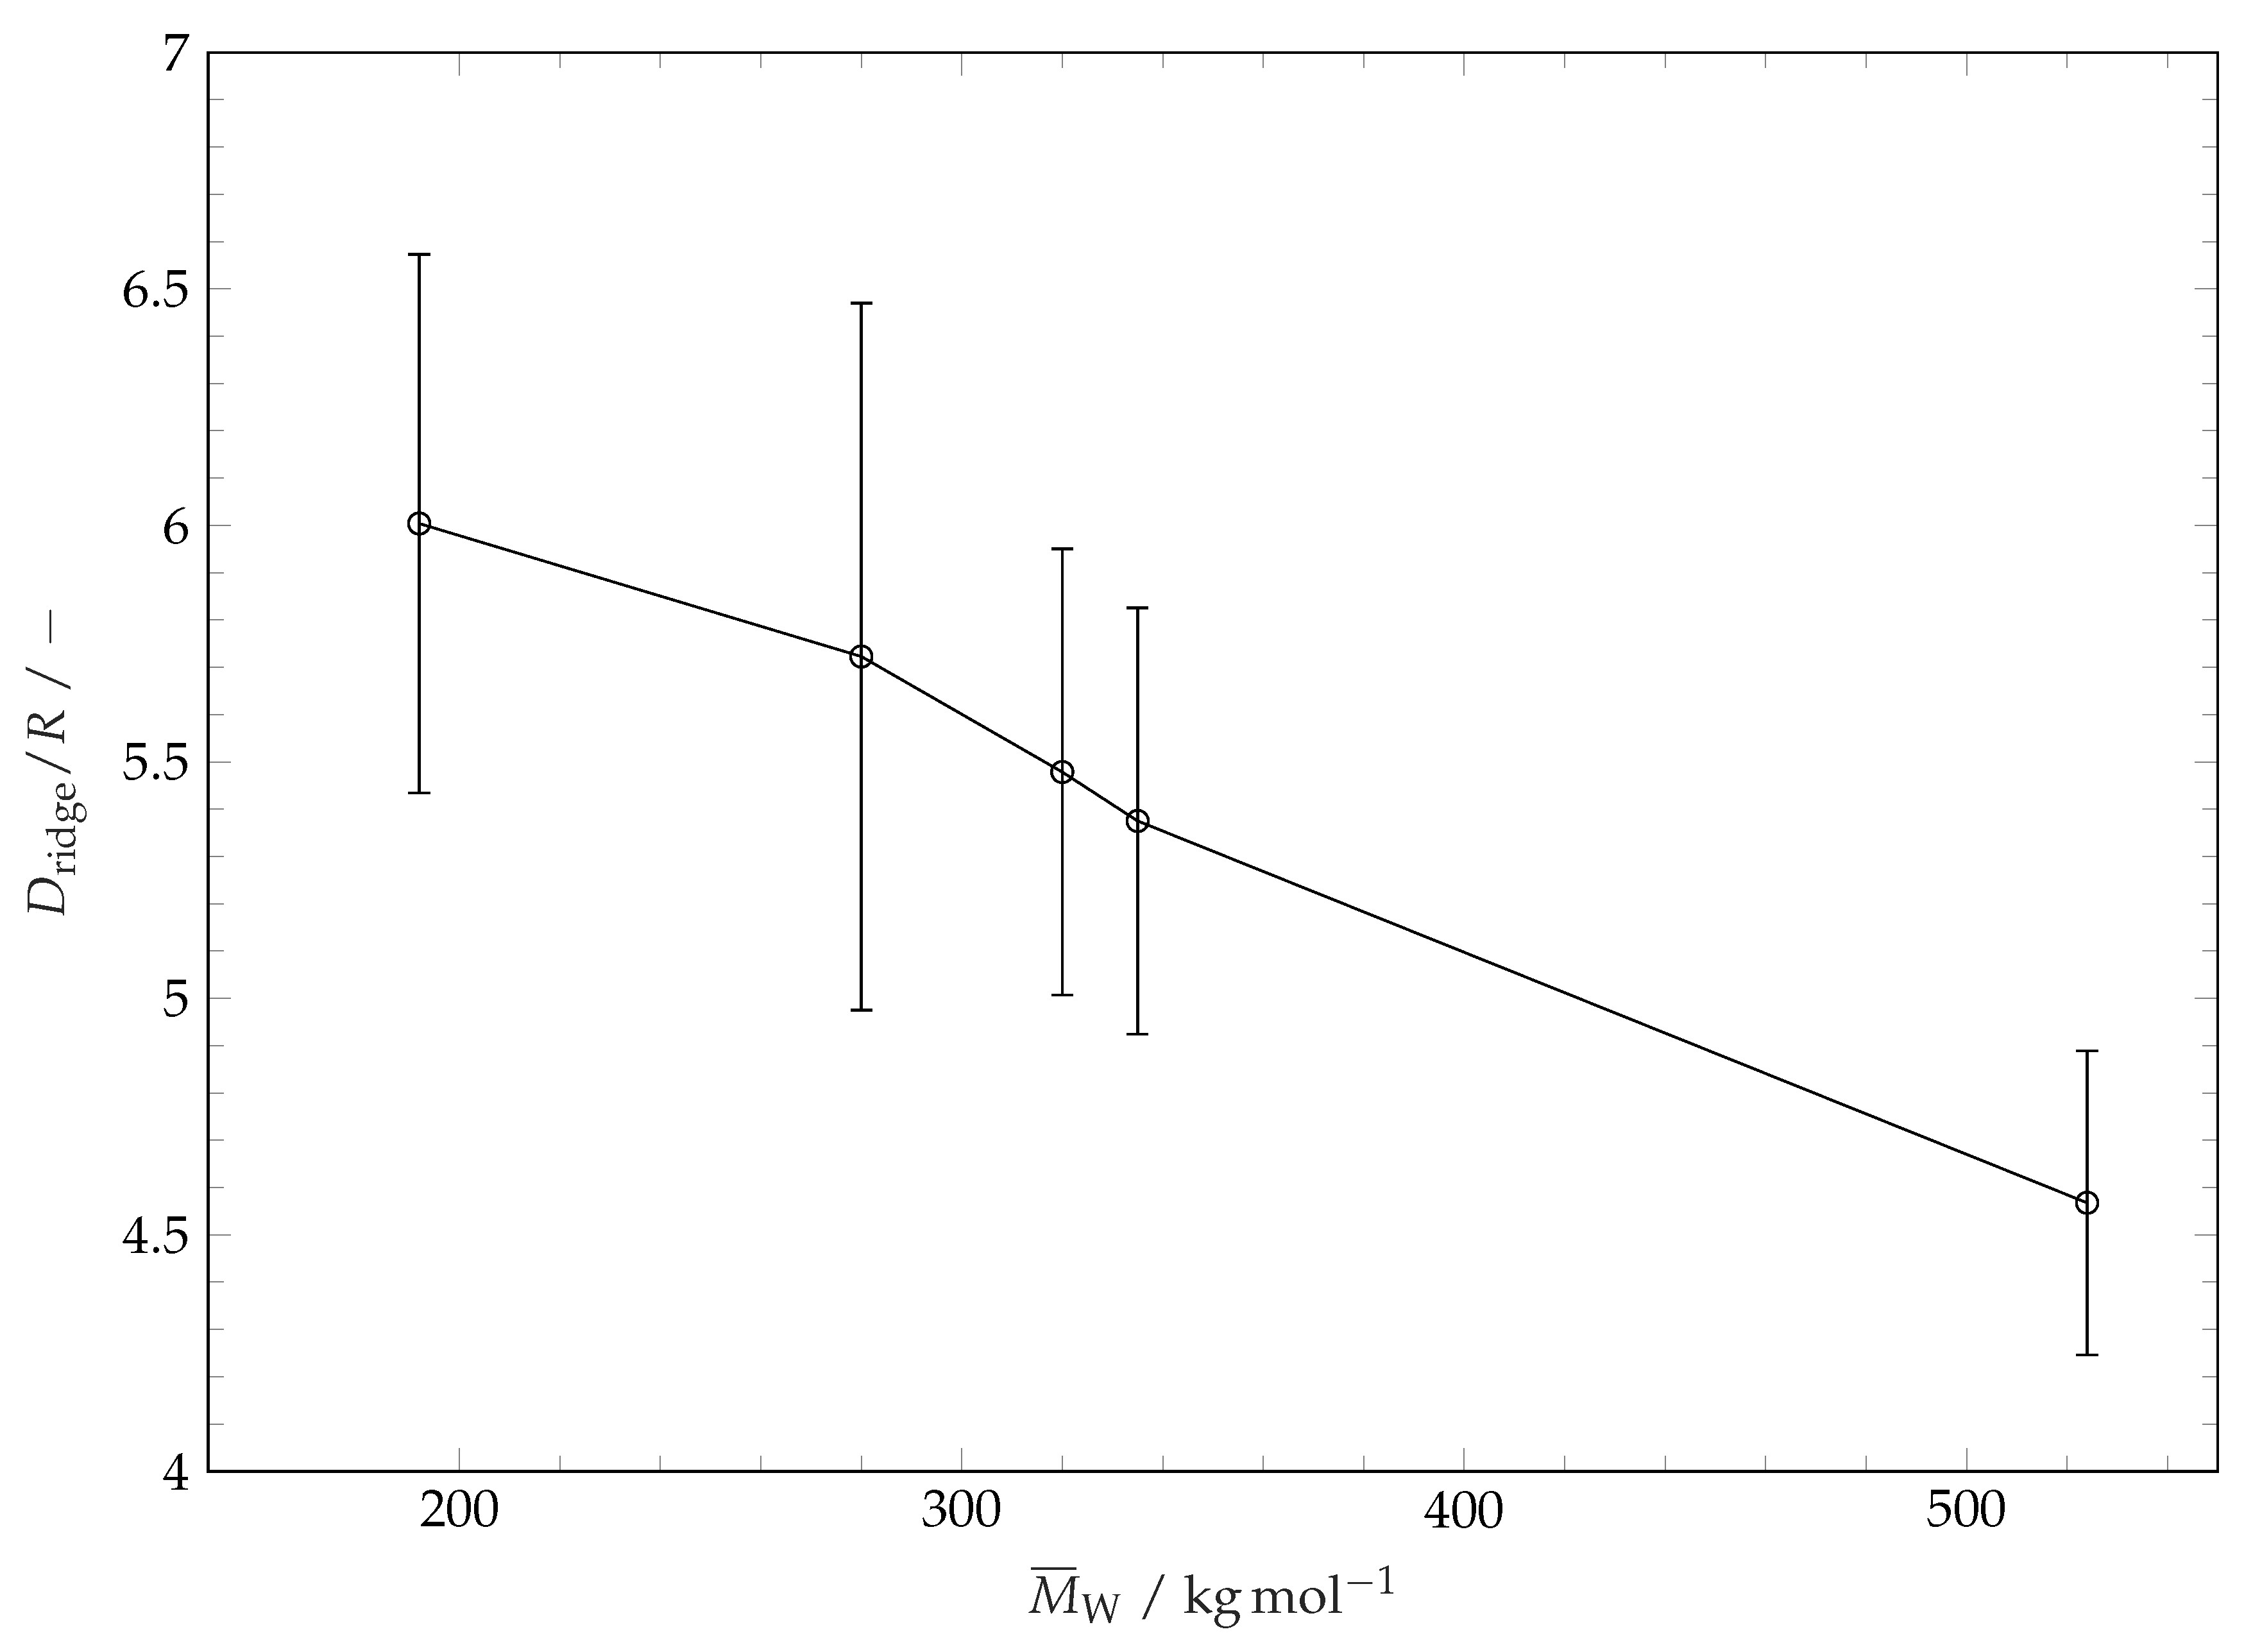
Figure 10. For characterization of the coating structure after the evaporation of solvent and restructuring we consider the diameter of the ridge line and the distribution of the height of the coating along the ridge line. The influence of molar mass of polymer coating (or coating solubility) on the ridge line diameter is plotted in
Figure 11. This diameter is determined by fitting a circle to the projection of the extracted ridge line onto the substrate plane. This parameter is very close to the maximum drop spreading diameter (see
Figure 3 and
Figure 6). It is seen in
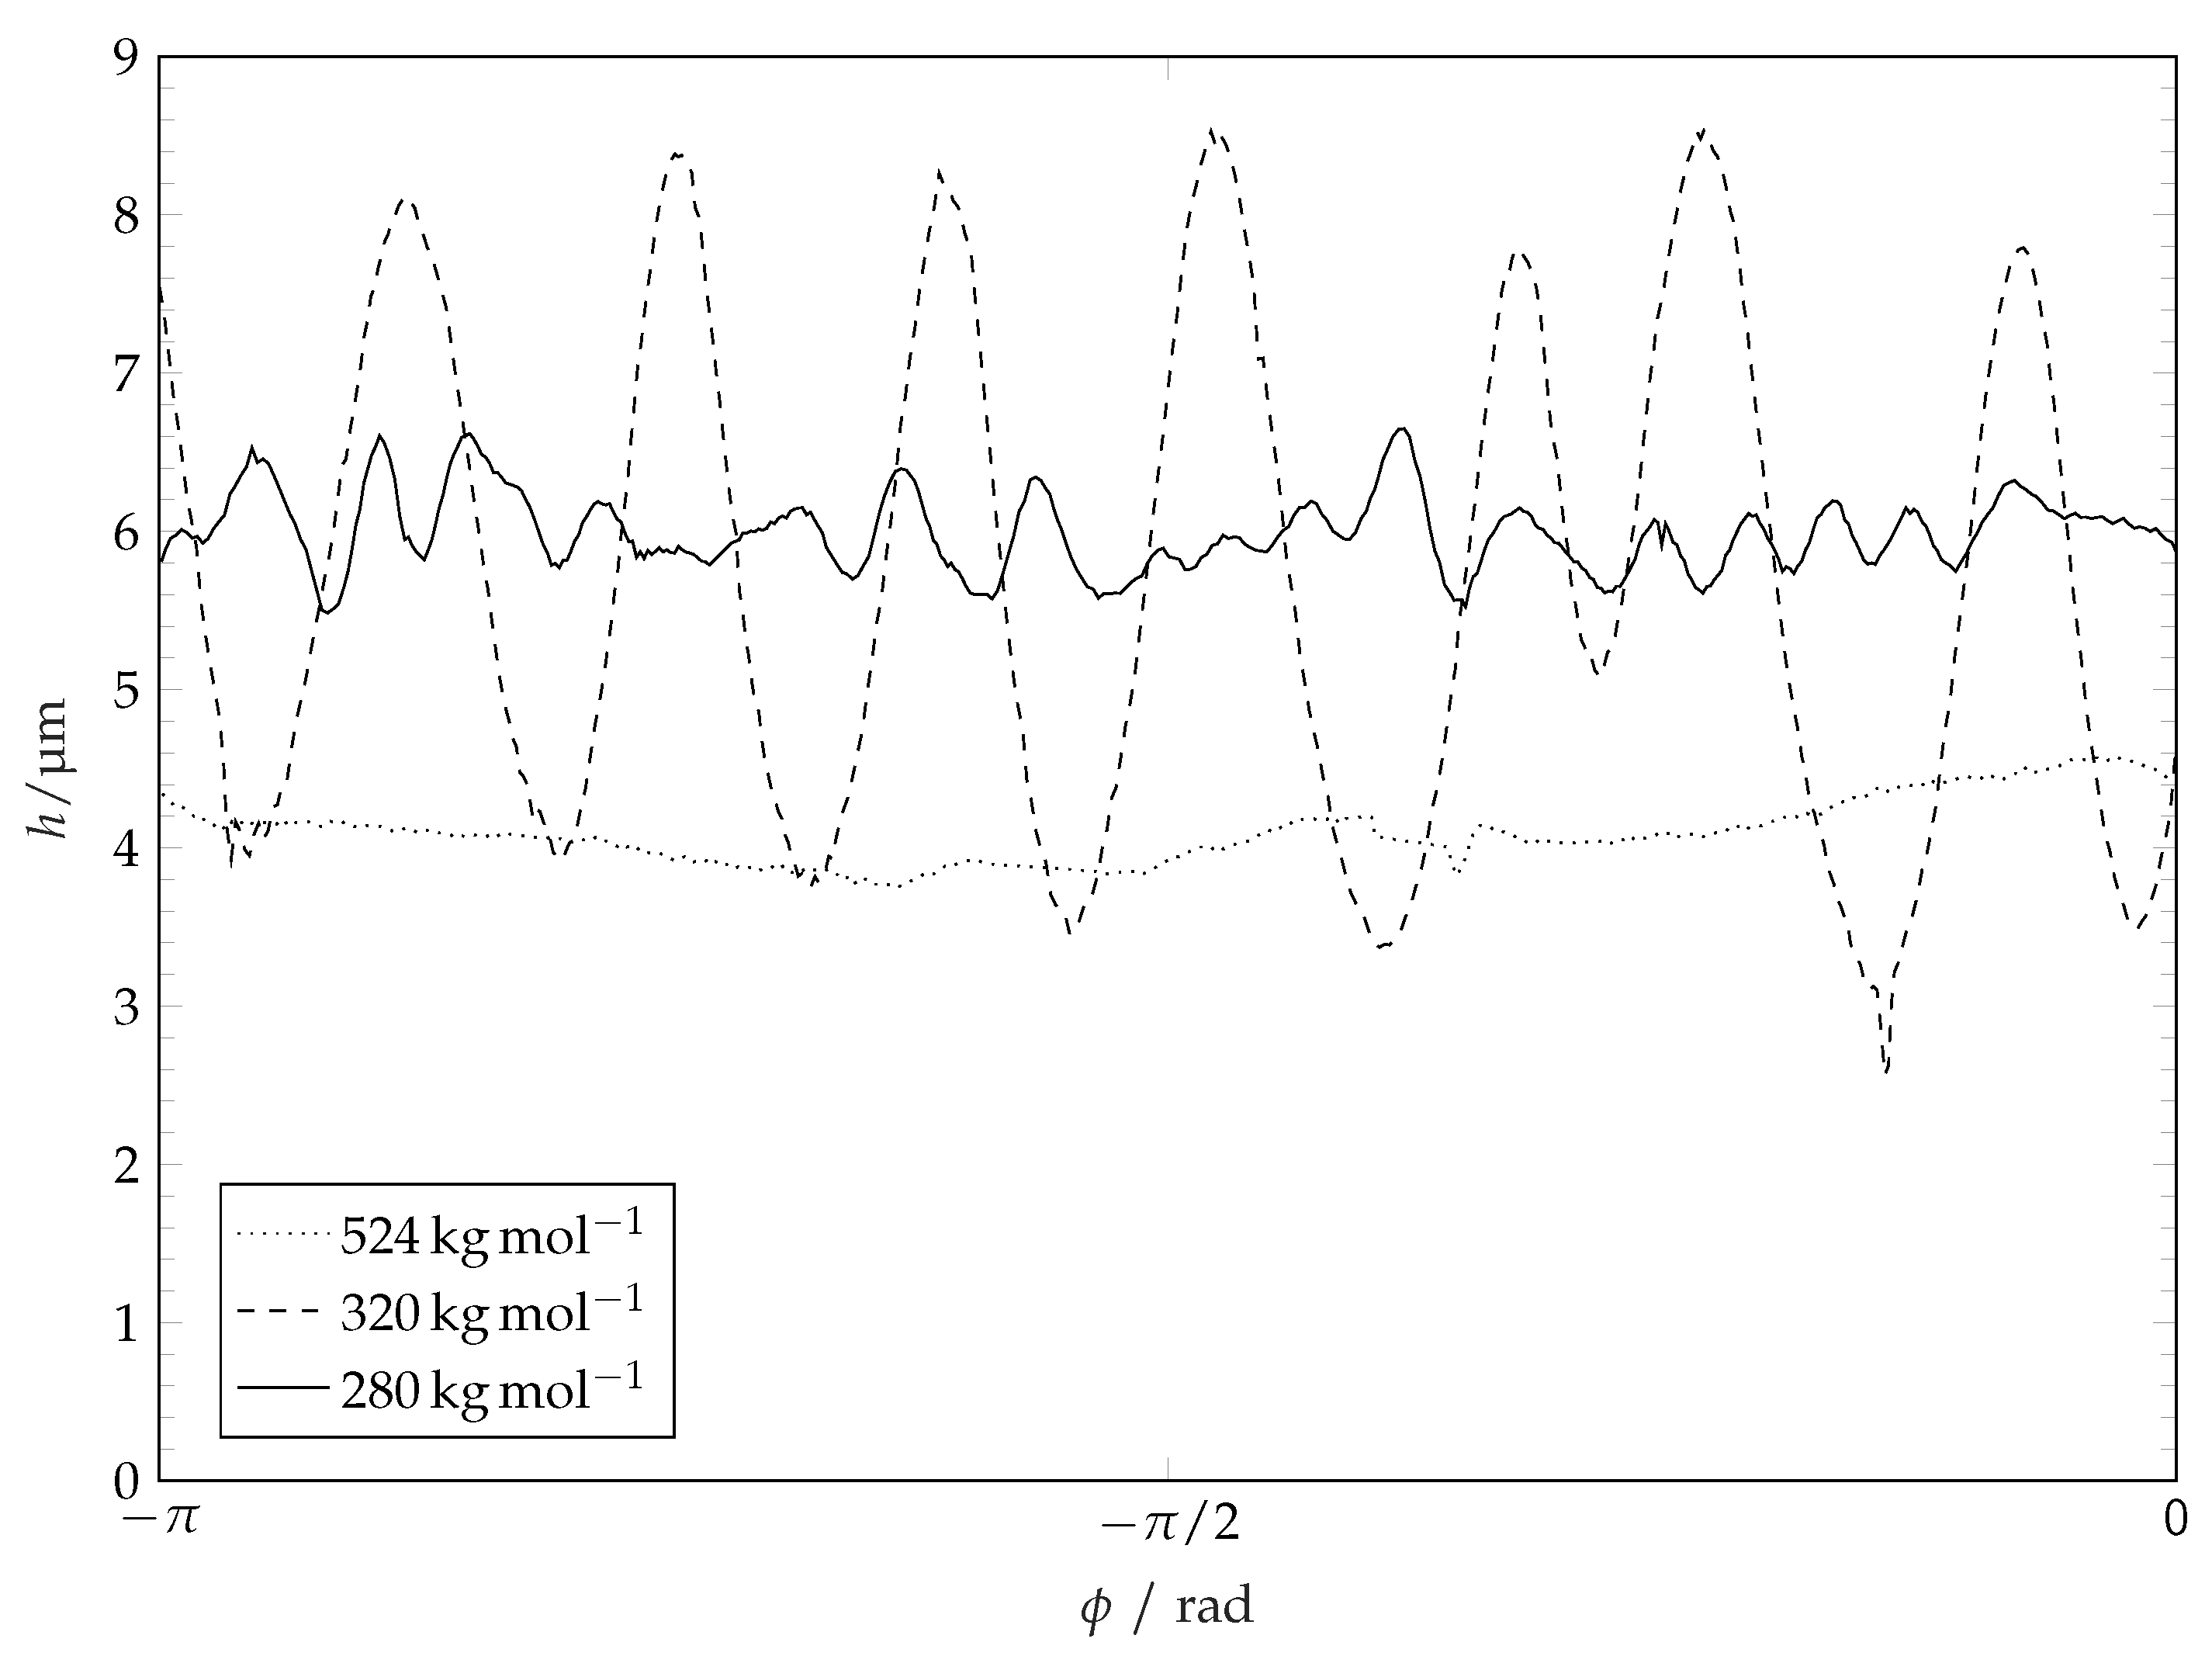
Figure 11 that the ridge line diameter decreases with increasing of polymer molar mass (i.e., decreasing solubility). The distribution of the coating thickness along the ridge line circumference is shown in
Figure 12. It is seen that the average height of the ridge, the amplitude and the wave length of the ridge height oscillations depend on the molar mass of the coating (and thereby the solubility [
44,
45]). Smooth ridge lines can be obtained with the coatings having high molar mass (or lower solubility, respectively). The increased solubility of low molar weight polymers results in perturbations along the ridge line. These perturbations manifest themselves in oscillations of the ridge height along the ridge line and in fingers which reach towards the centre of the circle. Polymers with a high molar mass (
−1) show smooth ridge lines with only low amplitude long wave perturbations. Polymers with a medium molar mass (
−1 and
−1) tend to show low numbers of perturbations along the ridge line (or perturbations with a long average wave length) with high amplitude. Polymers with a low molar mass (
−1 and
−1) tend to produce many perturbations along the ridge line (or perturbations with a short wave length) with lower amplitudes. These characteristics are not related to the initial surface roughness of the coatings. The roughness of the surface coatings is just slightly higher (
) for lower polymer molar masses on our overall smooth surfaces (see
Table 1). A possible explanation for the formation of ridge perturbations was delivered by Poulard and Damman [
46]. They conducted drying experiments with droplets of polydimethyolsiloxane (PDMS) solutions on inert surfaces and measured the surface left behind after complete solvent evaporation. Some of their structures resemble the ones we present within this work and also show perturbations. For their system, Poulard and Damman [
46] have attributed the appearance of perturbations to the Rayleigh–Plateau instability and related the number of observed fingers to the critical wavelength of the Rayleigh–Plateau theory:
W, with the perturbations wavelength
and the ridge cross-sectional width
W. However, this principle cannot be observed for the full range of our experiments. A possible explanation for this discrepancy lies in viscosity. Near the contact line a PS solution in a semi-diluted state is created. For this case, the relative viscosity of PS solutions in similar solvents scales with
and
[
32] as already mentioned earlier. Solutions of polymers with a high degree of polymerisation are therefore highly viscous compared to solutions with low molar mass polymers at the same volumetric concentration. A high viscosity near the contact line represents a damping mechanism which could suppress the development of ridge deformation.
Figure 10.
Illustration of the term
ridge line used within this work. The figure shows a portion of a pertubed ridge as depicted in
Figure 8. Image obtained with a PS of 335
/
−1.
Figure 10.
Illustration of the term
ridge line used within this work. The figure shows a portion of a pertubed ridge as depicted in
Figure 8. Image obtained with a PS of 335
/
−1.
Figure 11.
Ridge line diameters after wetting and evaporation of solvent droplets on different substrates. For comparability, ridge line diameters are divided by the initial solvent droplets radius R. The error bars represent the standard deviation of the mean values.
Figure 11.
Ridge line diameters after wetting and evaporation of solvent droplets on different substrates. For comparability, ridge line diameters are divided by the initial solvent droplets radius R. The error bars represent the standard deviation of the mean values.
Figure 12.
Ridge heights over angular coordinate show pertubations along ridge line. Graphs show heights above original coating level. Coating molar mass shows influence on pertubation frequency and amplitude. For a better visualisation, only half cycles are depicted.
Figure 12.
Ridge heights over angular coordinate show pertubations along ridge line. Graphs show heights above original coating level. Coating molar mass shows influence on pertubation frequency and amplitude. For a better visualisation, only half cycles are depicted.


