Article

The Effect of Dental Bleaching on Nanohybrid Composite Surface Roughness: A Comparative In Vitro Study of SEM and Profilometry

1
Department of Esthetic and Prosthetic Dentistry, Faculty of Dental Medicine, Saint Joseph University of Beirut, Beirut 1104 2020, Lebanon
2
Kamal A. Shair Central Research Science Laboratory, Faculty of Arts and Sciences, American University of Beirut, P.O. Box 11-0236, Beirut 1107 2020, Lebanon
3
Department of Removable Prosthodontics, Faculty of Dental Medicine, Saint Joseph University of Beirut, Beirut 1104 2020, Lebanon
4
Department of Physics, Faculty of Science, Saint Joseph University of Beirut, B.P. 11-514-Riad El Solh, Beirut 1107 2050, Lebanon
5
Department of Biomaterials and Bioengineering, INSERM UMR_S 1121, University of Strasbourg, 67000 Strasbourg, France
6
Department of Endodontics and Conservative Dentistry, Faculty of Dental Medicine, University of Strasbourg, 67000 Strasbourg, France
7
Postgraduate Program in Restorative and Esthetic Dentistry, Dental Faculty, Saint Joseph University of Beirut, Beirut 1104 2020, Lebanon
*
Authors to whom correspondence should be addressed.
J. Compos. Sci. 2025, 9(6), 313; https://doi.org/10.3390/jcs9060313
Submission received: 21 May 2025 / Revised: 10 June 2025 / Accepted: 13 June 2025 / Published: 19 June 2025
(This article belongs to the Special Issue Recent Progress in Hybrid Composites)

Abstract

Background: This study aimed to evaluate the effect of in-office bleaching with 38% hydrogen peroxide (HP) on the surface roughness of a nanohybrid composite resin by comparing two measurement techniques: Scanning Electron Microscopy (SEM) and profilometry. Methods: Sixty composite specimens of identical shade and thickness were prepared, light-cured, and polished following the manufacturer’s guidelines. These samples were divided into six groups based on the applied surface treatments: group 1: fresh composite (the control group), group 2: old composite, group 3: bleached fresh composite, group 4: bleached old composite, group 5: old repolished composite, and group 6: old repolished bleached composite. Surface roughness was measured using profilometry and SEM. Results: Pearson correlation analysis revealed a moderately significant linear relationship (r = 0.548, p < 0.001) between the surface roughness measurements obtained using SEM and the profilometer, indicating that both methods provide comparable results. A comparison of most groups showed significant differences (p < 0.001), highlighting the increased surface roughness observed after bleaching both fresh and aged composites. Conclusions: Bleaching increased the surface roughness of nanohybrid composites. It might be better to use SEM and a profilometer together to obtain a more comprehensive understanding of the surface characteristics.

1. Introduction

Studies on a variety of adult populations have revealed that 19.6% to 65.9% of people are not satisfied with their tooth color, and 20.4% to 50% are not pleased with the appearance of their teeth [1]. Overall, this discontent with both tooth appearance and color is linked to a heightened inclination for seeking treatments that enhance dental aesthetics, such as tooth whitening [2]. A prior study that examined how tooth color affected social judgments found that whiter teeth were associated with a more positive perception [3].
The integration of nanotechnology into conservative dentistry has given rise to the formulation of nanofilled and nanohybrid composites. Nano-sized fillers enable superior surface finishes and a smooth texture, contributing to a more natural appearance in dental restorations [4]. Neo SpectraTM ST Effects (Dentsply, Konstanz, Germany), previously cited in the literature as Ceram.x, is a nanohybrid composite characterized by the inclusion of pre-polymerized SphereTEC® fillers, which are spherical particles with an average size of approximately 15 µm. Moreover, the resin matrix includes finely dispersed methacrylic polysiloxane nanoparticles, which share chemical similarities with glass materials and ceramics [5]. According to the manufacturer, Neo Spectra ST was introduced as a rebranded version of Ceram.x Spectra ST, with identical composition and performance characteristics. Neo Spectra™ ST and Ceram.x™ Spectra ST are essentially the same nanohybrid composite material developed by Dentsply Sirona, both utilizing the proprietary SphereTEC® filler technology [6,7].
In the oral cavity, composite restorations endure various cyclic fatigue loads and are exposed to diverse aging conditions throughout their service life. These conditions can lead to matrix or filler degradation, interfacial debonding, or fracturing of filler particles due to mechanical or environmental stresses. Over time, the combined effects of mechanical and environmental aging contribute to the gradual deterioration of the material, crack development, and eventual failure of the restoration. Water aging appears to facilitate the dislodgement of filler particles from the fractured surface, which is caused by the degradation of the silane bond connecting the filler particle to the resin [8].
The bleaching procedure is a widely debated topic in contemporary dentistry due to its simplicity and conservative nature. While it has proven effective in enhancing the color of natural teeth, it has sparked numerous conflicting discussions about its impact on dental restoration materials, particularly composite resins [9]. To assess their effect on the surface of resin composite materials, different approaches, including both qualitative and quantitative techniques, have been employed [10]. Quantitative assessments are typically performed with profilometers, which measure surface roughness assigned using the Ra parameter [11]. SEM is commonly used for qualitative analysis, offering detailed visual insights into surface topography and microscopic defects. SEM images can be further analyzed quantitatively using specialized image processing software [12,13]. Image analysis has gained recognition as a reliable method for material characterization across various material science fields [14]. In dentistry, Van Pham and Vo [12] used ImageJ®1.52, an open-source software, combined with a Field Emission Scanning Electronic Microscope (FE-SEM) to measure the surface roughness of endodontic instruments. Furthermore, Balderrama et al. studied the surface roughness of different implants by analyzing SEM images using ImageJ® software [15].
This study aimed to evaluate the impact of in-office bleaching on the surface roughness of fresh and aged nanohybrid composites, employing two distinct methods, SEM and profilometry, to analyze and compare their results. The integration of image quantification from SEM data represents a significant advancement, providing precise, objective, and detailed evaluations of surface modifications. Recognizing that alterations induced by bleaching agents may have clinical significance, potentially compromising the integrity of restorations and requiring replacement, it becomes imperative to determine whether surface polishing alone can restore the composite to its original condition. Additionally, this study explored the effect of post-bleaching polishing in restoring the initial surface roughness of the composite.
The null hypotheses were as follows: There is no significant difference between profilometry results and SEM-ImageJ® results, bleaching will not change the surface roughness of the fresh and aged nanohybrid composites, and post-bleaching polishing has no effect on the surface roughness.

2. Materials and Methods

This study protocol was reviewed and approved by the Ethics Committee of Saint Joseph University of Beirut under the reference number USJ-2024-120.

2.1. Sample Size Calculation

To determine the sample size, a power analysis for 2 × 2 × 2 ANOVA (fixed effects, special, main effects, and interactions) was conducted using G*Power software 3.1.9.7 for Windows (Heinrich Heine, Universitat Düsseldorf, Düsseldorf, Germany). A power of 0.8, an alpha level of 0.05, 6 groups, and a numerator degree of freedom of 1 were considered, and a large conventional effect size of 0.4 was estimated. The minimum sample size required is 52 specimens in total. However, we selected a total of 60 specimens to enhance the statistical power of our analysis.

2.2. Specimen Preparation

Sixty rectangular samples were fabricated using enamel shade E1 of the nanohybrid composite Neo SpectraTM ST Effects (Dentsply, Konstanz, Germany), whose composition is summarized in Table 1. These samples were prepared by filling a customized plexi mold measuring 8 mm in length, 3 mm in width, and 2 mm in depth. The molds were slightly overfilled with resin material, covered on both sides with a Mylar strip, and compressed between two microscope glass slides to ensure uniformity and remove excess material. Each specimen was polymerized for 20 s using an LED light with a wavelength of 380–515 nm and a light intensity of 2300 mW/cm2 (Eighteeth Medical Curing Pen, Light Cure Unit), as recommended by the manufacturer.
All specimens were finished and polished by a single operator for consistency. Finishing was performed using Enhance® finishing points (Dentsply Caulk, Milford, DE, USA) for 20 s, followed by polishing with Enhance® polishing cups and Prisma® Gloss™ Composite Polishing Paste (Dentsply Caulk, Milford, DE, USA) for another 20 s using a low-speed micro-motor (10K RPM). The specimens were then rinsed with distilled water for 10 s and air-dried for 5 s to remove any remaining debris.
The sixty specimens were evenly distributed into six groups, with 10 specimens assigned to each group. The groups were categorized based on the type of surface treatment applied to the specimens, including bleaching, staining, and repolishing procedures, as follows:
  • Group 1: fresh composite (unstained, unbleached); this was the control group.
  • Group 2: old composite (aged and stained, unbleached).
  • Group 3: bleached fresh composite (unstained, bleached).
  • Group 4: bleached old composite (aged and stained, bleached).
  • Group 5: old repolished composite (aged and stained, unbleached, repolished).
  • Group 6: old repolished bleached composite (aged and stained, bleached, repolished).

2.3. Simulated Staining and Aging Procedures

Following ISO 7491:2000 for dental materials, forty specimens (groups 2, 4, 5, and 6) were aged via thermocycling and light exposure. The specimens were subjected to 20,000 cycles in the SD Mechatronik Thermocycler (SD Mechatronik GmbH, Feldkirchen-Westerham, Germany), alternating between 5 °C and 55 °C water baths with 20 s dwell time and a 10 s rest time. This procedure was conducted to simulate two years of in vivo exposure to the oral environment [16].
Given that the composite restoration may be subjected to a staining agent like coffee for around 15 min daily in vivo (equivalent to consuming 1 or 2 cups per day) [16], these forty specimens (groups 2, 4, 5, and 6) were then exposed to 200 cycles in the SD Mechatronik Thermocycler alternating between a 5 °C water bath and 55 °C coffee bath with 20 s dwell time and a 10 s rest time. Coffee is among the most widely consumed beverages globally [17,18]. In Lebanon, Turkish coffee dominates, accounting for 65% of total coffee consumption, while instant coffee makes up 35% [17]. Therefore, Café Najjar (Beirut, Lebanon) was selected as the staining solution.

2.4. Bleaching Procedure

Thirty specimens (groups 3, 4, and 6) underwent bleaching with 38% HP (fläsh; WHITEsmile, GmbH, Mannheim, Germany) following the manufacturer’s protocol. Two sessions were conducted one week apart, with the agent applied twice for 15 min per session. Specimens were rinsed with distilled water and air-dried with an air spray for one minute between applications.

2.5. Repolishing

After undergoing surface treatments, the specimens in groups 5 and 6 were finally repolished using the same polishing technique initially applied.

2.6. Surface Roughness Measurement

The average surface roughness (Ra) of all the specimens was first measured using a Bruker Dektak XT surface profilometer (Dektak, Bruker, Billerica, MA, USA) equipped with Vision64 software, followed by imaging with a Tescan MIRA3 scanning electron microscope (SEM).
Profiling Procedure:
For the profilometric measurements, the mean Ra value for each sample was reported as a result of three determinations at different regions near the center. The cut-off value was 0.25 mm with a transverse length of 0.2 mm, a stylus speed of 0.02 mm/s, and a stylus tip of 2 µm.
SEM Evaluation:
Following profilometric evaluation, all specimens were gold-coated using a sputter coater (Quorum Q150T ES, Laughton, East Sussex, United Kingdom) and mounted onto SEM stubs. Surface topography was then captured using secondary electron (SE) detector at 8000× magnification and a 5 kV operating voltage (Figure 1, Figure 2 and Figure 3). Morphometric analyses of the digital SEM images were conducted by two blind and calibrated examiners. Three SEM images near the center were taken for each specimen.
The surface roughness was quantified using open-source software, ImageJ® (NIH, Bethesda, MD, USA), using the roughness calculation plugin, which measures roughness parameters according to ISO 21920-2:2021; Geometrical product specifications (GPS)—Surface texture: Profile—Part 2: Terms, definitions and surface texture parameters. International Organization for Standardization: Geneva, Switzerland, 2021.: Ra (arithmetical mean deviation), Rq (root mean square deviation), Rv (lowest valley), Rp (highest peak), and Rt (total height). To relate the Ra value to the image’s pixel dimensions, the Ra value was divided by the distance measured along the diagonal line. This calculation yields the roughness of the surface expressed in micrometers per pixel (μm/pixel). The Ra value for each specimen was calculated as the average of the Ra measurements obtained from three SEM images of the same specimen.
Ra, the arithmetic mean deviation of the surface profile, was chosen as the primary measure of surface roughness due to its widespread use and standardization under ISO 21920-2:2022, forming the basis for statistical analysis in this study [19].

2.7. Statistical Methods

Data were analyzed using IBM SPSS Statistics (Version 26), with a significance level set at 5%. Normality of the Ra distribution was tested using the Kolmogorov–Smirnov and Shapiro–Wilk tests. Pearson correlation analysis was used to examine the relationship between profilometer and SEM measurements. One-way ANOVA was conducted to evaluate differences in mean surface roughness across the treatment groups for each measurement method. To account for the interactions between aging, bleaching, and repolishing, a three-way ANOVA was performed to assess both main effects and interactions. Finally, independent t-tests were used to compare roughness between bleaching conditions.

3. Results

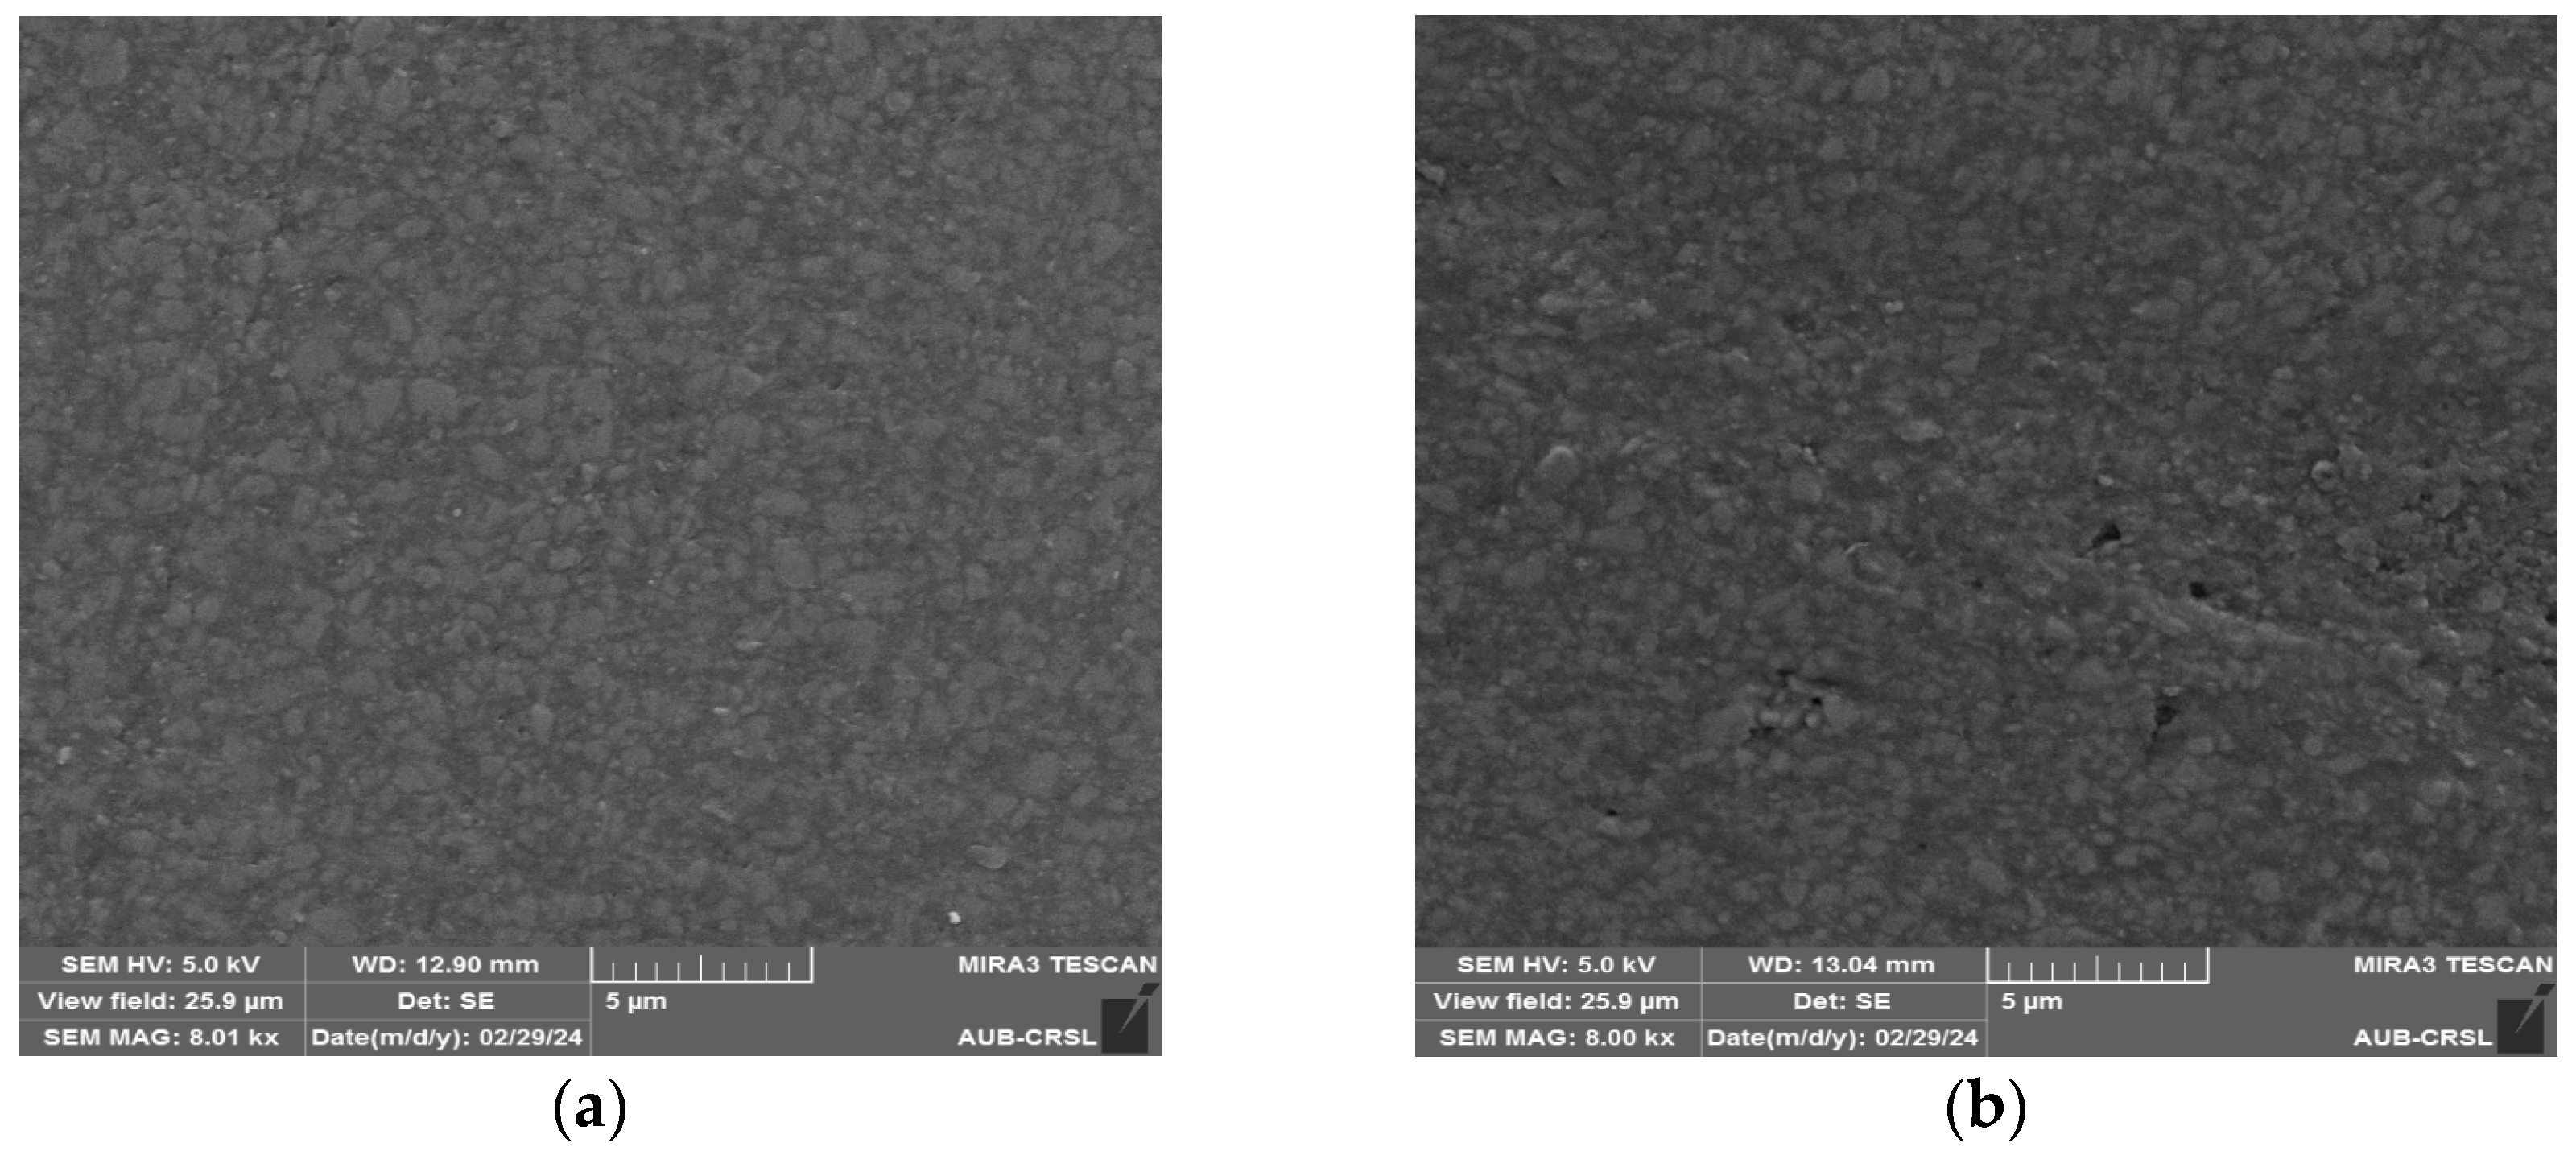
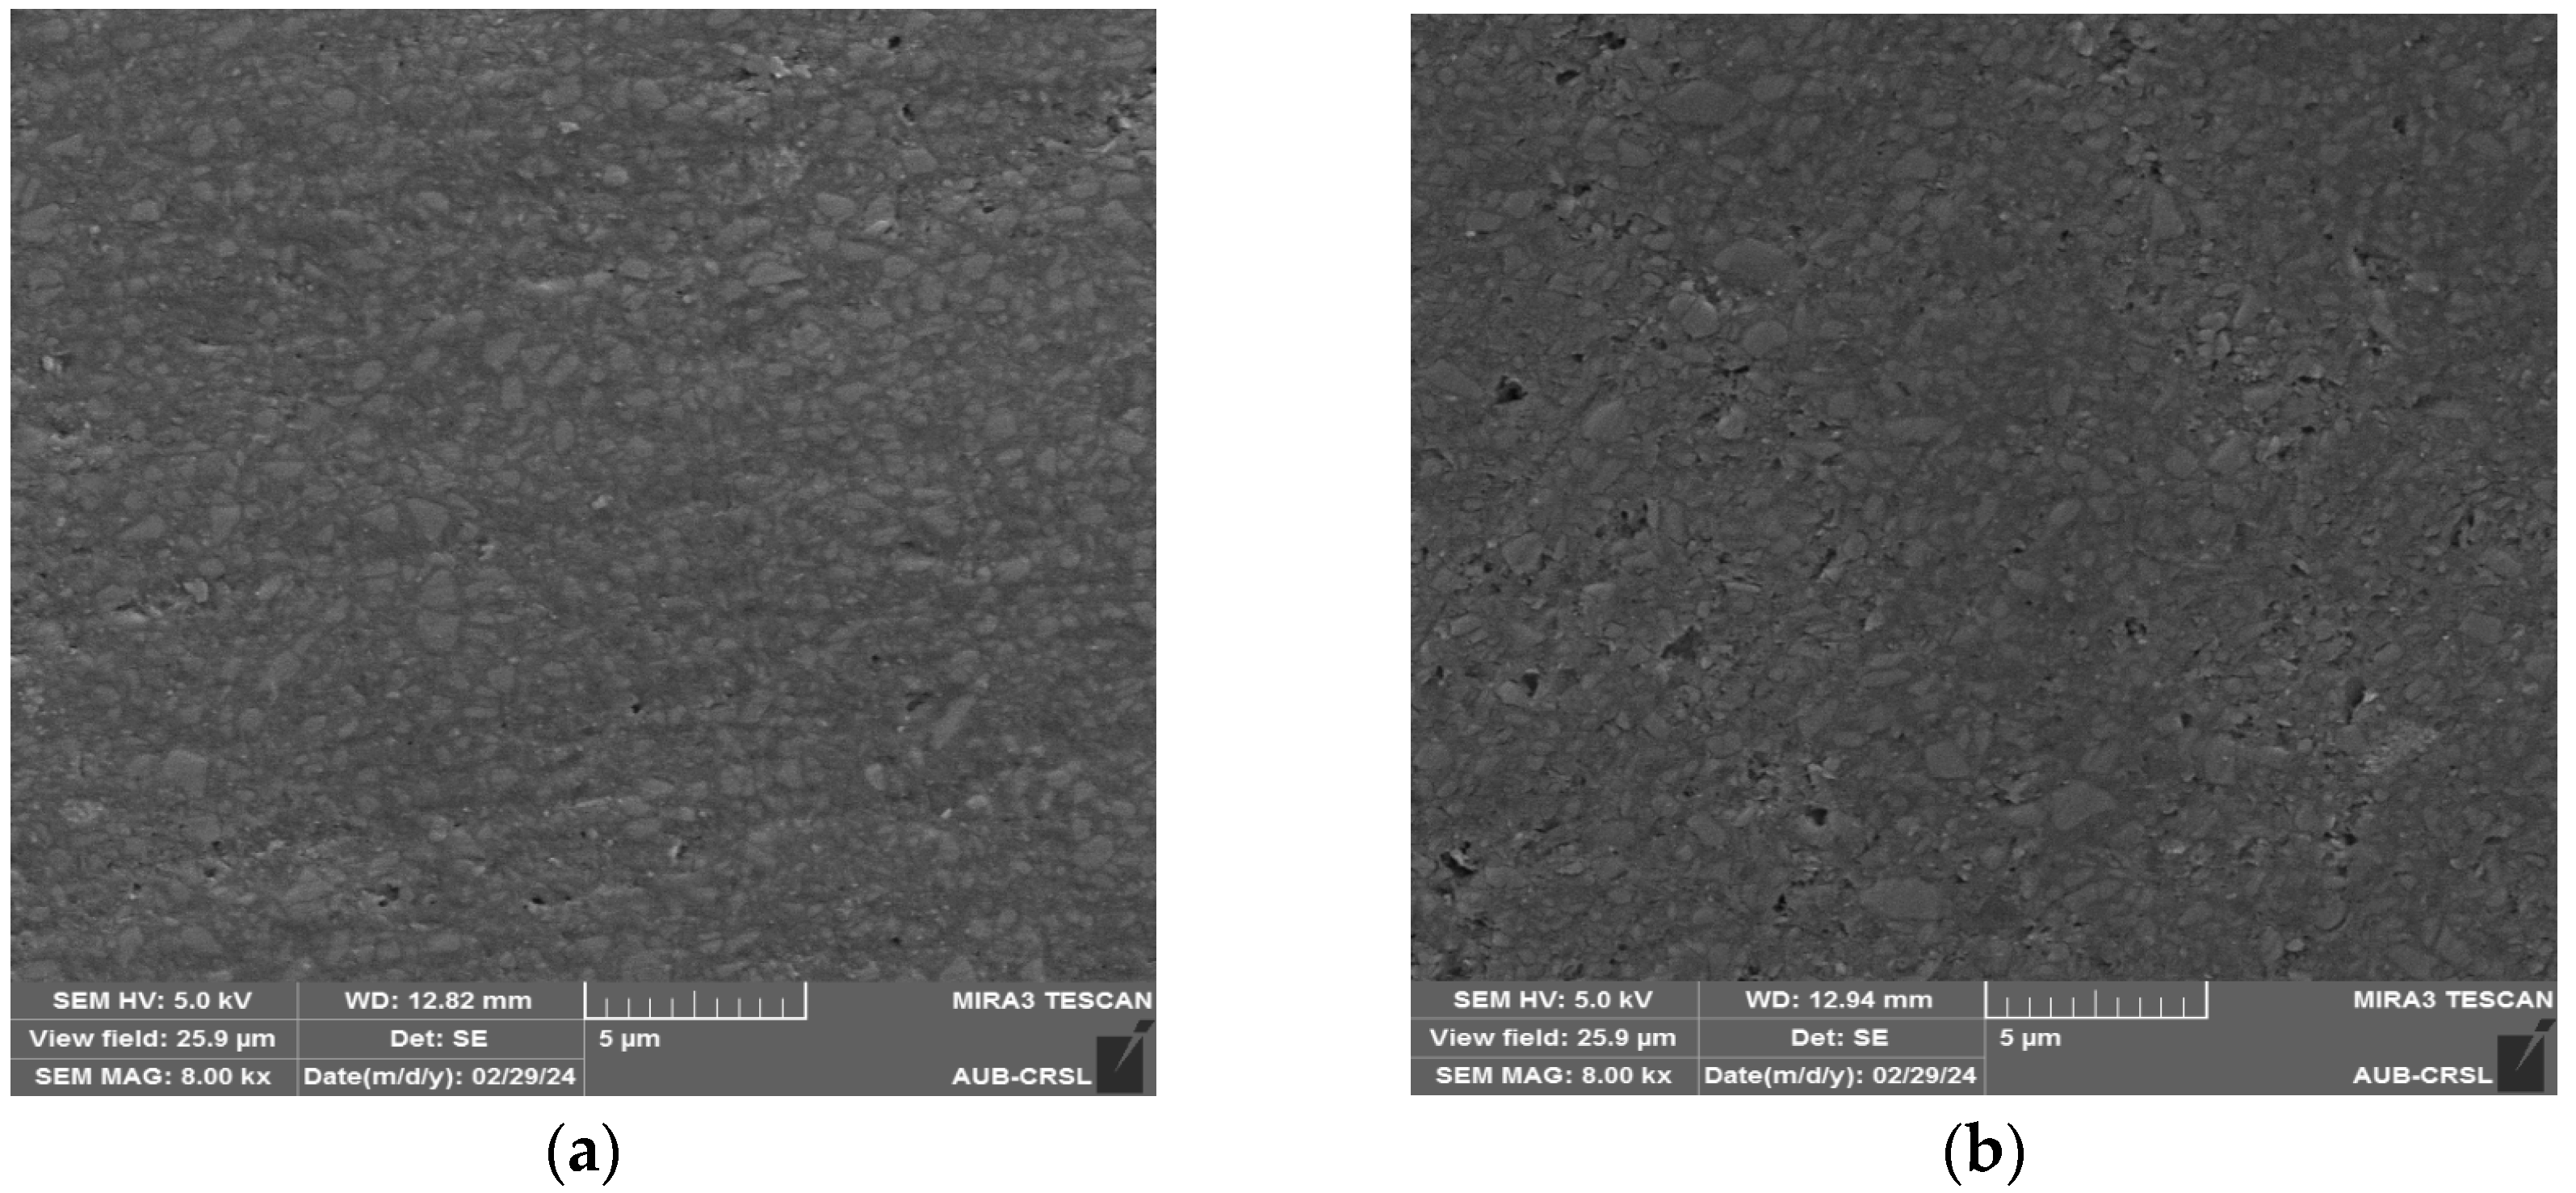
3.1. SEM Observations

Representative SEM images from each group are presented in Figure 1, Figure 2 and Figure 3. When comparing the SEM images of the different groups, the fresh nanohybrid composite (Figure 1a) presented the smoothest surface with no visible exposed filler particles. In contrast, pores and irregular filler particles were found on the surface of the composite after aging (Figure 1b).

3.2. Descriptive Statistics

The descriptive statistics presented in Table 2 and Table 3 were used to evaluate the central tendency, variability, and distribution of surface roughness within each group.

3.3. Comparing Methods of Surface Roughness Measurement

Surface roughness was measured using two methods: the profilometer (in nanometers) and the SEM (in micrometers per pixel) (Figure 1, Figure 2, Figure 3 and Figure 4). These methods measure different aspects of surface texture and use different units. A Pearson correlation analysis showed a moderate correlation of 0.548, which was statistically significant (p < 0.001). This means there is a relationship between the two methods, but it is not very strong.
Because the correlation is moderate, the two methods cannot be directly compared or used interchangeably. To fully understand the surface roughness, it was necessary to analyze the results from each method separately, as each method captures unique details.

3.4. Surface Roughness Comparison Across Treatment Groups: ANOVA Results

Figure 5 presents the distribution of surface roughness in nanometers across the six composite treatment groups. The boxplot clearly shows variations in surface roughness between the groups. Group 1 (fresh composite) demonstrated the lowest median surface roughness (mean = 141.57 nm, SD = 0.29 nm), indicating a smoother surface compared to all other groups. In contrast, group 4 (bleached old composite) exhibited the highest median surface roughness (mean = 254.90 nm, SD = 1.93 nm), suggesting that the combination of aging and bleaching led to a significantly rougher surface than all the other groups. This overall trend highlights the impact of different treatments on the roughness of dental composites.
Similarly, Figure 6 displays surface roughness measured using SEM in micrometers per pixel across the same treatment groups. In this case, group 1 (fresh composite) again showed the lowest surface roughness (mean = 0.0922 µm/pixel, SD = 0.0029 µm/pixel), while group 6 (old bleached repolished composite) exhibited the highest roughness (mean = 22.61 µm/pixel, SD = 0.63 µm/pixel), followed by group 4 (mean = 21.39 µm/pixel, SD = 0.63 µm/pixel). Interestingly, while group 4 had the highest roughness in nanometers, group 6 showed the highest roughness when measured in micrometers per pixel, highlighting the importance of examining results from both measurement methods to gain a complete understanding of surface roughness.

3.5. Three-Way ANOVA Analysis

The three-way ANOVA results for both nanometers and micrometers per pixel revealed that aging, bleaching, and repolishing significantly affect the surface roughness of dental composites. The interactions between these factors were also significant (p-value < 0.001), indicating complex relationships that should be considered when evaluating the surface characteristics of composites after various treatments.

3.6. Independent Samples T-Test Analysis

The table below (Table 4) summarizes the surface roughness measurements from the study, comparing different treatment protocols across composite groups based on the independent t-test.

4. Discussion

To achieve the main goal of this study, the average surface roughness Ra was measured using the profilometer device and SEM-ImageJ® software. Ra is the most commonly used measurement unit in the majority of studies assessing the surface roughness of composite resins [20].
Both the SEM (Figure 1a) and profilometer analyses of the control group, which consisted of a fresh Neo SpectraTM ST Effects composite polished with the Enhance system, revealed the lowest surface roughness at 141.57 nm (0.141 μm), as shown in Figure 4b and Figure 5. These findings are consistent with those of Yaldav et al., who reported a similar profilometric value of 0.1457 μm and comparable SEM images for the fresh Ceram.x composite polished using the Enhance system [21]. However, when studying the effects of bleaching and repolishing, SEM and profilometer yielded different results, thereby rejecting the first hypothesis.
The results of the present study indicate that bleaching fresh and old nanohybrid composites significantly increases surface roughness according to both methods used (Figure 1b, Figure 2 and Figure 3 and Table 4). Thus, this finding rejects the second null hypothesis. The active bleaching agent, HP, often induces oxidation, promoting free radical formation [22,23]. After the dissociation of H2O2 molecules, reactive free radicals can be generated, such as superoxide ions (O2), hydroxyl ions (OH), perhydroxyl ions (HOO), hydroxyl radicals (HO•), and hydroperoxy radicals (HOO•). These species can interact with single and double C–C bonds, as well as ester bonds within the polymer network at the surface of the polymerized composite, potentially leading to the oxidation of these bonds (oxidative ester cleavage) and promoting hydrolytic degradation at the resin–filler interface. The oxidation of chemical bonds in the composite leads to its degradation and softening. This process may create cracks in the matrix, facilitating the release of unreacted monomers from the material. Furthermore, the oxidative stress at the resin–filler interface disrupts the silane coupling agent, which is responsible for anchoring filler particles to the organic matrix. This disruption contributes to filler–matrix debonding, matrix erosion, and the formation of microscopic surface defects, all of which collectively contribute to a significant increase in surface roughness and deterioration of the material’s physical properties [24].
Several studies have shown that bleaching agents increase the surface roughness of composite materials. Popescu et al. found that 40% HP caused the greatest roughness, particularly in microhybrid composites, which were rougher than nanohybrid composites [19]. Similarly, Wongpraparatana et al. noted that both 10% CP and 40% HP significantly increased surface roughness in composite materials and resin-modified glass ionomer cement [25]. In contrast, a study by Chakraborty et al. did not show any significant difference in the surface roughness of the nanohybrid composite (Ceram.x ® SphereTEC™ one) after bleaching with 35% HP [26]. This difference can be attributed to several reasons. Firstly, the profilometer was used to assess the surface roughness; however, specific details regarding the size of the stylus tip were not provided. Secondly, the composite samples were tested in their fresh state, without any prior aging or staining processes.
To mitigate the increase in surface roughness, some authors suggested repolishing the composite material after the bleaching process [19,27,28,29]. The findings of the present study collectively suggest that the effectiveness of repolishing may vary depending on the method of surface roughness measurement. Repolishing the composite material after it has been subjected to bleaching, aging, and staining can significantly reduce surface roughness, as shown by profilometer measurements. However, this process does not completely return the composite to the original smoothness of its fresh, untouched state. Polishing after bleaching can remove the residual monomers released by bleaching, which positively affects the physical properties of the composite material [30]. However, the SEM data (Figure 3a,b) indicated that repolishing might not fully mitigate the surface roughness induced by bleaching, especially when considering the broader surface texture.
The stylus profilometer, utilized in this study, characterizes surface features at a scale corresponding to the size of the stylus. The profilometer, with its 2 μm diamond stylus, is less precise compared to the SEM. Due to its larger size, the profilometer cannot access certain micro-irregularities and fails to capture surface features smaller than the stylus, potentially leading to an underestimation of surface roughness [11,31].
A profilometer is designed to measure surface roughness by physically tracing the surface with a stylus. The stylus tip’s size determines the smallest feature that can be detected; in our case, a 2-micron tip would mean that the profilometer can detect surface features down to around 2 microns in size or larger. This is significantly less sensitive than SEM, which is why it operates effectively at the micron scale but cannot resolve nanoscale features [31,32].
SEM is capable of detecting surface features at the nanoscale due to its high resolution [33]. This is because SEM uses a focused beam of electrons to scan the surface of a sample, providing very detailed images that can reveal fine surface details, such as microcracks, nanostructures, or very small surface textures [34]. Scratches observed on the surface can be mostly attributed to the grinding effect of the dislodged fillers [11,35].
The difference in Ra values between the two methods may also be attributed to the fact that the measurement of surface parameters is influenced by the size of the area under examination. Additionally, while the profilometer measures line roughness in either horizontal or vertical directions, SEM assesses area roughness across the entire surface [11]. Both methods provide valuable but different insights into the effects of bleaching and repolishing on composite surfaces.
The SEM results showed that repolishing after bleaching increased the surface roughness. Repolishing a bleached composite may initially be intended to smooth the surface, but if the bleaching process has already caused significant deterioration, additional polishing can exacerbate surface roughness. The polishing process can create new scratches or reveal subsurface defects that were hidden before bleaching (Figure 4a). The SEM images may show more scratches and grinding marks after repolishing because the combination of bleaching-induced degradation and mechanical abrasion from polishing tools can make the surface appear rougher and less uniform. Pala et al. conducted a study to evaluate the surface roughness of resin composites following various finishing and polishing techniques. Their findings indicated that the most noticeable scratches and irregularities (deep pits and undulating surfaces) were present on composites treated with the Enhance system [36].
When interpreting the results of the present study, it is important to acknowledge its limitations. This study was conducted in vitro, limiting its representation of real-world clinical conditions, particularly factors like saliva’s role in moderating bleaching effects [37,38]. While the findings provide valuable insights into material aging and degradation, further research is needed to explore the influence of varying HP concentrations on the surface roughness, particularly considering the guidelines of the European Scientific Committee on Consumer Safety (SCCS) limiting HP levels in dental whitening products to a maximum of 6% [35]. Additionally, studies should focus on newer materials, nanocomposites, and different polishing techniques. Integrating SEM imaging with profilometric analysis to determine the surface roughness threshold for bacterial adhesion could also provide a more comprehensive understanding of the interplay between surface characteristics and material performance.

5. Conclusions

Bleaching with 38% HP increased the surface roughness of both freshly treated and aged nanohybrid composites measured using a profilometer and SEM.
From a clinical perspective, while repolishing may reduce surface roughness at a finer scale (as measured in nanometers), it does not effectively smooth the broader surface texture, particularly when observed with SEM. This limitation underscores the potential need to replace restorations to maintain both aesthetic and functional outcomes. These findings emphasize the importance of monitoring restorative materials post-bleaching and considering replacement to ensure optimal clinical results and patient satisfaction.
SEM and profilometry are both recognized techniques for evaluating surface roughness in materials, but their combined use is not universally standard practice in all studies. While they offer complementary advantages—SEM providing detailed topography at the microscopic level and profilometry offering quantitative roughness data—many studies typically use one or the other depending on the research goals. Therefore, it might be better to use these techniques together to obtain a more comprehensive understanding of surface characteristics, especially in studies focusing on material properties at different scales.

Author Contributions

Conceptualization, D.A.S., C.M.Z. and G.K.; methodology, D.A.S. and C.M.Z.; software, M.A., R.S. and D.A.S.; validation, C.M.Z. and D.A.S.; formal analysis, D.A.S., M.A. and C.M.Z.; investigation, R.S., D.A.S. and M.A.; resources, C.M.Z.; data curation, D.A.S. and M.A.; writing—original draft preparation, D.A.S.; writing—review and editing, N.K. and C.M.Z.; visualization, D.A.S.; supervision, C.M.Z. and D.A.S.; project administration, D.A.S. and C.M.Z.; funding acquisition, D.A.S. All authors have read and agreed to the published version of the manuscript.

Funding

This research received no external funding.

Data Availability Statement

The raw data supporting the conclusions of this article will be made available by the authors on request.

Acknowledgments

The authors are grateful to Dentsply Sirona and WhiteSmile for their help in providing materials for this research. Sincere gratitude is also extended to the Kamal A. Shair Central Research Science Laboratory (CRSL) at the American University of Beirut for facilitating the profilometry and SEM analyses. The thermocycling work was carried out at the Biomaterials unit at the Cranio-Facial Research Laboratory at the Faculty of Dental Medicine at Saint Joseph University of Beirut, Lebanon. All authors approved and validated the study.

Conflicts of Interest

The authors declare no conflicts of interest.

References

  1. Newton, J.T.; Subramanian, S.S.; Westland, S.; Gupta, A.K.; Luo, W.; Joiner, A. The impact of tooth colour on the perceptions of age and social judgements. J. Dent. 2021, 112, 103771. [Google Scholar] [CrossRef] [PubMed]
  2. Kamel, C.; Nachabe, N.; El Osta, N.; Zogheib, C.M. Evaluation of dental parameters perception by Lebanese prosthodontists, orthodontists and aesthetic doctors. Int. Arab J. Dent. 2020, 11, 67–74. [Google Scholar] [CrossRef]
  3. Kwon, S.R.; Wertz, P.W. Review of the mechanism of tooth whitening. J. Esthet. Restor. Dent. 2015, 27, 240–257. [Google Scholar] [CrossRef]
  4. Hussain, S.K.; Al-Abbasi, S.W.; Refaat, M.M.; Hussain, A.M. The effect of staining and bleaching on the color of two different types of composite restoration. J. Clin. Exp. Dent. 2021, 13, e1233–e1238. [Google Scholar] [CrossRef] [PubMed]
  5. Preethy, N.A.; Jeevanandan, G.; Govindaraju, L.; Subramanian, E.M.G. Comparison of Shear Bond Strength of Three Commercially Available Esthetic Restorative Composite Materials: An In Vitro Study. Int. J. Clin. Pediatr. Dent. 2020, 13, 635–639. [Google Scholar]
  6. Karademir, S.A.; Atasoy, S.; Yılmaz, B. Effect of bleaching and repolishing on whiteness change and staining susceptibility of resin-based materials. BMC Oral Health 2024, 24, 1507. [Google Scholar] [CrossRef]
  7. Angerame, D.; Fanfoni, L.; De Biasi, M.; Bevilacqua, L.; Generali, L. Influence of Thickness and Shade on the Color of Layered Novel Nanohybrid Composite Systems. Int. J. Periodontics Restor. Dent. 2021, 41, 449. [Google Scholar] [CrossRef]
  8. Oja, J.; Lassila, L.; Vallittu, P.K.; Garoushi, S. Effect of Accelerated Aging on Some Mechanical Properties and Wear of Different Commercial Dental Resin Composites. Materials 2021, 14, 2769. [Google Scholar] [CrossRef]
  9. Kaya, S.; Bektaş, Ö. Effect of in-office bleaching on the surface roughness of different composite resins. Cumhur. Dent. J. 2022, 25, 78–82. [Google Scholar] [CrossRef]
  10. Devlukia, S.; Hammond, L.; Malik, K. Is surface roughness of direct resin composite restorations material and polisher-dependent? A systematic review. J. Esthet. Restor. Dent. 2023, 35, 947–967. [Google Scholar] [CrossRef]
  11. Kakaboura, A.; Fragouli, M.; Rahiotis, C.; Silikas, N. Evaluation of surface characteristics of dental composites using profilometry, scanning electron, atomic force microscopy and gloss-meter. J. Mater. Sci. Mater. Med. 2007, 18, 155–163. [Google Scholar] [CrossRef] [PubMed]
  12. Van Pham, K.; Vo, C.Q. A new method for assessment of nickel-titanium endodontic instrument surface roughness using field emission scanning electronic microscope. BMC Oral Health 2020, 20, 240. [Google Scholar] [CrossRef]
  13. Liu, J.; Bai, X.; Elsworth, D. Evolution of pore systems in low-maturity oil shales during thermal upgrading—Quantified by dynamic SEM and machine learning. Pet. Sci. 2024, 21, 1739–1750. [Google Scholar] [CrossRef]
  14. AlMarzooqi, F.A.; Bilad, M.R.; Mansoor, B.; Arafat, H.A. A comparative study of image analysis and porometry techniques for characterization of porous membranes. J. Mater. Sci. 2016, 51, 2017–2032. [Google Scholar] [CrossRef]
  15. de Fátima Balderrama, Í.; de Toledo Stuani, V.; Cardoso, M.V.; Oliveira, R.C.; Lopes, M.M.; Greghi, S.L. The influence of implant surface roughness on decontamination by antimicrobial photodynamic therapy and chemical agents: A preliminary study in vitro. Photodiagn. Photodyn. Ther. 2021, 33, 102105. [Google Scholar] [CrossRef] [PubMed]
  16. Khazaal, G.; Daou, M.; Mahdi, S.S.; Ahmed, Z.; Maalouf, E.; Batteni, G.; Qasim, S.S.; Kassis, C.; Agha, D.; Haddad, H.; et al. In vitro evaluation of the color stability and surface roughness of a new composite flow. J. Clin. Exp. Dent. 2023, 15, e43–e50. [Google Scholar] [CrossRef]
  17. Sayegh, S.M.; Daou, M.; Najjar, G.; Zebouni, E. In vitro comparison of the color degradation of two computer-aided design/computer-aided manufacturing provisional materials: A 12-month simulation. J. Indian Prosthodont. Soc. 2023, 23, 38–44. [Google Scholar] [CrossRef]
  18. Mark, D.A.; Hallage, P.H.; Zebouni, E. In vitro evaluation of color changes of two different layering ceramics after thermocycling in coffee. Int. Arab J. Dent. (IAJD) 2021, 12, 73–80. [Google Scholar]
  19. Popescu, A.D.; Tuculina, M.J.; Diaconu, O.A.; Gheorghiță, L.M.; Nicolicescu, C.; Cumpătă, C.N.; Petcu, C.; Abdul-Razzak, J.; Rîcă, A.M.; Voinea-Georgescu, R. Effects of Dental Bleaching Agents on the Surface Roughness of Dental Restoration Materials. Medicina 2023, 59, 1067. [Google Scholar] [CrossRef]
  20. Jaramillo-Cartagena, R.; López-Galeano, E.J.; Latorre-Correa, F.; Agudelo-Suárez, A.A. Effect of polishing systems on the surface roughness of nano-hybrid and nano-filling composite resins: A systematic review. Dent. J. 2021, 9, 95. [Google Scholar] [CrossRef]
  21. Yadav, R.D.; Raisingani, D.; Jindal, D.; Mathur, R. A Comparative Analysis of Different Finishing and Polishing Devices on Nanofilled, Microfilled, and Hybrid Composite: A Scanning Electron Microscopy and Profilometric Study. Int. J. Clin. Pediatr. Dent. 2016, 9, 201–208. [Google Scholar] [CrossRef]
  22. Durner, J.; Stojanovic, M.; Urcan, E.; Spahl, W.; Haertel, U.; Hickel, R.; Reichl, F.X. Effect of hydrogen peroxide on the three-dimensional polymer network in composites. Dent. Mater. 2011, 27, 573–580. [Google Scholar] [CrossRef]
  23. Abe, A.T.; Youssef, M.N.; Turbino, M.L. Effect of bleaching agents on the nanohardness of tooth enamel, composite resin, and the tooth-restoration interface. Oper. Dent. 2016, 41, 44–52. [Google Scholar] [CrossRef] [PubMed]
  24. Chen, S.; Zhu, J.; Yu, M.; Jin, C.; Huang, C. Effect of aging and bleaching on the color stability and surface roughness of a recently introduced single-shade composite resin. J. Dent. 2024, 143, 104917. [Google Scholar] [CrossRef] [PubMed]
  25. Wongpraparatana, I.; Matangkasombut, O.; Thanyasrisung, P.; Panich, M. Effect of Vital Tooth Bleaching on Surface Roughness and Streptococcal Biofilm Formation on Direct Tooth-Colored Restorative Materials. Oper. Dent. 2018, 43, 51–59. [Google Scholar] [CrossRef] [PubMed]
  26. Chakraborty, A.; Purayil, T.; Ginjupalli, K.; Pentapati, K.C.; Shenoy, N. Effect of in-office bleaching agent on the surface roughness and microhardness of nanofilled and nanohybrid composite resins. F1000Research 2023, 12, 129. [Google Scholar] [CrossRef] [PubMed]
  27. Aydın, N.; Topçu, F.T.; Karaoğlanoğlu, S.; Oktay, E.A.; Erdemir, U. Effect of finishing and polishing systems on the surface roughness and color change of composite resins. J. Clin. Exp. Dent. 2021, 13, e446–e454. [Google Scholar] [CrossRef]
  28. Bansal, K.; Gupta, S.; Nikhil, V.; Jaiswal, S.; Jain, A.; Aggarwal, N. Effect of Different Finishing and Polishing Systems on the Surface Roughness of Resin Composite and Enamel: An In vitro Profilometric and Scanning Electron Microscopy Study. Int. J. Appl. Basic. Med. Res. 2019, 9, 154–158. [Google Scholar] [CrossRef]
  29. Madhyastha, P.S.; Hegde, S.; Srikant, N.; Kotian, R.; Iyer, S.S. Effect of finishing/polishing techniques and time on surface roughness of esthetic restorative materials. Dent. Res. J. 2017, 14, 326–330. [Google Scholar]
  30. Tuysuz, O.K.; Gurses, M. Changes in physical properties of universal composites and CAD/CAM materials after bleaching and antioxidant applications: Scanning electron microscope and atomic force microscope evaluation. Microsc. Res. Tech. 2024, 87, 977–990. [Google Scholar] [CrossRef]
  31. El-Rashidy, A.A.; Shaalan, O.; Abdelraouf, R.M.; Habib, N.A. Effect of immersion and thermocycling in different beverages on the surface roughness of single- and multi-shade resin composites. BMC Oral Health 2023, 23, 367. [Google Scholar] [CrossRef]
  32. Barac, R.; Gasic, J.; Trutic, N.; Sunaric, S.; Popovic, J.; Djekic, P.; Radenkovic, G.; Mitic, A. Erosive Effect of Different Soft Drinks on Enamel Surface in vitro: Application of Stylus Profilometry. Med. Princ. Pract. 2015, 24, 451–457. [Google Scholar] [CrossRef] [PubMed]
  33. Kim, K.W. High-resolution imaging of the microbial cell surface. J. Microbiol. 2016, 54, 703–708. [Google Scholar] [CrossRef] [PubMed]
  34. Nguyen, J.N.; Harbison, A.M. Scanning electron microscopy sample preparation and imaging. In Molecular Profiling: Methods and Protocols; Humana Press: New York, NY, USA, 2017; pp. 71–84. [Google Scholar]
  35. Zhang, L.; Yu, P.; Wang, X.Y. Surface roughness and gloss of polished nanofilled and nanohybrid resin composites. J. Dent. Sci. 2021, 16, 1198–1203. [Google Scholar] [CrossRef] [PubMed]
  36. Pala, K.; Tekce, N.; Tuncer, S.; Serim, M.E.; Demirci, M. Evaluation of the surface hardness, roughness, gloss and color of composites after different finishing/polishing treatments and thermocycling using a multitechnique approach. Dent. Mater. J. 2016, 35, 278–289. [Google Scholar] [CrossRef]
  37. Alrabeah, G.; Shabib, S.; Almomen, R.; Alhedeithi, N.; Alotaibi, S.; Habib, S.R. Effect of Home Bleaching on the Optical Properties and Surface Roughness of Novel Aesthetic Dental Ceramics. Coatings 2023, 13, 330. [Google Scholar] [CrossRef]
  38. Farooq, I.; Bugshan, A. The role of salivary contents and modern technologies in the remineralization of dental enamel: A narrative review. F1000Research 2021, 9, 171. [Google Scholar] [CrossRef]
Figure 1. (a) SEM image from a sample taken from group 1; (b) SEM image from a sample taken from group 2 (magnification: 8000; scale: 5 µm).
Jcs 09 00313 g001
Figure 2. (a) SEM image from a sample taken from group 3; (b) SEM image from a sample taken from group 4 (magnification: 8000; scale: 5 µm).
Jcs 09 00313 g002
Figure 3. (a) SEM image from a sample taken from group 5; (b) SEM image from a sample taken from group 6 (magnification: 8000; scale: 5 µm).
Jcs 09 00313 g003
Figure 4. (a) A crack running diagonally across the surface of a specimen from group 6 (magnification: 5; scale: 10 µm); (b) SEM image from a sample taken from group 1 with high contrast (magnification: 4000; scale: 10 µm).
Jcs 09 00313 g004
Figure 5. Boxplots showing the surface roughness in nanometers across composite treatment groups (measured using a profilometer).
Jcs 09 00313 g005
Figure 6. Boxplots showing the surface roughness in micrometers per pixel across composite treatment groups (measured using image analysis/SEM).
Jcs 09 00313 g006
Table 1. Composition of the composite resin used in this study.
MaterialTypeCompositionFiller Content (w/w)
Neo SpectraTM ST Effects E1
(Dentsply, Konstanz, Germany)
Nano-hybridMatrix: Methacrylate modified polysiloxane dimethacrylates,
ethyl-4 (dimethylamino) benzoate, and bis(4-methyl-phenyl) iodonium hexafluorophosphate.
Weight: 78–80 wt.%
Volume: 60–62 vol.%
Filler:
Barium glass, Ytterbium fluoride,
Inorganic fillers (0.1–3.0 μm), SphereTEC® fillers (d3, 50 ≈ 15 μm)
Table 2. Surface roughness summary in nanometers (profilometry).
GroupNMeanStd. ErrorStd. DeviationVariance
110141.570.090.290.09
210222.721.584.9824.81
310212.401.223.8714.98
410254.900.611.933.73
510167.331.645.1826.80
610159.812.186.9147.70
Table 3. Surface roughness summary in micrometers per pixel (SEM).
GroupNMeanStd. ErrorStd. DeviationVariance
1100.090.000.000.00
21019.591.580.940.89
31019.631.220.890.79
41021.390.610.630.40
51019.751.640.540.29
61022.612.180.430.19
Table 4. Comparison across the groups.
Surface Roughness (Nanometers)Surface Roughness (Micrometers per Pixel)
Group ComparisonMean ± Standard Deviationp-ValueMean ± Standard Deviationp-Value
Group 1 vs. Group 2−81.16 (141.57 ± 0.29 vs. 222.72 ± 4.98)<0.001−19.50 (0.09 ± 0.003 vs. 19.59 ± 0.94)<0.001
Group 1 vs. Group 3−70.83 (141.57 ± 0.29 vs. 212.40 ± 3.87)<0.001−19.53 (0.09 ± 0.003 vs. 19.63 ± 0.89)<0.001
Group 1 vs. Group 4−113.34 (141.57 ± 0.29 vs. 254.90 ± 1.93)<0.001−21.30 (0.09 ± 0.003 vs. 21.39 ± 0.63)<0.001
Group 1 vs. Group 5−25.76 (141.57 ± 0.29 vs. 167.33 ± 5.18)<0.001−19.65 (0.09 ± 0.003 vs. 19.75 ± 0.54)<0.001
Group 1 vs. Group 6−18.24 (141.57 ± 0.29 vs. 159.81 ± 6.91)<0.001−22.52 (0.09 ± 0.003 vs. 22.61 ± 0.43)<0.001
Group 2 vs. Group 310.32 (222.72 ± 4.98 vs. 212.40 ± 3.87)<0.001−0.03 (19.59 ± 0.94 vs. 19.63 ± 0.89)0.939 *
Group 2 vs. Group 4−32.18 (222.72 ± 4.98 vs. 254.90 ± 1.93)<0.001−1.79 (19.59 ± 0.94 vs. 21.39 ± 0.63)<0.001
Group 2 vs. Group 555.39 (222.72 ± 4.98 vs. 167.33 ± 5.18)<0.001−0.15 (19.59 ± 0.94 vs. 19.75 ± 0.54)0.67 *
Group 2 vs. Group 662.91 (222.72 ± 4.98 vs. 159.81 ± 6.91)<0.001−3.02 (19.59 ± 0.94 vs. 22.61 ± 0.43)<0.001 *
Group 3 vs. Group 4−42.50 (212.40 ± 3.87 vs. 254.90 ± 1.93)<0.001−1.76 (19.63 ± 0.89 vs. 21.39 ± 0.63)<0.001
Group 3 vs. Group 545.07 (212.40 ± 3.87 vs. 167.33 ± 5.18)<0.001−0.12 (19.63 ± 0.89 vs. 19.75 ± 0.54)0.722 *
Group 3 vs. Group 652.59 (212.40 ± 3.87 vs. 159.81 ± 6.91)<0.0012.99 (19.63 ± 0.89 vs. 22.61 ± 0.43)<0.001 *
Group 4 vs. Group 587.57 (254.90 ± 1.93 vs. 167.33 ± 5.18)<0.0011.64 (21.39 ± 0.63 vs. 19.75 ± 0.54)<0.001
Group 4 vs. Group 695.09 (254.90 ± 1.93 vs. 159.81 ± 6.91)<0.001−1.22 (21.39 ± 0.63 vs. 22.61 ± 0.43)<0.001 *
Group 5 vs. Group 67.52 (167.33 ± 5.18 vs. 159.81 ± 6.91)0.013−2.87 (19.75 ± 0.54 vs. 22.61 ± 0.43)<0.001 *
* indicate differences between the two measurement methods.
Disclaimer/Publisher’s Note: The statements, opinions and data contained in all publications are solely those of the individual author(s) and contributor(s) and not of MDPI and/or the editor(s). MDPI and/or the editor(s) disclaim responsibility for any injury to people or property resulting from any ideas, methods, instructions or products referred to in the content.

