Article

Parametric Optimization of Dry Sliding Wear Attributes for AlMg1SiCu Hybrid MMCs: A Comparative Study of GRA and Entropy-VIKOR Methods

by
Krishna Prafulla Badi
1,*,
Srinivasa Rao Putti
2,
Maheswara Rao Chapa
2 and
Muralimohan Cheepu
3,*
1
Department of Mechanical Engineering, Anil Neerukonda Institute of Technology & Sciences, Sangivalasa, Visakhapatnam 531162, AP, India
2
Department of Mechanical Engineering, Andhra University, Visakhapatnam 530003, AP, India
3
Department of Materials System Engineering, Pukyong National University, Busan 48547, Republic of Korea
*
Authors to whom correspondence should be addressed.
J. Compos. Sci. 2025, 9(6), 297; https://doi.org/10.3390/jcs9060297
Submission received: 2 May 2025 / Revised: 30 May 2025 / Accepted: 4 June 2025 / Published: 10 June 2025
(This article belongs to the Special Issue Recent Progress in Hybrid Composites)

Abstract

:
In recent days, aluminum-based hybrid composites have garnered more interest than monolithic alloys owing to their remarkable properties, encompassing a high strength-to-weight ratio, excellent corrosion resistance, and impressive wear durability. The present study attempts to optimize the multiple wear attribute characteristics of Al6061/SiC/Al2O3 hybrid composites using grey and entropy-based VIKOR techniques. The composites were produced by adding equal proportions of SiC/Al2O3 (0–12 wt.%) ceramics through the stir-casting process, using an ultrasonication setup. Dry sliding wear experiments were executed with tribometer variants, namely reinforcement content (wt.%), load (N), sliding velocity (v), and sliding distance (SD), following L27 OA. The optimal combination of process variables for achieving high GRG values from grey analysis was found to be A3-B3-C3-D3. The S/N ratios and ANOVA results for GRG indicated that RF content (wt.%) is the predominant component determining multiple outcomes, followed by sliding distance, load, and sliding velocity. The multi-order regression model formulated for the VIKOR index (Qi) displayed high significance and more accuracy, with a variance of 0.0216 and a coefficient of determination (R2), and adjusted R2 values of 99.60% and 99.14%. Subsequent morphological studies indicated that plowing, abrasion, and adhesion mechanisms are the dominant modes of wear.

1. Introduction

The Al 6xxx series alloys, known for their aluminum–magnesium–silicon composition, are recognized for their exceptional structural properties, corrosion resistance, and excellent machinability [1,2]. Among these alloys, Al6061 is a versatile high-performance matrix material suitable for composite applications. Its outstanding strength-to-weight ratio, ease of fabrication, and heat resistance make it a favored option in numerous applications, such as in aircraft wings, fuselage, brake systems, heat sinks, wind turbine components, boat hulls, and masts [3,4]. To enhance the inherent properties of Al matrix materials, reinforcement, such as the addition of SiC, Al2O3, TiB2, and ZrB2, significantly boosts the wear resistance, hardness, and thermal conductivity, thereby expanding the material’s applicability in demanding mechanical and thermal conditions [5,6]. However, these composites present challenges such as complex manufacturing, difficult machinability due to hard reinforcements, and recycling issues, which can limit their broader adoption despite their superior mechanical properties. Many researchers have opted for the conventional stir-casting method, which is known for its simplicity, lower cost, and high productivity [7,8].
Al-SiC composites are widely used in automotive components, such as brake rotors and engine blocks, aerospace structures, and electronics heat sinks, due to their high strength, wear resistance, and excellent thermal conductivity. Junwen Zhu et al. [9] researched enhancements in the mechanical traits of Al6082 resulting from the addition of SiC reinforcements through the mixing of squeeze and stir-casting methods. The results indicate that SiC nanoparticles (SiCnp) were uniformly dispersed within the 6082–aluminum matrix alloy through the stir-casting process. The incorporation of SiCnp significantly refined the microstructure of the aluminum alloy. Mulugundam Siva Surya and G Prasanthi [10] utilized powder metallurgy to prepare functionally graded Al7075/SiC composites, examining how reinforcement weight percentage and layer numbers affect microstructural and structural characteristics. Al-Al2O3 composites are preferred for brake discs, high-temperature engine parts, electrical insulators, ballistic armor, and heat exchangers, benefiting from their superior wear resistance, high temperature stability, and oxidation resistance. S. Sakthivelu et al. [11] accomplished experimental research on the dry sliding friction attributes of Al-Al2O3 composites created via the stir-casting process. The optimal process parameters for achieving the lowest wear rate and coefficient of friction (COF) were determined using grey relational analysis (GRA). R. Manikandan and T.V. Arjunan [12] focused on the fabrication, mechanical characteristics, and tribological behavior of Al7075–CDA–B4C hybrid composites processed through a multi-stage stir-casting technique. N. Durga Vithal et al. [13] focused on the implication of zirconium diboride (ZrB2) ceramics in AA7075 on its microstructure, mechanical features, and modes of failures, utilizing the stir-casting process. Dipankar Dey et al. [14] explored how the silicon carbide content influences the mechanical and frictional attributes of Al2024–SiC alloys produced in the stir-casting method. SiC-reinforced composites demonstrated improved wear resistance and mechanical properties over the matrix alloy, with a shift from adhesive to abrasive wear mechanisms. These enhancements make them promising candidates for applications such as gears, drive shafts, brake drums, and bearings. R. Jojith and N. Radhika [15] investigated the structural and friction properties of thermally treated Al-7 Si-0.3 Mg-10 wt.% B4C composites produced through centrifugal casting. The major challenges in the above manufacturing processes include the non-uniform dispersion of reinforcements, gas porosity, and processing defects, which can lead to poor mechanical properties and must be addressed.
Gowrishankar et al. [16] studied the outcome of adding Gr/TiC ceramics on the mechanical and friction performance of Al6061 hybrid materials. Improvements in both mechanical and wear properties were observed with an increase in the reinforcement content. E. Jayakumar et al. [17] researched the abrasion and friction performance traits of A319/SiCp AMMCs that were centrifugally cast. J. David Raja Selvam et al. [18] examined the unlubricated friction nature of in situ fabricated AA6061–TiC ceramic composites under varying load conditions. They observed wear mechanisms such as plowing and adhesion under lower loads, while delamination occurred at higher loads. Prasada Reddy et al. [19] studied the dual body friction behaviors of AA 6061-2SiC-2Gr HMMCs produced by employing the stir-casting method with ultrasonic attachment. The reduction in wear rate is observed in hybrid composites over the monolithic alloy and the Al6061–SiC composite. Shalok Bharti et al. [20] conducted tribometer tests to analyze the friction properties of AA2014–Al2O3 surface composites prepared through the friction stir process. Jatinder Kumar et al. [21] looked into the mechanical, wear, structural, and processability features of stir-cast Al-Si-SiC-Mo HMMCs. Wear resistance was improved with the addition of SiC contents. Prasada Reddy et al. [22] explored how the Gr content affects the frictional properties of Al 6061/2SiC/xGr hybrid nano metallic composite materials produced via the stir-casting method assisted with ultrasonication. Their research indicated that including the Gr reinforcements leads to minimizing the size of wear debris in the Al/2SiC nanocomposite. A. Aherwar et al. [23] evaluated the dry sliding wear characteristics of Al6061/TiB2/CDA hybrid composites using machine learning methods. The SEM results revealed that adhesion, abrasion, oxidation, and delamination are the dominant wear mechanisms. J. Kumaraswamy et al. [24] studied the mechanical and wear properties of Al6061/Si3N4 nanocomposites through in situ techniques and noticed abrasive wear at lower stresses and adhesive wear at higher loads, which can be used for brake drum applications.
Simultaneously optimizing tribometer performance characteristics using numerous MCDM/MADM techniques is a valuable research area for assessing the suitability of composite materials across various engineering applications. J. Udaya Prakash et al. [25] employed Taguchi’s robust technique to idealize the abrasion friction factors of AA356/B4C MMCs. V. Mohanavel and M. Ravichandran [26] applied Taguchi and ANOVA methods to improve the structural traits of AA7178/Si3N4 alloys. P. Venkateshwar Reddy et al. [27] investigated the structural and friction properties of stir-cast Al 6063–TiC MMCs by RSM. Finally, Mulugundam Siva Surya et al. [28] applied RSM to assess the mechanical and abrasion performances of Al7075–SiC composites manufactured through powder metallurgy methods. Mukesh Kumar [29] optimized the structural and unlubricated friction behavior of AA356-Al2O3-SiC-Gr MMCs through the Taguchi design of experiments (DOE) and AHP-GRA methods. Siva Sankara Raju et al. [30] evaluated the abrasion characteristics of Al-CSAp MMCs using the grey fuzzy technique. Nazeem Ahamad et al. [31] performed wear tests on tribometer equipment to investigate the friction attributes of Al/Al2O3/TiO2 hybrid MMCs made through mechanical stir casting, optimizing wear performance using TOPSIS and ANOVA techniques. Ashiwani Kumar et al. [32] reviewed the mechanical attributes and frictional features of AA 7075–SiC–marble dust–Gr mixed alloy materials formed by a high vacuum casting technique, optimizing their performance via a hybrid entropy-VIKOR approach. J.D.J. Dhilip et al. [33] utilized the VIKOR method to optimize the machinability characteristics of Al/B4C/MoS2 hybrid composites.
From the existing literature, it has been found that the conventional stir-casting process requires certain modifications to overcome challenges such as non-uniform dispersion and processing defects. To address this, the present study introduces an integrated stir-casting process incorporating ultrasonication and a bottom-pouring setup to manufacture Al6061/SiC/Al2O3 hybrid composites. These improvements result in fewer imperfections, a smoother surface, and an overall enhancement in cast quality. The cast samples were studied for their wear performance using a pin-on-disc tribometer. The volumetric wear loss (V), wear rate (WR), and coefficient of friction (COF) were optimized using GRA and entropy-VIKOR analyses. While optimizing multiple responses, a lack of research on assigning individual weightage to responses has been noted, which can lead to inaccurate judgments and ineffective optimization of wear and friction characteristics. In this work, the effectiveness and reliability of both techniques (with and without considering individual response weights) were thoroughly compared to determine their suitability for optimizing pin-on-disc tribometric parameters. Furthermore, post-wear surface morphology analysis was carried out to explore the wear mechanisms, addressing a relatively understudied aspect of the research.

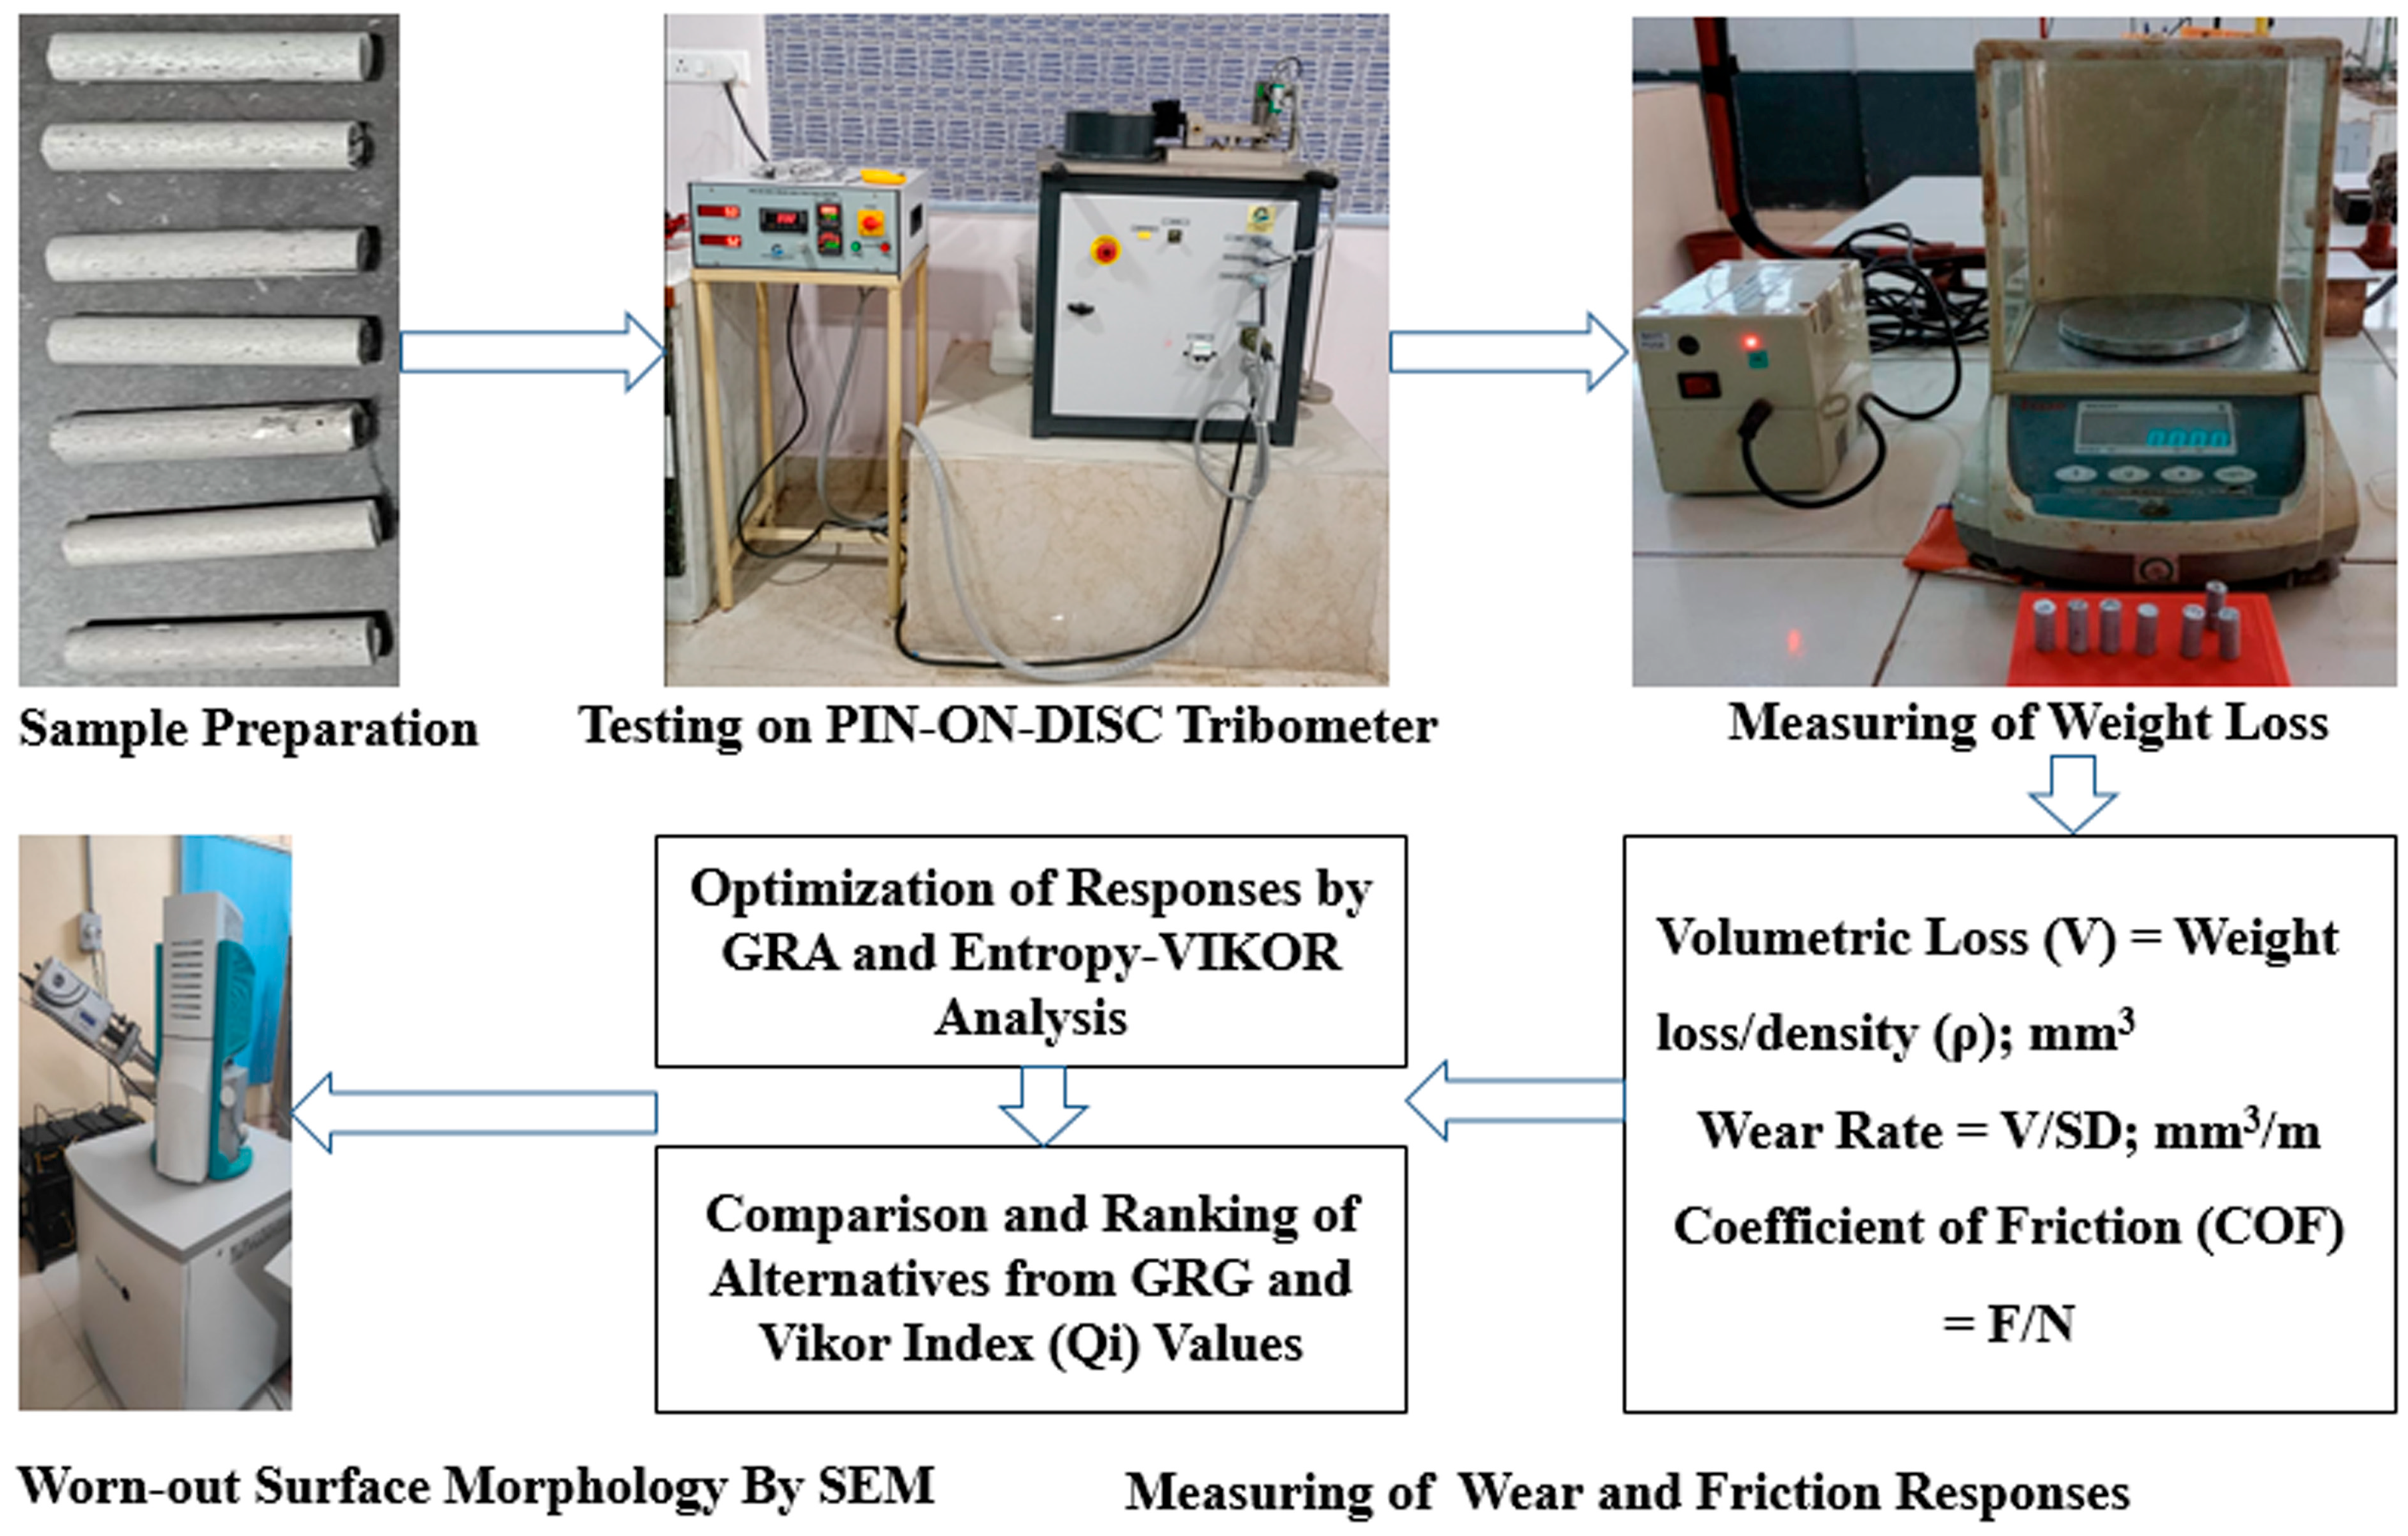
2. Materials and Methods

2.1. Fabrication of Composites

Al-6061/SiC/Al2O3 hybrid composites were fabricated using stir casting integrated with ultrasonic treatment. Around 1 kg of the Al-6061 alloy was melted at 750 °C in a graphite crucible, keeping the furnace temperature at 800 °C under an argon gas environment to prevent oxidation. Mechanical stirring (at 600 rpm for 30 min) was employed to create a vortex for uniform reinforcement dispersion. Preheated SiC and Al2O3 particles (600 °C) and 1 wt.% Mg was sequentially added, followed by ultrasonic treatment (at 20 kHz, 2 kW, for 15 min) to enhance homogeneity. The refined melt was bottom-poured into a 450 °C preheated mild steel mold (200 mm × 120 mm × 16 mm) and solidified. The microstructures of the Al6061 alloy and composites are shown in Figure 1a–d, respectively.

Design of Experiments

Wear and friction tests were conducted using a pin-on-disc tribometer (MMT, Micromatic Technologies, Bengaluru, India) following ASTM G99 standards [34]. A stationary pin (30 mm × 10 mm ø) was slid against a rotating EN31 steel disc (62 HRC) under a controlled load for 15 min. Wear track formation and friction were monitored, and post-test analysis determined the weight loss, wear rate, and coefficient of friction. The experimental study considered process variables, including reinforcement content (wt.%), load (N), sliding velocity (v), and sliding distance (D), each evaluated at various alternative levels, as detailed in Table 1. The experimental design followed Taguchi’s standard L27 orthogonal array, which is presented in Table 2. The performance metrics assessed included volumetric loss (V), wear rate (WR), and coefficient of friction (COF), which were measured and optimized to determine the optimal factors necessary for achieving the desired multi-response outcomes concurrently. The workflow schematic is illustrated in Figure 2.

2.2. MCDM/MADM Techniques

Multi-criteria/attribute decision-making (MCDM/MADM) techniques play a major role in confronting intricate industrial obstacles characterized by conflicting objectives, including cost, quality, efficiency, and environmental concerns [35]. By offering Pareto-optimal solutions, MOO enables decision-makers to evaluate trade-offs and choose the best options while managing issues such as non-linearity and multiple constraints. Its applicability is widespread across various sectors, including manufacturing, supply chain management, energy systems, and production scheduling, thereby enhancing operational efficiency and competitiveness. In the present work, GRA, entropy-VIKOR, and MCDM methods were chosen to optimize dry wear parameters in aluminum-based hybrid composites due to their complementary strengths. GRA is particularly effective for analyzing systems with incomplete or uncertain information, offering simplicity in computation and interpretability. It is highly useful in identifying the degree of correlation among different criteria but lacks a comprehensive mechanism for handling conflicting criteria or assigning dynamic weights based on data variability. On the other hand, entropy-VIKOR incorporates objective weighting through entropy and focuses on compromise ranking, making it suitable for multi-criteria decision-making scenarios with conflicting objectives. It provides a more nuanced evaluation by considering both the group utility and individual regret. This dual approach allows cross-validation of findings while leveraging the strengths of each technique.

2.2.1. Grey Relational Analysis (GRA)

The grey relational grade method is a fundamental approach in grey system theory utilized to address intricate decision-making challenges that involve incomplete or uncertain information [36]. The next step involves defining a reference or ideal sequence that signifies the optimal solution across all criteria, where each normalized value in the reference sequence is generally set to 1. Following this, the grey relational coefficient (GRC) is computed, which indicates the degree of closeness of each alternative to the ideal sequence by using a distinguishing coefficient (δ) that ranges from 0 to 1, often set at 0.5. In the final stage, the grey relational grade (GRG) is computed by aggregating all GRC values for every alternative across all criteria, resulting in an overall performance score. Alternatives are then ranked according to their GRG, with the alternative that has the highest score being deemed the best solution, as it is closest to the ideal sequence. Figure 3 illustrates the flowchart for the procedural steps involved in grey analysis.

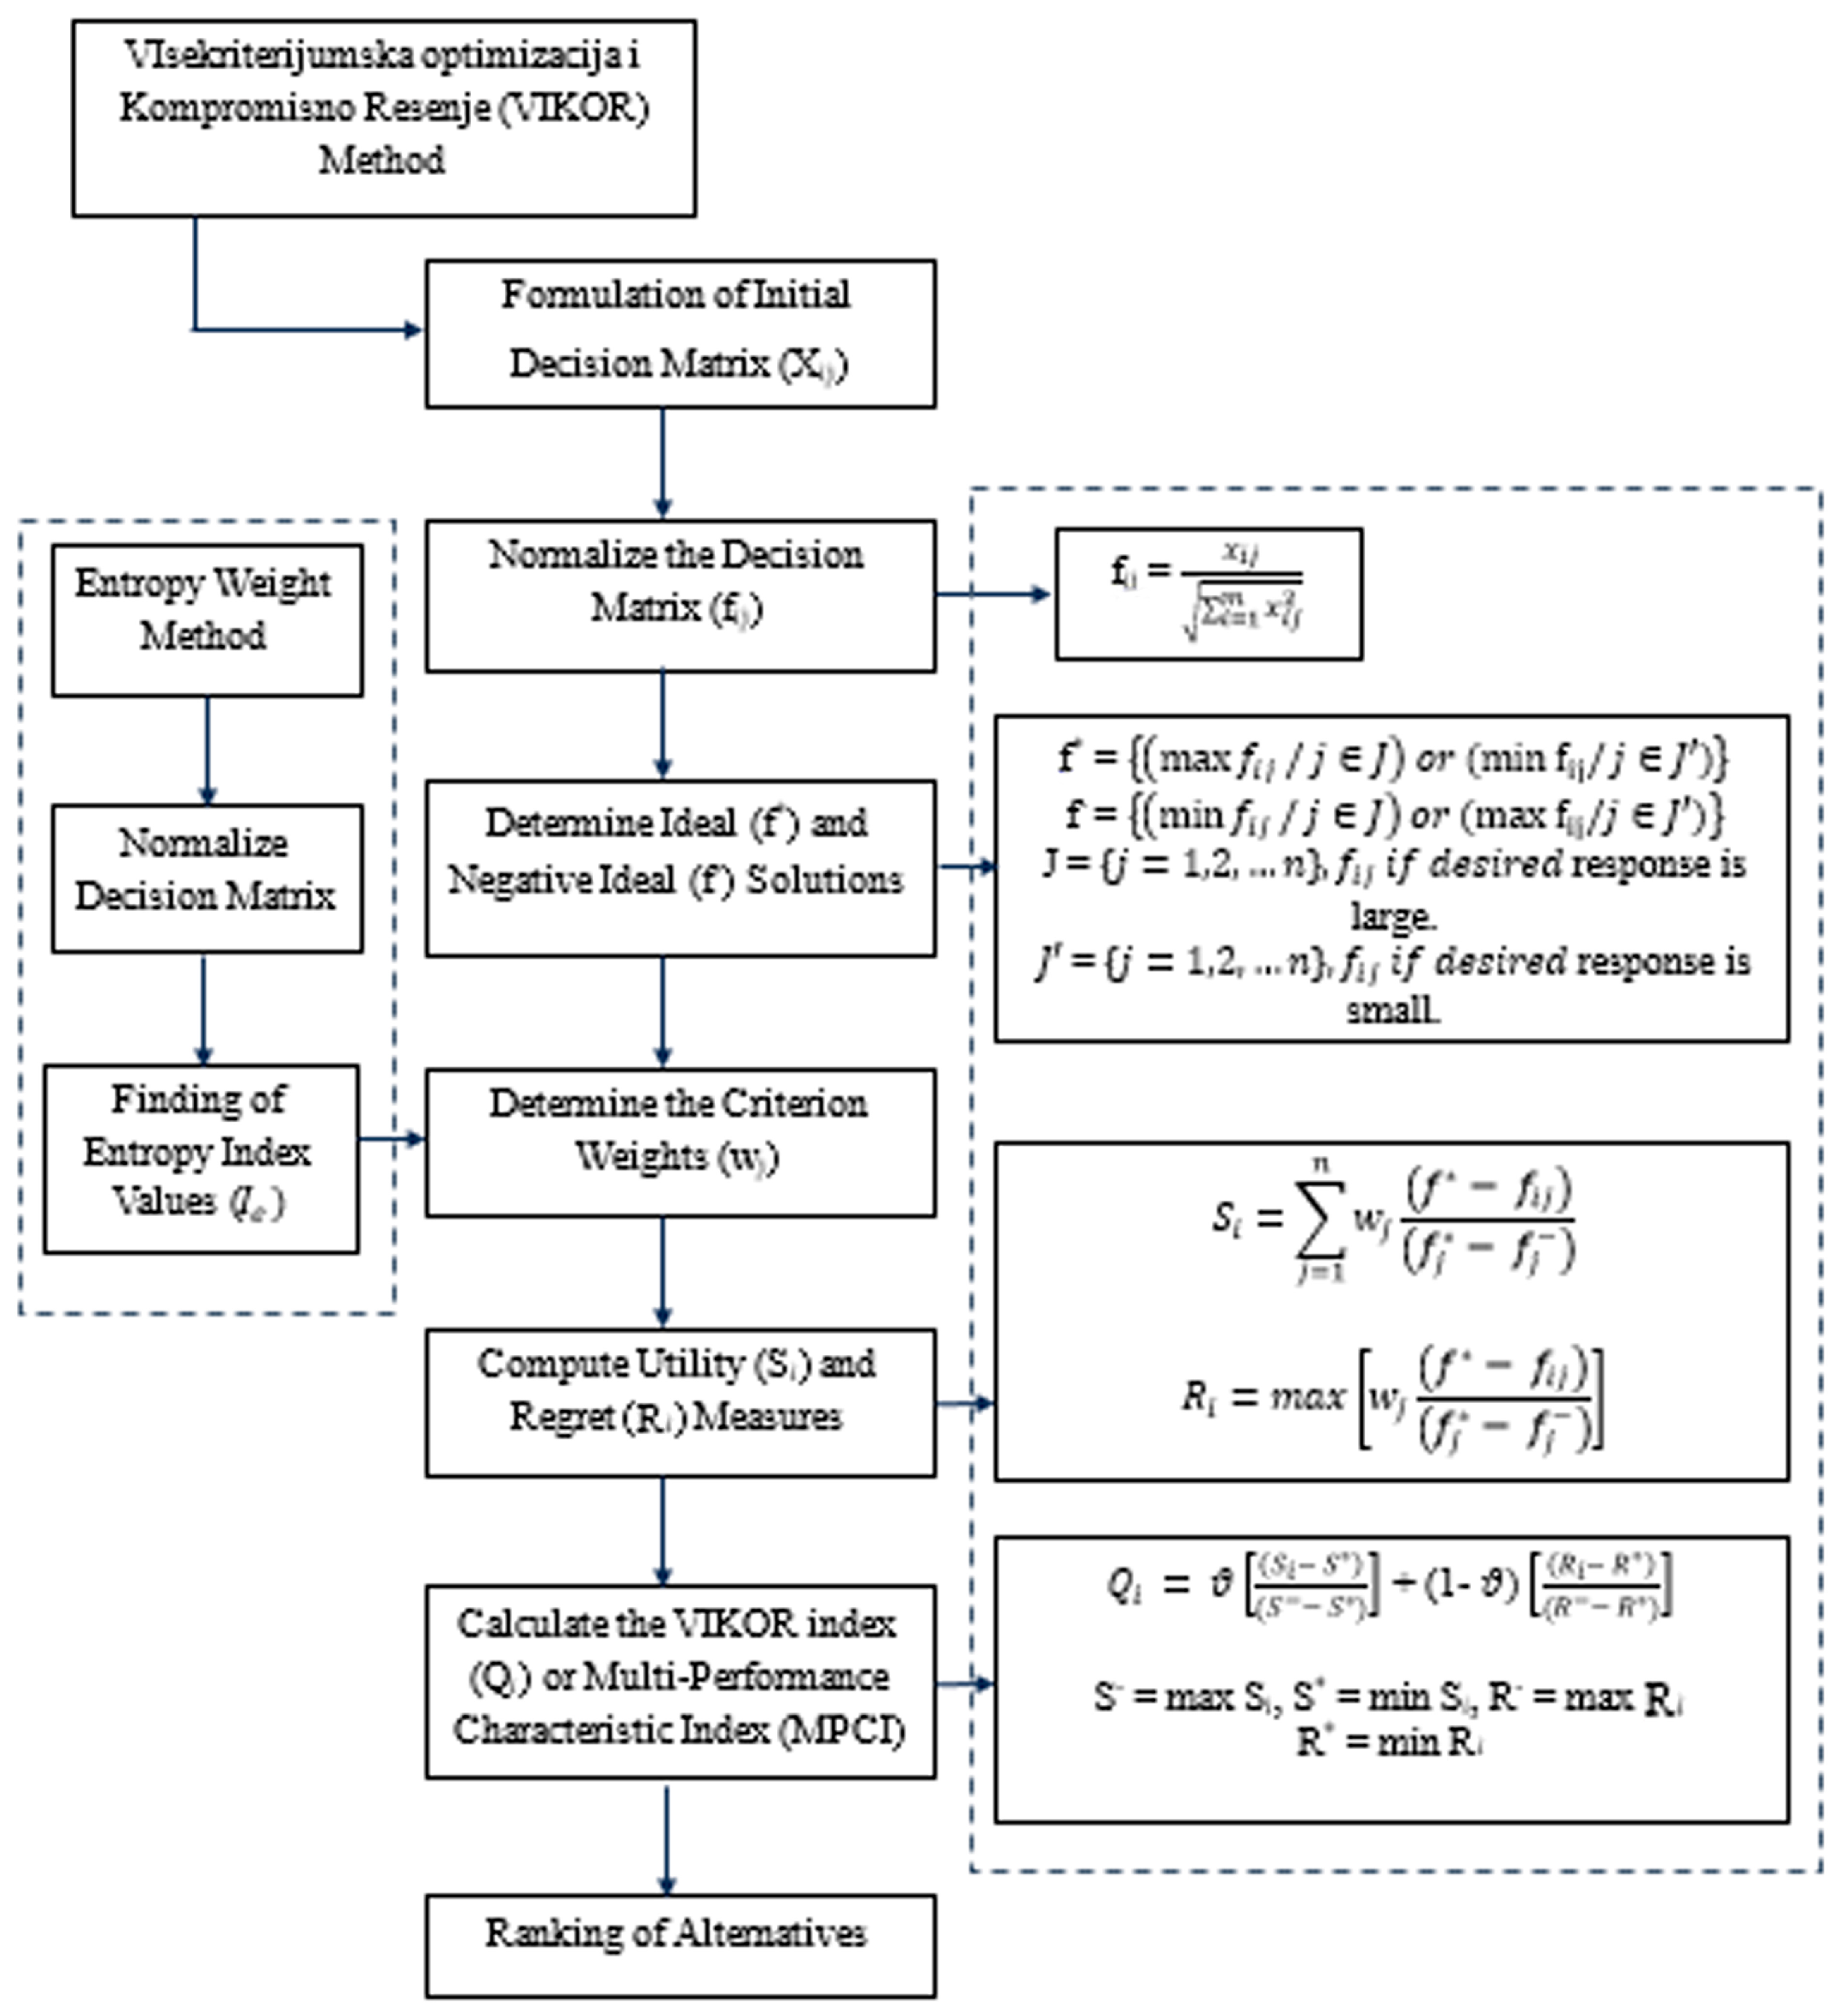
2.2.2. VIKOR Analysis

The VIKOR (VlseKriterijumska Optimizacija I Kompromisno Resenje) technique is an MCDM approach designed to rank and choose alternatives based on conflicting criteria. Its primary aim is to identify a trade-off that is nearest to the ideal solution. The stages involved in the procedure include specifying the alternatives and criteria, followed by the creation of a decision matrix, where alternatives are represented by rows and criteria by columns. To ensure comparability of the data, normalization is carried out in the subsequent step, taking into account desired criteria (where high values are favored) and undesired criteria (where low values are favorable). The following step involves identifying the ideal (f*) and negative ideal (f) solutions. The ideal solution (f*) encompasses the best possible values for all criteria, while the negative ideal solution (f) reflects the worst values. Next, utility and regret measures are calculated, where the utility measure (Si) sums the distances of each alternative from the ideal solution across all criteria. The regret measure (Ri) assesses the maximum distance from the ideal solution for each criterion. Finally, the VIKOR index (Qi) is computed by integrating the utility and regret measures. The experiments are then ranked by their Qi values, with the alternative that has the lowest Qi regarded as the best compromise solution. Figure 4 illustrates the flowchart for the procedural steps involved in VIKOR analysis.

3. Results and Discussion

In tribometer testing, key metrics, namely volumetric wear loss, wear rate, and coefficient of friction, are essential for assessing the performance of materials under dry sliding conditions. These parameters are affected by factors including reinforcement content (wt.%), applied load (N), sliding velocity (v), and sliding distance (D). Volumetric wear loss is generally established by quantifying the weight loss of the material and converting this loss into volume using its density. The abrasion rate is calculated by normalizing the volumetric wear loss against the sliding distance, offering insights into material durability. The coefficient of friction is expressed as the proportion of the resistive force to the applied load, indicating the interfacial resistance encountered during sliding. The empirical findings obtained are outlined in Table 3.

3.1. Grey Analysis

The wear and friction characteristics were enhanced through the utilization of the grey relational grade method to establish the ideal combination of process variables, thereby improving material performance simultaneously. The procedure detailed in the methodology section was applied to the responses displayed in Table 1, with the normalized responses and loss function values shown in Table 4.
Using the obtained loss function values and assuming the distinguishing coefficient to be 0.5, the grey relational coefficient (GRC) values for every response were determined. Based on these GRC values, the grey relational grade (GRG) quantities for the alternatives were computed by averaging the GRC values for the individual responses [11]. Table 5 presents the calculated GRC values of the responses along with the average GRG value for the alternatives.

3.1.1. Taguchi Analysis

Taguchi analysis is a structured method that utilizes orthogonal arrays (OAs) to decrease the number of required experiments, effectively conserving time and resources. This approach is commonly applied in manufacturing, material development, and product design to enhance efficiency, lower costs, and maintain consistent performance in industrial processes. In this context, it is applied to optimize process factors, enhance performance, and upgrade product quality by reducing variability. By identifying key factors and their interactions, Taguchi analysis facilitates the creation of robust and dependable designs across various conditions. Table 6 represents the mean values of S/N proportions for the grey relational grade values derived for the alternatives.
The main effect plot for signal-to-noise (S/N) ratios pertaining to the grey relational grade values is illustrated in Figure 5. From this plot, the ideal setting of process variables for arriving at the maximum grey relational grade values is identified as follows: reinforcement content (wt.%): L3, 10; load (N): L3, 50 N; sliding velocity (v): L3, 2.5 m/s; and sliding distance (SD): L3, 750 m [24]. Additionally, the Taguchi results confirm that reinforcement wt.% has a notable influence on the multiple attribute value of the grey relational grade (GRG) [34].

3.1.2. Analysis of Variance (ANOVA)

ANOVA is employed on the GRG values obtained from the grey analysis to validate the significance of various factors and to assess the fitness of the model. Table 7 presents the ANOVA results, indicating that the reinforcement content (wt.%) is the most influential factor for the multi-response of the GRG, with a significance value of 133.40 and a contribution value of 0.000. Conversely, sliding velocity (v) is identified as the least influential factor, with a significance value of 5.64 and a contribution value of 0.035. However, a moderate impact is noticed due to load (N) and sliding distance (SD) on the multi-response of the GRG, whereas the interaction effect between reinforcement content (wt.%) and load (N) is remarkable, with F and p values of 7.03 and 0.021, respectively, for achieving a higher GRG. The model’s accuracy and adequacy are verified using residual plots, which are shown in Figure 6. These graphs point out that the errors approximate normality, as they align closely with the normal probability plot. The constant variance is also validated, as the residuals plotted against fits and order do not exhibit any discernible pattern and are evenly distributed around the horizontal line. Overall, the model is deemed fit and accurate, with variance and coefficient of determination (R2) values calculated at 0.0462189 and 93.98%, respectively [29].

3.2. Entropy-VIKOR Analysis

Grey analysis has the limitation of not explicitly accounting for the weights of criteria, which may result in biased outcomes and an oversimplification of multi-response optimization. In contrast, the entropy-VIKOR method effectively overcomes this drawback by objectively calculating criteria weights using entropy and optimizing conflicting responses through compromise ranking, thereby facilitating a more balanced and precise decision-making process. The procedural steps of the entropy-VIKOR technique, as outlined in the methodology, were implemented to determine the criteria weights and the VIKOR index (Qi) values for the alternatives.
The normalized and entropy indices entities for the responses are presented in Table 8. From the entropy indices, the entropy (ej) values for the criteria are calculated to be 0.9309 for volumetric loss (V), 0.9045 for the wear rate (WR), and 0.9871 for the coefficient of friction (COF) [30]. The degree of diversification/redundancy (dj) reflects the variation or contrast in the data for each criterion; a higher dj indicates greater variability, suggesting that the criterion is more important. The redundant values obtained for the three responses are 0.0691, 0.0954, and 0.0128, respectively. Finally, the weights for each criterion are determined by normalizing the degree of diversification values, resulting in wV: 0.3893, wWR: 0.5380, and wCOF: 0.0726 [31].
The weights obtained for the responses were utilized to calculate two aggregate measures for each alternative. Ultimately, the VIKOR index (Qi) entities are computed by setting υ at 0.5, which is commonly used to balance the utility and regret measures. Table 9 displays the calculated values of the utility measure (Si), regret measure (Ri), and the corresponding VIKOR index (Qi) for the alternatives.

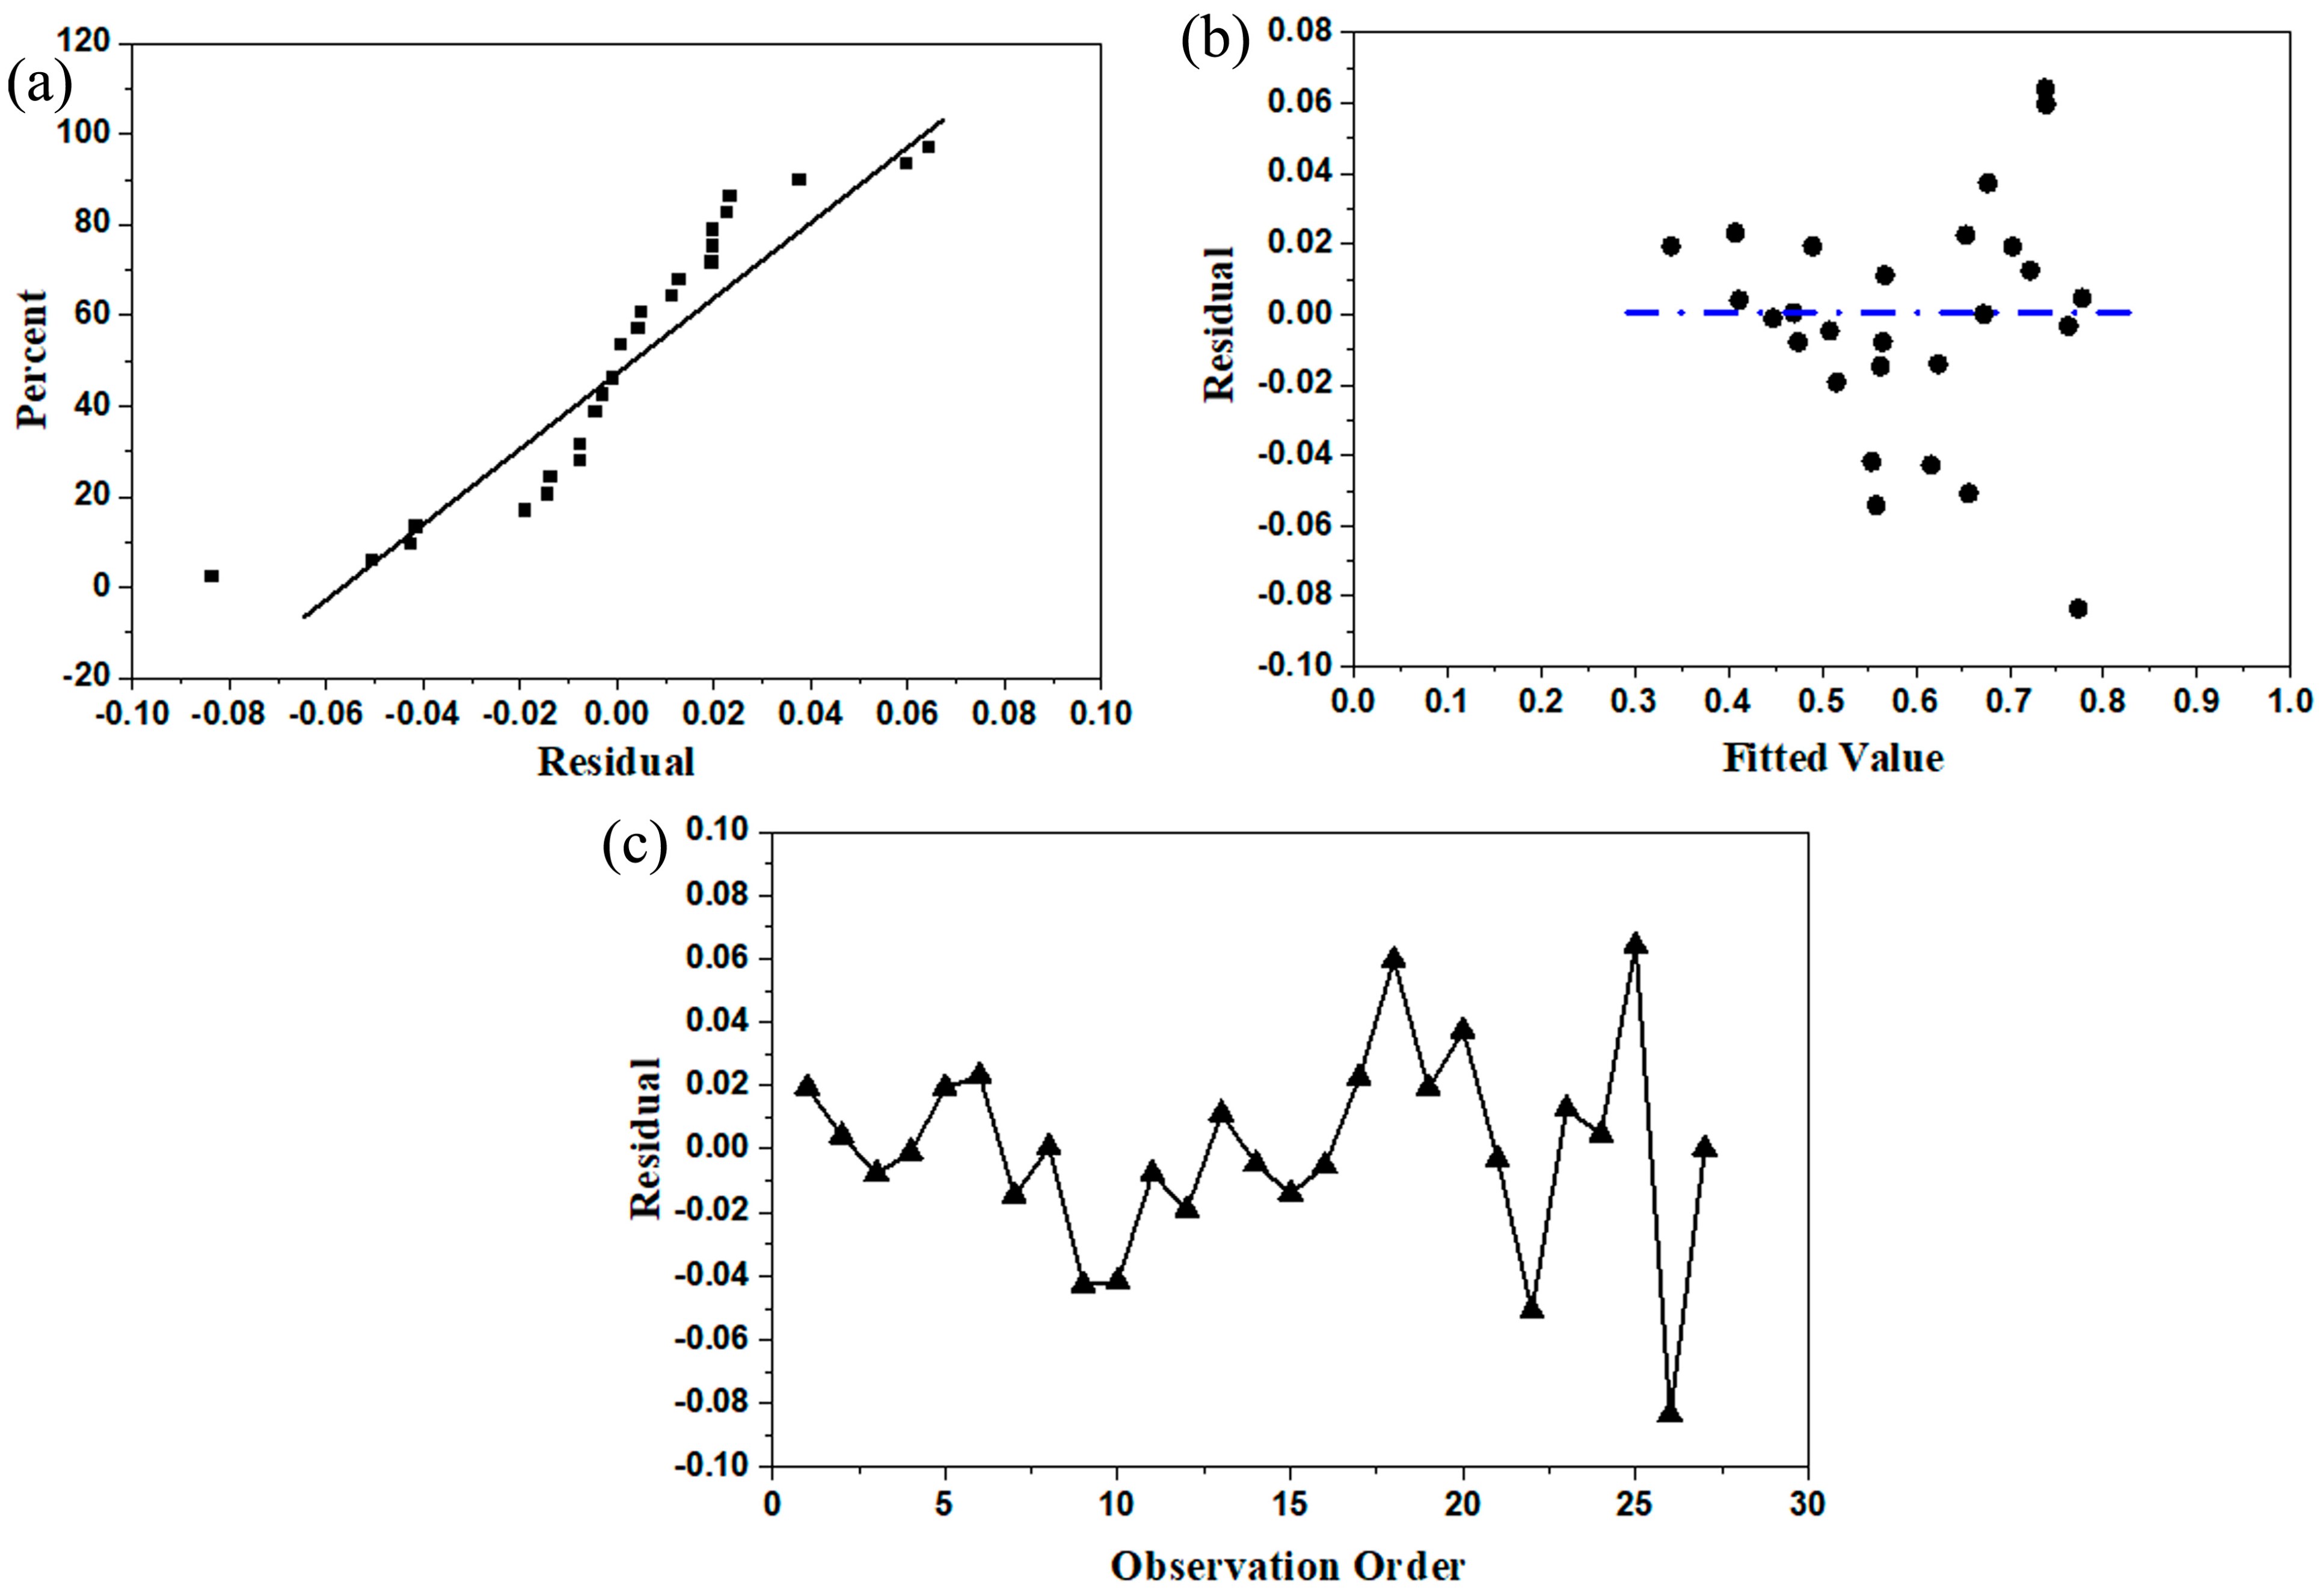
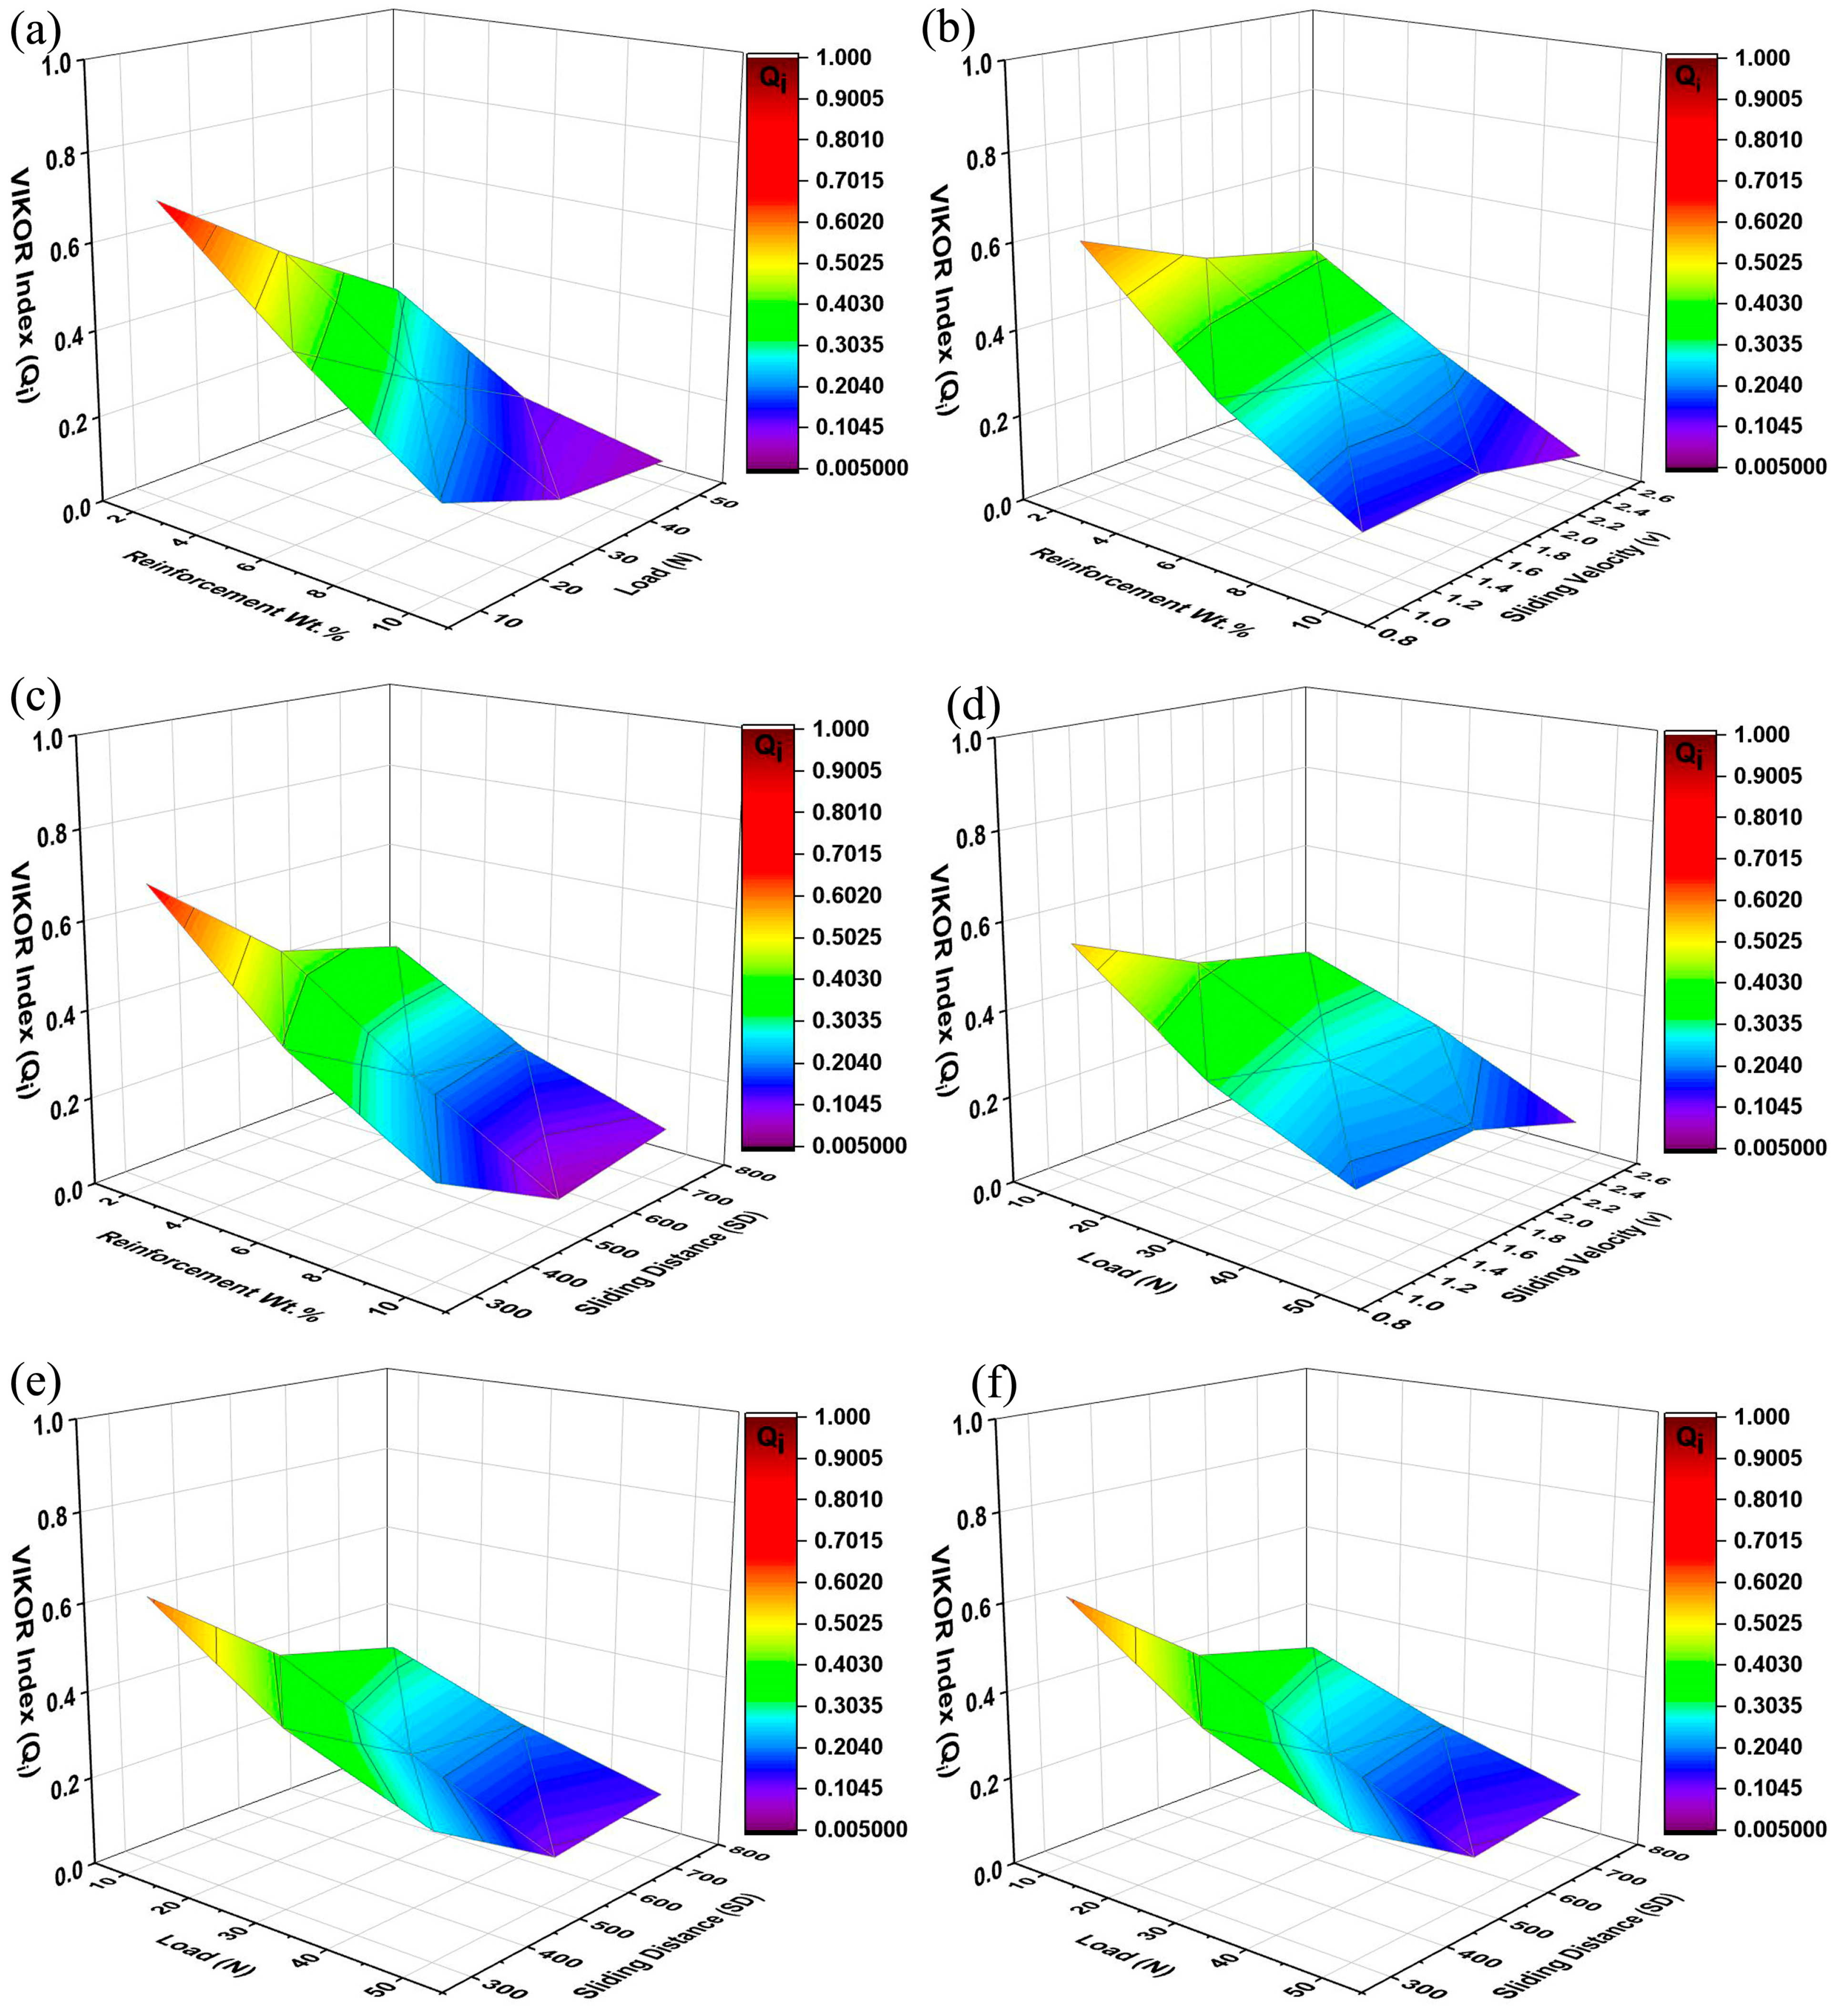
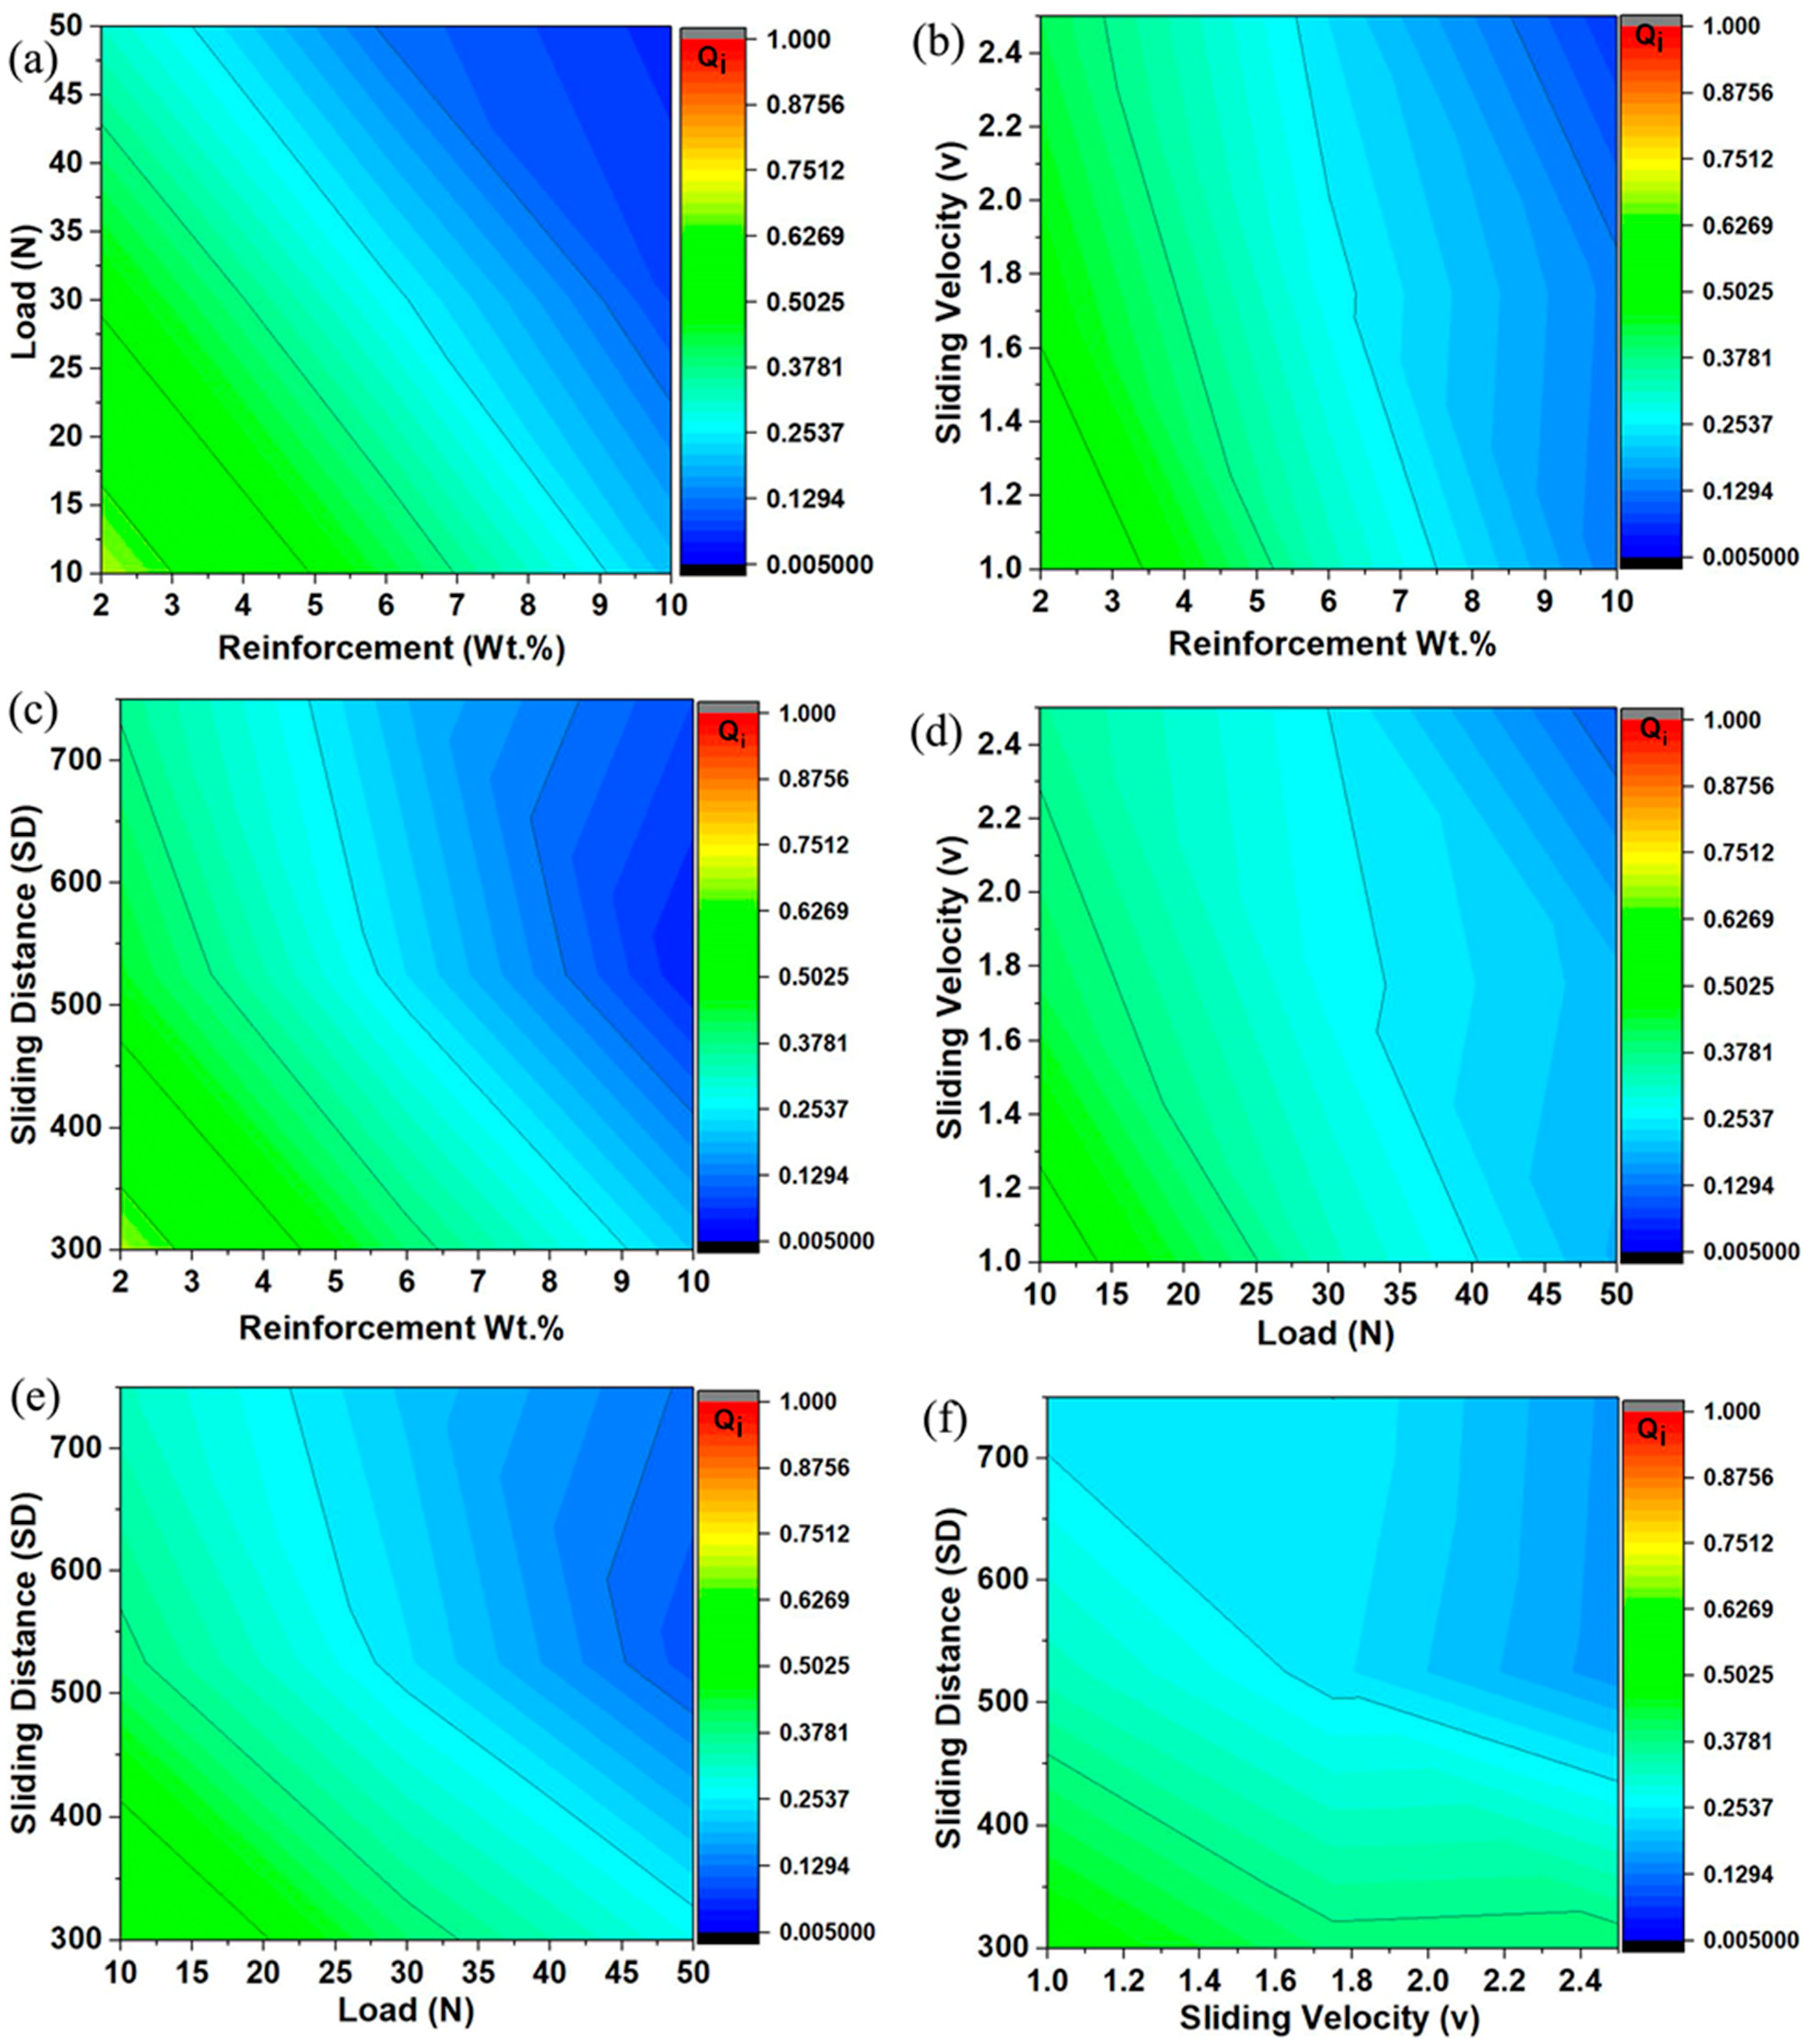
Response Surface Methodology (RSM)

Response surface methodology (RSM) is a robust quantitative and numerical tool employed for the depiction and idealization of approaches that are influenced by multiple variables. Its significance lies in its capability to identify the relationships between input factors and responses, forecast optimal conditions, and minimize experimental effort through the use of design of experiments (DOE) techniques. RSM is widely applied across various fields, including material science, chemical engineering, and manufacturing. It is utilized to optimize parameters for processes such as wear testing, composite fabrication, and product development, leading to enhanced performance and cost efficiency. The multi-order linear regression model developed for the multiple attribute values of the VIKOR index (Qi) is presented in Equation (1).
Q i = 2.1296 0.13271   R F w t . % 0.01994   N 0.1309   v 0.002573   S D + 0.002049   R F w t . % × R F w t . % + 0.000055   N × N + 0.0024   v × v + 0.000002   S D × S D + 0.000749   R F w t . % × N + 0.00718   R F w t . % × v + 0.000048   R F w t . % × S D + 0.001002   N × v + 0.000007   N × S D 0.000049   v × S D
Table 10 displays the ANOVA results for Qi, showing that all process parameters are statistically significant, as their p-values are below 0.05, which corresponds to a 95% confidence level [26]. The ANOVA findings represented that reinforcement content (wt.%) is the highest influential factor in attaining the desired lower VIKOR index value, with an F value of 1415.84, followed by load (F = 737.18), sliding distance (F = 433.93), and sliding velocity (F = 122.11), respectively. Interaction effects among the tribometer process variables are also significant, as illustrated by the interaction plots for Qi in Figure 7. Notably, the interaction effects of reinforcement wt.% with the others are found to be more significant in achieving the lowest VIKOR index value. The accuracy and adequacy of the model have been confirmed through residual plots for Qi, as presented in Figure 8. These plots indicate that the residuals comply with both normality and constant variance, suggesting that the model is significant and suitable for future predictions of multi-response values [27]. The model exhibits an excellent fit, with a variance (S) of 0.0216803 and coefficient of determination (R2) and adjusted R2 values of 99.60% and 99.14%, respectively.
Figure 9 presents 3D surface plots labeled from (a) to (f), each depicting the interaction effects of two variables on the VIKOR index (Qi), with response values shown through a color gradient. In Figure 9a, the two variables on the x-axis (reinforcement content) and y-axis (load) demonstrate a strong interaction, as evidenced by the steep gradient of the surface. The Qi decreases notably (from red to blue) as both variables increase, indicating a potential synergistic effect in lowering Qi. Figure 9b shows a smoother transition, reflecting a milder interaction effect between the reinforcement content (wt.%) and sliding velocity (v). The gradient reveals a gradual decrease in Qi, suggesting that one variable may have a greater influence on the response than the other. In Figure 9c, the curvature indicates a non-linear interaction between the two variables, reinforcement content and sliding distance (SD). The Qi decreases more dramatically in certain areas, suggesting that specific combinations of the variables lead to more significant reductions.
In Figure 9d, the interaction between load (N) and sliding velocity (v) appears to be mild yet consistent. The Qi decreases steadily, showing less pronounced curvature compared to the other plots. Figure 9e reveals a sharp interaction effect between the load (N) and sliding distance (SD), which is particularly noticeable in the steep transition of Qi values. The surface indicates that simultaneous variations in both variables significantly impact Qi. In Figure 9f, the surface exhibits a relatively smooth appearance, suggesting a weaker or more linear interaction between the sliding velocity (v) and sliding distance (SD). The decrease in Qi is gradual and characterized by a nearly uniform gradient.
Figure 10 displays contour plots labeled from (a) to (f), showing the interaction effects of two independent variables on the response variable, the VIKOR index (Qi), with color gradients indicating the magnitude of Qi. In Figure 10a, Qi decreases as reinforcement content increases, particularly at higher load levels. The steep gradient in the blue area underscores that reinforcement content is the primary factor in lowering Qi; while load also has an effect, its impact is less significant. In Figure 10b, Qi decreases as both reinforcement content and sliding velocity increase, with a more substantial effect observed at higher levels of reinforcement content. The closely spaced contours at elevated sliding velocity levels indicate a stronger interaction effect in that range. In Figure 10c, Qi decreases significantly with increasing reinforcement content, especially at greater sliding distances. The influence of sliding distance is less pronounced compared to reinforcement content, as shown by the smoother contours along the sliding distance axis.
Figure 10d indicates a decreasing trend in Qi as both load and sliding velocity increase. The interaction between these variables appears mild, as evidenced by the gradual changes in Qi and the widely spaced contours. Figure 10e demonstrates that Qi steadily decreases with increasing load and sliding distances, with the gradient becoming more pronounced at higher sliding distances, indicating a stronger combined influence of these variables. Figure 10f shows the decline in Qi as sliding velocity and sliding distance increase, with the most significant reduction occurring at higher sliding distances. While sliding velocity affects Qi, it is secondary to sliding distance. Across all process variables, reinforcement content is consistently recognized as the most influential factor in reducing Qi. Therefore, maximizing reinforcement content while optimizing the other variables within their effective ranges is crucial for achieving the lowest Qi.

3.3. Comparison of Grey and Entropy-VIKOR Approaches

Figure 11 provides a comparison of the grey relational grade (GRG) and VIKOR index (Qi) values derived from the two multi-objective optimization techniques. It is noted that the highest GRG value is 80.23, while the lowest Qi value is 0.0062, both corresponding to the 25th alternative. Additionally, Table 11 displays the rankings of the alternatives based on the grey analysis and the entropy-based VIKOR analysis.

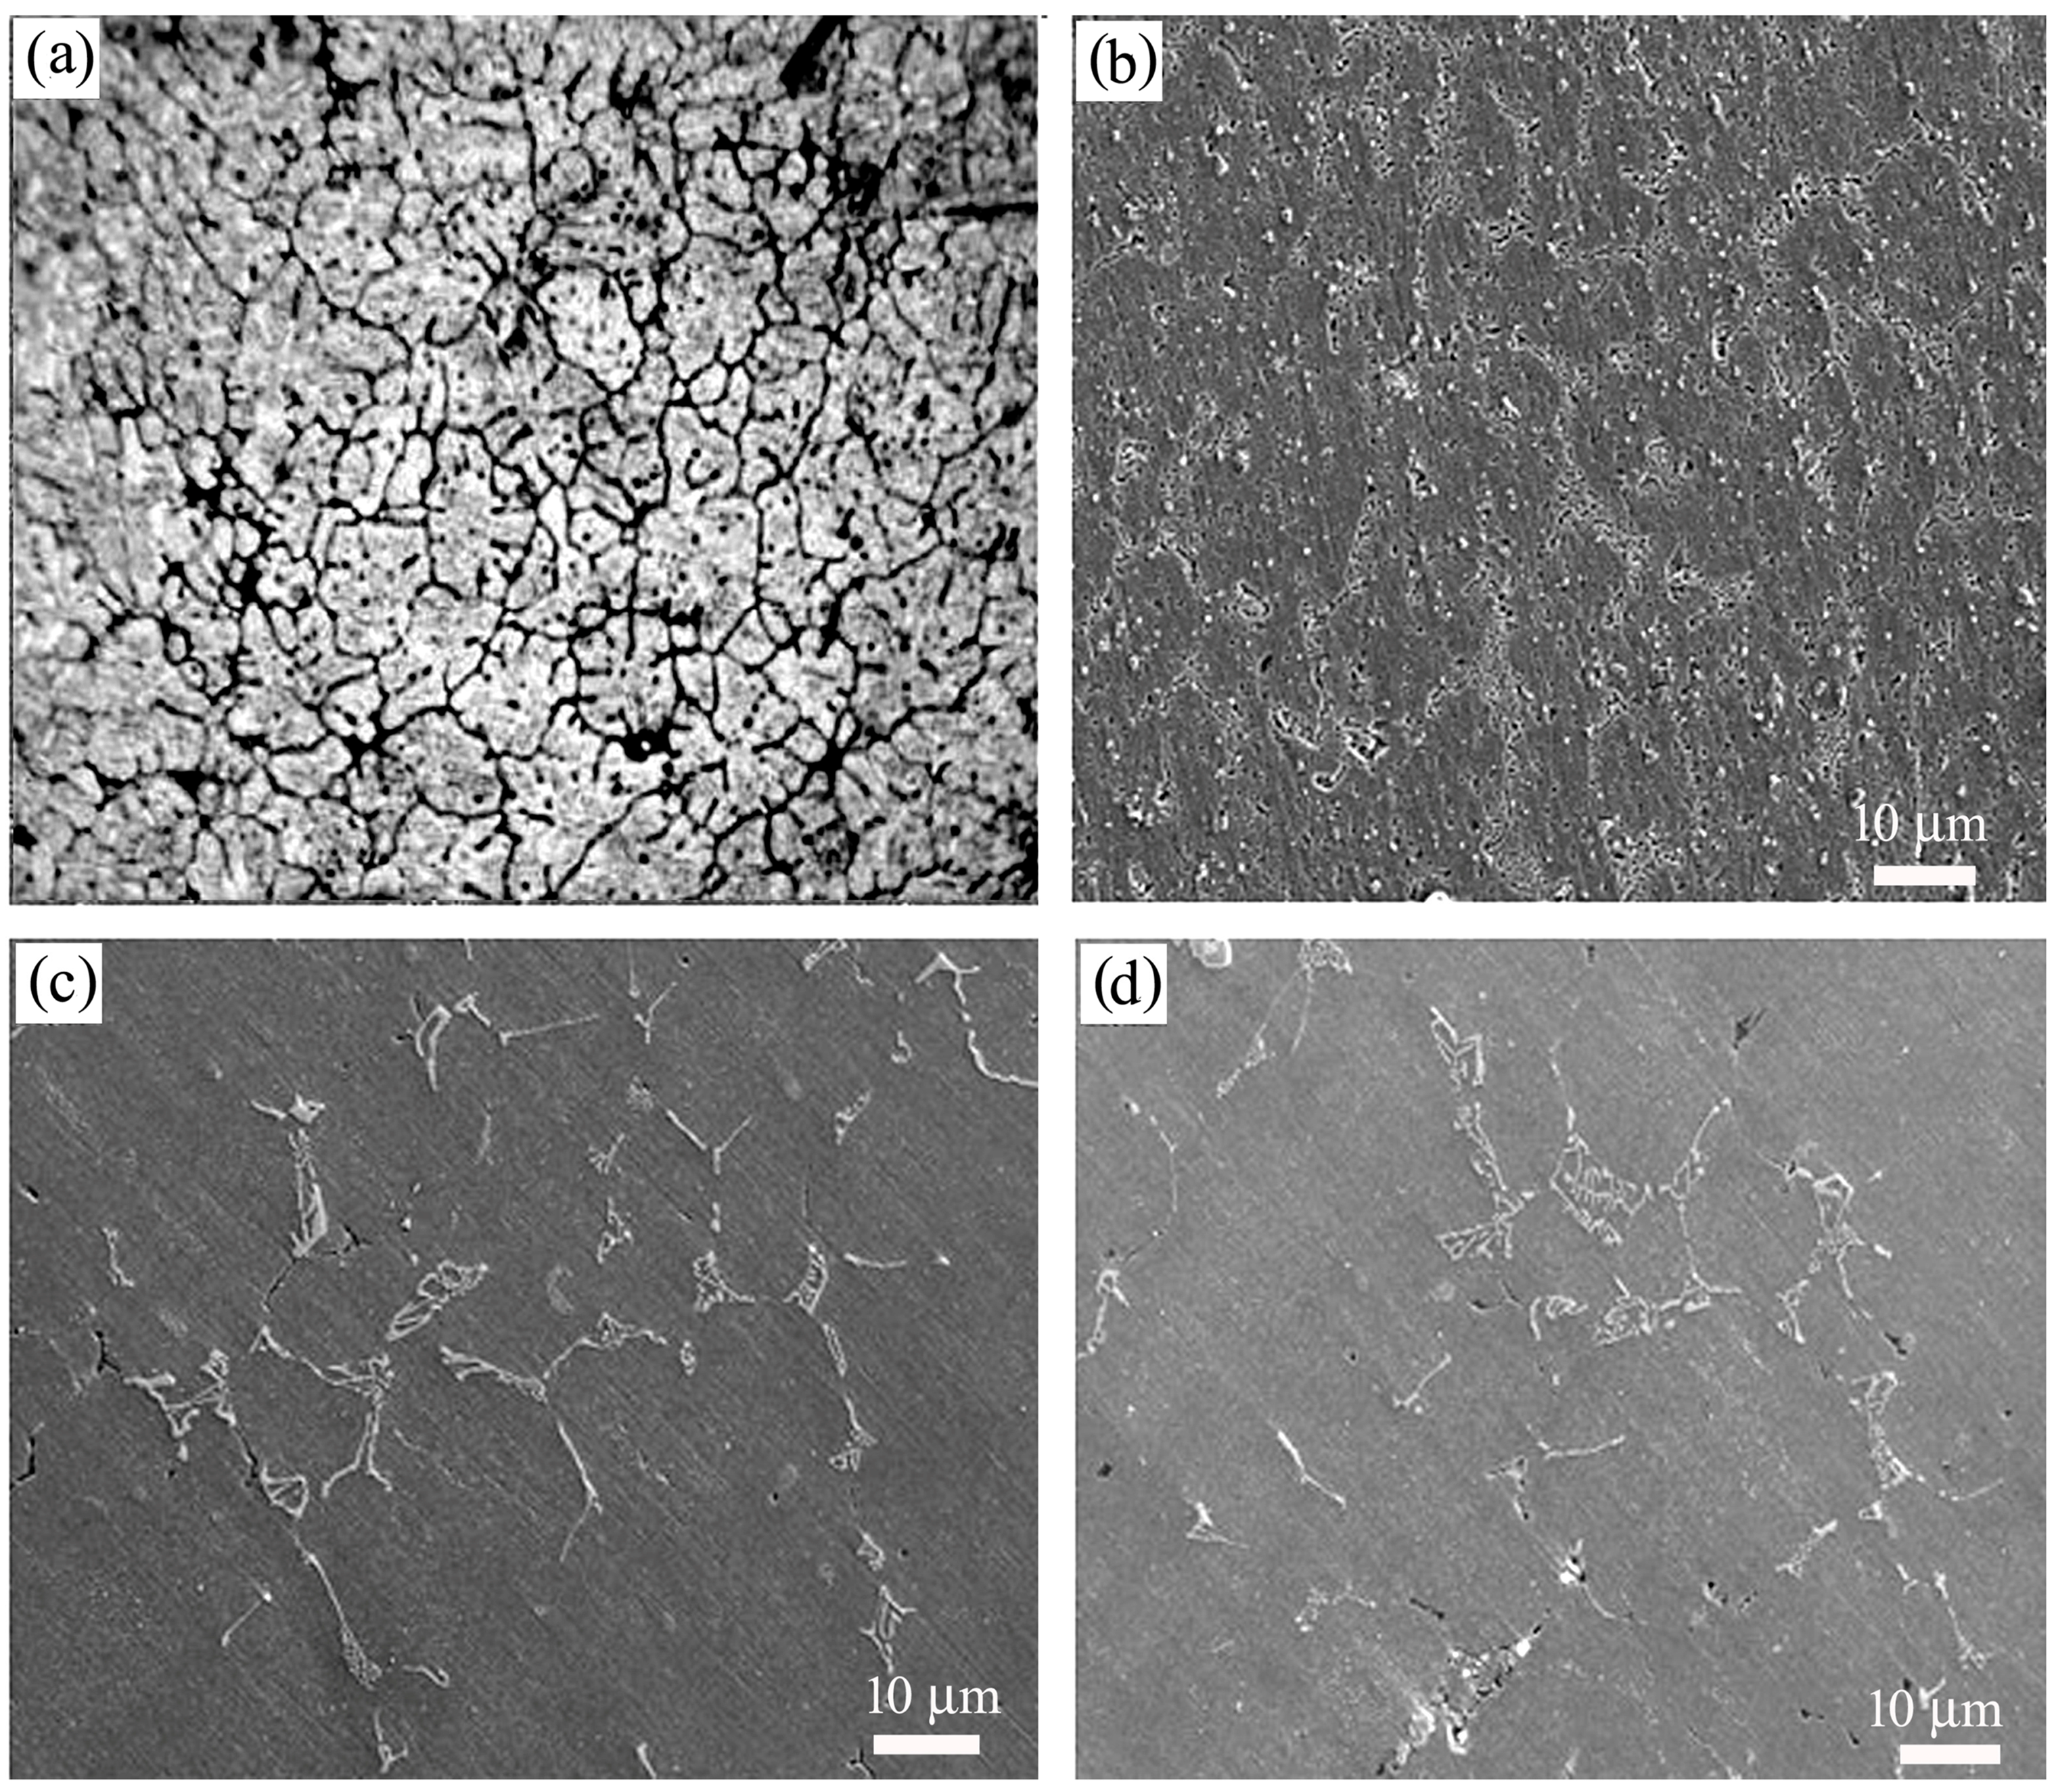
3.4. Morphologies of Worn-Out Surfaces

The abrasion traits of the composite samples were analyzed with the FESEM (Make: JEOL ASIA PTE Ltd., Singapore, Model: JSM-IT800) technique. The morphologies shown in Figure 12 reflect distinct wear mechanisms, demonstrating how reinforcement content and applied load govern wear behavior. Figure 12a shows abrasive wear under a combination of 5% SiC and 5% Al2O3 reinforcements at a 10 N load. This is primarily due to the micro-cutting and plowing actions of hard particles sliding across the surface, which results in material removal through grooves and scratches [14], while the inclusion of ceramic reinforcements of SiC and Al2O3 increased the composite’s hardness and wear resistance by acting as barriers to deformation. However, at moderate loads, the hard abrasive particles embedded within the matrix may lead to localized plastic deformation and material degradation. In Figure 12b, adhesive wear and delamination are evident at a higher load of 50 N. This is exacerbated under high loads that increase surface contact pressures, enhancing adhesion forces and generating cyclic stresses [18]. The peeling of composite layers occurs as a fatigue-driven process due to repeated stress cycles near the interface or within the matrix, causing crack initiation and propagation parallel to the surface. This interplay of adhesion and cyclic fatigue stresses aligns well with tribological theories of adhesive wear combined with fatigue-induced delamination.
It is observed that increasing the reinforcement content to 10 wt.% (SiC + Al2O3) improves wear resistance even at a higher load of 50 N. The reinforcements prevent plastic deformation and reduce direct metal-to-metal contact, thus lowering adhesive wear and delaying delamination initiation [20,21]. Figure 12c exhibits deep grooves and small-sized wear debris under optimal reinforcement and load conditions, demonstrating plowing and particle fragmentation wear mechanisms [22]. The presence of wear debris confirms ongoing fragmentation and removal of particles due to these high-contact stresses. This mechanism also contributes to the roughening of surfaces and accelerates wear progression through repeated micro-cutting and fatigue cracking. Overall, this load-bearing capacity of the composites is essential for applications in the automobile sector, specifically for pistons, cylinder liners, connecting rods, and gear housings, etc. [23,24].

4. Conclusions

From the experimental and optimization results of grey and entropy-VIKOR approaches, the ensuing outcomes can be inferred:
  • The ultrasonic stir-casting process effectively overcomes the limitations of conventional methods by enhancing particle dispersion, reducing porosity, and improving matrix-reinforcement bonding, leading to superior wear resistance properties;
  • The grey analysis identified the optimal process parameters for minimizing the multi-responses of wear features, at 10 wt.% reinforcement content, 50 N load, 2.5 m/s sliding velocity, and 750 m sliding distance;
  • ANOVA and signal-to-noise (S/N) ratio results indicate that reinforcement content is the most influential factor, while sliding velocity has the least impact on the multi-response value of the GRG;
  • A multi-order regression model for the VIKOR index (Qi) demonstrated high accuracy, with a variance of 0.0216, a coefficient of determination (R2) value of 99.60%, and an adjusted R2 of 99.14%;
  • Entropy-weighted VIKOR analysis combined with response surface methodology (RSM) offers greater insights and higher accuracy than Taguchi grey relational analysis;
  • Morphological studies revealed that wear mechanisms are predominantly driven by plowing, abrasion, and adhesion;
  • The combination of GRA and entropy-VIKOR provides a robust, data-driven approach for multi-criteria optimization, reducing subjective bias and ensuring balanced performance evaluation, making it ideal for complex composite systems.

Author Contributions

Conceptualization, K.P.B. and M.R.C.; methodology, S.R.P.; software, M.R.C. and M.C.; validation, S.R.P. and K.P.B.; formal analysis, M.R.C.; investigation, K.P.B.; resources, S.R.P.; data curation, K.P.B.; writing—original draft preparation, K.P.B.; writing—review and editing, S.R.P., M.R.C. and M.C. All authors have read and agreed to the published version of the manuscript.

Funding

This research received no external funding.

Data Availability Statement

The original contributions presented in this study are included in the article Further inquiries can be directed to the corresponding author(s).

Conflicts of Interest

The authors declare no conflicts of interest.

Abbreviations

The following abbreviations are used in this manuscript:
RFReinforcement Content (wt.%)
NNormal Load
vSliding Velocity
SDSliding Distance
OAOrthogonal Array
GRCGrey Relational Coefficient
GRGGrey Relational Grade
IeEntropy Index
SiUtility Measure
RiRegret Measure
QiVIKOR Index

References

  1. Singh, J.; Chauhan, A. A review of microstructure, mechanical properties and wear behavior of hybrid aluminium matrix composites fabricated via stir casting route. Sadhana 2019, 44, 16. [Google Scholar] [CrossRef]
  2. Krstic, J.; Jovanovic, J.; Gajevic, S.; Miladinovic, S.; Vaxevanidis, N.M.; Kiss, I.; Stojanovic, B. Application of Metal Matrix Nanocomposites in Engineering. Adv. Eng. Lett. 2024, 3, 180–190. [Google Scholar] [CrossRef]
  3. Kumar, S.; Singh, R.; Hashmi, M.S.J. Metal matrix composite: A methodological review. Adv. Mater. Process. Technol. 2020, 6, 13–24. [Google Scholar] [CrossRef]
  4. Ramanathan, A.; Krishnan, P.K.; Muraliraja, R. A review on the production of metal matrix composites through stir casting–Furnace design, properties, challenges, and research opportunities. J. Manuf. Process. 2019, 42, 213–245. [Google Scholar] [CrossRef]
  5. Singh, L.; Singh, B.; Saxena, K.K. Manufacturing techniques for metal matrix composites (MMC): An overview. Adv. Mater. Process. Technol. 2020, 6, 441–457. [Google Scholar] [CrossRef]
  6. Ravishankar, B.; Nayak, S.K.; Kader, M.A. Hybrid composites for automotive applications—A review. J. Reinf. Plast. Compos. 2019, 38, 835–845. [Google Scholar] [CrossRef]
  7. Aynalem, G.F. Processing methods and mechanical properties of aluminium matrix composites. Adv. Mater. Sci. Eng. 2020, 2020, 3765791. [Google Scholar] [CrossRef]
  8. Samal, P.; Vundavilli, P.R.; Meher, A.; Mahapatra, M.M. Recent progress in aluminum metal matrix composites: A review on processing, mechanical and wear properties. J. Manuf. Process. 2020, 59, 131–152. [Google Scholar] [CrossRef]
  9. Zhu, J.; Jiang, W.; Li, G.; Guan, F.; Yu, Y.; Fan, Z. Microstructure and mechanical properties of SiCnp/Al6082 aluminum matrix composites prepared by squeeze casting combined with stir casting. J. Mater. Process. Technol. 2020, 283, 116699. [Google Scholar] [CrossRef]
  10. Surya, M.S.; Prasanthi, G. Effect of silicon carbide weight percentage and number of layers on microstructural and mechanical properties of Al7075/SiC functionally graded material. Silicon 2022, 14, 1339–1348. [Google Scholar] [CrossRef]
  11. Sakthivelu, S.; Sethusundaram, P.P.; Ravichandran, M.; Meignanamoorthy, M. Experimental investigation and analysis of properties and dry sliding wear behavior of Al-Fe-Si alloy matrix composites. Silicon 2021, 13, 1285–1294. [Google Scholar] [CrossRef]
  12. Manikandan, R.; Arjunan, T.V. Mechanical and tribological behaviors of aluminium hybrid composites reinforced by CDA-B4C. Mater. Res. Express 2020, 7, 016584. [Google Scholar] [CrossRef]
  13. Vithal, D.N.; Krishna, B.B.; Krishna, G.M. Microstructure, mechanical properties and fracture mechanisms of ZrB2 ceramic reinforced A7075 composites fabricated by stir casting. Mater. Today Commun. 2020, 25, 101289. [Google Scholar] [CrossRef]
  14. Dey, D.; Bhowmik, A.; Biswas, A. Effect of SiC content on mechanical and tribological properties of Al2024-SiC composites. Silicon 2022, 14, 1–11. [Google Scholar] [CrossRef]
  15. Jojith, R.; Radhika, N. Investigation of mechanical and tribological behavior of heat-treated functionally graded Al-7Si/B4C composite. Silicon 2020, 12, 2073–2085. [Google Scholar] [CrossRef]
  16. Gowrishankar, T.P.; Manjunatha, L.H.; Sangmesh, B. Mechanical and Wear behavior of Al6061 reinforced with Graphite and TiC Hybrid MMCs. Mater. Res. Innov. 2020, 24, 179–185. [Google Scholar] [CrossRef]
  17. Jayakumar, E.; Praveen, A.P.; Rajan, T.P.D.; Pai, B.C. Studies on tribological characteristics of centrifugally cast SiCp-reinforced functionally graded A319 aluminium matrix composites. Trans. Indian Inst. Met. 2018, 71, 2741–2748. [Google Scholar] [CrossRef]
  18. David Raja Selvam, J.; Dinaharan, I.; Rai, R.S.; Mashinini, P.M. Dry sliding wear behavior of in-situ fabricated TiC particulate reinforced AA6061 aluminium alloy. Tribol.-Mater. Surf. Interfaces 2019, 13, 1–11. [Google Scholar] [CrossRef]
  19. Prasad Reddy, A.; Vamsi Krishna, P.; Rao, R.N. Two-body abrasive wear behavior of AA6061-2SiC-2Gr hybrid nanocomposite fabricated through ultrasonically assisted stir casting. J. Compos. Mater. 2019, 53, 2165–2180. [Google Scholar] [CrossRef]
  20. Bharti, S.; Ghetiya, N.D.; Patel, K.M. Micro-hardness and wear behavior of AA2014/Al2O3 surface composite produced by friction stir processing. SN Appl. Sci. 2020, 2, 1760. [Google Scholar] [CrossRef]
  21. Kumar, J.; Singh, D.; Kalsi, N.S.; Sharma, S.; Mia, M.; Singh, J.; Rao, K.V. Investigation on the mechanical, tribological, morphological and machinability behavior of stir-casted Al/SiC/Mo reinforced MMCs. J. Mater. Res. Technol. 2021, 12, 930–946. [Google Scholar] [CrossRef]
  22. Prasad Reddy, A.; Vamsi Krishna, P.; Rao, R.N. Tribological behavior of Al6061–2SiC-xGr hybrid metal matrix nanocomposites fabricated through ultrasonically assisted stir casting technique. Silicon 2019, 11, 2853–2871. [Google Scholar] [CrossRef]
  23. Aherwar, A.; Ahirwar, A.; Pathak, V.K. Dry sliding tribological characteristics evaluation and prediction of TiB2-CDA/Al6061 hybrid composites exercising machine learning methods. Sci. Rep. 2025, 15, 16710. [Google Scholar] [CrossRef]
  24. Kumaraswamy, J.; Bharath, L.; Anil, K.C.; Geetha, T.M.; Nagesh, R. Results in mechanical properties and wear behaviour of AA6061-Si3N4 composites. Results Surf. Interfaces 2025, 18, 100376. [Google Scholar] [CrossRef]
  25. Udaya Prakash, J.; Jebarose Juliyana, S.; Saleem, M.; Moorthy, T.V. Optimisation of dry sliding wear parameters of aluminium matrix composites (356/B4C) using Taguchi technique. Int. J. Ambient. Energy 2021, 42, 140–142. [Google Scholar] [CrossRef]
  26. Mohanavel, V.; Ravichandran, M. Optimization of parameters to improve the properties of AA7178/Si3N4 composites employing Taguchi approach. Silicon 2022, 14, 1381–1394. [Google Scholar] [CrossRef]
  27. Reddy, P.V.; Prasad, P.R.; Krishnudu, D.M.; Goud, E.V. An investigation on mechanical and wear characteristics of Al 6063/TiC metal matrix composites using RSM. J. Bio-Tribo-Corros. 2019, 5, 90. [Google Scholar] [CrossRef]
  28. Surya, M.S.; Prasanthi, G.; Gugulothu, S.K. Investigation of mechanical and wear behaviour of Al7075/SiC composites using response surface methodology. Silicon 2021, 13, 2369–2379. [Google Scholar] [CrossRef]
  29. Kumar, M. Mechanical and sliding wear performance of AA356-Al2O3/SiC/graphite alloy composite materials: Parametric and ranking optimization using Taguchi DOE and hybrid AHP-GRA method. Silicon 2021, 13, 2461–2477. [Google Scholar] [CrossRef]
  30. Raju, S.S.; Rao, G.S.; Samantra, C. Wear behavioral assessment of Al-CSAp-MMCs using a grey-fuzzy approach. Measurement 2019, 140, 254–268. [Google Scholar] [CrossRef]
  31. Ahamad, N.; Mohammad, A.; Sadasivuni, K.K.; Gupta, P. Wear, optimization, and surface analysis of Al-Al2O3-TiO2 hybrid metal matrix composites. Proc. Inst. Mech. Eng. Part J J. Eng. Tribol. 2020, 235, 93–102. [Google Scholar] [CrossRef]
  32. Kumar, A.; Kumar, M.; Pandey, B. Investigations on mechanical and sliding wear performance of AA7075-SiC/marble dust/graphite hybrid alloy composites using hybrid ENTROPY-VIKOR method. Silicon 2022, 14, 2051–2065. [Google Scholar] [CrossRef]
  33. Dhilip, J.D.J.; Ganesan, K.P.; Sivalingam, V. Machinability studies and optimization of process parameters in wire electrical discharge machining of aluminum hybrid composites by the VIKOR method. J. Mater. Eng. Perform. 2024, 33, 5547–5562. [Google Scholar] [CrossRef]
  34. ASTM G99; Standard Test Method for Wear Testing with a Pin-on-Disk Apparatus. ASTM International: West Conshohocken, PA, USA, 2017.
  35. Ch, M.R.; Prasad, K.D.; Subbaiah, K.V. Application of integrated entropy-COPRAS and ANN approaches for maximizing wire EDM machinability attributes of Al6082-T6/GNP/TiB2 composites. Eng. Res. Express 2024, 6, 035535. [Google Scholar] [CrossRef]
  36. Soni, S.; Gohil, P. Optimization of reinforcement ratio and stirring speed on mechanical properties of Al-TiB2-B4C hybrid composite using Taguchi–grey relational analysis. Mater. Res. Express 2024, 11, 126510. [Google Scholar] [CrossRef]
Figure 1. Scanning electron microscopic images of the various composites: (a) Al6061 alloy, (b) Al6061 + 1%SiC + 1%Al2O3, (c) Al6061 + 3%SiC + 3%Al2O3, and (d) Al6061 + 5%SiC + 5%Al2O3.
Jcs 09 00297 g001
Figure 2. An experimental workflow chart explaining the preparation of the composites and the analysis of the properties of the composites.
Jcs 09 00297 g002
Figure 3. Flowchart for GRA.
Jcs 09 00297 g003
Figure 4. Flowchart for entropy-VIKOR.
Jcs 09 00297 g004
Figure 5. Main effect plots of (a) the mean of S/N ratios vs. reinforcement, (b) the mean of S/N ratios vs. load, (c) the mean of S/N ratios vs. sliding velocity, and (d) the mean of S/N ratios vs. sliding distance for the grey relational grade (GRG).
Jcs 09 00297 g005
Figure 6. Residual plots of (a) residual vs. percent, (b) fitted value vs. residual, and (c) observation order vs. residual for the grey relational grade (GRG).
Jcs 09 00297 g006
Figure 7. Interaction effects plot for the VIKOR index (Qi).
Jcs 09 00297 g007
Figure 8. Residual plots of (a) residual vs. percent, (b) fitted value vs. residual and (c) observation order vs. residual for VIKOR Index (Qi).
Jcs 09 00297 g008
Figure 9. Surface plots of (a) the VIKOR index (Qi) vs. RF Wt.% and N, (b) the VIKOR index (Qi) vs. RF Wt.% and v, (c) the VIKOR index (Qi) vs. RF Wt.% and SD, (d) the VIKOR index (Qi) vs. N and v, (e) the VIKOR index (Qi) vs. N and SD, (f) the VIKOR index (Qi) vs. v, and the SD for the VIKOR index (Qi).
Jcs 09 00297 g009
Figure 10. Contour plots of (a) reinforcement vs. load, (b) load vs. sliding velocity, (c) reinforcement vs. sliding distance, (d) load vs. sliding velocity, (e) load vs. sliding distance, and (f) sliding velocity vs. sliding distance for the VIKOR index (Qi).
Jcs 09 00297 g010
Figure 11. Experiment number vs. the GRG and the VIKOR index (Qi).
Jcs 09 00297 g011
Figure 12. Fractography of the worn-out surfaces of composites at various conditions of (a) high reinforcement (5%SiC + 5%Al2O3), (b) high load (50 N), and (c) optimal conditions (high reinforcements).
Jcs 09 00297 g012
Table 1. Wear factors with specific levels.
ParameterLevel 1Level 2Level 3
Reinforcement Content, wt.%2610
Normal Load (FN), N103050
Sliding Velocity (v), m/s11.752.5
Sliding Distance (SD), m300525750
Table 2. L27 orthogonal array design.
S. No.RF Wt.%NvSD
12101300
22101.75525
32102.5750
42301525
52301.75750
62302.5300
72501750
82501.75300
92502.5525
106101525
116101.75750
126102.5300
136301750
146301.75300
156302.5525
166501300
176501.75525
186502.5750
1910101750
2010101.75300
2110102.5525
2210301300
2310301.75525
2410302.5750
2510501525
2610501.75750
2710502.5300
Table 3. Empirical findings of responses.
S. No.V, mm3WR, mm3/mCOF
19.43470.03140.4583
27.99170.01520.5251
36.51180.00870.5918
46.84480.0130.4984
55.36480.00720.5206
65.66080.01890.4995
74.25480.00570.5064
84.51380.0150.4937
93.07090.00580.507
106.32890.01210.3169
114.89380.00650.3837
125.18820.01730.3202
133.75320.0050.4513
144.04750.01350.4301
152.57570.00490.4523
162.90690.00970.4521
171.47180.00280.4654
180.07360.00010.4788
193.27940.00440.1756
203.57090.01190.112
212.11340.0040.1788
222.44130.00810.3607
230.98380.00190.383
240.43730.00060.4052
250.14580.00030.4238
261.56680.00210.4371
271.27530.00430.4244
Table 4. Normalized (Nij) and loss functions (∆) of responses.
S. No.Normalization (Nij)Loss Function (∆)
VWRCOFVWRCOF
10.00000.00000.27821.00001.00000.7218
20.15410.51760.13900.84590.48240.8610
30.31220.72520.00000.68780.27481.0000
40.27670.58790.19470.72330.41210.8053
50.43480.77320.14840.56520.22680.8516
60.40310.39940.19240.59690.60060.8076
70.55330.82110.17800.44670.17890.8220
80.52570.52400.20450.47430.47600.7955
90.67980.81790.17670.32020.18210.8233
100.33180.61660.57290.66820.38340.4271
110.48510.79550.43370.51490.20450.5663
120.45360.45050.56610.54640.54950.4339
130.60690.84350.29280.39310.15650.7072
140.57550.57190.33700.42450.42810.6630
150.73270.84660.29070.26730.15340.7093
160.69730.69330.29120.30270.30670.7088
170.85060.91370.26340.14940.08630.7366
181.00001.00000.23550.00000.00000.7645
190.65750.86260.86740.34250.13740.1326
200.62640.62301.00000.37360.37700.0000
210.78210.87540.86080.21790.12460.1392
220.74710.74440.48170.25290.25560.5183
230.90280.94250.43520.09720.05750.5648
240.96110.98400.38890.03890.01600.6111
250.99230.99360.35010.00770.00640.6499
260.84050.93610.32240.15950.06390.6776
270.87160.86580.34890.12840.13420.6511
Table 5. GRC values of responses and GRG values of alternatives.
S. No.Grey Relational Coefficients (GRC)GRG
VWRCOF
10.33330.33330.40920.3586
20.37150.50890.36740.4159
30.42100.64540.33330.4666
40.40870.54820.38300.4466
50.46940.68790.36990.5091
60.45580.45430.38240.4308
70.52820.73650.37820.5476
80.51320.51230.38590.4705
90.60960.73300.37790.5735
100.42800.56600.53930.5111
110.49270.70980.46890.5571
120.47780.47640.53540.4965
130.55990.76160.41420.5785
140.54080.53870.42990.5032
150.65160.76530.41350.6101
160.62290.61980.41360.5521
170.77000.85290.40430.6757
181.00001.00000.39540.7985
190.59350.78450.79040.7228
200.57230.57011.00000.7142
210.69650.80050.78220.7597
220.66410.66170.49100.6056
230.83720.89680.46960.7345
240.92790.96900.45000.7823
250.98480.98740.43480.8023
260.75810.88670.42460.6898
270.79570.78840.43440.6728
Table 6. Means of S/N proportions for GRG.
LevelRF wt.%NvSD
1−6.660−5.364−5.108−5.633
2−4.725−4.929−4.813−4.440
3−2.876−3.968−4.339−4.187
3.7841.3960.7691.446
Rank1342
Table 7. ANOVA for GRG.
SourceDFAdj SSAdj MSFp
Model140.4003600.02859713.390.000
Linear40.3707820.09269543.390.000
RF wt.%10.2849620.284962133.400.000
N10.0338260.03382615.830.002
v10.0120440.0120445.640.035
SD10.0399500.03995018.700.001
Square40.0103690.0025921.210.355
RF wt.% × RF wt.%10.0003510.0003510.160.693
N × N10.0027290.0027291.280.280
V × v10.0005740.0005740.270.614
SD × SD10.0067160.0067163.140.102
Square40.0103690.0025921.210.355
2-way Interaction60.0192090.0032021.500.259
RF wt.% × N10.0150130.0150137.030.021
RF wt.% × v10.0004980.0004980.230.638
RF wt.% × SD10.0003670.0003670.170.686
N × v10.0000690.0000690.030.861
N × SD10.0026240.0026241.230.289
v × SD10.0039300.0039301.840.200
Error120.0256340.002136
Total260.425995
Table 8. Normalization (fij) and entropy indices (Ie) values of responses.
S. No.Normalization (fij)Entropy Indices (Ie)
VWRCOFVWRCOF
10.41030.55060.2045−0.22184−0.27162−0.13037
20.34760.26650.2343−0.20108−0.17935−0.14302
30.28320.15250.2641−0.17709−0.12372−0.1549
40.29770.22790.2224−0.18275−0.16221−0.13806
50.23330.12620.2323−0.15622−0.1083−0.14219
60.24620.33140.2229−0.16182−0.20513−0.13827
70.18500.09990.2260−0.13369−0.09152−0.13956
80.19630.26300.2203−0.13918−0.17785−0.13717
90.13360.10170.2262−0.10643−0.09269−0.13967
100.27520.21220.1414−0.1739−0.15475−0.10054
110.21280.11400.1712−0.14697−0.10066−0.11521
120.22560.30330.1429−0.1528−0.19441−0.10129
130.16320.08770.2014−0.1226−0.08312−0.12899
140.17600.23670.1919−0.12918−0.16624−0.12477
150.11200.08590.2018−0.09377−0.08189−0.12919
160.12640.17010.2017−0.10233−0.13336−0.12915
170.06400.04910.2077−0.06176−0.0536−0.13175
180.00320.00180.2136−0.00528−0.00336−0.13434
190.14260.07720.0784−0.11152−0.07559−0.06492
200.15530.20870.0500−0.11841−0.15305−0.04588
210.09190.07010.0798−0.08109−0.07037−0.06582
220.10620.14200.1609−0.09017−0.1177−0.11028
230.04280.03330.1709−0.04522−0.03957−0.11506
240.01900.01050.1808−0.02362−0.0155−0.1197
250.00630.00530.1891−0.00947−0.00865−0.1235
260.06810.03680.1950−0.06477−0.04282−0.12618
270.05550.07540.1894−0.05533−0.0743−0.12362
Table 9. Utility (Si), regret (Ri) measures, and VIKOR index (Qi) values of alternatives.
S. No.Utility Measure (Si)Regret Measure (Ri)VIKOR Index (Qi)
10.97970.53801.0000
20.65130.32930.6127
30.48810.26780.4628
40.56180.28160.5164
50.40390.22010.3693
60.61410.32310.5864
70.32980.17390.2828
80.49850.25610.4566
90.28230.12470.2077
100.49740.26020.4601
110.35150.20050.3213
120.53980.29560.5186
130.28850.15300.2395
140.44370.23030.4010
150.23800.10410.1630
160.33430.16500.2763
170.15800.05820.0737
180.05540.05550.0156
190.21680.13330.1810
200.34820.20280.3218
210.16190.08480.1025
220.27360.13750.2158
230.10970.04100.0303
240.06800.04440.0112
250.05360.04720.0062
260.14560.06210.0709
270.16940.07210.0938
Table 10. ANOVA findings regarding the VIKOR Index (Qi).
SourceDFAdj SSAdj MSFp
Model141.412620.100902214.670.000
Linear41.273360.318339677.260.000
RF wt.%10.665500.6654951415.840.000
N10.346500.346502737.180.000
v10.057400.057396122.110.000
SD10.203960.203962433.930.000
Square40.049920.01248026.550.000
RF wt.% × RF wt.%10.006450.00644613.710.003
N × N10.002940.0029386.250.028
v × v10.000010.0000110.020.881
SD × SD10.040530.04052686.220.000
2-way Interaction60.089350.01489131.680.000
RF wt.% × N10.040390.04039085.930.000
RF wt.% × v10.005220.00522011.110.006
RF wt.% × SD10.020690.02069544.030.000
N × v10.002540.0025385.400.039
N × SD10.009760.00975920.760.001
v × SD10.000790.0007851.670.221
Error120.005640.000470
Total261.41826
Table 11. Ranking of alternatives in GRA and entropy-VIKOR analysis.
S. No.Ranking
Grey AnalysisEntropy-VIKOR AnalysisS. No.Grey AnalysisEntropy-VIKOR Analysis
1272715119
22626161614
323221796
424231823
5191819610
6252520717
717152148
82220221212
914112354
1018212432
1115162511
1221242685
13131327107
142019
Disclaimer/Publisher’s Note: The statements, opinions and data contained in all publications are solely those of the individual author(s) and contributor(s) and not of MDPI and/or the editor(s). MDPI and/or the editor(s) disclaim responsibility for any injury to people or property resulting from any ideas, methods, instructions or products referred to in the content.

