Article

The Effects of Fiber Concentration, Orientation, and Aspect Ratio on the Frontal Polymerization of Short Carbon-Fiber-Reinforced Composites: A Numerical Study

Department of Aerospace Engineering and Mechanics, The University of Alabama, Tuscaloosa, AL 35487, USA
*
Author to whom correspondence should be addressed.
J. Compos. Sci. 2025, 9(6), 307; https://doi.org/10.3390/jcs9060307
Submission received: 24 May 2025 / Revised: 11 June 2025 / Accepted: 14 June 2025 / Published: 17 June 2025

Abstract

The cure kinetics in frontal polymerization (FP) of short carbon-fiber-reinforced composites are investigated numerically, focusing on the influence of fiber aspect ratio, volume fraction, and orientation. A classical heat conduction equation is used in FP, where the enthalpic reaction generates heat. The heat generation term is expressed in terms of the rate of degree of cure ( d α / d t ) in thermoset resin. A rate equation of the degree of cure for epoxy is established in terms of a pre-exponential factor, activation energy, Avogadro’s gas constant, and temperature. The cure kinetics parameters for epoxy resin used in this study are determined using the Ozawa method. The numerical model was validated with experimental data. The results reveal that the aspect ratio of fibers has a minimal effect on the polymerization time. The volume percentage of fibers significantly influences the curing time and temperature distribution, with higher fiber volume fractions leading to faster curing due to enhanced heat transfer. Additionally, fiber orientation plays a critical role in cure kinetics, with specific angles facilitating more effective heat transfer, thereby influencing the curing rate and frontal velocity. The results offer valuable insights into optimizing the design and manufacturing processes for high-performance epoxy-based composites through FP, where precise control over curing is critical.

1. Introduction

Frontal polymerization (FP) is an innovative polymerization technique to convert monomers into polymers through a self-sustaining and propagating reaction front. This method shows several distinct advantages over conventional polymerization methods. One of the primary advantages of FP is its energy efficiency [1,2]. Traditional polymerization requires substantial external heat input to initiate and maintain the reaction. In contrast, FP leverages the exothermic nature of the polymerization reaction itself to generate heat, thereby reducing the amount of external energy needed [3,4].
The curing process and fiber reinforcement significantly influence the performance of neat epoxy resins. Different curing agents and methods can lead to variations in the properties of the cured epoxy, which can affect its suitability for high-performance applications [5,6,7]. Incorporating fiber reinforcement, particularly carbon fibers, significantly enhances the mechanical properties of epoxy resins. The aspect ratio, volume percentage, and orientation of the fibers are essential parameters that affect the performance of the composite material [8]. Higher aspect ratios and volume percentages of fibers typically result in enhanced tensile strength and stiffness of the epoxy matrix [9]. The mechanical performance of fiber-reinforced composites is strongly influenced by fiber volume fraction (Vf), aspect ratio, and orientation [10,11]. Bidirectional carbon/epoxy woven composites have shown enhanced mechanical properties due to the effective load transfer between the fibers and the epoxy matrix [12]. Moreover, the orientation of the fibers can dictate the directional strength of the composite; unidirectional fibers can provide superior strength along their length, while woven fibers can offer balanced properties in multiple directions [13].
Developing theoretical models that accurately describe the cure kinetics of composites in FP and the factors influencing void formation and residual stress are paramount to advancing this manufacturing technique. Cure kinetics modeling in FP involves understanding the chemical reactions at the molecular level, including the initiation, propagation, and termination phases of the polymerization process. Several factors, such as the temperature of the reaction front, the concentration of the initiator, and the reactivity of the monomer or resin system, influence the rate at which these reactions occur [8,14,15]. Advanced theoretical models must accurately capture these dynamics to predict the speed of the reaction front and the degree of cure achieved as the polymerization front progresses [2,16,17,18]. This requires the integration of chemical kinetic theories with heat transfer models to describe the self-propagating nature of FP. Developing predictive tools using reliable theoretical models for designing and manufacturing FP-processed composites represents a significant advancement for the field. By enabling the simulation of FP under various conditions, these tools can guide the selection of materials, the design of composite structures, and the optimization of process parameters [17,19,20,21,22]. This capability would significantly reduce the need for trial-and-error experimentation, speeding up the development of new composite materials and structures and ensuring that they meet the required performance specifications.
To build such reliable numerical models, it is necessary first to obtain accurate cure kinetics parameters for the resin system. These parameters—such as activation energy, reaction order, and pre-exponential factors form the foundation of the cure kinetics submodels within FP simulations. The Ozawa method is commonly used to investigate the cure kinetics of thermoset polymers. This method involves assessing the kinetics of the curing reaction by examining the relationship between the degree of cure and temperature [23]. Researchers have applied the Ozawa method to study the curing behavior of various thermoset polymers, aiming to determine the essential kinetic parameters that govern the curing process [24,25]. For example, research has focused on the non-isothermal curing kinetics of novel polymers containing specific chemical units, where the average activation energy values determined by the Ozawa method were crucial for understanding the curing behavior [26]. Additionally, the Ozawa method has been used to evaluate the kinetic parameters of cyanate ester resin [27]. In the context of FP, some of the key cure kinetics parameters for epoxy resins include determining the activation energy and reaction order. Studies have shown that the Ozawa method and other techniques, such as the Kissinger and Flynn–Wall–Ozawa methods, have been instrumental in calculating these parameters for epoxy resin systems [12]. By utilizing the Ozawa method, researchers have gained a deeper understanding of the curing behavior of epoxy resins, enabling them to optimize processing conditions and enhance the mechanical properties of composite materials. Overall, the Ozawa method plays a significant role in characterizing the cure kinetics of thermoset polymers, particularly epoxy resins, and has been instrumental in advancing research on curing processes in various applications [28,29].
Finite Element Analysis (FEA) is a powerful theoretical tool for predicting the curing behavior of thermosetting polymers, particularly in systems reinforced with continuous fibers. It enables the analysis of complex thermal and chemical interactions, helps optimize curing cycles, and minimizes defects such as residual stress and voids. Studies by Patham and Zhang have shown how multi-physics FEA and viscoelastic modeling can predict cure-induced stresses and material behavior during processing [30,31]. When continuous fibers are integrated, FEA also aids in simulating interfacial bonding and load transfer [32]. Greenfeld and Xiao also examined how curing dynamics influence stiffness and structural performance [33,34].
Recent research has applied FEA to simulate frontal polymerization in unidirectional and cross-ply carbon fiber laminates, showing that triggering along the fiber direction increases front velocity, and further analyzing the interplay between heat loss and exothermic heat generation [35,36]. Some works also further analyzed the balance between heat loss and exothermic heat generation, key to understanding front stability and propagation efficiency [19]. Additionally, advanced techniques such as photothermal curing and localized heating have been shown to rapidly initiate curing in complex geometries, improving processing speed and material integrity [2,37]. FEA provides critical insight into the curing mechanisms of thermosetting composites, facilitating the design of optimized processes, tailored material properties, and structurally sound components for high-performance applications.
The numerical simulation of the cure kinetics in FP for short fiber composites is rarely reported in the literature [21,38,39]. Most theoretical studies in FP have primarily focused on neat epoxy resin and continuous fiber-reinforced composites. In this study, we further investigate the influence of short carbon fibers (SCFs) on the FP of epoxy composites. Specifically, the effects of fiber aspect ratio, orientation angle, and volume fraction on the curing time and front velocity are systematically analyzed. A Python script was developed using “PyCharm (version 2023)” to randomly distribute SCFs within the matrix, representing realistic microstructural configurations. FEM simulations were conducted in ABAQUS, incorporating user-defined material subroutines to model the thermal and chemical behavior of the system. The simulation results were validated against experimental data, confirming the model’s ability to predict the curing dynamics in SCF-reinforced epoxy systems [40]. This work aims to establish a predictive framework for optimizing FP-based short fiber composite manufacturing, combining experimental and simulation work. It advances the understanding of how reinforcement parameters influence the curing process and guides the design of next-generation polymer composites tailored for aerospace and other high-performance applications.

2. Theory

The heat transfer in thermoset resin during the initiation and propagation of frontal polymerization is governed by the following thermochemical heat conduction equation, where the enthalpic reaction generates heat.
ρ C p T t = k 2 T + Q
In Equation (1):
ρ is the density of the material (kg/m3).
Cp is the specific heat capacity of the material (J/kg·K).
T is the temperature (K).
t is the time (s).
k is the thermal conductivity of the material (W/m·K).
2T is the Laplacian of the temperature field (K/m2).
Q is the heat generation term due to the exothermic reaction (W/m3).
The heat generation term Q can be defined as the rate of exothermic reaction as follows:
Q = ρ H r d α d t
where,
Hr = Enthalpy change.
d α d t = rate of cure.
Since the exothermic reaction primarily occurs in the resin, the heat generation rate is directly influenced by the resin density ( ρ ). The density also affects the total heat capacity of the system, thereby influencing local temperature rise during polymerization. Together with the specific heat, it governs how the released heat alters the temperature field within the composite.
The curing phenomenon in FP involves the crosslinking of molecules in the thermoset resin, leading to an exothermic reaction, chemical shrinkage, and the development of thermophysical and thermomechanical properties. Forming a network structure through the curing reaction of epoxy and amine compounds is vital to the heat transfer mechanisms in thermosetting resins. The rate of cure in Equation (2), d α d t , can be expressed as follows:
d α d t = A   e x p ( E a R T ) f ( α )
where A is the pre-exponential factor, E a is the activation energy, R is the Avogadro gas constant, and T is the temperature. Like most thermosetting resins, epoxy resin follows autocatalytic kinetics [12,41,42]. So, the equation for f(α) is expressed as follows:
f ( α ) = ( 1 α ) m α n
f(α) reflects the classical PT model. The Prout–Tompkins (PT) model is widely used for describing the cure kinetics of thermosetting polymers, particularly those that exhibit autocatalytic behavior, such as epoxy–amine systems. The degree of cure (DOC), which quantifies the extent of the crosslinking reaction from 0 (uncured) to 1 (fully cured), is a key variable in this model. The PT model empirically relates the reaction rate to both DOC and temperature, keeping track of the acceleration of the reaction due to the chemical reaction kinetics of monomers and curing agents. By incorporating parameters that account for the autocatalytic nature of the system, the PT model enables accurate predictions of curing behavior under varying thermal conditions. The selected epoxy resins m and n reaction orders are determined using the DSC (Differential Scanning Calorimetry) data and the Ozawa method.

3. Determination of FP Cure Kinetics Reaction Parameters
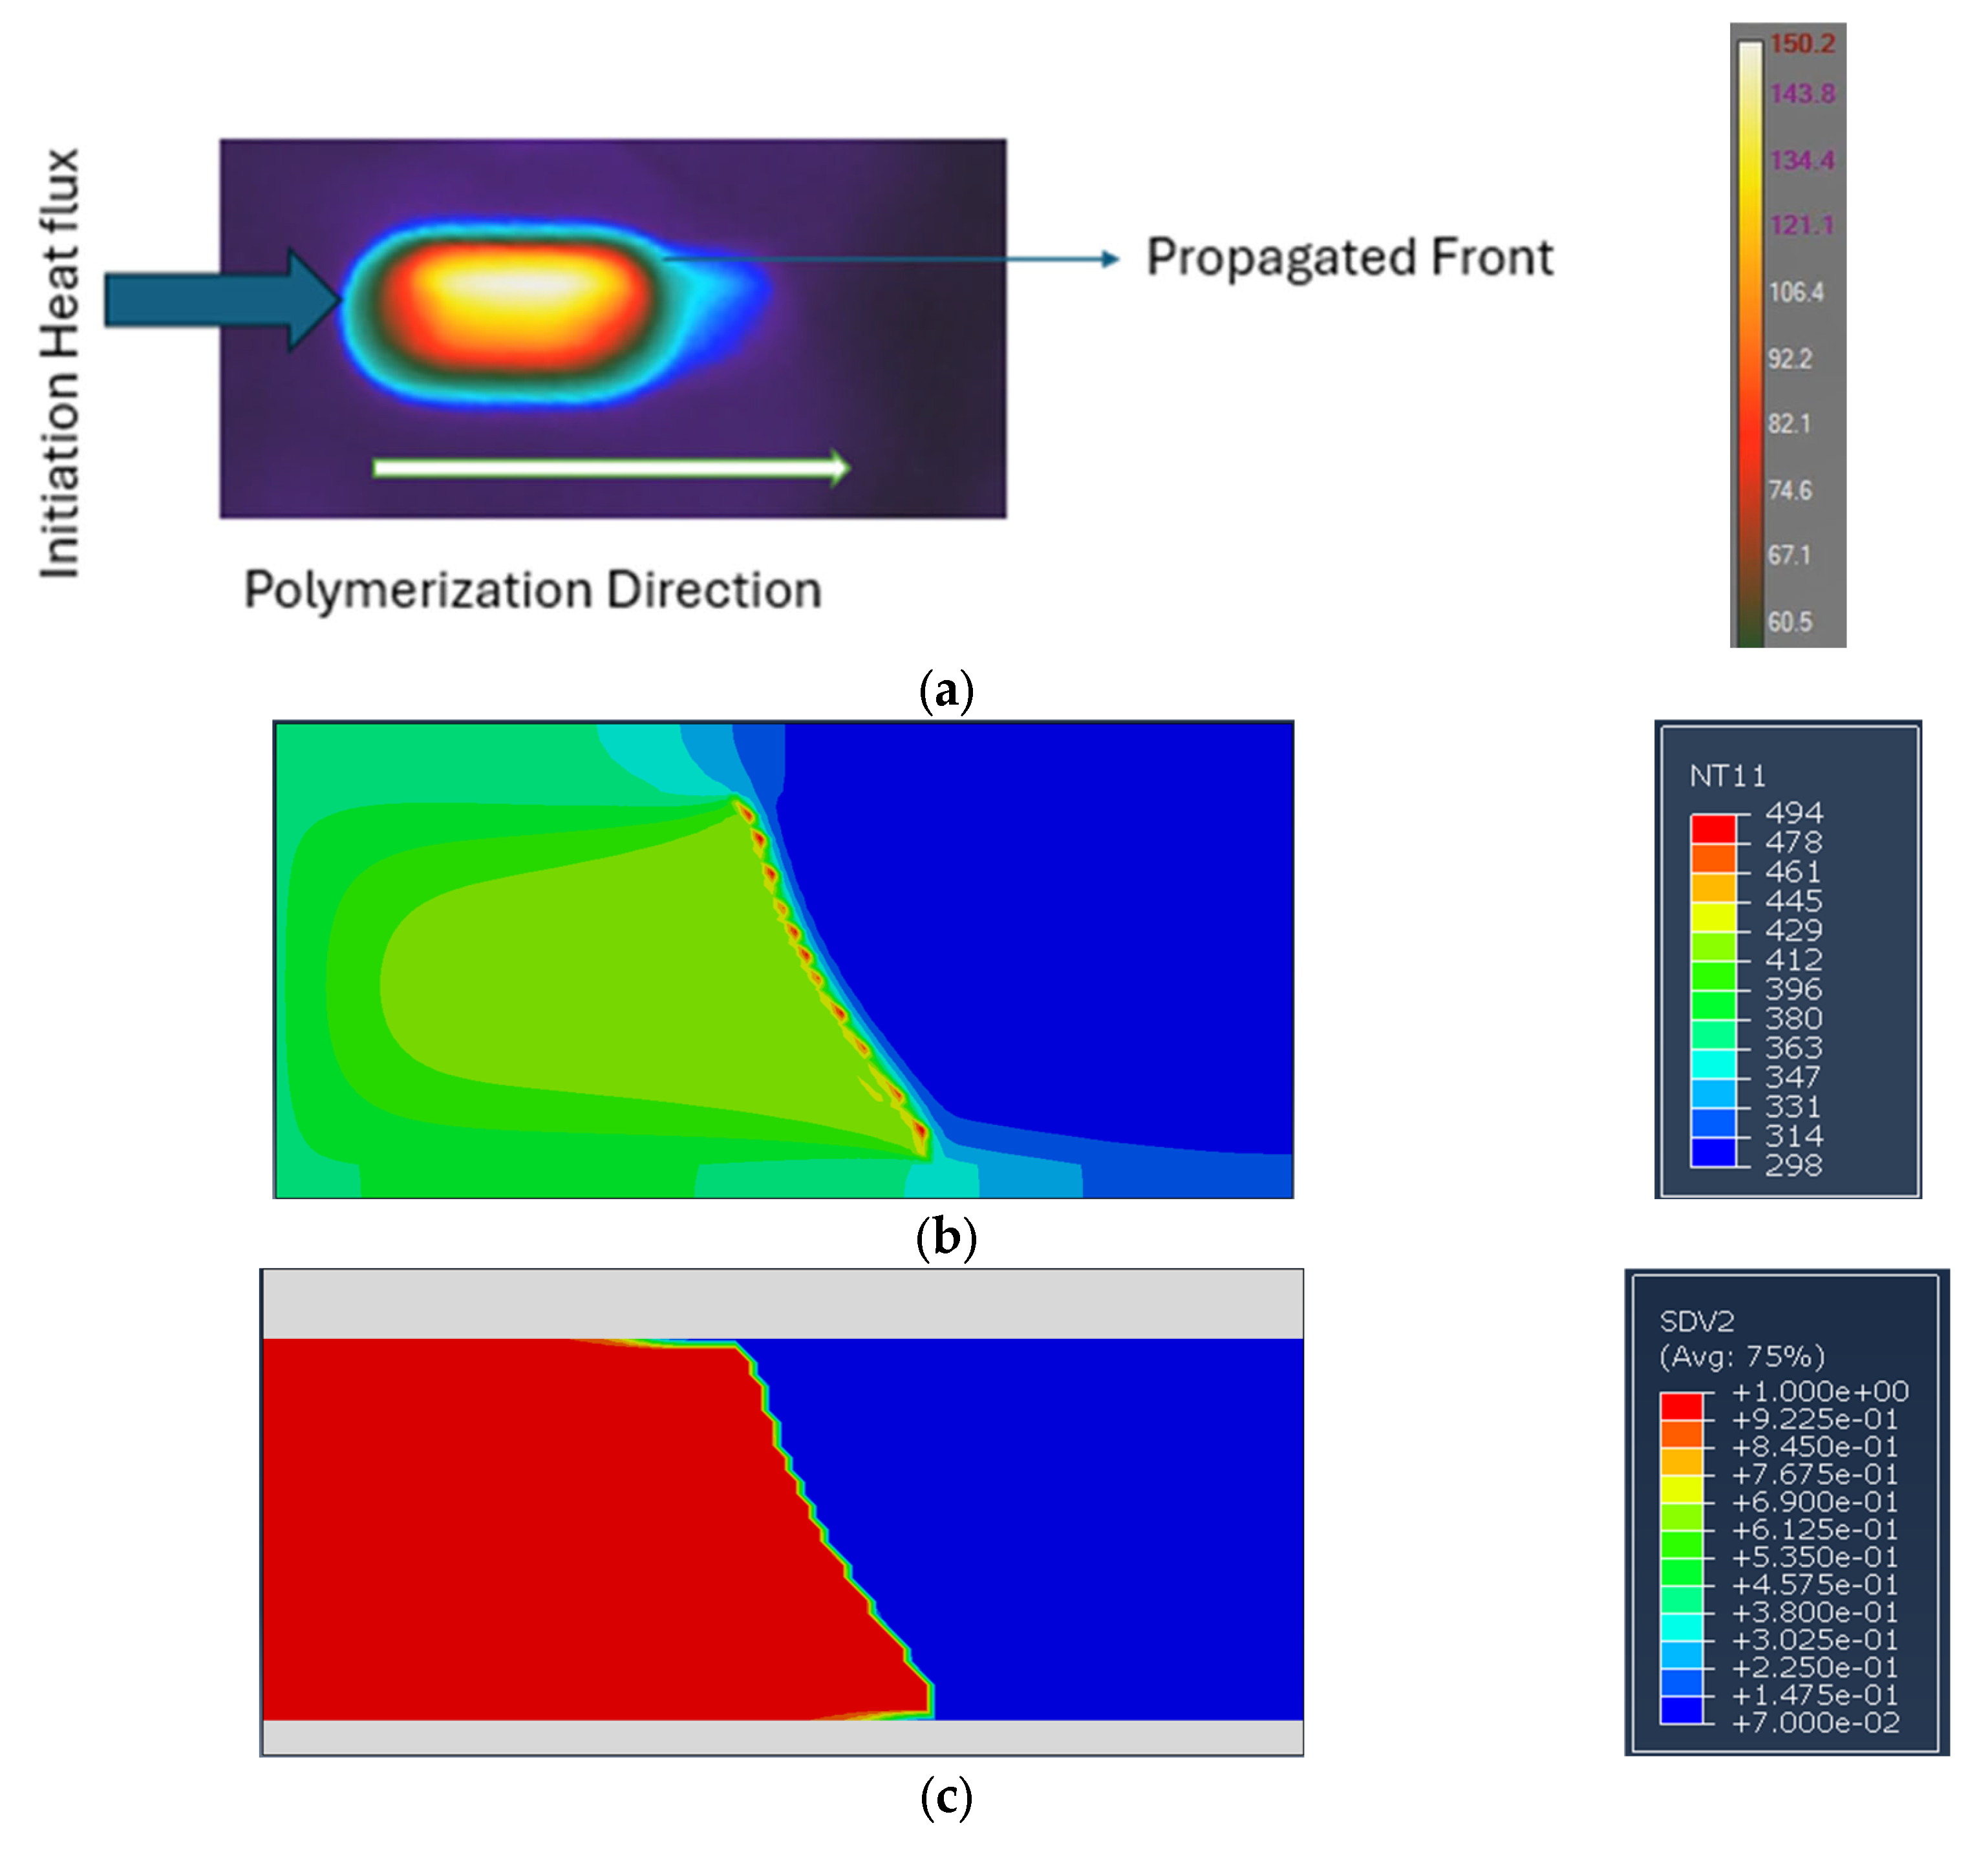
Numerical simulation of the FP curing process requires determining the reaction parameters for the specific epoxy group, thermal initiator, and cationic initiator used as reactants. The thermal initiator TPED (tetraphenyl ethylene diamine) and a cationic initiator (Bis[4-(tert-butyl) phenyl iodonium Tetra (nonafluoro-tertbutoxy) aluminate) work synergistically to facilitate the FP of epoxy resin. TPED generates the reaction conditions necessary for activating cationic initiators through thermal decomposition, without directly interacting with the monomers. Upon activation, the cationic initiator produces cationic species that open the epoxide rings of the epoxy monomers (e.g., Epon 828), allowing them to react with other monomers or growing polymer chains. This key interaction, catalyzed by the cationic species, initiates the polymerization process, in which monomer units link together to form polymer chains. The heat generated during this reaction further decomposes TPED, sustaining the polymerization process. This study determined the reaction parameters for Epon 828, the thermal initiator TPED, and the cationic initiator for the numerical simulation of FP cure kinetics.
The critical parameters in FP reaction kinetics include the apparent activation energy (Ea), the frequency or pre-exponential factor (A), and the reaction order (m and n). Apparent activation energy is a threshold for the reaction to occur. A higher frequency factor results in a faster reaction rate. The cure kinetics models always follow the basic equation.
Figure 1 represents the DSC data of the epoxy resin, with the X-axis representing temperature and the Y-axis representing heat flow. This data is obtained at a heating rate of 20 °C/min. DSC data enables the determination of the degree of cure using Equation (5). The term β in Equation (5) refers to the heating rate. It is easier to detect the change in the degree of cure with temperature changes using DSC data. So, the degree of cure can be determined using Equation (6).
α = H H
d α d t = d T d t × d α d T = β × d α d T
Substituting Equation (6) into Equation (7) and then taking the logarithm of both sides yields
β d α d T = A   e x p ( E a R T ) f ( α )
ln β d α d T = ( ln A f α E a R T
Here, ln (A*f(α)) is the conversion rate function. To determine the energy of activation ( E a ), the conversion rate function is assumed to be constant. From the DSC data at different α values, ln(β) vs. 1/T is plotted in Figure 2a. The slope of that plot will be the E a value at that degree of cure. The activation energy of the reaction is the average of the E a values. Figure 2b also shows the different E a values at different α values.
Figure 1. DSC data for epoxy resin at heating rate of 20 °C/min.
Jcs 09 00307 g001
The activation energy is also determined using the Ozawa method. According to the Kissinger method, activation energy is obtained from the maximum reaction rate, where d(dα/dt)/dt is zero at a constant heating rate, and the reaction rate is assumed to be maximum at the peak temperature ( T P ). But these two methods give very close values [26]. That is why only Ozawa’s methods are used in this current study.
Substituting Equation (4) into Equation (3) and then taking the logarithm of both sides yields
l n ( d α / d t ) = l n A E a / R T + n l n ( 1 α ) + m l n α
Then,
l n ( d ( α ( f ) ) / d t = l n A E a / R T + n l n ( 1 α ( f ) ) + m l n ( α ( f ) )
where α(f) is the fractional extent conversion at a given temperature T’. Assume α(f) = 1 – α; then, Equation (10) becomes
l n ( d ( 1 α ) / d t ) = l n A E a / R T + n l n ( α ) + m l n ( 1 α )
By subtracting and adding Equation (9) and Equation (11),
E a R T + ln d α d t E a R T + ln d α ( f ) d t = n m ln 1 α α
E a R T + ln d α d t + E a R T + ln d α ( f ) d t = 2 l n A + n + m ln ( 1 α ) α
E a R T + ln d α d t E a R T + ln d α ( f ) d t = Value-1
E a R T + ln d α d t + E a R T + ln d α ( f ) d t = Value-2
So, the plot of value-1 and ln 1 α α will give (m − n). (m − n) will be the slope of the trendline. Then, the plot of value-2 and ln ( 1 α ) α will be constructed. The (m + n) will be the slope of the trendline, and 2*ln(A) will be the interception. The plots are shown in Figure 3.
ln A, m, and n values of the cure kinetics of epoxy are shown in Table 1 below:
The cure kinetics equation for epoxy is
d α d t = ( 2.63 × 10 13 )   ×   exp   ( 98   KJ / mol ) / RT )   ×   ( 1     α ) 1.93   α 0.87
The experimental and calculated values at different heating rates are shown in Figure 4.

4. Simulation Model

The flow chart in Figure 5 illustrates a numerical procedure implemented in ABAQUS for simulating the curing process of a thermoset resin using frontal polymerization. It begins by calling USDFLD at each nodal point and retrieving curing parameters from ABAQUS, along with the nodal temperature from the previous increment. The rate of conversion (dα/dt) is then solved using a given equation, and the last nodal conversion value α is updated based on the current rate and time increment (Δt). HETVAL is called, and the internal heat flux is calculated using the updated cure rate. Subsequently, the local temperature change is updated to account for heat transfer and internal heat flux, and Δt is incremented to represent the passage of time. This process is repeated for each node until all nodes have been calculated, iterating to the next node if not all are completed.
The process begins with the generation of short fibers using a Python script. Each fiber is represented as a rectangle with specific dimensions randomly generated within a predefined area. To ensure the model’s accuracy, it is checked that no fibers (rectangles) overlap. The number of fibers can be adjusted to achieve the required volume percentage in the composite. An additional function applies trigonometric transformations to model the orientation of the fibers, rotating each fiber at a specified angle. This ensures that each fiber is positioned with the desired orientation. The schematic of the model is shown in Figure 6b.
Once the fiber geometry is generated, the data is incorporated into ABAQUS. In Abaqus, the fibers and matrix regions are partitioned based on the generated geometry. The remaining steps in the simulation workflow, including component assembly, step definition, boundary condition application, loading, meshing, and job creation, are completed manually within the ABAQUS interface.
The simulation in ABAQUS involves specific boundary and initial conditions for modeling the curing process of a thermoset resin using frontal polymerization. The initial temperature ( T 0 ) is set to 298 K (25 °C), while the initiation temperature is 413 K (140 °C), with a triggering time of 10 s. The initial degree of conversion ( α 0 ) is 0.07. Additionally, the model’s entire left and right sides are kept insulated to ensure no heat loss through these boundaries. These conditions are crucial for accurately simulating the thermal and curing behavior of the thermoset resin during the frontal polymerization process.
The dimensions of the geometric model for both continuous and short fiber orientations are shown in Figure 6. The model in Figure 6a comprises three materials: epoxy resin (monomer), glass, and continuous carbon fiber. The properties used in the simulation are also listed in Table 2. The mesh size in epoxy was 0.1 mm × 0.1 mm, but for glass and CCF, it was 0.2 mm × 0.1 mm. The run time was 30 s. The results obtained after the triggering time were considered, as no polymerization occurs before the triggering temperature is reached.

5. Model Validation

For verification, the model’s results were compared with experimental data, as shown in Figure 7. The experimental setup and procedures used in this study were described in detail in our previously published work [40]. The curing parameters were derived from pure epoxy DSC data. The numerical values closely matched the experimental results when the simulation included the carbon fiber composite (CCF).
As depicted in Figure 7a, the degree of cure (α) and temperature propagated faster near the CCF and more slowly near the glass region. The maximum temperature was observed in the middle area, indicated by dark yellow, which is already cured. The temperature at the left edge decreases once the initiation heat dissipates after the triggering time. In the numerical results, the highest temperatures are seen at the curing fronts, where the cure rate is elevated. The temperature in cured polymers is observed to be 430 K (157 °C). The temperature on the front is observed to be slightly higher because, at that position, the curing rate is at its maximum.
The heat generated dissipates more quickly in regions close to the glass and CCF, resulting in lower temperatures in these areas in both experimental and numerical results. The numerical values show higher temperatures, which can be attributed to the camera’s limitations in capturing microscale phenomena. As a result, the temperature of the front is not captured with the camera. This occurs because the propagation front is confined to a tiny region.
Additionally, the velocity closely aligns with the experimental results. The average frontal velocity is very close to the experimental value (a 10% difference), as shown in Figure 8. The discrepancy is primarily due to the heat loss effect and variation in the sample size. The model size is only 15 mm, but the sample is 75 mm long in the experiment. Moreover, this difference arises due to the heat loss effect during the experiment, whereas the heat loss effect is ignored in the simulation. As is shown in Equation (3), the rate of cure depends on the temperature. As the heat loss to the air is not considered in the model, the generated heat will only flow into the nearest uncured region. As a result of that, the temperature in the model is higher compared to the experimental case. In the experiment, the generated heat due to curing dissipates into the air through the test tube. It is to be noted that the governing differential equation (Equation (1)) and boundary conditions (three sides concealed and triggering temperature applied on the remaining side) applied to both CCF/epoxy composites and SCF/Ep composites were the same in the geometric model of numerical simulations, except for the fiber geometry. The short fiber geometric configurations are modeled in our numerical simulation, as described earlier. So, the model validation applied to CCF/Ep is also reasonably valid for SCF/Ep composites.

6. Results and Discussion

The effects of fiber concentrations, orientations, and aspect ratios of short carbon fibers on curing time, reaction temperature, and frontal velocity were analyzed, as shown in Table 3. The geometric model was 15 mm × 5 mm, as shown in Figure 6b. The initiation temperature and time were kept at 423 K (150 °C) and 10 s, respectively. The boundary conditions were the same as those in the model validation.
The following assumptions are considered in this work:
  • All short carbon fibers are assumed to have a constant diameter (based on manufacturer datasheets), and their lengths are varied systematically to achieve specific aspect ratios ranging from 50 to 500. Fibers are modeled as straight, rigid rods with no curvature, waviness, or tapering, ensuring uniform geometry across simulations.
  • Fibers are distributed within the matrix domain using a randomly aligned, non-overlapping algorithm that does not account for physical agglomeration or clustering effects commonly observed in real composite manufacturing. Each fiber acts independently, with no interaction or contact with neighboring fibers.
  • This study assumes in-plane (2D) fiber alignment at defined angles (e.g., 0°, 15°, 30°) to enable controlled evaluation of orientation effects. This assumption is relevant to processes with partial fiber alignment.
Table 3. Summary of parametric study on the effects of short fibers in epoxy composites.
Variations in Fiber
Concentration (Vf) Analyzed When Aspect Ratio Is 100 and Orientation Angle Is 0°
Variations in Fiber Orientation (FO) Analyzed When Fiber Volume Is 20% and the Aspect Ratio Is 50Variations in Aspect Ratio (AR) Analyzed When Fiber Volume Is 20% and Orientation Angle Is 0°
10%50
20%15°100
30%30°200
45°300
60°400
75°500

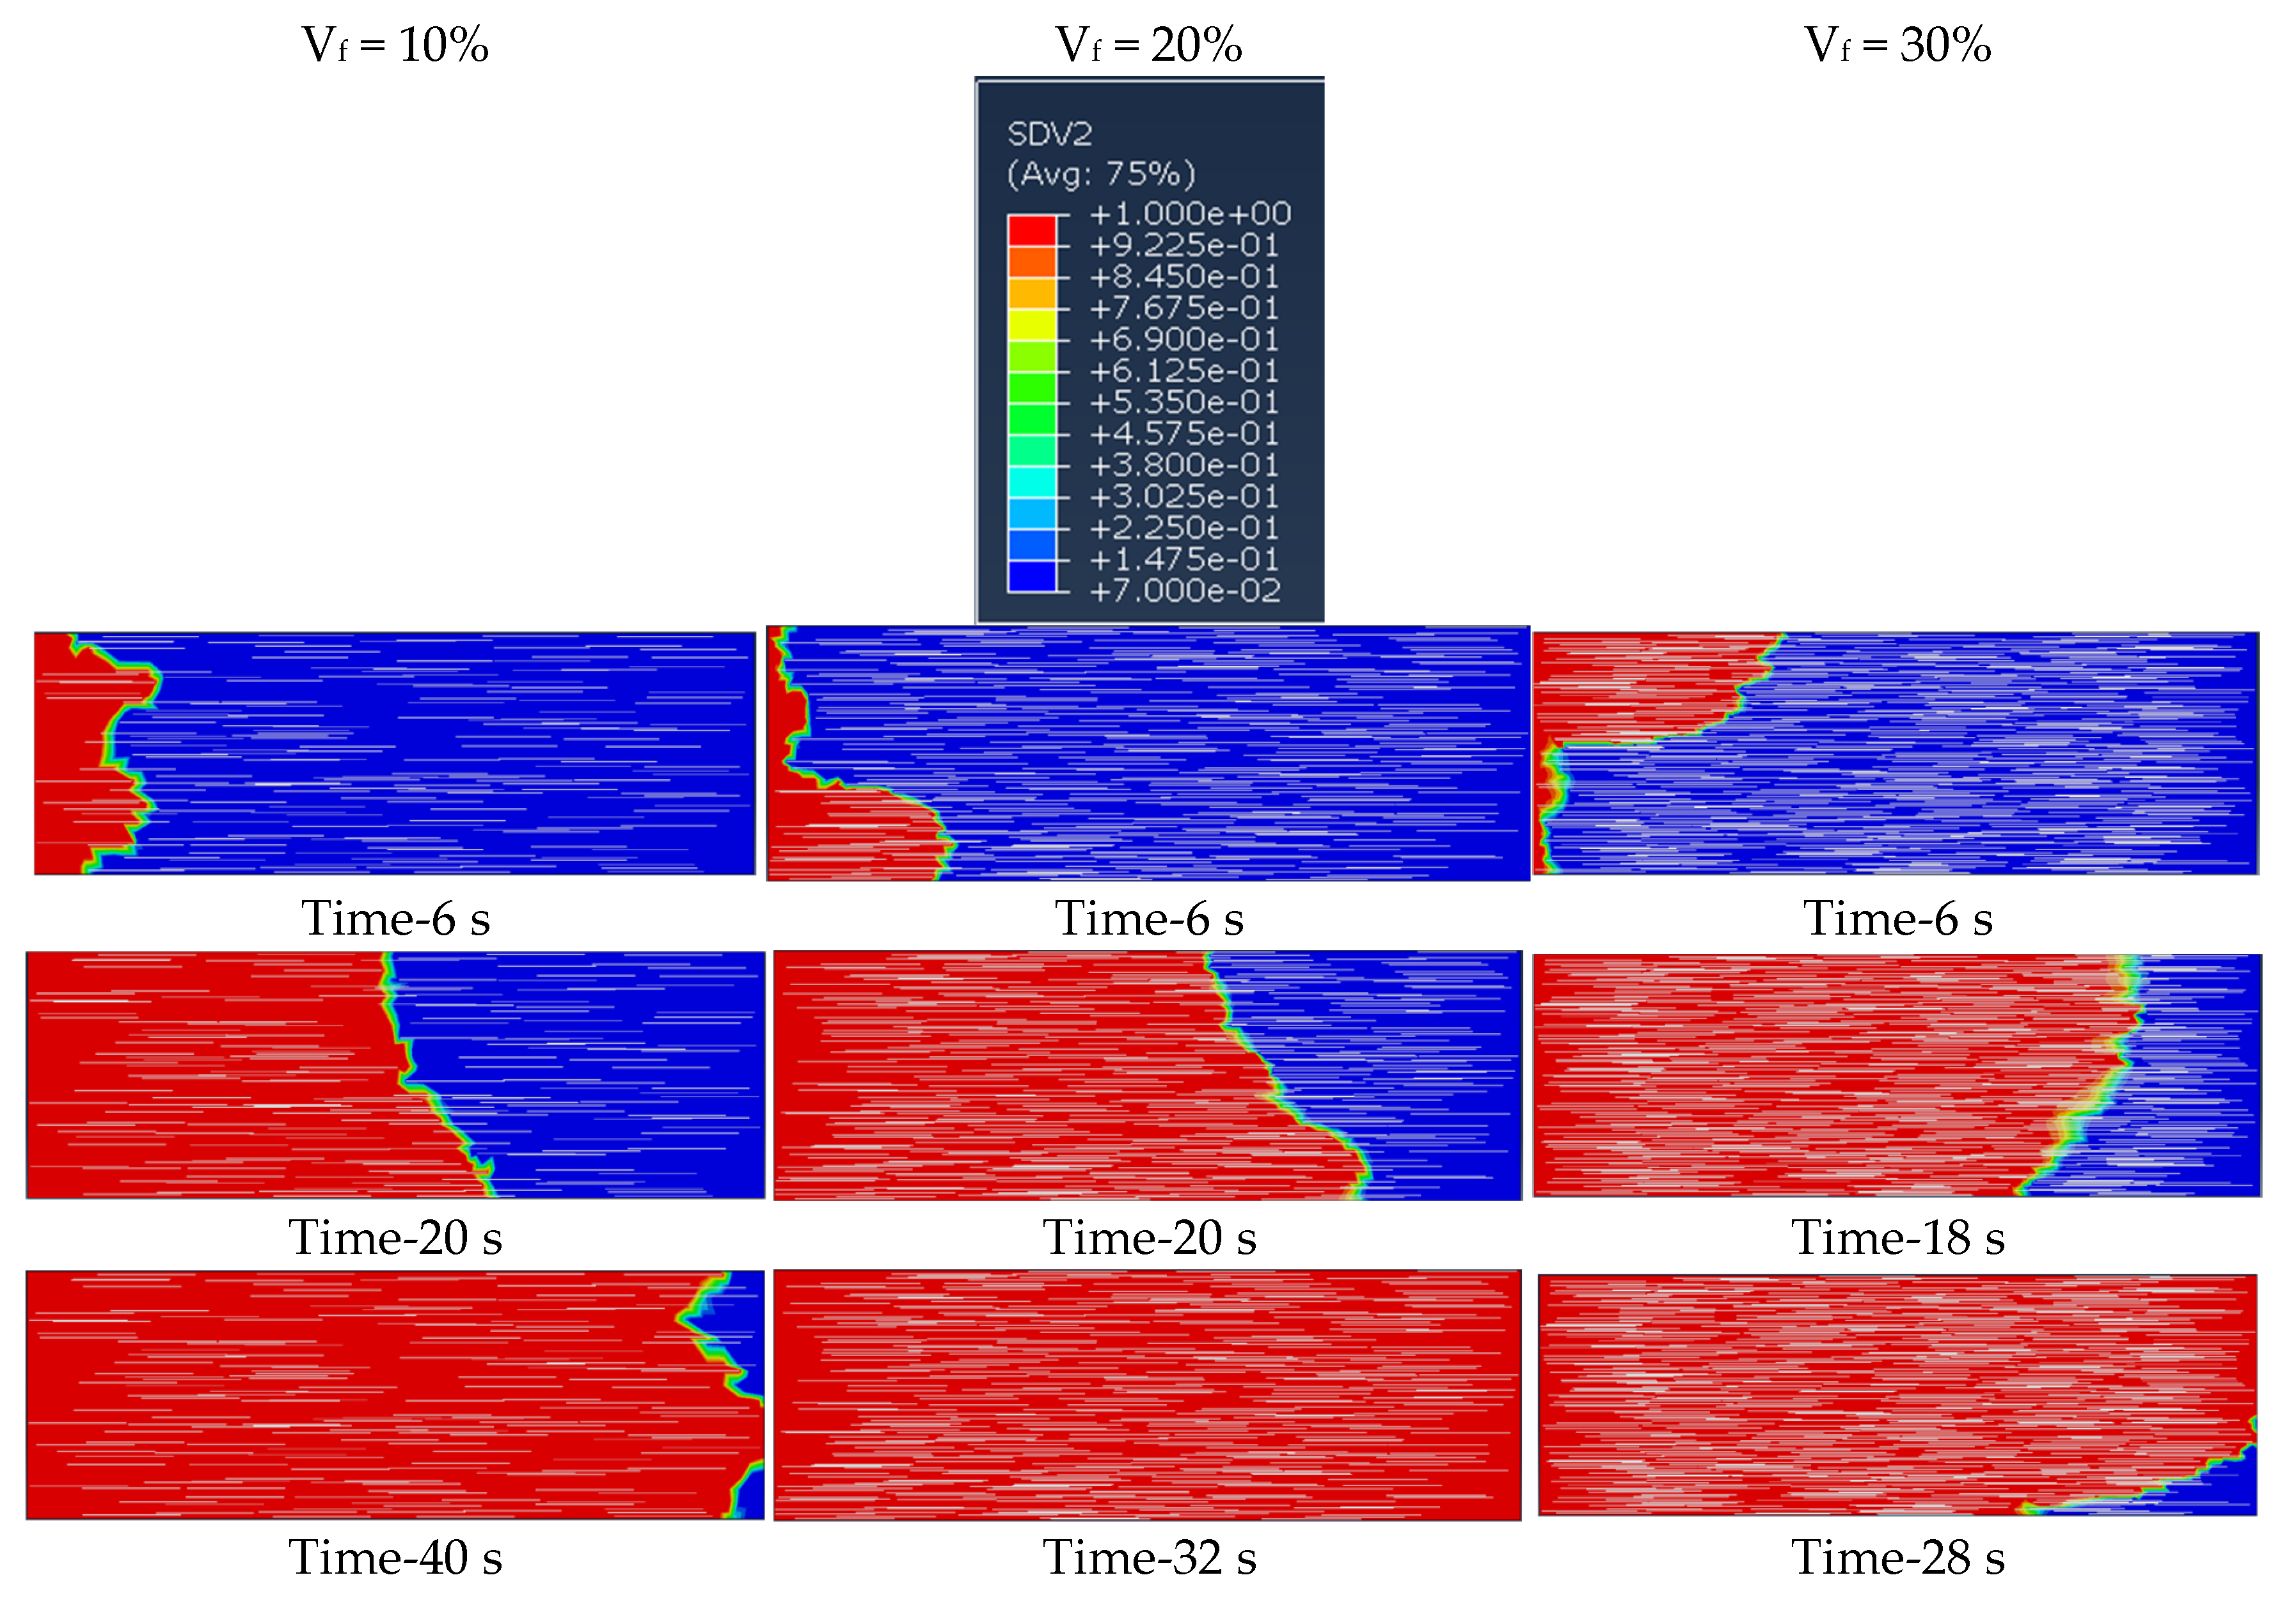
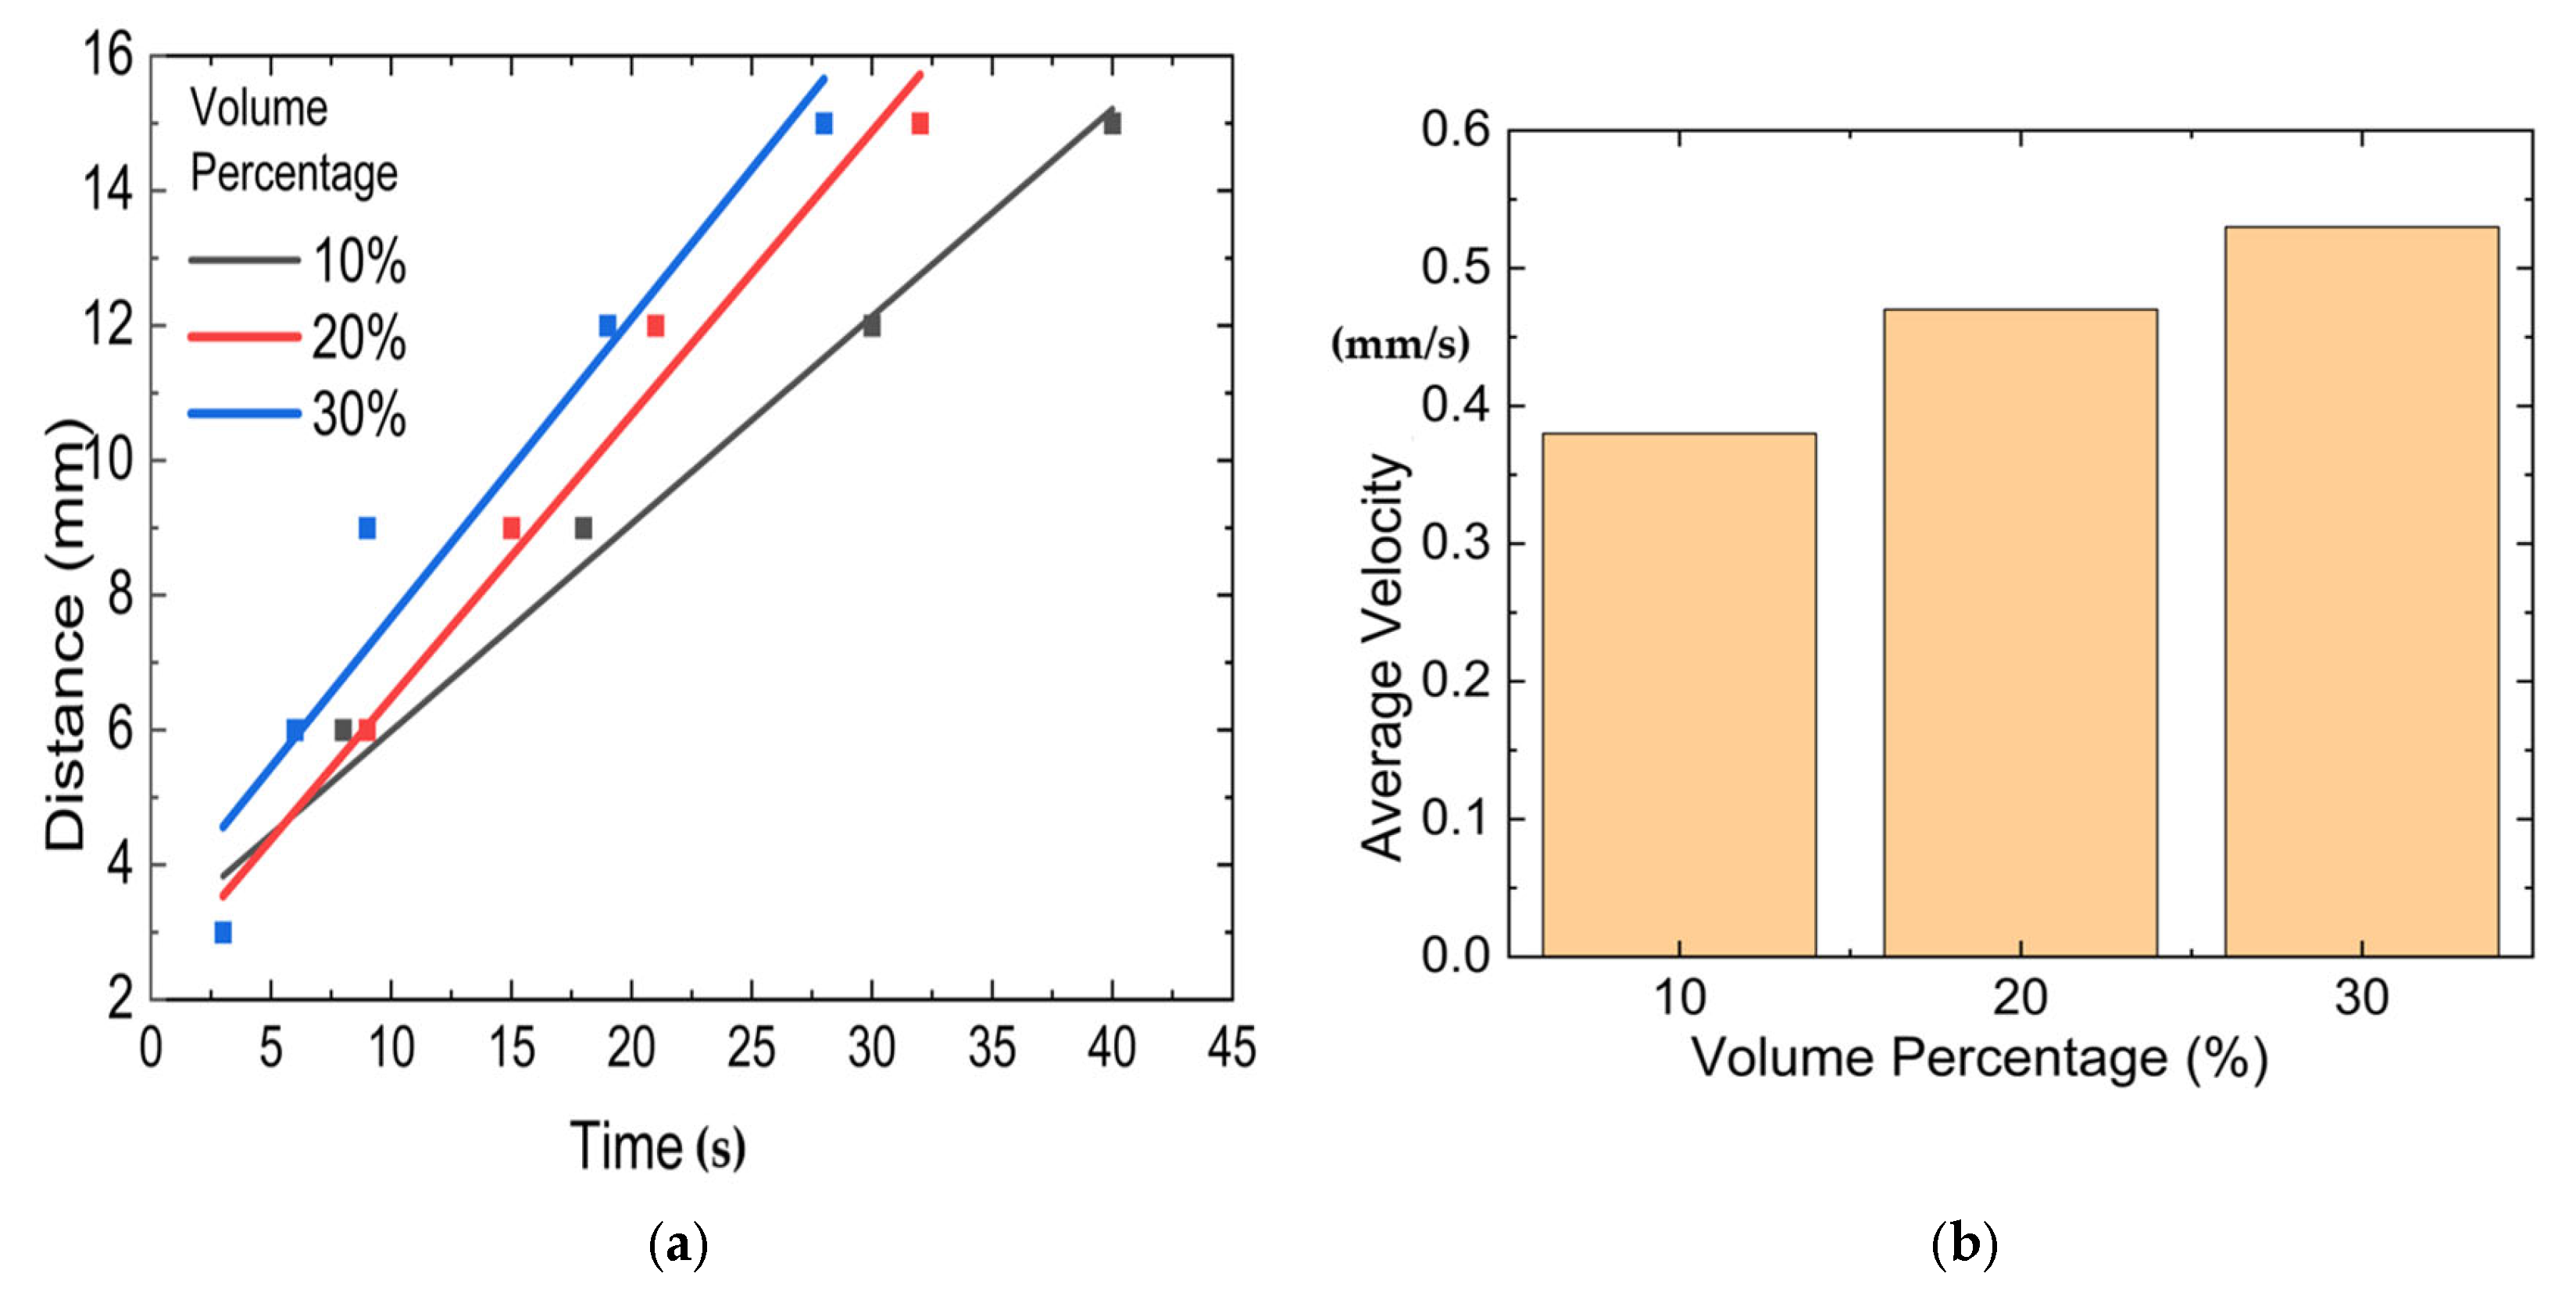
6.1. Effect of Fiber Concentrations

In this study, fiber concentrations of 10%, 20%, and 30% by volume were considered for unidirectional SCF/Ep composites with a fiber aspect ratio of 100. The simulation results show the degree of cure and reaction temperature distributions at three intervals in Figure 9 and Figure 10. It can be observed that fiber concentrations significantly influence the cure time. The cure time is reduced with increased fiber concentrations. The cure time is observed to be 40 s for SCF/Ep composites with 10% SCF. But as the SCF concentration rises to 20 percent, the time is reduced to 32 s. The cure time is observed to be 28 s with 30% SCF. The quantity of resin decreases with increased fiber concentration. This resulted in a shorter curing time for a smaller amount of resin. Enhanced fiber concentrations also enhanced heat transfer, facilitating the curing process.
Figure 10 illustrates the temperature field evolution in the FP of SCF/Ep composites with 10%, 20%, and 30% SCF concentrations by volume (vol%) at various time intervals. The initial temperature was 25 °C (298 °K). A triggering temperature of 150 °C (423 °K) was applied at x = 0 for 10 s. The temperature distribution at different time intervals, as shown in Figure 10, resulted from the exothermic reaction after the triggering temperature was isolated. The color-coded temperature contours indicate that the reaction temperature proceeds more rapidly in SCF/Ep composites with higher SCF concentrations. This increase in frontal velocity (FV) is attributed to the higher thermal conductivity of the carbon fibers, which allows for more efficient heat transfer, resulting in faster curing.
The variation in maximum temperature at each fiber volume fraction is presented in Figure 11. It can be observed that the maximum temperature decreases as the fiber content increases. This is because the addition of fibers reduces the amount of epoxy resin available for curing, thereby lowering the total heat generated during the reaction. As a result, the peak temperature at the reaction front declines at higher fiber loadings. Additionally, the temperature in the already cured region also decreases, likely due to the enhanced thermal conductivity provided by the fibers.
Figure 12a presents a distance vs. time plot tracking the progression of the reaction front along the X-direction at various fiber concentrations. Nodes were selected along a straight line, and their respective distances were recorded to determine the time required for the reaction front to reach each point. The corresponding average velocity vs. fiber concentration is shown in Figure 12b. The average velocity is determined from the slope of the distance vs time plots in Figure 12a. It can be seen that the average velocity of the FP reaction increases with enhanced fiber concentrations. This enhanced reaction velocity at higher fiber concentrations is due to the shorter cure time required for reduced resin contents. Heat transfer occurred at a faster rate due to the increased fiber quantity, resulting in faster curing.

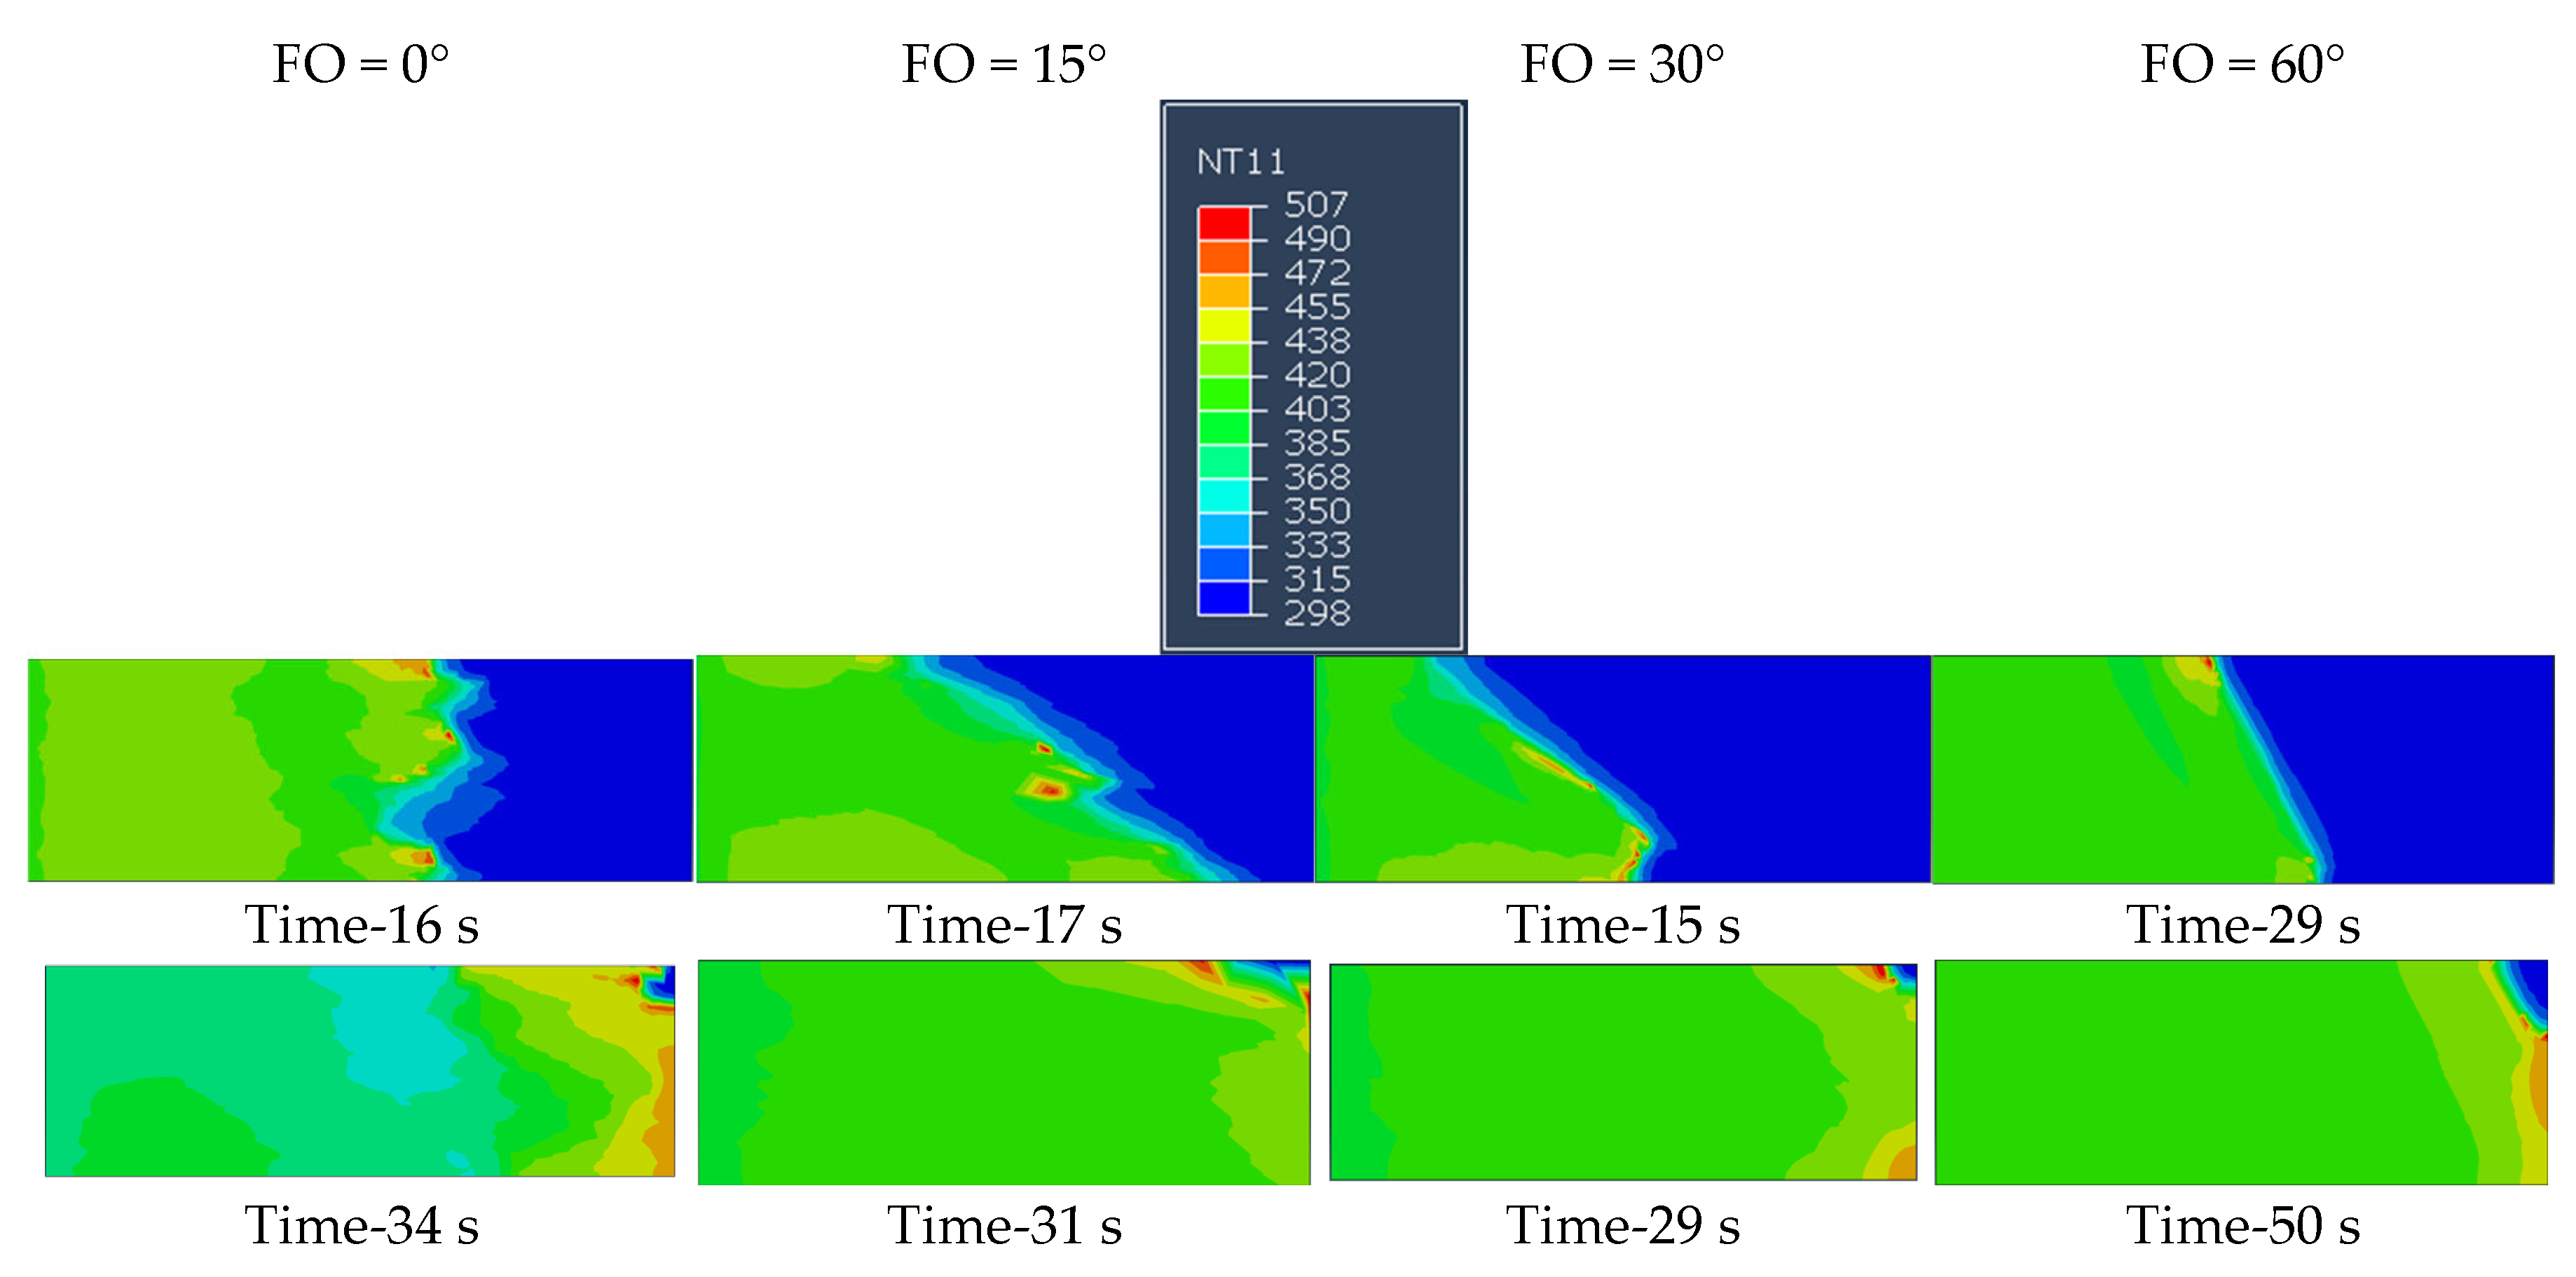
6.2. Effect of Fiber Orientation

The fiber aspect ratio of 50 and a concentration of 20% by volume were considered in studying the effects of fiber orientation on the degree of cure and reaction temperature distribution, as shown in Figure 13 and Figure 14. Figure 13 illustrates the degree of cure at various time intervals for 0°, 15°, 30°, and 60° orientations. The results demonstrate a significant impact of fiber orientations on the degree of cure for SCF/Ep composites. The first row in Figure 13 clearly shows that the curing reaction follows the path of fiber orientations. The orientation angle also significantly contributes to the polymerization time, as seen in Figure 13. It took 34 s to complete polymerization at the 0° orientation, but the time was reduced for the 15° and 30° orientations. These phenomena are attributed to the heat transfer of the fiber, which relates to both the fiber’s transverse area and length. In the case of a 60° orientation, the polymerization time is observed to increase based on the same phenomenon. The 0° of short fibers primarily contributes to horizontal heat transfer, whereas the misaligned fibers contribute to both horizontal and transverse heat transfer. The results show a shorter polymerization time for 15° and 30° orientations compared to 0° and 60° orientations.
Figure 14 shows temperature distribution plots at different time intervals for 0°, 15°, 30°, and 60° orientations. The color-coded temperature color scale is represented in Kelvin (K). It can be observed in the first row of Figure 14 that the temperature profile follows the orientations of the fiber. A good correlation between the degree of cure and reaction temperature paths is observed in Figure 13 and Figure 14. A maximum reaction temperature of 507 K (234 °C) is observed in a completely polymerized zone, whereas room temperature, 298 K (25 °C), is observed in the uncured region. The results show a very uniform temperature distribution for the SCF/Ep composite with 60° fiber orientation. At the front zone of the reaction, the temperature profile is not uniform; however, the region slightly behind the reaction zone exhibits a uniform temperature distribution. The reaction temperature distribution in the 0° orientation of the SCF/Ep composite is not uniform, unlike that in the 60° orientation at 29 s and at other orientations. The results indicate that orientations of the fiber also influence the temperature distribution in SCF/Ep composites.
Table 4 shows the average frontal velocity of the reaction as a function of fiber orientations (0°, 15°, 30°, 45°, 60°, 75°). The frontal velocity is observed to be low (0.44 mm/s) at zero orientation, and it increases to 0.48 and 0.52 mm/s for 15- and 30-degree orientations, respectively. However, the frontal velocity is further reduced (0.37, 0.3, and 0.25 mm/s) at 45°, 60°, and 75° orientations. Such a trend is related to the observed degree of cure and polymerization time. The lowest velocity is observed at 75°fiber orientations. The results indicate that fiber orientation influences the frontal velocity of the reaction.

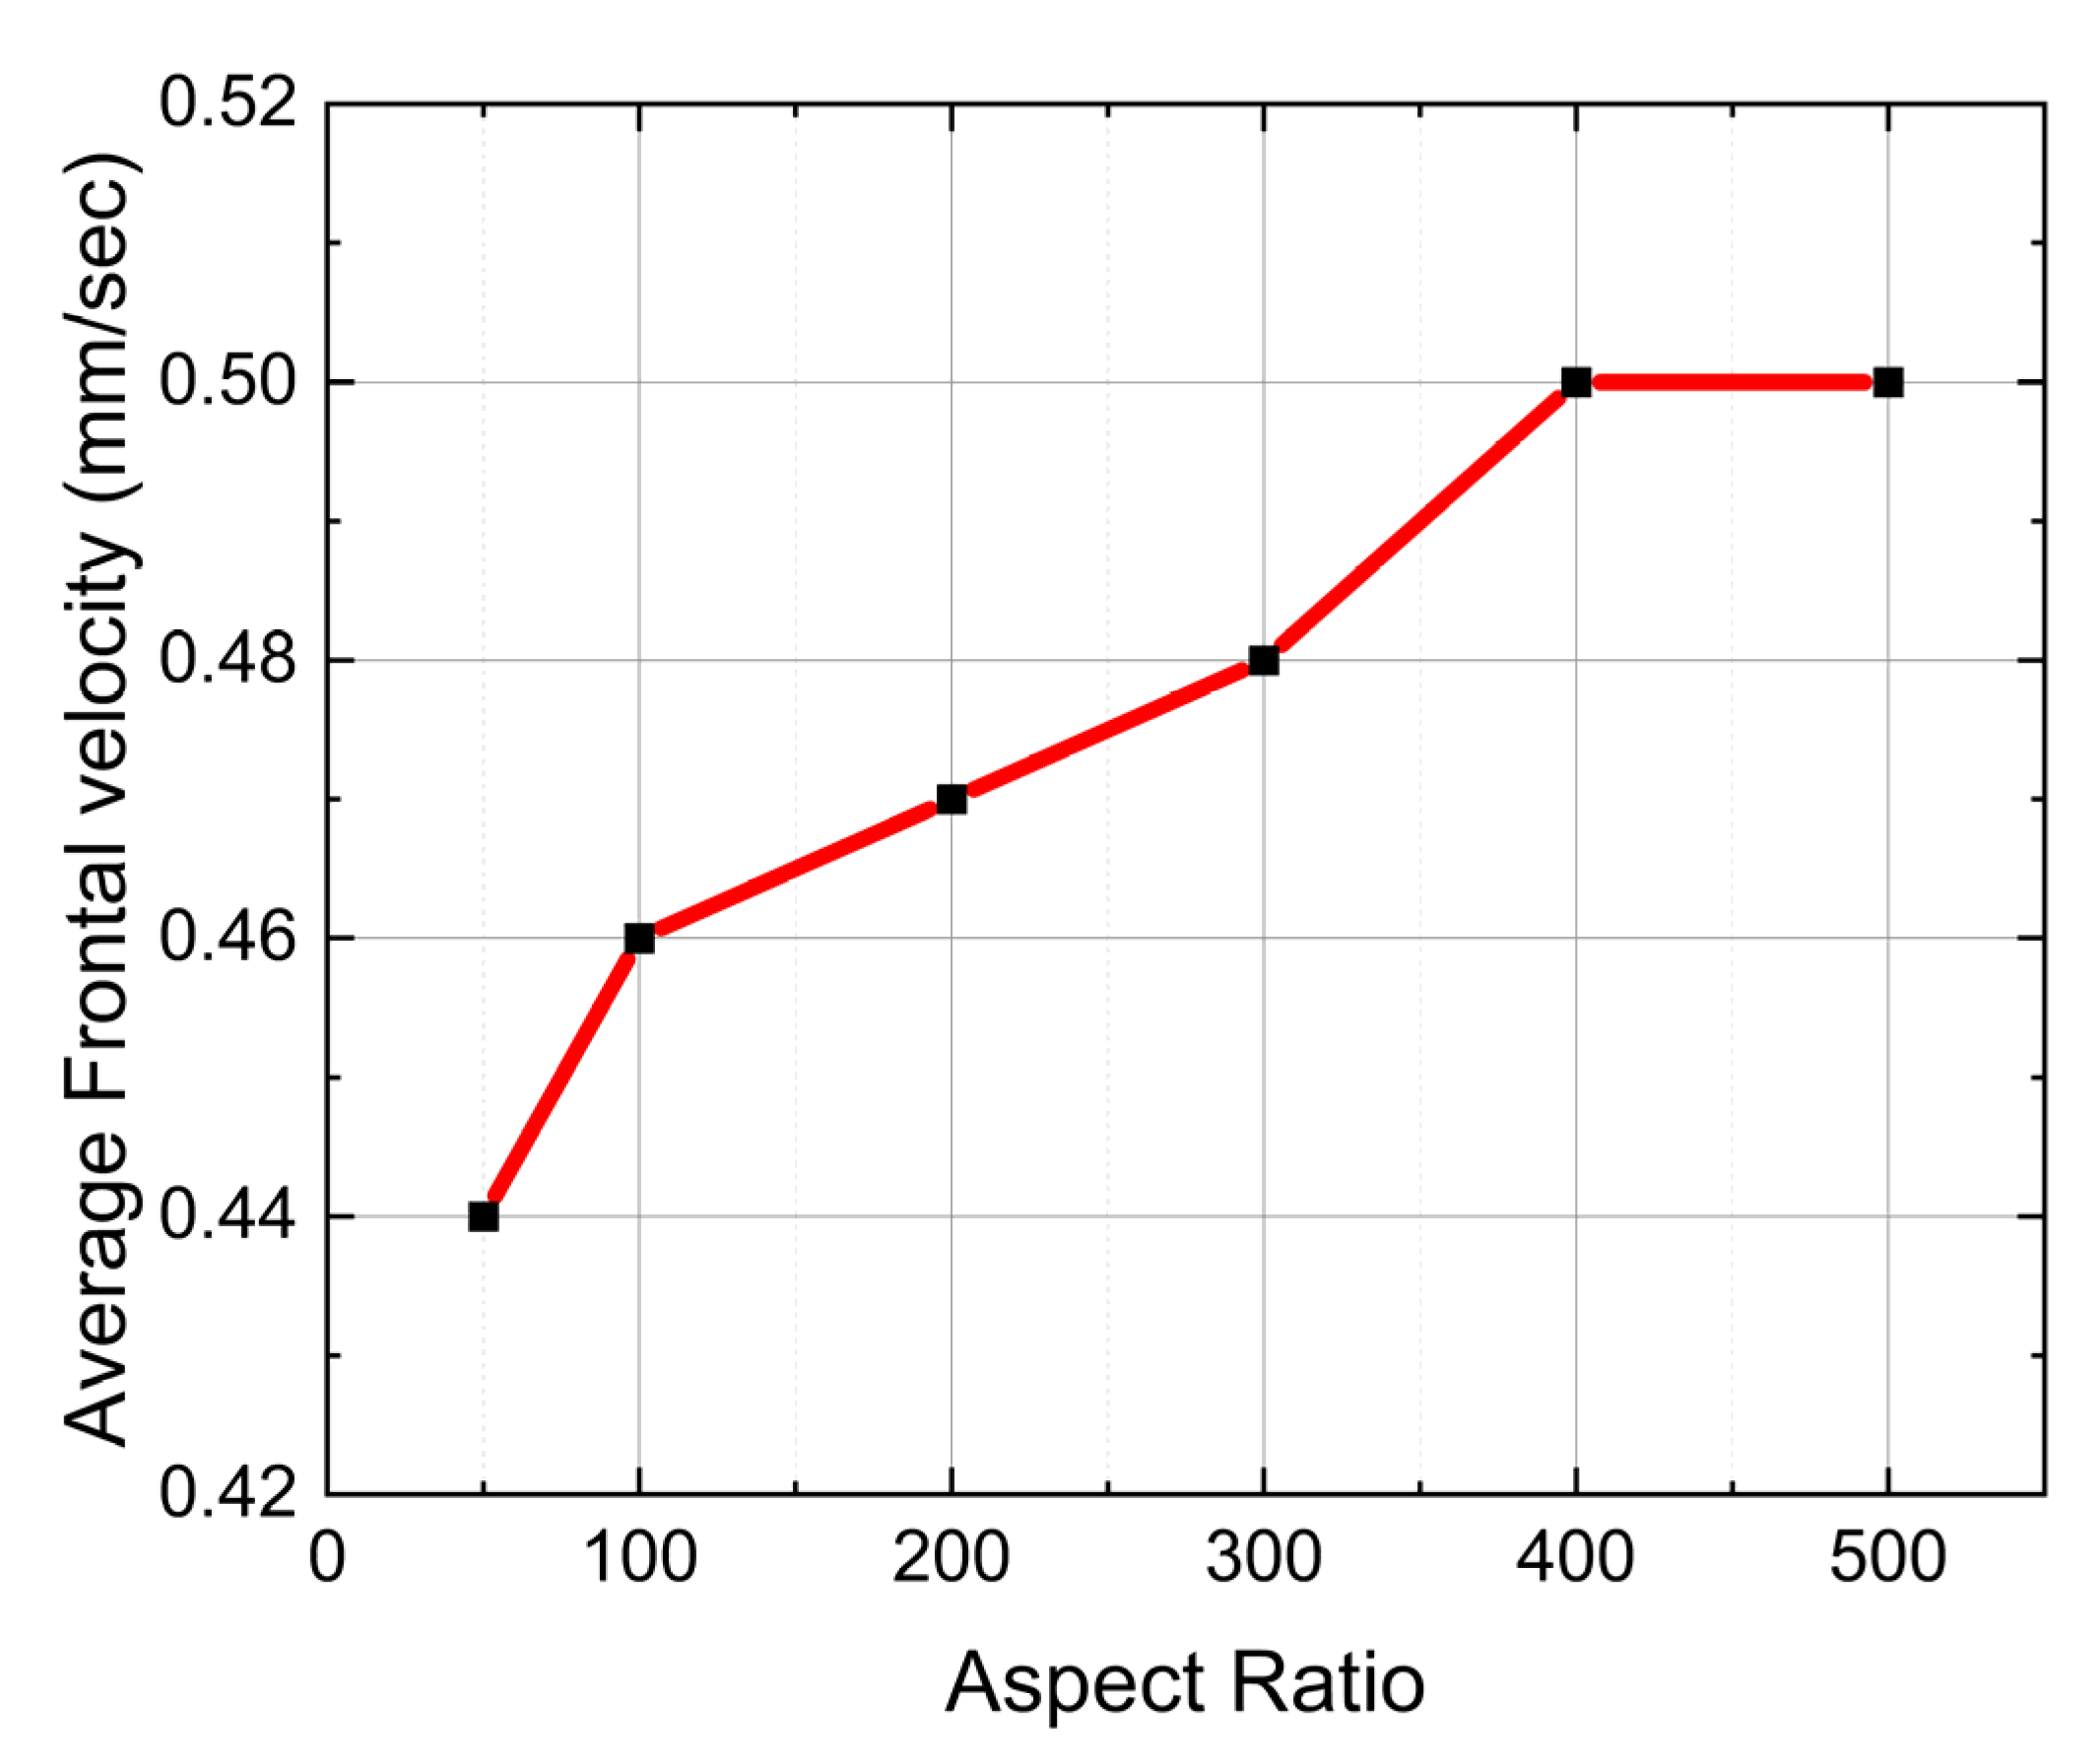
6.3. Effect of Aspect Ratio

The orientation angle was kept at zero degrees, and the volume percentage was 20% while analyzing the effect of fiber aspect ratio (l/d) on the degree of cure, reaction temperature, and frontal velocity. The length of the fibers was varied to study the effects of aspect ratios (ARs) of 100, 300, and 500. Figure 15 illustrates the polymerization and degree of cure at various time intervals as a function of fiber aspect ratio. The color-coded bar marker represents the degree of cure, and red indicates a degree of cure of 100%. As observed in Figure 15, 500 aspect ratio fibers took less time (30 s) compared to 100 aspect ratio fibers at 0° orientation (32 s) to reach 100% degree of cure. However, this trend was not observed at early time intervals (16 s), as not all fibers in the system actively participated in the process. It is also necessary to note that at a 20% fiber volume fraction, AR-100, AR-300, and AR-500 exhibited distinct distribution patterns in terms of the number of fibers, fiber length, and boundary conditions. All these factors also have different implications at different time intervals.
Figure 16 illustrates the temperature distributions at various time intervals for fiber aspect ratios AR-100, AR-300, and AR-500. A maximum reaction temperature of 512 K (239 °C) was observed in the higher curing rate area. The color-coded temperature marker indicated a gradual increase in temperature at the reaction front from the uncured liquid zone toward the cured zone. Figure 17 illustrates the variation in reaction frontal velocity with respect to fiber aspect ratio. A shift in frontal velocity from 0.44 mm/s to 0.50 mm/s is observed as the fiber aspect ratio increases from 50 to 400. The change in frontal velocity is not significantly observed when the aspect ratio increases from 400 to 500.

7. Conclusions

The following conclusions are drawn from the results of this study.
  • The fiber concentrations in terms of volume fraction significantly influence the degree of cure, reaction temperature distribution, and velocity in frontal polymerization of short SCF/Ep composites. The cure time is reduced from 40 s to 28 s as the SCF volume percentage increases from 10% to 30%.
  • The orientation of the short fibers also significantly affects the curing dynamics, with specific angles facilitating better heat transfer and resulting in faster polymerization. The highest (0.52 mm/s) and lowest (0.25 mm/s) frontal velocity is observed for fiber orientations of 30 degrees and 75 degrees, respectively. The curing reaction also follows the path of fiber orientation.
  • The fiber aspect ratio shows some influence on polymerization time and reaction temperature distribution in low fiber aspect ratios (50–400), but the frontal velocity remains the same above a fiber aspect ratio of 400.

Author Contributions

Conceptualization, A.T.S. and.; Software, A.T.S.; Investigation, A.T.S.; Resources, A.H. and E.A.P.; Writing—review & editing, E.A.P. and A.H.; Supervision, E.A.P. and A.H. All authors have read and agreed to the published version of the manuscript.

Funding

This research received no external funding.

Data Availability Statement

The data is contained within the article, and the code will be available on GitHub.

Conflicts of Interest

The authors declare no conflicts of interest.

References

  1. Suslick, B.A.; Hemmer, J.; Groce, B.R.; Stawiasz, K.J.; Geubelle, P.H.; Malucelli, G.; Mariani, A.; Moore, J.S.; Pojman, J.A.; Sottos, N.R. Frontal Polymerizations: From Chemical Perspectives to Macroscopic Properties and Applications. Chem. Rev. 2023, 123, 3237–3298. [Google Scholar] [CrossRef] [PubMed]
  2. Robertson, I.D.; Yourdkhani, M.; Centellas, P.J.; Aw, J.E.; Ivanoff, D.G.; Goli, E.; Lloyd, E.M.; Dean, L.M.; Sottos, N.R.; Geubelle, P.H.; et al. Rapid Energy-Efficient Manufacturing of Polymers and Composites Via Frontal Polymerization. Nature 2018, 557, 223. [Google Scholar] [CrossRef] [PubMed]
  3. Esposito, G.; Tandon, G.; Abbott, A.; Butcher, D.; Koerner, H. Frontal polymerization for UV- and thermally initiated EPON 826 resin. Polym. Eng. Sci. 2024, 64, 4760–4773. [Google Scholar] [CrossRef]
  4. Bomze, D.; Knaack, P.; Koch, T.; Jin, H.; Liska, R. Radical induced cationic frontal polymerization as a versatile tool for epoxy curing and composite production. J. Polym. Sci. Part Polym. Chem. 2016, 54, 3751–3759. [Google Scholar] [CrossRef]
  5. Gary, D.P.; Ngo, D.; Bui, A.; Pojman, J.A. Charge transfer complexes as dual thermal/photo initiators for free-radical frontal polymerization. J. Polym. Sci. 2022, 60, 1624–1630. [Google Scholar] [CrossRef]
  6. Groce, B.R.; Ferguson, M.M.; Pojman, J.A. Thermally initiated cationic frontal polymerization of epoxies and vinyl ethers through a lone onium salt. J. Polym. Sci. 2023, 61, 3149–3158. [Google Scholar] [CrossRef]
  7. Staal, J.; Smit, E.; Caglar, B.; Michaud, V. Thermal management in radical induced cationic frontal polymerisation for optimised processing of fibre reinforced polymers. Compos. Sci. Technol. 2023, 237, 110009. [Google Scholar] [CrossRef]
  8. Topkaya, T.; Gao, Y.; Geubelle, P. Frontal Polymerization in Short-Fiber-Reinforced Thermoset Composites. ACS Appl. Polym. Mater. 2022, 4, 6880–6886. [Google Scholar] [CrossRef]
  9. Abasi, F.O.; Aabass, R.U. Thermo-mechanical behavior of epoxy composite reinforced by carbon and Kevlar fiber. MATEC Web Conf. 2018, 225, 01022. [Google Scholar] [CrossRef]
  10. Pokharel, A.; Falua, K.J.; Babaei-Ghazvini, A.; Acharya, B. Biobased Polymer Composites: A Review. J. Compos. Sci. 2022, 6, 255. [Google Scholar] [CrossRef]
  11. Karbhari, V.M.; Xian, G. Hygrothermal effects on high VF pultruded unidirectional carbon/epoxy composites: Moisture uptake. Compos. Part B Eng. 2009, 40, 41–49. [Google Scholar] [CrossRef]
  12. Ramírez-Herrera, C.A.; Cruz-Cruz, I.; Jiménez-Cedeño, I.H.; Martínez-Romero, O.; Elías-Zúñiga, A. Influence of the Epoxy Resin Process Parameters on the Mechanical Properties of Produced Bidirectional [±45°] Carbon/Epoxy Woven Composites. Polymers 2021, 13, 1273. [Google Scholar] [CrossRef] [PubMed]
  13. Dong, K.; Zhang, J.; Cao, M.; Wang, M.; Gu, B.; Sun, B. A Mesoscale Study of Thermal Expansion Behaviors of Epoxy Resin and Carbon Fiber/Epoxy Unidirectional Composites Based on Periodic Temperature and Displacement Boundary Conditions. Polym. Test. 2016, 55, 44–60. [Google Scholar] [CrossRef]
  14. Goli, E.; Robertson, I.D.; Agarwal, H.; Pruitt, E.L.; Grolman, J.M.; Geubelle, P.H.; Moore, J.S. Frontal Polymerization Accelerated by Continuous Conductive Elements. J. Appl. Polym. Sci. 2019, 136, 47418. [Google Scholar] [CrossRef]
  15. Elenchezhian, M.; Enos, R.; Martin, N.; Sen, S.; Zhang, D.; Pantelelis, N. Cure process modeling and characterization of composites using in-situ dielectric and fiber otpic sensor monitoring. In Proceedings of the Composites and Advance Materials Expo (CAMX) 2022, Anaheim, CA, USA, 17–20 October 2022. [Google Scholar]
  16. Kumar, A.; Gao, Y.; Geubelle, P.H. Analytical Estimates of Front Velocity in the Frontal Polymerization of Thermoset Polymers and Composites. J. Polym. Sci. 2021, 59, 1109. [Google Scholar] [CrossRef]
  17. Wang, Y. Modeling the through-thickness frontal polymerization of unidirectional carbon fiber thermoset composites: Effect of microstructures. J. Appl. Polym. Sci. 2022, 139, e52735. [Google Scholar] [CrossRef]
  18. Feng, Q.; Li, F.; Yan, Q.-Z.; Zhu, Y.-C.; Ge, C.-C. Frontal Polymerization Synthesis and Drug Delivery Behavior of Thermo-Responsive Poly(N-Isopropylacrylamide) Hydrogel. Colloid Polym. Sci. 2010, 288, 915. [Google Scholar] [CrossRef]
  19. Goli, E.; Gai, T.; Geubelle, P.H. Impact of Boundary Heat Losses on Frontal Polymerization. J. Phys. Chem. B 2020, 124, 6404. [Google Scholar] [CrossRef]
  20. Sharifi, A.M.; Kwon, D.-J.; Shah, S.Z.H.; Lee, J. Modeling of frontal polymerization of carbon fiber and dicyclopentadiene woven composites with stochastic material uncertainty. Compos. Struct. 2023, 326, 117582. [Google Scholar] [CrossRef]
  21. Vyas, S.; Zhang, X.; Goli, E.; Geubelle, P.H. Frontal Vs. Bulk Polymerization of Fiber-Reinforced Polymer-Matrix Composites. Compos. Sci. Technol. 2020, 198, 108303. [Google Scholar] [CrossRef]
  22. Gao, Y.; Rodriguez Koett, L.E.; Hemmer, J.; Gai, T.; Parikh, N.A.; Sottos, N.R.; Geubelle, P.H. Frontal Polymerization of Thin Layers on a Thermally Insulating Substrate. ACS Appl. Polym. Mater. 2022, 4, 4919. [Google Scholar] [CrossRef]
  23. Aktas, A.; Krishnan, L.; Kandola, B.; Boyd, S.; Shenoi, R. A cure modelling study of an unsaturated polyester resin system for the simulation of curing of fibre-reinforced composites during the vacuum infusion process. J. Compos. Mater. 2015, 49, 2529–2540. [Google Scholar] [CrossRef]
  24. Cui, H.-W.; Jiu, J.; Nagao, S.; Sugahara, T.; Suganuma, K.; Uchida, H. Using Ozawa method to study the curing kinetics of electrically conductive adhesives. J. Therm. Anal. Calorim. 2014, 117, 1365–1373. [Google Scholar] [CrossRef]
  25. Cui, H.-W.; Suganuma, K.; Uchida, H. Using the Ozawa Method to Study the Thermally Initiated Curing Kinetics of Vinyl Ester Resin. RSC Adv. 2015, 5, 2677–2683. [Google Scholar] [CrossRef]
  26. Yang, G.; Yuan, Z.; Yang, Z.; Zhang, M. Nonisothermal curing kinetics of a novel polymer containing phenylsilylene and propargyl–hexafluorobisphenol a units. J. Appl. Polym. Sci. 2013, 127, 3178–3185. [Google Scholar] [CrossRef]
  27. Qiao, Y.; Xing, A.; Gao, C.; Yuan, P.; He, Z.; Lv, J.; Li, S.; Xue, P.; Niu, S.; Li, X. A study on cure kinetics and time-temperature-transformation cure diagram of epoxy/cyanate ester co-curing system. Polymer 2025, 324, 128230. [Google Scholar] [CrossRef]
  28. Puhurcuoğlu, N.; Arman, Y. Parameter estimation of epoxy resin cure kinetics by dynamics DSC data. Polym. Adv. Technol. 2024, 35, e6498. [Google Scholar] [CrossRef]
  29. Um, M.-K.; Daniel, I.M.; Hwang, B.-S. A study of cure kinetics by the use of dynamic differential scanning calorimetry. Compos. Sci. Technol. 2002, 62, 29–40. [Google Scholar] [CrossRef]
  30. Patham, B. Multiphysics simulations of cure residual stresses and springback in a thermoset resin using a viscoelastic model with cure-temperature-time superposition. J. Appl. Polym. Sci. 2013, 129, 983–998. [Google Scholar] [CrossRef]
  31. Zhang, C.; Wang, Y.; Liu, Y. Construction of improved isothermal TTT cure diagram based on an epoxy–amine thermoset. J. Appl. Polym. Sci. 2019, 136, 47279. [Google Scholar] [CrossRef]
  32. D’Mello, R.J.; Maiarù, M.; Waas, A.M. Effect of the curing process on the transverse tensile strength of fiber-reinforced polymer matrix lamina using micromechanics computations. Integrating Mater. Manuf. Innov. 2015, 4, 119–136. [Google Scholar] [CrossRef]
  33. Xiao, H.; He, Q.; Duan, Y.; Wang, J.; Yao, Q.; Ming, Y.; Zhang, C.; Zhu, Y. Low-temperature 3D printing and curing process of continuous fiber-reinforced thermosetting polymer composites. Polym. Compos. 2023, 44, 2322–2330. [Google Scholar] [CrossRef]
  34. Greenfeld, I.; Shneider, M.; Kaestner, A.; Wagner, H.D. Stiffness modeling of thermoset polymer fibers. J. Polym. Sci. 2024, 62, 2780–2796. [Google Scholar] [CrossRef]
  35. Tarafdar, A.; Jia, C.; Hu, W.; Hosein, I.D.; Fu, K.; Wang, Y. Three-dimensional modeling of frontal polymerization for rapid, efficient, and uniform thermoset composites manufacturing. Compos. Part B Eng. 2023, 266, 111029. [Google Scholar] [CrossRef]
  36. Tiani, R.; Pojman, J.A.; Rongy, L. Critical Role of Layer Thickness in Frontal Polymerization. J. Phys. Chem. B 2022, 126, 3607. [Google Scholar] [CrossRef]
  37. Ziaee, M.; Naseri, I.; Johnson, J.W.; Franklin, K.A.; Yourdkhani, M. Frontal Polymerization and Three-Dimensional Printing of Thermoset Polymers with Tunable Thermomechanical Properties. ACS Appl. Polym. Mater. 2023, 5, 1715–1724. [Google Scholar] [CrossRef]
  38. Vyas, S.; Goli, E.; Zhang, X.; Geubelle, P.H. Manufacturing of Unidirectional Glass-Fiber-Reinforced Composites Via Frontal Polymerization: A Numerical Study. Compos. Sci. Technol. 2019, 184, 107832. [Google Scholar] [CrossRef]
  39. Yi, X.; Li, S.; Wen, P.; Yan, S. Numerical Simulation of Polyacrylamide Hydrogel Prepared via Thermally Initiated Frontal Polymerization. Polymers 2024, 16, 873. [Google Scholar] [CrossRef]
  40. Shams, A.T.; Papon, E.A.; Shinde, P.S.; Bara, J.; Haque, A. Degree of Cure, Microstructures, and Properties of Carbon/Epoxy Composites Processed via Frontal Polymerization. Polymers 2024, 16, 1493. [Google Scholar] [CrossRef]
  41. Du, S.; Guo, Z.-S.; Zhang, B.; Wu, Z. Cure kinetics of epoxy resin used for advanced composites. Polym. Int. 2004, 53, 1343–1347. [Google Scholar] [CrossRef]
  42. Zhao, L.; Hu, X. Autocatalytic curing kinetics of thermosetting polymers: A new model based on temperature dependent reaction orders. Polymer 2010, 51, 3814–3820. [Google Scholar] [CrossRef]
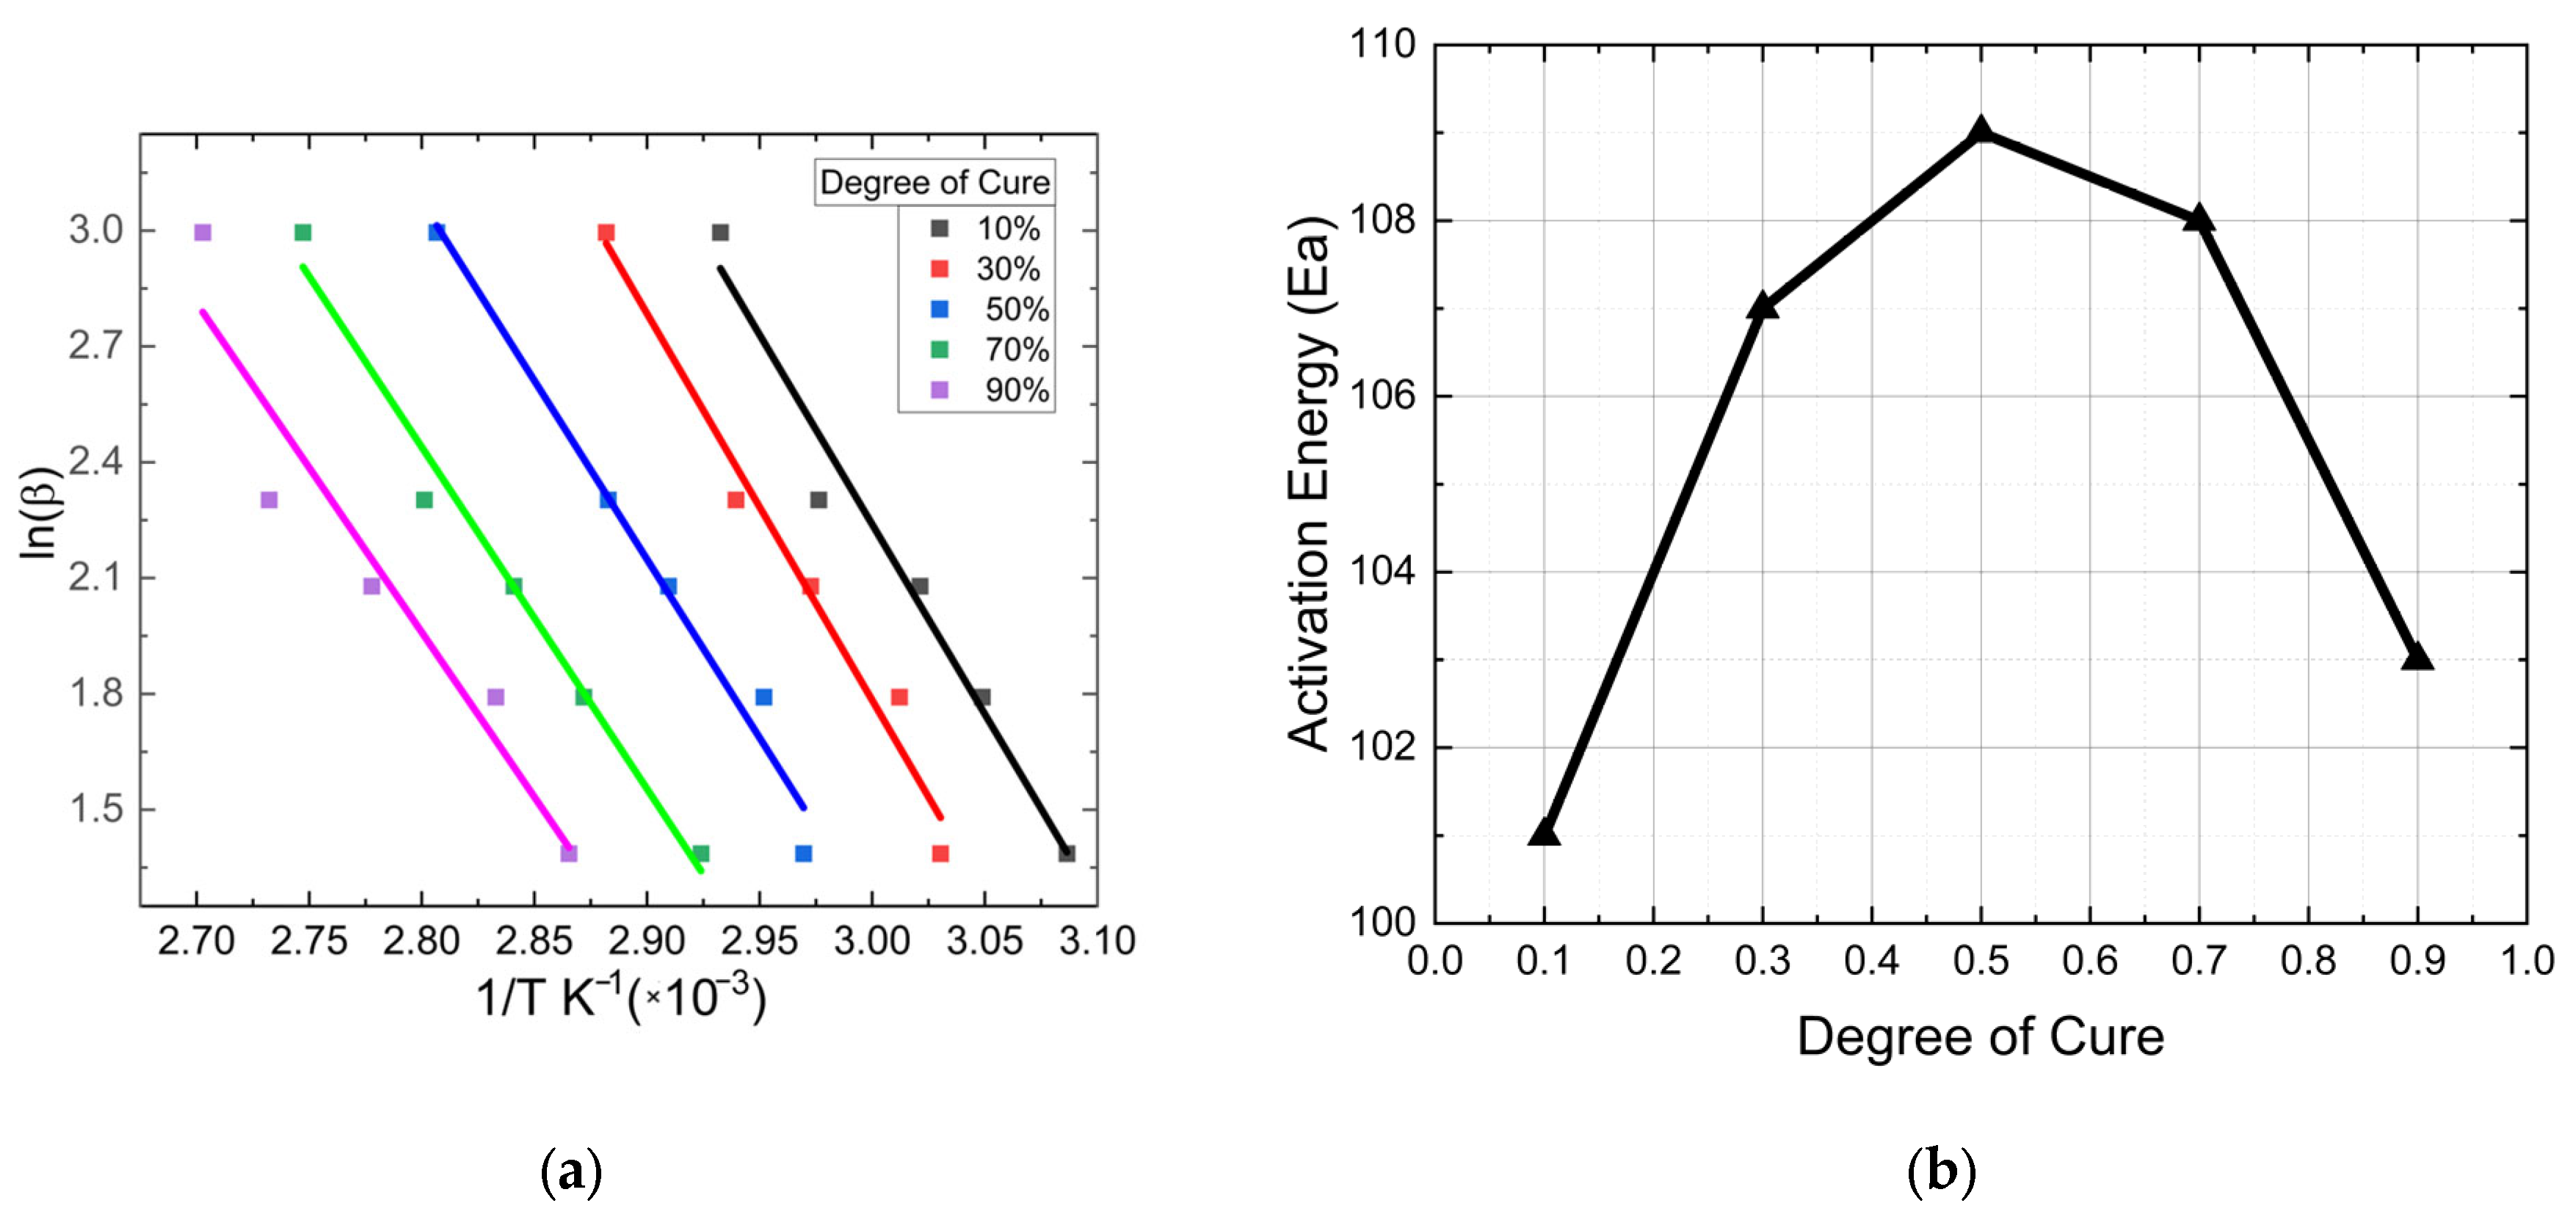
Figure 2. Activation Energy Calculation (a) l n ( β ) v s 1 / T plot at different cure percentage (b) activation energy at different degree of cure.
Jcs 09 00307 g002
Figure 3. Plot of (a) Value-1 vs. ln 1 α α ; (b) Value-2 vs. ln ( 1 α ) × α .
Jcs 09 00307 g003
Figure 4. Calculated and experimental values of the dα/dt vs. α at different heating rate (a) 5 °C/min, (b) 10 °C/min, (c) 15 °C/min, and (d) 20 °C/min.
Jcs 09 00307 g004
Figure 5. Flow chart of the numerical modeling using ABAQUS with USDFLD and HETVAL subroutines.
Jcs 09 00307 g005
Figure 6. Schematic of the model (a) with continuous fiber for validation and (b) with short fibers.
Jcs 09 00307 g006
Figure 7. Comparison of the experimental and simulation results (a) temperature profile captured using FTIR camera (b) Temperature evaluation in simulation (c) degree of cure profile in simulation.
Jcs 09 00307 g007
Figure 8. Comparison of the frontal velocity (FV); distance vs time plot in (a) numerical Simulation and (b) experimental study.
Jcs 09 00307 g008
Figure 9. Evolution of degree of cure over time for varying fiber volume fractions.
Jcs 09 00307 g009
Figure 10. Temperature distribution over time during FP.
Jcs 09 00307 g010
Figure 11. Maximum front temperature during curing at different volume percentages of SCF.
Jcs 09 00307 g011
Figure 12. (a) Distance vs time plot of the FP reaction path; (b) average velocity vs. volume percentage.
Jcs 09 00307 g012
Figure 13. Degree of cure at different time intervals for 0°, 15°, 30°, 60° fiber orientations.
Jcs 09 00307 g013
Figure 14. Temperature distribution at different time intervals for fiber orientations of 0°, 15°, 30°, and 60°.
Jcs 09 00307 g014
Figure 15. Degree of cure at different time intervals for fiber aspect ratios AR-100, AR-300, and AR-500.
Jcs 09 00307 g015
Figure 16. Temperature distribution at different time intervals for fiber aspect ratios AR-100, AR-300, and AR-500.
Jcs 09 00307 g016
Figure 17. Variation of frontal velocity with varying fiber AR (the width of the fiber is 20 µm).
Jcs 09 00307 g017
Table 1. Cure kinetics parameters for epoxy.
Heating Ratem + nm − nmnln A
52.811.081.960.7431.017
102.791.041.940.7930.914
152.750.981.850.8730.896
202.730.971.810.8930.873
Average2.761.021.890.8730.895
Table 2. Material properties.
MaterialDensity (ρ)
kg/m3
Thermal
Conductivity, k (W/m·K)
Specific Heat Cp (J/kg·K)Total Enthalpy of Reaction Hr (J/g)
Epoxy (Epon-828)12000.21750410
Glass22301.14800-
Carbon Fiber176010.45795-
Table 4. Average velocity with the change in orientation angle.
Fiber Orientation Angle 15°30°45°60°75°
Average Velocity (mm/s)0.44 0.480.520.370.300.25
Disclaimer/Publisher’s Note: The statements, opinions and data contained in all publications are solely those of the individual author(s) and contributor(s) and not of MDPI and/or the editor(s). MDPI and/or the editor(s) disclaim responsibility for any injury to people or property resulting from any ideas, methods, instructions or products referred to in the content.

