Abstract
Automation of the structural health monitoring process involves the use of successful methods for detecting defects and determining their critical characteristics. An efficient means of crack detection in composite materials is the ultrasonic method, but its application to determine critical crack parameters, such as depth in construction practice, is difficult or leads to large errors. This article focuses on machine learning methods usage to detect cracks in composite materials like brickwork. Ceramic bricks with various mechanical properties and with pre-grown cracks from 2 to 60 mm are considered. To understand the processes occurring during the ultrasonic pulse transmission, modeling was performed in the ANSYS environment. The brick is considered a porous medium weakened by a crack. Numerical modeling allows for the identification of the main features of the signal response and the determination of the amplitude-time range for different porosity and crack depth values. Using machine learning methods made it possible to solve two related problems. The first, binary classification, i.e., the presence or absence of a crack, is solved with 100% accuracy. The second is determining the crack depth. A neural network was built using an ensemble of decision trees. The accuracy of crack depth prediction is R2 = 0.983, and the error in predicted values is within 8%.
1. Introduction
Diagnostics of building and structural conditions is one of the most important scientific areas in modern construction research. Timely detection of defects in the form of cracks allows for maintaining integrity and eliminating human casualties. There are many known cases of building collapses in the world that have led to serious consequences and could have been avoided by using structural health monitoring tools [1,2,3]. The first case covers the need for timely detection of the location and severity of damage to the building structure to prevent collapse [1]. The second case describes the distribution, causes, and behavior of degradation of the structure of textile-reinforced cement composite as a result of environmental factors, which can lead to the direst consequences [2]. The third case concerns the degradation of materials and communications as a result of the formation and development of cracks and corrosion [3]. At the same time, there are many unsolved scientific problems in this area related to the detection and localization of defects, and determining their geometric characteristics and comparing them with threshold values is needed before the object can be classified as inoperative or emergency. It is known that crack development occurs in three stages: initiation [4,5,6], development [7,8,9], and supercritical growth [10,11,12], which in most cases occurs suddenly and leads to collapse (breakdown). Each stage is characterized by its own set of characteristics and factors; therefore, it is described by various dependencies, which make it difficult to predict destruction. In the case of concrete or ceramic materials, prediction of failure is complicated by the anisotropy of properties and the large difference in compressive and tensile strength values. Thus, it is clear that in order to predict the service life of structures, it is necessary to learn how to detect a crack at an early stage, and then be able to determine the characteristics of the crack and the material in order to understand the possible development of the crack and estimate the threshold value after which failure will occur.
Magnetic, eddy current, acoustic, ultrasonic, acoustic emission, laser, and other techniques are widely used to detect cracks. In [13,14], the authors consider the interaction of laser-generated Rayleigh waves with an artificial recess of various shapes. The authors note that the shape of the crack and the angle of the faces to the surface make a certain contribution to the signal response. To understand the processes that occur in the material during the passage of a pulse, a preliminary FEM simulation was performed, which showed a time shift in the signal in the presence of a crack. In [15], the authors developed an automated method for contactless detection of cracks in a tunnel using a laser Doppler vibrometer. The spectral characteristics of the laser signal showed a strong correlation with the presence of defects, which allowed the authors to develop an effective method.
Automated methods for detecting cracks in tunnels are also discussed in [16,17,18]. The authors use convolutional neural network algorithms in combination with deep learning. The use of convolutional neural networks [19,20,21,22] is attractive from various sides. Often, the human eye is unable to distinguish a defect, while computer vision accurately determines the presence of a crack. In addition, convolutional neural networks allow algorithmic crack detection and eliminate the human factor. The use of image analysis allows for the improvement of CNN algorithms and the application of an optimized deep neural network (DNN) [23,24,25]. The system’s performance made it possible to achieve 99% accuracy in binary classification, which is an excellent result. It should be noted that parameters like the sensitivity threshold of the model are not considered. Thus, it is unclear at what size the neural network begins to determine the presence of a crack. The use of machine learning is also attractive because crack detection can be combined with the prediction of concrete properties [26]. In [27,28,29,30,31], artificial intelligence algorithms are proposed that allow predicting the compressive strength of concrete of various types. The algorithms used are Random Forest (RF), Long-Short-Term Memory, Convolutional Neural Network, K-Nearest Neighbor, and Adaboost, which allow achieving accuracy in the range of 89–93%.
To reliably predict crack development and determine the ultimate stresses on the structure at which the crack will not have a significant effect, it is necessary to know the geometric characteristics of the crack. While the length and width of the crack can be determined visually, and image analysis methods can be used, other methods are required to determine the crack depth. The works [32,33,34,35,36,37] consider methods based on the use of phased ultrasonic arrays. These methods differ in their efficiency and accuracy of damage assessment, the detection of defects on the surface or in the depth of the material, as well as in the types of monitored materials and structures and the algorithms for implementing monitoring and measurements. Such methods use a system of ultrasonic sensors that emit a disturbance pulse and capture both direct and reflected signals. The methods allow for the visualization of the defect and the automation of the signal processing. However, such methods have not yet found wide application due to the high cost of equipment and the rather large and labor-intensive preliminary work.
A significant part of the research is aimed at modeling the processes occurring during the interaction of an ultrasonic pulse with a defect [38,39,40,41,42]. This allows us to estimate the contribution of the defect to the ultrasonic signal and subsequently apply effective processing methods. The papers [3,40,41,42,43,44] consider the problems of elastic wave propagation in elastic isotropic media and their interaction with defects of various locations. It is shown that with a surface location of the defect, the crack breaks the wave front, and the pulse requires more time to go around the defect. In this case, the signal shifts along the time axis, and this can be effectively used to detect the crack and determine its depth [40]. When detecting hidden (deep) defects, it is necessary to analyze the reflected signals, which significantly complicates the task. An important feature of concrete or ceramic materials is their heterogeneous and porous structure. The review showed, firstly, that when studying these materials, the authors accept the hypothesis of a homogeneous isotropic medium. At the same time, it is of interest to study the properties of heterogeneity and porosity and their influence on defect detection. Secondly, the use of artificial intelligence algorithms gives effective results and is a promising area of research. Thirdly, the use of ultrasonic tomographs and sensor arrays is an expensive and labor-intensive task, which is impractical in conventional construction.
Thus, the purpose of this work is to develop a scientific basis for a crack detection method (binary classification), determining the crack depth based on ultrasonic diagnostics data. To achieve this goal, the following problems were solved:
- Numerical modeling of ultrasonic pulse propagation in a porous medium weakened by a crack.
- Conducting a cycle of experimental measurements of ultrasonic signals in brickworks with various crack depths.
- Application of machine learning to the problem of binary classification of defects in ceramic bricks based on a dataset of experimental data.
- Neural network application in crack depth assessment.
2. Materials and Methods
2.1. Materials
We consider porous ceramic bricks with a size of 65 mm × 120 mm × 250 mm. The density of these bricks ranges between 1706 kg/m3 and 1986 kg/m3. A compressive strength between 16.9 MPa and 32.1 MPa, and a flexural strength between 2.15 MPa and 4.03 MPa characterize these bricks (strength grade M150).
The brick exhibits water absorption of 8.1%, with porosity ranging from 8% to 14%. This composite material exhibits an F50 frost resistance rating, demonstrating its ability to endure a minimum of 50 freeze-thaw cycles. Ceramic brick samples were experimentally fabricated with induced cracks of varying depths. Figure 1 displays images of brick samples featuring a range of crack severities, including those artificially created and those occurring naturally.
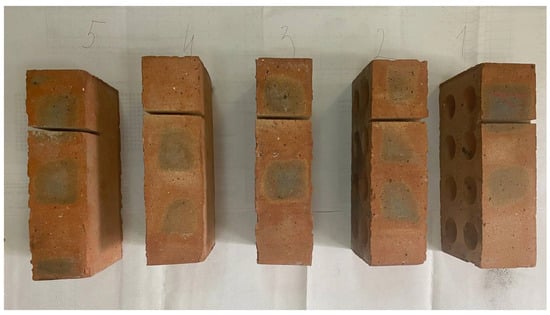
Figure 1.
Experimental brick samples with cracks of various depths.
A selection of 220 ceramic bricks exhibiting cracks formed the basis of the experimental study. The deterioration of the bricks resulted from two distinct causes. Artificially created cracks were manufactured in several bricks (Figure 1), alongside naturally occurring fractures. Table 1 presents the crack depth, brick properties, compressive strength (Rc), and density (ρ) for the experimental specimens.

Table 1.
Mechanical characteristics of bricks in groups of experimental samples.
Ultrasonic crack detection was performed using a Pulsar-2.2 device (NPP Interpribor, Chelyabinsk, Russia). Figure 2 illustrates the device’s design and the brick crack detection process.
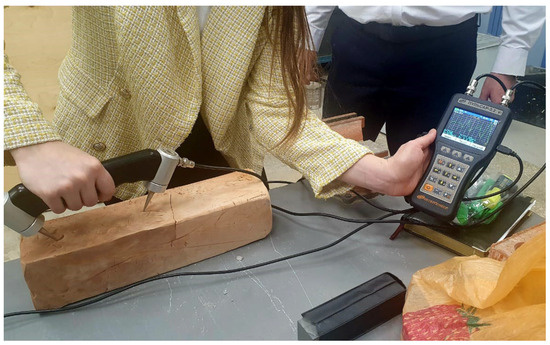
Figure 2.
The process of measuring using the Pulsar-2.2 ultrasonic device.
The device’s operational principle relies on the measurement of ultrasonic pulse propagation time from emitter to receiver through the product material. The device is designed to evaluate the properties and flaw detection of solid materials by the time and speed of propagation and the shape of the received ultrasonic pulses during surface and through-sounding. The device allows us to detect defects and determine the strength, density, and elastic modulus of building materials, as well as the sound index of abrasives. The main areas of application are as follows:
- -
- determination of the strength of concrete during process control and inspection of buildings and structures;
- -
- search for defects in concrete structures by an abnormal decrease in speed and by the shape of visualized signals of ultrasonic pulses;
- -
- assessment of crack depth;
- -
- assessment of porosity, fracturing, and anisotropy of composite materials and rocks;
- -
- determination of the elastic modulus and density of materials.
The device ensures operation:
- -
- during surface sounding, with a surface sounding sensor assembled on a fixed base (120 ± 1) mm with dry contact;
- -
- with through-sounding, with through-sounding sensors on an arbitrary base with contact grease or surface and angular sounding with dry contact (cone nozzles).
The operating conditions are as follows:
- -
- ambient air temperature ranging from minus 20 °C to plus 40 °C;
- -
- relative air humidity up to 80% at a temperature of 25 °C and lower temperatures, without moisture condensation;
- -
- atmospheric pressure from 84 to 106.7 kPa.
The operating frequency of ultrasonic vibrations generated by the device is 60 ± 10 kHz. The measurement base for surface sounding is 120 ± 1 mm.
The measurement range of the ultrasonic pulse propagation speed is 1000–10,000 m/s.
The measurement range of the ultrasonic pulse propagation time is 10–100 μs.
The range of ultrasonic pulse propagation time indications is 10–20,000 μs.
The general appearance of the device and converters in the kit is shown in Figure 3.
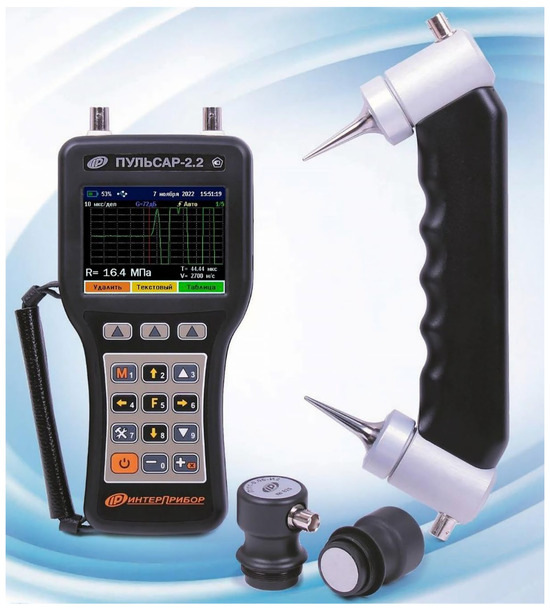
Figure 3.
General view of the Pulsar 2.2 device in the form of an electronic unit, a surface sounding sensor, and through-sounding sensors.
A more detailed description of the device can be found in [40].
2.2. Propagation of Elastic Ultrasonic Waves in a Porous Medium
Let us consider a porous medium that occupies a volume V in space and arrange the coordinate axes in accordance with Figure 4. The porous medium is characterized by the porosity coefficient:
here, is the volume of the skeleton, and is the volume occupied by the pores.
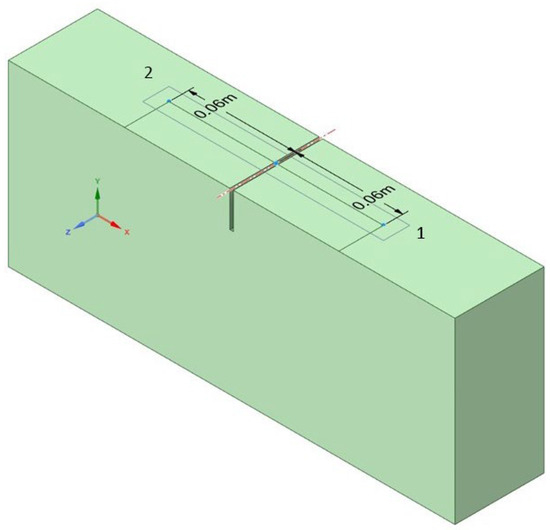
Figure 4.
Scheme of a block with a crack: 1—pulse application location; 2—point of the ultrasonic signal receiver.
A surface-breaking crack, characterized by a depth Hcr, width δ, and length L, is oriented such that it intersects the ultrasonic pulse application surface. Symmetrically from the edges of the crack, the source of ultrasonic waves is located at point 1, and the receiver at point 2. The distance between the points of pulse application and signal reception is 120 mm.
The equations of motion of the medium in the form of Biot’s equations have the form.
here, are the components of the displacement vector of the skeleton and pore, and are the densities of the skeleton, fluid in the pores, and the added density of the fluid in the pores. The components of the stress and strain tensor are determined from the expressions
here, are Biot constants, p is the fluid pressure.
The equations were solved numerically using the ANSYS Workbench module under the following boundary conditions. The displacements at the bottom surface of brick Ω are defined by these relationships.
Points on the lower surface are constrained, with zero displacement in the Y direction (UY = 0). The Z-directional displacement (UZ) is fixed at 0 for points located on the lower edge where x = 0. Nodes situated along the bottom edge, possessing an x-coordinate of 250 mm, exhibit zero displacement in the X direction (UX = 0).
A force is acting at pulse point 1 with coordinates
The results of numerical modeling in the form of stress, displacement, and strain fields made it possible to analyze the influence of crack depth on the shape and numerical characteristics of the ultrasonic signal, as well as to study the influence of the porosity of the medium on the nature of wave propagation in brickwork weakened by cracks.
2.3. Methods
The research methodology is based primarily on regulatory and technical documents and the existing instrumentation base based on the principle of availability and repeatability of measurement results, as well as their reproducibility. In order for this study to be verifiable, it is proposed to rely on ultrasonic methods for determining the properties of building materials that reflect their structure, in particular porosity. The approved measuring instrument, entered as in the relevant register, a PULSAR-2.2 device, served as the instrumentation base.
The methodology of the instrumental physical experiment corresponded to the methodology for working with this device. The research related to the creation of a complex of automated measurement methods was based on the principles of working with data based on artificial intelligence. The material base of the study was samples of materials and products with specified factory characteristics, checked by us in a laboratory and in an experimental manner. The general scheme of the study included familiarization with the materials and products under study, conducting our own experimental measurements, building verification models, creating a database necessary for training artificial intelligence and developing a methodology for such a measurement, and, finally, proposals for implementation in real practice.
3. Results and Discussion
3.1. Numerical Analysis of the Impact of an Ultrasonic Pulse at Different Positions of the Device Relative to the Crack—Porous Media
The numerical study was carried out in the ANSYS (v. 2023 R1) software package using the finite element method. The Cam–Clay model [45,46,47,48,49] was used as a material model, which takes into account the nonlinear behavior of concrete under load and the porous structure of the material.
In the classical Cam–Clay model [50], the yield surface depends on the average stress p and the deviatoric stress q:
here, is hydrostatic pressure, is deviatoric stress intensity, M is a parameter related to the angle of internal friction, and is a hardening parameter (critical pressure).
The Initial Void Ratio parameter for specifying porosity is calculated using the formula
here, n is the porosity coefficient from Equation (1).
IVR = n/(1 − n)
In this analysis, the Porous Elasticity model, which is a component of the Cam–Clay model, is used to model porosity. The main parameters of this model are Swell Index, Elastic Limit of Tensile Strength, Poisson’s Ratio, and Initial Void Ratio (Table 2).
Table 2.
Parameters of the Cam–Clay model.
The ratio of the increment of plastic strain-stress in this case is determined by the following formula [51]:
here, C is the linearized stiffness tensor, which can be assigned as a function of the volume and shear moduli; is the bulk modulus; µ is the shear modulus; I is the second-order identity tensor; and is the fourth-order deviatoric projection tensor.
The change in the void ratio e is proportional to the change in the logarithmic pressure:
here, k is the swelling index, and p is the pressure.
Elastic deformation is related to emptiness by the following relationship:
here, is the initial void ratio.
The shear modulus does not depend directly on the void ratio or pressure, but Poisson’s ratio is constant, which leads to the following relationship for the shear modulus:
here, is Poisson’s coefficient.
The parameters of the Cam–Clay model are given in Table 2.
A spatial problem is considered (Figure 4), allowing for the analysis of the reflections of elastic waves from the edges of a brick weakened by cracks. The response curves of the ultrasonic signal at the reception point are shown in Figure 5. The time range up to 400 μs is considered, since further development of the signal is accompanied by reflection from the edges and distorts the characteristic points determining the crack depth.
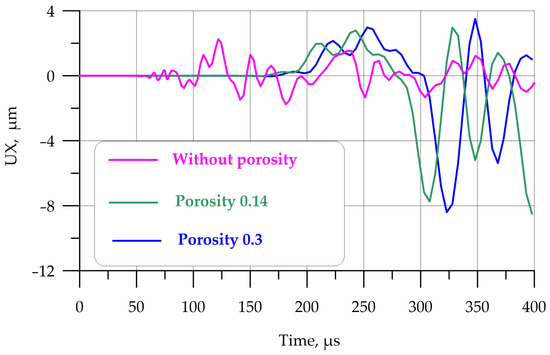
Figure 5.
Comparison of the ultrasonic pulse response in a brick with a 60 mm crack at different porosity coefficients: magenta line, without porosity; green, n = 0.14; blue, n = 0.3.
During the modeling, the crack depth Hcr and material porosity n varied in the ranges Hcr = 3…60 and n = 0…0.3.
From Figure 5, it is evident that porosity significantly shifts the signal along the time axis. The amplitude character of the signal remains similar, but the frequency (time) component changes. Similar changes are observed in the amplitude-frequency characteristic of the signal, which is the Fourier transform (Figure 6).
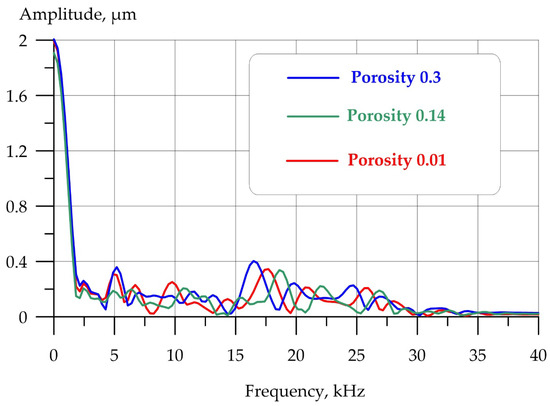
Figure 6.
Comparison of the amplitude-frequency characteristics of an ultrasonic pulse in a brick with a 60 mm crack at different porosity coefficients: red, n = 0.01; green, n = 0.14; blue, n = 0.3.
Analysis of the amplitude-time (ATC) and amplitude-frequency characteristics (AFC) of the response to ultrasonic action shows that porosity significantly changes the nature of the signal. More porous materials scatter the signal and extend the time it takes to reach the receiving point.
The successive evolution of the von Mises stress fields during the passage of an ultrasonic pulse for a brick with a 60 mm crack and porosity n = 0.14 is shown in Figure 7a–f.
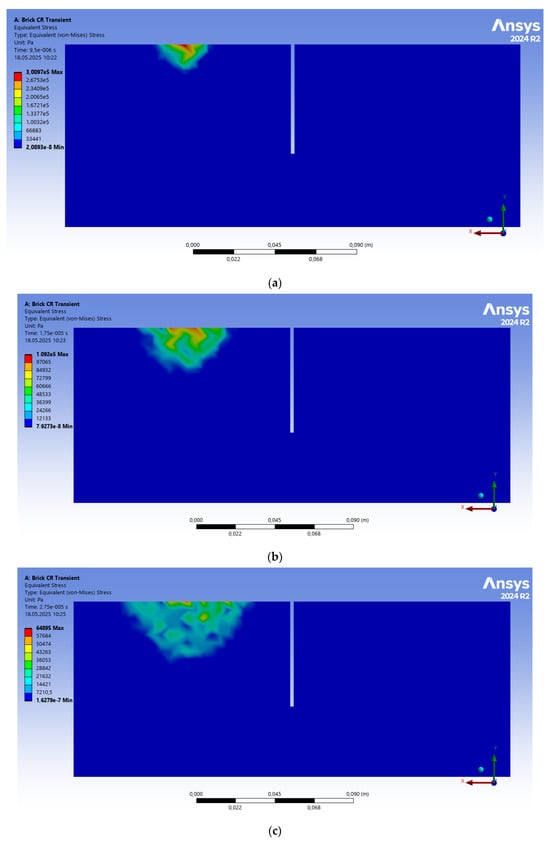
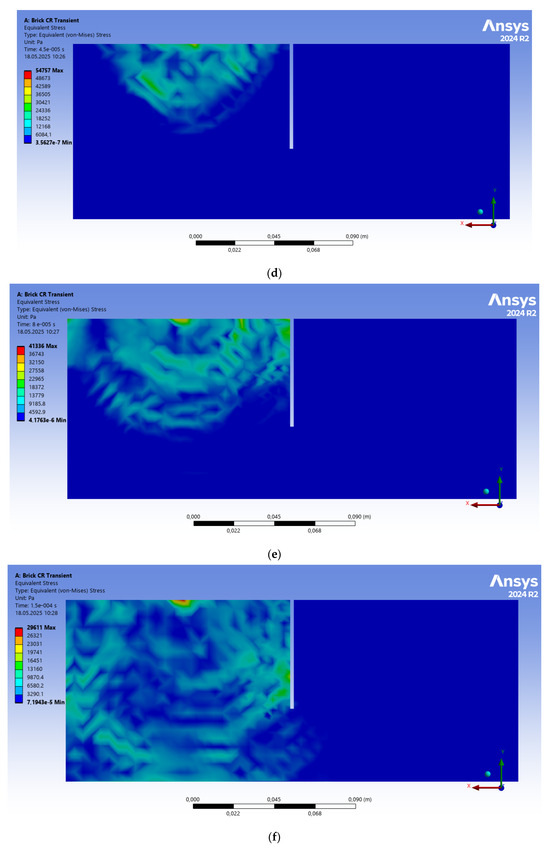
Figure 7.
Sequential development of equivalent von Mises stresses during the passage of an ultrasonic signal with a porosity of n = 0.14 and crack depth Hcr = 60 mm: (a) t = 9.5 μs, (b) t = 17.5 μs, (c) t = 27.5 μs, (d) t = 45 μs, (e) t = 80 μs, (f) t = 150 μs.
Figure 7 shows that the propagation of an ultrasonic pulse in a porous medium differs from a similar process in a continuous medium. The initial stage of pulse generation (Figure 7a) at t = 9.5 μs shows that the equivalent stress zones have a spherical character, similar to a continuous medium [40,52,53]. However, already in Figure 7b, it is evident that the sphericity of the equivalent stress zone is lost and has a blurred character, but a more energetic transverse wave is already generated. Figure 7c,d (t = 45 µs) enhances this blurriness and shows that the pulse reaches the rear wall. The reflected wave from the rear wall produces noise, which affects the pulse shape. Figure 7e,f clearly demonstrates that the ultrasonic wave collides with a crack, resting against it as if it were a wall. The crack breaks the wave front. The ultrasonic wave must bend around the crack to bypass the barrier and emerge on the surface at the point of pulse reception. Porosity leads to significant signal scattering and amplitude attenuation.
Figure 7e,f shows that the first wave, the longitudinal one, begins to significantly separate from the more energetic transverse wave (the equivalent stress zone, colored red and yellow). However, the longitudinal waves reflected from the brick walls introduce an error into the more energetic transverse wave and significantly distort the signal.
Thus, it seems appropriate to limit ourselves to the analysis of the passage of the longitudinal wave, as it is faster. The longitudinal wave must bypass the crack and approach the signal reception point faster. The influence of reflected waves from the brick walls is lower, and the signal is easier to interpret than filtering the response of a transverse wave with superimposed reflections.
3.2. Binary Crack Identification Using Machine Learning
Let us consider training a binary classifier for automatic crack detection based on a dataset obtained during ultrasonic diagnostics.
The collected dataset contains data on the diagnostics of 11 different building blocks. For each of them, 10 full-scale experiments were conducted during which ultrasonic diagnostics were carried out both for the case of no defects and for the case of an artificially formed crack of a given depth. The dataset prepared in this way contains data on 220 time series. Original signals experimentally obtained from different defects in the block are shown in Figure 8.
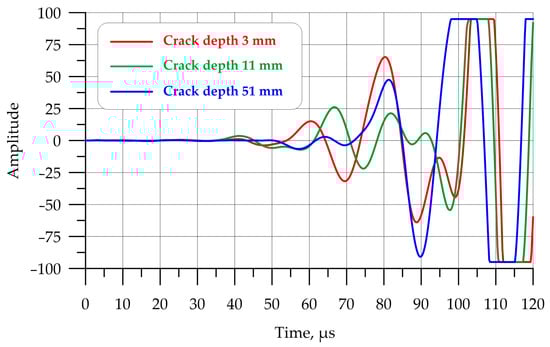
Figure 8.
Original signals experimentally obtained during ultrasound diagnostics: red—crack 3 mm; green—crack 11 mm; blue—crack 31 mm.
For the purposes of unique identification, as well as for the correct division of data into training and test samples, each measured series was assigned a unique numerical identifier formed from the block numbers, measurement, and a single sign of the presence of a defect in the block. The size of the test sample was taken as 30% of the total dataset. The proposed machine learning algorithm is used, among other things, to optimize the properties of building materials [54,55,56,57].
The TimeSeriesForestClassifier model from the SKTIME library [58] was used as a training model in the work, which allows the training of a time series classifier based on an ensemble of decision trees. To improve the predictive power of the model without an excessive increase in the volume of calculations, we studied how the quality metrics Accuracy and F1-score are affected by such a model hyperparameter as the number of decision trees in the ensemble, the value of which varied from 1 to 20 (Figure 9). It is evident from the graph that, already with the number of trees in the ensemble equal to 10, the values of the quality metrics take values of 0.99 or higher. A typical discrepancy matrix for such a classifier is given in Table 3.
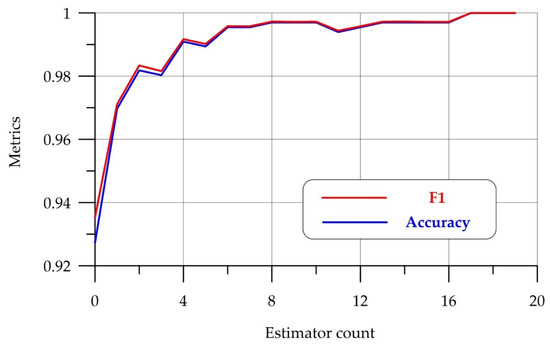
Figure 9.
Dependence of the Accuracy and F1 metrics on the number of trees in the ensemble.
Table 3.
Confusion matrix for a classifier with 10 decision trees.
Thus, the model used in the work is based on direct analysis of the time series obtained by ultrasonic scanning and the use of the tree ensemble algorithm for classifying time series. The classifier allows for high-precision detection of cracks in a building block and can be used as a basis for deploying automated quality control systems for building materials or as an element of the intellectualization of systems existing on the market.
3.3. Determining the Depth of a Crack Using Machine Learning Based on the Amplitude-Time Characteristic of a Signal
A more interesting task is not simply detecting the presence or absence of a crack but trying to predict its depth based on the measured signal, which is a classic regression problem.
The signals obtained numerically from different defects are shown in Figure 10.
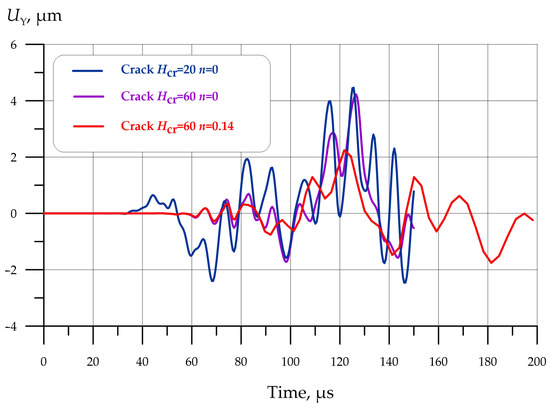
Figure 10.
Signals obtained numerically from different defects: blue—crack Hcr = 20 mm without porosity; magenta—crack Hcr = 60 mm without porosity; red—crack Hcr = 60 mm with porosity n = 0.14.
One method for solving such a problem based on a time series is to use an ensemble of decision trees, where each tree in the ensemble is trained on a random subset of features extracted from the time series [45]. Unlike the classic decision tree approach, which uses a fixed set of initial features, this approach generates time series features dynamically by calculating a number of statistics for a random set of intervals within the original time series. This generates a feature vector of dimension D = K∙M for each series, where K is the number of intervals and M is the number of statistics taken for each interval. In the classical case, the average value, standard deviation, and slope of each selected interval are considered as statistics, and the number of intervals is taken to be equal to the square root of the length of the original time series (), where N is the number of elements in the series. However, the approach described above, which relies solely on the characteristics of the original time series, does not allow additional features inherent in the real object of study to be taken into account in the process of training the ensemble. In our study, one of such important characteristics is the density of the material under study, since it significantly affects the propagation speed, attenuation strength, and internal reflection of the diagnostic ultrasonic wave, and, therefore, leads to a change in the amplitude-time characteristics of the measured signal. Thus, the final feature vector for training the regression model can be described as
here, are the mean, standard deviation, and slope of the j-th interval taken in the i-th row, and is the density of the material from which the time series was obtained.
During the training of the model, an ensemble of one hundred regressors was formed based on decision trees (decision tree regressor), for each of which its own set of interval boundaries was formed. Thus, each of the regressors in the ensemble relied on its own unique set of features, which was nevertheless selected according to the same rule for each of the measured time series. The size of the test sample was taken as 20% of the formed dataset. Predictions obtained by different regressors were averaged over the ensemble.
The scatter plot between the values of the real crack depth and the depth predicted by the trained model is shown in Figure 11.
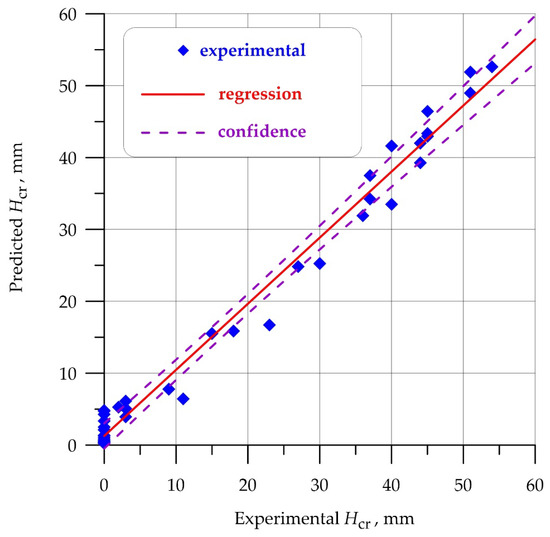
Figure 11.
Scatter plot of the “crack depth”—“predicted depth” pair.
The quality metrics of the resulting model are given in Table 4.
Table 4.
Quality metrics of the resulting crack depth prediction model.
The results indicate that material density, when considered within a machine learning framework, facilitates the development of a crack depth prediction model, exhibiting a determination coefficient of 0.983 and an error margin of 8%.
The findings represent a significant advancement in characterizing the structural properties and overall quality of porous materials and products. For stone materials used as wall products, porosity is one of the main parameters. It affects not only the mechanical safety of the building but also the thermal insulation characteristics of wall structures, as well as the overall picture of the life cycle of the constructed construction projects. From the point of view of comparing the proposed method with existing traditional methods, this method has a high level of automation, reduces the negative impact of the human factor on the measurement results and, in general, leads to an overall improvement in the quality of the processes of measurement, quality control, diagnostics, and monitoring of materials, products, and structures used at construction sites. Thus, the main result of this work is a significant improvement in the quality of work with objects, as well as a reduction in labor costs and material resources when carrying out quality control procedures, inspection, and monitoring at different stages of the life cycle of buildings and structures.
4. Conclusions
Based on this study’s findings, the following conclusions are drawn:
- Numerical modeling of porous media in the form of brickwork weakened by cracks was carried out. The results showed that the porous medium significantly changes the nature of the propagation of the ultrasonic pulse. A material with greater porosity distorts and scatters the signal more strongly, complicating the algorithm for determining the crack depth.
- An experiment was conducted to study the propagation of an ultrasonic wave in bricks weakened by cracks. A dataset for machine learning was created, and characteristic parameters of the time signal were determined. It was shown that taking into account porosity and density significantly refines the model.
- Binary identification of cracks using machine learning methods has proven its effectiveness. This study used the TimeSeriesForestClassifier model from the SKTIME library, which allows training a time series classifier based on an ensemble of decision trees. The proposed model allows for the detection of the presence of a crack with 100% accuracy.
- To determine the crack depth using machine learning methods, this study uses an approach based on the use of an ensemble of decision trees. During the training of the model, an ensemble of one hundred regressors was formed based on decision trees (decision tree regressor), for each of which its own set of interval boundaries was formed. The resulting model allows for the determination of the crack depth in brickwork with an accuracy of R2 = 0.983 and an error of up to 8%.
Author Contributions
Conceptualization, N.B., I.R., S.A.S., E.M.S., A.C. and D.E.; methodology, N.B., A.N.B., V.D. and I.R.; software, I.P., N.B., I.R. and V.D.; validation, V.D., N.B., I.P. and A.N.B.; formal analysis, I.P. and A.C.; investigation, I.P., S.A.S., N.B., E.M.S., A.N.B., V.D., A.C. and D.E.; resources, S.A.S. and E.M.S.; data curation, I.P. and I.R.; writing—original draft preparation, S.A.S., E.M.S., N.B., I.P., V.D. and A.N.B.; writing—review and editing, S.A.S., E.M.S., I.P., V.D. and A.N.B.; visualization, S.A.S., E.M.S., V.D., I.P., A.N.B. and N.B.; supervision, A.N.B.; project administration, A.N.B.; funding acquisition, E.M.S. All authors have read and agreed to the published version of the manuscript.
Funding
This research received no external funding.
Institutional Review Board Statement
Not applicable.
Informed Consent Statement
Not applicable.
Data Availability Statement
This study did not report any data.
Acknowledgments
The authors would like to acknowledge the administration of Don State Technical University for their resources.
Conflicts of Interest
The authors declare no conflicts of interest.
Abbreviations
The following abbreviations are used in this manuscript:
| CNN | Convolutional neural network |
| DNN | Deep neural network |
| RF | Random Forest |
| AFC | Amplitude-frequency characteristics |
| ATC | Amplitude-time characteristics |
| IVR | Initial Void Ratio |
References
- Wang, G.; Ke, J. Literature Review on the Structural Health Monitoring (SHM) of Sustainable Civil Infrastructure: An Analysis of Influencing Factors in the Implementation. Buildings 2024, 14, 402. [Google Scholar] [CrossRef]
- Ospitia, N.; Pourkazemi, A.; Tsangouri, E.; Tayeh, T.; Stiens, J.H.; Aggelis, D.G. Nondestructive Monitoring of Textile-Reinforced Cementitious Composites Subjected to Freeze–Thaw Cycles. Materials 2024, 17, 6232. [Google Scholar] [CrossRef] [PubMed]
- Abuassal, A.; Kang, L.; Martinho, L.; Kubrusly, A.; Dixon, S.; Smart, E.; Ma, H.; Sanders, D. A Review of Recent Advances in Unidirectional Ultrasonic Guided Wave Techniques for Nondestructive Testing and Evaluation. Sensors 2025, 25, 1050. [Google Scholar] [CrossRef]
- Yang, L.; Xie, H.; Fang, S.; Huang, C.; Yang, A.; Chao, Y.J. Experimental study on mechanical properties and damage mechanism of basalt fiber reinforced concrete under uniaxial compression. Structures 2021, 31, 330–340. [Google Scholar] [CrossRef]
- Wang, J.-Y.; Guo, J.-Y. Damage investigation of ultra high performance concrete under direct tensile test using acoustic emission techniques. Cem. Concr. Compos. 2018, 88, 17–28. [Google Scholar] [CrossRef]
- Huang, B.-T.; Li, Q.-H.; Xu, S.-L.; Zhou, B.-M. Tensile fatigue behavior of fiber-reinforced cementitious material with high ductility: Experimental study and novel P-S-N model. Constr. Build. Mater. 2018, 178, 349–359. [Google Scholar] [CrossRef]
- Geng, B.; Li, Z.; Zhao, Y.; Zhang, X. Peridynamics analysis of crack propagation in concrete considering random aggregate distribution. Sci. Rep. 2025, 15, 4172. [Google Scholar] [CrossRef]
- Puzatova, A.V.; Dmitrieva, M.A.; Tovpinets, A.O.; Leitsin, V.N. Study of Structural Defects Evolution in Fine-Grained Concrete Using Computed Tomography Methods. Adv. Eng. Res. 2024, 24, 227–237. [Google Scholar] [CrossRef]
- Zhang, D.; Zhang, S.; Chayan, S.M.; Fan, Y.; Shah, S.P.; Zheng, J. Time-frequency characterization of acoustic emission signals from bending damage of corroded reinforced concrete beams in high- temperature saline environment. Case Stud. Constr. Mater. 2025, 22, e04237. [Google Scholar] [CrossRef]
- Chen, Y.; Yu, D.; Wang, Y.; Zhao, Y.; Lin, H.; Meng, J.; Wu, H. Fracture evolution in steel fiber reinforced concrete (SFRC) of tunnel under static and dynamic loading based on DEM-FDM coupling model. Int. J. Coal Sci. Technol. 2025, 12, 9. [Google Scholar] [CrossRef]
- Karalar, M.; Başaran, B.; Aksoylu, C.; Zeybek, Ö.; Althaqafi, E.; Beskopylny, A.N.; Stel’makh, S.A.; Shcherban’, E.M.; Umiye, O.A. Utilizing recycled glass powder in reinforced concrete beams: Comparison of shear performance. Sci. Rep. 2025, 15, 6919. [Google Scholar] [CrossRef] [PubMed]
- Luo, X.; Zhang, S.; Zhang, Y.; Jiang, Y. Mechanical properties and cracking behavior of rebar reinforced UHPC (R-UHPC) under uniaxial tension: Evaluation and design. Case Stud. Constr. Mater. 2025, 22, e04243. [Google Scholar] [CrossRef]
- Li, H.; Pan, Q.; Zhang, X.; An, Z. An Approach to Size Sub-Wavelength Surface Crack Measurements Using Rayleigh Waves Based on Laser Ultrasounds. Sensors 2020, 20, 5077. [Google Scholar] [CrossRef]
- Li, H.; Zhang, R.; Pan, Q.; Wang, P. Quantitative Angle Measurement of the Inclined Surface Crack Based on Laser Ultrasonics. Sensors 2025, 25, 1486. [Google Scholar] [CrossRef]
- Zhang, X.; Li, B.; Jiang, Y.; Wu, F.; Gao, Y. Ambient vibration-based quantitative assessment on tunnel lining defect using laser Doppler vibrometer. Measurement 2025, 239, 115481. [Google Scholar] [CrossRef]
- Li, B.; Xu, H.; Jin, X.; Zhang, H.; Jin, S.; Chen, Q.; Wu, F. An Optimized Dual-View Snake Unet Model for Tunnel Lining Crack Detection. Buildings 2025, 15, 777. [Google Scholar] [CrossRef]
- Alamdari, A.G.; Ebrahimkhanlou, A. A multi-scale robotic approach for precise crack measurement in concrete structures. Autom. Constr. 2024, 158, 105215. [Google Scholar] [CrossRef]
- Shim, S.; Lee, S.-W.; Cho, G.-C.; Kim, J.; Kang, S.-M. Remote robotic system for 3D measurement of concrete damage in tunnel with ground vehicle and manipulator. Comput.-Aided Civ. Infrastruct. Eng. 2023, 38, 2180–2201. [Google Scholar] [CrossRef]
- Nyathi, M.A.; Bai, J.; Wilson, I.D. Deep Learning for Concrete Crack Detection and Measurement. Metrology 2024, 4, 66–81. [Google Scholar] [CrossRef]
- Beskopylny, A.N.; Stel’makh, S.A.; Shcherban’, E.M.; Razveeva, I.; Kozhakin, A.; Meskhi, B.; Chernil’nik, A.; Elshaeva, D.; Ananova, O.; Girya, M.; et al. Computer Vision Method for Automatic Detection of Microstructure Defects of Concrete. Sensors 2024, 24, 4373. [Google Scholar] [CrossRef]
- Razveeva, I.; Kozhakin, A.; Beskopylny, A.N.; Stel’makh, S.A.; Shcherban’, E.M.; Artamonov, S.; Pembek, A.; Dingrodiya, H. Analysis of Geometric Characteristics of Cracks and Delamination in Aerated Concrete Products Using Convolutional Neural Networks. Buildings 2023, 13, 3014. [Google Scholar] [CrossRef]
- Beskopylny, A.N.; Shcherban’, E.M.; Stel’makh, S.A.; Mailyan, L.R.; Meskhi, B.; Razveeva, I.; Kozhakin, A.; El’shaeva, D.; Beskopylny, N.; Onore, G. Discovery and Classification of Defects on Facing Brick Specimens Using a Convolutional Neural Network. Appl. Sci. 2023, 13, 5413. [Google Scholar] [CrossRef]
- Lin, Y.; Ahmadi, M.; Alnowibet, K.A.; Bukhari, F.A. Concrete crack detection using ridgelet neural network optimized by advanced human evolutionary optimization. Sci. Rep. 2025, 15, 4858. [Google Scholar] [CrossRef]
- Zhang, L.; Shen, J.; Zhu, B. A research on an improved Unet-based concrete crack detection algorithm. Struct. Health Monit. 2021, 20, 1864–1879. [Google Scholar] [CrossRef]
- Hacıefendioğlu, K.; Başağa, H.B. Concrete Road Crack Detection Using Deep Learning-Based Faster R-CNN Method. Iran. J. Sci. Technol. Trans. Civ. Eng. 2022, 46, 1621–1633. [Google Scholar] [CrossRef]
- Chepurnenko, A.S.; Kondratieva, T.N. Determining the Rheological Parameters of Polymers Using Machine Learning Techniques. Mod. Trends Constr. Urban Territ. Plan. 2024, 3, 71–83. [Google Scholar] [CrossRef]
- Kumar, R.; Kumar, S.; Rai, B.; Samui, P. Development of hybrid gradient boosting models for predicting the compressive strength of high-volume fly ash self-compacting concrete with silica fume. Structures 2024, 66, 106850. [Google Scholar] [CrossRef]
- Kumar, S.; Kumar, R.; Rai, B.; Samui, P. Prediction of compressive strength of high-volume fly ash self-compacting concrete with silica fume using machine learning techniques. Constr. Build. Mater. 2024, 438, 136933. [Google Scholar] [CrossRef]
- Hematibahar, M.; Kharun, M.; Beskopylny, A.N.; Stel’makh, S.A.; Shcherban’, E.M.; Razveeva, I. Analysis of Models to Predict Mechanical Properties of High-Performance and Ultra-High-Performance Concrete Using Machine Learning. J. Compos. Sci. 2024, 8, 287. [Google Scholar] [CrossRef]
- Beskopylny, A.N.; Stel’makh, S.A.; Shcherban’, E.M.; Mailyan, L.R.; Meskhi, B.; Razveeva, I.; Kozhakin, A.; Pembek, A.; Elshaeva, D.; Chernil’nik, A.; et al. Prediction of the Compressive Strength of Vibrocentrifuged Concrete Using Machine Learning Methods. Buildings 2024, 14, 377. [Google Scholar] [CrossRef]
- Kumar, R.; Prakash, S.; Rai, B.; Samui, P. Development of a prediction tool for the compressive strength of ternary blended ultra-high performance concrete using machine learning techniques. J. Struct. Integr. Maint. 2024, 9, 2385206. [Google Scholar] [CrossRef]
- Shen, J.; Liu, L.; Shi, Z.; Li, S.; Peng, M.; Wang, Y.; Liu, C. Fast concrete crack depth detection using low frequency ultrasound array SH waves data. J. Appl. Geophys. 2024, 230, 105530. [Google Scholar] [CrossRef]
- Saini, A.; Fang, J.; Tang, H. The multi-mode reverse time migration for defect characterization using ultrasonic array. NDT E Int. 2025, 151, 103293. [Google Scholar] [CrossRef]
- Hu, F.; Gou, H.-Y.; Yang, H.-Z.; Yan, H.; Ni, Y.-Q.; Wang, Y.-W. Automatic PAUT crack detection and depth identification framework based on inspection robot and deep learning method. J. Infrastruct. Intell. Resil. 2025, 4, 100113. [Google Scholar] [CrossRef]
- Lyu, D.; Xiao, X.; Hu, H.; Liu, Z.; Wang, X.; Xu, N. Orientation characterisation of branched crack-like defects in curved components using ultrasonic array vector total focusing method. Nondestruct. Test. Eval. 2025, 1–18. [Google Scholar] [CrossRef]
- Rijal, M.; Amoateng-Mensah, D.; Sundaresan, M.J. Finite Element Simulation of Acoustic Emissions from Different Failure Mechanisms in Composite Materials. Materials 2024, 17, 6085. [Google Scholar] [CrossRef]
- Tanveer, M.; Elahi, M.U.; Jung, J.; Azad, M.M.; Khalid, S.; Kim, H.S. Recent Advancements in Guided Ultrasonic Waves for Structural Health Monitoring of Composite Structures. Appl. Sci. 2024, 14, 11091. [Google Scholar] [CrossRef]
- Hu, F.; Gou, H.; Yang, H.; Ni, Y.-Q.; Wang, Y.-W.; Bao, Y. Digital twin-based fatigue life assessment of orthotropic steel bridge decks using inspection robot and deep learning. Autom. Constr. 2025, 172, 106022. [Google Scholar] [CrossRef]
- Hawwat, S.-E.; Shah, J.K.; Wang, H. Machine learning supported ultrasonic testing for characterization of cracks in polyethylene pipes. Measurement 2025, 240, 115609. [Google Scholar] [CrossRef]
- Beskopylny, A.N.; Stel’makh, S.A.; Shcherban’, E.M.; Dolgov, V.; Razveeva, I.; Beskopylny, N.; Elshaeva, D.; Chernil’nik, A. Determination of Crack Depth in Brickworks by Ultrasonic Methods: Numerical Simulation and Regression Analysis. J. Compos. Sci. 2024, 8, 536. [Google Scholar] [CrossRef]
- Sobol, B.V.; Soloviev, A.N.; Vasiliev, P.V.; Lyapin, A.A. Modeling of Ultrasonic Flaw Detection Processes in the Task of Searching and Visualizing Internal Defects in Assemblies and Structures. Adv. Eng. Res. 2023, 23, 433–450. [Google Scholar] [CrossRef]
- Jasiūnienė, E.; Vaitkūnas, T.; Šeštokė, J.; Griškevičius, P. Digital Image Correlation and Ultrasonic Lamb Waves for the Detection and Prediction of Crack-Type Damage in Fiber-Reinforced Polymer Composite Laminates. Polymers 2024, 16, 1980. [Google Scholar] [CrossRef]
- Aslam, M.; Park, J.; Lee, J. A comprehensive study on guided wave dispersion in complex structures. Int. J. Mech. Sci. 2024, 269, 109089. [Google Scholar] [CrossRef]
- Capineri, L.; Bulletti, A. Ultrasonic Guided-Waves Sensors and Integrated Structural Health Monitoring Systems for Impact Detection and Localization: A Review. Sensors 2021, 21, 2929. [Google Scholar] [CrossRef]
- Safari, A.; Taheri, A.; Karakus, M. A New Yield Surface for Cemented Paste Backfill Based on the Modified Structured Cam-Clay. Minerals 2025, 15, 4. [Google Scholar] [CrossRef]
- Chen, Q.; Zheng, H.; Tian, D. Application of Dimension Extending Technique to Unified Hardening Model. Appl. Sci. 2024, 14, 5677. [Google Scholar] [CrossRef]
- Pyatina, T.; Sugama, T.; Moghadam, A.; Naumann, M.; Skorpa, R.; Feneuil, B.; Soustelle, V.; Godøy, R. Assessment of Cementitious Composites for High-Temperature Geothermal Wells. Materials 2024, 17, 1320. [Google Scholar] [CrossRef]
- Wróżyńska, M. Tailings Behavior Assessment Using Piezocone Penetration Test. Minerals 2024, 14, 208. [Google Scholar] [CrossRef]
- Levatti, H.U. Review of Methods to Solve Desiccation Cracks in Clayey Soils. Geotechnics 2023, 3, 808–828. [Google Scholar] [CrossRef]
- Borja, R.I.; Lee, S.R. Cam-clay plasticity, part 1: Implicit integration of elasto-plastic constitutive relations. Comput. Methods Appl. Mech. Eng. 1990, 78, 49–72. [Google Scholar] [CrossRef]
- ANSYS Inc. Fluent User’s Guide: Release 2025 R1 January 2022, Canonsburg, PA. 2022. [Electronic Resource]. Available online: https://ansyshelp.ansys.com/public (accessed on 21 May 2025).
- Franesqui, M.A.; Gallego, J. Inspection and depth sizing of surface-initiated cracking for preventive maintenance of asphalt pavements. Int. J. Pavement Eng. 2022, 24, 2083617. [Google Scholar] [CrossRef]
- Shinde, S.N.; Christa, S.; Grover, R.K.; Pasha, N.; Harinder, D.; Nakkeeran, G. Optimization of waste plastic fiber concrete with recycled coarse aggregate using RSM and ANN. Sci. Rep. 2025, 15, 7798. [Google Scholar] [CrossRef]
- Sapkota, S.C.; Panagiotakopoulou, C.; Dahal, D.; Beskopylny, A.N.; Dahal, S. Optimizing high-strength concrete compressive strength with explainable machine learning. Multiscale Multidiscip. Model. Exp. Des. 2025, 8, 160. [Google Scholar] [CrossRef]
- Samanth, M.; Hiremath, P.; Deepak, G.D.; Naik, N.; H S., A.; Heckadka, S.S.; Shivamurthy, R.C. Sustainable Composites from Sugarcane Bagasse Fibers and Bio-Based Epoxy with Insights into Wear Performance, Thermal Stability, and Machine Learning Predictive Modeling. J. Compos. Sci. 2025, 9, 124. [Google Scholar] [CrossRef]
- Cakiroglu, C.; Ahadian, F.; Bekdaş, G.; Geem, Z.W. Tensile Strength Predictive Modeling of Natural-Fiber-Reinforced Recycled Aggregate Concrete Using Explainable Gradient Boosting Models. J. Compos. Sci. 2025, 9, 119. [Google Scholar] [CrossRef]
- Laqsum, S.A.; Zhu, H.; Haruna, S.I.; Ibrahim, Y.E.; Al-shawafi, A. Mechanical and Impact Strength Properties of Polymer-Modified Concrete Supported with Machine Learning Method: Microstructure Analysis (SEM) Coupled with EDS. J. Compos. Sci. 2025, 9, 101. [Google Scholar] [CrossRef]
- SKTIME. Available online: https://www.sktime.net/en/stable/ (accessed on 11 May 2025).
Disclaimer/Publisher’s Note: The statements, opinions and data contained in all publications are solely those of the individual author(s) and contributor(s) and not of MDPI and/or the editor(s). MDPI and/or the editor(s) disclaim responsibility for any injury to people or property resulting from any ideas, methods, instructions or products referred to in the content. |
© 2025 by the authors. Licensee MDPI, Basel, Switzerland. This article is an open access article distributed under the terms and conditions of the Creative Commons Attribution (CC BY) license (https://creativecommons.org/licenses/by/4.0/).