
Design of Composite Systems Based on Hydrophilic Silica and Organic Acids: Gallic, Glycyrrhizic and Its Salts

 , , , and
Abstract
1. Introduction
2. Materials and Methods
2.1. Materials
2.2. X-Ray Diffraction (XRD)
2.3. Infrared Spectroscopy
2.4. Thermal Analysis
2.5. NMR Spectroscopy and Cryoporometry
2.6. Rheometry
3. Results
4. Conclusions
Author Contributions
Funding
Data Availability Statement
Acknowledgments
Conflicts of Interest
References
- Ow, Y.Y.; Stupans, I. Gallic acid and gallic acid derivatives: Effects on drug metabolizing enzymes (англ). Curr. Drug Metab. J. 2003, 4, 241–248. [Google Scholar] [CrossRef] [PubMed]
- Gu, C.; Howell, K.; Dunshea, F.R.; Suleria, H.A.R. LC-ESI-QTOF/MS characterization of phenolic acids and flavonoids in polyphenol-rich fruits and vegetables andtheir potential antioxidant activities. Antioxidants 2019, 8, 405. [Google Scholar] [CrossRef] [PubMed]
- Balkrishna, S.; Pokhrel, M.; Tomer, S.; Verma, A.; Kumar, P.; Nain, A.; Gupta, V. Anti-acetylcholinesterase activities of mono-herbal extracts and exhibited synergistic effects of the phytoconstituents: A biochemical and computational study. Molecules 2019, 24, 4175. [Google Scholar] [CrossRef]
- Govea-Salas, M.; Rivas-Estilla, A.M.; Rodríguez-Herrera, R.; Lozano-Sepúlveda, S.A.; Aguilar-Gonzalez, C.N.; Zugasti-Cruz, A.; Salas-Villalobos, T.B.; Morlett-Ch’avez, J.A. Gallic acid decreases hepatitis C virus expression through its antioxidant capacity. Exp. Ther. Med. 2016, 11, 619–624. [Google Scholar] [CrossRef] [PubMed]
- Nouri, A.; Heibati, F.; Heidarian, E. Gallic acid exerts anti-inflammatory, anti-oxidative stress, and nephroprotective effects against paraquat-induced renal injury in male rats. Naunyn Schmiedebergs Arch. Pharmacol. 2021, 394, 1–9. [Google Scholar] [CrossRef]
- BenSaad, L.A.; Kim, K.H.; Quah, C.C.; Kim, W.R.; Shahimi, M. Anti-inflammatory potential of ellagic acid, gallic acid and punicalagin A&B isolated from Punica granatum. BMC Complement. Altern. Med. 2017, 17, 47. [Google Scholar] [CrossRef]
- Bai, J.; Zhang, Y.; Tang, C.; Hou, Y.; Ai, X.; Chen, X.; Zhang, Y.; Wang, X.; Meng, X. Gallic acid: Pharmacological activities and molecular mechanisms involved in inflammation-related diseases. Biomed. Pharmacother. 2021, 133, 110985. [Google Scholar] [CrossRef]
- Lee, H.; Jeong, S.W.; Jung, E.; Lee, D. Dexamethasone-loaded H2O2-activatable anti-inflammatory nanoparticles for on-demand therapy of inflammatory respiratory diseases. Nanomed. Nanotechnol. Biol. Med. 2020, 30, 102301. [Google Scholar] [CrossRef]
- Hashimoto, O.; Kuniishi, H.; Nakatake, Y.; Yamada, M.; Wada, K.; Sekiguchi, M. Early life stress from allergic dermatitis causes depressive-like behaviors in adolescent male mice through neuroinflammatory priming. Brain Behav. Immun. 2020, 90, 319–331. [Google Scholar] [CrossRef]
- Kim, H.K.; Kim, M.; Kim, S.; Kim, M.; Chung, J.H. Effects of Green Tea Polyphenol on Cognitive and Acetylcholinesterase Activities. Biosci. Biotechnol. Biochem. 2004, 68, 1977–1979. [Google Scholar] [CrossRef]
- Lima, K.G.; Krause, G.C.; Schuster, A.D.; Catarina, A.V.; Basso, B.S.; De Mesquita, F.C.; Pedrazza, L.; Marczak, E.S.; Martha, B.A.; Nunes, F.B.; et al. Gallic acid reduces cell growth by induction of apoptosis and reduction of IL-8 in HepG2 cells. Biomed. Pharmacother. 2016, 84, 1282–1290. [Google Scholar] [CrossRef] [PubMed]
- Ho, H.H.; Chang, C.S.; Ho, W.C.; Liao, S.Y.; Lin, W.L.; Wang, C.J. Gallic acid inhibits gastric cancer cells metastasis and invasive growth via increased expression of RhoB, downregulation of AKT/small GTPase signals and inhibition of NF-κB activity. Toxicol. Appl. Pharmacol. 2013, 266, 76–85. [Google Scholar] [CrossRef]
- Schimites, P.I.; Segat, H.J.; Teixeira, L.G.; Martins, L.R.; Mangini, L.T.; Baccin, P.S.; Rosa, H.Z.; Milanesi, L.H.; Burger, M.E.; Soares, A.V. Gallic acid prevents ketamine-induced oxidative damages in brain regions and liver of rats. Neurosci. Lett. 2020, 714, 134560. [Google Scholar] [CrossRef] [PubMed]
- Vuolo, M.M.; Batista, A.G.; Biasoto, A.C.T.; Correa, L.C.; Júnior, M.R.M.; Liu, R.H. Red-jambo peel extract shows antiproliferative activity against HepG2 human hepatoma cells. Food Res. Int. 2019, 124, 93–100. [Google Scholar] [CrossRef]
- Shahrzad, S.; Aoyagi, K.; Winter, A.; Koyama, A.; Bitsch, I. Pharmacokinetics of gallic acid and its relative bioavailability from tea in healthy humans. J. Nutr. 2001, 131, 1207–1210. [Google Scholar] [CrossRef] [PubMed]
- Zhong, Y.X.; Jin, X.L.; Gu, S.Y.; Peng, Y.; Zhang, K.R.; Ou-Yang, B.C.; Wang, Y.; Xiao, W.; Wang, Z.Z.; Aa, J.Y.; et al. Integrated identification, qualification and quantification strategy for pharmacokinetic profile study of Guizhi Fuling capsule in healthy volunteers. Sci. Rep. 2016, 6, 31364. [Google Scholar] [CrossRef]
- Zhu, H.; Liu, X.; Zhu, T.T.; Wang, X.L.; Qin, K.M.; Pei, K.; Cai, B.C. UHPLC-MS/MS method for the simultaneous quantitation of five anthraquinones and gallic acid in rat plasma after oral administration of prepared rhubarb decoction and its application to a pharmacokinetic study in normal and acute blood stasis rats. J. Sep. Sci. 2017, 40, 2382–2389. [Google Scholar] [CrossRef]
- Tsang, M.S.; Jiao, D.; Chan, B.C.; Hon, K.L.; Leung, P.C.; Lau, C.B.; Wong, E.C.; Cheng, L.; Chan, C.K.; Lam, C.C.W.; et al. Anti-inflammatory activities of Pentaherbs Formula, Berberine, gallic acid and chlorogenic acid in atopic dermatitis-like skin inflammation. Molecules 2016, 21, 519. [Google Scholar] [CrossRef]
- Yoon, C.H.; Chung, S.J.; Lee, S.W.; Park, Y.B.; Lee, S.K.; Park, M.C. Gallic acid, a natural polyphenolic acid, induces apoptosis and inhibits proinflammatory gene expressions in rheumatoid arthritis fibroblast-like synoviocytes. Jt. Bone Spine 2013, 80, 274–279. [Google Scholar] [CrossRef]
- Correa, L.B.; P’adua, T.A.; Seito, L.N.; Costa, T.E.; Silva, M.A.; Cand’ea, A.L.; Rosas, E.C.; Henriques, M.G. Anti-inflammatory effect of Methyl Gallate on experimental arthritis: Inhibition of neutrophil recruitment, production of inflammatory mediators, and activation of macrophages. J. Nat. Prod. 2016, 79, 1554–1566. [Google Scholar] [CrossRef]
- Kononova, P.A.; Selyutina, O.Y.; Polyakov, N.E. Glycyrrhizic acid as a multifunctional drug carrier—From physicochemical properties to biomedical applications: A modern insight on the ancient drug. Membranes 2023, 13, 505. [Google Scholar] [CrossRef]
- Selyutina, O.Y.; Kononova, P.A.; Polyakov, N.E. Effect of glycyrrhizic acid on phospholipid membranes in media with different pH. Russ. Chem. Bull. 2021, 70, 2434–2439. [Google Scholar] [CrossRef]
- Selyutina, O.Y.; Polyakov, N.E. Glycyrrhizin-Assisted Transport of Praziquantel Anthelmintic Drug through the Lipid Membrane: An Experiment and MD Simulation. Int. J. Pharm. 2019, 559, 271–279. [Google Scholar] [CrossRef]
- Kim, A.V.; Shelepova, E.A.; Selyutina, O.Y.; Meteleva, E.S.; Dushkin, A.V.; Medvedev, N.N.; Polyakov, N.E.; Lyakhov, N.Z. Glycyrrhizic acid: A promising carrier material for anticancer therapy. Mol. Pharm. 2019, 16, 3188–3198. [Google Scholar] [CrossRef] [PubMed]
- Yazdi, I.; Chiappini, C.; Weiner, B.; Ferrari, M.; Tasciotti, E. Novel mesoporous silicon particles as an efficient sustained delivery system for antibiotics. In Proceedings of the 2010 NSTI Nanotechnology Conference and Expo, Anaheim, CA, USA, 21–24 June 2010; pp. 324–325. [Google Scholar]
- Khalbas, A.H.; Albayati, T.M.; Ali, N.S.; Salih, I.K. Drug loading methods and kinetic release models using of mesoporous silica nanoparticles as a drug delivery system: A review. S. Afr. J. Chem. Eng. 2024, 50, 261–280. [Google Scholar] [CrossRef]
- Tella, J.O.; Adekoya, J.A.; Ajanaku, K.O. Mesoporous silica nanocarriers as drug delivery systems for anti-tubercular agents: A review. R. Soc. Open Sci. 2022, 9, 220013. [Google Scholar] [CrossRef]
- Wei, Q.; Zheng, J.; Yang, W.; Krupska, T.V.; Klymenko NYu Vitiuk, N.V.; Terebinska, M.I.; Turov, V.V. Stabilization of weakly associated water forms by the surface of compacted methylsilica and its composites with Betulin. Colloids Surf. A Physicochem. Eng. Asp. 2024, 689, 133624. [Google Scholar] [CrossRef]
- Krupska, T.V.; Vitiuk, N.V.; Klymenko, N.Y.; Siora, I.V.; Turov, V.V. Composite medical systems based on hydrophobic silica and gelatin. Chem. Phys. Technol. Surf. 2024, 15, 280–290. [Google Scholar] [CrossRef]
- Gun’ko, V.M. Morphological and textural features of various materials composed of porous or nonporous nanoparticles differently packed in secondary structures. Appl. Surf. Sci. 2021, 569, 151117. [Google Scholar] [CrossRef]
- Gregg, S.J.; Sing, K.S.W. Adsorption, Surface Area and Porosity; Academic Press: London, UK, 1982. [Google Scholar]
- Adamson, A.W.; Gast, A.P. Physical Chemistry of Surface, 6th ed.; Wiley: New York, NY, USA, 1997. [Google Scholar]
- Rüger, R.; Franchini, M.; Trnka, T.; Yakovlev, A.; van Lenthe, E.; Philipsen, P.; van Vuren, T.; Klumpers, B.; Soini, N. AMS 2024.102. SCM, Theoretical Chemistry, Vrije Universiteit, Amsterdam, The Netherlands. Available online: https://www.scm.com (accessed on 6 February 2024).
- Stewart, J.J.P. MOPAC 2022.1.1, Stewart Computational Chemistry. Available online: http://OpenMOPAC.net (accessed on 6 February 2024).
- Gun’ko, V.M.; Turov, V.V. Nuclear Magnetic Resonance Studies of Interfacial Phenomena; CRC Press: Boca Raton, FL, USA, 2013. [Google Scholar]
- Strange, J.H.; Rahman, M.; Smith, E.G. Characterization of porous solids by NMR. Phys. Rev. Lett. 1993, 71, 3589–3591. [Google Scholar] [CrossRef] [PubMed]
- Mitchell, J.; Webber, J.B.W.; Strange, J.H. Nuclear magnetic resonance cryoporometry. Phys. Rep. 2008, 461, 1–36. [Google Scholar] [CrossRef]
- Kimmich, R. NMR Tomography, Diffusometry, Relaxometry; Springer: Heidelberg, Germany, 1997. [Google Scholar]
- Abragam, A. Principles of Nuclear Magnetic Resonance; Oxford Science Publcations: Oxford, UK, 1989. [Google Scholar]
- Gun’ko, V.M.; Turov, V.V. Interfacial Phenomena in Nanostructured Systems with Various Materials. ChemPhysChem 2024, 25, e202300622. [Google Scholar] [CrossRef]
- Glushko, V.P. (Ed.) Thermodynamic Properties of Individual Substances; Nauka: Moscow, Russia, 1978; 495p. [Google Scholar]
- Haddad, Y.M. Viscoelasticity of Engineering Materials; Chapman and Hall: London, UK, 1995; 378p. [Google Scholar]
- Gentile, L.; Silva, B.F.; Balog, S.; Mortensen, K.; Olsson, U. Structural transitions induced by shear flow and temperature variation in a nonionic surfactant/water system. J. Colloid Interface Sci. 2012, 372, 32. [Google Scholar] [CrossRef]
- Giomi, L.; Liverpool, T.B.; Marchetti, M.C. Sheared active fluids: Thickening, thinning, and vanishing viscosity. Phys. Rev. E 2010, 81, 051908. [Google Scholar] [CrossRef]
- Hatwalne, Y.; Ramaswamy, S.; Rao, M.; Simha, R.A. Rheology of Active-Particle Suspensions. Phys. Rev. Lett. 2004, 92, 118101. [Google Scholar] [CrossRef]


| System | h (mg/g) | CuwS (mg/g) | CuwW (mg/g) | CmsIce (mg/g) | ΔGS (kJ/mol) | γS (J/g) | γSIce (J/g) |
|---|---|---|---|---|---|---|---|
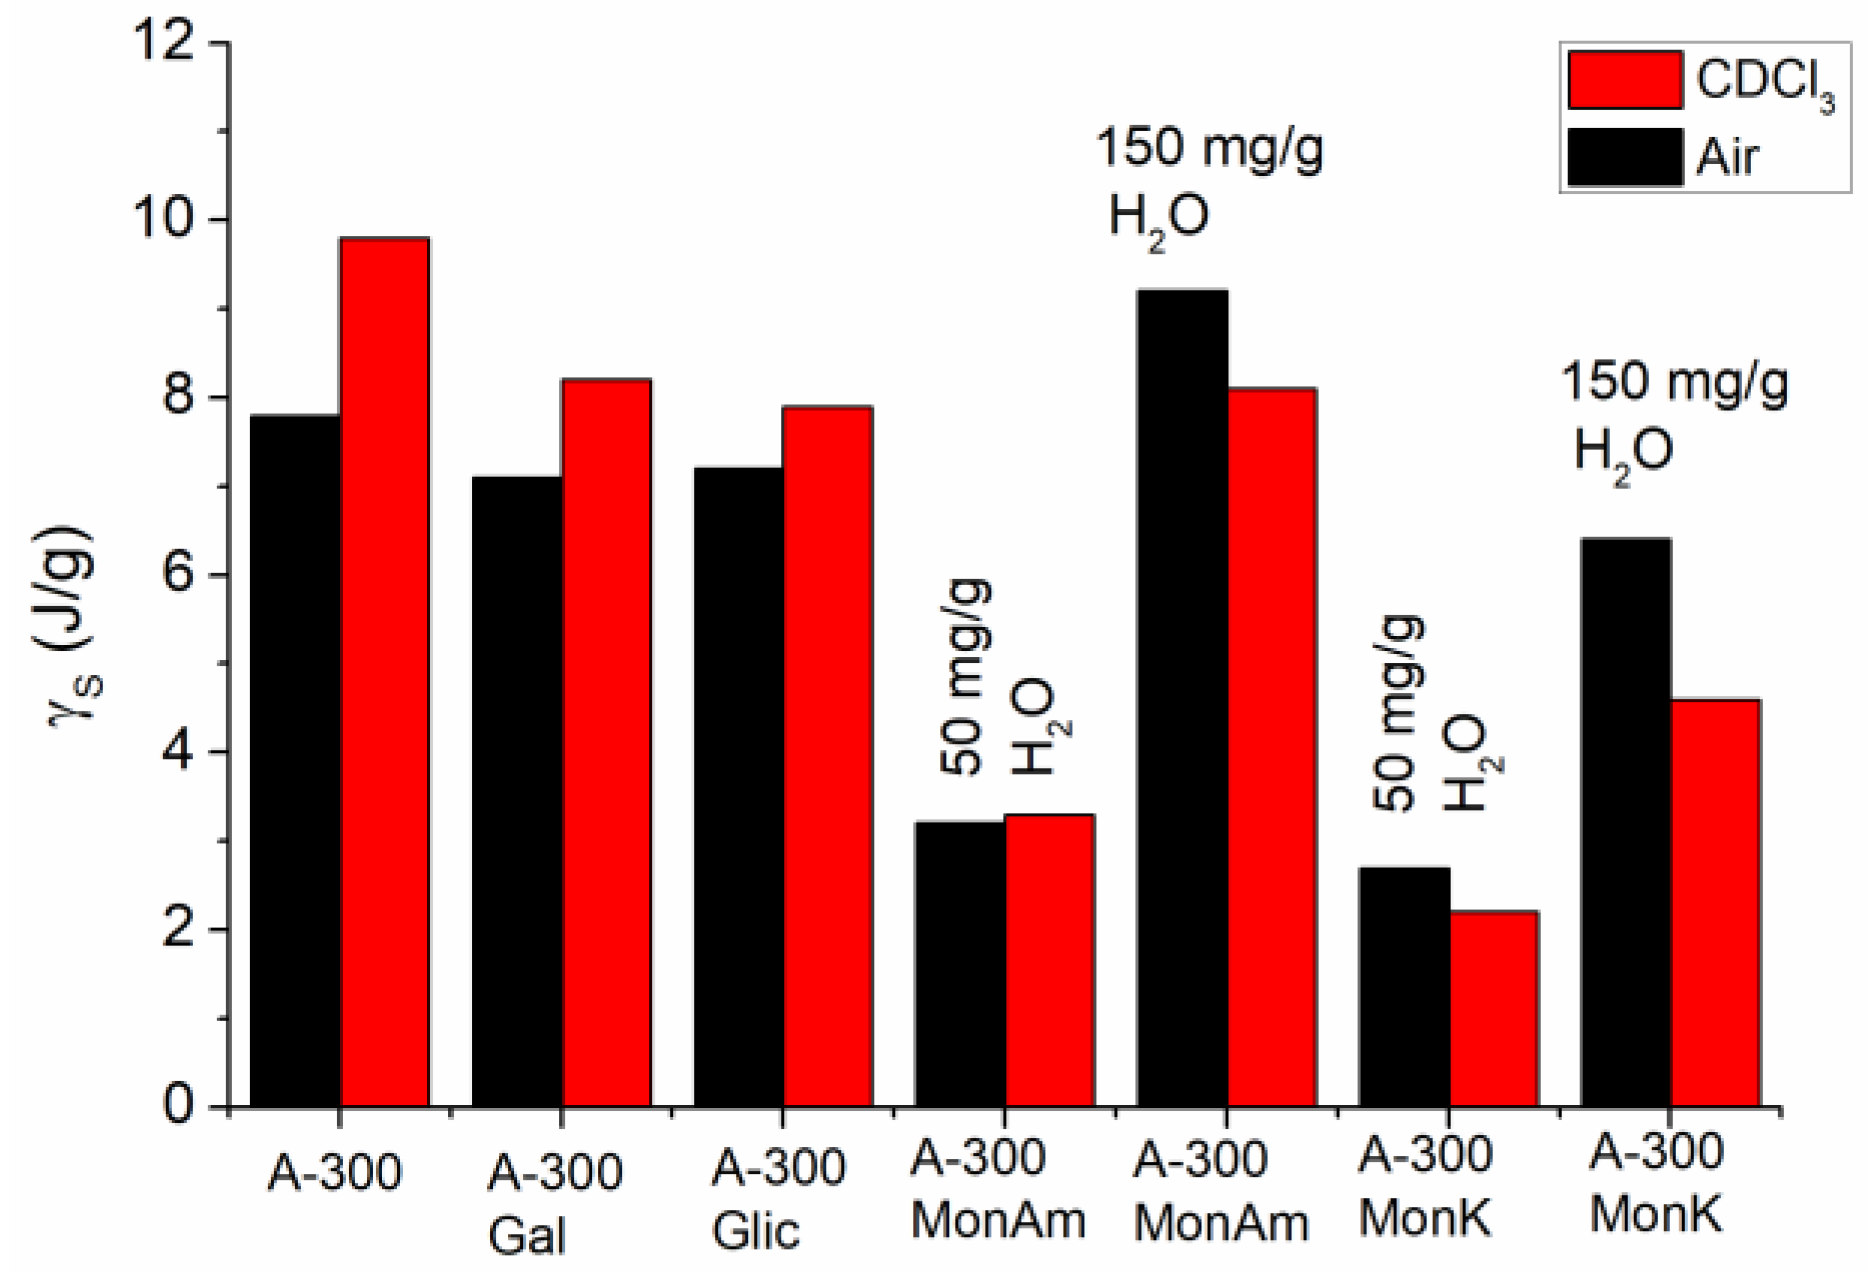
| A-300, Air | 150 | 125 | 15 | 10 | −2.5 | 7.8 | 0.15 |
| A-300, CDCl3 | 150 | 140 | 10 | 0 | −2.8 | 9.8 | - |
| A-300/GA, Air | 150 | 110 | 15 | 25 | −3 | 7.1 | 2.1 |
| A-300/GA, CDCl3 | 150 | 145 | 5 | 0 | −2.5 | 8.2 | - |
| A-300/GLA, Air | 150 | 75 | 20 | 55 | −2.8 | 7.2 | 1.1 |
| A-300/GLA, CDCl3 | 150 | 95 | 15 | 40 | −2.6 | 7.9 | 0.68 |
| A-300/MonAmGLA, Air | 50 | 28 | 5 | 17 | −3.5 | 3.2 | 0.29 |
| A-300/MonAmGLA, CDCl3 | 50 | 30 | 11 | 9 | −3 | 3.3 | 0.14 |
| A-300/MonAmGLA, Air | 150 | 100 | 15 | 35 | −3 | 9.2 | 0.49 |
| A-300/MonAmGLA, CDCl3 | 150 | 105 | 15 | 30 | −2.8 | 8.1 | 0.44 |
| A-300/MonKGLA, Air | 50 | 22.5 | 10 | 17.5 | −3 | 2.7 | 0.27 |
| A-300/MonKGLA, CDCl3 | 50 | 22.5 | 7.5 | 10 | −2.8 | 2.2 | 0.21 |
| A-300/MonKGLA, Air | 150 | 100 | 30 | 20 | −2.5 | 6.4 | 0.23 |
| A-300/MonKGLA, CDCl3 | 150 | 75 | 35 | 40 | −2.1 | 4.6 | 0.6 |
Disclaimer/Publisher’s Note: The statements, opinions and data contained in all publications are solely those of the individual author(s) and contributor(s) and not of MDPI and/or the editor(s). MDPI and/or the editor(s) disclaim responsibility for any injury to people or property resulting from any ideas, methods, instructions or products referred to in the content. |
© 2025 by the authors. Licensee MDPI, Basel, Switzerland. This article is an open access article distributed under the terms and conditions of the Creative Commons Attribution (CC BY) license (https://creativecommons.org/licenses/by/4.0/).
Share and Cite
Krupska, T.; Wei, Q.; Zheng, J.; Yang, W.; Holovan, A.; Borysenko, M.; Turov, V. Design of Composite Systems Based on Hydrophilic Silica and Organic Acids: Gallic, Glycyrrhizic and Its Salts. J. Compos. Sci. 2025, 9, 247. https://doi.org/10.3390/jcs9050247
Krupska T, Wei Q, Zheng J, Yang W, Holovan A, Borysenko M, Turov V. Design of Composite Systems Based on Hydrophilic Silica and Organic Acids: Gallic, Glycyrrhizic and Its Salts. Journal of Composites Science. 2025; 9(5):247. https://doi.org/10.3390/jcs9050247
Chicago/Turabian StyleKrupska, Tetiana, Qiliang Wei, Jinju Zheng, Weiyou Yang, Alina Holovan, Mykola Borysenko, and Volodymyr Turov. 2025. "Design of Composite Systems Based on Hydrophilic Silica and Organic Acids: Gallic, Glycyrrhizic and Its Salts" Journal of Composites Science 9, no. 5: 247. https://doi.org/10.3390/jcs9050247
APA StyleKrupska, T., Wei, Q., Zheng, J., Yang, W., Holovan, A., Borysenko, M., & Turov, V. (2025). Design of Composite Systems Based on Hydrophilic Silica and Organic Acids: Gallic, Glycyrrhizic and Its Salts. Journal of Composites Science, 9(5), 247. https://doi.org/10.3390/jcs9050247