
Electromagnetic Shielding Effectiveness of Carbon Nanotubes Hydrogel Nanocomposites in the Frequency Range from 1.7 to 6.0 GHz


Abstract

1. Introduction
2. Materials and Methods
2.1. Materials
2.2. Composites Preparation
2.2.1. Preparation of the Hydrogel Composite
2.2.2. Preparation of the Hydrogel Nanocomposite
2.3. Measurements and Characterization
2.3.1. Surface Morphology Characterization
2.3.2. Dielectric Properties Characterization
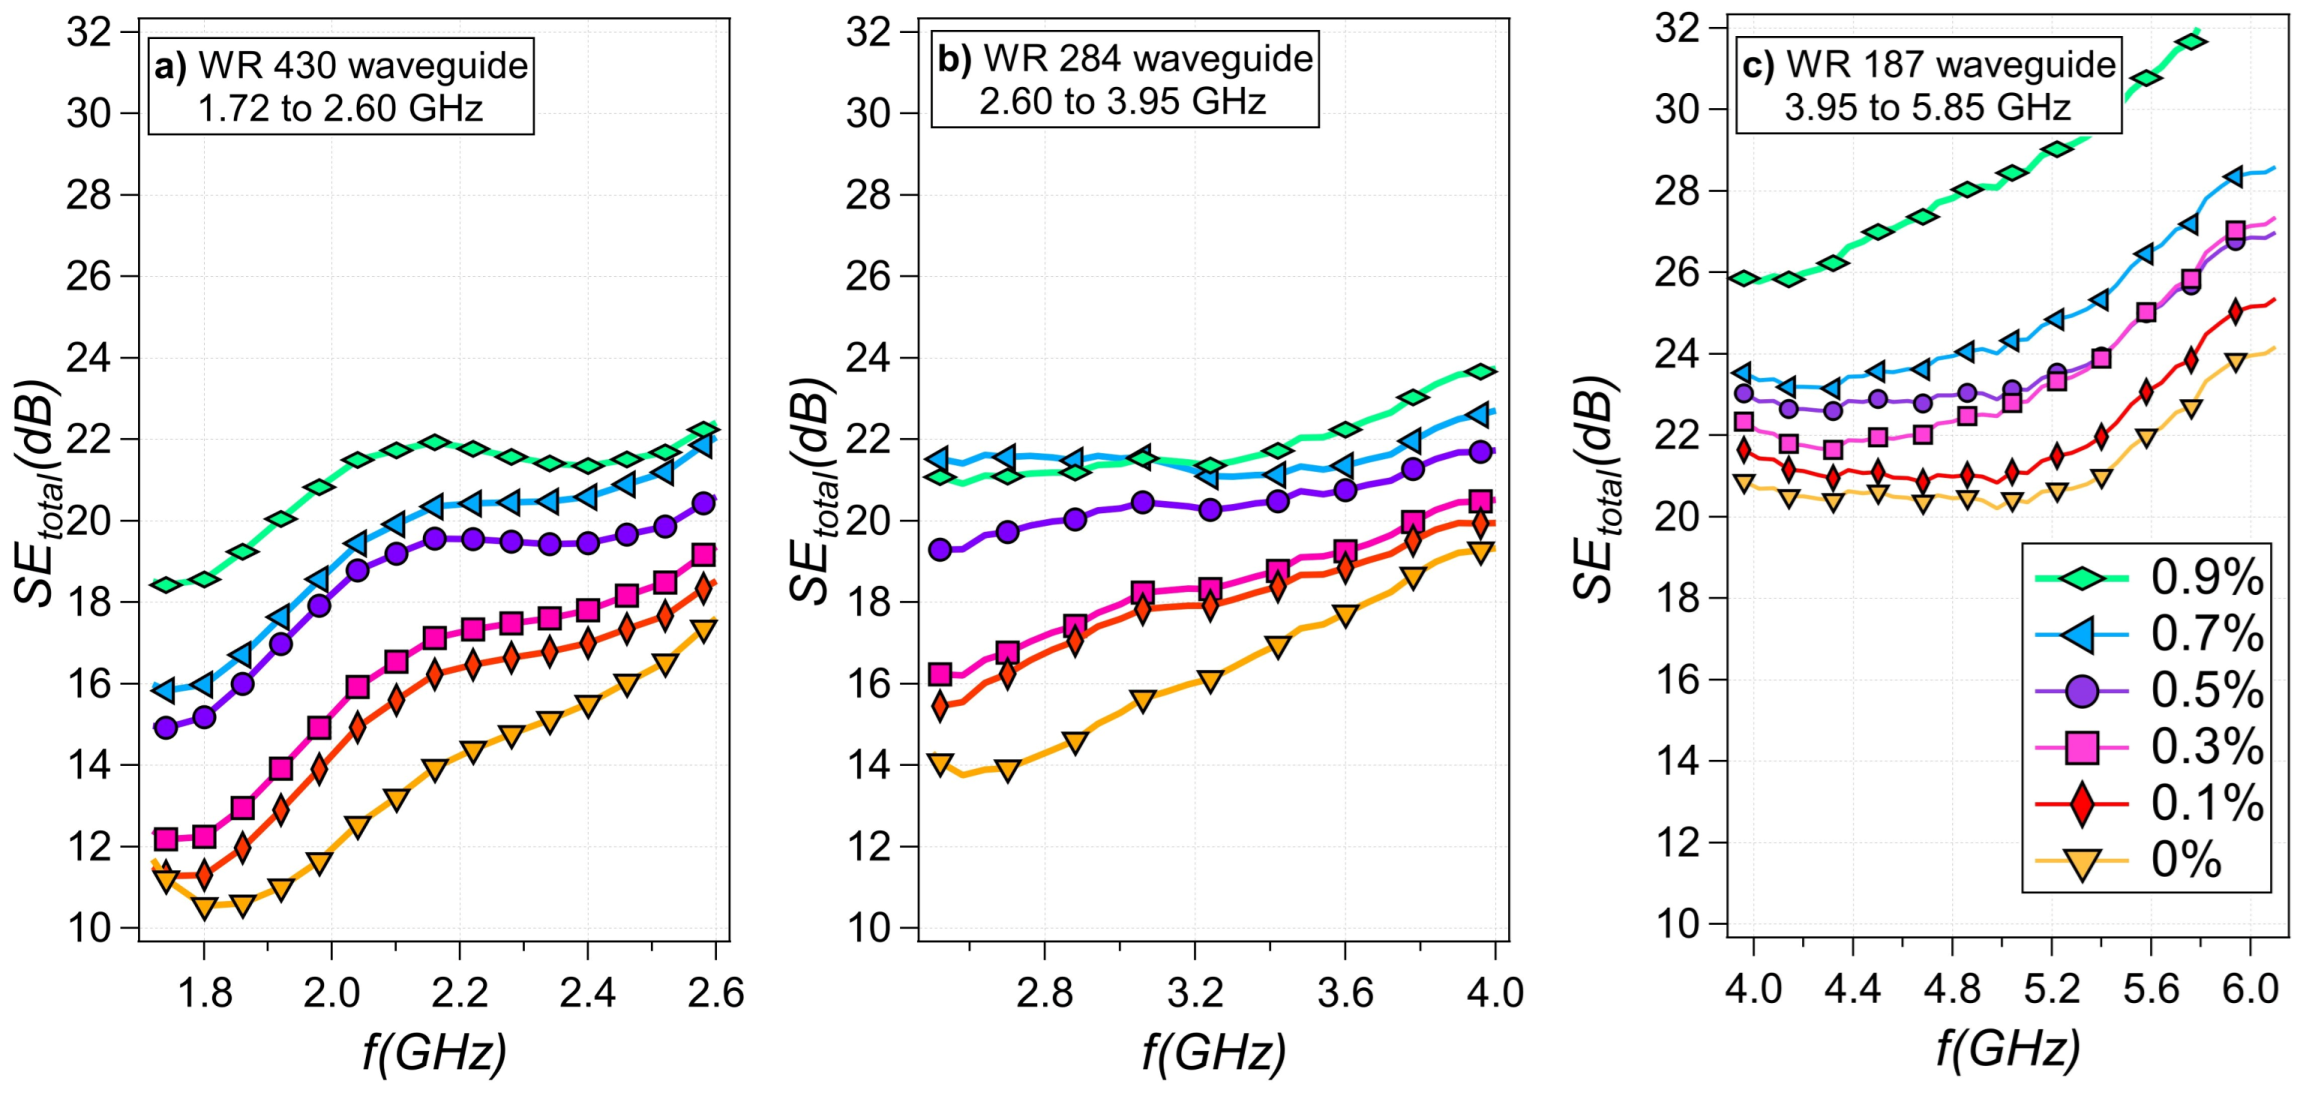
2.3.3. Electromagnetic Interference Shielding Characterization
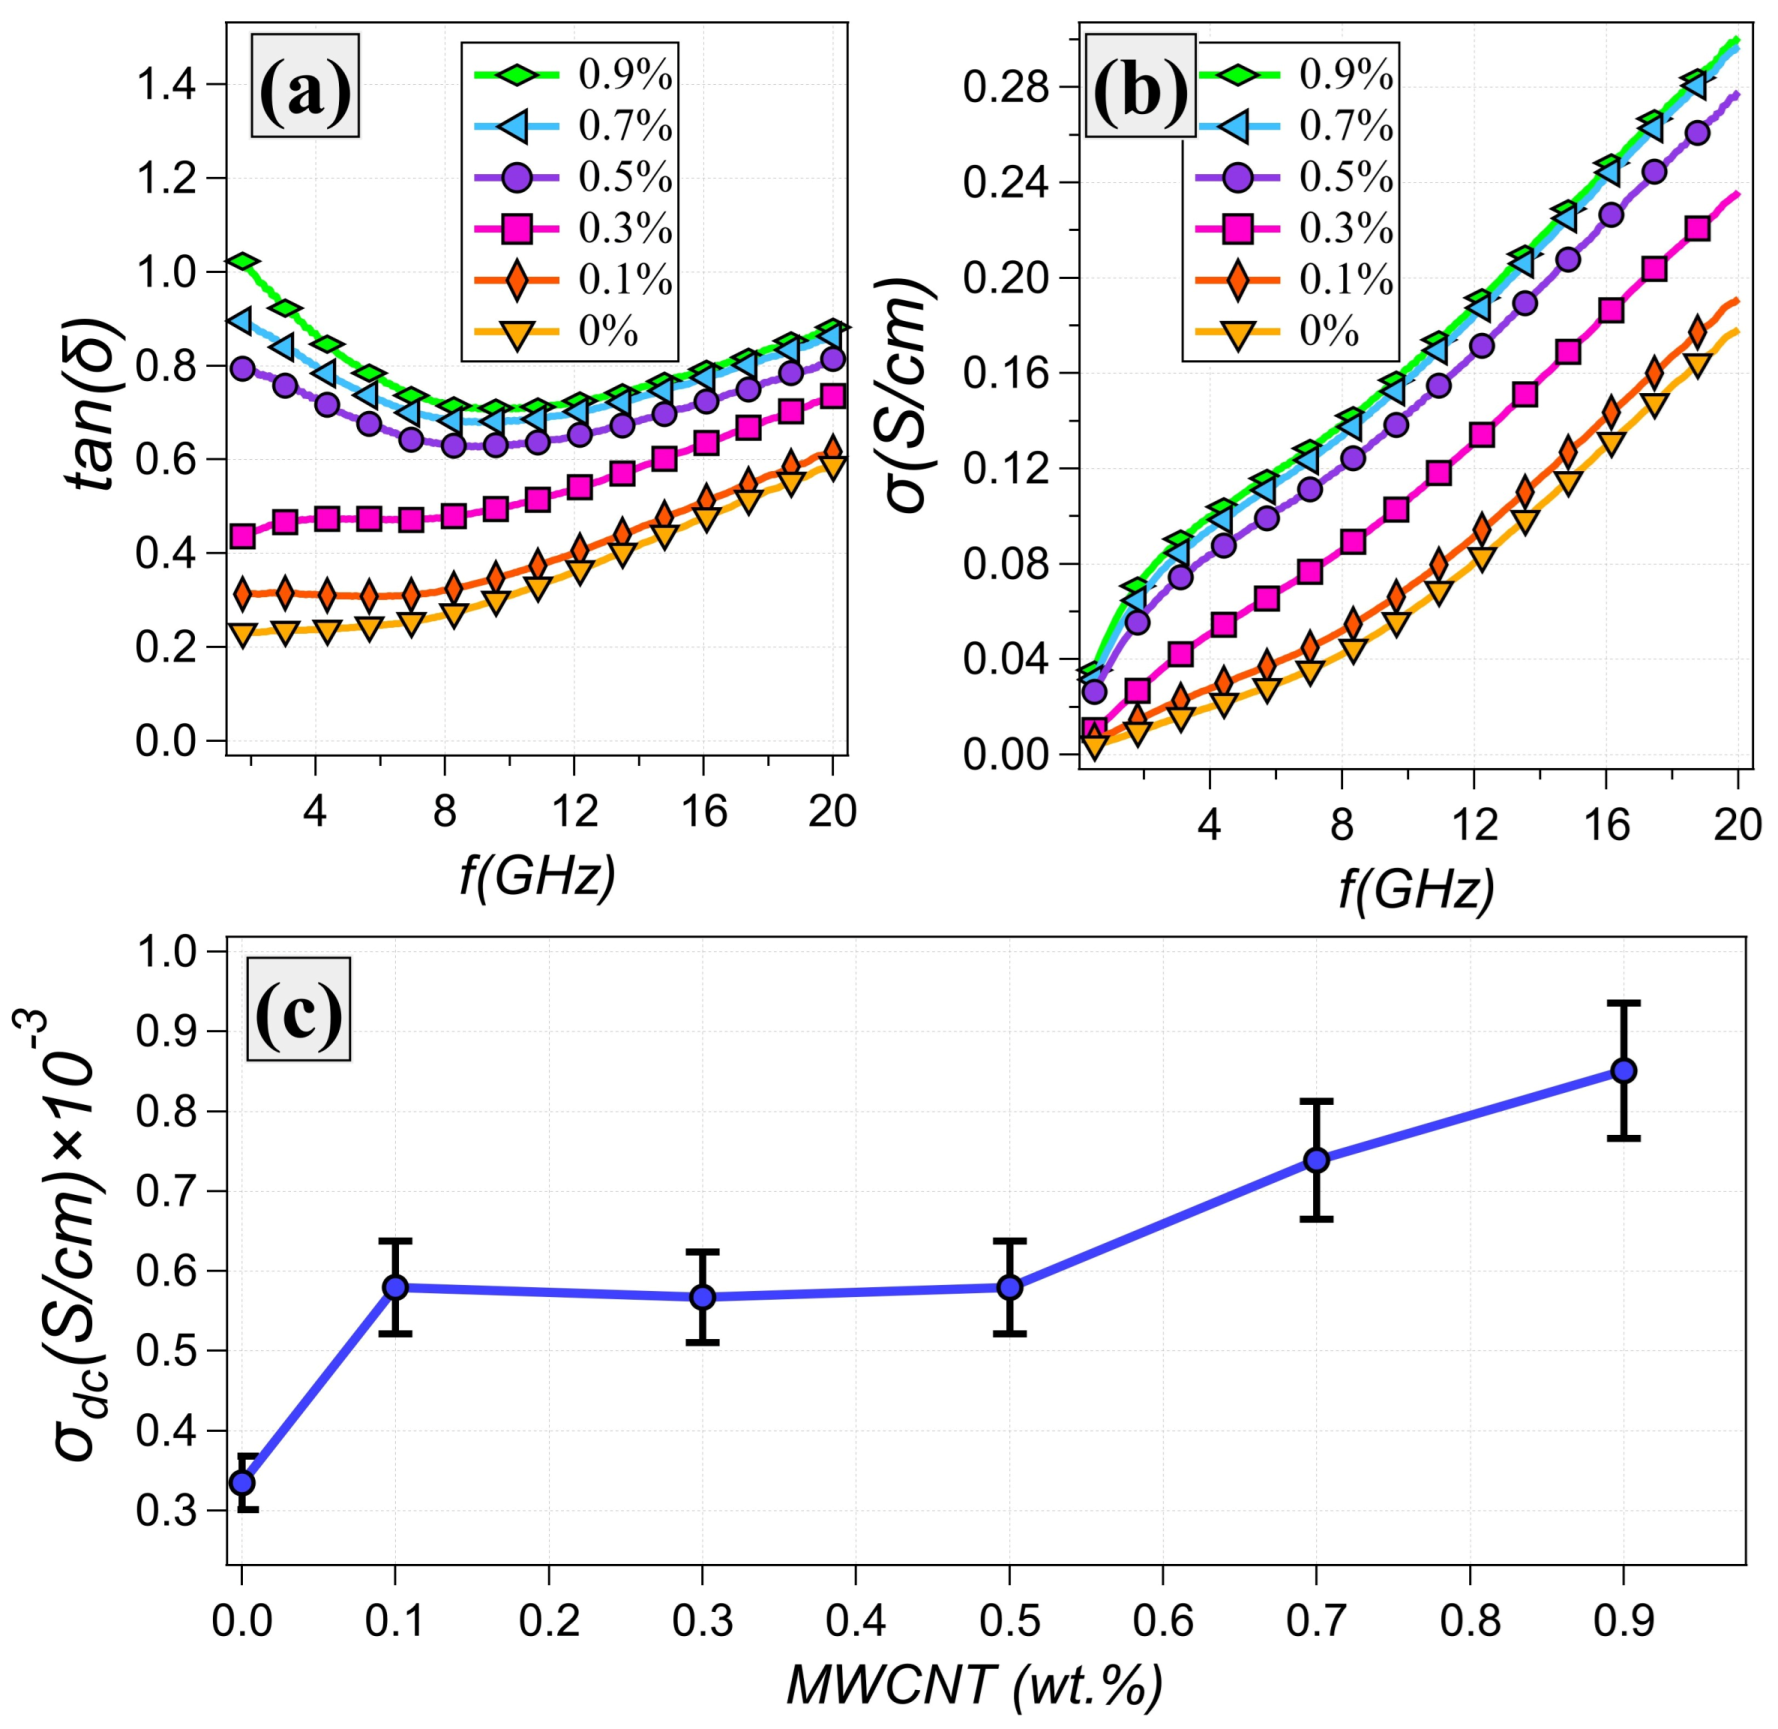
2.3.4. Electrical Conductivity Characterization
3. Results
3.1. SEM Analysis of Nanocomposite
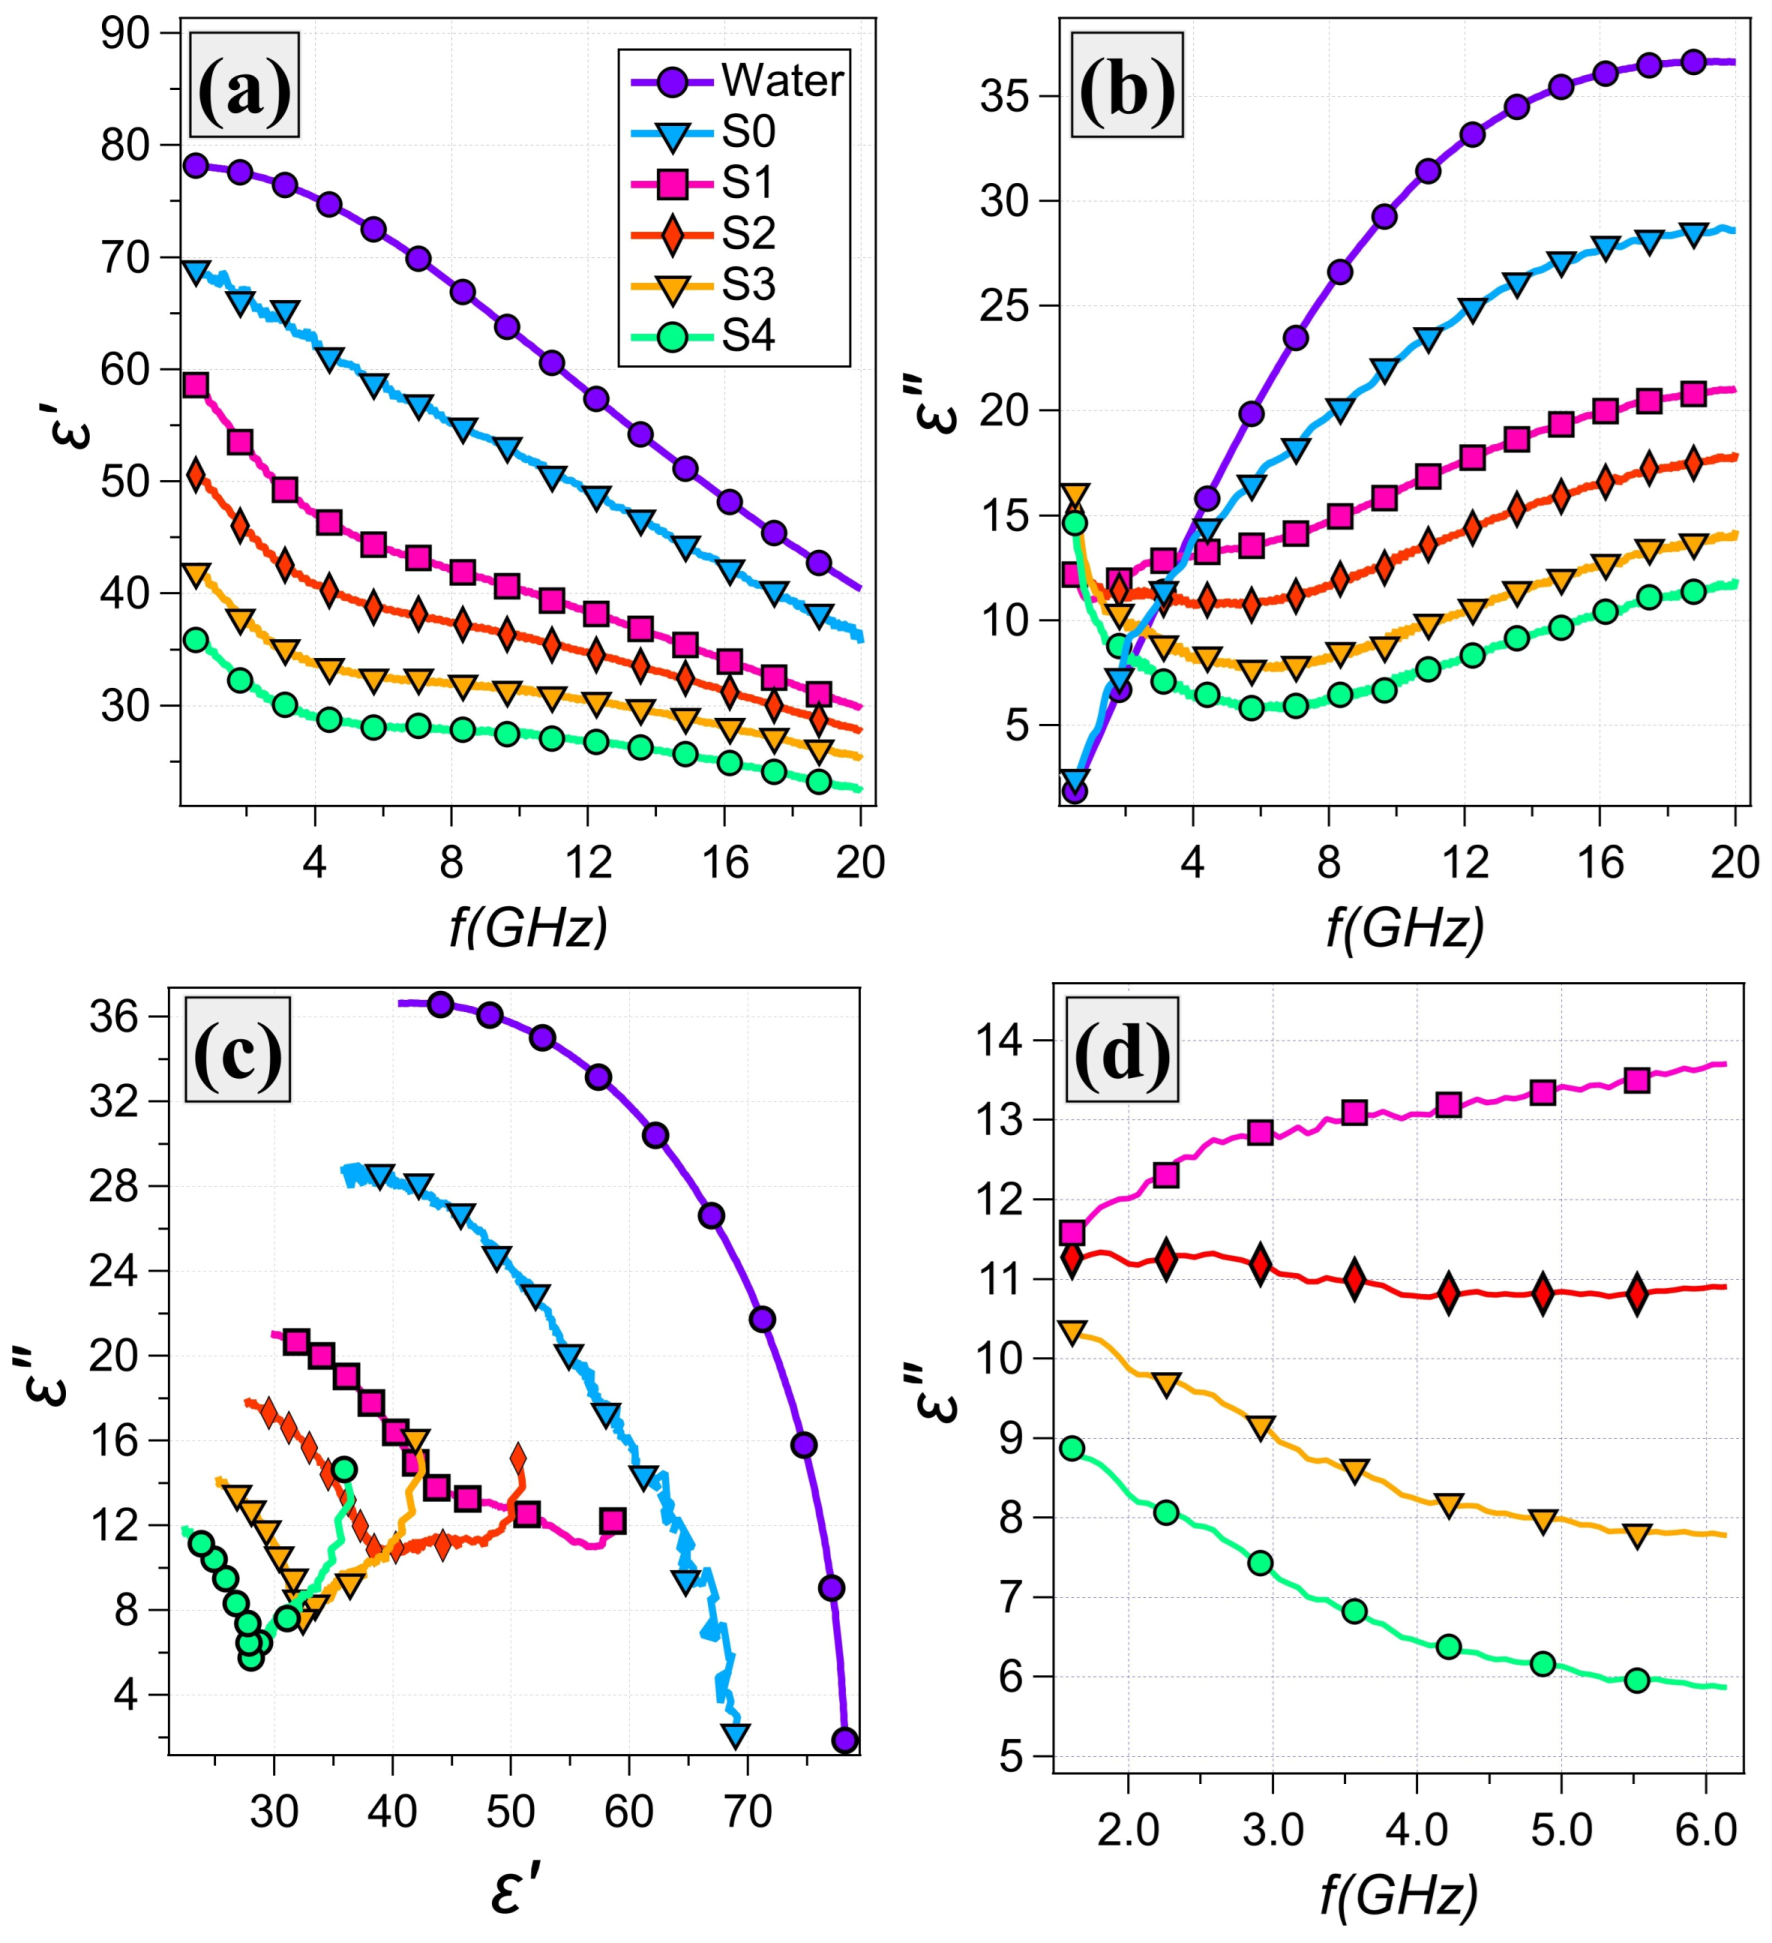
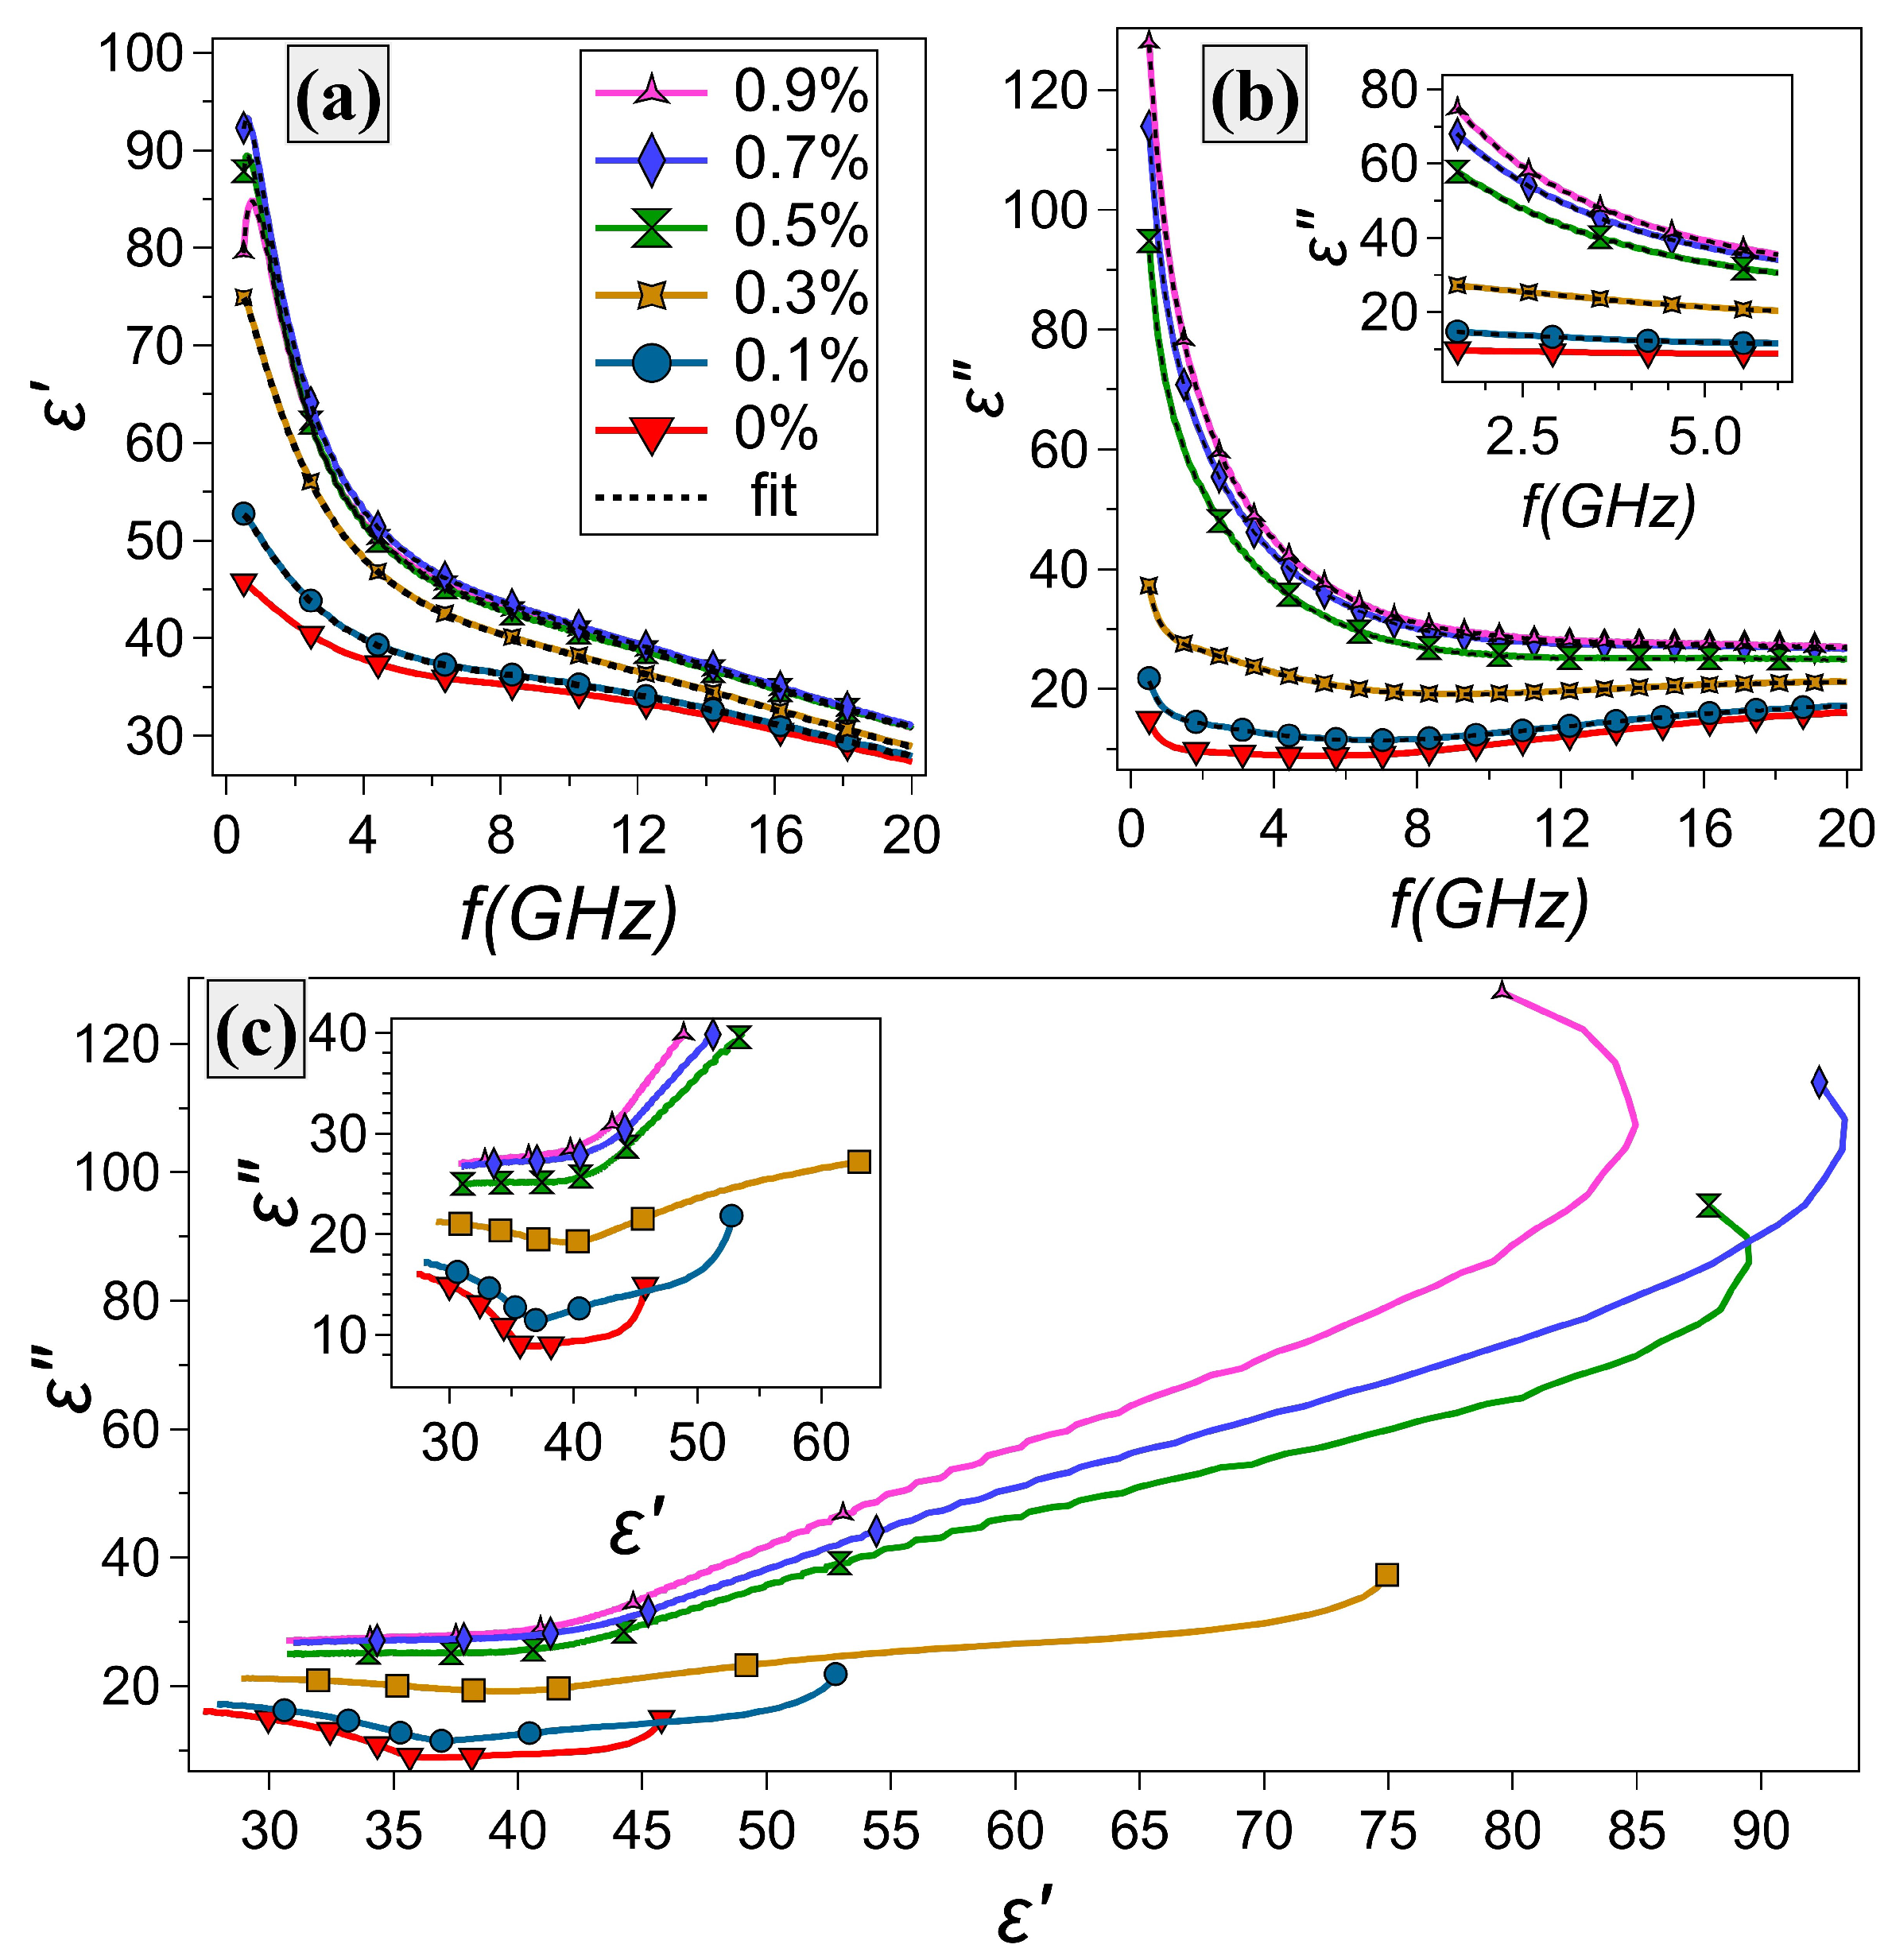
3.2. Dielectric Properties
3.3. EMI Shielding Effectiveness
4. Conclusions
Funding
Data Availability Statement
Acknowledgments
Conflicts of Interest
References
- Geetha, S.; Satheesh Kumar, K.K.; Rao, C.R.K.; Vijayan, M.; Trivedi, D.C. EMI shielding: Methods and materialsâ—A review. J. Appl. Polym. Sci. 2009, 112, 2073–2086. [Google Scholar] [CrossRef]
- Joseph, K.; Wilson, R.; George, G. Front Matter. In Materials for Potential EMI Shielding Applications; Elsevier: Amsterdam, The Netherlands, 2020; pp. i–ii. [Google Scholar] [CrossRef]
- Chung, D. Materials for electromagnetic interference shielding. Mater. Chem. Phys. 2020, 255, 123587. [Google Scholar] [CrossRef]
- Liu, J.; Yu, M.Y.; Yu, Z.Z.; Nicolosi, V. Design and advanced manufacturing of electromagnetic interference shielding materials. Mater. Today 2023, 66, 245–272. [Google Scholar] [CrossRef]
- Nguyen, T.T.L.; Cho, S.J.; Ko, J.; Nguyen, D.C.T.; Kim, M.W.; Kim, N.D.; Lee, D.S.; Joo, Y. Exceptional electromagnetic interference shielding using single-walled carbon nanotube/conductive polymer composites films with ultrathin, lightweight properties. Carbon 2024, 230, 119567. [Google Scholar] [CrossRef]
- Li, X.; Zeng, B.; Zheng, Y.; Zhou, J. Excellent mechanical and electromagnetic interference shielding properties of polylactic acid/polycaprolactone/multiwalled carbon nanotube composites enabled by a multilayer structure design. RSC Adv. 2024, 14, 20390–20397. [Google Scholar] [CrossRef]
- Wang, X.; Wang, G.; He, G.; Liao, X.; Song, P.; Zou, F.; Liu, S.; Luo, Y.; Li, G. Fabrication of lightweight flexible thermoplastic polyurethane/multiwalled carbon nanotubes composite foams for adjustable frequency-selective electromagnetic interference shielding by supercritical carbon dioxide. J. Supercrit. Fluids 2022, 188, 105675. [Google Scholar] [CrossRef]
- Iijima, S. Helical microtubules of Graphitic Carbon. Nature 1991, 354, 56–58. [Google Scholar] [CrossRef]
- Wu, D.; Wei, M.; Li, R.; Xiao, T.; Gong, S.; Xiao, Z.; Zhu, Z.; Li, Z. A percolation network model to predict the electrical property of flexible CNT/PDMS composite films fabricated by spin coating technique. Compos. Part B Eng. 2019, 174, 107034. [Google Scholar] [CrossRef]
- Elaskalany, M.; Behdinan, K. Effect of carbon nanotube type and length on the electrical conductivity of carbon nanotube polymer nanocomposites. Mater. Res. Express 2023, 10, 105010. [Google Scholar] [CrossRef]
- Hyung-ick Kim, H.; Wang, M.; Lee, S.K.; Kang, J.; Nam, J.D.; Ci, L.; Suhr, J. Tensile properties of millimeter-long multi-walled carbon nanotubes. Sci. Rep. 2017, 7, 2045–2322. [Google Scholar] [CrossRef]
- Aminul Islam, M.; Hasan, M.; Rahman, M.; Hosne Mobarak, M.; Akter Mimona, M.; Hossain, N. Advances and significances of carbon nanotube applications: A comprehensive review. Eur. Polym. J. 2024, 220, 113443. [Google Scholar] [CrossRef]
- Wang, Y.; Weng, G.J. Electrical Conductivity of Carbon Nanotube- and Graphene-Based Nanocomposites. In Micromechanics and Nanomechanics of Composite Solids; Meguid, S.A., Weng, G.J., Eds.; Springer International Publishing: Cham, Switzerland, 2018; pp. 123–156. [Google Scholar] [CrossRef]
- Lee, D.K.; Yoo, J.; Kim, H.; Kang, B.H.; Park, S.H. Electrical and Thermal Properties of Carbon Nanotube Polymer Composites with Various Aspect Ratios. Materials 2022, 15, 1356. [Google Scholar] [CrossRef] [PubMed]
- Takakura, A.; Beppu, K.; Nishihara, T.; Fukui, A.; Kozeki, T.; Namazu, T.; Miyauchi, Y.; Itami, K. Strength of carbon nanotubes depends on their chemical structures. Nat. Commun. 2019, 10, 3040. [Google Scholar] [CrossRef]
- Arash, B.; Wang, Q.; Varadan, V.K. Mechanical properties of carbon nanotube/polymer composites. Sci. Rep. 2014, 4, 6479. [Google Scholar] [CrossRef]
- Peng, L.M.; Zhang, Z.; Qiu, C. Carbon Nanotube Digital Electronics. Nat. Electron. 2019, 2, 499–505. [Google Scholar] [CrossRef]
- Saliev, T. The Advances in Biomedical Applications of Carbon Nanotubes. C 2019, 5, 29. [Google Scholar] [CrossRef]
- Muchuweni, E.; Mombeshora, E.T.; Martincigh, B.S.; Nyamori, V.O. Recent Applications of Carbon Nanotubes in Organic Solar Cells. Front. Chem. 2022, 9, 733552. [Google Scholar] [CrossRef]
- Raul, P.K.; Thakuria, A.; Das, B.; Devi, R.R.; Tiwari, G.; Yellappa, C.; Kamboj, D.V. Carbon Nanostructures As Antibacterials and Active Food-Packaging Materials: A Review. ACS Omega 2022, 7, 11555–11559. [Google Scholar] [CrossRef]
- Gohardani, O.; Elola, M.C.; Elizetxea, C. Potential and prospective implementation of carbon nanotubes on next generation aircraft and space vehicles: A review of current and expected applications in aerospace sciences. Prog. Aerosp. Sci. 2014, 70, 42–68. [Google Scholar] [CrossRef]
- Seng, L.Y.; Wee, F.H.; Rahim, H.A.; Malek, F.; You, K.Y.; Liyana, Z.; Jamlos, M.A.; Ezanuddin, A.A. EMI shielding based on mwcnts/polyester composites. Appl. Phys. A 2018, 124, 140. [Google Scholar] [CrossRef]
- Altarawneh, M.M.; Alharazneh, G.A.; Al-Madanat, O.Y. Dielectric properties of single wall carbon nanotubes-based gelatin phantoms. J. Adv. Dielectr. 2018, 8, 1850010. [Google Scholar] [CrossRef]
- Alam, R.B.; Ahmad, M.H.; Islam, M.R. Effect of MWCNT nanofiller on the dielectric performance of bio-inspired gelatin-based nanocomposites. RSC Adv. 2022, 12, 14686–14697. [Google Scholar] [CrossRef]
- Tarawneh, M.A.; Al Nawafleh, A.H.; Altarawneh, M.M.; Garalleh, H.A.; Afandi, A.; Maghrabi, L.; Husein Qwasmeh, A.A.; Al Ameryeen, H.A.; Algnamat, B.S.; Al-Douri, Y. Preparation and Characterization of Functionalized Multi-Walled Carbon Nanotubes (f-MWCNTs) Incorporated in Gelatin-Based Hydrogel Nanocomposites. J. Biomed. Nanotechnol. 2024, 20, 513–523. [Google Scholar] [CrossRef]
- Yoon, I.K.; Hwang, J.Y.; won Seo, J.; Jang, W.C.; Kim, H.W.; Shin, U.S. Carbon nanotube-gelatin-hydroxyapatite nanohybrids with multilayer core-shell structure for mimicking natural bone. Carbon 2014, 77, 379–389. [Google Scholar] [CrossRef]
- Altarawneh, M.; Aladailaha, M.; Al-Madanat, O. The Effect of Multi-Wall Carbon Nanotubes Addition on the Shielding Properties Against Gamma Radiation. East Eur. J. Phys. 2023, 524–530. [Google Scholar] [CrossRef]
- Kakapour, A.; Nouri Khorasani, S.; Khalili, S.; Hafezi, M.; Sattari-Najafabadi, M.; Najarzadegan, M.; Saleki, S.; Bagheri-Khoulenjani, S. An Injectable IPN Nanocomposite Hydrogel Embedding Nano Silica for Tissue Engineering Application. Macromol. Mater. Eng. 2024, 310, 2400242. [Google Scholar] [CrossRef]
- Xing, Q.; Yates, K.; Vogt, C.; Qian, Z.; Frost, M.C.; Zhao, F. Increasing Mechanical Strength of Gelatin Hydrogels by Divalent Metal Ion Removal. Sci. Rep. 2014, 4, 4706. [Google Scholar] [CrossRef] [PubMed]
- Shetty, H.D.; Ashok Reddy, G.; Ramasamy, V.; Kaliprasad, C.; Daruka Prasad, B.; Yogananda, H.; Naik, R.; Prasad, V.; Koyyada, G.; Anil Kumar, Y. Electrical conductivity and electromagnetic interference shielding effectiveness of elastomer composites: Comparative study with various filler systems. Inorg. Chem. Commun. 2023, 151, 110578. [Google Scholar] [CrossRef]
- Peymanfar, R.; Selseleh-Zakerin, E.; Ahmadi, A.; Saeidi, A.; Tavassoli, S.H. Preparation of self-healing hydrogel toward improving electromagnetic interference shielding and energy efficiency. Sci. Rep. 2021, 11, 16161. [Google Scholar] [CrossRef]
- Technologies, K. Keysight 85070E Dielectric Probe Kit 200 MHz to 50 GHz—Technical Overview; Keysight Technologies: Santa Rosa, CA, USA, 2017. [Google Scholar]
- Asadi, A.; Alarifi, I.M. Effects of ultrasonication time on stability, dynamic viscosity, and pumping power management of MWCNT-water nanofluid: An experimental study. Sci. Rep. 2020, 10, 15182. [Google Scholar] [CrossRef]
- Tahalyani, J.; Khanale, M.; Kandasubramanian, B. Chapter 25—Dielectric Polymeric Compositions for Improved Electrical Properties of Flexible Electronics. In Handbook of Nanomaterials for Industrial Applications; Mustansar Hussain, C., Ed.; Micro and Nano Technologies; Elsevier: Amsterdam, The Netherlands, 2018; pp. 430–467. [Google Scholar] [CrossRef]
- Choy, T.C. Effective Medium Theory: Principles and Applications; Oxford University Press: Oxford, UK, 2016. [Google Scholar]
- Markel, V. Introduction to the Maxwell Garnett approximation: Tutorial. J. Opt. Soc. Am. A Opt. Image Sci. Vis. 2016, 33, 1244–1256. [Google Scholar] [CrossRef] [PubMed]
- Tuncer, E.; Niklasson, G.A. Properties of bruggeman dielectric mixture expression. In Proceedings of the 2014 IEEE Conference on Electrical Insulation and Dielectric Phenomena (CEIDP), Des Moines, IA, USA, 19–22 October 2014; pp. 875–878. [Google Scholar] [CrossRef]
- Altarawneh, M.M. The dielectric properties of silicone-multiwall carbon nanotubes nanocomposite in the frequency range from 0.5 to 20 GHz. AIP Adv. 2024, 14, 035209. [Google Scholar] [CrossRef]
- Kashi, S.; Hadigheh, S.A.; Varley, R. Microwave Attenuation of Graphene Modified Thermoplastic Poly(Butylene adipate-co-terephthalate) Nanocomposites. Polymers 2018, 10, 582. [Google Scholar] [CrossRef]
- Saini, P.; Choudhary, V.; Singh, B.; Mathur, R.; Dhawan, S. Enhanced microwave absorption behavior of polyaniline-CNT/polystyrene blend in 12.4 to 18.0 GHz range. Synth. Met. 2011, 161, 1522–1526. [Google Scholar] [CrossRef]
- Du, H.; Fang, C.; Zhang, J.; Xia, X.; Weng, G.J. Segregated carbon nanotube networks in CNT-polymer nanocomposites for higher electrical conductivity and dielectric permittivity, and lower percolation threshold. Int. J. Eng. Sci. 2022, 173, 103650. [Google Scholar] [CrossRef]
- Kougkolos, G.; Golzio, M.; Laudebat, L.; Valdez-Nava, Z.; Flahaut, E. Hydrogels with electrically conductive nanomaterials for biomedical applications. J. Mater. Chem. B 2023, 11, 2036–2062. [Google Scholar] [CrossRef] [PubMed]
- Charkhesht, A.; Lou, D.; Sindle, B.; Wen, C.; Cheng, S.; Vinh, N.Q. Insights into Hydration Dynamics and Cooperative Interactions in Glycerol-Water Mixtures by Terahertz Dielectric Spectroscopy. J. Phys. Chem. B 2019, 123, 8791–8799. [Google Scholar] [CrossRef] [PubMed]
- Rather, J.A.; Akhter, N.; Ashraf, Q.S.; Mir, S.A.; Makroo, H.A.; Majid, D.; Barba, F.J.; Khaneghah, A.M.; Dar, B. A comprehensive review on gelatin: Understanding impact of the sources, extraction methods, and modifications on potential packaging applications. Food Packag. Shelf Life 2022, 34, 100945. [Google Scholar] [CrossRef]
- Liu, G.; Chen, Y.; Gong, M.; Liu, X.; Cui, Z.K.; Pei, Q.; Gu, J.; Huang, C.; Zhuang, Q. Enhanced dielectric performance of PDMS-based three-phase percolative nanocomposite films incorporating a high dielectric constant ceramic and conductive multi-walled carbon nanotubes. J. Mater. Chem. C 2018, 6, 10829–10837. [Google Scholar] [CrossRef]
- Hoseini, A.H.A.; Arjmand, M.; Sundararaj, U.; Trifkovic, M. Significance of interfacial interaction and agglomerates on electrical properties of polymer-carbon nanotube nanocomposites. Mater. Des. 2017, 125, 126–134. [Google Scholar] [CrossRef]
- Raju, G.G. Dielectric Materials for Electrical Engineering; Wiley-IEEE Press: Hoboken, NJ, USA, 2014. [Google Scholar]
- Khan, L.U.; Younas, M.; Khan, S.U.; Rehman, M.Z. Synthesis and characterization of COFE2O4/mwcnts nanocomposites and high-frequency analysis of their dielectric properties. J. Mater. Eng. Perform. 2020, 29, 251–258. [Google Scholar] [CrossRef]
- Lu, W.; Guan, H. Electromagnetic Wave Absorption and Shielding Materials; CRC Press: Boca Raton, FL, USA, 2024. [Google Scholar]


| Sample # | Glycerol wt% | Water wt% | Gelatin wt% |
|---|---|---|---|
| S0 | 10 | 90 | 0 |
| S1 | 10 | 85 | 5 |
| S2 | 10 | 80 | 10 |
| S3 | 10 | 75 | 15 |
| S4 | 10 | 70 | 20 |
Disclaimer/Publisher’s Note: The statements, opinions and data contained in all publications are solely those of the individual author(s) and contributor(s) and not of MDPI and/or the editor(s). MDPI and/or the editor(s) disclaim responsibility for any injury to people or property resulting from any ideas, methods, instructions or products referred to in the content. |
© 2025 by the author. Licensee MDPI, Basel, Switzerland. This article is an open access article distributed under the terms and conditions of the Creative Commons Attribution (CC BY) license (https://creativecommons.org/licenses/by/4.0/).
Share and Cite
Altarawneh, M.M. Electromagnetic Shielding Effectiveness of Carbon Nanotubes Hydrogel Nanocomposites in the Frequency Range from 1.7 to 6.0 GHz. J. Compos. Sci. 2025, 9, 150. https://doi.org/10.3390/jcs9040150
Altarawneh MM. Electromagnetic Shielding Effectiveness of Carbon Nanotubes Hydrogel Nanocomposites in the Frequency Range from 1.7 to 6.0 GHz. Journal of Composites Science. 2025; 9(4):150. https://doi.org/10.3390/jcs9040150
Chicago/Turabian StyleAltarawneh, Moaz M. 2025. "Electromagnetic Shielding Effectiveness of Carbon Nanotubes Hydrogel Nanocomposites in the Frequency Range from 1.7 to 6.0 GHz" Journal of Composites Science 9, no. 4: 150. https://doi.org/10.3390/jcs9040150
APA StyleAltarawneh, M. M. (2025). Electromagnetic Shielding Effectiveness of Carbon Nanotubes Hydrogel Nanocomposites in the Frequency Range from 1.7 to 6.0 GHz. Journal of Composites Science, 9(4), 150. https://doi.org/10.3390/jcs9040150