Article

Computational Approach for Optimizing Resin Flow Behavior in Resin Transfer Molding with Variations in Injection Pressure, Fiber Permeability, and Resin Sorption

Department of Mechanical and Industrial Engineering, Manipal Institute of Technology, Manipal Academy of Higher Education, Manipal 576104, Karnataka, India
*
Author to whom correspondence should be addressed.
J. Compos. Sci. 2025, 9(3), 129; https://doi.org/10.3390/jcs9030129
Submission received: 16 February 2025 / Revised: 2 March 2025 / Accepted: 8 March 2025 / Published: 11 March 2025
(This article belongs to the Special Issue Theoretical and Computational Investigation on Composite Materials)

Abstract

:
Resin transfer molding (RTM) is a key process for manufacturing high-performance fiber-reinforced composites, in which resin infiltration dynamics play a critical role in process efficiency and defect minimization. This study presents a numerical and experimental analysis of resin flow in biaxial noncrimp carbon fiber reinforcement using FormuLITE 2500A/2401B epoxy. A model based on Darcy’s law and resin sorption effects was developed to investigate the influence of injection pressure (15–25 kPa), permeability (350 × 10−12 m2 to 0.035 × 10⁻¹² m2), porosity (0.78–0.58), viscosity (0.28–0.48 Pa·s), and injection radius (0.001–0.003 m) on flow-front progression. The results show that a higher injection pressure increased the infiltration depth by 30% at 250 s, while a 100× reduction in permeability reduced infiltration by 75%. The increased viscosity slowed the resin flow by ~18%, and the lower porosity reduced the flow-front progression by 15%. The experimental validation demonstrated a relative error of <5% between the numerical predictions and the measured data. This study provides critical insights into RTM process optimization for uniform fiber impregnation and defect minimization.

1. Introduction

The demand for high-performance fiber-reinforced polymer (FRP) composites has surged across the aerospace, automotive, wind energy, and marine industries owing to their superior strength-to-weight ratio, corrosion resistance, and design flexibility [1,2]. Among manufacturing techniques, RTM has gained widespread adoption because of its ability to produce complex, lightweight, and structurally sound components with minimal material waste [3,4]. However, traditional RTM studies have predominantly focused on rectilinear resin infiltration, neglecting the effects of radial flow behavior, which is crucial for optimizing injection strategies, minimizing void formation, and ensuring uniform fiber impregnation [5,6].
The radial injection approach in RTM has been extensively studied using Darcy’s law to model the resin flow in porous media, incorporating parameters such as permeability, porosity, capillary pressure, and resin sorption effects [7,8,9] and motivation for the study. Previous studies have demonstrated that resin viscosity, injection pressure, and fiber architecture play pivotal roles in determining resin flow-front advancement and void formation tendencies [10,11]. Additionally, advanced modeling approaches coupling mass conservation equations with Darcy–Brinkman models have provided insights into the transient flow dynamics within fibrous reinforcements [5,12].
Despite significant progress, most existing studies use petroleum-based epoxy resins, which have a high environmental impact and limited biodegradability [13]. In response, bio-based epoxy systems, such as FormuLITE 2500A/2401B, have been developed to offer a sustainable alternative without compromising the mechanical performance [14]. These resins exhibit low viscosity, extended pot life, and improved fiber-wetting characteristics, making them promising candidates for RTM applications [15]. However, limited research has been conducted to evaluate the flow behavior of bio-based epoxies in radial-injection RTM processes, particularly concerning their interaction with fibrous media and the impact of sorption on process efficiency [16].
The incorporation of bio-based epoxy resin represents a sustainable alternative to conventional petroleum-derived epoxies, addressing concerns related to fossil resource depletion and environmental impact. Bio-based epoxies are derived from renewable sources such as vegetable oils, lignin, and cashew nut shell liquid (CNSL), significantly reducing carbon footprint and VOC emissions [17,18].
This study aims to develop an advanced numerical model to predict the radial infiltration behavior of the FormuLITE 2500A/2401B bio-epoxy system by incorporating resin sorption, fiber permeability, and injection pressure effects. The proposed model builds upon previous studies by integrating a mass conservation approach with Darcy’s law, while considering the influence of bio-based resin properties. Comparative analyses with conventional epoxy resins will be conducted to assess the processing and sustainability benefits of FormuLITE in RTM.

2. Background Study

2.1. RTM and Radial Flow Behavior

RTM is a widely adopted technique in the composite manufacturing industry owing to its ability to produce high-quality, complex-shaped, and lightweight components. Several studies have investigated the fluid flow dynamics, pressure distribution, and fiber saturation mechanisms in RTM, particularly focusing on rectilinear flow behavior. However, limited research has been conducted on radial flow injection, which is crucial for circular and multi-inlet mold geometries [19,20].
Gomez et al. (2021) [21] investigated the impact of resin viscosity and fiber permeability on the final part quality and concluded that a higher resin viscosity leads to incomplete impregnation and increased void content. Their study emphasized that variations in fiber permeability significantly affect the mold-filling uniformity and process efficiency. Bodaghi et al. (2019) [22] extended this work by incorporating microstructural effects into RTM modeling, demonstrating that pore size distribution and fiber architecture play a pivotal role in determining the resin infiltration rate and potential void formation. Goh (2025) [23] highlighted the importance of radial injection over rectilinear flow, who showed that radial flow minimizes pressure drop, optimizes mold filling, and ensures better fiber wetting in curved geometries. However, their study primarily used traditional petroleum-based epoxies, leaving a significant knowledge gap in understanding the behavior of bio-based resins under radial-injection RTM conditions.
Recent advances in computational modeling have contributed significantly to the prediction of resin infiltration and the optimization of injection strategies. Simacek et al. (2018) [24] and Moumen et al. (2023) [25] employed finite element methods (FEM) coupled with Darcy’s law to analyze the transient flow behavior in RTM, revealing that multiphase flow models incorporating fiber compaction effects yield more accurate predictions. Despite these advancements, there is a lack of experimental validation for bio-based resin systems, highlighting the need for further research.

2.2. The Role of Resin Properties in RTM

The physical and chemical properties of the resin systems play a crucial role in determining the flow characteristics, infiltration efficiency, and final composite quality. Traditional petroleum-based epoxies with high viscosity (1000–5000 cPs at 25 °C) have been extensively studied, which is a major limitation for effective mold filling. Peng et al. (2024) [26] investigated the effect of resin viscosity on RTM efficiency, demonstrating that higher viscosity leads to nonuniform infiltration and increased void formation. Their study compared various commercial resins and concluded that low-viscosity formulations offered improved fiber wetting and reduced injection pressure requirements. Similarly, Natarajan (2022) [27] and Yang et al. (2023) [28] examined the influence of pot life and gelation time on the process efficiency, highlighting that resins with extended processing windows provide better control over infiltration and reduce premature curing risks.
The emergence of bio-based epoxies has provided a sustainable alternative to the traditional petroleum-derived resins. FormuLITE 2500A/2401B was developed to offer low viscosity (~700 cP at 25 °C), extended pot life (105 min), and improved adhesion properties. Mustapha et al. (2019) [29] and Devansh et al. (2024) [30] performed comparative studies between bio-based and petroleum-based epoxies and concluded that bio-based resins exhibit comparable mechanical performance while significantly reducing the environmental impact. However, the behavior of bio-based resins in RTM processes, particularly under radial injection conditions, remains underexplored, necessitating further experimental validation.

2.3. Effect of Resin Sorption on Flow Dynamics

Resin sorption, the absorption of resin into fiber reinforcements, is a critical factor that influences the flow-front velocity, pressure gradients, and mold filling efficiency. Several studies have explored resin–fiber interactions and their impact on process dynamics. Zhao et al. (2024) [31] conducted experimental investigations on natural fiber composites, demonstrating that high resin sorption reduces the effective permeability and requires increased injection pressures. Their findings indicated that flax and jute fibers exhibit higher sorption tendencies than synthetic reinforcements, leading to longer mold filling times. Wang et al. (2024) [32] extended this research by incorporating sorption effects into mass conservation equations, and proposed a sink-term correction model that accounted for dynamic resin absorption and its impact on flow-front progression.
Despite these efforts, the sorption effects of bio-based resins have not been adequately studied. Rudawska et al. (2023) [33] highlighted that bio-based resins exhibit different wetting characteristics than petroleum-based alternatives, affecting capillary forces and interfacial interactions within fiber bundles. The lack of numerical and experimental validation of bio-based resin sorption effects underscores the need for further investigation of RTM applications.

3. Materials and Method

3.1. Materials

3.1.1. Resin System

FormuLITE 2500A (resin) and FormuLITE 2401 B (hardener) were selected as the bio-based epoxy systems because of their low viscosity (~700 cPs at 25 °C), which facilitates easy infiltration through the fiber reinforcement. This resin system offers an extended pot life (~105 min), allowing controlled resin flow and reduced void formation. In addition, its sustainable formulation makes it an environmentally friendly alternative to traditional petroleum-based epoxies. The key physical properties of FormuLITE 2500A/2401B include a density of ~1.1 g/cm3, cure temperature range of 80–120 °C, and gelation time of approximately 105 min at 25 °C. The glass transition temperature (Tg) of the cured system is ~100 °C, ensuring adequate thermal and mechanical stability. Table 1 shows the properties of the bio-epoxy considered for this study.

3.1.2. Fibrous Reinforcement

The reinforcement used in this study consisted of biaxial noncrimp carbon fiber fabric, which was selected because of its high strength and uniform permeability characteristics. This fabric provided an optimized fiber orientation for improving the mechanical performance of the final composite. The fiber volume fraction (Vf) was set to 50%, ensuring a well-balanced resin-to-fiber ratio for effective reinforcement. The permeability (k) of the fibrous medium was measured as 3.5 × 10⁻¹⁰ m2, allowing for efficient resin infiltration. Additionally, the porosity (ϵ) of the fiber preform was maintained at 0.78, which contributes to the capillary-driven resin flow and affects the overall infiltration rate during RTM processing.

3.1.3. Resin Injection Process

Before injection, the FormuLITE 2500A/2401B resin system was preheated to 50 °C to maintain consistent viscosity throughout the molding process. The mold dimensions were 0.15 × 0.4 × 0.003 m3. The resin was injected under three different pressure conditions to analyze its impact on the infiltration rate and pressure distribution within the mold. The first case used an injection pressure of 15 kPa, the second case applied 20 kPa, and the third case involved a higher injection pressure of 25 kPa. These variations were implemented to evaluate the influence of pressure-driven flow on void formation, permeability effects, and the overall mold filling efficiency. The advancement of the resin flow front was tracked in real time using a transparent mold setup and high-speed video recording, enabling the precise observation of infiltration dynamics and validation of numerical models. Mathematical modeling was performed using MATLAB-R2025a (Version 25.1, MathWorks Inc., Natick, MA, USA), and the governing equations for radial resin infiltration were solved numerically.

3.2. Numerical Modeling Approach and Governing Equations for Radial Resin Injection in RTM

The flow of resin through fibrous reinforcement follows the fundamental principles of mass conservation and Darcy’s law in porous media. Figure 1 illustrates the resin flow-front propagation within a porous fiber medium during resin transfer molding (RTM). The schematic highlights the key flow regions, including the fully saturated flow zone, capillary-driven impregnation, and dry/porous fiber regions. The resin is introduced through an inlet valve at an injection pressure pinj, and the flow front advances radially outward until reaching the outlet. The transition from fully saturated to partially saturated flow is governed by fiber permeability and resin viscosity. The capillary impregnation effect influences the degree of fiber wetting, while dry fiber regions indicate incomplete saturation due to local permeability variations. The region labeled ‘A’ represents a possible site of resin accumulation or void formation, which can impact the final composite quality. This schematic provides a visual understanding of the resin infiltration dynamics and pressure-driven flow behavior in RTM. By considering several reports in the literature [7,24,34,35,36,37,38,39,40,41,42,43,44], the numerical model was designed and is discussed in the next section.
Equations (1)–(40) collectively establish a comprehensive mathematical framework for modeling resin infiltration dynamics in resin transfer molding (RTM). These equations incorporate the mass conservation laws, Darcy’s law, pressure evolution, velocity distribution, resin sorption effects, and flow-front progression, enabling an accurate prediction of resin flow under varying process conditions. The governing equations begin with the continuity equation and incompressible resin flow assumptions, followed by the application of Darcy’s law to model resin velocity in a porous medium. Further refinements include the incorporation of sorption effects to account for fiber absorption, modifications for pressure-driven flow-front movement, and analytical solutions for radial resin infiltration under different permeability and viscosity conditions. Additionally, time-dependent solutions for the resin velocity and pressure gradients were derived to track the flow evolution, ensuring an accurate estimation of the total resin volume injected and the time required for complete mold filling. These equations collectively offer a robust predictive framework that aligns well with experimental observations and numerical simulations, supporting process optimization and defect minimization in RTM.

3.2.1. Mass Conservation Equation

The general mass conservation equation for an incompressible resin flow in porous media is:
ρ t   + Δ · ( ρ v ) = S
Since the resin is incompressible, that can be simplified as:
∇·v = −S/ρ
For radial flow in cylindrical coordinates (r, θ, z), assuming azimuthal symmetry (/∂θ = 0) and neglecting the flow in the z-direction,
1   r r ( r · v r ) = S   ρ
where vr is the radial velocity of the resin and S is the sink term (mass flow absorbed by fibers per unit volume per unit time).

3.2.2. Darcy’s Law for Fluid Flow in Porous Media

Applying Darcy’s law for an incompressible, Newtonian fluid in a porous medium:
v = k μ   ( p ρ g )
For radial flow, assuming gravity effects are negligible (g = 0):
v r = k μ   p r
where k is the permeability of the fibrous reinforcement (m2), μ is the dynamic viscosity of the resin (Pa·s), and p is the resin pressure (Pa).

3.2.3. Incorporation of Resin Sorption Effects

During the RTM process, the fibers absorb the resin, altering the resin flow behavior. This resin sorption was modeled as follows:
S = β(ppc)
where β is the sorption coefficient (kg/m3·s) and pc the capillary pressure threshold (Pa). Thus, the governing equation, including sorption, becomes:
1   r r ( k μ   r P r ) = β ρ ( p p c )
The sorption coefficient (β) was determined experimentally using a gravimetric absorption test. Dry biaxial noncrimp carbon fiber specimens (50 mm × 50 mm) were submerged in FormuLITE 2500A/2401B resin at controlled injection pressures. The mass of the samples was recorded before and after resin exposure at intervals of 5, 10, 20, and 30 min to track resin uptake. The absorption rate (S) was calculated using the relation S = Δm/(Vt), where Δm is the mass change, V is the fiber preform volume, and t is time. The sorption coefficient (β) was obtained by fitting the experimental data to a sorption kinetics model and incorporated into the numerical simulation to account for resin absorption effects in RTM.

3.2.4. Solution of Governing Equations

Pressure Distribution

The general solution for pressure distribution is:
p ( r ) =   β μ 4 k ( r 2 r f f 2 ) + (   p i n j p f f + β μ 4 k ( r f f 2 r i n j 2 ) l n ( r i n j / r f f ) ) ln ( r / r ff ) + p ff
where pinj = injection pressure and pff = pressure at the resin front.

Velocity of Resin Flow

Using the pressure gradient from Darcy’s law, the radial velocity of the resin is:
v r = k μ ρ r
Substituting the pressure equation:
V = k μ [ β μ 2 k r + (   p i n j p f f + β μ 4 k ( r f f 2 r i n j 2 ) l n ( r i n j / r f f ) )   1 r ]
Correcting for porosity effects (ε):
V real =   v r ε

Flow-Front Position over Time

To determine flow-front position over time, use:
d r f f d t   = v r e a l
Expanding:
d r f f d t = k μ ε [ β μ 2 k r f f + (   p i n j   p f f + β μ 4 k ( r f f 2 r i n j 2 ) l n ( r i n j / r f f ) )   1 r f f ]
Solving numerically gives r f f (t).

Total Resin Volume Injected Considering Radial Flow Dynamics

The total resin volume injected at time t is:
V resin ( t ) =   r i n j r f f   2 π r h v r e a l d r
where h is mold thickness.

Analytical Estimation of Mold Filling Time Based on Permeability and Pressure Gradients

From the flow-front equation, the time to completely fill the mold is:
t ill =   μ ε 2 k [ r f f 2 ln ( r f f r i n j ) 1 2 ( r f f 2 r i n j 2 ) p i n j p f f ]

3.2.5. Theoretical Case

Theoretical validation was performed by setting the resin absorption term to zero (S = 0), effectively assuming nonabsorptive fibers. This allows an exact solution to be derived and compared with the analytical solutions available in previous studies.

Pressure Field

For a radial flow under a constant injection pressure, the pressure field can be expressed as:
p ( r , t ) = [ P inj ( t ) P ff ]   l n ( r r f f )   l n ( r i n j r f f )   + P ff
where Pinj(t) is the injection pressure at time t, Pff = pressure at the resin front rff (t), and rinj is the injection radius; rff (t) is the radial position of the resin flow front. The derived equation aligns with the theoretical models established in the literature.

Velocity Field

Using Darcy’s law:
v r = k μ ρ r
Substituting the pressure distribution equation:
v r ( r ,   t ) = k r μ ( P inj ( t ) P ff )   ( 1 l n ( r i n j ) ( r f f ) )
where k is the permeability of the fiber preform, and μ is the dynamic viscosity of the FormuLITE 2500A/2401B epoxy. This equation provides the radial velocity profile as a function of the injection pressure and permeability.

Flow-Front Position

The resin flow-front velocity is given by:
d r f f d t = k ε μ ( P inj ( t ) P ff )   ( 1 l n ( r i n j ) ( r f f ) )
where ε is the porosity of the fibrous reinforcement.
After integration:
t fill = μ ε 2 k ( P inj P ff )   [ r f f 2   ln ( r f f r i n j ) 1 2   ( r f f 2 r i n j 2 ) ]
where tfill is the total time required for complete mold filling. This exact solution for the flow front is in agreement with the results of previous theoretical studies.

3.2.6. Experimental Case

To validate the model, a comparison was made between the mathematical modeling and predictions against the experimental results for resin radial infiltration into a fibrous preform.

Injection Pressure as a Function of Time

The experimental injection pressure behavior is given by:
P inj ( t ) = { P 0 + a 1 t 0.5 + a 2 exp ( a 3 t a 4 + a 5 t ) , 0     t   t e P e , t > t e
where P 0 = 1.01323   bar (atmospheric pressure); α 1 , α 2 , α 3 , α 4 , α 5 = empirical coefficients; and P e = final equilibrium pressure. Using this pressure profile, transient infiltration equations were numerically solved.
The comparison between the experimental and numerical results demonstrated a strong correlation, with relative errors remaining below 5% for the key parameters, as shown in Table 2. The flow-front position, resin velocity, total injected resin volume, and injection time were in close agreement with the predicted values, confirming the accuracy of the numerical model. Minor deviations may be attributed to variations in fiber permeability, resin absorption effects, or experimental uncertainties. This validation serves as the basis for the process parameters shown in Table 3, which systematically examine the influence of injection pressure, permeability, porosity, and resin viscosity on mold filling dynamics.
The selection of process parameters, including permeability, viscosity, and injection pressure, was based on experimental measurements, prior studies, and industrial RTM conditions. The permeability range (350 × 10−12 m2 to 0.035 × 10⁻¹² m2) corresponds to values reported for biaxial noncrimp carbon fiber reinforcements, ensuring relevance to practical composite manufacturing [45,46]. The viscosity values (0.28–0.48 Pa·s) were chosen based on bio-based epoxy formulations, with reference to flow characteristics observed in prior RTM studies [47,48]. The selected injection pressures (15–25 kPa) align with those used in low-to-moderate pressure RTM processes, ensuring controlled resin infiltration while minimizing void formation [49,50]. This parameter selection enables a comprehensive evaluation of resin flow behavior, facilitating direct comparisons with both numerical predictions and experimental observations.

4. Results and Discussion

4.1. Derivation of Mass Conservation Equation

For an incompressible resin flow in a porous medium, the continuity equation is:
ρ t   + · ( ρ v ) = S
Since resin is incompressible, ρ t 0 , reducing the equation to:
∇·v = −S/ρ
For radial flow in cylindrical coordinates (r, ϑ, z), assuming azimuthal symmetry ( ϑ 0 ) and neglecting the flow in the z-direction:
1   r r ( r · v r ) = S   ρ
where vr the radial velocity of the resin and S = sink term (mass flow absorbed by the fiber per unit volume per unit time), which governs the conservation of mass during resin infiltration.

4.1.1. Darcy’s Law for Radial Resin Flow

Darcy’s law for an incompressible, Newtonian fluid in a porous medium is:
v = k μ   P
for radial flow (vr):
v r = k μ   d P d r
where k is the permeability of the fiber reinforcement, µ is the resin viscosity, and P = resin pressure. This equation describes how pressure gradients drive the resin flow.

4.1.2. Derivation of Pressure Distribution

Integrating Darcy’s law for pressure P(r) between the injection point (rinj, Pinj) and flow front (rff, Pff) yields:
P i n j P f f d P = µ k T i n j T f f Q 2 π r h d r
Solving for P(r):
P ( r ) P i n j µ Q 2 π k h l n ( r r i n j )
where Q = volumetric flow rate and h is the mold thickness. This equation provides the pressure variation inside the mold.

4.1.3. Radial Velocity of Resin

Using Darcy’s law:
v r = k μ d P d r
Substituting P(r):
v r = k μ [ d d r   ( P i n j   µ Q 2 π k h l n ( r r i n j ) ) ]
v r = Q 2 π r h
which confirms that the resin velocity decreases radially outward.

4.1.4. Derivation of Flow-Front Position over Time

Applying the mass conservation principle:
d d t ( π r f f 2 h ϵ ) = Q
Rearranging:
d r f f d t = Q 2 π h ϵ r f f
Substituting Q from Darcy’s equation:
d r f f d t = k μ ϵ ( P i n j P f f ) ln ( r f f r i n j )
which governs the evolution of the resin flow front over time.

4.1.5. Total Resin Volume Injected Based on Flow Front Advancement

The total resin volume injected at time t is:
V r e s i n ( t ) = 0 t Q d t = π r f f 2 h ϵ
This represents the amount of resin that has entered the mold at any given time.

4.1.6. Integral Formulation for Injection Time Considering Logarithmic Flow Behavior

From the flow-front equation:
r i n j r f f d r ln ( r r i n j ) = 0 t f f k μ ϵ ( P i n j P f f ) d t
Solving this integral:
t f i l l = μ ϵ 2 k ( P i n j P f f ) [ r f f 2 ln ( r f f r i n j ) 1 2 ( r f f 2 r i n j 2 ) ]
which determines how long it takes for the mold to completely fill.

4.1.7. Validation Equations

Theoretical Case (no resin sorption). For a nonabsorptive fiber preform (S-0), the pressure field simplifies to:
P ( r , t ) = [ P i n j ( t ) P f f ] + P f f
The velocity field is:
v r ( r , t ) = k μ ( P i n j P f f ) 1 r
The flow-front position follows:
r f f ( t ) = r i n j 2 + 2 k μ ϵ ( P i n j P f f ) t
These are compared against experimental data.

4.2. Pressure Distribution and Flow-Front Propagation

The pressure evolution and resin flow dynamics in the radial injection process were analyzed under injection pressures of 15, 20, and 25 kPa, while keeping the permeability, porosity, and resin viscosity constant. The observed pressure distributions across the mold follow a logarithmic decay trend, which aligns with the theoretical predictions of Darcy’s law for the flow through porous media. Figure 2a–c illustrate the effect of increasing the injection pressure on the infiltration rate and flow-front progression over time.
At an injection pressure of 15 kPa (Figure 2a), the resin initially exhibited a high pressure gradient near the injection port, which gradually diminished as it spread radially outward. At t = 10 s, the pressure near the injection point is 15 kPa, declining rapidly to approximately 0 kPa at a radial distance of r ≈ 0.04 m. Over time, as the resin continues to propagate, the pressure gradient becomes less pronounced, and by t = 250 s, the flow front reaches r ≈ 0.055 m, indicating that the mold is nearly filled. However, a relatively low injection pressure resulted in slower infiltration, which increased the total filling time.
In contrast, when the injection pressure was increased to 20 kPa (Figure 2b), the resin propagated faster, leading to a larger radial extent of flow-front movement. At t = 10 s, the pressure at r ≈ 0.03 m is approximately 5 kPa, which is slightly higher than in the 15 kPa case, confirming an increased pressure differential. At t = 250 s, the resin flow front extends to approximately r ≈ 0.06 m, indicating an increased infiltration depth and shorter filling time. This highlights the influence of higher pressure in driving the resin through the fiber reinforcement more effectively while ensuring uniform saturation.
Further increase in the injection pressure to 25 kPa (Figure 2c) resulted in the most efficient resin infiltration. The initial pressure gradient remains high, with t = 10 s showing a pressure of 6.5 kPa at r ≈ 0.03 m, further confirming the trend in enhanced pressure-driven flow. At t = 250 s, the resin reached r ≈ 0.065 m, which was the longest infiltration distance observed across all three cases. The results clearly indicate that higher injection pressures not only accelerate resin flow, but also ensure deeper penetration, thus reducing the overall infusion time.
For all the remaining studies, an injection pressure of 20 kPa was maintained to ensure consistency in evaluating the effects of other parameters, such as injection radius, permeability, porosity, and resin viscosity. This pressure was chosen because it provided an optimal balance between efficient resin infiltration and controlled flow dynamics, minimizing the risk of void formation while maintaining adequate fiber wetting. The selection of 20 kPa allowed for a direct comparison of the impact of varying the fiber and resin properties without the confounding influence of fluctuating pressure. This approach ensures that the observed trends in the flow-front progression, velocity distribution, and pressure decay are primarily driven by material and geometric factors rather than external pressure variations.

4.3. Flow-Front Progression and Its Dependence on Injection Pressure and Radius

The progression of the resin flow front over time was analyzed for varying injection pressures (15, 20, and 25 kPa), as shown in Figure 3a, and different injection radii (0.001, 0.002, and 0.003 m), as shown in Figure 3b. The results indicate a monotonic increase in the flow-front radius with time, which follows a nearly linear trend at later stages. In the initial phase, the resin infiltration is strongly influenced by the injection pressure and radius of the injection port.
For varying injection pressures (Figure 3a), it was observed that a higher Pinj led to a faster flow-front advancement. At t = 50 s, the flow front reached r = 0.023, 0.026, and 0.031 m for Pinj = 15, 20, and 25 kPa, respectively. At t = 250 s, the maximum flow-front positions recorded were r = 0.05, 0.055, and 0.065 m, showing an approximately 30% increase in the total infiltration distance as the pressure increased from 15 kPa to 25 kPa. This acceleration in flow is due to the higher pressure overcoming the resistance of the fiber network, thereby reducing the resin impregnation time.
Similarly, for different injection radii (Figure 3b), the results indicate that a larger injection port leads to faster flow-front propagation. At t = 50 s, the flow front reaches r = 0.023 m, 0.026 m, and 0.03 m for r1 = 0.001 m, 0.002 m, and 0.003 m, respectively. At t = 250 s, the flow front stabilizes at r = 0.05 m, 0.055, and 0.065 m, demonstrating that increasing the injection radius enhances the radial spreadability. A larger injection radius facilitates a greater initial resin flux, allowing a more uniform distribution and reducing the pressure losses. These findings confirm that higher injection pressures and larger injection ports improve the impregnation rates and minimize the overall mold filling time.

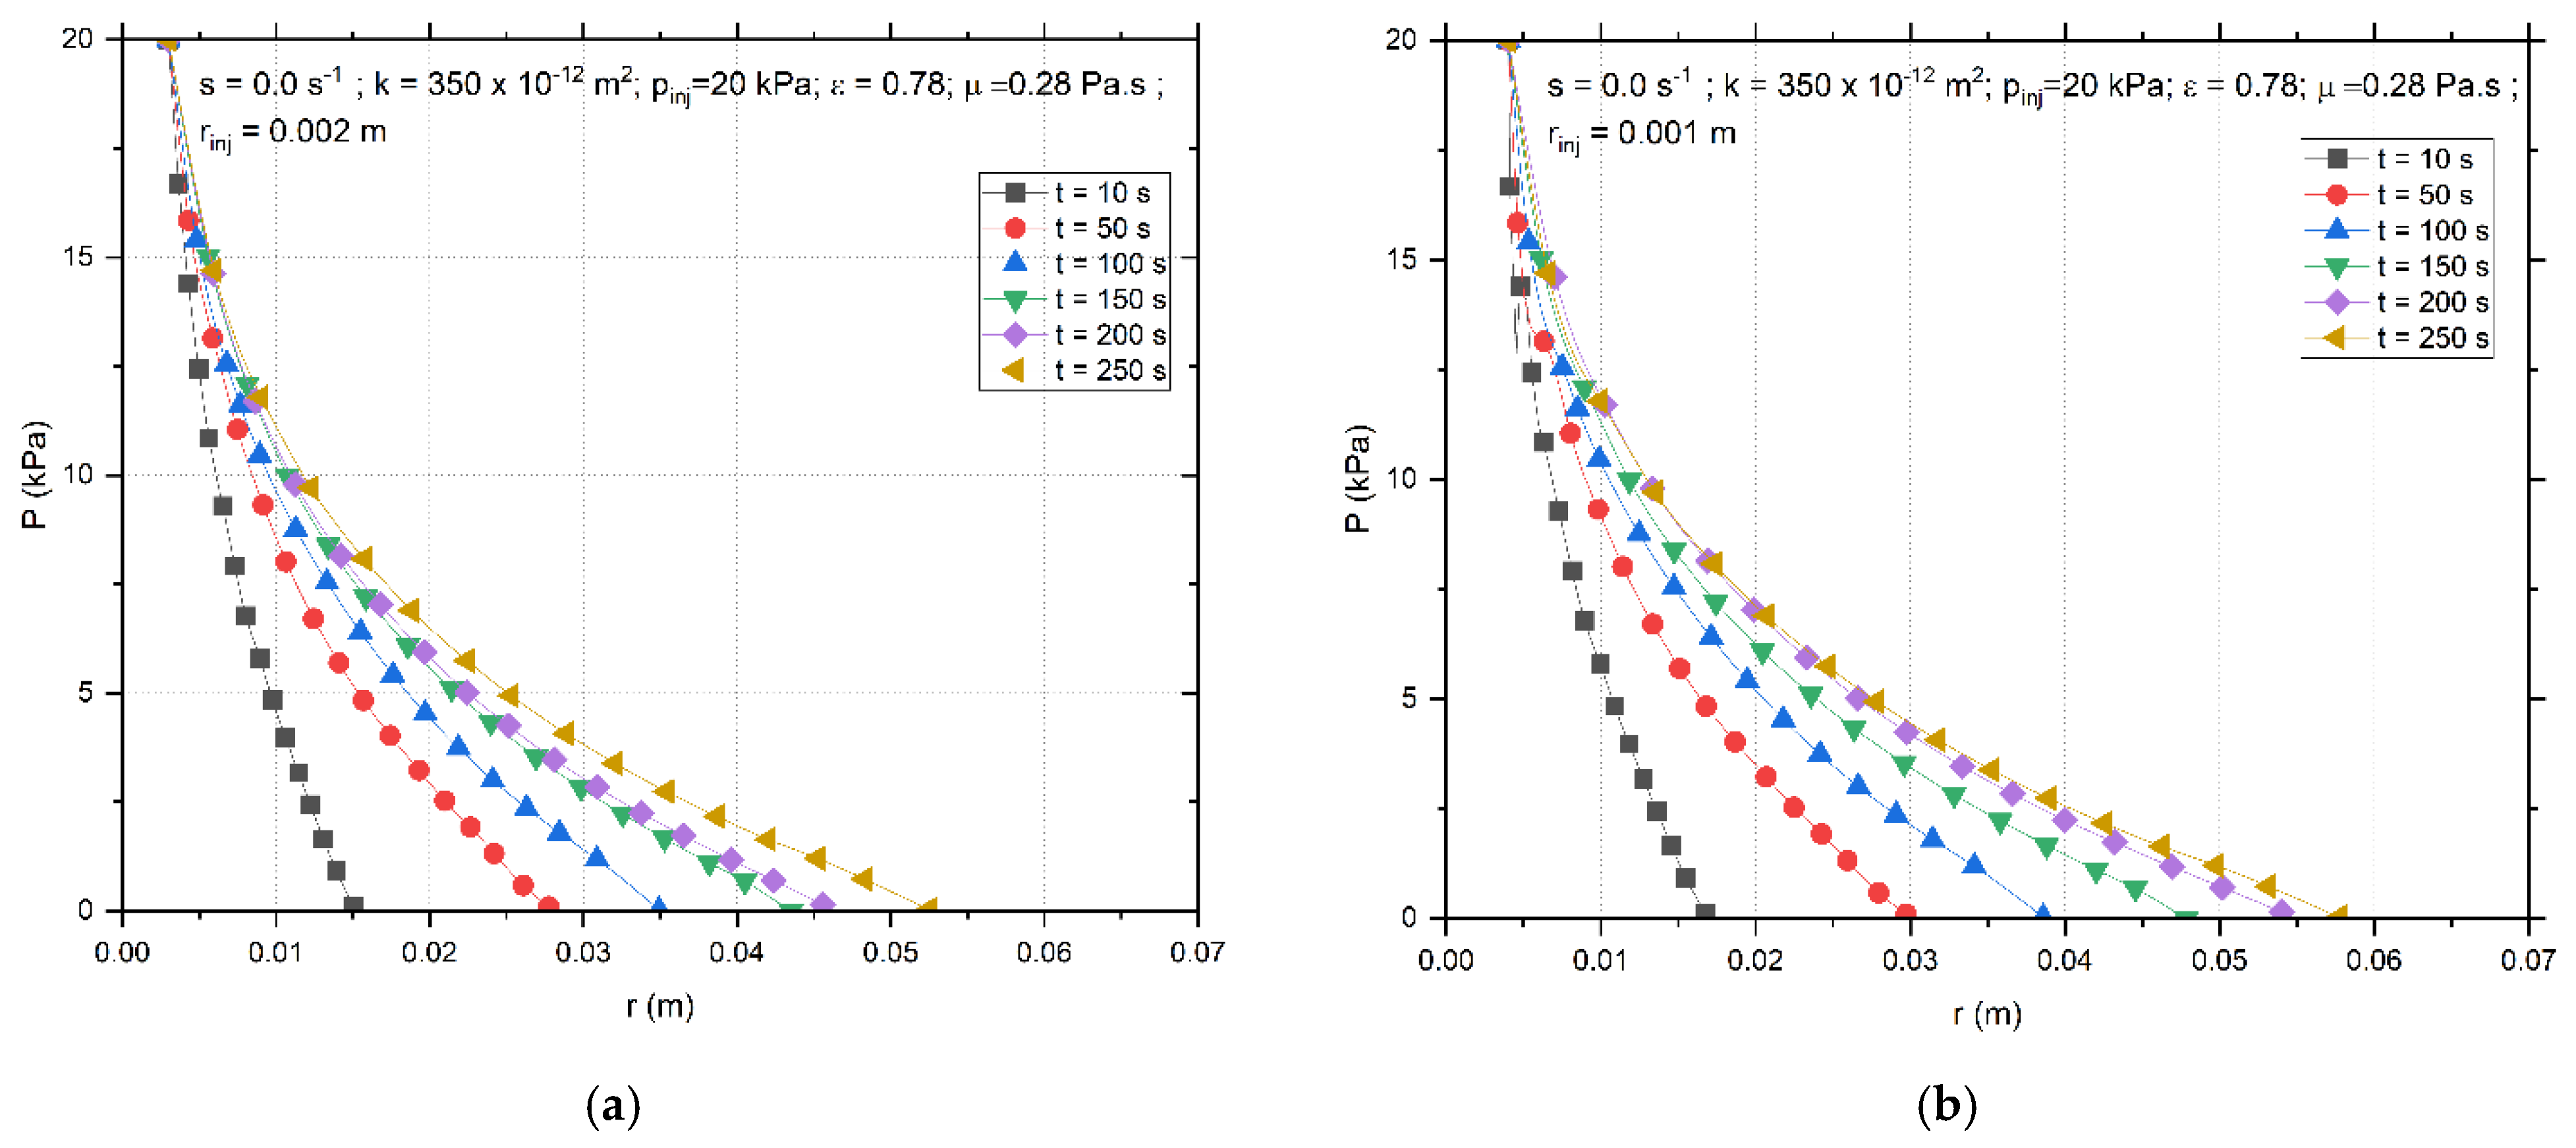
4.4. Transient Pressure Behavior for Different Injection Radii and Impact of Injection Radius on Flow Front and Velocity

The transient evolution of the pressure inside the mold for different injection radii is shown in Figure 4a (condition 4: r1 = 0.002 m) and Figure 4b (condition 5: r1 = 0.001 m). These figures illustrate how the pressure propagates and stabilizes over time as the resin flows radially through the fiber reinforcement. This study focuses on understanding the impact of reducing the injection port radius on pressure distribution, infiltration dynamics, and overall resin flow behavior.
For rinj = 0.002 m (Figure 4a), the initial injection pressure was 20 kPa, and a steep pressure gradient was observed near the injection port, leading to a rapid decline in the pressure as the resin propagated outward. At t = 10 s, the pressure at r ≈ 0.01 m is around 15 kPa, whereas at r ≈ 0.03 m, it reduces to 5 kPa. The pressure stabilized at approximately t = 250 s, with negligible variation across the mold, indicating that the resin uniformly saturated the fiber network. The transient behavior shows that for r1 = 0.002 m, the resin spreads at a moderate rate, with a pressure decay that follows a logarithmic trend, similar to that in previous studies.
For r1 = 0.001 m (Figure 4b), the smaller injection radius results in a more localized pressure buildup, leading to a sharper initial gradient. At t = 10 s, the pressure at r ≈ 0.01 m is approximately 17 kPa, higher than that shown in Figure 4a, but it drops to 4 kPa at r ≈ 0.03 m. Compared to r1 = 0.002 m, the overall pressure decay is more pronounced, indicating a higher resistance to resin flow. At t = 250 s, the pressure stabilized, but the final distribution suggests a slower infiltration rate, confirming that smaller injection radii limit the spreadability of the resin.
The impact of injection radius on resin flow-front position and velocity is analyzed in Figure 5a, which tracks the flow-front position for different radii, and Figure 5b, which examines the velocity evolution for condition 2 (base case: r1 = 0.003 m), condition 4 (r1 = 0.002 m), and condition 5 (r1 = 0.001 m). These results highlight the influence of the injection radius on the resin penetration depth, infiltration rate, and transient velocity behavior during radial injection.
Figure 5a shows that for a constant injection pressure of 20 kPa, the flow-front position increases with increasing injection radius. At t = 50 s, the flow front reaches r = 0.023 m, 0.026 m, and 0.031 m for r1 = 0.001 m, 0.002 m, and 0.003 m, respectively. At t = 250 s, the flow front stabilized at r = 0.05 m, 0.055, and 0.065 m, indicating that a larger injection radius facilitated faster resin spread owing to the higher initial resin influx. The increasing gap between the flow-front positions for different radii suggests that smaller injection radii lead to more localized flow, higher resistance, and delayed impregnation. This is because a narrower injection region restricts the initial resin volume from entering the mold, limiting its radial spread and increasing the flow resistance.
In Figure 5b, the transient velocity behavior is examined, revealing that the highest initial velocity occurs for r </s> = 0.003 m, reaching approximately 0.0075 m/s at t = 5 s, whereas for r </s> = 0.001 m, the velocity is slightly lower at 0.0065 m/s. As time progressed, the velocity for all cases decreased exponentially, stabilizing below 0.001 m/s after t = 50 s, indicating that most resin infiltration occurred within the first 50 s. The velocity decay was more pronounced for smaller radii, suggesting a greater flow resistance and reduced resin mobility under these conditions. This behavior occurs because a smaller injection radius causes a higher localized pressure gradient, which initially enhances the velocity but subsequently results in faster resistance-driven decay, slowing the overall infiltration.
The observed trends confirm that a larger injection radius enhances both the flow rate and the initial resin dispersion, reducing the localized pressure buildup and minimizing the flow resistance. However, smaller injection radii retain a higher pressure near the inlet but at the cost of slower infiltration and prolonged filling time. This tradeoff highlights the importance of optimizing the injection radius to balance the pressure retention, resin mobility, and impregnation efficiency in the RTM processes.

4.5. Impact of Permeability on Pressure, Flow Front, and Velocity

The transient pressure behavior inside the mold for different porous medium permeabilities is analyzed in Figure 6a (condition 6: k = 3.5 × 10⁻¹² m2) and Figure 6b (condition 7: k = 0.035 × 10⁻¹² m2). These figures illustrate the influence of the permeability of the reinforcement on the pressure distribution and resin infiltration dynamics. In Figure 6a (k = 3.5 × 10⁻¹² m2), the pressure gradient shows a gradual decrease over time, with an initial steep drop near the injection point, followed by a smoother decay. At t = 10 s, the pressure at r ≈ 0.01 m is approximately 17 kPa, reducing to 5 kPa at r ≈ 0.03 m. Stabilization occurred at approximately t = 250 s, indicating that moderate permeability facilitated resin infiltration with balanced pressure dissipation.
Conversely, in Figure 6b (k = 0.035 × 10⁻¹² m2), the pressure drop is much steeper because of the low permeability, leading to high resistance to resin flow. At t = 10 s, the pressure at r ≈ 0.01 m remains close to 20 kPa, indicating significant retention near the inlet. The pressure drop beyond r = 0.003 m was abrupt, confirming that extremely low permeability hinders resin movement, resulting in prolonged high-pressure zones. This behavior suggests that, for highly compacted fiber preforms with minimal permeability, the injection pressure must be optimized to prevent localized high-pressure buildup and incomplete wetting.
The effect of permeability on the resin flow-front position and velocity is analyzed in Figure 7a (flow-front position for conditions 2, 6, and 7) and Figure 7b (velocity evolution for the same conditions). These figures highlight the changes in permeability impact infiltration depth, flow uniformity, and transient resin velocity.
Figure 7a shows that for a constant injection pressure of 20 kPa, the resin flow front advanced significantly faster under high-permeability conditions. For k = 350 × 10−12 m2 (condition 2), the flow front reaches r = 0.05 m at t = 250 s, whereas for k = 3.5 × 10⁻¹² m2 (condition 6), it extends to only r = 0.012 m, and for k = 0.035 × 10⁻¹² m2 (condition 7), the flow front remains below r = 0.005 m. These results confirm that a lower permeability drastically reduces resin spreadability, increasing the risk of incomplete saturation.
As shown in Figure 7b, the velocity trends follow a similar pattern. For high permeability (k = 350 × 10−12 m2, condition 2), the initial velocity peaks at 0.008 m/s at t = 5 s and gradually stabilizes below 0.001 m/s after t = 50 s. For k = 3.5 × 10⁻¹² m2 (condition 6), the velocity is significantly lower, peaking at only 0.002 m/s, while for k = 0.035 × 10⁻¹² m2 (condition 7), the velocity remains nearly negligible throughout the simulation. This behavior indicates that as permeability decreases, the flow velocity decreases substantially owing to increased flow resistance, requiring extended injection durations to achieve full mold saturation.

4.6. Effect of Sorption on Pressure Distribution, Flow-Front Progression, and Velocity Evolution

The influence of sorption effects on the pressure distribution, resin flow-front progression, and velocity evolution are analyzed in Figure 8a,b and Figure 9a,b. Sorption introduces an additional resin absorption mechanism within the fiber network, which affects pressure dissipation and flow behavior over time. Figure 8a,b present the transient pressure evolution for two sorption rates (condition 8: S = 5 × 10⁻⁴ s−1 and condition 9: S = 10 × 10−4 s−1), while Figure 9a,b illustrate the corresponding flow-front progression and velocity trends.
In Figure 8a (S = 5 × 10⁻⁴ s−1), the pressure decay follows a logarithmic trend, similar to previous cases without sorption. However, the pressure gradient was slightly reduced owing to resin loss into the fiber structure, which lowered the available resin volume for flow. At t = 250 s, the pressure stabilizes at lower values compared to the nonsorptive cases, confirming that sorption affects moderate pressure dissipation. In Figure 8b (S = 10 × 10−4 s−1), the impact is more pronounced, with a faster pressure drop as a larger fraction of the resin is absorbed into the fibers. This resulted in a shorter infiltration distance and delayed pressure stabilization.
The impact of sorption on the flow-front progression is shown in Figure 9a, where increasing the sorption rate reduces the resin infiltration distance over time. At t = 50 s, the flow front reaches r = 0.026 m, 0.023 m, and 0.020 m for S = 0, S = 5 × 10⁻⁴ s−1, and S = 10 × 10−4 s−1, respectively. At t = 250 s, the flow front stabilizes at r = 0.065 m, 0.06 m, and 0.055 m, indicating that higher sorption reduces overall resin spreadability due to material absorption.
In Figure 9b, the velocity trends reveal that sorption reduces the initial resin velocity, causing a faster velocity decay compared with nonsorptive cases. For S = 0, the peak velocity is 0.008 m/s at t = 5 s, while for S = 10 × 10−4 s−1, it is reduced to 0.007 m/s. The velocity stabilized below 0.001 m/s in all cases, but the decay occurred more rapidly for higher sorption rates, confirming that sorption increased the flow resistance and slowed infiltration.
Overall, these findings highlight that sorption reduces resin mobility by increasing the absorption into the fiber network, leading to a lower infiltration depth, faster velocity decay, and delayed pressure stabilization. While sorption can help in uniform wetting, excessive sorption may prolong the mold filling time and require higher injection pressures to compensate for the absorbed resin loss.

4.7. Impact of Porosity on Pressure Distribution, Flow-Front Progression, and Velocity Evolution

The effects of porosity variation on the pressure distribution, resin infiltration, and velocity behavior are analyzed in Figure 10a,b and Figure 11a,b. Figure 10a,b present the transient pressure evolution for reduced porosity conditions (condition 10: ε = 0.68; condition 11: ε = 0.58), while Figure 11a,b illustrate the corresponding flow-front progression and velocity variations.
In Figure 10a (ε = 0.68), the pressure decay follows a pattern similar to that of higher porosity conditions, but the pressure retention near the injection point is slightly higher because of the reduced void space for resin flow. At t = 10 s, the pressure at r ≈ 0.01 m is approximately 16 kPa, gradually decreasing to 5 kPa at r ≈ 0.03 m. The stabilization occurred around t = 250 s, indicating that a moderate porosity reduction had a noticeable but limited effect on the pressure dissipation.
As shown in Figure 10b (ε = 0.58), the pressure drop is significantly steeper, confirming that a lower porosity increases the flow resistance. At t = 10 s, the pressure near the injection point remains around 17.5 kPa, and its decay beyond r = 0.01 m is more abrupt compared to Figure 10a. This behavior indicates that, as the porosity decreases, the available pathways for resin movement are restricted, leading to delayed pressure stabilization and slower resin distribution.
The effect of porosity on the flow-front progression is shown in Figure 11a, where a higher porosity results in a greater resin infiltration depth. At t = 50 s, the flow front reaches r = 0.027 m, 0.025 m, and 0.022 m for ε = 0.78, ε = 0.68, and ε = 0.58, respectively. At t = 250 s, the infiltration distances are r = 0.065 m, 0.06 m, and 0.055 m, confirming that lower porosity hinders resin mobility and extends the filling time.
In Figure 11b, the velocity analysis reveals that a decrease in porosity leads to reduced initial resin velocity and faster velocity decay. For ε = 0.78, the peak velocity reached 0.008 m/s at t = 5 s, whereas for ε = 0.58, it was only 0.0065 m/s. The velocity stabilized below 0.001 m/s in all cases, but the decay was more pronounced for lower porosity values, indicating an increased resistance to resin flow.
Overall, the findings suggest that as porosity decreases, resin infiltration slows owing to reduced flow pathways and higher resistance, leading to delayed pressure dissipation, shorter infiltration distances, and lower resin velocity. These effects should be considered in the process optimization to ensure uniform mold filling without excessive injection time or pressure buildup.

4.8. Effect of Resin Viscosity on Pressure Distribution, Flow-Front Progression, and Velocity Evolution

Figure 12a,b present the transient pressure distribution for increased viscosity conditions (condition 12: µ = 0.38 Pa·s and condition 13: µ = 0.48 Pa·s), while Figure 13a,b illustrate the corresponding flow-front progression and velocity variations.
In Figure 12a (µ = 0.38 Pa·s), the pressure decay follows a pattern similar to that of the lower viscosity cases, but the initial pressure retention is higher owing to the increased resistance to flow. At t = 10 s, the pressure near the injection point (r ≈ 0.01 m) is approximately 17 kPa, which drops to 5 kPa at r ≈ 0.03 m by t = 250 s. Compared to the base viscosity condition (µ = 0.28 Pa·s), the pressure takes longer to dissipate, indicating that higher viscosity impedes resin movement and delays pressure stabilization.
In Figure 12b (µ = 0.48 Pa·s), the effect is more pronounced, with the pressure near the injection point at t = 10 s reaching 18.5 kPa. The pressure drop beyond r = 0.01 m is sharper than in Figure 12a, confirming that as viscosity increases, flow resistance rises, causing pressure buildup near the injection site and slower dissipation.
The resin flow-front progression in Figure 13a further illustrates the impact of increasing viscosity on the infiltration depth. At t = 50 s, the flow front reaches r = 0.028 m, 0.025 m, and 0.022 m for µ = 0.28 Pa·s, µ = 0.38 Pa·s, and µ = 0.48 Pa·s, respectively. At t = 250 s, the maximum flow-front position is r = 0.065 m, 0.06 m, and 0.055 m, confirming that higher viscosity significantly slows resin infiltration.
As shown in Figure 13b, the velocity trends indicate that a higher viscosity results in a lower initial resin velocity and a more rapid decline. For µ = 0.28 Pa·s, the peak velocity is 0.008 m/s at t = 5 s, while for µ = 0.48 Pa·s, it is reduced to 0.0065 m/s. The velocity stabilized below 0.001 m/s for all conditions, but the decay was faster for higher viscosities, demonstrating the increased resistance to resin flow caused by viscosity enhancement.
Overall, these findings confirm that higher-viscosity resins lead to higher pressure retention, reduced infiltration depth, and lower flow velocity, increasing the risk of incomplete mold filling. Process parameters, such as the injection pressure or temperature, may need to be adjusted to compensate for the higher viscosity and maintain efficient mold filling.
Table 4 provides a detailed evaluation of the resin flow front (rff) at different time intervals (10 s to 250 s) for 13 distinct conditions, considering variations in porosity (ε), permeability (k), resin sorption rate (S), viscosity (μ), injection pressure (Pinj), and injection radius (rinj). The dataset enables a comparative assessment of key parameters influencing resin infiltration behavior in resin transfer molding (RTM).

5. Conclusions

This paper presents an advanced numerical and experimental investigation of radial resin infiltration in resin transfer molding (RTM) using the bio-based FormuLITE 2500A/2401B epoxy system. This study integrates Darcy’s law, mass conservation principles, and resin sorption effects to predict the flow-front progression under varying process conditions, including injection pressure, fiber permeability, porosity, injection radius, and resin viscosity. A comprehensive comparison with the experimental results validates the accuracy of the numerical model.
  • Injection Pressure Influence:
    • Higher injection pressure (15 kPa to 25 kPa) significantly accelerates resin infiltration.
    • At 250 s, the flow front reached 0.056 m at 15 kPa, 0.062 m at 20 kPa, and 0.068 m at 25 kPa, confirming the enhanced penetration at higher pressures.
    • A 30% increase in the infiltration depth was observed as the pressure increased from 15 kPa to 25 kPa.
  • Effect of Injection Radius:
    • A larger injection radius (0.001 m to 0.003 m) improved radial flow.
    • The flow-front position increased by ~20% at 250 s, demonstrating that a larger injection area enhanced the uniform resin distribution.
    • The velocity decay was sharper for smaller injection radii, leading to a higher resistance and slower filling times.
  • Permeability and Resin Sorption Effects:
    • A 100× reduction in permeability (from 350 × 10−12 m2 to 0.035 × 10⁻¹² m2) caused a 75% decrease in the resin infiltration rate, confirming the crucial role of permeability in the mold filling efficiency.
    • Increased resin sorption rates (5 × 10⁻⁴ s−1 to 10 × 10−4 s−1) led to reduced infiltration depth and delayed pressure stabilization, highlighting the necessity for optimizing fiber–resin interactions.
  • Impact of Porosity Variation:
    • Decreasing the porosity (ε = 0.78, ε = 0.58) resulted in a 15% reduction in the flow-front position at 250 s.
    • Lower porosity increased flow resistance, reducing resin mobility and extending injection time.
  • Influence of Resin Viscosity:
    • Higher viscosity (0.28 Pa·s and 0.48 Pa·s) led to longer filling times and higher pressure retentions near the injection site.
    • The infiltration depth at 250 s was reduced by ~18%, confirming that viscosity significantly affects the flow-front advancement.
  • Validation and Predictive Accuracy
    • A direct numerical–experimental comparison revealed a relative error below 5% for key parameters, including the flow-front position, resin velocity, and total injected resin volume.
    • The developed numerical model accurately predicted the pressure evolution, velocity trends, and resin infiltration depth, and aligned well with the experimental findings.
  • Implications and Future Work
    • The findings confirm that optimizing the injection pressure, fiber permeability, and porosity can significantly enhance the mold filling efficiency and reduce void formation.
    • The integration of machine learning algorithms can further refine predictive modeling and real-time process control in RTM.
    • Future studies will focus on extending the model to multi-inlet RTM processes, incorporating fiber compaction effects, and improving the sustainability of bio-based resin systems.
This study provides critical insights into optimizing the RTM parameters, ensuring uniform fiber impregnation, minimal defects, and improved process reliability for high-performance composite manufacturing. While this study provides valuable insights into resin infiltration dynamics in RTM, certain assumptions and experimental constraints should be acknowledged. The permeability of the fiber preform was assumed to be constant, whereas in reality, fiber compaction during resin infiltration could lead to local variations in permeability, affecting flow behavior. Additionally, resin sorption effects were modeled based on bulk absorption data, but microscale variations in fiber–resin interactions could introduce minor deviations in real-time infiltration predictions. In the experimental setup, factors such as slight variations in fiber stacking, injection pressure fluctuations, and measurement uncertainties could contribute to discrepancies between numerical and experimental results. Future work will focus on integrating dynamic permeability models, fiber compaction effects, and real-time in situ monitoring to further enhance the accuracy of resin infiltration simulations.

Author Contributions

P.H.: conceptualization, methodology, numerical modeling, data analysis, and writing—original draft; K.D.A.: supervision, review and editing, and validation; P.K.J.: investigation, experimental work, and data curation; S.S.H.: software, computational modeling, and formal analysis; G.D.D.: visualization, validation, and interpretation of results; B.R.N.M.: experimental design, data acquisition, and review and editing; S.K.: optimization and review. N.N.: resources, funding acquisition, and final manuscript review. All authors have read and agreed to the published version of the manuscript.

Funding

This study received no funding.

Institutional Review Board Statement

This study did not involve any human participants, animals, or sensitive ethical concerns. No ethical approval was obtained for this study.

Data Availability Statement

All data generated or analyzed during this study are included in this published article. No additional data are available from this study.

Conflicts of Interest

The authors declare that they have no conflicts of interest related to the publication of this manuscript.

References

  1. Diniță, A.; Ripeanu, R.G.; Ilincă, C.N.; Cursaru, D.; Matei, D.; Naim, R.I.; Tănase, M.; Portoacă, A.I. Advancements in Fiber-Reinforced Polymer Composites: A Comprehensive Analysis. Polymers 2023, 16, 2. [Google Scholar] [CrossRef] [PubMed]
  2. Karim, M.A.; Abdullah, M.Z.; Deifalla, A.F.; Azab, M.; Waqar, A. An assessment of the processing parameters and application of fibre-reinforced polymers (FRPs) in the petroleum and natural gas industries: A review. Results Eng. 2023, 18, 101091. [Google Scholar] [CrossRef]
  3. Choi, J.Y.; Jeon, J.H.; Lyu, J.H.; Park, J.; Kim, G.Y.; Chey, S.Y.; Quan, Y.-J.; Bhandari, B.; Prusty, B.G.; Ahn, S.-H. Current Applications and Development of Composite Manufacturing Processes for Future Mobility. Int. J. Precis. Eng. Manuf. Technol. 2023, 10, 269–291. [Google Scholar] [CrossRef]
  4. Mengesha, G. Advances in Composite Structures: A Systematic Review of Design, Performance, and Sustainability Trends. Compos. Mater. 2025, 9, 1–17. [Google Scholar] [CrossRef]
  5. Teixidó, H.; Staal, J.; Caglar, B.; Michaud, V. Capillary Effects in Fiber Reinforced Polymer Composite Processing: A Review. Front. Mater. 2022, 9, 809226. [Google Scholar] [CrossRef]
  6. Giavaras, A.; Boateng, E. Transient filling modelling at meso-level for RTM process using a single phase LSM. Int. J. Mater. Form. 2015, 8, 197–210. [Google Scholar] [CrossRef]
  7. Oliveira, J.S.; Carvalho, L.H.; Delgado, J.M.P.Q.; Lima, A.G.B.; Pereira, A.S.; Franco, C.M.R.; Chaves, F.S. Applying Resin Radial Injection for Manufacturing Fiber-Reinforced Polymer Composite: Advanced Mathematical Modeling and Simulation. Polymers 2024, 16, 3525. [Google Scholar] [CrossRef]
  8. Nascimento Santos, M.J.; Delgado, J.M.P.Q.; Barbosa de Lima, A.G.; Oliveira, I.R. Liquid Injection Molding Process in the Manufacturing of Fibrous Composite Materials: Theory, Advanced Modeling and Engineering Applications; Springer: Cham, Switzerland, 2018; pp. 251–272. [Google Scholar] [CrossRef]
  9. Habibi, M.; Ruiz, É.; Lebrun, G.; Laperrière, L. Effect of surface density and fiber length on the porosity and permeability of nonwoven flax reinforcement. Text. Res. J. 2018, 88, 1776–1787. [Google Scholar] [CrossRef]
  10. Mehdikhani, M.; Gorbatikh, L.; Verpoest, I.; Lomov, S. V Voids in fiber-reinforced polymer composites: A review on their formation, characteristics, and effects on mechanical performance. J. Compos. Mater. 2019, 53, 1579–1669. [Google Scholar] [CrossRef]
  11. Facciotto, S.; Simacek, P.; Advani, S.G.; Pickett, A.; Middendorf, P. Modeling formation and evolution of voids in unsaturated dual scale preforms in Resin Transfer Molding processes. Compos. Part A Appl. Sci. Manuf. 2023, 173, 107675. [Google Scholar] [CrossRef]
  12. Kang, J.; Wang, M. Flow behavior prediction at free-fibrous interface. Int. J. Heat Mass Transf. 2024, 228, 125621. [Google Scholar] [CrossRef]
  13. Kumar, S.; Samal, S.K.; Mohanty, S.; Nayak, S.K. Recent Development of Biobased Epoxy Resins: A Review. Polym. Plast. Technol. Eng. 2018, 57, 133–155. [Google Scholar] [CrossRef]
  14. Hiremath, P.; Ranjan, R.; DeSouza, V.; Bhat, R.; Patil, S.; Maddodi, B.; Shivamurthy, B.; Perez, T.C.; Naik, N. Enhanced Wear Resistance in Carbon Nanotube-Filled Bio-Epoxy Composites: A Comprehensive Analysis via Scanning Electron Microscopy and Atomic Force Microscopy. J. Compos. Sci. 2023, 7, 478. [Google Scholar] [CrossRef]
  15. Haresamudram, H.; Essa, I.; Plötz, T. Assessing the State of Self-Supervised Human Activity Recognition Using Wearables. Proc. ACM Interact. Mob. Wearable Ubiquitous Technol. 2022, 6, 1–47. [Google Scholar] [CrossRef]
  16. Klose, L.; Meyer-Heydecke, N.; Wongwattanarat, S.; Chow, J.; Pérez García, P.; Carré, C.; Streit, W.; Antranikian, G.; Romero, A.M.; Liese, A. Towards Sustainable Recycling of Epoxy-Based Polymers: Approaches and Challenges of Epoxy Biodegradation. Polymers 2023, 15, 2653. [Google Scholar] [CrossRef]
  17. Rojtman, E.; Denis, M.; Sirvent, C.; Lapinte, V.; Caillol, S.; Briou, B. Polyols from cashew nut shell liquid (CNSL): Corner-stone building blocks for cutting-edge bio-based additives and polymers. Polym. Chem. 2024, 15, 4375–4415. [Google Scholar] [CrossRef]
  18. Bobade, S.K.; Paluvai, N.R.; Mohanty, S.; Nayak, S.K. Bio-Based Thermosetting Resins for Future Generation: A Review. Polym. Plast. Technol. Eng. 2016, 55, 1863–1896. [Google Scholar] [CrossRef]
  19. Delgado, J.M.P.Q.; Barbosa de Lima, A.G.; do Nascimento Santos, M.J. Transport Phenomena in Liquid Composite Molding Processes; Springer International Publishing: Cham, Switzerland, 2019. [Google Scholar] [CrossRef]
  20. Ali, M.A.; Umer, R.; Khan, K.A.; Cantwell, W.J. Application of X-ray computed tomography for the virtual permeability prediction of fiber reinforcements for liquid composite molding processes: A review. Compos. Sci. Technol. 2019, 184, 107828. [Google Scholar] [CrossRef]
  21. Gomez, C.; Salvatori, D.; Caglar, B.; Trigueira, R.; Orange, G.; Michaud, V. Resin Transfer molding of High-Fluidity Polyamide-6 with modified Glass-Fabric preforms. Compos. Part A Appl. Sci. Manuf. 2021, 147, 106448. [Google Scholar] [CrossRef]
  22. Bodaghi, M.; Lomov, S.V.; Simacek, P.; Correia, N.C.; Advani, S.G. On the variability of permeability induced by reinforcement distortions and dual scale flow in liquid composite moulding: A review. Compos. Part A Appl. Sci. Manuf. 2019, 120, 188–210. [Google Scholar] [CrossRef]
  23. Wen Goh, K.; Algot, K.K.; Laxmaiah, G.; Babu, P.R.; Vodnala, V.P.; Zainul, R. Experimental analysis, simulation, and evaluation of process parameters of GFRP composites produced through resin transfer molding. Adv. Manuf. Polym. Compos. Sci. 2025, 11, 2441629. [Google Scholar] [CrossRef]
  24. Simacek, P.; Advani, S.G. Resin flow modeling in compliant porous media: An efficient approach for liquid composite molding. Int. J. Mater. Form. 2018, 11, 503–515. [Google Scholar] [CrossRef]
  25. El Moumen, A.; Saouab, A.; Imad, A.; Kanit, T. Towards a numerical modeling of the coupling between RTM process and induced mechanical properties for rigid particle-filled composites. Int. J. Adv. Manuf. Technol. 2023, 125, 1251–1270. [Google Scholar] [CrossRef]
  26. Peng, Y.; Li, M.; Yang, X. Void formation and suppression in CFRP laminate using newly designed ultrasonic vibration assisted RTM technique. Compos. Struct. 2024, 329, 117796. [Google Scholar] [CrossRef]
  27. Natarajan, B. Processing-structure-mechanical property relationships in direct formed carbon nanotube articles and their composites: A review. Compos. Sci. Technol. 2022, 225, 109501. [Google Scholar] [CrossRef]
  28. Yang, J.; Bai, Y.; Sun, J.; Lv, K.; Lang, Y. Recent advances of thermosetting resin and its application prospect in oil and gas drilling and production engineering. Geoenergy Sci. Eng. 2023, 230, 212222. [Google Scholar] [CrossRef]
  29. Mustapha, R.; Rahmat, A.R.; Abdul Majid, R.; Mustapha, S.N.H. Vegetable oil-based epoxy resins and their composites with bio-based hardener: A short review. Polym. Technol. Mater. 2019, 58, 1311–1326. [Google Scholar] [CrossRef]
  30. Devansh; Patil, P.; Pinjari, D.V. Oil-based epoxy and their composites: A sustainable alternative to traditional epoxy. J. Appl. Polym. Sci. 2024, 141, e55560. [Google Scholar] [CrossRef]
  31. Zhao, F.; Liu, X.; Zhao, J.; Feng, T.; Guo, W. Plant fiber-reinforced composites based on injection molding process: Manufacturing, service life, and remanufacturing. Polym. Compos. 2024, 45, 4876–4899. [Google Scholar] [CrossRef]
  32. Wang, X.; Xue, F.; Gu, X.; Xia, X. Simulation of Frost-Heave Failure of Air-Entrained Concrete Based on Thermal–Hydraulic–Mechanical Coupling Model. Materials 2024, 17, 3727. [Google Scholar] [CrossRef]
  33. Rudawska, A.; Szabelski, J.; Miturska-Barańska, I.; Doluk, E. Biological Reinforcement of Epoxies as Structural Adhesives. In Structural Adhesives; Wiley: Hoboken, NJ, USA, 2023; pp. 31–104. [Google Scholar] [CrossRef]
  34. Oya, Y.; Matsumiya, T.; Ito, A.; Matsuzaki, R.; Okabe, T. Gate optimization for resin transfer molding in dual-scale porous media: Numerical simulation and experiment measurement. J. Compos. Mater. 2020, 54, 2131–2145. [Google Scholar] [CrossRef]
  35. Zhao, C.; Yang, B.; Wang, S.; Ma, C.; Wang, S.; Bi, F. Three-Dimensional Numerical Simulation of Meso-Scale-Void Formation during the Mold-Filling Process of LCM. Appl. Compos. Mater. 2019, 26, 1121–1137. [Google Scholar] [CrossRef]
  36. Huang, Z.M.; Lee, S.Y.; Kim, H.M.; Youn, J.R.; Song, Y.S. Three-dimensional numerical simulation for resin transfer molding of automotive wheel. Korea-Aust. Rheol. J. 2019, 31, 141–147. [Google Scholar] [CrossRef]
  37. Sandberg, M.; Yuksel, O.; Baran, I.; Hattel, J.H.; Spangenberg, J. Numerical and experimental analysis of resin-flow, heat-transfer, and cure in a resin-injection pultrusion process. Compos. Part A Appl. Sci. Manuf. 2021, 143, 106231. [Google Scholar] [CrossRef]
  38. Baum, M.; Anders, D.; Reinicke, T. Approaches for Numerical Modeling and Simulation of the Filling Phase in Injection Molding: A Review. Polymers 2023, 15, 4220. [Google Scholar] [CrossRef] [PubMed]
  39. do Nascimento Santos, M.J.; de Oliveira Neto, G.L.; Carmo de Lima, A.R.; de Oliveira, N.G.N.; Pereira de Farias, R.; Pereira Ramos, R.; de Lima, A.G.B. Resin Radial and Isothermal Infiltration in Fibrous Media: A New Mathematical Formulation. Defect Diffus. Forum 2020, 400, 123–134. [Google Scholar] [CrossRef]
  40. Shevtsov, S.; Zhilyaev, I.; Chang, S.-H.; Wu, J.-K.; Huang, J.-P.; Snezhina, N. Experimental and Numerical Study of Vacuum Resin Infusion for Thin-Walled Composite Parts. Appl. Sci. 2020, 10, 1485. [Google Scholar] [CrossRef]
  41. Asiliskender, A.; Peiró, J.; Lee, K.-Y.; Parlamas, A.; Falzon, B.; Kazancı, Z. Predicting filling efficiency of composite resin injection repair. Compos. Part A Appl. Sci. Manuf. 2023, 174, 107708. [Google Scholar] [CrossRef]
  42. Dammann, C.; Mahnken, R. Simulation of a resin transfer molding process using a phase field approach within the theory of porous media. Compos. Part A Appl. Sci. Manuf. 2019, 120, 147–160. [Google Scholar] [CrossRef]
  43. Lionetto, F.; Moscatello, A.; Totaro, G.; Raffone, M.; Maffezzoli, A. Experimental and Numerical Study of Vacuum Resin Infusion of Stiffened Carbon Fiber Reinforced Panels. Materials 2020, 13, 4800. [Google Scholar] [CrossRef]
  44. Magalhães, G.M.C.; Fragassa, C.; Lemos, R.d.L.; Isoldi, L.A.; Amico, S.C.; Rocha, L.A.O.; Souza, J.A.; dos Santos, E.D. Numerical Analysis of the Influence of Empty Channels Design on Performance of Resin Flow in a Porous Plate. Appl. Sci. 2020, 10, 4054. [Google Scholar] [CrossRef]
  45. Bernard, M.; Zamora, M.; Géraud, Y.; Boudon, G. Transport properties of pyroclastic rocks from Montagne Pelée volcano (Martinique, Lesser Antilles). J. Geophys. Res. Solid Earth 2007, 112. [Google Scholar] [CrossRef]
  46. Laadel, N.-E.; El Mansori, M.; Kang, N.; Marlin, S.; Boussant-Roux, Y. Permeation barriers for hydrogen embrittlement prevention in metals—A review on mechanisms, materials suitability and efficiency. Int. J. Hydrogen Energy 2022, 47, 32707–32731. [Google Scholar] [CrossRef]
  47. Hu, F.; La Scala, J.J.; Yadav, S.K.; Throckmorton, J.; Palmese, G.R. Epoxidized soybean oil modified using fatty acids as tougheners for thermosetting epoxy resins: Part 2—Effect of curing agent and epoxy molecular weight. J. Appl. Polym. Sci. 2021, 138, 50579. [Google Scholar] [CrossRef]
  48. Yadav, S.K.; Hu, F.; La Scala, J.J.; Palmese, G.R. Toughening Anhydride-Cured Epoxy Resins Using Fatty Alkyl-Anhydride-Grafted Epoxidized Soybean Oil. ACS Omega 2018, 3, 2641–2651. [Google Scholar] [CrossRef] [PubMed]
  49. Leclerc, J.S.; Ruiz, E. Porosity reduction using optimized flow velocity in Resin Transfer Molding. Compos. Part A Appl. Sci. Manuf. 2008, 39, 1859–1868. [Google Scholar] [CrossRef]
  50. Matsuzaki, R.; Seto, D.; Todoroki, A.; Mizutani, Y. In situ void content measurements during resin transfer molding. Adv. Compos. Mater. 2013, 22, 239–254. [Google Scholar] [CrossRef]
Figure 1. Schematic representation of resin flow-front propagation in a porous fiber medium during resin transfer molding.
Jcs 09 00129 g001
Figure 2. Pressure distribution and resin flow-front evolution for Pinj: (a) condition 1, 15 kPa; (b) condition 2, 20 kPa; and (c) condition 3, 25 kPa, showing progressive infiltration, increasing flow speed, and optimized impregnation.
Jcs 09 00129 g002
Figure 3. (a) Flow-front progression over time for Pinj = 15 kPa, 20 kPa, and 25 kPa. (b) Velocity of resin flow for condition 1, 2, and 3 from Table 3.
Jcs 09 00129 g003
Figure 4. Time-dependent pressure distribution inside the mold: (a) condition 4, rinj = 0.002; (b) condition 5, rinj = 0.001.
Jcs 09 00129 g004
Figure 5. Transition phase characteristics: (a) resin flow-front position; (b) velocity evolution for different injection radii (rinj = 0.001 m, 0.002 m, and 0.003 m) at Pinj = 20 kPa (conditions 2, 4, and 5).
Jcs 09 00129 g005
Figure 6. Transient pressure evolution inside the mold for different permeabilities: (a) k = 3.5 × 10⁻¹² m2, condition 6; (b) k = 0.035 × 10⁻¹² m2, condition 7.
Jcs 09 00129 g006
Figure 7. Transition phase characteristics: (a) resin flow-front position; (b) velocity evolution for different permeabilities (conditions 2, 6, and 7) at Pinj = 20 kPa.
Jcs 09 00129 g007
Figure 8. Transient pressure evolution for different sorption rates: (a) S = 5 × 10⁻⁴ s−1, condition 8; (b) S = 10 × 10−4 s−1, condition 9.
Jcs 09 00129 g008
Figure 9. Transition phase characteristics: (a) resin flow-front position; (b) velocity evolution for different sorption rates (S = 0, S = 5 × 10⁻⁴ s−1 and S = 10 × 10−4 s−1), i.e., conditions 2, 8, and 9 at Pinj = 20 kPa.
Jcs 09 00129 g009
Figure 10. Transient pressure evolution for different porosities at Pinj = 20 kPa: (a) ε = 0.68, condition 10; (b) ε = 0.58, condition 11.
Jcs 09 00129 g010
Figure 11. Transition phase characteristics: (a) resin flow-front position; (b) velocity evolution for different porosities (ε = 0.78, ε = 0.68, and ε = 0.58); conditions 2, 10, and 11 at Pinj = 20 kPa.
Jcs 09 00129 g011
Figure 12. Transient pressure evolution for different resin viscosities at Pinj = 20 kPa: (a) µ = 0.38 Pa·s, condition 12; (b) µ = 0.48 Pa·s, condition 13.
Jcs 09 00129 g012
Figure 13. Transition phase characteristics: (a) resin flow-front position (b) velocity evolution for different viscosities (µ = 0.28 Pa·s, µ = 0.38 Pa·s, and µ = 0.48 Pa·s); conditions 2, 12, and 13 at Pinj = 20 kPa.
Jcs 09 00129 g013
Table 1. Properties of the bio-epoxy considered for this study.
ParameterFormuLITE
Calculated bio-content36.6
Mix ratio by weight100:30
Mix ratio by volume100:36
Mix viscosity at 25 °C (cPs)700
Mix viscosity at 40 °C (cPs)242
Pot life at 25 °C (min)105
Pot life at 40 °C (min)57
Tg (°C)92
Tensile strength (MPa)62
Tensile modulus (MPa)2615
Elongation at Fmax (%)/Elongation at break (%)4.8/6.4
Flexural strength (MPa)92
Flexural modulus (MPa)2262
Table 2. Comparison of experimental and numerical results for resin flow in the RTM process.
ParameterExperimental ValueNumerical PredictionRelative Error (%)
Injection Pressure (Pa)20,00020,0000
Flow-Front Position at 250 s (m)0.0580.0563.45
Resin Velocity at 10 s (m/s)0.00750.00724
Total Resin Volume Injected (m3)0.00050.000484
Injection Time for Full Mold Filling (s)2402352.08
Table 3. Process parameters used for numerical modeling.
ConditionParameterε (-)k (×10−12 m2)S (×10−4 s−1)µ (Pa·s)Pinj (kPa)rinj (m)Pff (Pa)
1Base Case0.7835000.28150.0030
2Higher Injection Pressure0.7835000.28200.0030
3Maximum Injection Pressure0.7835000.28250.0030
4Reduced Injection Radius0.7835000.28200.0020
5Smallest Injection Radius0.7835000.28200.0010
6Reduced Permeability0.783.500.28200.0030
7Minimal Permeability0.780.03500.28200.0030
8Sorption Effect Introduced0.7835050.28200.0030
9Increased Sorption0.78350100.28200.0030
10Reduced Porosity0.6835000.28200.0030
11Minimum Porosity0.5835000.28200.0030
12Higher Resin Viscosity0.7835000.38200.0030
13Maximum Resin Viscosity0.7835000.48200.0030
Table 4. Comprehensive analysis of resin flow-front progression under various process parameters in RTM.
ConditionParameterε (-)k (×10−12 m2)S (×10−4 s−1)µ (Pa·s)Pinj (kPa)rinj (m)rff  at 10 s (m)rff  at 50 s (m)rff  at 100 s (m)rff  at 150 s (m)rff  at 200 s (m)rff  at 2500 s (m)
1Base Case0.7835000.28150.0030.0150.0300.0370.0450.0510.056
2Higher Injection Pressure0.7835000.28200.0030.0160.0330.0410.0510.0570.062
3Maximum Injection Pressure0.7835000.28250.0030.0180.0340.0450.0550.0620.068
4Reduced Injection Radius0.7835000.28200.0020.0130.0260.0320.0390.0440.048
5Smallest Injection Radius0.7835000.28200.0010.0140.0280.0360.0440.0490.053
6Reduced Permeability0.783.500.28200.0030.0020.0030.0040.0050.0050.006
7Minimal Permeability0.780.03500.28200.0030.0040.0070.0090.0110.0130.014
8Sorption Effect Introduced0.7835050.28200.0030.0160.0310.0390.0470.0530.058
9Increased Sorption0.78350100.28200.0030.0160.0320.0400.0490.0550.060
10Reduced Porosity0.6835000.28200.0030.0160.0330.0410.0510.0570.062
11Minimum Porosity0.5835000.28200.0030.0180.0340.0450.0550.0620.068
12Higher Resin Viscosity0.7835000.38200.0030.0160.0310.0390.0470.0530.058
13Maximum Resin Viscosity0.7835000.48200.0030.0160.0330.0410.0510.0570.062
Disclaimer/Publisher’s Note: The statements, opinions and data contained in all publications are solely those of the individual author(s) and contributor(s) and not of MDPI and/or the editor(s). MDPI and/or the editor(s) disclaim responsibility for any injury to people or property resulting from any ideas, methods, instructions or products referred to in the content.

