Article

A Study on the Early Degradation of the Non-Additive Polypropylene–Polyethylene Composite Sampled between the Polymerization Reactor and the Deactivation-Degassing Tank

by
Joaquín Alejandro Hernández Fernández
1,2,3,4,*,
Rodrigo Ortega-Toro
4 and
Eduardo Antonio Espinosa Fuentes
5,*
1
Chemistry Program, Department of Natural and Exact Sciences, San Pablo Campus, University of Cartagena, Cartagena 130015, Colombia
2
Chemical Engineering Program, School of Engineering, Universidad Tecnológica de Bolivar, Parque Industrial y Tecnológico Carlos Vélez Pombo, Cartagena 130001, Colombia
3
Department of Natural and Exact Science, Universidad de la Costa, Barranquilla 080002, Colombia
4
Food Packaging and Shelf-Life Research Group (FP&SL), Food Engineering Department, Universidad de Cartagena, Cartagena de Indias 130015, Colombia
5
Engineering Faculty, Universidad Libre, Barranquilla 080003, Colombia
*
Authors to whom correspondence should be addressed.
J. Compos. Sci. 2024, 8(8), 311; https://doi.org/10.3390/jcs8080311
Submission received: 27 June 2024 / Revised: 1 August 2024 / Accepted: 6 August 2024 / Published: 9 August 2024
(This article belongs to the Special Issue Progress in Polymer Composites, Volume III)

Abstract

The industrial production of polypropylene–polyethylene composites (C-PP-PE) involves the generation of waste that is not usable, resulting in a significant environmental impact globally. In this research, we identified different concentrations of aluminum (8–410 ppm), chlorine (13–205 ppm), and iron (4–100 ppm) residues originating from traces of the Ziegler–Natta catalyst and the triethylaluminum (TEAL) co-catalyst. These residues accelerate the generation of plastic waste and affect the thermo-kinetic performance of C-PP-PE, as well as the formation of volatile organic compounds that reduce the commercial viability of C-PP-PE. Several families of organic compounds were quantified by gas chromatography with mass spectrometry, and it is evident that these concentrations varied directly with the ppm of Al, Cl, and Fe present in C-PP-PE. This research used kinetic models of Coats–Redfern, Horowitz–Metzger, Flynn–Wall–Ozawa, and Kissinger–Akahira–Sunose. The activation energy values (Ea) were inversely correlated with Al, Cl, and Fe concentrations. In samples PP0 and W3, with low Al, Cl, and Fe concentrations, the values (Ea) were 286 and 224 kJ mol−1, respectively, using the Horowitz method. Samples W1 and W5, with a high ppm of these elements, showed Ea values of 80.83 and 102.99 kJ mol−1, respectively. This knowledge of the thermodynamic behavior and the elucidation of possible chemical reactions in the industrial production of C-PP-PE allowed us to search for a suitable remediation technique to give a new commercial life to C-PP-PE waste, thus supporting the management of plastic waste and improving the process—recycling to promote sustainability and industrial efficiency. One option was using the antioxidant additive Irgafos P-168 (IG-P168), which stabilized some of these C-PP-PE residues very well until thermal properties similar to those of pure C-PP-PE were obtained.

1. Introduction

Polypropylene (PP) and polypropylene–polyethylene composites (C-PP-PE) are widely used due to their advantageous properties, such as toughness, tensile strength, tear resistance, flexibility, and chemical, thermal, and moisture resistance. They can be processed using techniques such as injection molding, film and fiber extrusion, thermoforming, and blow molding, making them versatile and applicable in many areas. However, it is well known that both PP and C-PP-PE are prone to degradation during processing and extended use. Stabilizers are required to prevent this degradation. Consequently, the extensive use of PP and C-PP-PE is only possible thanks to their stabilization. The degradation and stabilization of post-polymerized pure polypropylene have been the subject of extensive studies, especially between the 1980s and the mid-2000s [1,2,3,4].
From the perspective of the linear economy, the life cycle of PP and C-PP-PE consisted of only a processing stage and usage stage before being discarded, following the take-make-use-dispose model. However, it is now recognized that once a material has reached the end of its useful life and is discarded, it should be considered a valuable resource. This approach reduces the demand for raw materials while simultaneously contributing to mitigating plastic pollution, aligning with the circular economy paradigm [5,6,7,8].
In the transition to a circular economy, increasing attention is focused on the im-portance of the industry, especially the petrochemical sector, which has shifted its focus toward post-consumer materials, such as plastic packaging waste, considering them a valuable resource [9,10,11]. Despite a significant portion of collected plastic packaging ending up in landfills or being used for energy recovery, research has intensified in technologies aiming to improve the recycling and chemical transformation of these post-consumer wastes, accounting for 42% of cases. Until 2018, the recycling of plastic packaging waste was mainly carried out through mechanical methods. Still, inherent limitations, such as extensive pre-treatment requirements, have sparked a growing interest in chemical recycling as an innovative solution [11,12,13,14,15]. Unlike mechanical recycling, where the chemical structure of the plastic is preserved, chemical recycling in-volves the de-polymerization of plastic packaging waste to obtain smaller hydrocarbons, often through catalytic or thermal processes [6,7].
The renewed interest in the degradation and stabilization of PP and C-PP-PE has emerged due to the need to understand how degradation affects their recyclability [12,13,14]. However, most of these studies focus solely on describing degradation during re-processing in a molten state, overlooking that degradation throughout the lifespan also exerts a considerable influence on the recyclability of PP and C-PP-PE [16,17,18,19,20].
The oxidation of PP and C-PP-PE is recognized as a heterogeneous process. The presence of catalyst residues, especially compounds containing titanium (Ti), is a possible reason for the heterogeneous onset of PP and C-PP-PE oxidation [21,22,23,24,25,26,27]. The influence of these catalyst residues on PP and C-PP-PE oxidation has been detailed in various publications. It is generally accepted as a source for the heterogeneous initiation of material degradation. Once initiated, degradation gradually spreads from these initial points to the rest of the material, progressively affecting the surroundings [28,29,30,31]. Sev-eral studies have observed the degradation spread from the initial oxidation point [32,33]. Using polarized optical microscopy, Nakatani and colleagues illustrated initiation and propagation in the amorphous phase of PP and C-PP-PE by adding a small amount of pre-oxidized PP [23,24,25,26,27,28,29,30,31,32,33,34].
Despite previous studies addressing aspects of the heterogeneous oxidation of PP and C-PP-PE, the present research stands out in its in-depth analysis of the complex mechanisms involved in material degradation [21,24,25,27,35]. While previous works, such as those by Richters [36], Billingham [37], and Blakey et al. [38], have demonstrated het-erogeneity in PP oxidation and the propagation of degradation throughout the polymer, our research delves into a more profound and detailed analysis of the kinetic mecha-nisms involved. This study differentiates itself by investigating in detail how impurities derived from the chemical recycling of plastic waste influence the final properties of the generated products. Understanding degradation kinetics is essential for designing more stable materials, reducing waste, and minimizing environmental impact, enabling the scientific community to optimize processes and foster innovations in various industries. This research includes thermogravimetric analysis (TGA) to determine the macroscopic kinetics of the thermo-catalytic process, providing critical information for understanding degradation kinetics [39,40,41,42,43,44].
The subsequent research is a testament to innovation in the field, focusing on the kinetic degradation mechanisms of PP and C-PP-PE matrices through pyrolysis. This research, utilizing the Ziegler–Natta catalyst residues as accelerators, identifies resulting gases, determines degradation steps through thermodynamic models, and emphasizes the influence of plastic waste composition. The necessity to comprehend degradation kinetics in pyrolysis is underscored, making this comprehensive approach highly relevant and novel. It advances the understanding and optimization of critical processes in sustainable plastic waste management, sparking curiosity and intrigue about the innovative findings it can provide.

2. Materials and Methods

2.1. Sample Collection

The residues of non-additive C-PP-PE were generated during their industrial synthesis using heterogeneous Ziegler–Natta catalysis systems (W. R. Grace and Company, Columbia, MD, USA) based on TiCl4 on MgCl2, accompanied by agents for selectivity control and TEAL as a co-catalyst. Specific details of the catalyst composition are detailed in Table 1.
Several samples of non-additive PP and C-PP-PE were identified; the samples were classified as W1, W2, W3, W4, and W5 according to color. All samples were cleaned many times with high-purity nitrogen gas in Agilent brand high-pressure vials with a 20 mL capacity. All samples, including pure polypropylene (PPO), were analyzed immediately. The PP and C-PP-PE were crushed and sieved to obtain an average particle size of 2 mm. A standard Prodex Henschel 115JSS mixer (Federal Equipment Company, Lodi, NJ, USA) was used at 800 rpm for 7 min at room temperature to ensure homogeneity. Subsequently, the samples were mixed by melt extrusion through a Welex-300 extruder (KD Capital Equipment, LLC, Scottsdale, AZ, USA) with process temperatures of 190–220 °C. The samples were prepared following the measurements specified in Table 2.

2.2. Instrumental Analysis

X-ray fluorescence: For the elemental analysis of metals, mainly of catalyst residues (Ti, Al, Fe, and Cl), an X-ray fluorescence Malvern Panalytical Axios FAST elemental analyzer and a Zetium Polymer Edition elemental analyzer were used.

2.3. Thermogravimetric Analyzer

A thermogravimetric analyzer (Perkin Elmer TGA7; Artisan Technology Group ®101 Mercury DriveChampaign, Champaign, IL, USA) was used for the thermal analysis. In each experiment, 10 mg of the sample was placed into an alumina melting pot and pyrolyzed under a high-purity N2 (99.999%) stream with a 60 mL/min flow rate. The heating was performed at a temperature range of 30–600 °C and a heating rate of 20 °C/min. The experimental errors were lower than 3% in three runs repeated under the same conditions.

2.4. Gas Chromatography (GC-MS)

The gas stream from the thermo-oxidative pyrolysis process was collected in a properly deactivated stainless steel cylinder with a capacity of 200 mL. The valve relief was adjusted in a range of 540–600 psi and then analyzed by an Agilent technology chromatograph (Agilent Technologies; 5301 Stevens Creek Blvd Santa Clara, CA, USA) with front and back split/splitless injector ports. The GC apparatus is equipped with seven valves for gas sampling, eight columns of different lengths and polarity, three detectors, one Pulse Discharge Helium Ionization Detector (PDHID), one Universal Flame Ionization Detector (FID), and a mass spectrometer (MS), allowing for the identification of the chemical nature of oxygenates, sulfur, thiols, and permanent gases in a single operation lasting almost 40 min. The setup conditions were as follows: The run time was 37.14 min. The flow of helium carrier gas was adjusted to 2.8 mL min−1. The valve assembly transported the pyrolysis gases to the columns and the detectors. For identifying and quantifying thiols and oxygenated compounds, an MS Agilent InertPlus 5977 (Agilent Technologies; 5301 Stevens Creek Blvd Santa Clara, CA, USA) quadrupole equipped with an electronic impact ionization source, set at 230 °C, was used to identify and quantify the thiols and oxygenated compounds. The FID was used for the hydrocarbon family, and the permanent gases were analyzed with the PDHID.
The analysis began with the transfer of gases to the chromatograph. At 0.10 min, the gases were directed to the helium carrier and the initial columns for preliminary separation. The first column retained the heavier compounds, allowing CO2 and other lighter components to pass to the next column, which separated the CO2. The subsequent column was used to separate oxygenated compounds, which were then identified using the mass spectrometer. At 0.16 min, most of the sample was directed to a split vent system, while a fraction was sent to a column for heavier hydrocarbons and another for lighter hydrocarbons. At 1.40 min, the sample was moved to a column that retains CO2 and allows CO and other lighter compounds to flow to a final column for separation before detection. The elution order is CO2, H2, argon/O2, methane, and CO. Finally, after the elution of 1-pentene, the heavier components were directed to a final column for removal in the chromatograph’s programmable oven.

2.5. Pyrolysis Setup

The pyrolysis and thermo-oxidative degradation of the five industrial residues (approximately 20 g in each run) were carried out in a quartz reactor placed in a horizontal tube furnace. The residue was characterized before pyrolysis and thermo-oxidative degradation, to determine its chemical composition. Pyrolysis was carried out in a N2 atmosphere followed by thermo-oxidative degradation. To ensure that the environment was inert during the experiments, a flow of N2 of 100 mL min−1 was continuously passed through the reactor. The pyrolysis and thermo-oxidative degradation temperature was 550 °C, at a constant heating rate of 10 °C/min. The gases obtained were collected in metal cylinders with sulfinert alloy, to prevent sulfur compounds from being absorbed, thereby impeding their quantification and being reported as pyrolysis and thermo-oxidative degradation impurities.

2.6. Thermodynamical Analysis

The models of Coats–Redfern [45] and Horowitz–Metzger [46] were used for the thermodynamic calculations. Both models have a linear approach in which several thermodynamic parameters, such as activation energy and collision factor, can be determined. Indeed, these mathematical methods have been extensively used in the kinetic analysis of the thermal decomposition of many solid materials. The different models plot the mass loss rate as a function of temperature or the reciprocal of temperature.

2.7. Kinetic Modeling

Isoconversional methods study how pure plastics or mixtures of plastic waste decompose over time. This approach makes it possible to calculate three critical factors in the decomposition rate, assuming that the conversion rate is related to the amount of reactive substances present. This allows us to describe the decomposition rate using Equation (1), which considers how the conversion rate changes during the heating process.
d α d t = β d α d T = k T f α
In this equation, β represents the heating rate (in degrees Celsius per minute), α is the conversion, f(x) is a function that describes the kinetics with the conversion, and k(T) is a constant function that depends on temperature. The conversion is defined by Equation (2).
α = m i m m i m f  
In this equation, mi represents the initial mass, m indicates the mass at a specific point during the degradation process, and mf is the final mass. The application of the Arrhenius equation involves the following:
β d α d T = A e E a R T f α
In Equation (3), Ea represents the activation energy in kJ mol−1, A represents the pre-exponential factor (s−1), and R is the gas constant. This equation describes how the conversion rate varies with temperature, depending on the rate at which it is heated. This is crucial for understanding the isoconversional kinetic models that will be explained later.

2.7.1. Method 1 and 2: Coats–Redfern and Horowitz–Metzger

This study used approaches that did not involve constant temperature conditions, such as the Arrhenius equation and various methods like Horowitz–Metzger, Coats–Redfern, and Flynn–Wall–Ozawa. These methods were employed to obtain information on the kinetic properties of PP resins with residues from different metals, such as their activation energy and frequency factor, from data obtained through TG/DTG.
In the Coats–Redfern method, the functions f(α) can be used to determine the kinetic parameters. Their representation is given by Equation (4):
ln f α T 2 = ln A R β E a 1 2 R T E a E a R T  
A represents the pre-exponential part. The values of activation energy and pre-exponential parameters for each f(α) function can be determined using a least squares linear regression approach, using the slopes and intercepts of the ln(f(α)/T2) graphs as a function of 1/T.
The Horowitz–Metzger model is formulated as follows:
ln ln W f W f W = θ E a 2.303 R T 2 l o g 2.303
In the equation, Wf refers to the amount of mass lost at the end of the first decomposition process, while W is the mass loss up to a certain temperature (T). If we plot ln[ln Wf/(WfW)] as a function of θ, we will obtain a straight line. The slope of this line provides us with the value of Ea (activation energy).

2.7.2. Method 3: Flynn–Wall–Ozawa (FWO)

The calculation of Doyle’s temperature integral forms the basis for the Flynn–Wall–Ozawa (FWO) approach, which uses a specific mathematical expression, p(x) = exp(−1.052.x − 5.331). This expression is presented differently in Equation (6). To determine activation energies, the FWO technique was employed, which is based on the slope of a fitted linear function that relates lnβ to 1/T.
ln P E a R T = 5.331 1.052 E a R T    
l n   ( 1 ( 1 α ) 1 / 2 ) = ln A R E a ln β 5.331 1.052 E a R T

2.7.3. Method 4: Kissinger–Akahira–Sunose (KAS)

The KAS method is an integral isoconversion technique that relies on the Coats–Redfern approximation (4) and uses a fit of Equation (3). This standard Formula (7) can be expressed as follows:
P E a R T = e E a R T E a R T m 2 = R 2 T 2 e E a R T E a 2  
ln 1 ( 1 α ) 1 / 2 T m 2 = ln A R E a ln β E a R T    
To calculate the activation energy (Ea) and the pre-exponential factor (A), a linear regression of ln [1 − (1 − α)(1/2)] against 1/Tm2 is performed.

3. Results

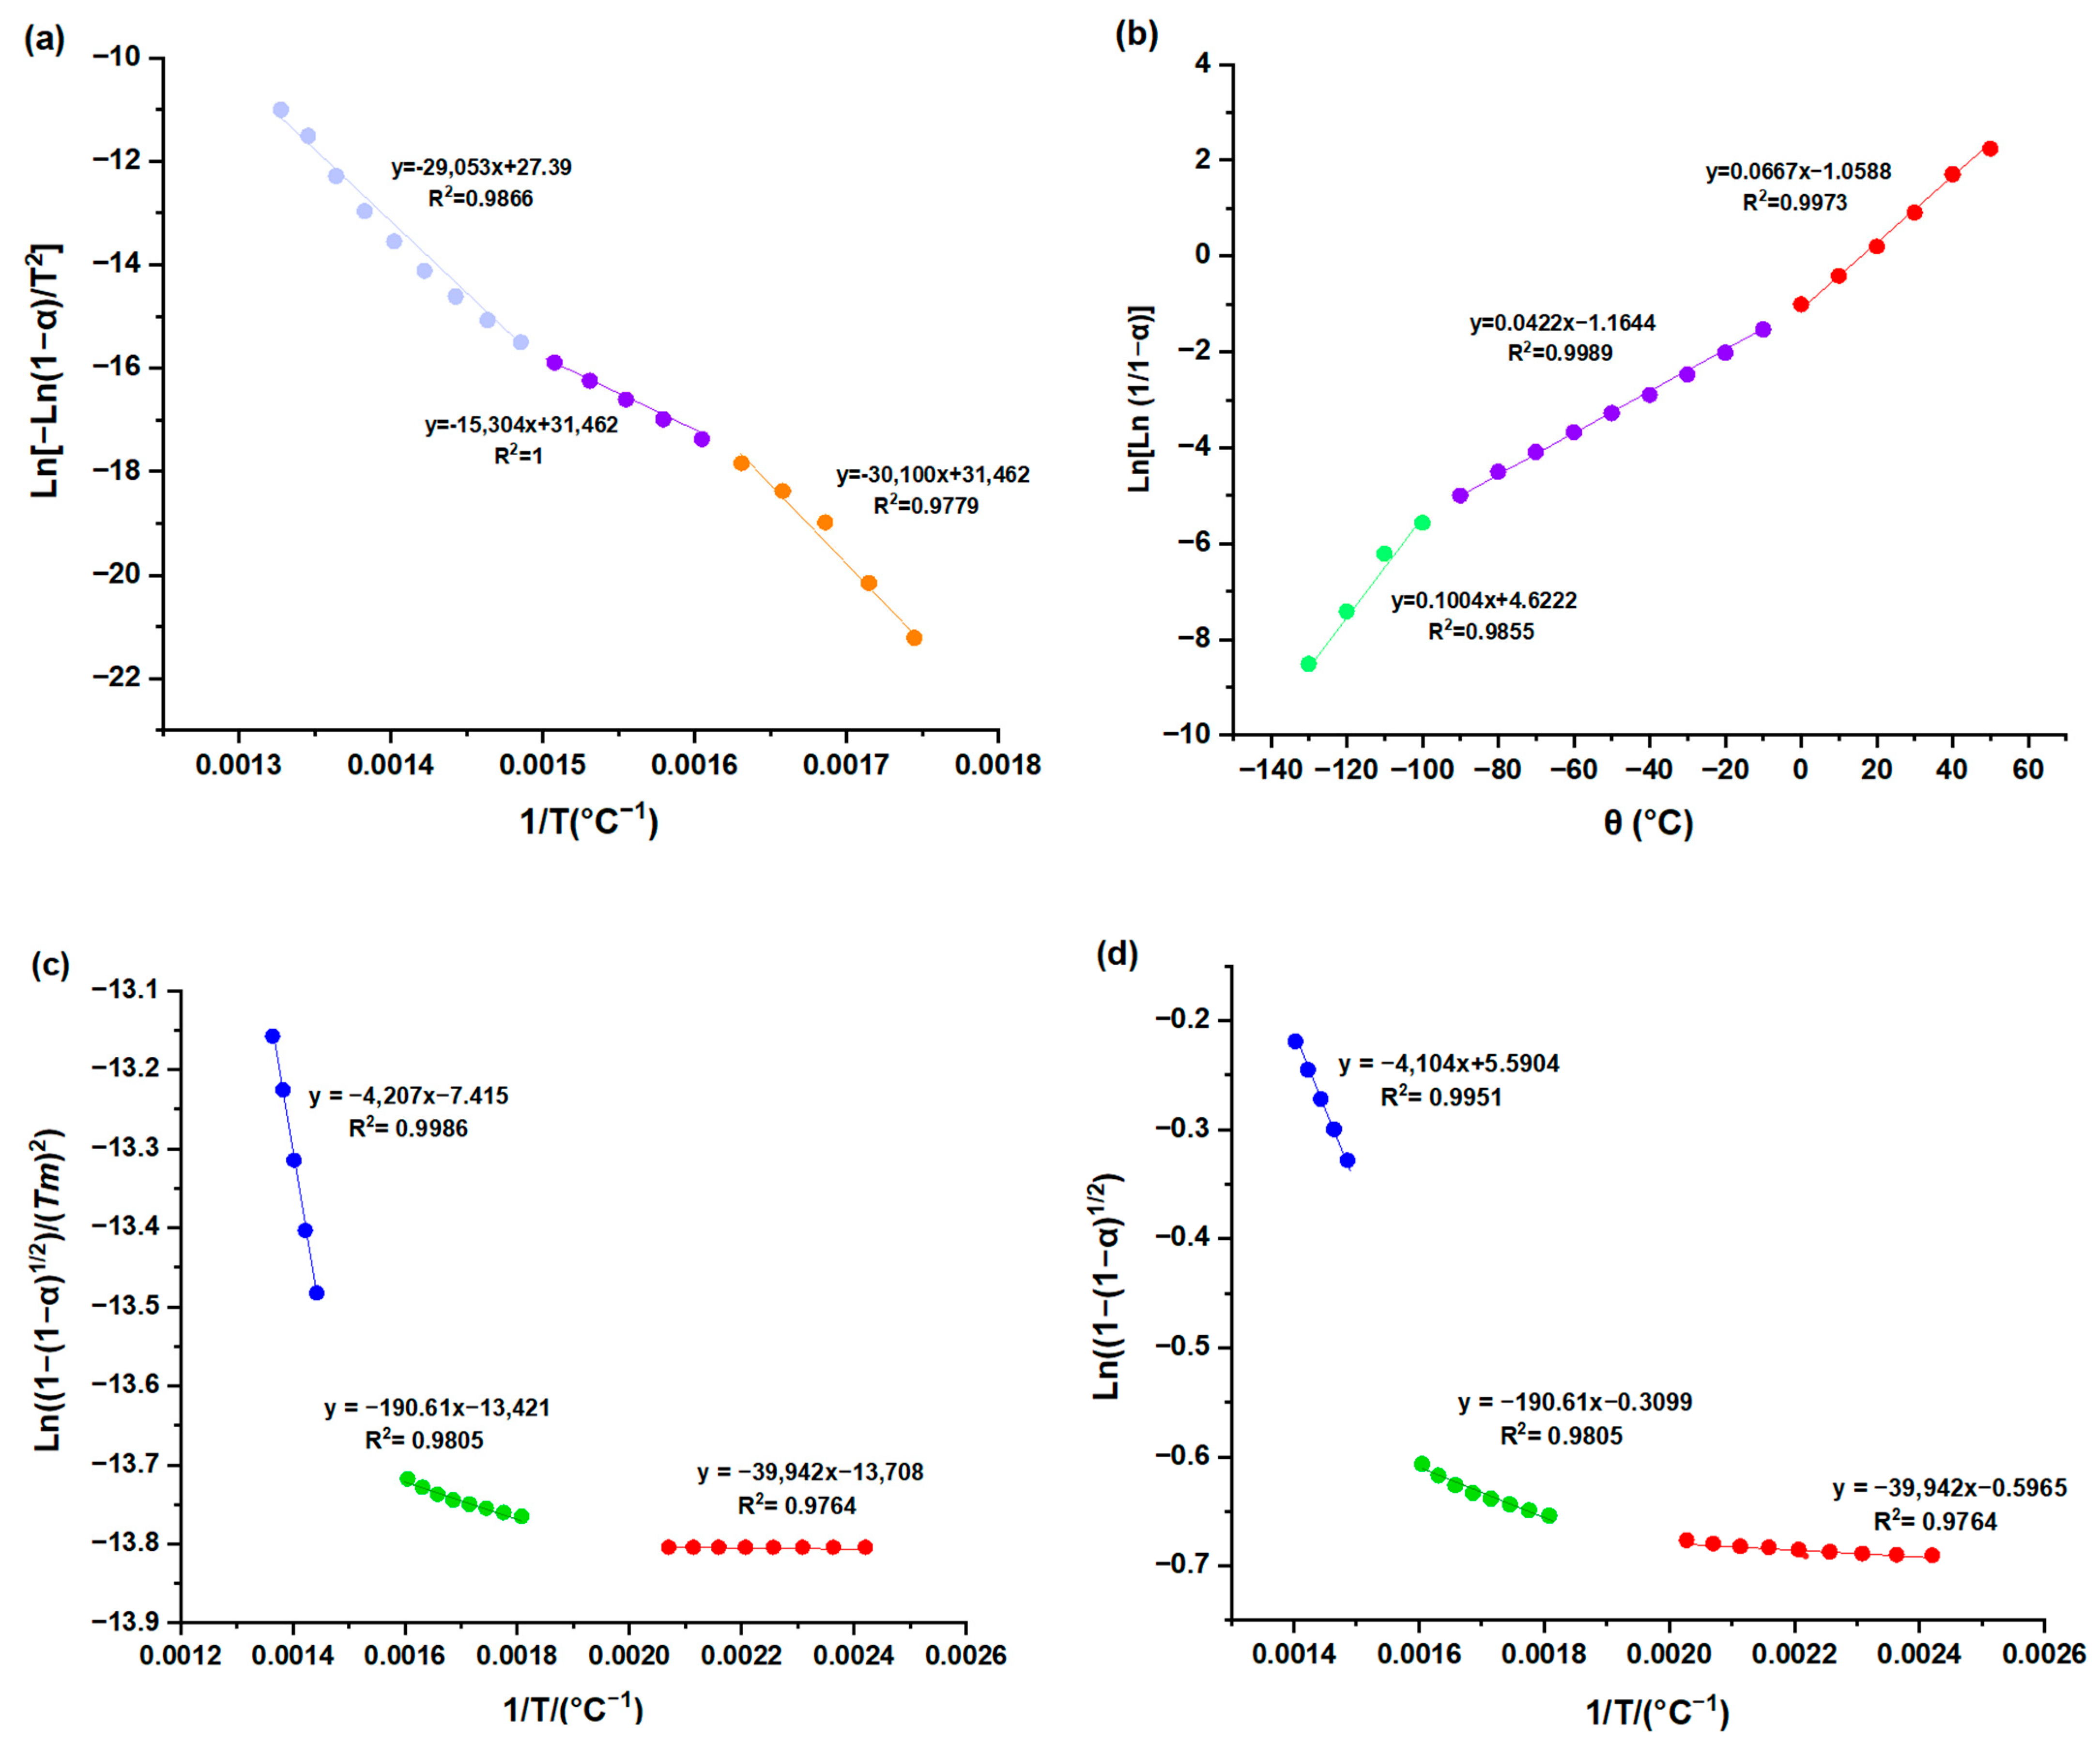
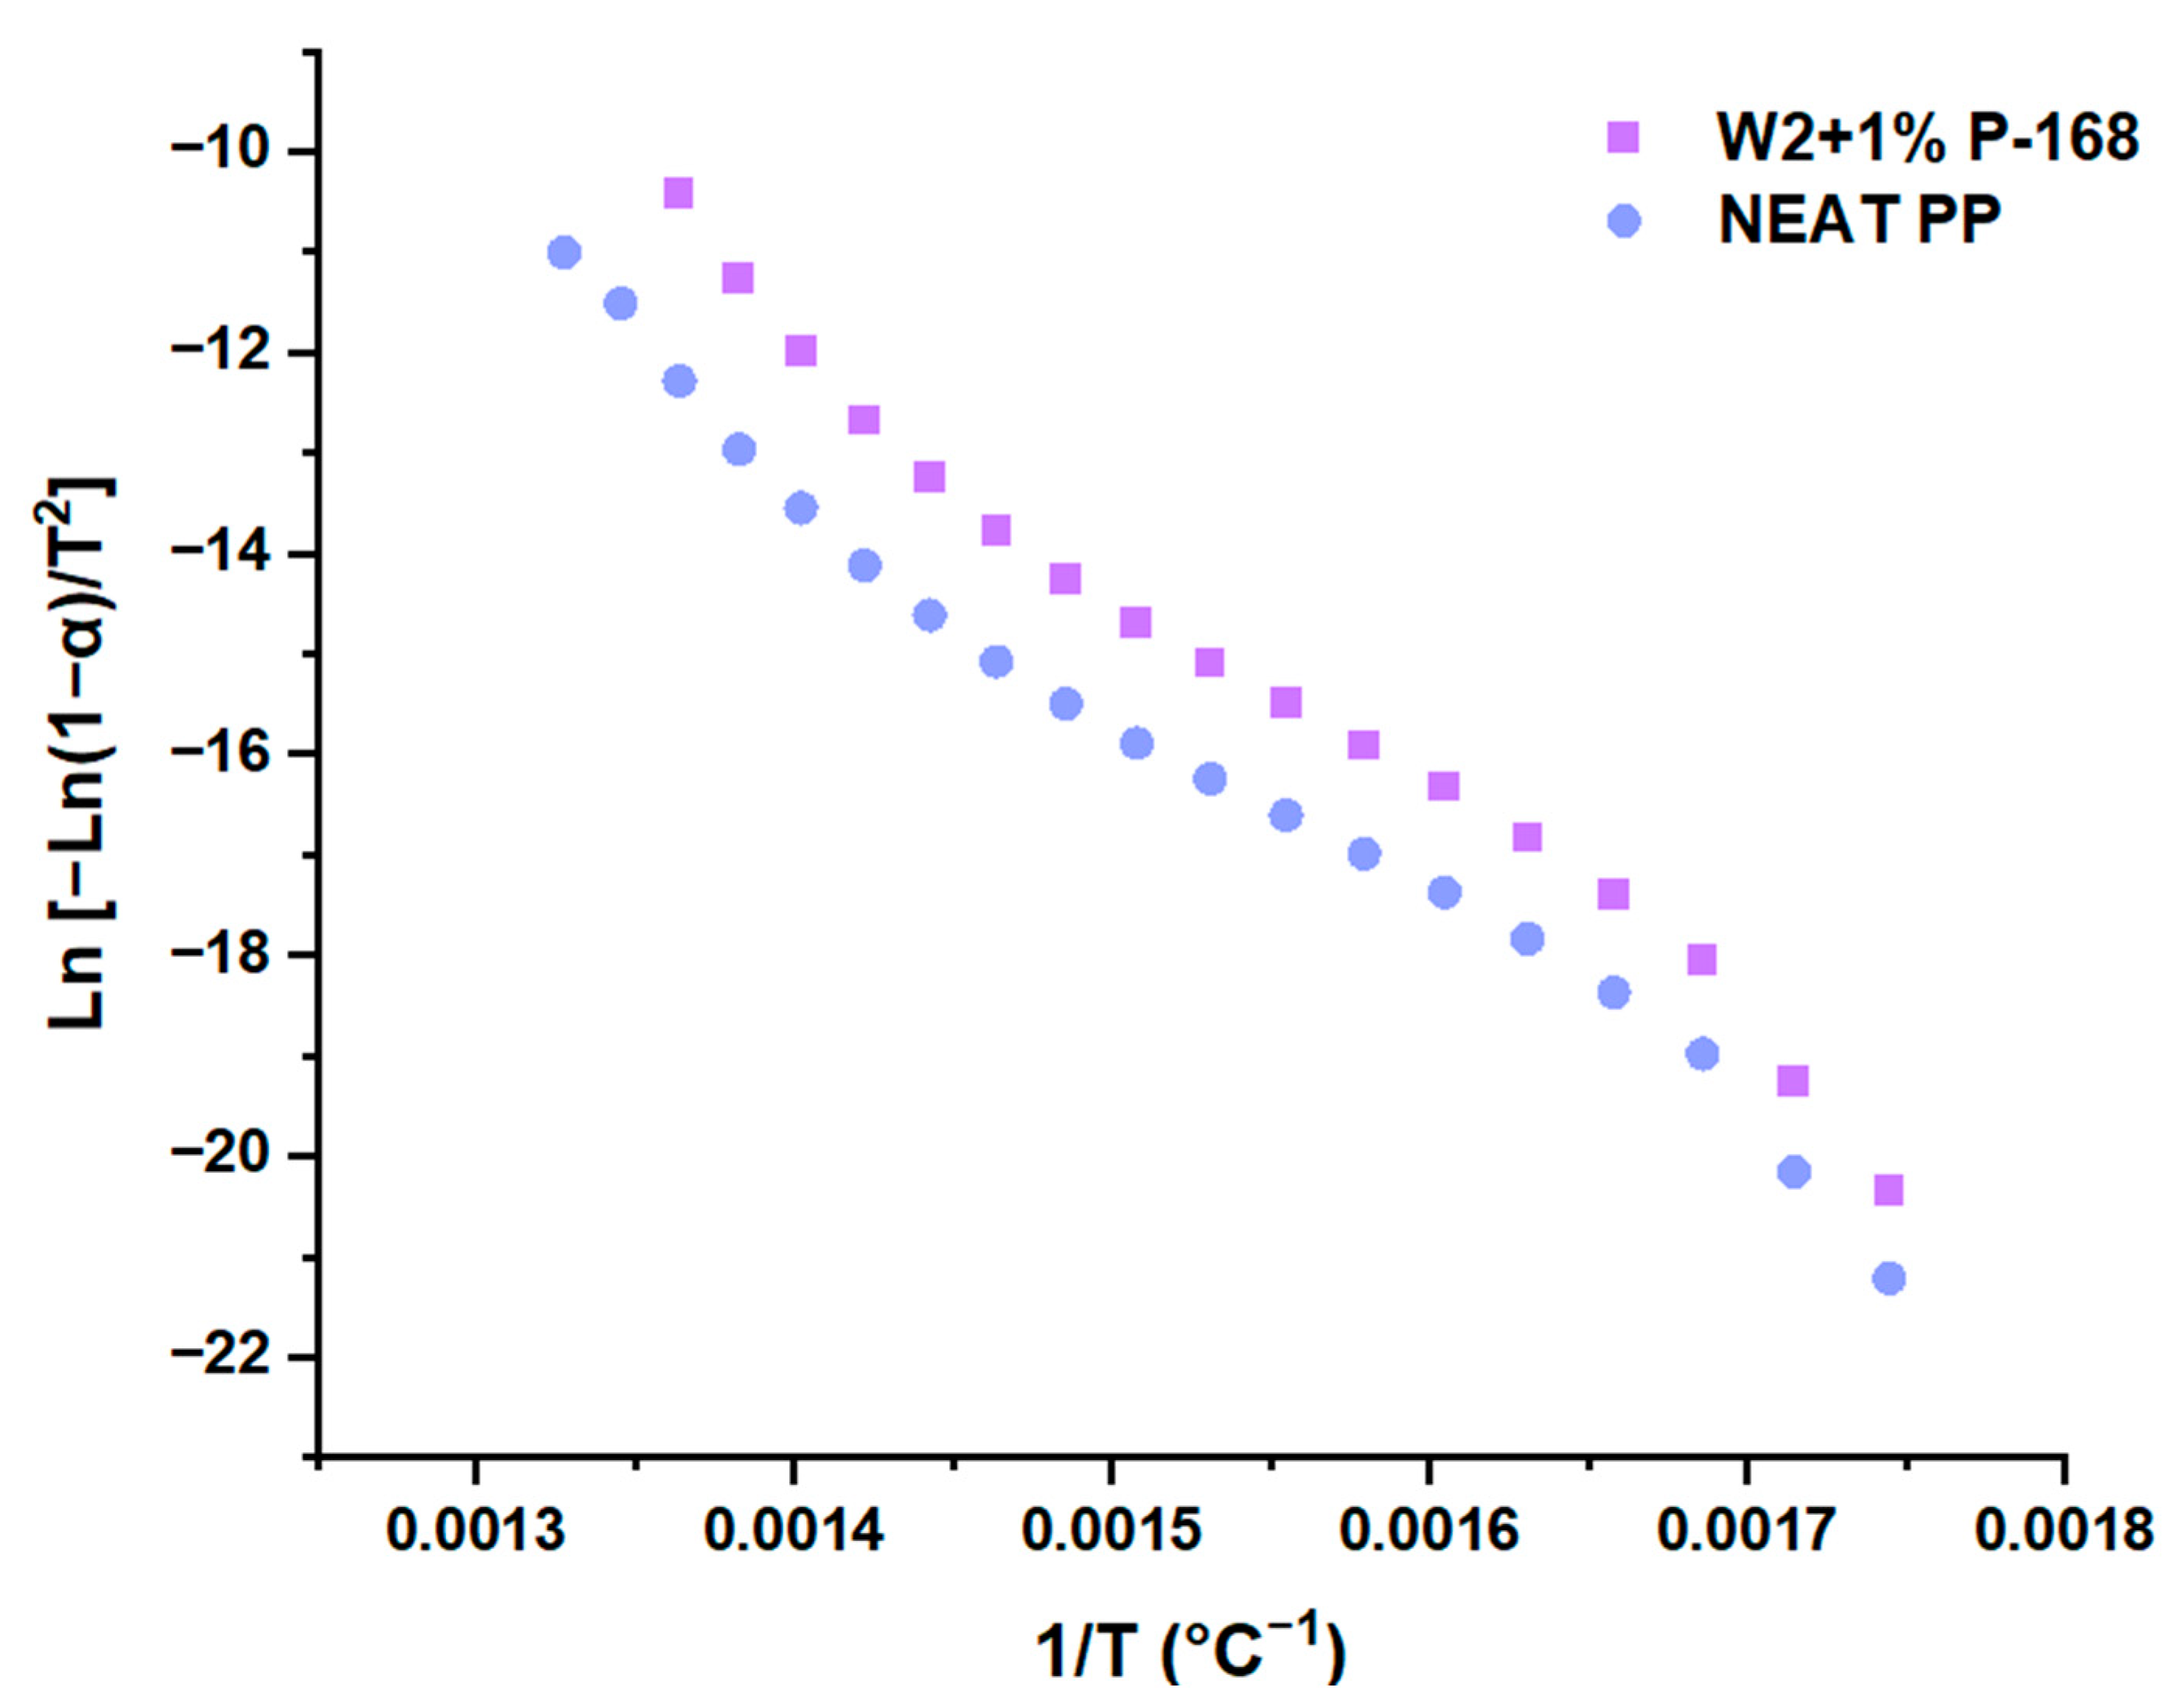
3.1. Kinetic Parameters

The determination of the overall activation energy of the degradation process is a chemical kinetic parameter that provides a comprehensive understanding of the catalytic effect compared to a non-catalytic process [47,48,49,50]. Table 3 and Table 4 display the results obtained for the activation energy for each isoconversion model, ranging from 0.09 to 885.41 kJ/mol, along with their respective equations, by applying the R2 contraction cylinder mechanism, as recommended by Dubdub et al. [51]. This approach proved to be suitable for this type of mixture.

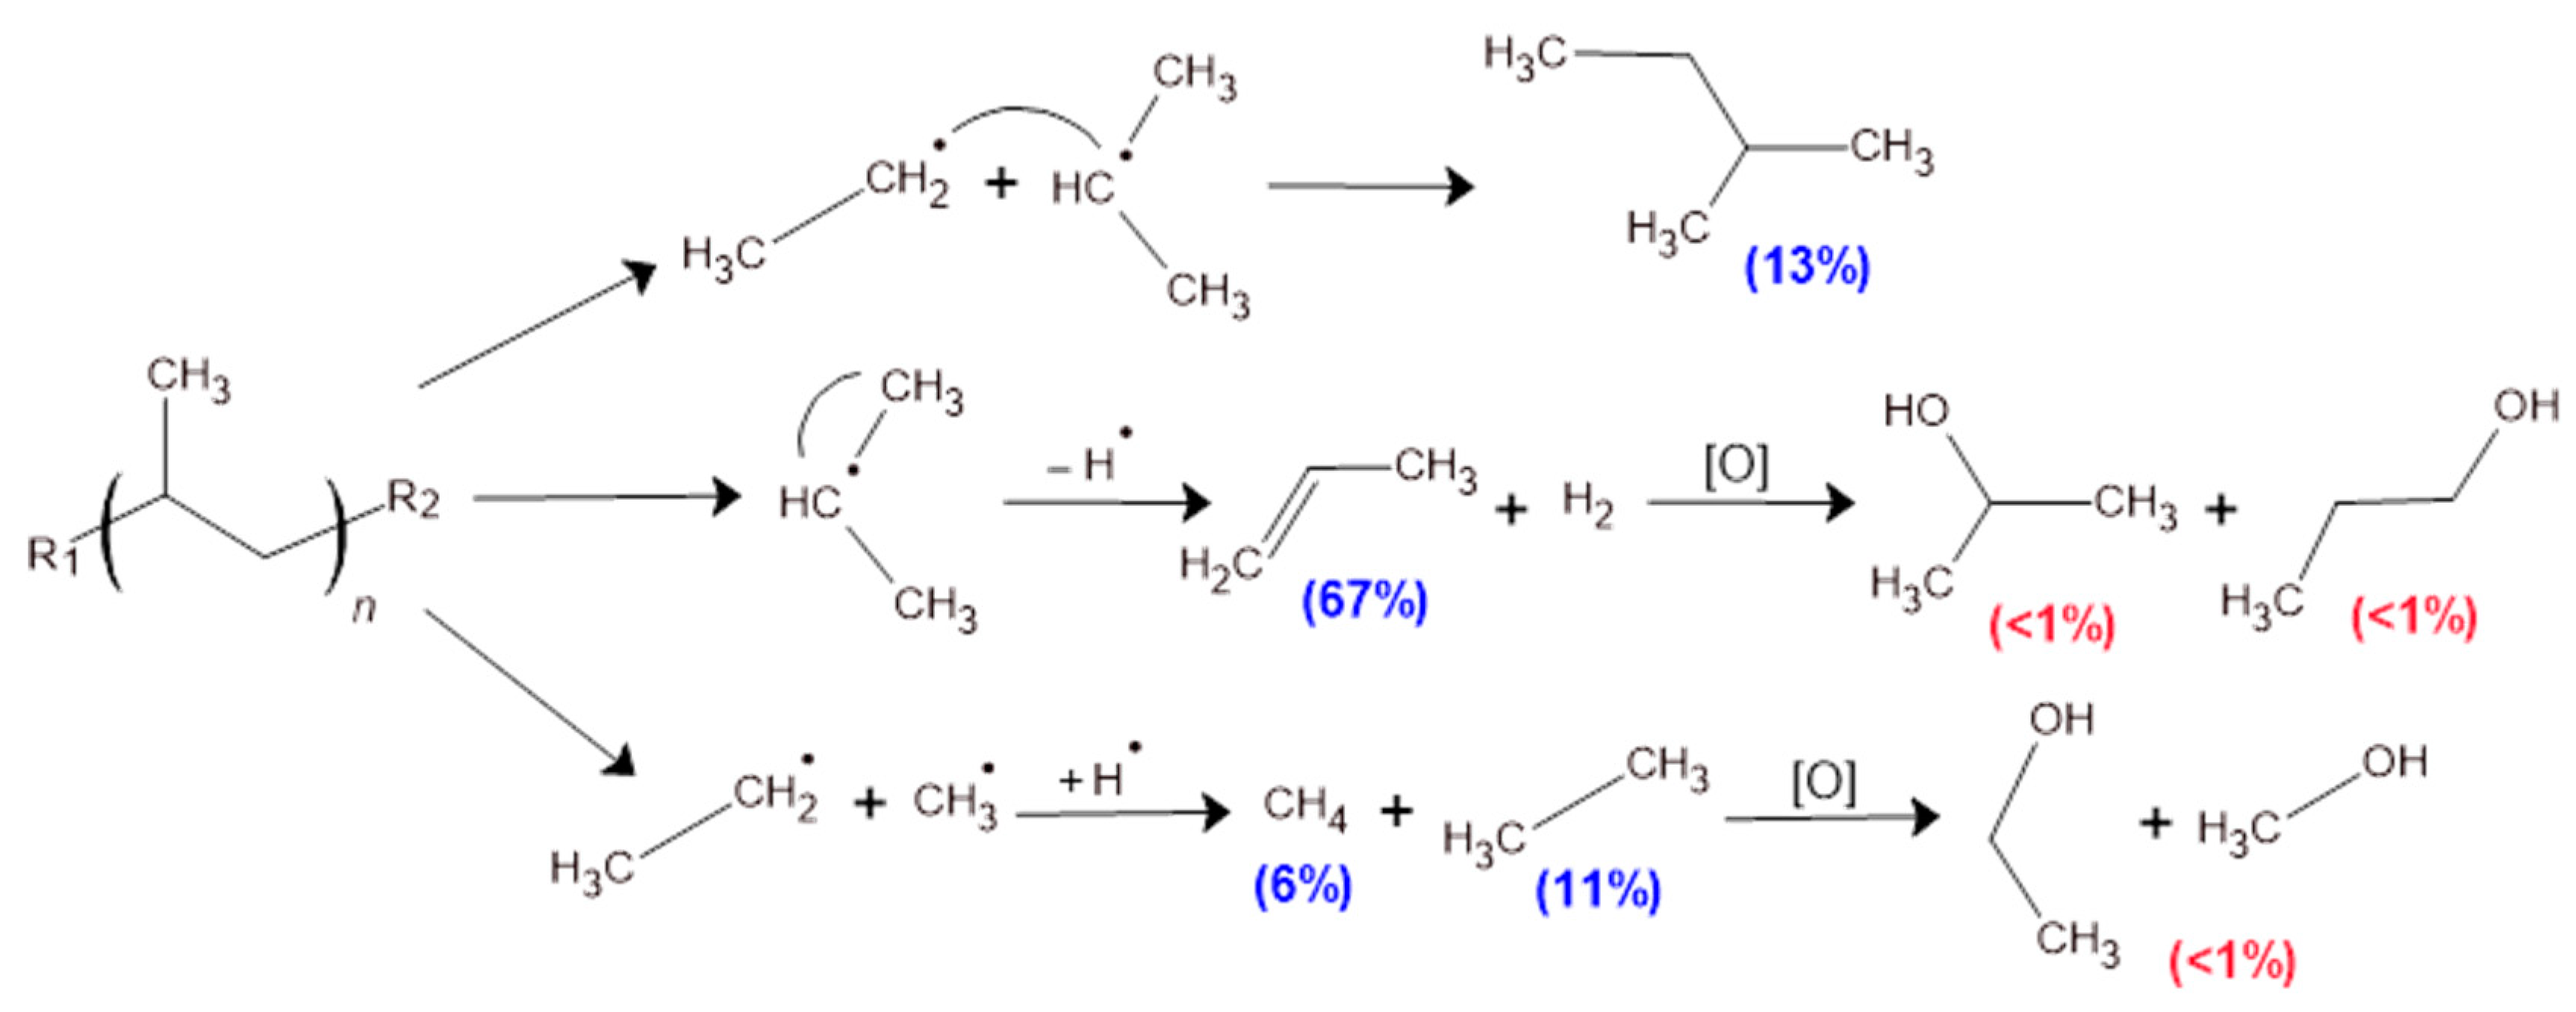
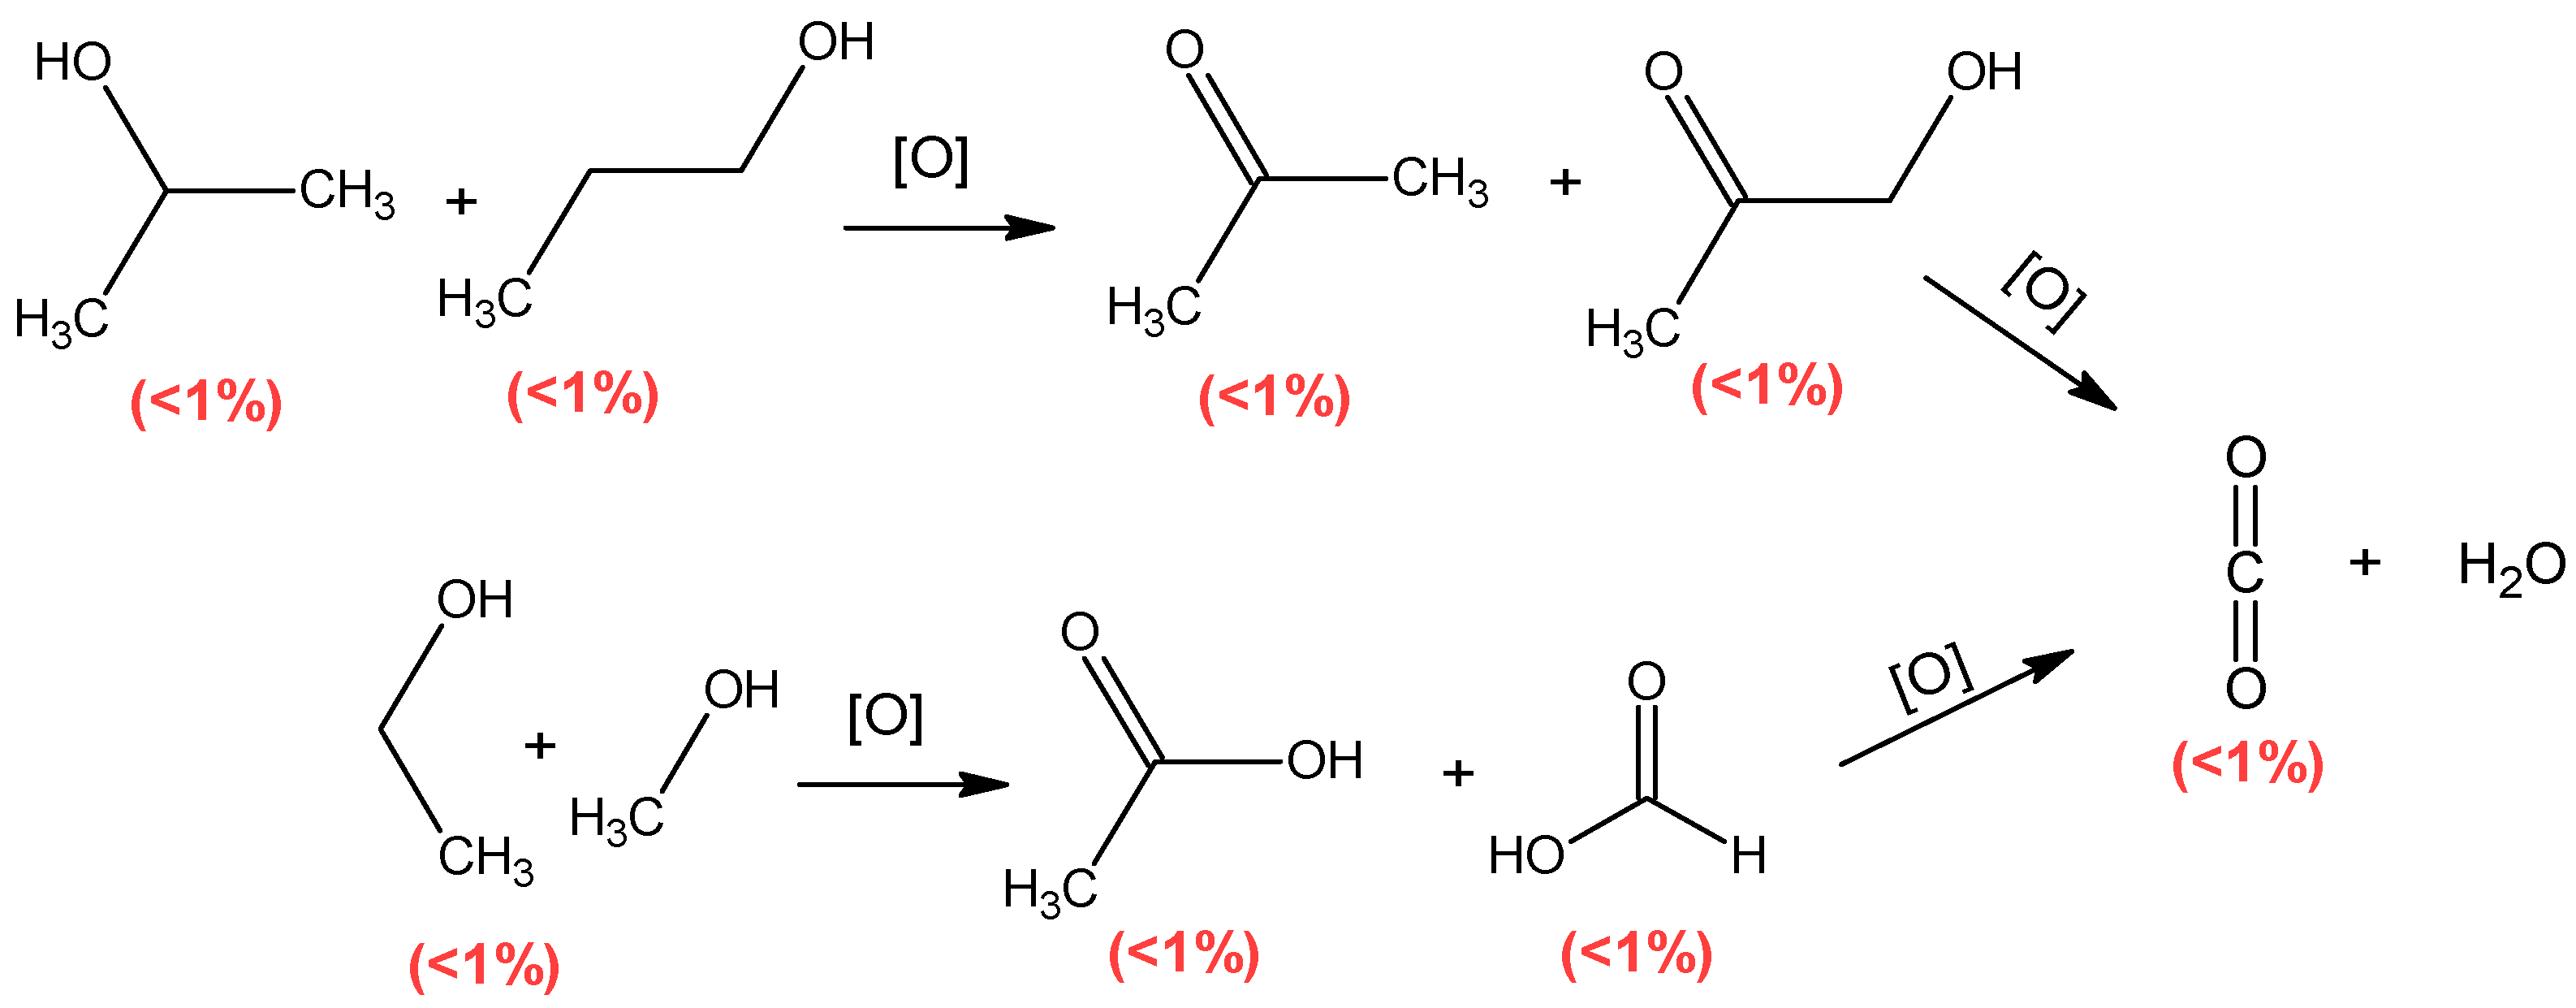
Mechanism of Pyrolysis

Understanding the mechanism of a chemical reaction is fundamental in industry and science, as it provides a step-by-step understanding of the transformation process of reactants, allowing researchers to predict product outcomes, optimize reaction conditions, and devise strategies to synthesize new compounds more efficiently. In this sense, a thermodynamic and mechanistic analysis of the pyrolysis of pure polypropylene (PPO) and PP matrices contaminated with Ziegler–Natta-type metal catalyst residues in an inert N2 atmosphere is presented below. The pyrolytic process was recorded using TGA, and pyrolysis effluent gases were analyzed using GC-MS to identify the identities of the emerging gases and propose a decomposition mechanism. Catalyst residues are predicted to catalyze the process, decreasing the activation energy of the polymer matrix decomposition. Naturally, the physicochemical processes are related to multiple discrete numbers, both in the quantities of the substances consumed and in the products formed (Law of definite proportions); similarly, in a thermogravimetric run, an intrinsic relationship is recorded, in which the mass decreases by evaporation depending on the boiling temperature and chemical properties of the substances formed. This dynamic allows us to obtain an almost fingerprint thermodynamic record of the processes, allowing us to determine the velocity counters and the energy barriers associated with the discrete mass losses, which change from one particular process to another. In the pyrolysis process of polypropylene, three distinct linear trends in mass change were identified, allowing us to propose three marked stages or steps during the process. These stages were observed in the temperature ranges of 370–610 °C, 620–660 °C, and 670–750 °C, with some variations (see Figure 1).
On the other hand, the proposed stages are supported by the stability and concentration of the substances found in the gaseous effluents of pyrolysis, also based on the theoretical guidelines established by organic chemistry “summarizing, from the most reduced to the most oxidized substances”. In detail, after melting the solid PPO matrix (approx. 300–350 °C), no variation in mass percentage is observed. It is expected that the initial stage corresponds to a process of the decomposition or de-polymerization of the linear chains to form reactive hydrocarbon structures of smaller size, free radical type; this process is quite complex and dynamic due to the number of free radicals formed. Although TEAL and TiCl4 residues may influence the process, their exact catalytic role requires further investigation (see Table 5).
In this study, the magnitude of changes in activation energy is presented sequentially using the three methods (see Table 3 and Table 4). It has been observed that the activation energies calculated using the Coats–Redfern method are lower than those obtained with the other two methods. Conversely, the Ea values computed using the Chan et al. [52] method are lower than those obtained by the Horowitz and Metzger method but higher than those from the Coats and Redfern method. These variations in activation energies calculated with the three method may be attributed to different approximations of the temperature integral [3]. It is important to note that while these values may not be the most precise, they provide an approximate range of parameters. Activation energy data obtained by each specific method can be conveniently used to compare the relative thermal stability of different polymers.
The complexity of the process is reflected in the wide range of temperatures involved; it can be proposed that this is an extensive and dynamic process, as initially, the long PPO chains must be decomposed to give rise to the formation of lower-molecular weight hydrocarbons, such as propylene, ethylene, etc. In PPO or PP without catalyst residues, bond breaking is purely thermal. There are two methods to break a bond: using pure thermal energy or through the intervention of a catalyst, which lowers the energy barrier and increases the effectiveness of interactions (making collisions more effective). TEAL and TiCl4 residues reduced the activation energy by approximately 50–90% (Table 5). In the subsequent phase, the most probable and concentrated secondary by-products found in the pyrolysis exhaust gases are more stable alkanes, alkenes, and alkynes, such as methane, ethane, isopentane, and propylene. These compounds are formed from the most likely radicals: methyl, ethyl, and propyl. These hydrocarbons were found in concentrations of approximately 6–57%. This process is faster due to the high reactivity of the precursor radicals. Additionally, it is associated with a shorter temperature range and reduced process time; this is also due to the high reactivity of the precursors and the less condensed phase in which they are found, which accelerates and facilitates more effective collisions, leading to the final products reported here (Scheme 1 and Scheme 2). Finally, the oxidation of hydrocarbons (alkanes and alkenes) consumes all the oxygen, nitrogen, sulfur, and part of the hydrogen from the oxygenated structures and the remaining water vapor, leading to the formation of alcohols, ketones, carboxylic acids, and combustion gases such as CO2, H2S, etc. (Table 6). The oxidized substances were found in low concentrations (below 1%) due to the low availability of oxidizing species. The second phase occurs rapidly and over a shorter temperature range due to the higher reactivity of the formed species (ordinary molecular weight alkyl radicals). In summary, once the polymeric matrix is molten, it decomposes thermally or catalytically; the reactive species lead to the formation of stable hydrocarbons, which are then oxidized to form alcohols, ketones, and other oxidized species. After analyzing the physicochemical process of the anaerobic decomposition of PP and the intermediate by-products, it is possible to design a catalytic protocol to decompose polymeric matrices into hydrocarbons that can later be used in the energy and petrochemical industries.

3.2. Thermodynamic Analysis

For the following thermodynamic analysis of the thermogravimetric profile of pyrolysis, the Coats–Redfern (C-R) [53] and Horowitz–Metzger (H-M) [46] approximations were used, which are related to or generated from the Arrhenius theoretical approximation [54]. Before the thermodynamic analysis, temperature ranges with marked linear trends were identified and separated. Once the linear approximations of the C-R and H-M methods were modeled, the activation energies of the three proposed processes were determined, finding consistency in the order of magnitude. In the samples contaminated with catalyst residues, it was found that aluminum and titanium catalyst residues markedly decreased the energy barrier in the three stages by about 50–90% (see Table 3). Specifically, TEAL concentrations (represented as Al) of approximately 400 ppm reduced the activation energy notably by about 90%; in Table 3, it can be seen that in most of the tests with the contaminated samples, the activation energy in the three stages was below the activation energy of PPO, except in samples W2 and W3, which presented similar activation energies in stage 3 of the mechanism.
Another important aspect is that the most significant decrease in activation energy occurred in the initial phase, which is the determining phase of decomposition. The contaminated samples mixed with the additive IRGAFOS P-168 (IG-P168) presented the same behavior as pure PPO, suggesting that the residues of TEAL and TiCl4 react beforehand with the additive, being consumed before the decomposition of the polymeric matrix. Figure 2 shows the thermal profile of PP and W2+1%IG-P168, where parallel mathematical trends can be observed, corroborating the hypothesis that the additive may consume the excess catalysts before polymeric decomposition.
Finally, it is essential to highlight that the pyrolysis of polypropylene (PP) using Ziegler–Natta catalysts has a significant impact by significantly reducing the activation energy of the process. This phenomenon leads to the production of gaseous hydrocarbons, which are of great industrial interest in the energy and petrochemical chains. Consequently, this type of process can be proposed as relevant to the circular economy framework, offering valuable insights for sustainable resource management.
All the tests reveal a greater degree of degradation in samples W1 and W5, which, in turn, present the highest levels of Al, Cl, and Fe. On the other hand, it was determined that PP0 and W3 are the most stable since they have the lowest concentrations of these metal residues. See Figure 3. The trend in these results suggests that TEAL and TiCl4 undergo decomposition processes that generate free radicals, as previously mentioned and shown in Figure 4a. These free radicals, in turn, react considerably with the polymer, accelerating its degradation. For samples PP0 and W3, Ea values of 286 and 224 kJ mol−1 were obtained using the Horowitz–Metzger method. These values are the highest and are related to lower mean concentrations of Al, Cl, and Fe, which are 5.15, 13.37, and 4.13 ppm, respectively. As for samples W1 and W5, with the Coats–Redfern method, a maximum Ea value of 80.83 kJ mol−1 for sample W1 and 102.99 kJ mol−1 for sample W5 was recorded. The average Al, Cl, and Fe concentrations increased compared to the previous samples, reaching values of 320.23, 201.03, and 99.11 ppm, respectively. Finally, for samples W2 and W4, the highest Ea values were obtained: 177 kJ mol−1 for W2, using the Horowitz–Metzger model, and 132.17 kJ mol−1 for W4, with the Coats–Redfern model. This group’s mean Al, Cl, and Fe concentrations were 88.135, 93.47, and 47.93 ppm, respectively.
As is widely recognized, the presence of metals during the degradation of PP acts as a catalyst factor, facilitating the formation of oxygenated compounds (alcohols, aldehydes, ketones, carboxylic acids, and permanent gases) [16,31,40,42]. From a thermodynamic point of view, these oxygenated species are more stable than other degradation products. The catalytic influence of metals reduces the activation energy necessary for the formation reactions of these compounds, which promotes their appearance during the PP degradation process, as indicated in Scheme 2. Sample analysis (Figure 4b) revealed a direct relationship between the presence of metals, the formation of oxygenated species, and the lowest activation energies observed. Specifically, samples with higher concentrations of aluminum (Al) (Figure 4a) showed more significant amounts of oxygenated compounds. This finding underlines the catalytic role of metals in generating oxygenated species during PP degradation.

4. Discussion

In the research titled “Kinetic Analysis of Thermal Degradation of Recycled Polypropylene and Polystyrene Mixtures Using Regenerated Catalyst from Fluidized Catalytic Cracking Process (FCC)”, the focus is on the regeneration of catalysts and their application in the pyrolysis of recycled mixtures of polypropylene and polystyrene [55]. The study’s approach, which is of paramount importance in addressing plastic waste management and the potential for harnessing its energy value, is a significant contribution to the field. The results revealed that the integral isoconversion model by Starink provided the best fit to the experimental data, suggesting it is the most suitable method for describing the degradation kinetics in this context. The values of activation energy obtained at different heating rates (188, 215, and 148 kJ/mol) are crucial because they indicate the amount of energy required for thermal degradation to occur. In this case, lower activation energy values suggest that the degradation process is more efficient and, thus, more accessible to initiate. This could be beneficial in applications where the rapid conversion of plastic waste into valuable products, such as hydrocarbons, is desired.
Our study focused on analyzing the thermal degradation of polypropylene (PP) and how catalyst residues, such as iron, aluminum, and chlorine, influence this process. Various kinetic models, including Coats–Redfern (CR), Horowitz–Metzger (HM), Flynn–Wall–Ozawa (FWO), and Kissinger–Akahira–Sunose (KAS), were employed to analyze the degradation kinetics. The results demonstrated that Ziegler–Natta catalyst residues significantly decrease the activation energy of pyrolysis, making the process more efficient and more accessible to initiate. This reduction in activation energy is fundamental as it reduces the costs and energy required for pyrolysis. The obtained activation energy values, such as 885.41 kJ/mol in clean PP and 0.09 kJ/mol (W3) in the sample with catalyst residues, illustrate how these residues can expedite the PP degradation process.

5. Conclusions

In conclusion, physical polymer recycling provides assurances for economic and environmental well-being. However, chemical recycling, primarily through the pyrolysis of olefinic polymeric matrices, offers a compelling alternative by providing cleaner and more durable materials with enhanced mechanical performance. This study has conducted an analysis of the products generated during the pyrolysis and thermo-oxidative degradation of C-PP-PE, revealing hydrocarbon gases as the predominant products, constituting over 50% and holding significant value in the petrochemical industry. The identification of oxidized substances indicates that less than 1% is attributed to residual water vapor and other oxidative species.
These findings contribute valuable insights that extend beyond the laboratory, informing real-world applications in polymer recycling, industry practices, and sustainable material development. It is essential to highlight that isoconversional models provide detailed information on the kinetics and mechanisms of degradation. This information can be utilized to optimize industrial processes related to the production and recycling of polypropylene, potentially leading to significant cost reductions and efficiency improvements. Additionally, understanding the action of inorganic chemical residues in polypropylene degradation is crucial for developing more effective recycling technologies, contributing to designing chemical recycling methods that minimize environmental impact and maximize the recovery of valuable materials. The results of this study could have direct implications for industrial plastic waste management, enabling the implementation of more sustainable practices to reduce the amount of plastic waste and improve the quality of recycled materials. Furthermore, understanding degradation mechanisms could contribute to the design of more robust and durable polypropylene resins, with potential applications in manufacturing plastic products with an extended lifespan. These aspects reinforce the relevance and practical impact of the presented research, making it clear that the findings are not just theoretical but have tangible implications for the industry and the environment.

Author Contributions

Conceptualization, E.A.E.F., R.O.-T. and J.A.H.F.; Methodology, E.A.E.F. and J.A.H.F.; Software, E.A.E.F., R.O.-T. and J.A.H.F.; Validation, R.O.-T. and J.A.H.F.; Formal analysis, E.A.E.F.; Investigation, R.O.-T. and J.A.H.F.; Resources, R.O.-T.; Data curation, E.A.E.F. and J.A.H.F.; Writing—review and editing, E.A.E.F., R.O.-T. and J.A.H.F.; Visualization, E.A.E.F., R.O.-T. and J.A.H.F.; Supervision, J.A.H.F.; Project administration, J.A.H.F.; Funding acquisition, R.O.-T. All authors have read and agreed to the published version of the manuscript.

Funding

This research received no external funding.

Data Availability Statement

Data are contained within the article.

Conflicts of Interest

The authors declare no conflicts of interest.

References

  1. Zweifel, H. Stabilization of Polymeric Materials; Springer Science & Business Media: Berlin/Heidelberg, Germany, 2012. [Google Scholar]
  2. Pospíšil, J.; Klemchuk, P.P. Oxidation Inhibition in Organic Materials; CRC Press: Boca Raton, FL, USA, 1990; Volumes 1 and 2. [Google Scholar]
  3. Scott, G. Atmospheric Oxidation and Antioxidants; Elsevier Science Publishers: Amsterdam, The Netherlands, 1993; Volume 1, ISBN 9780444896179. [Google Scholar] [CrossRef]
  4. Rabek, J.F. (Ed.) Photostabilization of Polymers: Priciples and Application; Springer Science & Business Media: Berlin/Heidelberg, Germany, 2012. [Google Scholar]
  5. Kleinhans, K.; Demets, R.; Dewulf, J.; Ragaert, K.; De Meester, S. Non-household end-use plastics: The ‘forgotten’plastics for the circular economy. Curr. Opin. Chem. Eng. 2021, 32, 100680. [Google Scholar] [CrossRef]
  6. Brems, A.; Dewil, R.; Baeyens, J.; Zhang, R. Gasification of plastic waste as waste-to-energy or waste-to-syngas recovery route. Solid Waste A Renew. Resour. 2013, 5, 241–263. [Google Scholar] [CrossRef]
  7. Al-Salem, S.M.; Lettieri, P.; Baeyens, J. Recycling and recovery routes of plastic solid waste (PSW): A review. Waste Manag. 2009, 29, 2625–2643. [Google Scholar] [CrossRef] [PubMed]
  8. Pfaendner, R. Restabilization–30 years of research for quality improvement of recycled plastics review. Polym. Degrad. Stab. 2022, 203, 110082. [Google Scholar] [CrossRef]
  9. Alotaibi, M.; Aldhafeeri, T.; Barry, C. The Impact of Reprocessing with a Quad Screw Extruder on the Degradation of Polypropylene. Polymers 2022, 14, 2661. [Google Scholar] [CrossRef]
  10. Blázquez-Blázquez, E.; Díez-Rodríguez, T.M.; Pérez, E.; Cerrada, M.L. Recycling of metallocene isotactic polypropylene: Importance of antioxidants. J. Therm. Anal. Calorim. 2022, 147, 13363–13374. [Google Scholar] [CrossRef]
  11. Schweighuber, A.; Felgel-Farnholz, A.; Bögl, T.; Fischer, J.; Buchberger, W. Investigations on the influence of multiple extrusion on the degradation of polyolefins. Polym. Degrad. Stab. 2021, 192, 109689. [Google Scholar] [CrossRef]
  12. Schyns, Z.O.; Shaver, M.P. Mechanical recycling of packaging plastics: A review. Macromol. Rapid Commun. 2021, 42, 2000415. [Google Scholar] [CrossRef] [PubMed]
  13. Gabriel, D.S.; Saragih, R.H.P. Impact of repetitive recycling on optical properties of virgin and recycled polypropylene blends based on material value conservation paradigm. Mater. Sci. Forum 2021, 1020, 192–198. [Google Scholar] [CrossRef]
  14. Saikrishnan, S.; Jubinville, D.; Tzoganakis, C.; Mekonnen, T.H. Thermo-mechanical degradation of polypropylene (PP) and low-density polyethylene (LDPE) blends exposed to simulated recycling. Polym. Degrad. Stab. 2020, 182, 109390. [Google Scholar] [CrossRef]
  15. Lindqvist, K.; Andersson, M.; Boss, A.; Oxfall, H. Thermal and mechanical properties of blends containing PP and recycled XLPE cable waste. J. Polym. Environ. 2019, 27, 386–394. [Google Scholar] [CrossRef]
  16. Hernández-Fernández, J.; Castro-Suares, J.; Toloza, C. Iron Oxide Powder as Responsible for the Generation of Industrial Polypropylene Waste and as a Co-Catalyst for the Pyrolysis of Non-Additive Resins. Int. J. Mol. Sci. 2022, 23, 11708. [Google Scholar] [CrossRef] [PubMed]
  17. La Mantia, F.P.; Morreale, M.; Botta, L.; Mistretta, M.C.; Ceraulo, M.; Scaffaro, R. Degradation of polymer blends: A brief review. Polym. Degrad. Stab. 2017, 145, 79–92. [Google Scholar] [CrossRef]
  18. Hamskog, M.; Klügel, M.; Forsström, D.; Terselius, B.; Gijsman, P. The effect of base stabilization on the recyclability of polypropylene as studied by multi-cell imaging chemiluminescence and microcalorimetry. Polym. Degrad. Stab. 2004, 86, 557–566. [Google Scholar] [CrossRef]
  19. Hamskog, M.; Kluegel, M.; Forsstroem, D.; Terselius, B.; Gijsman, P. The effect of adding virgin material or extra stabilizer on the recyclability of polypropylene as studied by multi-cell imaging chemiluminescence and microcalorimetry. Polym. Degrad. Stab. 2006, 91, 429–436. [Google Scholar] [CrossRef]
  20. Ranjan, V.P.; Goel, S. Recyclability of polypropylene after exposure to four different environmental conditions. Resour. Conserv. Recycl. 2021, 169, 105494. [Google Scholar] [CrossRef]
  21. Knight, J.B.; Calvert, P.D.; Billingham, N.C. Localization of oxidation in polypropylene. Polymer 1985, 26, 1713–1718. [Google Scholar] [CrossRef]
  22. Billingham, N.C.; Calvert, P.D.; Knight, J.B. Application of ultraviolet microscopy to oxidation of polyolefin. In Proc. IUPAC, IUPAC, Macromol. Symp. 1982.
  23. Cicchetti, O.; De Simone, R.; Gratani, F. Titanium-catalysed-inhibited autoxidation of polypropylene and of its models. Eur. Polym. J. 1973, 9, 1205–1229. [Google Scholar] [CrossRef]
  24. Kresta, J.; Majer, J.; Veselý, K. Reactions of low molecular weight polypropylene induced by titanium compounds. J. Polym. Sci. Part C Polym. Symp. 1968, 22, 329–338. [Google Scholar] [CrossRef]
  25. Allen, N.S.; Fatinikun, K.O.; Henman, T.J. Thermal and photochemical oxidation of polypropylene. Influence of residual catalyst levels in unstabilised diluent and gas phase polymers. Eur. Polym. J. 1983, 19, 551–554. [Google Scholar] [CrossRef]
  26. Gijsman, P.; Fiorio, R. Long term thermo-oxidative degradation and stabilization of polypropylene (PP) and the implications for its recyclability. Polym. Degrad. Stab. 2023, 208, 110260. [Google Scholar] [CrossRef]
  27. Goss, B.G.; Nakatani, H.; George, G.A.; Terano, M. Catalyst residue effects on the heterogeneous oxidation of polypropylene. Polym. Degrad. Stab. 2003, 82, 119–126. [Google Scholar] [CrossRef]
  28. Ahlblad, G.; Gijsman, P.; Terselius, B.; Jansson, A.; Möller, K. Thermo-oxidative stability of PP waste films studied by imaging chemiluminescence. Polym. Degrad. Stab. 2001, 73, 15–22. [Google Scholar] [CrossRef]
  29. Scheirs, J.; Delatycki, O.; Bigger, S.W.; Billingham, N.C. Staining techniques for detecting localized oxidation in high density polyethylene powders and films. Polym. Int. 1991, 26, 187–193. [Google Scholar] [CrossRef]
  30. Celina, M.; George, G.A. A heterogeneous model for the thermal oxidation of solid polypropylene from chemiluminescence analysis. Polym. Degrad. Stab. 1993, 40, 323–335. [Google Scholar] [CrossRef]
  31. Hernández-Fernández, J.; Cano, H.; Aldas, M. Impact of Traces of Hydrogen Sulfide on the Efficiency of Ziegler–Natta Catalyst on the Final Properties of Polypropylene. Polymers 2022, 14, 3910. [Google Scholar] [CrossRef] [PubMed]
  32. Ablblad, G.; Stenberg, B.; Terselius, B.; Reitberger, T. Imaging chemiluminescence instrument for the study of heterogeneous oxidation effects in polymers. Polym. Test. 1997, 16, 59–73. [Google Scholar] [CrossRef]
  33. Eriksson, P.; Reitberger, T.; Ahlblad, G.; Stenberg, B. Oxidation fronts in polypropylene as studied by imaging chemiluminescence. Polym. Degrad. Stab. 2001, 73, 177–183. [Google Scholar] [CrossRef]
  34. Nakatani, H.; Shibata, H.; Miyazaki, K.; Yonezawa, T.; Takeda, H.; Azuma, Y.; Watanabe, S. Studies on heterogeneous degradation of polypropylene/talc composite: Effect of iron impurity on the degradation behavior. J. Appl. Polym. Sci. 2010, 115, 167–173. [Google Scholar] [CrossRef]
  35. Drake, W.O.; Pauquet, J.-R.; Todesco, R.V. Polypropylene the Way Ahead, Madrid, Spain; PRI: London, UK, 1989. [Google Scholar]
  36. Richters, P. Initiation process in the oxidation of polypropylene. Macromolecules 1970, 3, 262–264. [Google Scholar] [CrossRef]
  37. Billingham, N.C. Localization of oxidation in polypropylene. In Makromolekulare Chemie. Macromolecular Symposia; Hüthig & Wepf Verlag: Basel, Switzerland, 1989; Volume 28, pp. 145–163. [Google Scholar]
  38. Blakey, I.; Billingham, N.; George, G.A. Use of 9,10-diphenylanthracene as a contrast agent in chemiluminescence imaging: The observation of spreading of oxidative degradation in thin polypropylene films. Polym. Degrad. Stab. 2007, 92, 2102–2109. [Google Scholar] [CrossRef]
  39. Hernández-Fernández, J.; Guerra, Y.; Espinosa, E. Development and Application of a Principal Component Analysis Model to Quantify the Green Ethylene Content in Virgin Impact Copolymer Resins During Their Synthesis on an Industrial Scale. J. Polym. Environ. 2022, 30, 4800–4808. [Google Scholar] [CrossRef]
  40. Hernández-Fernández, J.; Vivas-Reyes, R.; Toloza, C.A.T. Experimental Study of the Impact of Trace Amounts of Acetylene and Methylacetylene on the Synthesis, Mechanical and Thermal Properties of Polypropylene. Int. J. Mol. Sci. 2022, 23, 12148. [Google Scholar] [CrossRef] [PubMed]
  41. Pavon, C.; Aldas, M.; Hernández-Fernández, J.; López-Martínez, J. Comparative characterization of gum rosins for their use as sustainable additives in polymeric matrices. J. Appl. Polym. Sci. 2022, 139, 51734. [Google Scholar] [CrossRef]
  42. Hernández-Fernández, J.; Lopez-Martinez, J.; Barceló, D. Development and validation of a methodology for quantifying parts-per-billion levels of arsine and phosphine in nitrogen, hydrogen and liquefied petroleum gas using a variable pressure sampler coupled to gas chromatography-mass spectrometry. J. Chromatogr. A 2021, 1637, 461833. [Google Scholar] [CrossRef] [PubMed]
  43. Hu, Q.; Tang, Z.; Yao, D.; Yang, H.; Shao, J.; Chen, H. Thermal behavior, kinetics and gas evolution characteristics for the co-pyrolysis of real-world plastic and tyre wastes. J. Clean. Prod. 2020, 260, 121102. [Google Scholar] [CrossRef]
  44. Vyazovkin, S.; Burnham, A.K.; Criado, J.M.; Pérez-Maqueda, L.A.; Popescu, C.; Sbirrazzuoli, N. ICTAC Kinetics Committee recommendations for performing kinetic computations on thermal analysis data. Thermochim. Acta 2011, 520, 1–19. [Google Scholar] [CrossRef]
  45. Coats, A.W.; Redfern, J.P. Kinetic Parameters from Thermogravimetric Data. Nature 1964, 201, 68–69. [Google Scholar] [CrossRef]
  46. Horowitz, H.H.; Metzger, G. A New Analysis of Thermogravimetric Traces. Anal. Chem. 1963, 35, 1464–1468. [Google Scholar] [CrossRef]
  47. Meng, X.; Yang, R. How formaldehyde affects the thermo-oxidative and photo-oxidative mechanism of polypropylene: A DFT/TD-DFT study. Polym. Degrad. Stab. 2022, 205, 110131. [Google Scholar] [CrossRef]
  48. Nguyen, H.M.; Tang, H.-Y.; Huang, W.-F.; Lin, M. Mechanisms for reactions of trimethylaluminum with molecular oxygen and water. Comput. Theor. Chem. 2014, 1035, 39–43. [Google Scholar] [CrossRef]
  49. Naumkin, F.Y. Flat-structural Motives in Small Alumino−Carbon Clusters CnAlm (n = 2−3, m = 2−8). J. Phys. Chem. A 2008, 112, 4660–4668. [Google Scholar] [CrossRef] [PubMed]
  50. Martínez-Narro, G.; Royston, N.J.; Billsborough, K.L.; Phan, A.N. Kinetic modelling of mixed plastic waste pyrolysis. Chem. Thermodyn. Therm. Anal. 2023, 9, 100105. [Google Scholar] [CrossRef]
  51. Dubdub, I.; Al-Yaari, M. Pyrolysis of Mixed Plastic Waste: I. Kinet. Study. Mater. 2020, 13, 4912. [Google Scholar] [CrossRef]
  52. Gul, H.; Shah, A.U.H.A.; Gul, S.; Arjomandi, J.; Bilal, S. Study on the thermal decomposition kinetics and calculation of activation energy of degradation of poly (o-toluidine) using thermogravimetric analysis. Iran. J. Chem. Chem. Eng. (IJCCE) 2018, 37, 193–204. [Google Scholar]
  53. Cai, J.; Bi, L. Precision of the Coats and Redfern Method for the Determination of the Activation Energy without Neglecting the Low-Temperature End of the Temperature Integral. Energy Fuels 2008, 22, 2172–2174. [Google Scholar] [CrossRef]
  54. Arrhenius, S. Über die Dissociationswärme und den Einfluss der Temperatur auf den Dissociationsgrad der El-ektrolyte. Z. Für Phys. Chem. 1889, 4U, 96–116. [Google Scholar] [CrossRef]
  55. Palmay, P.; Pillajo, L.; Andrade, M.; Medina, C.; Barzallo, D. Kinetic Analysis of Thermal Degradation of Recycled Polypropylene and Polystyrene Mixtures Using Regenerated Catalyst from Fluidized Catalytic Cracking Process (FCC). Polymers 2023, 15, 2035. [Google Scholar] [CrossRef]
Scheme 1. A proposed mechanism for the decomposition of polypropylene.
Jcs 08 00311 sch001
Scheme 2. Oxidation reaction mechanism of hydrocarbon gases. Concentration of gases was estimated from peak area of chromatographic run.
Jcs 08 00311 sch002
Figure 1. A Thermal decaying model according to the following: (a) Coats and Redfern; (b) Horowitz and Metz; (c) Kissinger–Akahira–Sunose (KAS); and (d) Flynn–Wall–Ozawa (FWO).
Jcs 08 00311 g001
Figure 2. Comparison of EA decays according to H-R methods for PPO and samples contaminated with additive Irganox (W2 + 1% de IGP-168).
Jcs 08 00311 g002
Figure 3. Comparison of thermal decays according to H-R methods for PPO and samples contaminated with additive Irganox (W1 + 1% de IGP-168); (a) TGA profile and (b) DTG curves of different samples.
Jcs 08 00311 g003
Figure 4. (a) Activation energy (Ea) values for residual products using the Coats–Redfern, Ozawa, Horowitz–Metzger, and Kissinger models; (b) relationship between oxygenated compounds formed during PP degradation and activation energy in each sample.
Jcs 08 00311 g004
Table 1. The composition of the catalytic system.
ComponentAmount (%W/W)
White mineral oil (petroleum)≤75%
Magnesium chloride–titanium tetrachloride complex≤30%
Organic ester<7%
Diethyl phthalate<5%
Isopentane<8%
Titanium tetrachloride≤0.65%
Phthalic anhydride≤0.6%
Chlorobenzene≤0.5%
2-Chloro-1-methylbenzene≤0.04%
Iron chloride≤0.004%
Aluminum chloride≤0.005%
Table 2. Sample composition.
Moisture, wt%Volatile Matter,
wt%
Ti
ppm
Al
ppm
Cl
ppm
Fe
ppm
PPO0.1899.490.988.5313.374.13
W10.3399.490.98320.23201.0399.11
W20.2199.490.98171.1281.7151.34
W30.1899.490.985.1558.757.03
W40.2299.490.985.15105.2344.51
W50.3599.490.98410.13205.33100.13
Table 3. Kinetic parameters obtained by Horowitz and Metz and Coats and Redfern methods.
Sample NameStages MechanismHorowitz and Metz (HM)Ea/kJCoats and Redfern (CR)Ea/kJA
PPO1 ln ( ln 1 1 α = 0.1994 θ + 4.6222 412.73 ln l n ( 1 α ) T 2 = 30100 T + 31.462 250.264.22 × 1017
2 ln ( ln 1 1 α = 0.0422 θ 1.1644 173.48 ln l n ( 1 α ) T 2 = 15304 T + 7.1851 127.246.01 × 106
3 ln ( ln 1 1 α = 0.0667 θ 1.0588 274.19 ln l n ( 1 α ) T 2 = 29053 T + 27.39 241.566.76 × 1015
W11 ln ( ln 1 1 α = 0.0002 θ + 1.056 0.82 ln l n ( 1 α ) T 2 = 3257.8 T 9.9442 27.091.90 × 107
2 ln ( ln 1 1 α = 0.0007 θ + 1.1483 2.88 ln l n ( 1 α ) T 2 = 7175,4 T 3.7459 59.669.40 × 104
3 ln ( ln 1 1 α = 0.0171 θ + 1.882 70.30 ln l n ( 1 α ) T 2 = 18731 T + 13.498 155.744.00 × 109
W21 ln ( ln 1 1 α = 0.0159 θ 2.693 65.36 ln l n ( 1 α ) T 2 = 3859.8 T 9.9783 32.092.49 × 107
2 ln ( ln 1 1 α = 0.0378 θ 1.3818 155.39 ln l n ( 1 α ) T 2 = 8522.1 T 1.9798 70.861.85 × 104
3 ln ( ln 1 1 α = 0.0755 θ 1.4 893 310.37 ln l n ( 1 α ) T 2 = 34837 T + 37.033 289.651.20 × 1020
W31 ln ( ln 1 1 α = 0.0546 θ 0.3011 224.45 ln l n ( 1 α ) T 2 = 17228 T + 10.837 143.682.48 × 108
2 ln ( ln 1 1 α = 0.0425 θ 1.6025 174.71 ln l n ( 1 α ) T 2 = 26804 T + 25.08 222.866.25 × 1014
3 ln ( ln 1 1 α = 0.0663 θ 1.2822 272.55 ln l n ( 1 α ) T 2 = 41516 T + 45.98 345.181.16 × 1024
W41 ln ( ln 1 1 α = 0.036 θ 2.7017 147.99 ln l n ( 1 α ) T 2 = 5153.7 T 6.9419 42.841.50 × 106
2 ln ( ln 1 1 α = 0.0146 θ 2.3436 60.02 ln l n ( 1 α ) T 2 = 10399 T + 1.4298 86.461.24 × 104
3 ln ( ln 1 1 α = 0.035 θ 0.9313 143.88 ln l n ( 1 α ) T 2 = 32138 T + 33.239 267.212.47 × 1018
W51 ln ( ln 1 1 α = 0.0259 θ 2.1057 106.47 ln l n ( 1 α ) T 2 = 3174.7 T 9.6004 26.401.37 × 107
2 ln ( ln 1 1 α = 0.0139 θ 1.379 57.14 ln l n ( 1 α ) T 2 = 8477 T 0.6612 70.485.00 × 103
3 ln ( ln 1 1 α = 0.0313 θ 0.3835 128.67 ln l n ( 1 α ) T 2 = 30100 T + 24.342 212.092.67 × 1014
Table 4. Kinetic parameters obtained by Flynn–Wall–Ozawa and Kissinger–Akahira–Sunose methods.
Sample NameStages MechanismFlynn–Wall–Ozawa (FWO) Kissinger–Akahira–Sunose (KAS)
EquationEa/kJAEquationEa/kJA
PPO1 ln 1 ( 1 α ) 1 / 2 = 1357.23 T + 0.5694 10.731.38×105 ln 1 ( 1 α ) 1 / 2 T m 2 = 357.23 T 12.542 2.972.92 × 107
2 ln 1 ( 1 α ) 1 / 2 = 1299.20 T + 1.9797 10.275.66×105 ln 1 ( 1 α ) 1 / 2 T m 2 = 1299.2 T 11.131 10.807.14 × 106
3 ln 1 ( 1 α ) 1 / 2 = 7808.80 T + 17.1200 61.722.13×1012 ln 1 ( 1 α ) 1 / 2 T m 2 = 106490 T + 135.43 885.416.66 × 1060
W11 ln 1 ( 1 α ) 1 / 2 = 147.18 T + 0.3854 1.161.15×105 ln 1 ( 1 α ) 1 / 2 T m 2 = 147.18 T 13.497 1.227.63 × 107
2 ln 1 ( 1 α ) 1 / 2 = 2762.90 T + 3.6557 21.833.04×106 ln 1 ( 1 α ) 1 / 2 T m 2 = 3411.70 T 8.506 28.375.14 × 105
3 ln 1 ( 1 α ) 1 / 2 = 3306.80 T + 4.47 26.146.83×106 ln 1 ( 1 α ) 1 / 2 T m 2 = 4103.80 T 7.521 34.121.89 × 105
W21 ln 1 ( 1 α ) 1 / 2 = 385.40 T + 0.4659 3.056.83×106 ln 1 ( 1 α ) 1 / 2 T m 2 = 385.40 T 12.619 3.203.10 × 107
2 ln 1 ( 1 α ) 1 / 2 = 346.59 T + 0.403 2.741.17×105 ln 1 ( 1 α ) 1 / 2 T m 2 = 344.02 T 12.712 2.863.43 × 107
3 ln 1 ( 1 α ) 1 / 2 = 335.79 T + 0.3876 2.651.15×105 ln 1 ( 1 α ) 1 / 2 T m 2 = 338.00 T 12.72 2.813.43 × 107
W31 ln 1 ( 1 α ) 1 / 2 = 11.52 T 0.672 0.091.53×105 ln 1 ( 1 α ) 1 / 2 T m 2 = 19.32 T 13.770 0.161.03 × 108
2 ln 1 ( 1 α ) 1 / 2 = 167.40 T + 1.8677 13.235.07×105 ln 1 ( 1 α ) 1 / 2 T m 2 = 2745.00 T 9.671 22.821.71 × 106
3 ln 1 ( 1 α ) 1 / 2 = 6423.20 T + 8.6611 50.774.69×108 ln 1 ( 1 α ) 1 / 2 T m 2 = 6312.60 T 4.591 52.491.04 × 104
W41 ln 1 ( 1 α ) 1 / 2 = 59.38 T + 0.5747 0.471.39×105 ln 1 ( 1 α ) 1 / 2 T m 2 = 59.38 T 13.686 0.498.44 × 107
2 ln 1 ( 1 α ) 1 / 2 = 2011.40 T + 2.4262 15.908.88×105 ln 1 ( 1 α ) 1 / 2 T m 2 = 2801.30 T 9.526 23.291.40 × 106
3 ln 1 ( 1 α ) 1 / 2 = 3781.90 T + 5.098 29.891.28×107 ln 1 ( 1 α ) 1 / 2 T m 2 = 52237.20 T 6.057 43.544.67 × 104
W51 ln 1 ( 1 α ) 1 / 2 = 158.58 T 0.3758 1.251.14×105 ln 1 ( 1 α ) 1 / 2 T m 2 = 158.58 T 13487 1.327.63 × 107
2 ln 1 ( 1 α ) 1 / 2 = 2445.90 T + 3.1623 19.331.85×106 ln 1 ( 1 α ) 1 / 2 T m 2 = 3079.80 T 9.020 25.617.48 × 107
3 ln 1 ( 1 α ) 1 / 2 = 5338.30 T + 7.186 42.191.03×108 ln 1 ( 1 α ) 1 / 2 T m 2 = 4207.20 T 7.415 34.981.71 × 105
Table 5. Elemental characterization and activation energies of PPO and PP matrices contaminated with ZN catalysts. * Horowitz and Metzger method. ** Coats and Redfern method. *** Flynn–Wall–Ozawa. **** Kissinger–Akahira–Sunose.
Sample NameActivation EnergiesElemental Composition of Catalyst Residues
* Ea/kJ ** Ea/kJ *** Ea/kJ**** Ea/kJ Ti/ppmAl/ppmCl/ppmFe/ppm
PPO412.73250.2610.732.970.988.5313.374.13
173.48127.2410.2710.80
274.19241.5661.72885.41
W10.8227.091.161.220.98320.23201.0399.11
2.8859.6621.8328.37
70.3155.7426.1434.12
W265.3632.093.053.200.98171.1281.7151.34
155.3970.862.742.86
310.37289.652.652.81
W3224.45143.680.090.160.985.1558.757.03
174.71222.8613.2322.82
272.55345.1850.7752.49
W4147.9942.840.470.490.985.15105.2344.51
60.0286.4615.9023.29
143.88267.2129.8943.54
W5106.4726.41.251.320.98410.13205.33100.13
57.1470.4819.3325.61
128.67212.0942.1934.98
Table 6. Percentage groups of compounds in thermo-oxidative degradation.
CompoundsPP0Waste 1Waste 2Waste 3Waste 4Waste 5
Alkanes30.5215.5426.8932.3425.116.85
Alkenes67.6355.1549.8566.3249.3952.05
Alkynes0.933.882.840.794.293.75
Alcohols09.77.4408.5810.78
Ketones05.254.705.15.89
Acids05.293.9504.184.96
Permanent0.825.254.320.833.425.79
Disclaimer/Publisher’s Note: The statements, opinions and data contained in all publications are solely those of the individual author(s) and contributor(s) and not of MDPI and/or the editor(s). MDPI and/or the editor(s) disclaim responsibility for any injury to people or property resulting from any ideas, methods, instructions or products referred to in the content.

