Article

Evidence for a Giant Magneto-Electric Coupling in Bulk Composites with Coaxial Fibers of Nickel–Zinc Ferrite and PZT

by
Bingfeng Ge
1,2,
Jitao Zhang
1,
Sujoy Saha
2,
Sabita Acharya
2,
Chaitrali Kshirsagar
2,
Sidharth Menon
2,
Menka Jain
3,
Michael R. Page
4 and
Gopalan Srinivasan
2,*
1
College of Electrical and Information Engineering, Zhengzhou University of Light Industry, Zhengzhou 450002, China
2
Physics Department, Oakland University, Rochester, MI 48309, USA
3
Department of Physics, University of Connecticut, Storrs, CT 06269, USA
4
Materials and Manufacturing Directorate, Air Force Research Laboratory, Wright-Patterson Air Force Base, Dayton, OH 45433, USA
*
Author to whom correspondence should be addressed.
J. Compos. Sci. 2024, 8(8), 309; https://doi.org/10.3390/jcs8080309
Submission received: 26 June 2024 / Revised: 23 July 2024 / Accepted: 2 August 2024 / Published: 8 August 2024
(This article belongs to the Special Issue Discontinuous Fiber Composites, Volume III)

Abstract

:
This report is on magneto-electric (ME) interactions in bulk composites with coaxial fibers of nickel–zinc ferrite and PZT. The core–shell fibers of PZT and Ni1−xZnxFe2O4 (NZFO) with x = 0–0.5 were made by electrospinning. Both kinds of fibers, either with ferrite or PZT core and with diameters in the range of 1–3 μm were made. Electron and scanning probe microscopy images indicated well-formed fibers with uniform core and shell structures and defect-free interface. X-ray diffraction data for the fibers annealed at 700–900 °C did not show any impurity phases. Magnetization, magnetostriction, ferromagnetic resonance, and polarization P versus electric field E measurements confirmed the ferroic nature of the fibers. For ME measurements, the fibers were pressed into disks and rectangular platelets and then annealed at 900–1000 °C for densification. The strengths of strain-mediated ME coupling were measured by the H-induced changes in remnant polarization Pr and by low-frequency ME voltage coefficient (MEVC). The fractional change in Pr under H increased in magnitude, from +3% for disks of NFO–PZT to −82% for NZFO (x = 0.3)-PZT, and a further increase in x resulted in a decrease to a value of −3% for x = 0.5. The low-frequency MEVC measured in disks of the core–shell fibers ranged from 6 mV/cm Oe to 37 mV/cm Oe. The fractional changes in Pr and the MEVC values were an order of magnitude higher than for bulk samples containing mixed fibers with a random distribution of NZFO and PZT. The bulk composites with coaxial fibers have the potential for use as magnetic field sensors and in energy-harvesting applications.

1. Introduction

Ferromagnetic–ferroelectric composites have been studied extensively for an understanding of the nature of magneto-electric (ME) interactions between the two ferroic phases and for their potential for use in a variety of applications [1,2,3,4]. Most of the studies in the past on mechanical strain-mediated coupling were on composites with 3d-transition metals/alloys, rare earths, or ferrimagnetic oxides for the magnetic phase and PZT or PMN-PT for the ferroelectric phase and were aimed at achieving composites with strong ME coupling for use in sensors, energy harvesting, gyrators, and high-frequency devices [5,6,7,8,9,10]. A variety of thin films, thick films, bilayers, and multilayer composites were investigated [1,2,3,4,11,12]. Thin films and nanopillars on a substrate in particular are susceptible to clamping due to the substrate, resulting in a reduction in the strength of magnetostrictive or piezoelectric deformation in the films and the weakening of ME coupling strengths. Nanowires and core–shell composites that are free of such clamping are of importance in this regard [13,14,15]. In addition, a very high surface area to volume ratio in these structures is a key ingredient for achieving strong ME coupling.
Nanowires, nanotubes, and coaxial fibers can be prepared by a variety of techniques including template-assisted electro-deposition, chemical vapor deposition, and electrospinning [15,16,17]. These techniques were widely employed for the synthesis of magnetic materials [18,19], ferroelectrics [20,21], and core–shell ferroic composites [22,23,24,25]. The primary focus of this report is on the nature of ME interactions in ferromagnetic–ferroelectric bulk composites consisting of core–shell structures. Early reports on core–shell fibers were on cobalt-substituted nickel ferrite and barium titanate prepared by sol–gel and thermal decomposition processes [26,27], nickel ferrite-PZT nanowires prepared by template-assisted sol–gel-electro-deposition [28], and spinel ferrite-PZT fibers by electrospinning [13,29,30]. Xie et. al. utilized piezoresponse force microscopy (PFM) to measure the ME coupling in individual spinel ferrite-PZT fibers [29]. The PFM techniques were also used for the estimates of ME coupling in a core–shell fiber of nickel ferrite-PZT and PVDF-Fe3O4 and in several other nanocomposites. [14,31].
We previously reported on the synthesis of the coaxial fibers of spinel ferrites or hexagonal M-, Y-, and W-type ferrites and ferroelectrics by electrospinning [25,31,32]. The core–shell structure was confirmed by electron microscopy and scanning microwave microscopy (SMM). The strength of direct ME effects (the influence of magnetic field H on ferroelectric order parameters) and converse ME effects (the influence of electric field E on magnetic parameters) were measured by low-frequency ME voltage coefficient (MEVC), H-induced variations in the ferroelectric remnant polarization Pr, magneto-dielectric effects, and E-induced variations in the ferromagnetic resonance (FMR) frequency or field. Evidence for strong ME interactions was inferred from measurements on individual fibers and on 2D and 3D films of the fibers assembled in a magnetic field.
Here, we report on a giant H-induced variation in Pr in a bulk composite with ferrite–ferroelectric core–shell fibers. There have been very few studies so far on such composites. Heinrichs et al. recently reported on the in situ synthesis of a bulk composite with cobalt ferrite (CFO) cores and shells of a lead-free ferroelectric [33]. They inferred strong ME effects from piezo-force microscopy and reported evidence for ferroelectric polarization in the ferrimagnetic CFO cores. In this work, the bulk composites of NZFO-PZT were prepared using core–shell fibers synthesized by electrospinning. The measurements of ME coupling by P vs. E under H on disks of the composites revealed variations in Pr as high as −82%. Low-frequency MEVC data were also indicative of strong ME interactions in the system. The ME coupling strengths were found to be much stronger than in the bulk composite made of mixed fibers with a random distribution of NZFO and PZT. Details on the synthesis of the fibers and structural, magnetic, ferroelectric, and ME characterization are provided in the sections that follow.

2. Experiment

The procedure employed for the synthesis of the fibers was the same as the ones described in detail in our previous reports [32,34]. Briefly, the synthesis was carried out in three steps: the preparation of individual sol–gels of PbZr0.52Ti0.48O3 (PZT) and Ni1−x Znx Fe2O4 (x = 0–0.5), dispensing of the sols in syringes with a syringe pump through a metallic coaxial needle, and collection of fibers formed in the presence of a strong electric field on a rotating aluminum drum. First, we have prepared the PZT and ferrite sols. For PZT sol, an appropriate stoichiometric amount of lead(III) acetate trihydrate, Pb(CH3CO2)2, 3H2O (Alfa Aesar, Haverhill, MA, USA; 99%), was refluxed in 4 mL of 2-methoxyethanol for 1 h at 70 °C. Then, stoichiometric amounts of zirconium(IV) n-propoxide, Zr[O(CH2)2CH3]4, (Alfa Aesar), and titanium(IV) isopropoxide Ti[OCH(CH3)2]4 (Alfa Aesar) were mixed with 4 mL of 2-methoxyethanol and 0.2 g of acetic acid with constant stirring. Zr/Ti precursor solution was then added to the Pb precursor solution drop by drop with vigorous mixing and refluxed for 3 h at 80 °C. Then, 0.5 mL of distilled water was added and then refluxed for 6 h at 80 °C. Finally, 1.2 g of poly(vinylpyrrolidone) (PVP, MW~1,300,000) dissolved in a mixture of 9 mL of methanol and 3 mL of ethanol was added to the PZT precursor solution. The PZT precursor solution was obtained after mixing the solution for 20 h. For NZFO sol with the nominal composition Ni1−xZnxFe2O4, (NZFO hereon), we started with 1.2 g of poly(vinylpyrrolidone) (PVP, MW~1,300,000), and dissolved it in a mixture of ethanol (13 mL) and distilled water (7 mL) followed by magnetic stirring for 1 h to ensure the complete dissolution of PVP with no solid precipitated at the bottom. Then, appropriate amounts of nickel(II) acetate tetrahydrate, Ni(CH3COO)2, 4H2O, (Alfa Aesar, 98%); iron(III) nitrate nonahydrate, (Fe(NO3)3, 9H2O) (Alfa Aesar, 98%); and zinc(II) nitrate hexahydrate, Zn(NO3)2, 6H2O, (Alfa Aesar, 98%) were added to the solution containing PVP and further stirred for 20 h at room temperature to form a homogeneous viscous solution with a PVP concentration of 6 wt. % for electrospinning.
The setup for the electrospinning procedure comprised two syringes for the sols and a syringe pump (NE-4000, New Era Pump Systems Inc., Farmingdale, NY, USA) that delivered the solution at a controlled rate (0.3 mL/h) through a coaxial SS needle (Ramé-hart Instrument Co., Succasunna, NJ, USA) with the inner diameters of 400 μm and 1050 μm for the core and shell materials, respectively. A high-voltage power supply (PS375/20 kV, Stanford Research Systems, Sunnyvale, CA, USA) was used to apply a DC voltage of 15–20 kV between the needle and a rotating aluminum drum that was used to collect the fibers. The distance between the needle and the drum was kept at 10–15 cm. Humidity in the electrospinning chamber was maintained in the range of 30–40%.
Fiber synthesis was carried out in an enclosed, humidity-controlled chamber. For core–shell fibers, the PZT and NZFO sols were loaded onto two separate syringes and mounted in a syringe pump capable of dispensing the sols at a set rate through a coaxial stainless-steel needle. The fibers were formed under an electric field E = 1.5–2.0 kV/cm present in the region between the needle and a rotating aluminum drum that served as the collector. The fiber parameters such as the diameter of the core and shell thickness were dependent on the needle’s inner and outer diameters, sol viscosity, sol pumping rate, electric field E, and chamber humidity. For mixed fibers with a random distribution of NZFO and PZT, equal volumes of the two sols were mixed together and stirred for several hours to obtain a uniform solution. The fibers were then made by dispensing the sol through a single chamber SS needle. The fibers were dried at 40 °C for 24 h and annealed for 1 h at a temperature of 700–900 °C in air under a heating and cooling rate of 1 °C/min. For magnetic, ferroelectric, and ME measurements on bulk composites, the fibers were pressed into disks and rectangular platelets and annealed at 900–1000 °C.
Structural measurements were carried out on the annealed fibers. Phase formation and crystallographic characteristics were analyzed using an X-ray diffractometer (XRD) (Rigaku, Tokyo, Japan). Scanning probe microscope (SPM) (XE 100E, Park Systems, Santa Clara, CA, USA) with magnetic force microscopy option was employed to visualize the fiber structure and morphology. We also used scanning microwave microscopy (SMM) (Agilent) to analyze the fiber structures. A scanning electron microscope (SEM) (JEOL) was used to analyze the distribution of the fibers in annealed conditions. Ferromagnetic characterization involved measuring the magnetization with a Faraday balance and analyzing FMR with the use of a coplanar waveguide and vector network analyzers (VNAs). Ferroelectric polarization vs. electric field E was measured with a ferroelectric tester (Radiant Technologies, Albuquerque, NM, USA). The strengths of direct ME effects were measured through (i) changes in remnant polarization (Pr) caused by a static magnetic field H using an electromagnet coupled with the ferroelectric tester and (ii) low-frequency ME voltage coefficient using an in-house assembled setup.

3. Results

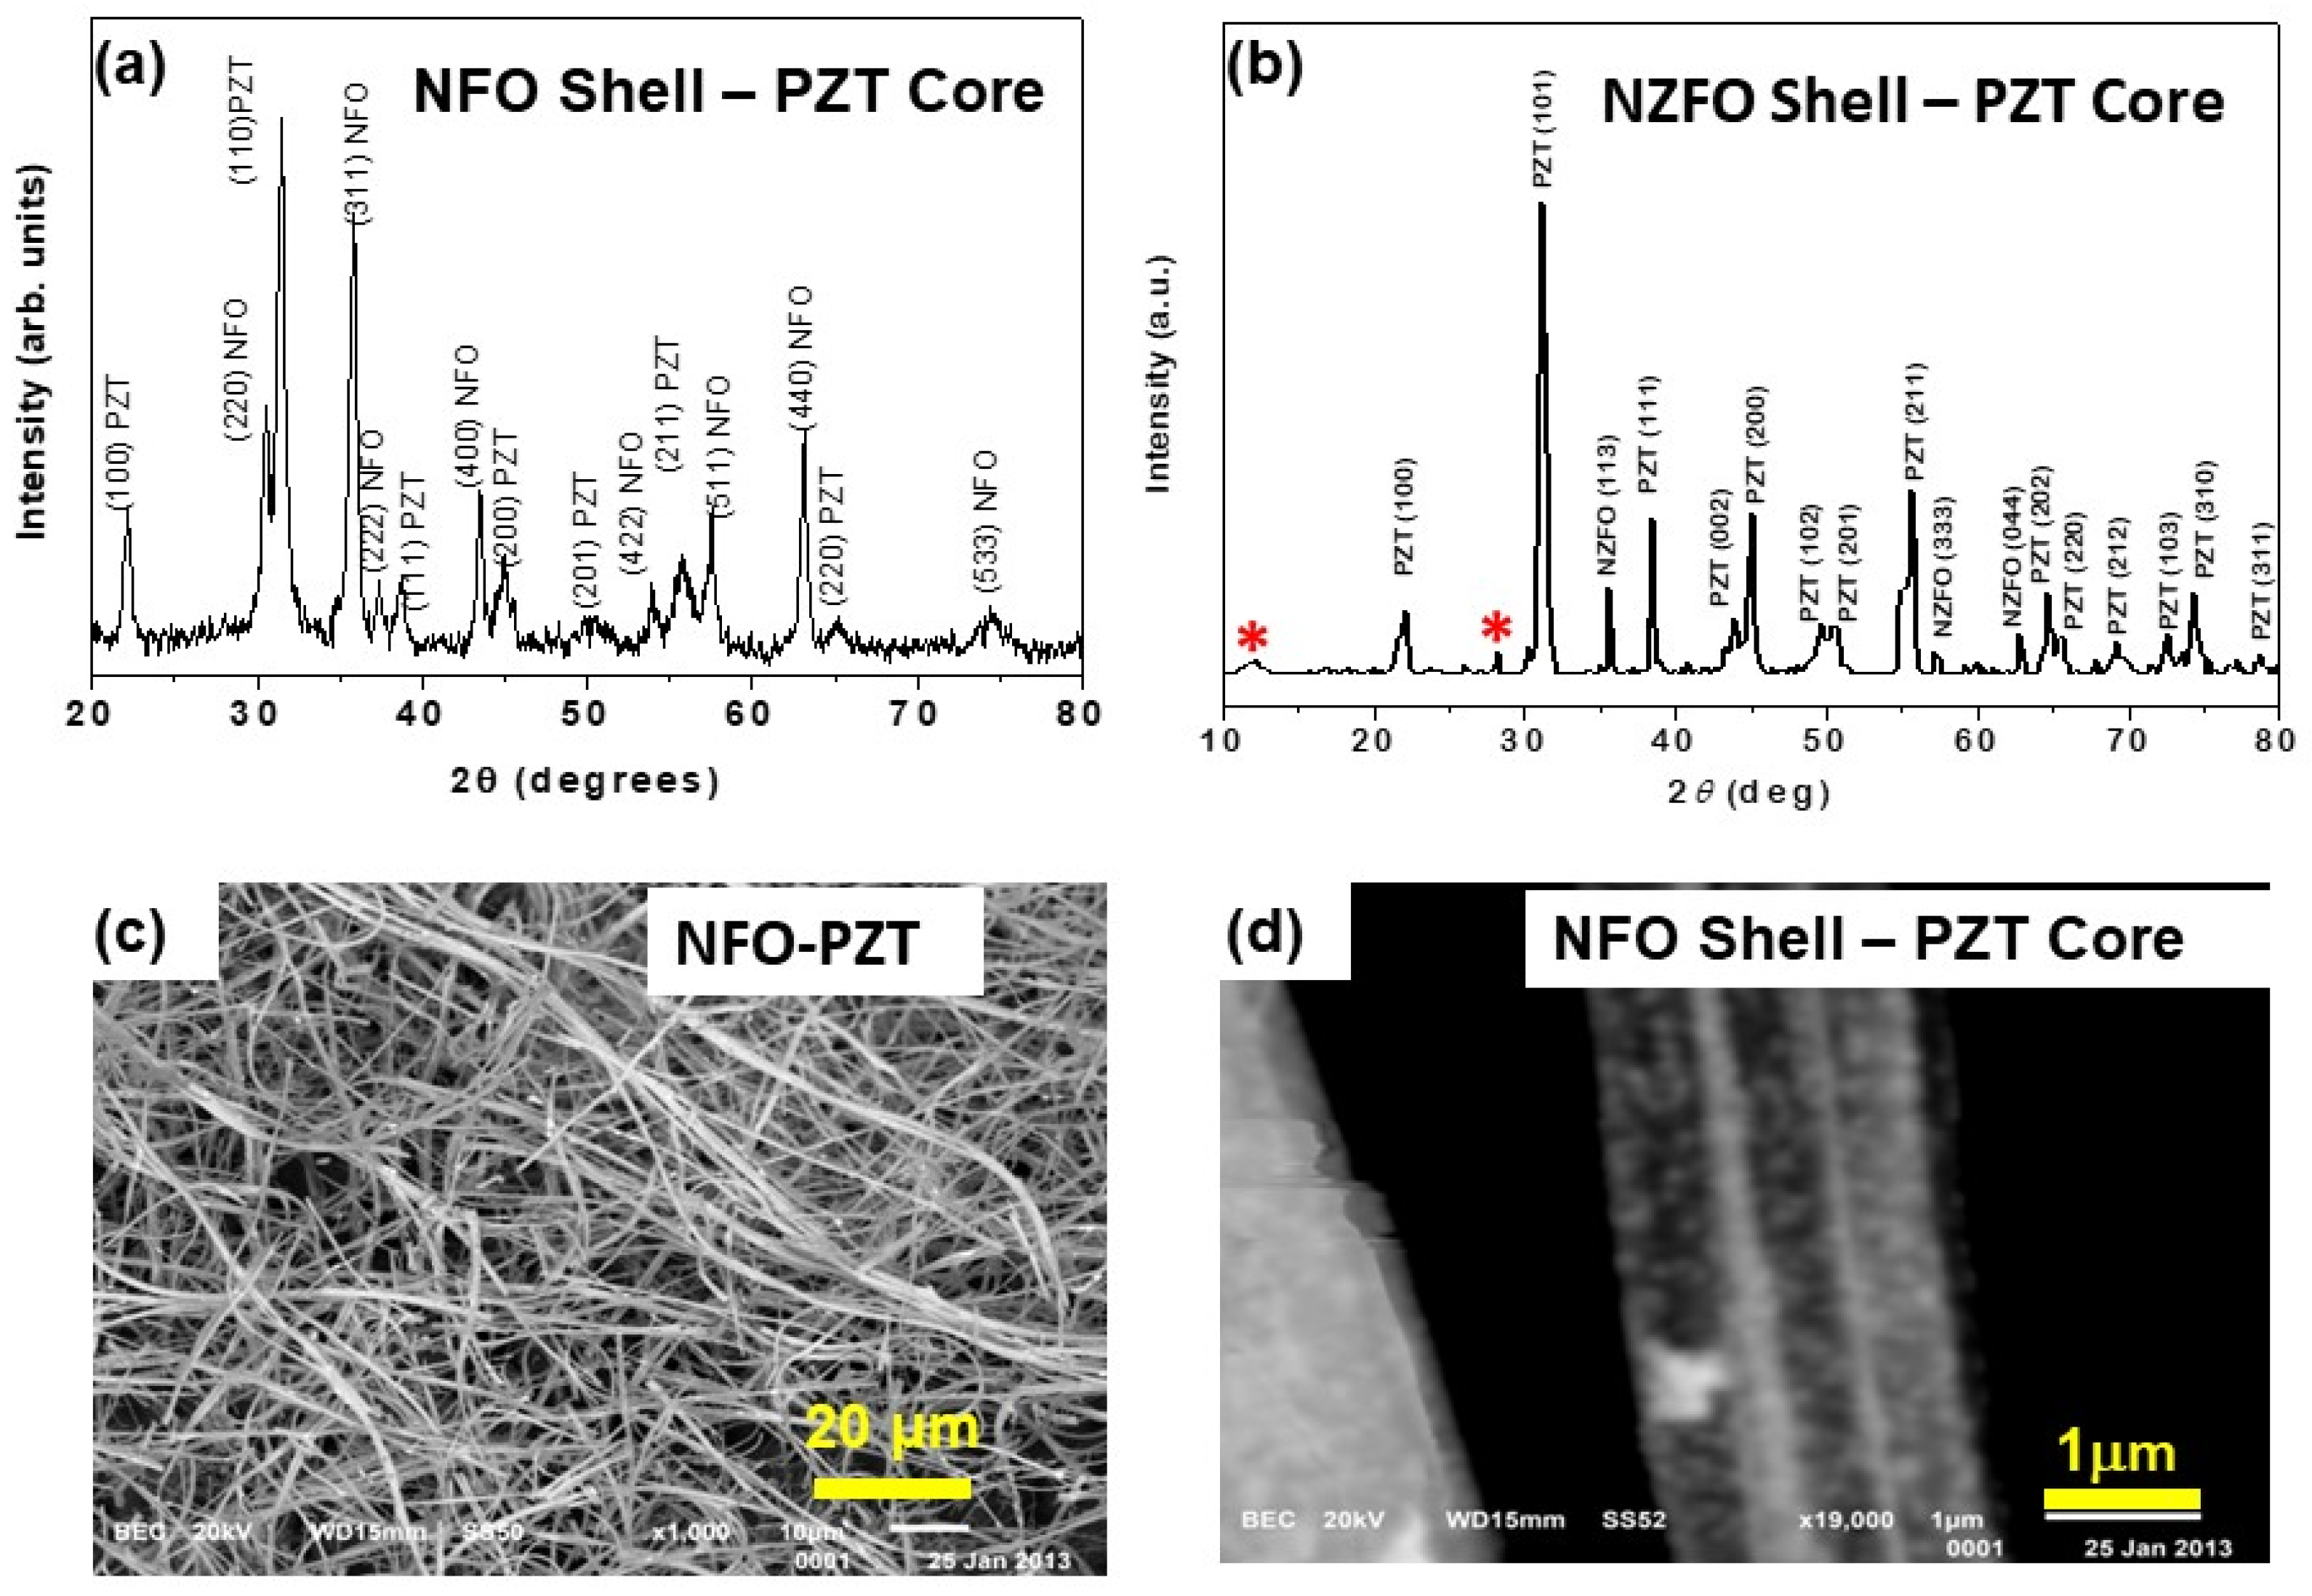
3.1. Structural Measurements

The results of the structural measurements with XRD and SEM for the representative core–shell fibers are shown in Figure 1 (also in Supplementary Figures S1–S4). The XRD patterns in Figure 1a,b for the annealed fibers of NZFO with x = 0 and 0.3 and PZT show diffraction peaks corresponding to the ferrite and PZT and are labeled in the figures. In Figure 1a, we have indexed the peaks to tetragonal PZT (PDF#00-033-0784, space group#99) and cubic NFO (PDF#00-044-1485, space group#227). In Figure 1b, we have indexed the peaks to tetragonal PZT (PDF#00-033-0784, space group#99) and cubic NZFO (PDF#00-008-0234, space group#227). There was no indication of the presence of impurity phases in the data for all the samples except for a very small amount of ZrO2 (PDF#01-074-0815) and Fe0.93Ni0.06 (PDF#00-044-1088) impurities seen in the XRD pattern of Figure 1b for NZFO (x = 0.3)-PZT. Here, for the NFO shell–PZT core fibers the XRD peaks are broader due to the smaller dimensions of the fibers as compared to the NZFO shell–PZT core fibers. The SEM image for a collection of fibers is shown in Figure 1c. Fibers with diameters ranging from 250 nm to 3 μm and of various lengths are seen. The measurements revealed that 60% of the fibers had diameters over a narrow 500 to 1500 nm range but were free of any defects such as bubbles or discontinuities. In our synthesis process, the fibers were collected on a rotating drum and no attempt was made to synthesize oriented fibers. This is indeed seen in the SEM image that shows a collection of fibers rather than fibers with specific orientations. The SEM image of an isolated fiber is shown in Figure 1d. It is also evident from the image in Figure 1d that a uniform core and shell structure with a well-defined interface is present in the fibers.
Scanning probe microscopy was utilized to examine the annealed fibers. Most of our fibers were tens of microns in length. In Figure 2, we showed AFM, MFM, and SMM images only for a portion of the fiber. The objective was to show the fiber shape and uniformity across its length. The AFM topography image in Figure 2a reveals a well-formed uniform, defect-free fiber. The core–shell structure with PZT core and NFO shell is seen in the magnetic force microscopy (MFM) image in Figure 2b. Both the core diameter and the shell thickness are uniform throughout the length of the fiber. The capacitance image at 10 GHz in Figure 2c acquired with an SMM also shows the desired core and shell structure for the fiber. Similar scanning probe microscopy images were seen for the NZFO (x = 0.1–0.5)-PZT fibers. As we can see in the MFM image in Figure 2b and the SMM image in Figure 2c, there are distinct discontinuities in the contrast at the core–shell interface along the entire length of the fiber and it is indicative of the absence of impurities or any diffusion across the phase boundary.

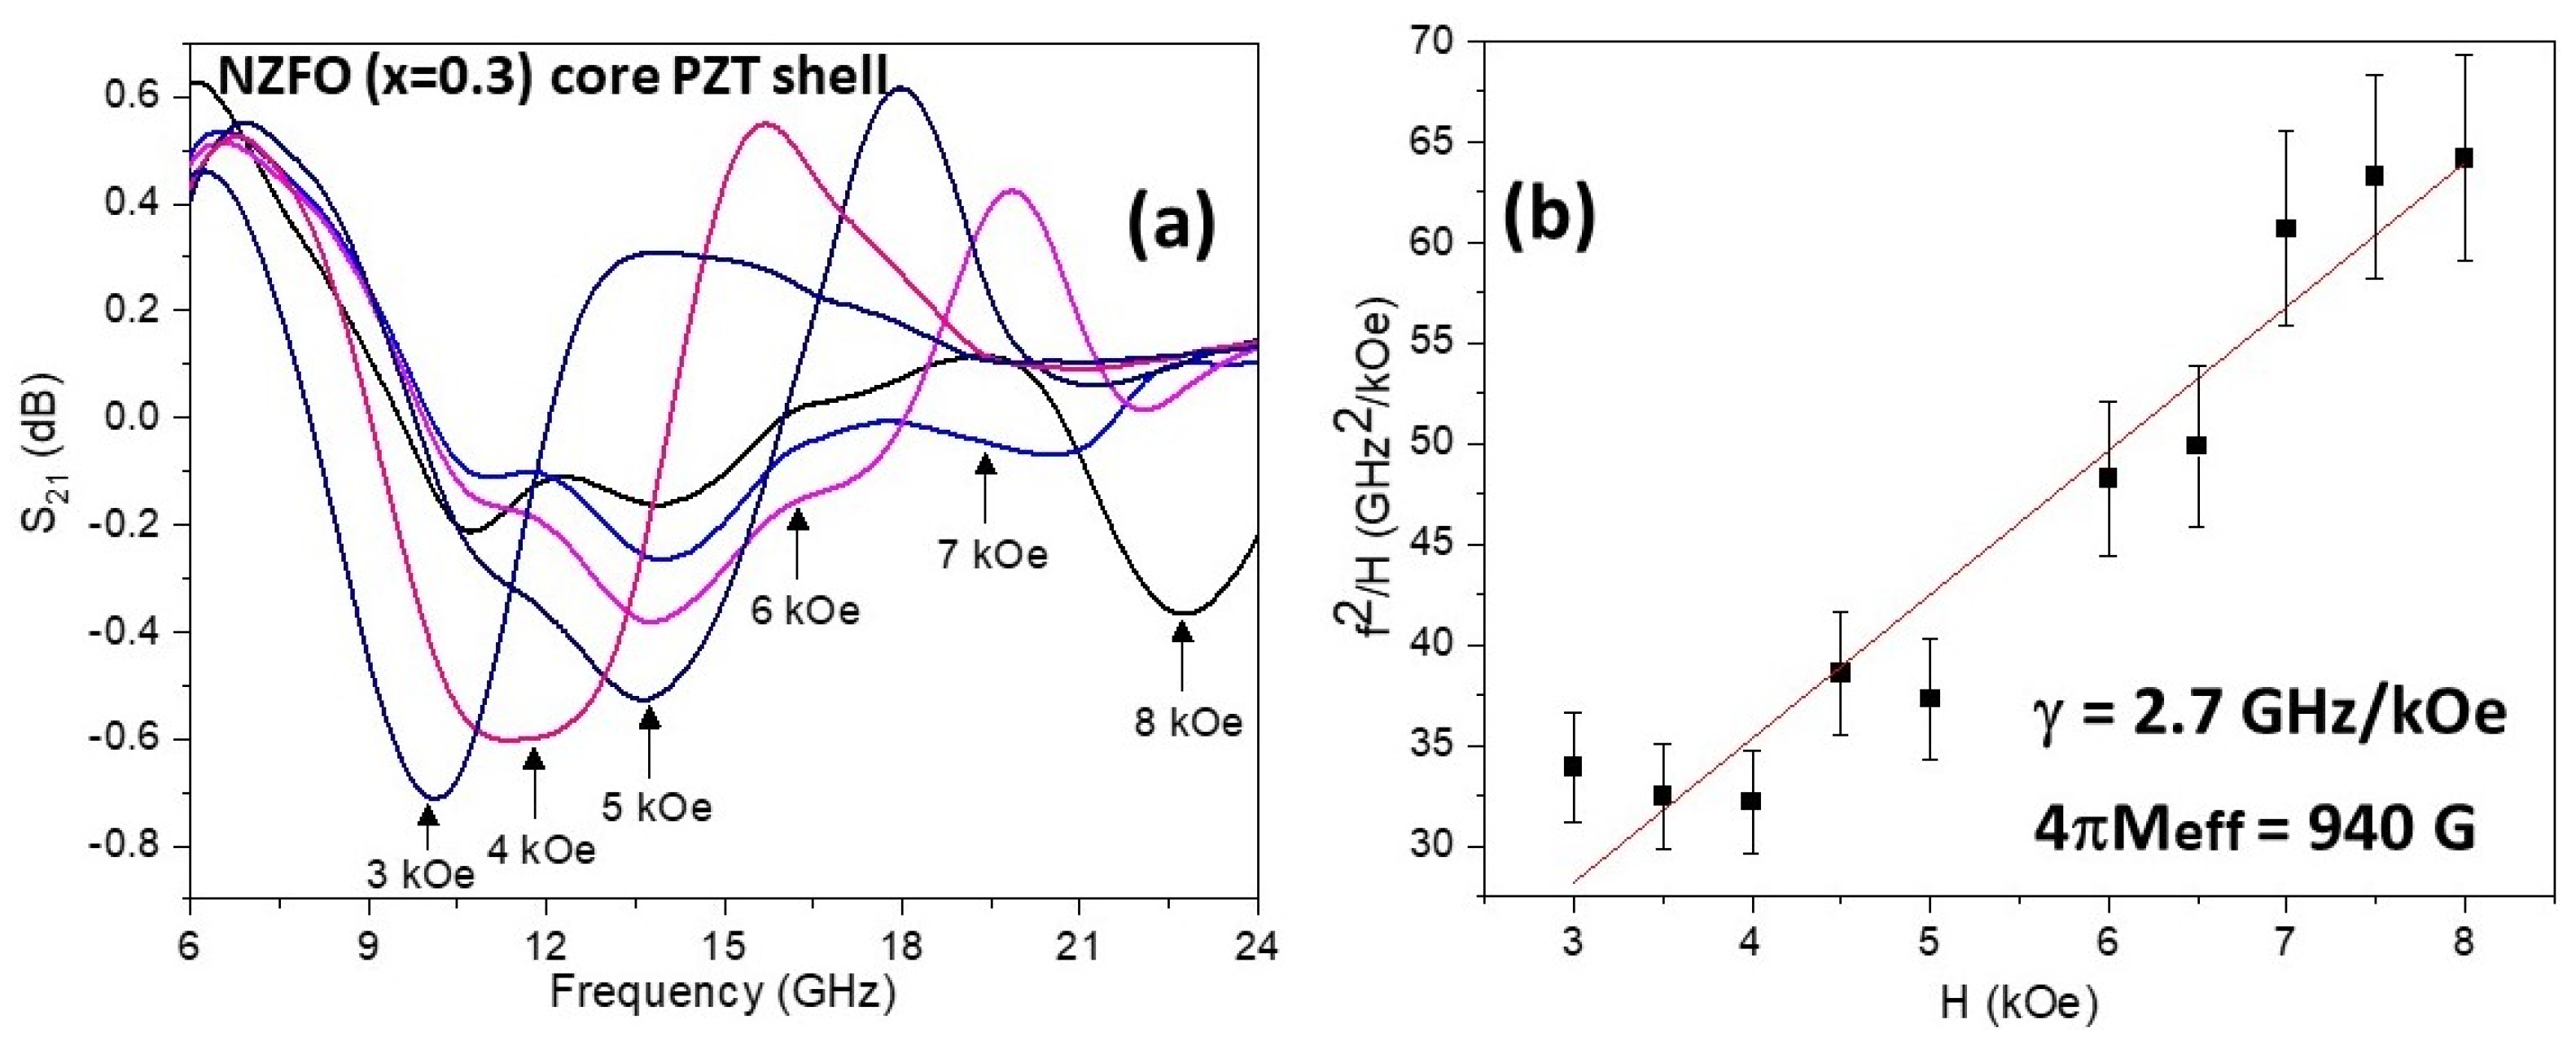
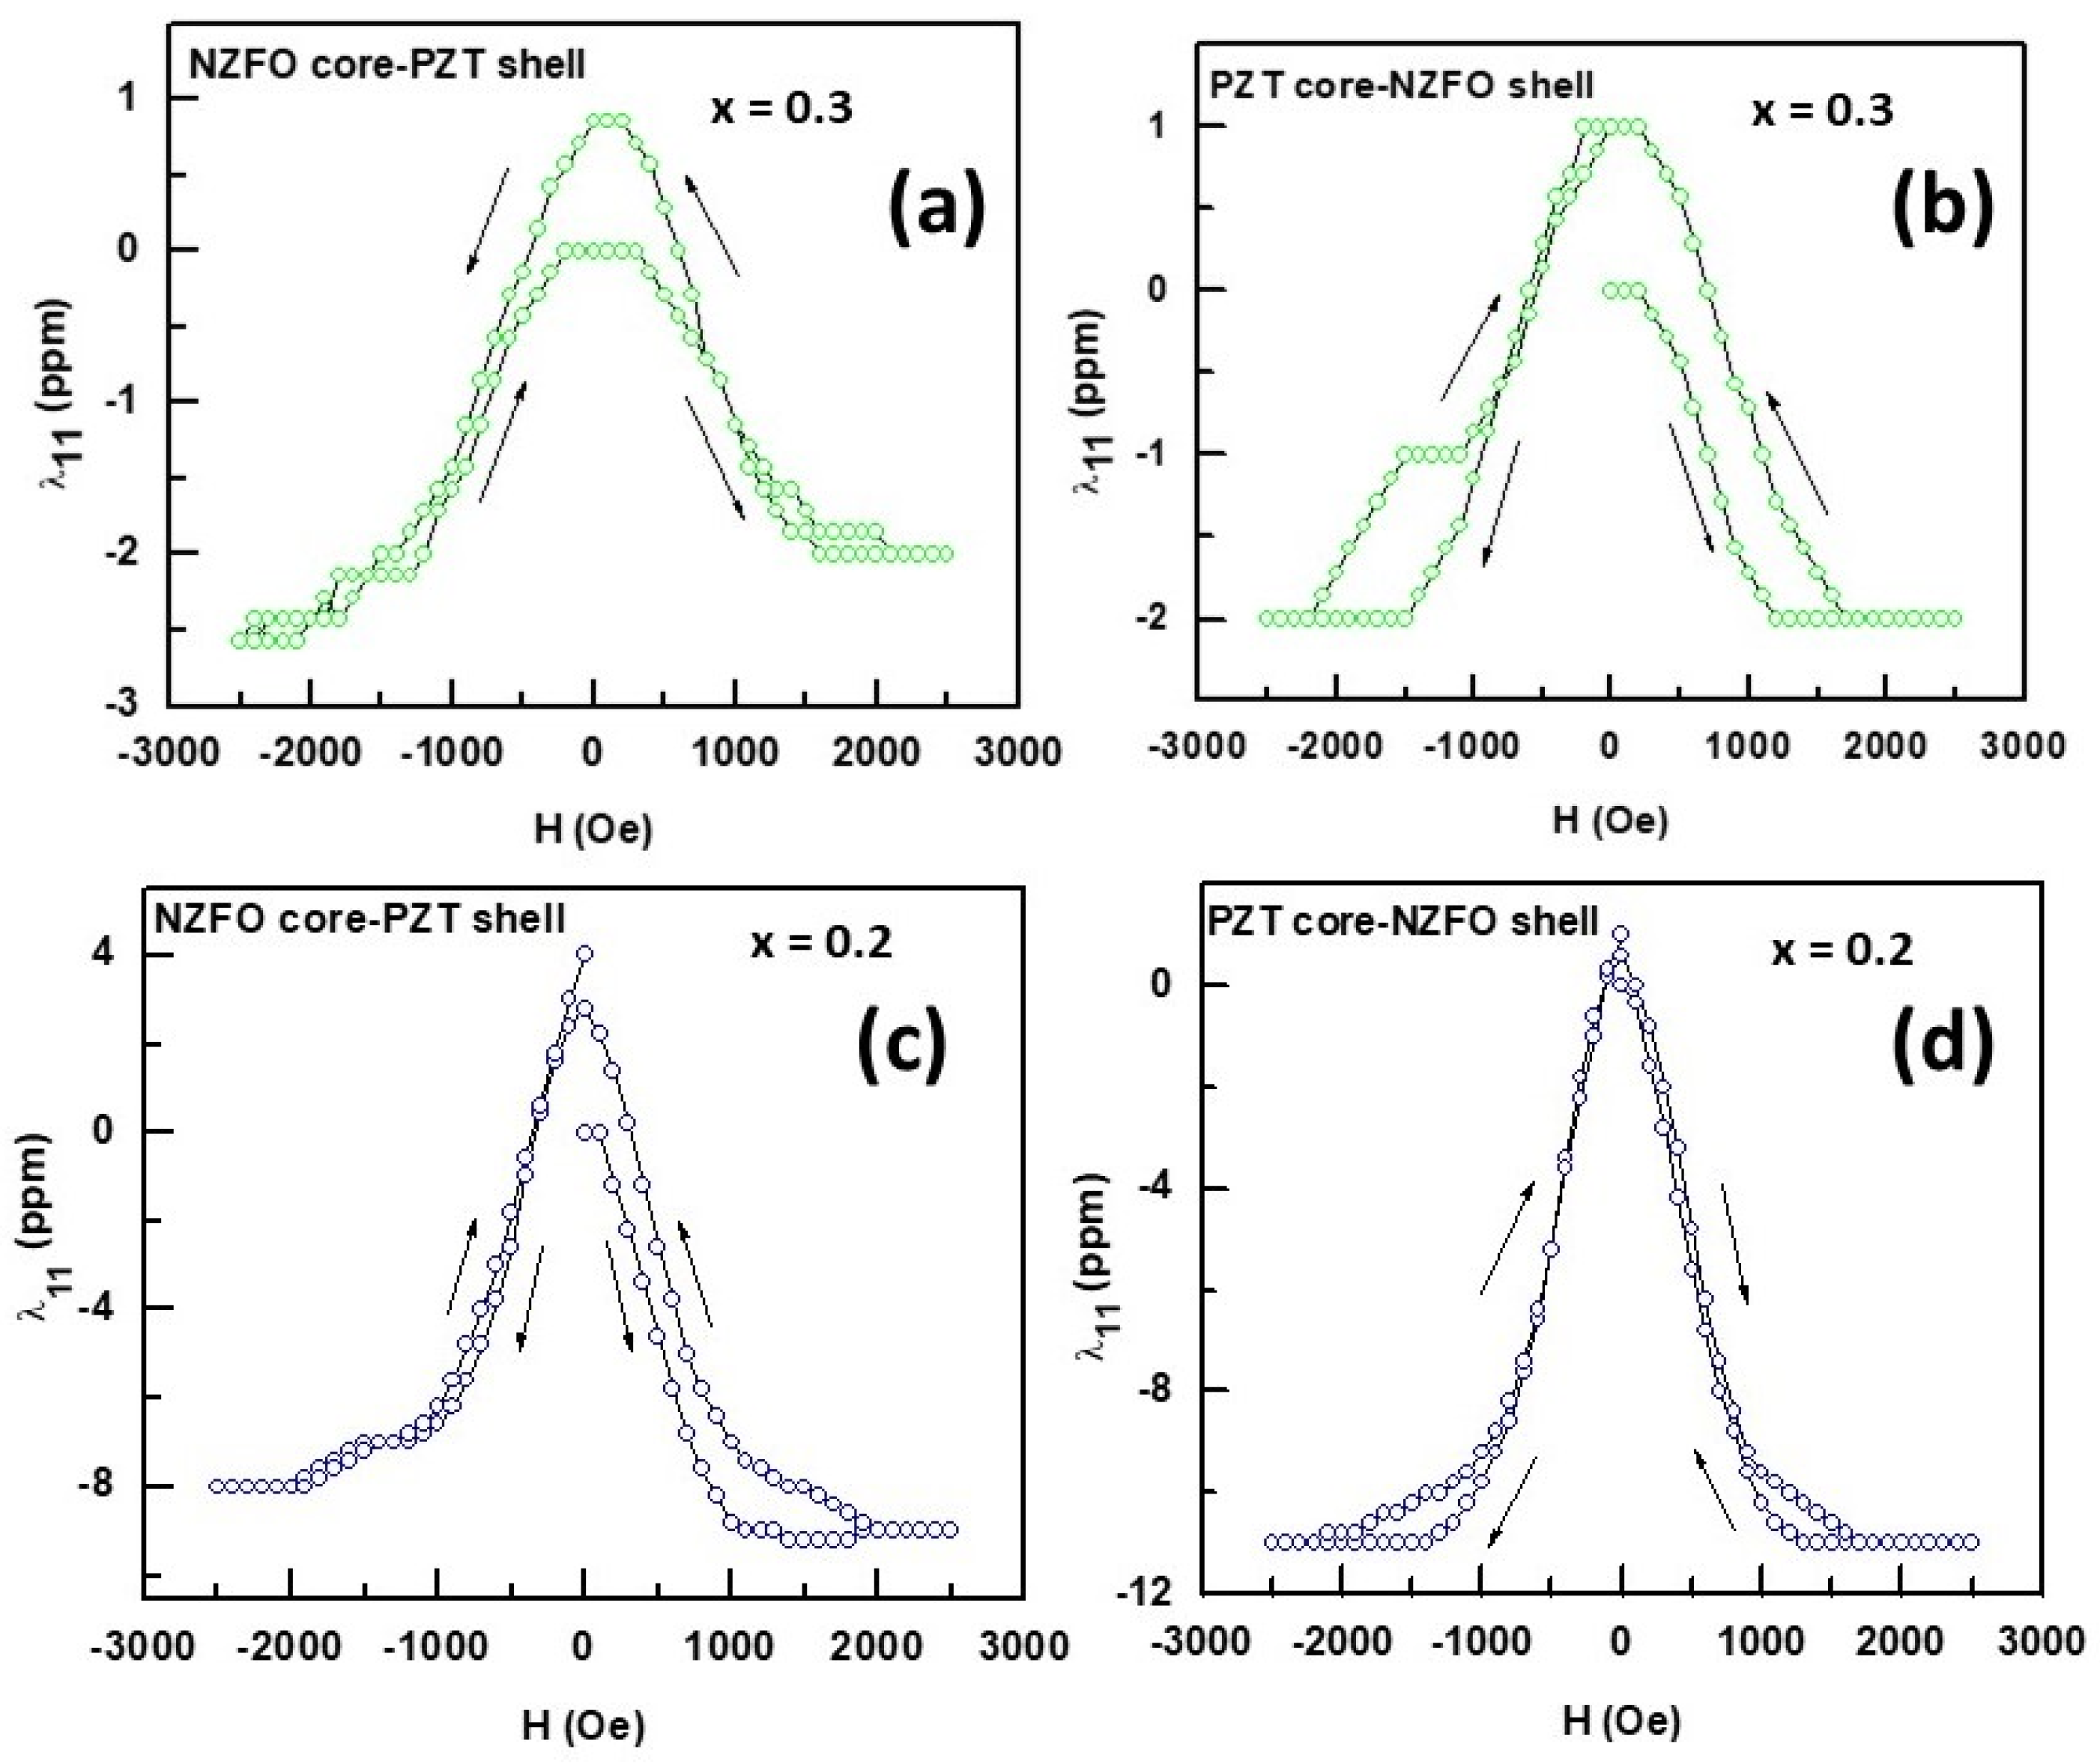
3.2. Magnetic Characterization

For characterization in terms of magnetization, FMR, and magnetostriction, the fibers were pressed into thin platelets or circular disks and annealed at 1000 °C. The samples with the fibers of both ferrite cores as well as PZT cores were made for these measurements. A Faraday balance was used to measure the magnetization M as a function of static magnetic field H. Data on M vs. H are shown in Figure 3 for representative samples with ferrite core and PZT shell. Similar magnetization data for the fibers with PZT cores and for all the other fibers studied are shown in Supplementary Figures S5 and S6. A typical M vs. H expected for a ferromagnet is seen in the figures. Data for NFO-PZT in Figure 3a do not show the saturation of the magnetization up to the maximum field of 3 kOe. For some of the fibers, the saturation of M occurs for H > 2 kOe. The saturation magnetization M0 values for the fibers (from Figure 3, Figures S5 and S6) vary from 5 emu/g to 24 emu/g and are smaller than the reported values of 50 emu/g for x = 0 to 80 emu/g for x = 0.5 for bulk polycrystalline NiZn ferrites [35]. A comparison of the M0 values for the NIZn ferrite-PZT fibers with the reported values for polycrystalline ferrites is complicated by the fact that there is a significant variation in the NZFO content among the fibers with a specific Zn substitution as well as in the fibers with different Zn substitutions.
Ferromagnetic resonance was performed on the NZFO-PZT fibers pressed into a thin rectangular platelet and annealed at 1000 °C. The sample was placed on top of a coplanar waveguide. With a static magnetic field H applied parallel to the sample plane, a VNA was used for excitation with the microwave power and to record the amplitude of the scattering matrix S21 as a function of the frequency f of the microwave power. Figure 4 and Figure 5 show the profiles of S21 vs. f for a series of H values for the samples of NZFO core–PZT shell for x = 0.2 and 0.3, respectively. FMR is seen as the absorption of microwave power in the profiles and the power absorbed increases with an increase in H and is accompanied by the narrowing of the absorption peaks. The half-power frequency widths of the resonances are on the order of 5–8 GHz that are very high as expected for the fibers of NZFO.
Similar characteristics are also observed in the FMR profiles for NZFO-PZT that are shown in the Supplementary Materials (Figures S7–S9). One can determine the gyromagnetic ratio γ and the effective magnetization 4πMeff = 4πM0 + Ha, where Ha is the anisotropy field, by fitting the resonance frequency fr versus H data (obtained from the profiles as in Figure 4 and Figure 5) to the Kittle equation,
(fr/γ)2 = H (H + 4πMeff).
The gyromagnetic ratio γ values for the fibers are in the range from 2.54 GHz/kOe to 3.13 GHz/kOe and are comparable to 3.0 to 3.2 GHz/kOe reported for polycrystalline nickel–zinc ferrites [35,36,37]. The values of 4πMeff for the fiber samples vary from a minimum of 250 G for x = 0 to a maximum of 3.07 kG for x = 0.2. We did not estimate Ha from 4πMeff and the measured values of Mo due to the fact that the powder samples of the fibers used for magnetization measurements could have significantly different ferrite contents than the platelet used for FMR.
Magnetostriction is a key parameter that determines the strength of ME coupling in NZFO-PZT composites and was measured in the platelets of the fiber samples. A strain gage, bonded to the sample surface with a thin 2-part epoxy (M-bond 600, Micro Measurements, Wendell, NC, USA), and a strain indicator were used for the measurements of magnetostriction λ11 parallel to the sample length and to the applied static magnetic field H. Figure 6 shows λ11 vs. H data for the samples of NZFO (x = 0.5)-PZT and NZFO (x = 0.4) and for the fibers with both ferrite cores as well as PZT cores. The magnetostriction for NZFO (x = 0.5)-PZT with a ferrite core is negative, as is the case for bulk polycrystalline samples, and increases in magnitude with increasing H [38]. When H is decreased back to zero, a hysteresis in λ11 is evident. When H is reversed, λ11 is negative and its overall field dependence stays the same as for H > 0. For the composite of x = 0.5 with a PZT core, however, λ11 is positive with its magnitude increasing with H to 11 ppm for H = 2.5 kOe. When H is decreased back to zero, λ11 continues to increase to a maximum of 13 ppm for H = 1 kOe and then decreases to a remnant value of 10 ppm. Upon the reversal of the direction of H, λ11 continues to decrease to 5 ppm for H = −2.5 kOe. For the fibers with x = 0.4 and a NZFO core, the magnetostriction is negative with a maximum value of −5 ppm, and its H-dependence is the same as for the fibers with x = 0.5. For the fibers of x = 0.5 with PZT cores, λ11 is negative and increases in magnitude 3 ppm for H = 2.5 kOe. When H is decreased to zero, λ11 decreases to zero for H~1 kOe, and shows a sign reversal and a peak value of 5 ppm for H~0. Upon the reversal of the direction of H, λ11 decreases to zero as H is increased to −2.5 kOe.
Similar λ11 vs. H data for NZFO-PZT with x = 0.3 and 0.2 are shown in Figure 7. The key features of the results are as follows: (i) The samples with x = 0.3 show a hysteresis in λ11 vs. H data with a maximum value of around −2 ppm and a sign reversal to a peak value of 1 ppm. (ii) The fibers with x = 0.2 shows the maximum value of λ11 = −8 ppm for the fibers with ferrite cores and −11 ppm for the fiber samples with PZT cores. The results in Figure 6 and Figure 7 also indicate an overall increase in the maximum value of λ11 with decreasing Zn content in NZFO. Finally, the magnetostriction data for x = 0.1 (shown in the Supplementary Figure S10) show similar hysteresis in its H-dependence and a variation in the peak values of from −6 ppm to +6 ppm for the sample with the ferrite core whereas the sample with a PZT core has a maximum magnetostriction of around 2 ppm.

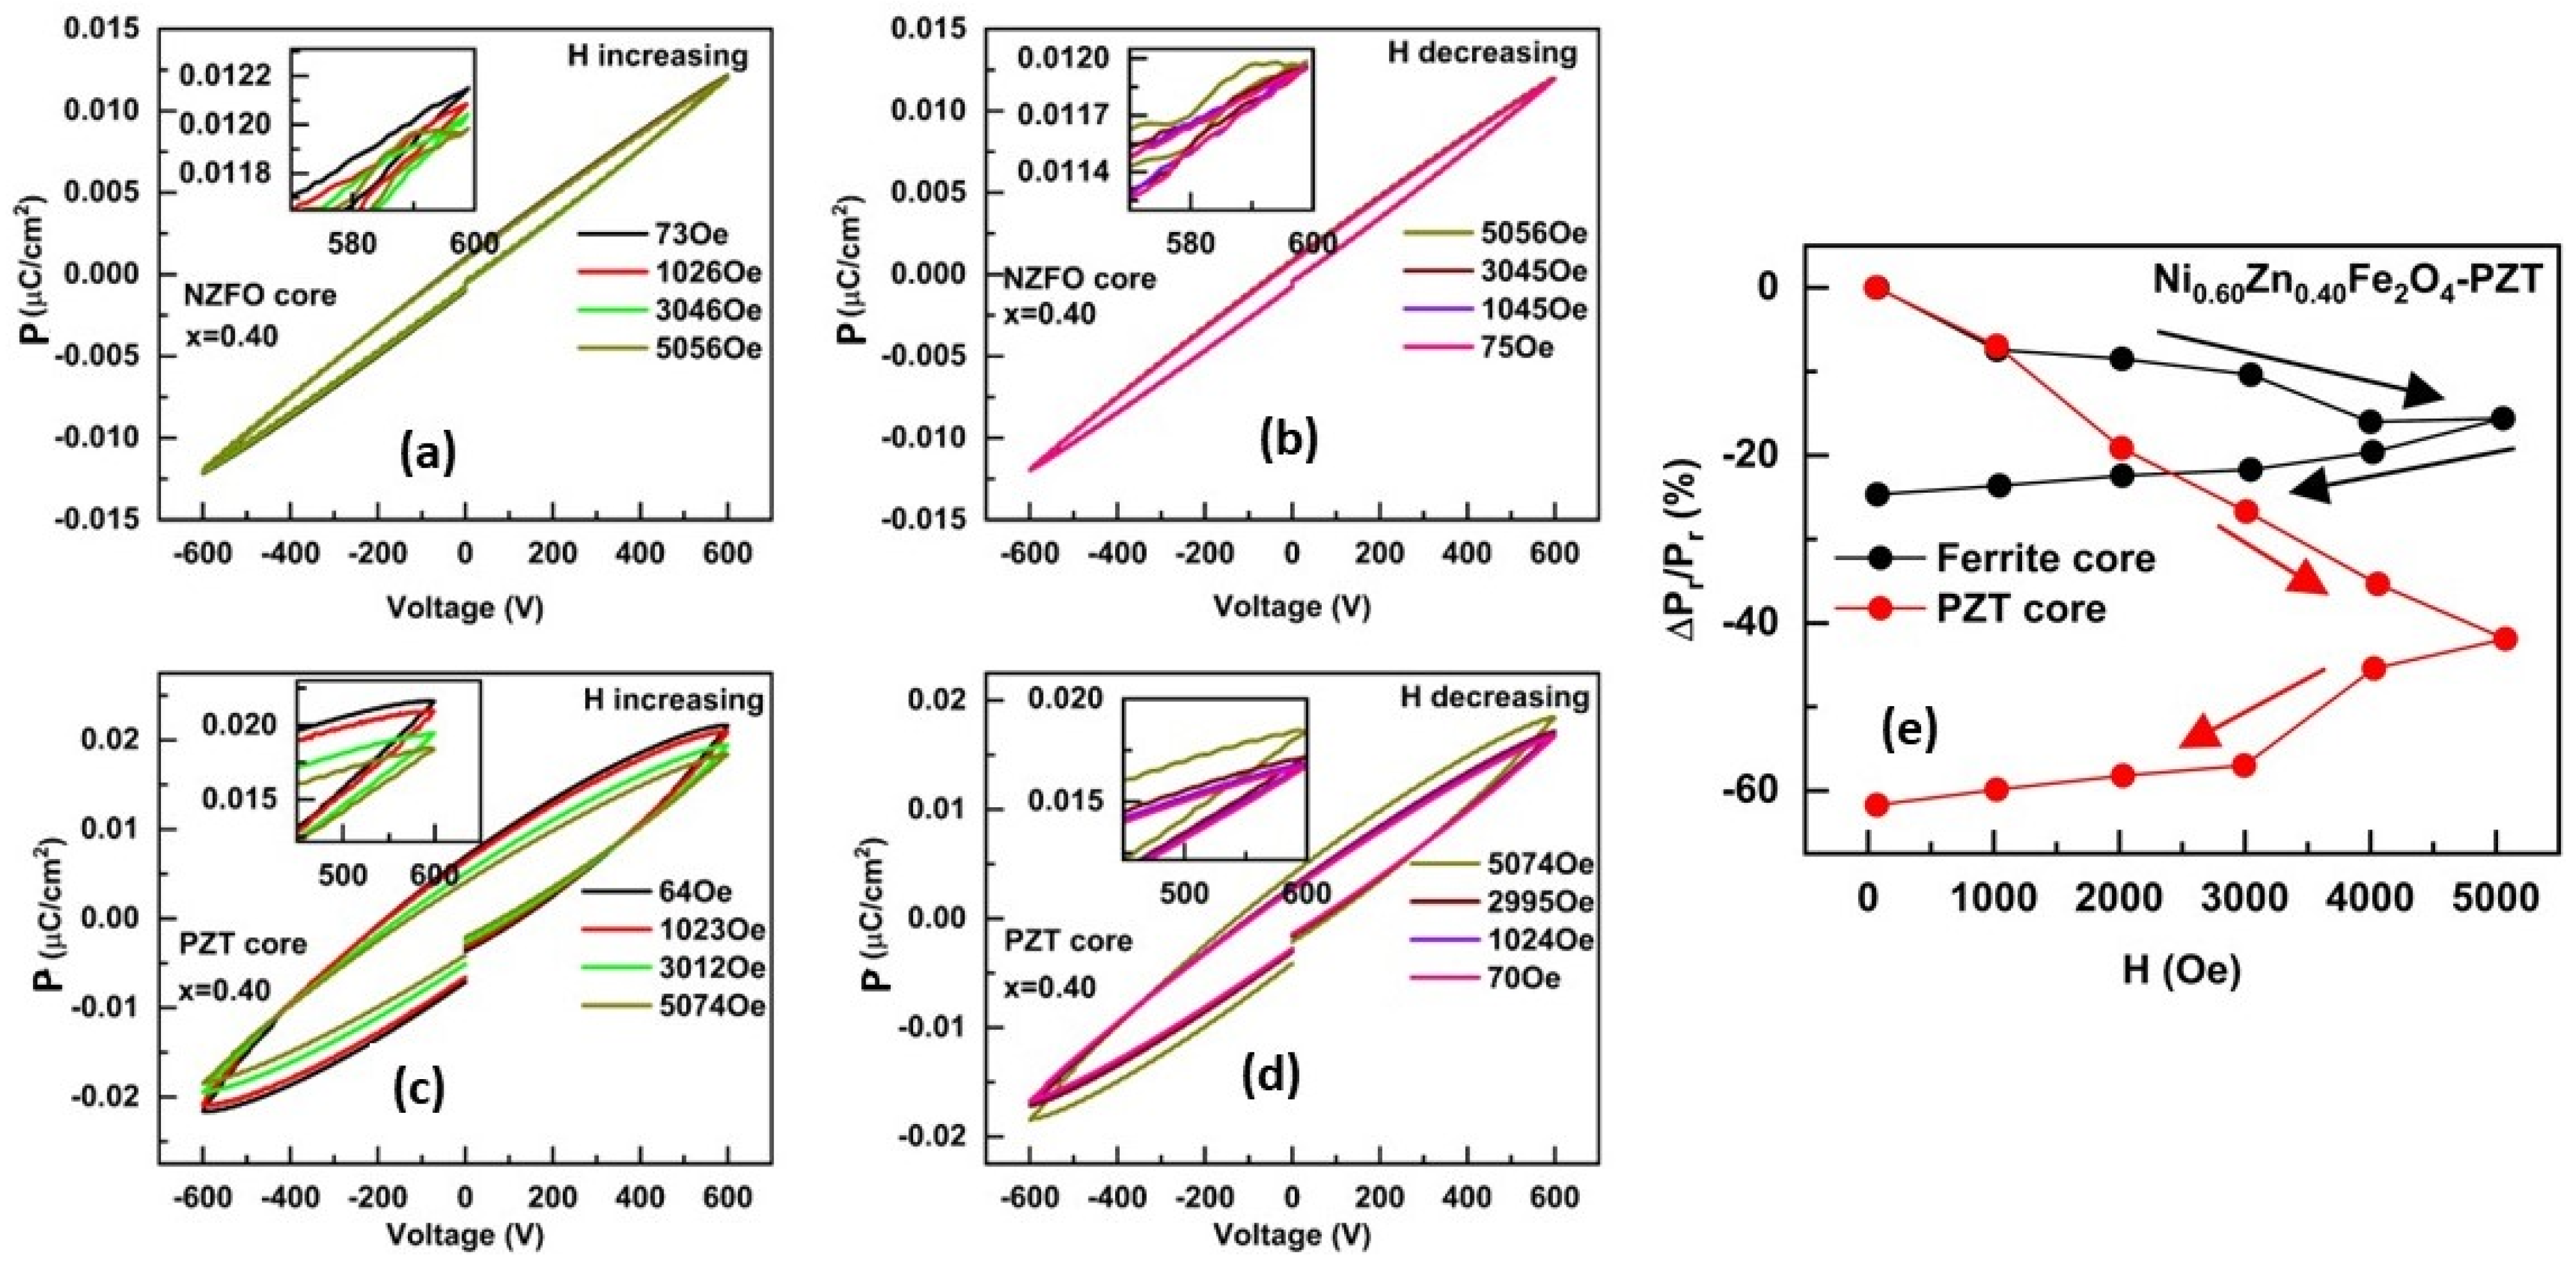
3.3. Ferroelectric and Magneto-Electric Characterization

Disks made of the core–shell fibers were used for studies on ferroelectric characterization by measuring the polarization P as a function of the applied static electric field E using a (Radiant Technologies) ferroelectric tester. The strength of direct ME interactions, i.e., the influence of H on ferroelectric order parameters, was determined by measuring the fractional change in the remnant polarization ∆Pr/Pr under H by measuring P vs. E as a function of H. Figure 8a–d show P vs. E for a series of H values for NZFO (x = 0.5) -PZT for the samples with both ferrite cores as well as PZT cores and for the increasing and decreasing magnitudes of ±H. Variation in P with E in Figure 8 is typical of ferroelectrics, but the p-values are rather small compared to the reported values for pure PZT nanofiber samples and thin films [20,21]. The maximum value of P in Figure 8 is 8 nC/cm2 for the samples containing ferrite or PZT cores. The low p-values could be attributed to anticipated large leakage currents since the samples are essentially bulk composites with low-resistivity ferrite cores or shells. Figure 8e shows the fractional H-induced variation ∆Pr/Pr with H determined from P vs. E data. A general decrease in Pr with H is evident from the data except for ∆Pr/Pr = +2.5% at H = 2 kOe for the sample with a ferrite core.
Measurements on the disks of the fibers with NZFO (x = 0.4)-PZT and NZFO (x = 0.3)-PZT show evidence for a giant H-induced variation in ∆Pr/Pr as discussed next. Figure 9 shows the results on P vs. E as a function of H and ∆Pr/Pr vs. H for the samples of NZFO (x = 0.4)-PZT. The maximum values of P are 15 nC/cm2 for the samples with ferrite cores and 20 nC/cm2 for the disks with PZT cores and are much higher than for the samples with x = 0.5. For both samples, there is a decrease in Pr upon the application of H. Figure 9e shows the estimated ∆Pr/Pr vs. H. For the sample made of fibers with ferrite cores, one observes a near-linear decrease in Pr with increasing H and ∆Pr/Pr reaches a value of −15% for H = 5 kOe. When H is decreased from 5 kOe to 0, ∆Pr/Pr shows a further linear decrease to −24% for H = 0. A much higher decrease in ∆Pr/Pr with H is observed in Figure 9e for the sample containing the fibers with PZT cores. With increasing H, ∆Pr/Pr decreases rapidly to a value of −44% at H = 5 kOe and then a further decline to −64% when H is decreased back to zero.
Figure 10 shows P vs. E under H and the results on ∆Pr/Pr vs. H for the disks with NZFO (x = 0.3)-PZT fibers. The maximum p-value of 80 nC/cm2 is a factor 2 to 4 higher than for the samples with the fibers of x = 0.5 and 0.4. The application of H leads to a sharp decrease in Pr and ∆Pr/Pr for the sample with a ferrite core decreases by 70% as H is increased to 5 kOe. With a subsequent decrease in H, ∆Pr/Pr decreases by 83% for H = 0. The sample with PZT core shows a similar behavior with an identical decrease in Pr with a net decrease of 83% in ∆Pr/Pr.
We carried out similar measurements on the disks with the fibers of NZFO (x = 0.2, 0.1, and 0)-PZT, and the results are shown in the Supplementary Figures S11–S13. The maximum p-value decreases to 20 nC/cm2 and 8 nC/m2, respectively, for the samples with x = 0.2 and 0.1 and the ∆Pr/Pr values are found to be in the range −2% to +5%, much smaller than for the samples with x = 0.3 and 0.4 and. Figure 11 summarizes the results of H-induced variations in Pr for the NZFO-PZT fibers with Zn concentration from 0 to 0.5. The maximum change in ∆Pr/Pr is plotted as a function of x. The ferroelectric remnant polarization for the fiber disks under a static magnetic field shows a relatively small change with the Zn content in the ferrite with the exception of the Zn content x = 0.3 and 0.4. Thus, there is evidence for a giant ME coupling in the bulk composites with NZFO-PZT fiber, in particular for the Zn concentration x = 0.3 and 0.4.
We also performed low-frequency magneto-electric voltage coefficient (MEVC) for the characterization of direct ME effects. The measurements were performed on rectangular platelets of the fibers. A static field H and an AC magnetic field h at 100 Hz were applied parallel to each other and to the sample plane and along the length of the sample. The ME voltage V induced in the sample was measured with a lock-in amplifier. The ME coefficient α31 = V/(t h), where t is the sample thickness, was measured as a function of H. Figure 12 shows α31 vs. H data measured with h = 5 Oe at 100 Hz for the samples with the fibers of NZFO (x = 0.5)-PZT and NZFO (x = 0.4)-PZT. As H is increased from zero, one notices a sharp jump in α31 to a large value of ~6 mV/cm Oe for x = 0.5. The H-dependence of α31 is rather weak with a small decrease for the maximum H value of 2.5 kOe. When H is decreased back to zero, in addition to a hysteresis α31 at H = 0 as a high maximum value, the reversal of the H direction is accompanied by a 180 deg phase difference in α31, but its magnitude and H-dependence remain the same as for +H. For the sample with x = 0.4, the data in Figure 12 shows hysteresis and a large zero-field MEVC, similar to the H-dependence for x = 0.5. The maximum values of α31 are 5.5 mV/cm Oe for the sample with NZFO core and 12 mV/cm Oe for the sample with PZT core which is a factor of two higher than for the sample with x = 0.5.
The low-frequency MEVC data for the samples with NZFO-PZT with x = 0.3 and 0.2 are shown in Figure 13. The overall H-dependence of α31 with hysteresis and a large zero-field MEVC when H is decreased back to zero are the same as for the results for x = 0.4 and 0.5 in Figure 12, but the ME coefficients are relatively high. The sample of x = 0.2 with a PZT core shows the highest α31 value of ~40 MV/cm Oe among the systems studied. Similar measurements for NZFO (x = 0.1)-PZT showed a maximum α31 of ~10 mV/cm Oe (Supplementary Figure S14). Finally, the MEVC data for the sample of NFO-PZT in Figure 14 also shows significant hysteresis and a large zero-field ME coefficient. Unlike the case of thick film- and thin film-layered ferrite-PZT composites that show a gradual increase in α31 to a maximum followed by a decrease to zero for high H values, the bulk composites with core–shell fibers in this study reveal very weak H-dependence.

4. Discussion

The fibers of nickel–zinc ferrite and PZT with core–shell structures were synthesized by electrospinning. The fibers annealed at high temperatures were free of any impurity phases and electron and scanning probe microscopy images showed fibers of uniform diameter with well-formed cores and shells. A ferromagnetic character for the fibers was evident from the magnetization and ferromagnetic resonance measurements. The gyromagnetic ratio γ for the fibers was in the range of 2.5–3.1 GHz/kOe, in general agreement with the reported values of 3.0–3.3 GHz/kOe for NiZn ferrites [36,37]. The determination of the values of other ferromagnetic order parameters such as the saturation magnetization and magnetic anisotropy field for the fibers for comparison with pure NiZn-ferrite, however, was not feasible due to the wide distribution in the core diameters and shell thicknesses and difficulties with the determination of the volume or weight fraction of ferrite in the fibers.
Magnetostriction measured in the platelets of the fibers showed the following important features: (i) Strong hysteresis and remanence were seen in λ11 vs. H for all of the Zn substitutions. (ii) The maximum magnetostriction values were much smaller than reported values of −15 ppm to −30 ppm for polycrystalline NiZn ferrites [38]. (iii) The samples with NZFO cores had a maximum value of λ11 = −2 ppm for x = 0.5 to −8 ppm for x = 0.2. (iv) The platelets with the fibers of PZT cores had the maximum value of λ11 = −12 ppm for x = 0.2. (v) The positive value of magnetostriction for the fibers with NZFO (x = 0.4 and 0.5) shell–PZT core is rather unique and its cause needs to be understood.
The results on P vs. E confirm the ferroelectric nature of the fibers. The maximum values of P, in the range of 8–80 nC/cm2, are comparable to the reported values of 80–90 nC/cm2 for NFO-PZT [34]. The polarization values, however, are smaller than 2–3 μC/cm2 measured in NFO-barium titanate (BTO) fibers [39] and two orders of magnitude smaller than for bulk and thin-film PZT [21] that could be attributed to large leakage current due to the presence low resistivity NiZn ferrites in the fibers. The most significant aspect in the present study is the strength of ME coupling by static magnetic field-induced ferroelectric polarization, i.e., the very large reduction in Pr, on the order of 64% to 83%, in the fibers with x = 0.3 and 0.4 which is probably the highest ever reported. Past reports include ∆Pr/Pr~5% for NFO-PZT [34], 3–6% for NFO-BTO [39], and −22% in strontium ferrite–ferroelectric core–shell fiber samples [25]. Recent studies on the core–shell fibers of Y-type hexagonal ferrites and PZT reported a fractional decrease in Pr on the order of 12–20% [40,41]. The H-induced polarization variations in NZFO-PZT coaxial fibers are the highest reported so far.
An important question to be addressed in regard to the giant H-induced reduction Pr is the phenomenon related specifically to the core–shell structure for the fibers. In order to address this, we prepared fibers with a random distribution of NZFO and PZT by using a sol containing equal volumes of NZFO (x = 0.1, 0.3, and 0.5) and PZT and characterized in terms of structural and magnetic parameters (Supplementary Figures S15 and S16). H-induced change in Pr was measured in the disks of the fibers (Figure S17). Figure 15 shows the maximum variation in ∆Pr/Pr with x. It is obvious from the −2% to −3% variation in ∆Pr/Pr for the mixed NZFO-PZT fiber samples that the giant H-induced change in Pr for the core–shell fiber samples with x = 0.3 and 0.4 (Figure 11) is indeed unique to the core–shell structure for the composite. A follow-up study on the core–shell composites of NZFO-PZT with x = 0.25 to 0.45 (in steps of 0.05) may be essential in this regard.
Finally, we discuss the results of low-frequency ME effects in the core–shell fiber samples. Significant inferences from the data in Figure 12, Figure 13 and Figure 14 are as follows: (i) The H-dependence of α31 shows hysteresis and remanence and a large zero-bias ME coefficient. (ii) The sample with NZFO (x = 0.2)-PZT show the highest value of α31 = 37 mV/cm Oe. (iii) ME coefficients for the core–shell samples are much higher than = 3–4 mV/cm Oe measured in the fiber samples with randomly distributed NZFO and PZT (data shown in Supplementary Figure S18) and compare favorably with the reported α31 values of 12–24 mV/cm Oe for NFO-hexagonal ferrite fibers and are much higher than ~0.5 mV/cm Oe for NFO-BTO fiber samples [24,39].

5. Conclusions

Studies on the nature of ME effects were performed on the coaxial fibers of NZFO with Zn substitutions from 0 to 0.5 and PZT prepared by electrospinning. The fibers annealed at high temperatures were free of impurity phases and of uniform diameter and defect-free core–shell interface. The magnetization measured on the fibers with a Faraday balance and ferromagnetic resonance on the platelets of the pressed and annealed fibers confirmed the ferromagnetic nature of NZFO. The ferroelectric polarization measured on the fiber disks was found to be small compared to the values reported for thin films of PZT. The results on H-induced variation in the remnant polarization in the composites were indicative of a giant ME coupling, in particular in disks of fibers with NZFO with the Zn substitutions of 0.3 and 0.4. We also inferred a strong ME coupling in the composites from the measured low-frequency ME voltage coefficients that were as high as 40 mV/cm Oe. A strong ME response even without an external magnetic field was also evident from the present study. Overall, this study suggests that the coaxial fibers of nickel–zinc ferrites and ferroelectrics are promising candidates for applications in magnetic sensors due to their strong magneto-electric coupling.

Supplementary Materials

The following supporting information can be downloaded at: https://www.mdpi.com/article/10.3390/jcs8080309/s1, Figure S1: (a) SEM image of (a) collection of fibers and (b) a single fiber with NZFO (x = 0.2) shell and PZT core. Figure S2: SEM image of collection of fibers with (a) NZFO (x = 0.4) shell and PZT core and (b) NZFO (x = 0.4) core and PZT shell. Figure S3: SEM image of mixed fibers of (a) NZFO (x = 0.3) and PZT and (b) NZFO (x = 0.4) and PZT. Figure S4: XRD patterns for fibers of (a) NZFO (x-0.1) shell and PZT core and (b) NZFO (x = 0.3) shell and PZT core. Figure S5: Magnetization vs static magnetic field H data for coaxial fibers of (a) NZFO (x = 0.1) core –PZT shell, (b) NZFO (x = 0.1) shell–PZT shell, (c) NZFO (x = 0.3) core- PZT shell, and (d) NZFO (x = 0.3) shell–PZT core. Figure S6: Magnetization vs static magnetic field H data for coaxial fibers of (a) NZFO (x = 0.5) shell–PZT core and (b) NZFO (x = 0.5) core-PZT shell. Figure S7: Scattering matrix parameter S11 vs frequency f for ferromagnetic resonance (FMR) for a series of in-plane static magnetic field H. The data are for a rectangular platelet of coaxial fibers of (a) NFO shell and PZT core and (b) NFO core and PZT shell. Figure S8: (a) Scattering matrix parameter S11 vs frequency f for ferromagnetic resonance (FMR) for a series of in-plane static magnetic field H. The data are for a rectangular platelet of coaxial fibers of NZFO (x = 0.2) shell and PZT core. (b) Fitting of the resonance frequency vs H to the Kittel’s equation to determine the gyromagnetic ratio γ and the effective saturation induction 4πMeff. Figure S9: (a) Scattering matrix parameter S11 vs frequency f for ferromagnetic resonance (FMR) for a series of in-plane static magnetic field H. The data are for a rectangular platelet of coaxial fibers of NZFO (x = 0.3) shell and PZT core. (b) Fitting of the resonance frequency vs H to the Kittel’s equation to determine the gyromagnetic ratio γ and the effective saturation induction 4πMeff. Figure S10: Magnetostriction λ11 measured parallel to the applied in-plane static magnetic field H. The data are for a rectangular platelet of coaxial fibers of (a) NZFO (x = 0.1) core and PZT shell and (b) PZT core and NZFO (x = 0.1) shell. The arrows indicate increasing or decreasing H direction. Figure S11: Polarization P as a function of electric field E for a series of applied static magnetic field H for a disc with fibers of NZFO (x = 0.2) core-PZT shell for (a) increasing H and (b) decreasing H. (c,d) show similar results for fibers with PZT core and NZFO (x = 0.2) shell. The insets show P vs. E in expanded scale. (e) Fractional change in the remnant polarization Pr as a function of H for increasing and decreasing H. Figure S12: Polarization P as a function of electric field E for a series of applied static magnetic field H for a disc with fibers of NZFO (x = 0.1) core-PZT shell for (a) increasing H and (b) decreasing H. (c,d) show similar results for fibers with PZT core and NZFO (x = 0.1) shell. The insets show P vs. E in expanded scale. (e) Fractional change in the remnant polarization Pr as a function of H for increasing and decreasing H. Figure S13: (a) Polarization P as a function of electric field E for applied static magnetic field H for a disc with fibers of NFO core-PZT shell for H = 0 and H = 2500 Oe. (b) Fractional change in the remnant polarization Pr as a function of H for increasing and decreasing H for NFO-PZT fiber samples. Figure S14: ME voltage coefficient a31 measured at 100 Hz as a function of bias field H for samples with fibers of NZFO (x = 0.1)-PZT. The inset shows the H dependence of a31 on an expanded scale for H < 1 kOe. Figure S15: SEM micrograph of a fiber with random distribution of NZFO (x = 0.1) and PZT. Figure S16: Scattering matrix parameter S11 vs frequency f for ferromagnetic resonance (FMR) for a series of in-plane static magnetic field H. The data are for a rectangular platelet of mixed fibers of NZFO (x = 0.5) and PZT. Figure S17: Fractional change in Pr as a function of H in samples with fibers of Randomly distributed NZFO and PZT for (a) x = 0.5, (b) x = 0.3, and (c) x = 0.1. Figure S18: ME voltage coefficient at 100 Hz versus H for fibers with random distribution of NZFO and PZT for (a) x = 0.1, (b) x = 0.3, and (c) x = 0.5.

Author Contributions

B.G., S.S., S.A. and C.K. synthesized the fibers; B.G., S.S. and S.M. carried out structural measurements and magnetic, ferroelectric, and ME characterization; J.Z., M.J., M.R.P. and G.S. were involved in data analysis, interpretation, funding acquisition, and project management. All the authors were involved in manuscript preparation. All authors have read and agreed to the published version of the manuscript.

Funding

The research at Oakland University was supported by grants from the National Science Foundation (NSF) (ECCS-1923732, ECCS-EAGER-2236879), and the Air Force Office of Scientific Research (AFOSR) Award No. FA9550-20-1-0114. Efforts at the University of Connecticut were supported by an NSF Grant (ECCS-EAGER-2236879) The research at AFRL was supported by a grant from the AFOSR (Award No. FA9550-23RXCOR001).

Data Availability Statement

The datasets generated and/or analyzed during the current study are available from the corresponding author upon reasonable request.

Conflicts of Interest

The authors declare no conflict of interest.

References

  1. Sun, N.; Priya, S.; Srinivasan, G. (Eds.) Composite Magnetoelectrics: Materials, Structures, and Applications; Elsevier: New York, NY, USA, 2015. [Google Scholar]
  2. Hu, J.M.; Nan, C.W. Opportunities and challenges for magnetoelectric devices. APL Mater. 2019, 7, 080905. [Google Scholar] [CrossRef]
  3. Bichurin, M.; Petrov, R.; Sokolov, O.; Leontiev, V.; Kuts, V.; Kiselev, D.; Wang, Y. Magnetoelectric magnetic field sensors: A review. Sensors 2021, 21, 6232. [Google Scholar] [CrossRef] [PubMed]
  4. Herrera Diez, L.; Kruk, R.; Leistner, K.; Sort, J. Magnetoelectric materials, phenomena, and devices. APL Mater. 2021, 9, 05040. [Google Scholar] [CrossRef]
  5. Narita, F.; Fox, M. A review on piezoelectric, magnetostrictive, and magnetoelectric materials and device technologies for energy harvesting applications. Adv. Eng. Mater. 2018, 20, 1700743. [Google Scholar] [CrossRef]
  6. Annapureddy, V.; Palneedi, H.; Hwang, G.T.; Peddigari, M.; Jeong, D.Y.; Yoon, W.H.; Kim, K.H.; Ryu, J. Magnetic energy harvesting with magnetoelectrics: An emerging technology for self-powered autonomous systems. Sustain. Energy Fuels 2017, 1, 2039–2052. [Google Scholar] [CrossRef]
  7. Leung, C.M.; Li, J.; Viehland, D.; Zhuang, X. A review on applications of magnetoelectric composites: From heterostructural uncooled magnetic sensors, energy harvesters to highly efficient power converters. J. Phys. D Appl. Phys. 2018, 51, 263002. [Google Scholar] [CrossRef]
  8. Wang, Y.J.; Gao, J.Q.; Li, M.H.; Shen, Y.; Hasanyan, D.; Li, J.F.; Viehland, D. A review on equivalent magnetic noise of magnetoelectric laminate sensors. Philos. Trans. R. Soc. A Math. Phys. Eng. Sci. 2014, 372, 20120455. [Google Scholar] [CrossRef] [PubMed]
  9. Yan, Y.; Geng, L.D.; Tan, Y.; Ma, J.; Zhang, L.; Sanghadasa, M.; Ngo, K.; Ghosh, A.W.; Wang, Y.U.; Priya, S. Colossal tunability in high frequency magnetoelectric voltage tunable inductors. Nat. Commun. 2018, 9, 4998. [Google Scholar] [CrossRef] [PubMed]
  10. Liang, X.; Chen, H.; Sun, N.X. Magnetoelectric materials and devices. APL Mater. 2021, 9, 041114. [Google Scholar] [CrossRef]
  11. Palneedi, H.; Maurya, D.; Kim, G.Y.; Annapureddy, V.; Noh, M.S.; Kang, C.Y.; Kim, J.W.; Choi, J.J.; Choi, S.Y.; Chung, S.Y.; et al. Unleashing the full potential of magnetoelectric coupling in film heterostructures. Adv. Mater. 2017, 29, 1605688. [Google Scholar] [CrossRef]
  12. Liang, X.; Dong, C.; Chen, H.; Wang, J.; Wei, Y.; Zaeimbashi, M.; He, Y.; Matyushov, A.; Sun, C.; Sun, N. A review of thin-film magnetoelastic materials for magnetoelectric applications. Sensors 2020, 20, 1532. [Google Scholar] [CrossRef] [PubMed]
  13. Xie, S.H.; Liu, Y.Y.; Li, J.Y. Synthesis, microstructures, and magnetoelectric couplings of electrospun multiferroic nanofibers. Front. Phys. 2012, 7, 399–407. [Google Scholar] [CrossRef]
  14. Viehland, D.; Li, J.F.; Yang, Y.; Costanzo, T.; Yourdkhani, A.; Caruntu, G.; Zhou, P.; Zhang, T.; Li, T.; Gupta, A.; et al. Tutorial: Product properties in multiferroic nanocomposites. J. Appl. Phys. 2018, 124, 061101. [Google Scholar] [CrossRef]
  15. Wang, N.; Cai, Y.; Zhang, R.Q. Growth of nanowires. Mater. Sci. Eng. R Rep. 2008, 60, 1–51. [Google Scholar] [CrossRef]
  16. Pant, M.; Singh, R.; Negi, P.; Tiwari, K.; Singh, Y. A comprehensive review on carbon nano-tube synthesis using chemical vapor deposition. Mater. Today Proc. 2021, 46, 11250–11253. [Google Scholar] [CrossRef]
  17. Li, Y.; Zhu, J.; Cheng, H.; Li, G.; Cho, H.; Jiang, M.; Gao, Q.; Zhang, X. Developments of advanced electrospinning techniques: A critical review. Adv. Mater. Technol. 2021, 6, 2100410. [Google Scholar] [CrossRef]
  18. Piraux, L. Magnetic nanowires. Appl. Sci. 2020, 10, 1832. [Google Scholar] [CrossRef]
  19. Jia, Y.; Yang, C.; Chen, X.; Xue, W.; Hutchins-Crawford, H.J.; Yu, Q.; Topham, P.D.; Wang, L. A review on electrospun magnetic nanomaterials: Methods, properties and applications. J. Mater. Chem. C 2021, 9, 9042–9082. [Google Scholar] [CrossRef]
  20. Liang, L.; Kang, X.; Sang, Y.; Liu, H. One-dimensional ferroelectric nanostructures: Synthesis, properties, and applications. Adv. Sci. 2016, 3, 1500358. [Google Scholar] [CrossRef]
  21. Sharma, S. Ferrolectric nanofibers: Principle, processing and applications. Adv. Mater. Lett. 2013, 4, 522–533. [Google Scholar] [CrossRef]
  22. Wen, X.; Dai, J.; Feng, W.; Cheng, C.; Huang, D. SrFe12O19@ZnFe2O4 core–shell composite fiber with enhanced exchange coupling interaction. J. Magn. Magn. Mater. 2023, 568, 170278. [Google Scholar] [CrossRef]
  23. Dai, J.; Wen, X.; Feng, W.; Cheng, C.; Huang, D. Correlation of the heat treatment feature and magnetic properties of the SrFe12O19@ZnFe2O4 core-shell nanofibers. Mater. Chem. Phys. 2022, 276, 125393. [Google Scholar] [CrossRef]
  24. Huang, D.; Wen, X.; Dai, J.; Wang, Q.; Liu, H.; Li, Z. Magnetic Properties and Exchange Coupling Effects of SrFe12O19@MFe2O4 (M = Co, Ni, Zn) as Hard-Soft Magnetic Ferrite Core–Shell Nanofibers. J. Supercond. Nov. Magn. 2023, 36, 711–719. [Google Scholar] [CrossRef]
  25. Srinivasan, G.; Liu, Y.; Zhang, T. Magneto-electric effects in coaxial nanofibers of hexagonal ferrites and ferroelectrics. Ferroelectrics 2023, 611, 161–170. [Google Scholar] [CrossRef]
  26. Shen, X.; Zhou, Z.; Song, F.; Meng, X. Synthesis and magnetic properties of nanocomposite Ni1−xCoxFe2O4–BaTiO3 fibers by organic gel-thermal decomposition process. J. Sol-Gel Sci. Technol. 2010, 53, 405–411. [Google Scholar] [CrossRef]
  27. Schileo, G. Recent developments in ceramic multiferroic composites based on core/shell and other heterostructures obtained by sol–gel routes. Prog. Solid State Chem. 2013, 41, 87–98. [Google Scholar] [CrossRef]
  28. Liu, M.; Li, X.; Imrane, H.; Chen, Y.; Goodrich, T.; Cai, Z.; Ziemer, K.S.; Huang, J.Y.; Sun, N.X. Synthesis of ordered arrays of multiferroic NiFe2O4-Pb (Zr0.52Ti0.48) O3 core-shell nanowires. Appl. Phys. Lett. 2007, 90, 152501. [Google Scholar] [CrossRef]
  29. Zheng, J.C.; Shen, X.Q.; Min, C.Y.; Meng, X.F.; Liang, Q.R. Fabrication and characterization of heterostructural CoFe2O4/Pb (Zr0.52Ti0.48) O3 nanofibers by electrospinning. J. Compos. Mater. 2010, 44, 2135–2144. [Google Scholar] [CrossRef]
  30. Xie, S.H.; Li, J.Y.; Qiao, Y.; Liu, Y.Y.; Lan, L.N.; Zhou, Y.C.; Tan, S.T. Multiferroic CoFe2O4–Pb (Zr0.52Ti0.48) O3 nanofibers by electrospinning. Appl. Phys. Lett. 2008, 92, 222904. [Google Scholar] [CrossRef]
  31. Gao, M.; Yang, Y.; Rao, W.F.; Viehland, D. Magnetoelectricity in vertically aligned nanocomposites: Past, present, and future. MRS Bull. 2021, 46, 123. [Google Scholar] [CrossRef]
  32. Liu, Y.; Zhou, P.; Ge, B.; Liu, J.; Zhang, J.; Zhang, W.; Zhang, T.; Srinivasan, G. Strain-mediated magneto-electric effects in coaxial nanofibers of Y/W-type hexagonal ferrites and ferroelectrics. J. Compos. Sci. 2021, 5, 268. [Google Scholar] [CrossRef]
  33. Henrichs, L.F.; Mu, X.; Scherer, T.; Gerhards, U.; Schuppler, S.; Nagel, P.; Merz, M.; Kübel, C.; Fawey, M.H.; Hansen, T.C.; et al. First-time synthesis of a magnetoelectric core–shell composite via conventional solid-state reaction. Nanoscale 2020, 12, 15677–15686. [Google Scholar] [CrossRef]
  34. Sreenivasulu, G.; Popov, M.; Zhang, R.; Sharma, K.; Janes, C.; Mukundan, A.; Srinivasan, G. Magnetic field assisted self-assembly of ferrite-ferroelectric core-shell nanofibers and studies on magneto-electric interactions. Appl. Phys. Lett. 2014, 104, 052910. [Google Scholar] [CrossRef]
  35. Smit, J.; Wijn, H.P.J. Ferrites; Wiley: New York, NY, USA, 1959. [Google Scholar]
  36. Harris, V.G. Modern microwave ferrites. IEEE Trans. Magn. 2011, 48, 1075–1104. [Google Scholar] [CrossRef]
  37. Thakur, P.; Taneja, S.; Chahar, D.; Ravelo, B.; Thakur, A. Recent advances on synthesis, characterization and high frequency applications of Ni-Zn ferrite nanoparticles. J. Magn. Magn. Mater. 2021, 530, 167925. [Google Scholar] [CrossRef]
  38. Arai, K.I.; Tsuya, N. Magnetostriction measurements of Ni-Zn ferrite single crystals. J. Phys. Chem. Solids 1975, 36, 463–465. [Google Scholar] [CrossRef]
  39. Sreenivasulu, G.; Zhang, J.; Zhang, R.; Popov, M.; Petrov, V.; Srinivasan, G. Multiferroic core-shell nanofibers, assembly in a magnetic field, and studies on magneto-electric interactions. Materials 2017, 11, 18. [Google Scholar] [CrossRef] [PubMed]
  40. Yadav, S.K.; Hemalatha, J. Direct magnetoelectric and magnetodielectric studies of electrospun Ba2Ni2Fe12O22–Pb (Zr0.52 Ti0.48) O3 core–shell nanofibers. J. Magn. Magn. Mater. 2022, 564, 170174. [Google Scholar] [CrossRef]
  41. Yadav, S.K.; Hemalatha, J. Synthesis and characterization of magnetoelectric Ba2Zn2Fe12O22–PbZr0.52 Ti0.48 O3 electrospun core–shell nanofibers for the AC/DC magnetic field sensor application. Appl. Phys. A 2024, 130, 67. [Google Scholar] [CrossRef]
Figure 1. X-ray diffraction patterns for the coaxial fibers of (a) NZFO (x = 0)-PZT and (b) NZFO (x = 0.3)-PZT. Small impurities are indicated by *. (c) SEM image showing a collection of the fibers of NFO-PZT. (d) SEM image showing the core and shell structure for an NFO-PZT fiber.
Jcs 08 00309 g001
Figure 2. (a) Atomic force microscopy image of an isolated coaxial fiber of NFO-PZT. (b) Magnetic force microscopy for a fiber of NFO shell–PZT core. (c) Scanning microwave microscopy (SMM) capacitance image at 10 GHz for NFO-PZT fiber.
Jcs 08 00309 g002
Figure 3. Magnetization vs. static magnetic field H data for the bulk samples with the fibers of (a) NFO-PZT, (b) NZFO (x = 0.2)-PZT, and (c) NZFO (x = 0.4)-PZT. The data are for the samples with ferrite core and PZT shell.
Jcs 08 00309 g003
Figure 4. (a) Scattering matrix parameter S11 vs. frequency f for ferromagnetic resonance (FMR) for a series of in-plane static magnetic field H. The data are for a rectangular platelet of the coaxial fibers of NZFO (x = 0.2) and PZT. (b) The fitting of the resonance frequency fr vs. H to Kittel’s equation to determine the gyromagnetic ratio γ and the effective saturation induction 4πMeff.
Jcs 08 00309 g004
Figure 5. Profiles showing FMR (a) and the fitting of fr vs. H data to Kittel’s equation (b) as in Figure 4 for a platelet with the fibers of NZFO (x = 0.3)-PZT.
Jcs 08 00309 g005
Figure 6. Magnetostriction λ11 measured parallel to the applied in-plane static magnetic field H. The data are for a rectangular platelet made of the coaxial fibers of NZFO (x = 0.5)-PZT (a,b) and NZFO (x = 0.4)-PZT (c,d). The arrows indicate increasing or decreasing H direction. The arrows represent the increasing and decreasing magnitude of H variation.
Jcs 08 00309 g006
Figure 7. λ11 vs. H data as in Figure 4 for NZFO (x = 0.3)-PZT (a,b) and NZFO (x = 0.2)-PZT (c,d). The arrows represent the increasing and decreasing magnitude of H variation.
Jcs 08 00309 g007
Figure 8. Polarization P as a function of electric field E for a series of applied static magnetic field H for a disk with the fibers of NZFO (x = 0.5) core–PZT shell for (a) increasing H and (b) decreasing H. (c,d) show similar results for fibers with PZT cores and NZFO (x = 0.5) shells. The insets show P vs. E on an expanded scale. (e) The fractional change in the remnant polarization Pr as a function of H for increasing and decreasing H. PZT (a,b) and NZFO (x = 0.5)-PZT (c,d). The arrows indicate increasing or decreasing H direction.
Jcs 08 00309 g008
Figure 9. Polarization P as a function of electric field E for a series of applied static magnetic field H for a disk with the fibers of NZFO (x = 0.4) core–PZT shell for (a) increasing H and (b) decreasing H. (c,d) show similar results for fibers with PZT cores and NZFO (x = 0.4) shells. The insets show P vs. E on an expanded scale. (e) The fractional change in the remnant polarization Pr as a function of H for increasing and decreasing H. The arrows represent the increasing and decreasing magnitude of H variation. The inset shows data on expanded scale.
Jcs 08 00309 g009
Figure 10. Results on P vs. E for a series of (a,c) increasing H-values and (b,d) decreasing H-values for a platelet with the core–shell fibers of NZFO (x = 0.3)-PZT. (e) Fractional change in Pr vs H for the core-shell fiber disks. The arrows represent the increasing and decreasing magnitude of H variation.
Jcs 08 00309 g010
Figure 11. Zn concentration x dependence of the maximum fractional variation in the remnant polarization in the bulk composites with NZFO-PZT core–shell fibers.
Jcs 08 00309 g011
Figure 12. ME voltage coefficient α31 measured at 100 Hz as a function of the bias field H for the samples with the fibers of NZFO (x = 0.5)-PZT and NZFO (x = 0.4)-PZT. The insets show the H-dependence of α31 on an expanded scale for H < 1 kOe. (a,c) are for fibers with ferrite core and (b,d) are for fibers with PZT core. Arrows indicate data for increasing and decreasing magnitude of H.
Jcs 08 00309 g012
Figure 13. Data as in Figure 12 for samples of NZFO (x = 0.3)-PZT and NZFO (x = 0.2)-PZT. (a,c) are for fibers with ferrite core and (b,d) are for fibers with PZT core. Arrows indicate data for increasing and decreasing magnitude of H.
Jcs 08 00309 g013
Figure 14. Data as in Figure 12 for bulk composites with NFO-PZT fibers. Data in (a) are for fibers with ferrite core and data in (b) are for fibers with PZT core. Arrows indicate data for increasing and decreasing magnitude of H.
Jcs 08 00309 g014
Figure 15. Maximum fractional H-induced change in Pr as a function of x in the fiber samples with randomly distributed NZFO-PZT.
Jcs 08 00309 g015
Disclaimer/Publisher’s Note: The statements, opinions and data contained in all publications are solely those of the individual author(s) and contributor(s) and not of MDPI and/or the editor(s). MDPI and/or the editor(s) disclaim responsibility for any injury to people or property resulting from any ideas, methods, instructions or products referred to in the content.

