Abstract
The development of a nanostructured copper–laser-induced graphene (LIG) composite that can catalyze the reduction of nitrate is described. The system was characterized using a range of surface analytical methods (SEM, Raman, DekTak profilometry). The electrochemical performance of the copper mesh in reducing nitrate was investigated, the nature of the catalytic response was elucidated, and the influence of potential interferences was critically appraised. The adaptation of the system as the basis of an electrochemical sensor for nitrate was assessed, which displayed a limit of detection of 4.7 μM nitrate. The analytical applicability in authentic media was evaluated through the analysis of two surface water samples and validated by standard spectroscopic (nitrate reductase–Griess methods). The LIG substrate offers a simple, scalable route towards the reduction of nitrate with a construction simplicity and sensitivity that is competitive with much more complex nanomaterials.
1. Introduction
Nitrate is one of the most prevalent nitrogen species within ecosystems and has a critical role in the biochemical and physiological development of plants. The ingestion of the latter provides a source of dietary nitrate, but it is also recognized as an additive in meat products, where it can hinder bacterial growth [1,2,3,4,5]. As such, it is ubiquitous within the agri-food industries, but its role within the environment and in the maintenance of human health has given rise to concern. The World Health Organization (WHO) recommends that the maximum permissible levels of nitrate in food and drinking water should be limited to 50 mg/L [6]. Excessive application of fertilizer and the consequences of agricultural run-off resulting in the contamination of surface and groundwater have long been pressing concerns [1,2,5]. While decentralized/field testing enabling environmental surveillance has traditionally been the prime driver for new nitrate sensing technologies [7,8,9,10,11], advances in communication and connectivity have begun to open new vistas for nitrate sensors where they can be embedded within precision agriculture systems [12,13]. Here, the promise is of targeted nitrate dosing rather than bulk application, resulting in a more efficient distribution that will reduce costs and improve productivity whilst minimizing environmental impact. Graphene-based materials have found a multitude of applications within the sensing sector and have been shown to have considerable promise for nitrate sensing [10,11], but their production can be problematic. In contrast to the extensive processing and patterning steps common to conventional graphene sensor production methods [14,15,16]), laser-induced graphene can be achieved by a desktop laser, which simply scribes a pattern onto a suitable substrate [17,18,19]. The aims of the present research have been to examine the potential applicability of laser-induced graphene electrodes [17,18,19] and the additive nature of their manufacture as the basis of a more accessible and scalable sensing system.
The electrochemical transformation of nitrate ions has a rich history from both fundamental and applied origins, but the unreactive nature of the target ion towards reduction at conventional metallic or carbon-based electrodes creates a considerable challenge for the sensing community. Electrodes modified with catalytic components or nanomaterials based on Cu, Au, Ag, Pd, Fe, and/or their corresponding oxides are frequently employed to enhance electrode responses and provide selectivity towards nitrate [7,8,9]. These composite systems have often been supplemented with graphene/graphene oxide or carbon nanotubes to yield interfacial structures that can improve the electroreduction response [10,11]. In many cases, however, preparation can be complex and not readily amenable to volume production. While screen-printed electrodes are often promoted as an ideal platform for decentralized testing, the costs associated with the production of screens and conductive inks can be prohibitive—especially when considering the prototyping of small batches. In contrast, the production of LIG involves a maskless, direct writing process where a laser is employed to convert sp3-hybridized carbon on a suitable substrate (typically polyimide) into sp2 carbon. Under ambient conditions, this laser processing yields a conductive graphitic deposit that can serve as an electrode material [17,18,19]. Lin et al. (2014) were the first to report the production of LIG from the laser scribing of polyimide film with a CO2 infra-red laser [17], but more recent studies have shown that commonly available laser diodes used in off-the-shelf engraving systems marketed as consumer products can be equally effective at producing viable electrode architectures [18]. The present research has sought to explore the potential applicability of LIG as a substrate for nitrate detection. The morphological properties and electrochemical characteristics of the LIG electrode are examined, and its subsequent modification with a nanostructured copper deposit and its analytical efficacy are critically appraised through the analysis of surface water.
2. Materials and Methods
All reagents were of the highest grade available, obtained from Sigma-Aldrich, and were used without further purification. Polyimide film (125 μm thick Kapton) was obtained from Goodfellow Research Materials. Electrolyte solutions consisting of 0.1 M sodium sulphate were adjusted to pH 3 through the addition of 0.1 M HCl. Electrochemical analyses were conducted using a micro Autolab (Type III) potentiostat with laser-induced graphene as the working electrode, a platinum wire counter electrode, and a commercial Ag|AgCl half-cell (3 M NaCl) reference. Voltammetric analysis was conducted at 22 ± 2 °C. An Atomstack A5 Laser, 5W Laser Diode (λ 445 nm) operating at varying power (20–45%) was used to prepare the LIG samples with optimization of the laser settings having been conducted previously [19]. Where the power is too low (<15%), the LIG tracks possess insufficient conductivity to enable electroanalytical measurements to be recorded. In contrast, increasing the power beyond 50% leads to greater ablation of the polyimide and results in a mechanically fragile deposit. As such, the adoption of 20% and 45% power was found to allow the reproducible production of electrodes with contrasting behavior [19]. The laser system has a fixed focus with a spot size of 0.5 mm × 0.3 mm and operates under a pulsed mode. The pulse duration was 1 ms and had a repetition rate of 1 kHz, which, at 20% power, gave rise to a per pulse fluence of 0.73 J/cm2. Designs were patterned on polyimide film under ambient conditions (22 °C) with a raster speed of 3000 mm/min and a density of 15 lines/mm. The resulting LIG samples were sectioned into 5 mm × 5 mm squares, and an adhesive copper tape was added to the bottom to serve as the external contact [19]. The LIG/Cu track was subsequently thermally encapsulated into polyester laminates that had been precut with a 2.5 mm × 2.5 mm square window to expose the LIG surface and control the geometric area of the working electrode (6.25 mm2).
Raman spectra of the LIG samples were obtained using a Renishaw Raman Microscope (20× objective lens) (Sourced from Renishaw, New Mills, UK) with a 532 nm laser operating at 10% power. The conductivity of the lasered polyimide was assessed with an Ossila 4-point probe (Ossila UK Ltd., Sheffield UK). Electron microscopy was conducted using a Hitachi SU5000 FE-SEM (Hitachi UK, Maidenhead, UK) with an accelerating voltage of 10 kV and a high vacuum pressure of 10−8 bar. A phloroglucinol spectroscopic assay was employed to detect nitrite byproducts arising from the electro-reduction processes and was prepared as described previously [20]. Water samples were collected from the Tobernalt Holy Well (County Sligo) and Glencar Waterfall (County Leitrim), Ireland. Water samples were analyzed using a nitrate reductase–Griess assay (Sigma-Aldrich No. 23479, St. Louis, MO, USA) with a BioTek Epoch plate reader (96-well microtiter plate, λmax 540 nm).
3. Results and Discussion
3.1. LIG Characterization
Scanning electron microscopy was used to assess the effect of various laser power settings on the morphology of the laser-induced graphene deposit formed on polyimide (PI). While the polyimide film is effectively smooth and featureless, laser processing results in a series of carbonized furrows that are sequentially rastered across a predefined geometric area. Representative images detailing the effect of laser ablation on the PI at 20% and 45% power are highlighted in Figure 1.
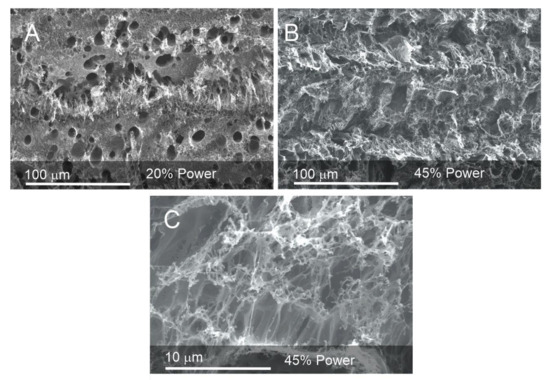
Figure 1.
Electron micrographs of the laser-induced graphene electrode deposits produced at (A) 20% and (B) 45% power. (C) Closer inspection of the morphology of the deposit formed at 45% power.
The surface of the resulting carbon deposit can be seen to be foam-like and can be attributed to the intensity of the localized heat leading to the degradation of the underlying polymer with the consequent liberation of gas raising the carbonized material. While the surface can be seen to possess a heterogenous morphology with a spectrum of porosity, closer inspection reveals a honeycomb structure that becomes more web-like as the power is increased to 45% (Figure 1C). The latter is broadly consistent with the LIG morphology observed by others [17,18,19]. The extent to which the polyimide substrate is transformed into LIG was evaluated through the use of surface profilometry. A 3 mm LIG track was scribed, and DEKTAK profilometry was conducted across the track immediately after the laser process to measure the height of the deposit. The surface profile was then repeated after sonication of the lasered polyimide to remove the carbonized LIG—essentially leaving a furrow and allowing the etch depth to be measured. The profiles for a representative sample obtained at 20% power are shown in Figure 2. The lasered profile of the LIG deposit is non-uniform and is consistent with the highly variable surface morphology observed in the electron micrographs detailed in Figure 1. There is an abundance of holes and ridges which give rise to the sharp deflections in the DEKTAK profile. These characteristics can be attributed to the nature of the ablation processes, where gaseous evolution and subsequent foaming give rise to a porous structure. The maximum height and depth of the LIG track obtained using 20% power were found to be 39.3 mm ± 2.1 mm and 13.2 mm ± 0.94 mm, respectively (n = 5). The maximum height of the 45% lasered sample was found to be 89 mm ± 5.6 mm (n = 5), with the increase in height attributed to the greater degree of ablation and subsequent foaming. It must also be noted that the pulsed nature of the laser will also contribute to the structural heterogeneity with the repeated heating/cooling process, leading to a ripple effect.
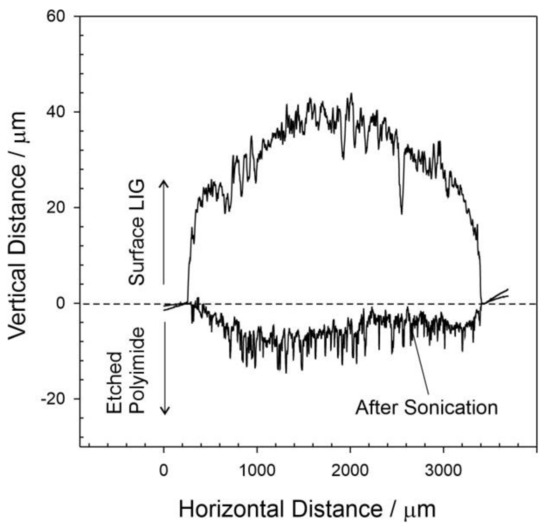
Figure 2.
DEKTAK surface profilometry of a lasered polyimide film (20% power) before and after sonication.
The conductive nature of the LIG deposit was assessed using a 4-point probe with the sheet resistance of the 20% and 45% samples found to be 58.1 ± 3.8 Ω/square and 22.6 ± 1.8 Ω/square, respectively (based on n = 5). The electrochemical properties of the LIG film were investigated using a ferrocyanide redox probe (2 mM, pH 7, 50 mV/s), and representative cyclic voltammograms are shown in Figure 3A. The LIG sample prepared using 45% power can be seen to possess a far greater capacitive background than the corresponding 20% sample, which can be attributed to the larger surface area arising from the increased graphitization of the polyimide. In the case of the 20% sample, the peak separation was found to be 60 mV (close to the Nernstian prediction for a one-electron transfer) [21,22] and stands in marked contrast to that typically observed with both homogenous carbon and composite systems. In such cases, secondary modifications such as electrochemical anodization are normally required to improve performance through defect-induced exfoliation and increased oxygen functionality at the interface [13,14,15,16,17,18,19,20,21,22,23,24,25]. The laser treatment process would appear to achieve this modification at the point at which the carbon is generated and thereby provides a procedurally simple and scalable means of generating highly active electrode surfaces. Given that the voltammetric profile observed with the 20% power sample has superior peak definition and separation, this setting was adopted for each of the subsequent experiments.
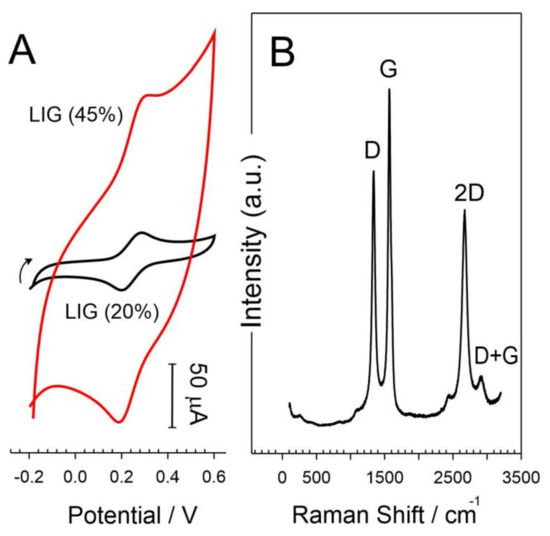
Figure 3.
(A) Cyclic voltammograms detailing the response of LIG electrodes prepared with different laser powers (20%, 45%) to ferrocyanide (2 mM, pH 7, 50 mV/s) and (B) Raman spectrum of a LIG substrate produced at a 20% power setting.
The production of carbon is supported when examining the Raman spectrum of the LIG substrate (Figure 3B), which exhibited the characteristic D, G, 2D, and the D + G peaks at 1340, 1571, 2668, and 2910 cm−1, respectively [17,26]. The D band (Raman active A1g mode) is indicative of disordered graphitic structures and is attributed to the sp3 carbon stretch vibration at the edge planes or defects present in graphene sheets. In contrast, the G band (Raman active E2g mode) is representative of the ordered graphitic structure and is attributed to the sp2 carbon stretching vibration [27,28,29,30,31]. The intensity ratio of the D and G peaks (ID/IG) for samples prepared with 20% laser power was found to be 0.87 ± 0.07 (n = 5) and can be considered to be indicative of a large concentration of defects within the laser-induced graphene sample [17,27]. The ID/IG ratio for the 45% sample dropped further to 0.52 ± 0.07 (n = 5) and can be attributed to the increased degradation of the carbonized film and corroborated by web-like morphology observed in the SEM images (Figure 1B,C). Generally, these defect sites—especially those resulting edge planes—can be highly advantageous in facilitating electron transfer, hence the Nernstian behavior observed with ferrocyanide (Figure 3A).
The 2D band at 2668 cm−1 arises through the two-photon, second-order intervalley scatter [30] and confirms the graphitization of the polyimide [17,27]. Moreover, the 2D peak FWHM was found to be 96 cm−1, which is indicative of graphene randomly stacked in the c-axis [14,26]. The I2D/IG ratio is recognized as a useful indicator of the number of graphene layers, with a ratio of 2–3 being regarded as being typical of a single layer. In this case, the ratio was 0.6 ± 0.02 (n = 5), characteristic of multilayer graphene [27].
3.2. LIG–Copper Characterization
While the laser processing of the LIG yielded a well-defined reversible voltammetric profile for ferrocyanide, there was no intrinsic response to nitrate, hence the need for electrodeposition of the copper layer. Electron micrographs of the copper layer on LIG at various deposition times are shown in Figure 4. The LIG surface provides a profusion of defects that serve as nucleation sites for the copper (Figure 4A), which leads to a fractal growth pattern (Figure 4B). Rather than forming a coherent planar coating, a nanostructured forest of tree-like appendages proliferates where the extensive branching leads to an elaborate microporous mesh.
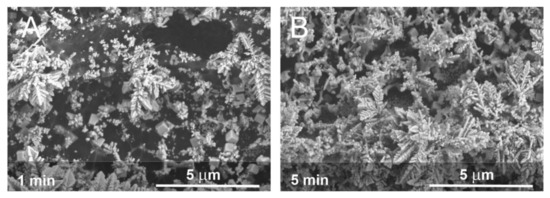
Figure 4.
Electron micrographs of the copper electrodeposited (50 mM, pH 3, −1 V) onto laser-induced graphene substrates after (A) 1 min and (B) 5 min.
The magnitude of the copper forest can be best appreciated when directly compared to the uncoated LIG, as indicated in Figure 5. In this case, half of the LIG substrate was shielded during the electrodeposition of the copper (20 min). At 20 min, the growth of the copper layer can be substantial and reaches the upper (125 μm) boundary of the recessed laminate window. A closer examination of Figure 5 reveals a series of furrows or trenches aligned along the Y direction on the LIG substrate that had previously been shielded. These are attributed to an artefact of the laser movement as it creates the LIG pattern. As the laser scans along a pre-determined line, the pulsed nature of the radiation source creates a distinct ripple-like morphology (discussed previously in relation to Figure 2). It could be anticipated that these would be absent when using a laser capable of operating in continuous mode.
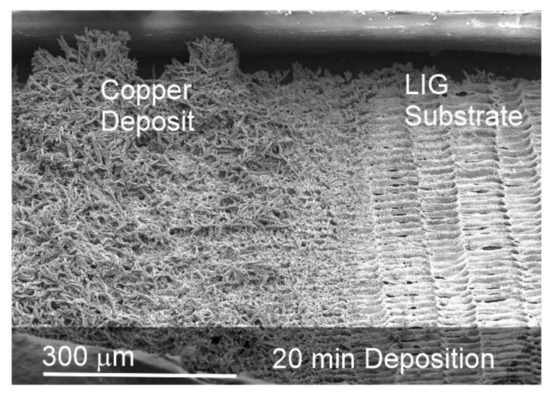
Figure 5.
Electron micrographs comparing the nature of the electrodeposited copper with the unmodified LIG substrate.
3.3. Electrochemical Response to Nitrate
Linear sweep voltammograms comparing the response of the copper-modified LIG electrode in pH 3 electrolyte before and after the addition of nitrate (196 μM) are shown in Figure 6. The addition of 196 μM (12 mg/L) nitrate was used as a model concentration through which to evaluate the LIG-Cu responses on the basis of being representative of surface water concentrations and was substantially lower than the WHO recommended limit (50 mg/L) [6].
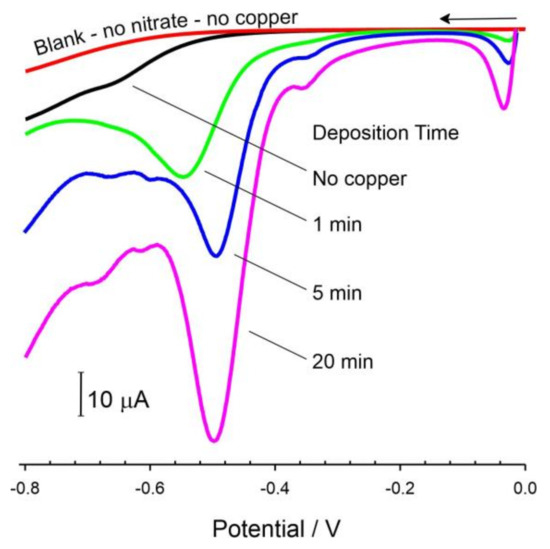
Figure 6.
Linear sweep voltammograms comparing influence of copper deposition time on the response of a LIG electrode towards nitrate (196 μM, pH 3). Scan rate: 50 mV/s.
There have been several reports on the use of metal-free amorphous graphene-based electrodes for the direct reduction of nitrate to ammonia [32,33], but, as indicated in Figure 6, unmodified LIG did not exhibit any analytical capability. In contrast, it is only upon the addition of copper deposits that nitrate could be electroanalytically quantified. The small reduction peak at −0.05 V arises from the fact that, upon commencing the scan at 0 V, some of the copper deposit is oxidatively stripped from the electrode and then redeposited as the scan progresses towards more negative potentials. It can be seen that, upon the addition of nitrate, a well-defined reduction peak process appears at −0.5 V, which is similar in position to that observed by Sookhakian et al. (2021) using a Cu-reduced graphene oxide (rGO) composite on an indium tin oxide substrate [34]. The chemical oxidation of the electrodeposited copper by nitrate was thought to be a critical process. As such, it was postulated that the voltammetric peak observed could be attributed to the reduction of the released copper ion. The validity of such a mechanism was explored further.
There was no discernible response to nitrate at the unmodified LIG electrode, and the reduction peak only appeared in the presence of the copper layer. The magnitude of the response to nitrate is mediated by the amount of copper present with increasing deposition times, increasing the size of the copper mesh (cf. Figure 4), and highlighted in the voltammograms in Figure 6. The response to nitrate was found to be linear up to 400 μM with the 20 min Cu-LIG system exhibiting Ipc (/μA) = 0.12 [NO3−/μM] + 0.468 (R2 = 0.998) with a calculated detection limit of 4.7 μM (based on 3.3 Sy, where Sy is the standard deviation of the Y/Slope). This is competitive with many of the more complex nanostructured electrode modifications reported by Sookhakian and colleagues [34] and those reviewed by Jiang et al. (2020) [3].
The electrocatalytic nitrate reduction reaction by copper is known to cascade towards the production of ammonia Equation (1), but the process is far from straightforward, involving numerous intermediates [34,35,36].
NO3− + 10 H+ + 8 e− → NH4+ + 3 H2O
Nitrite (NO2−) is one of those potential intermediates, and its formation can be attributed to the initial reaction of the nitrate with the copper deposit Equation (2) at the LIG surface.
Cu + NO3− + 2 H+ → Cu2+ + NO2− + H2O
This was corroborated by conducting a controlled electrolysis of the nitrate (196 μM NO3−) through poising the potential at −1 V and assaying aliquots of the cell solution at various time intervals. Phloroglucinol (1,3,5-trihydroxy-benzene) is known to react with acidified nitrite to yield the corresponding nitroso derivative, which gives rise to a characteristic absorption band at 312 nm [20]. This approach has been used as a sensitive, quantitative assay for nitrite with no interfering response by nitrate or copper ion. Given the electrocatalytic cascade from nitrate to ammonia Equation (1), it could be anticipated that nitrite would, at best, be transient and subsequently consumed in the process. As such, the solution was vigorously stirred during the electrolysis in an attempt to allow convection to remove the interfacial nitrite intermediate and distribute it within the solution bulk, thereby facilitating its detection. Representative spectra highlighting the response to the nitrate electrolysis samples are shown in Figure 7. The increase in absorbance at 312 nm is consistent with the production of nitrite [20]. It must be noted that there was no change in the blank phloroglucinol response when adding the nitrate solution directly (prior to the electrolysis), thereby confirming the selectivity of the assay towards electrogenerated nitrite.
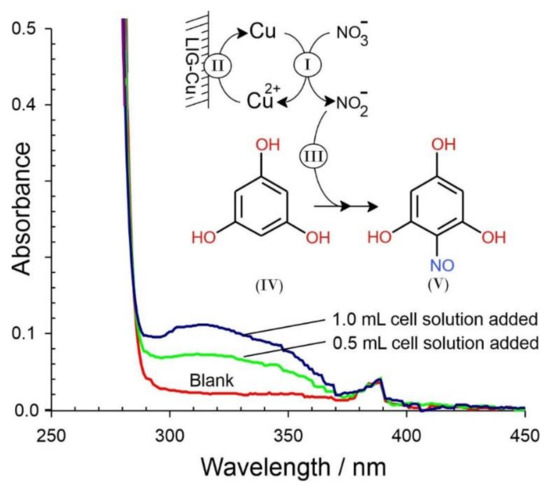
Figure 7.
Absorbance spectra detailing the capture of nitrite resulting from the electro-reduction of nitrate. Inset: Assay mechanism.
Cu-LIG electrode to additions of nitrite are detailed in Figure 8. Rather than the sharp peak observed with nitrate, the nitrite response is much broader and ill-defined. Given the fact that both nitrate and nitrite are reduced at the electrode in the same potential region, it could be levied that nitrite could be considered a potent interferent in the measurement of nitrate. However, it must be recognized that nitrite within the environment is liable to be present at significantly lower concentrations than nitrate (typically 0.1–0.21 mg/L) [6]. The relative sensitivity is another factor where the nitrate response (0.12 μA/μM) is almost three times that of the nitrite (0.041 μA/μM).
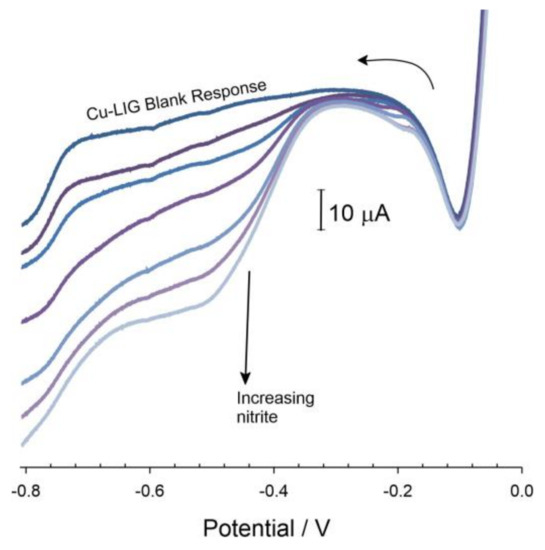
Figure 8.
Linear sweep voltammograms detailing the response of the Cu-LIG electrode towards increasing aliquots of nitrite (~0.1 mM NO2− per addition). Scan rate: 50 mV/s.
However, closer inspection of Equation (2) gives some insight into a more problematic form of interference. The re-reduction of cupric ion (Cu2+) could be considered pivotal to the peak response observed in Figure 6. It is notable that most investigations of Cu-catalyzed nitrate reduction use a fairly innocuous medium—typically pH 3 sulphuric acid/sulphate [34]. It could be envisaged that any agents present within the sample matrix that can complex Cu2+ would greatly influence the subsequent response. This hypothesis was confirmed by examining the voltammograms of the Cu-LIG electrode towards nitrate in the absence and presence of phosphate ions (Figure 9).
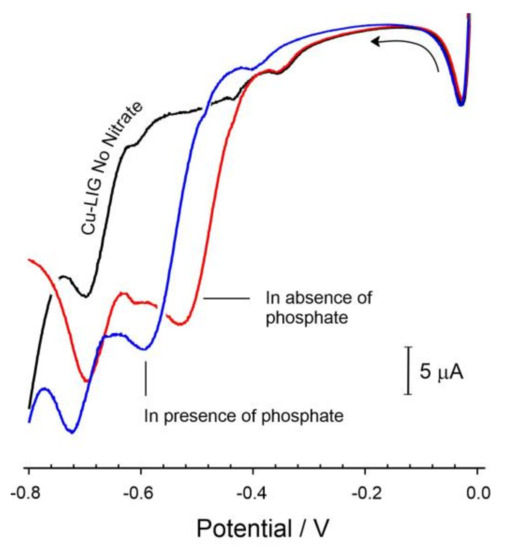
Figure 9.
Linear sweep voltammograms detailing the response of the Cu-LIG electrode towards nitrate (196 μM) before and after the addition of phosphate ion (3 mM, pH 3). Scan rate: 50 mV/s.
The position of the nitrate reduction peak was found to shift cathodically with increasing phosphate concentration (−62 mV per decade change in phosphate concentration). This could be attributed to the complexation of the phosphate with free copper ions, thereby making the reduction of the latter progressively more difficult. It should be noted that the phosphate stock was adjusted to pH 3 such that its addition would not alter the pH of the nitrate solution. As such, the shift in peak potential can be attributed unambiguously to the Cu–phosphate interaction.
3.4. Water Sample Analysis
On one level, it could have been postulated that this may serve as a method for measuring phosphate. However, it is diagnostics problematic and subject to error in real samples where other complexing agents could exert a similar effect. This was highlighted upon investigating the response of the Cu-LIG electrode in authentic natural water sources (Figure 10) subject to a myriad of microbiological processes and, hence, a spectrum of dissolved organic species capable of binding Cu2+. The voltammograms obtained from the Glencar Waterfall (County Leitrim) demonstrate that the nitrate peak has shifted cathodically by more than 80 mV compared to the peak observed in simple pH 3 electrolytes (Figure 6). Similar shifts were observed with the Tobernalt Holy Well water sample.
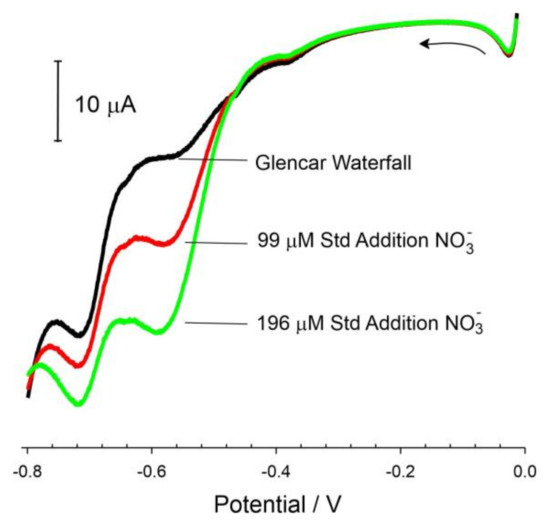
Figure 10.
Linear sweep voltammograms detailing the standard addition analysis of nitrate within water obtained from Glencar Waterfall (County Leitrim) with a Cu-LIG electrode. Scan rate: 50 mV/s.
The shift in the peak position with changes in the solution composition will prevent simple amperometric/calibration detection but remain viable where standard addition procedures are applied, and the peak positions can be unambiguously identified. This is highlighted in Figure 10, where the addition of nitrate aliquots to the Glencar water leads to an increase in the magnitude of the reduction peak. The accuracy of this standard addition system applied to both Glencar and Tobernalt Holy Well water was assessed by comparing the responses of the Cu-LIG electrode against a nitrate reductase–Griess spectroscopic assay (λ 540 nm) and the results summarized in Table 1. In both cases, excellent agreement is observed, but it is important to note that accuracy is dependent upon the acquisition of a clear peak position. Where there is an excessive amount of complexing agents present in the sample, the peak will move towards more negative potentials. The danger is that it will approach the potential where hydrogen evolution occurs, resulting in an ambiguous peak profile, which reduces the possibility of accurate quantification. This is an important caveat to nitrate sensors based on Cu catalytic deposits where voltammetric, rather than amperometric, analysis is required to ensure the integrity of the peak being measured.

Table 1.
Response comparison of the Cu-LIG electrode (n = 3) with the established spectroscopic assay (n = 6).
3.5. Performance Comparison
It is clear that the LIG-Cu substrate provides a procedurally simple means of detecting nitrate, which can operate within complex media. It is, however, necessary to consider its efficacy when compared to other composite constructions. Table 2 highlights a range of different systems along with their detection limit and the potentials applied.
Table 2.
Performance comparison of nanostructured composite electrode.
The LIG-CU system is clearly competitive with the alternative systems noted in Table 2. However, it must be noted that the fabrication approach adopted here is procedurally simpler, and the electrode pattern (i.e., shape, size) can be changed by simply altering the design prior to scribing. As such, it could be envisaged that the system could be readily adapted to a host of sensing applications but, equally, could potentially be used for nitrate remediation by changing the substrate design.
4. Conclusions
Laser-induced graphene can serve as a versatile platform for electroanalytical sensors, but the large overpotentials required for the detection of nitrate can prevent the acquisition of quantitative data. While a variety of copper nanostructures have been used in the development of nitrate sensing, the simple combination of the lasered graphene substrates with electrodeposited copper has been shown to provide a highly catalytic surface, which enhanced the reduction of nitrate. Well-resolved voltammetric peak profiles were obtained, and the analytical applicability of the approach was demonstrated through the standard addition analysis of nitrate within well water. The investigation also provided mechanistic insights into the reduction process at the electrode interface and highlighted the potential for interference caused by complexing agents that may be present within authentic samples.
Author Contributions
Conceptualization, C.S. and J.D.; methodology, J.D.; validation, C.S.; formal analysis, C.S. and V.G.; investigation, C.S. and V.G.; data curation, C.S.; writing—original draft preparation, J.D.; writing—review and editing, C.S., V.G., J.D. and K.M.; supervision, J.D. and K.M.; project administration, J.D.; funding acquisition, J.D. and K.M. All authors have read and agreed to the published version of the manuscript.
Funding
This research was funded by the Department of the Economy, Northern Ireland.
Data Availability Statement
Research data are available on request to the corresponding author.
Conflicts of Interest
The authors declare no conflict of interest.
References
- Singh, S.; Anil, A.G.; Kumar, V.; Kapoor, D.; Subramanian, S.; Singh, J.; Ramamurthy, P.C. Nitrates in the environment: A critical review of their distribution, sensing techniques, ecological effects and remediation. Chemosphere 2022, 287, 131996. [Google Scholar] [CrossRef] [PubMed]
- Patel, N.; Srivastav, A.L.; Patel, A.; Singh, A.; Singh, S.K.; Chaudhary, V.K.; Singh, P.K.; Bhunia, B. Nitrate contamination in water resources, human health risks and its remediation through adsorption: A focused review. Environ. Sci. Pollut. Res. 2022, 29, 69137–69152. [Google Scholar] [CrossRef] [PubMed]
- Jiang, C.; He, Y.; Liu, Y. Recent advances in sensors for electrochemical analysis of nitrate in food and environmental matrices. Analyst 2020, 145, 5400–5413. [Google Scholar] [CrossRef] [PubMed]
- Flores, M.; Toldrá, F. Chemistry, safety, and regulatory considerations in the use of nitrite and nitrate from natural origin in meat products. Meat Sci. 2021, 171, 108272. [Google Scholar] [CrossRef] [PubMed]
- Majou, D.; Christieans, S. Mechanisms of the bactericidal effects of nitrate and nitrite in cured meats. Meat Sci. 2018, 145, 273–284. [Google Scholar] [CrossRef] [PubMed]
- Nitrate and Nitrite in Drinking-Water. Background Document for Development of WHO Guidelines for Drinking-Water Quality. World Health Organization. 2003. Available online: https://apps.who.int/iris/bitstream/handle/10665/75380/WHO_SDE_WSH_04.03_56_eng.pdf (accessed on 30 May 2023).
- Tan, J.D.; Anastasi, A.; Chandra, S. Electrochemical detection of nitrate, nitrite and ammonium for on-site water quality monitoring. Curr. Opin. Electrochem. 2022, 32, 100926. [Google Scholar] [CrossRef]
- Amali, R.; Lim, H.; Ibrahim, I.; Huang, N.; Zainal, Z.; Ahmad, S. Significance of nanomaterials in electrochemical sensors for nitrate detection: A review. Trends Environ. Anal. Chem. 2021, 31, e00135. [Google Scholar] [CrossRef]
- Mahmud, M.A.P.; Ejeian, F.; Azadi, S.; Myers, M.; Pejcic, B.; Abbassi, R.; Razmjou, A.; Asadnia, M. Recent progress in sensing nitrate, nitrite, phosphate, and ammonium in aquatic environment. Chemosphere 2020, 259, 127492. [Google Scholar] [CrossRef]
- Li, D.; Wang, T.; Li, Z.; Xu, X.; Wang, C.; Duan, Y. Application of Graphene-Based Materials for Detection of Nitrate and Nitrite in Water—A Review. Sensors 2020, 20, 54. [Google Scholar] [CrossRef]
- Marlinda, A.R.; An’amt, M.N.; Yusoff, N.; Sagadevan, S.; Wahab, Y.A.; Johan, M.R. Recent progress in nitrates and nitrites sensor with graphene-based nanocomposites as electrocatalysts. Trends Environ. Anal. Chem. 2022, 34, e00162. [Google Scholar] [CrossRef]
- Kim, M.-Y.; Lee, K.H. Electrochemical Sensors for Sustainable Precision Agriculture—A Review. Front. Chem. 2022, 10, 848320. [Google Scholar] [CrossRef]
- Yin, H.; Cao, Y.; Marelli, B.; Zeng, X.; Mason, A.J.; Cao, C. Soil Sensors and Plant Wearables for Smart and Precision Agriculture. Adv. Mater. 2021, 33, 2007764. [Google Scholar] [CrossRef] [PubMed]
- Gutiérrez-Cruz, A.; Ruiz-Hernández, A.R.; Vega-Clemente, J.F.; Luna-Gazcón, D.G.; Campos-Delgado, J. A review of top-down and bottom-up synthesis methods for the production of graphene, graphene oxide and reduced graphene oxide. J. Mater. Sci. 2022, 57, 14543–14578. [Google Scholar] [CrossRef]
- Choi, S.H.; Yun, S.J.; Won, Y.S.; Oh, C.S.; Kim, S.M.; Kim, K.K.; Lee, Y.H. Large-scale synthesis of graphene and other 2D materials towards industrialization. Nat. Commun. 2022, 13, 1484. [Google Scholar] [CrossRef]
- Zhang, Y.; Huang, D.; Duan, Y.; Chen, H.; Tang, L.; Shi, M.; Li, Z.; Shi, H. Batch production of uniform graphene films via controlling gas-phase dynamics in confined space. Nanotechnology 2021, 32, 105603. [Google Scholar] [CrossRef]
- Lin, J.; Peng, Z.; Liu, Y.; Ruiz-Zepeda, F.; Ye, R.; Samuel, E.L.G.; Yacaman, M.J.; Yakobson, B.I.; Tour, J.M. Laser-induced porous graphene films from commercial polymers. Nat. Commun. 2014, 5, 5714. [Google Scholar] [CrossRef] [PubMed]
- Chyan, Y.; Ye, R.; Li, Y.; Singh, S.P.; Arnusch, C.J.; Tour, J.M. Laser-Induced graphene by multiple lasing: Toward electronics on cloth, paper, and food. ACS Nano 2018, 12, 2176–2183. [Google Scholar] [CrossRef] [PubMed]
- Barber, R.; Cameron, S.; Devine, A.; McCombe, A.; Pourshahidi, L.K.; Cundell, J.; Roy, S.; Mathur, A.; Casimero, C.; Papakonstantinou, P.; et al. Laser induced graphene sensors for assessing pH: Application to wound management. Electrochem. Commun. 2021, 123, 106914. [Google Scholar] [CrossRef]
- Karousos, N.; Chong, L.C.; Ewen, C.; Livingstone, C.; Davis, J. Evaluation of a multifunctional indicator for the electroanalytical determination of nitrite. Electrochim. Acta 2005, 50, 1879–1884. [Google Scholar] [CrossRef]
- Pletcher, D. A First Course in Electrode Processes; The Electrochemical Consultancy: Romsey, UK, 1991. [Google Scholar]
- Compton, R.G.; Banks, C.E. Understanding Voltammetry, 2nd ed.; Imperial College Press: London, UK, 2011. [Google Scholar]
- Casimero, C.; Hegarty, C.; McGlynn, R.J.; Davis, J. Ultrasonic exfoliation of carbon fiber: Electroanalytical perspectives. J. Appl. Electrochem. 2020, 50, 383–394. [Google Scholar] [CrossRef]
- Kava, A.A.; Henry, C.S. Exploring carbon particle type and plasma treatment to improve electrochemical properties of stencil-printed carbon electrodes. Talanta 2021, 221, 121553. [Google Scholar] [CrossRef]
- Pankratova, G.; Pan, J.Y.; Keller, S.S. Impact of plasma-induced surface chemistry on electrochemical properties of microfabricated pyrolytic carbon electrodes. Electrochim. Acta 2022, 410, 139987. [Google Scholar] [CrossRef]
- Ferrari, A.C.; Meyer, J.C.; Scardaci, V.; Casiraghi, C.; Lazzeri, M.; Mauri, F.; Piscanec, S.; Jiang, D.; Novoselov, K.S.; Roth, S.; et al. Raman spectrum of graphene and graphene layers. Phys. Rev. Lett. 2006, 97, 187401. [Google Scholar] [CrossRef]
- Nguyen, V.T.; Le, H.D.; Ngo, T.T.T.; Le, D.Q.; Nguyen, X.N.; Phan, N.M. Synthesis of multi-layer graphene films on copper tape by atmospheric pressure chemical vapor deposition method. Adv. Nat. Sci. Nanosci. Nanotechnol. 2013, 4, 035012. [Google Scholar] [CrossRef]
- Rosenburg, F.; Ionescu, E.; Nicoloso, N.; Riedel, R. High-Temperature Raman Spectroscopy of Nano-Crystalline Carbon in Silicon Oxycarbide. Materials 2018, 11, 93. [Google Scholar] [CrossRef]
- Gao, Z.; Zhu, J.; Rajabpour, S.; Joshi, K.; Kowalik, M.; Croom, B.; Schwab, Y.; Zhang, L.; Bumgardner, C.; Brown, K.R.; et al. Graphene reinforced carbon fibers. Sci. Adv. 2020, 6, eaaz4191. [Google Scholar] [CrossRef]
- Childres, I.; Jauregui, L.A.; Park, W.; Caoa, H.; Chena, Y.P. Raman Spectroscopy of Graphene and Related Materials. In New Developments in Photon and Materials Research; Nova Science Publishers Inc.: New York, NY, USA, 2013; pp. 403–418. [Google Scholar]
- Duy, L.X.; Peng, Z.; Li, Y.; Zhang, J.; Ji, Y.; Tour, J.M. Laser-induced graphene fibers. Carbon 2018, 126, 472–479. [Google Scholar] [CrossRef]
- Huang, L.; Cheng, L.; Ma, T.; Zhang, J.; Wu, H.; Su, J.; Song, Y.; Zhu, H.; Liu, Q.; Zhu, M.; et al. Direct Synthesis of Ammonia from Nitrate on Amorphous Graphene with Near 100% Efficiency. Adv. Mater. 2023, 35, e2211856. [Google Scholar] [CrossRef] [PubMed]
- Cheng, L.; Ma, T.; Zhang, B.; Huang, L.; Guo, W.; Hu, F.; Zhu, H.; Wang, Z.; Zheng, T.; Yang, D.-T.; et al. Steering the Topological Defects in Amorphous Laser-Induced Graphene for Direct Nitrate-to-Ammonia Electroreduction. ACS Catal. 2022, 12, 11639–11650. [Google Scholar] [CrossRef]
- Sookhakian, M.; Teridi, M.A.M.; Tong, G.B.; Woi, P.M.; Khalil, M.; Alias, Y. Reduced Graphene Oxide/Copper Nanoparticle Composites as Electrochemical Sensor Materials for Nitrate Detection. ACS Appl. Nano Mater. 2021, 4, 12737–12744. [Google Scholar] [CrossRef]
- Chen, J.-Q.; Ye, X.-X.; Zhou, D.; Chen, Y.-X. Roles of Copper in Nitrate Reduction at Copper-Modified Ru/C Catalysts. J. Phys. Chem. C 2023, 127, 2918–2928. [Google Scholar] [CrossRef]
- Li, X.; Zhao, X.; Lv, J.; Jia, X.; Zhou, S.; Huang, Y.; Chang, F.; Zhang, H.; Hu, G. Self-supported porous copper oxide nanosheet arrays for efficient and selective electrochemical conversion of nitrate ions to nitrogen gas. J. Mater. Sci. Technol. 2023, 137, 104–111. [Google Scholar] [CrossRef]
- Pasarakonda, S.L.; Ponnada, S.; Gorle, D.B.; Bose, R.S.C.; Palariya, A.; Kiai, M.S.; Gandham, H.B.; Kathiresan, M.; Sharma, R.K.; Nowduri, A. On the role of graphene oxide in bifunctional Ni/MOF/rGO composites in electrochemical nitrate detection and oxygen evolution reaction. New J. Chem. 2023, 47, 725–736. [Google Scholar] [CrossRef]
- Zhad, H.R.L.Z.; Lai, R.Y. Comparison of nanostructured silver-modified silver and carbon ultramicroelectrodes for electrochemical detection of nitrate. Anal. Chim. Acta 2015, 892, 153–159. [Google Scholar] [CrossRef]
- Li, Y.; Han, H.; Pan, D.; Zhang, P. Fabrication of a Micro-Needle Sensor Based on Copper Microspheres and Polyaniline Film for Nitrate Determination in Coastal River Waters. J. Electrochem. Soc. 2019, 166, B1038–B1043. [Google Scholar] [CrossRef]
- Garland, N.T.; McLamore, E.S.; Cavallaro, N.D.; Mendivelso-Perez, D.; Smith, E.A.; Jing, D.; Claussen, J.C. Flexible Laser-Induced Graphene for Nitrogen Sensing in Soil. ACS Appl. Mater. Inter. 2018, 10, 39124–39133. [Google Scholar] [CrossRef] [PubMed]
Disclaimer/Publisher’s Note: The statements, opinions and data contained in all publications are solely those of the individual author(s) and contributor(s) and not of MDPI and/or the editor(s). MDPI and/or the editor(s) disclaim responsibility for any injury to people or property resulting from any ideas, methods, instructions or products referred to in the content. |
© 2023 by the authors. Licensee MDPI, Basel, Switzerland. This article is an open access article distributed under the terms and conditions of the Creative Commons Attribution (CC BY) license (https://creativecommons.org/licenses/by/4.0/).