Article

Automated Characterization of the Ply Stacking Sequence of a Woven Carbon Fiber Composite Using Pulse-Echo Ultrasound

by
Nathaniel J. Blackman
and
David A. Jack
*
Department of Mechanical Engineering, Baylor University, Waco, TX 76706, USA
*
Author to whom correspondence should be addressed.
J. Compos. Sci. 2023, 7(9), 398; https://doi.org/10.3390/jcs7090398
Submission received: 29 July 2023 / Revised: 13 September 2023 / Accepted: 18 September 2023 / Published: 20 September 2023

Abstract

:
Carbon fiber composites are a popular design material due to their high specific strength. The directional strength of woven composites can be customized by changing the orientation and sequencing of individual lamina within the ply stack. This allows for the potential of specialized parts designed for specific applications, leading to both performance gains and weight savings. One challenge is the ability to characterize non-destructively the orientations of the individual lamina after the manufacturing process. Current industrial methods used to verify the ply stack are destructive to the part, increasing costs and material waste. This creates the need for a non-destructive technique capable of determining the ply stack, both for quality control and for in-service parts, including when there may be access to just a single side of the composite. This research introduces a procedure to scan a fabricated laminated composite using pulse-echo ultrasound coupled with an automated algorithm to determine the layer-by-layer orientation of the ply stack with a specific focus on woven composites. In this work, 12 unique plain-weave laminates ranging from 3 lamina to 18 lamina thick are studied. The orientations of each stacking sequence are different, with some following standard composite design methodologies and others randomly stacked. The mathematical technique presented in this work correctly characterizes non-destructively the orientation of each individual lamina to within 1° with 73% confidence and to within 3° with 98.3% confidence of the as-manufactured orientation.

1. Introduction

Carbon fiber composites are a highly desirable design material in a variety of industries due to their high specific strength. Laminated carbon-fiber-reinforced composites also benefit from the ability to align the strength along preferential loading paths based on the specific application. The final properties of the as-manufactured laminate are highly sensitive both to the number of plies and to the orientation of the plies [1,2,3,4,5]. It is then imperative that the composites be manufactured as designed and that techniques be developed that can inspect the as-manufactured ply stack without the destruction of the composite.
Several non-destructive techniques have been presented to determine the lamina fiber orientation in composites, such as visual analysis during the manufacturing process [6], eddy current of thin carbon composites with unidirectional lamina [7,8], and terahertz to determine the total stacking sequence [9]. These methods complement the presented technique but, respectively, are not able to inspect parts post-manufacture, inspect thicker composites, or determine individual lamina orientation. Two non-destructive techniques have shown particular promise in determining the lamina fiber orientation: ultrasound [10,11,12,13,14,15,16] and X-ray CT [17,18,19,20]. X-ray CT methods, although quite effective in capturing the internal microstructure of a composite, are limited in application due to challenges in scanning large components, safety considerations, and the significant capital investment costs required for the necessary equipment.
By contrast, ultrasound is considered to be relatively low-cost [21] and is one of the most popular non-destructive techniques [22]. It has proven to be a promising technology for the inspection of composites to identify manufacturing defects [23,24,25], such as foreign objects, quantify damage [26,27,28,29], and even evaluate adhesive bondlines [30,31,32,33]. In contrast to the works in identifying local changes in orientation for a thin unidirectional composite, such as the work by Mizukami et al. [8], this work is focused on thicker composite stacks and identifying a layer-by-layer characterization of the ply orientation. In addition, works that identify out-of-plane misalignment, such as that caused by impact damage, as shown in Yang et al. [29], are out of the scope of this study. This study focuses on the orientation characterization in the plane of the ply layup.
In the work by Smith and Clarke [10], a 20 MHz contact ultrasound probe was used to inspect the orientation of unidirectional composites. They demonstrate both manual and automated scanning techniques and show the ability to distinguish ply orientations of 0°, ±45°, and 90° when combined with a careful gating of the ultrasonic signal. They extended the work to include parts scanned with a painted coating and with layers of a copper mesh, and they demonstrated the additional layers did not impact the ability to determine ply orientation for a unidirectional composite laminate. Their method did struggle when multiple layers had the same orientation or when multiple layers alternated through the same two orientations, i.e., a sequence of [0/45/0/45].
Hsu et al. [11] demonstrated that shear wave ultrasonics can be used to detect errors in ply orientation layup using a differential measurement against the properly made sample. Using the angular dependence of the shear wave, they were able to generate a “fingerprint” for a laminate and then determine when a laminate has misaligned plies. Their method was demonstrated on unidirectional laminates of 24 and 48 ply thicknesses. In a successive work, Im et al. [13] developed a simplified ply-by-ply vector decomposition to qualitatively identify misaligned plies. They provide comparisons between modeled scan results and experimental results for different quasi-isotropic ply stacks that show strong agreement. The above works by Hsu et al. and Im et al. are helpful for determining the existence of misaligned plies in a laminate, but both are limited to the use of unidirectional laminates and do not quantify which plies are misoriented.
Hsu et al. [12] used the two-dimensional Fourier transform on the ultrasonic data of unidirectional carbon fiber composites to determine ply orientation. Their work utilized a 20 MHz and 50 MHz transducer to scan the composites. By gating the ultrasonic signal at the interface between two laminae, they found that the orientations of both the lamina below and above the interface were present in the data. They distinguish the two orientations by summing the amplitudes for respective angles of the transformed data. The angle with the highest summed amplitude was taken to be the predicted orientation of the lamina. They presented results for a 16-ply laminate where their method correctly predicts the orientation of all interior laminates while failing to predict the first and last layers’ orientations. Their work focused on laminae oriented at 0°, ±45°, and 90° and included a small study demonstrating the potential to predict orientations of 0°, 2°, 5°, 10°, 15°, and 20°.
Expanding on the work in [12], Smith and Nelson [14] utilized a two-dimensional fast Fourier transform method to determine ply orientation for unidirectional composites. They advanced the state of the art by presenting results for determining the weave type for the fabric present in non-unidirectional carbon fiber composites using ultrasound data. In [34], Smith further developed the methodology for determining ply orientation in unidirectional composites and proposed guidelines for acquiring ultrasound data and a method for automated analysis.
Nelson and Smith [16] presented a different technique for determining the ply orientation of unidirectional composites through the use of the Radon transform. Their work only examines a laminate with orientations of 0°, ±45°, and 90°. The Hilbert transform was used to help determine ply interfaces and is coupled with the orientation data provided by the Radon transform. Recent work in the literature has focused on improving the signal quality of the captured ultrasonic waveform near the front and back surfaces of the part. For example, Yang et al. [35] provide an approach using advanced filtering and reconstruction to provide a better quantification of the individual ply thicknesses. Similarly, Zilidou et al. [36] use a simulation to generate the expected signal for a given laminate structure and subtract this signal from the physical signal to better represent changes near the front and back surfaces caused by defects.
The work presented in this paper advances the works of Smith and Clark [10], Hsu et al. [12], and Nelson and Smith [16] as it provides a method for determining the ply orientation of woven carbon fiber composites. This work uses a custom ultrasonic immersion C-scan system to scan carbon fiber laminates using a 15 MHz transducer. The laminates scanned are not limited in their layup to being balanced or symmetric. This work extends the earlier works by focusing on woven laminates, and instead of binning the allowed orientations into a prescribed set of orientations of 0°, 45°, and 90°, the presented method quantifies the orientation to within 3° with a 98.3% confidence of the as-manufactured composite. This work does not use any knowledge of the part a priori in the analysis.
The irregular ply stacks used in this study are selected to highlight the expanded capabilities of the technique and further study the ability of such techniques to identify subtle variations within the ply orientation stack. Another uniqueness is the ability to automatically extract the orientation for each individual lamina and report the orientation as a function of lamina depth. An algorithm is presented that makes use of the 2D FFT to determine the ply orientation and the effectiveness is demonstrated on 12 different laminates ranging from 3 plies to 18 plies totaling 117 unique laminae. The presented automated technique characterized the orientation within ±3° over 98% of the time over those 117 laminae and correctly characterized the number of laminae in each part for every single part analyzed.

2. Materials and Methods

2.1. Composite Fabrication

In an earlier study by the authors and their collaborators, over 500 carbon fiber specimens were fabricated using 3 K, 203 gsm (6 oz.) plain-weave carbon fiber from ACP Composites (Livermore, CA, USA) as part of a larger study for an FAA certification (see [37] for more details on the expanded study). This present study makes use of 12 specimens selected from the larger set. A total of 4 different composite thicknesses are studied with 3 unique laminates fabricated in-house from each thickness of 3-ply, 6-ply, 12-ply, and 18-ply laminates. Laminae were cut with the use of a projected overhead grid using calibration patterns that project grids for different angles onto the carbon fiber fabric prior to the markup of the dry fabric. The ply stack for each lamina is provided in Table 1. It is noted that the ply stacks of the laminates studied are chosen to not be exclusively balanced and symmetric, nor are the laminates exclusively quasi-isotropic. This selection encompasses previous studies as well as expanding the application space to a broader range of composites. This blend of standard and non-standard panels is selected to highlight the effectiveness and versatility of the introduced method. The vacuum-assisted resin transfer method (VARTM) is used to infuse a Proset INF 114 resin and Proset 211 hardener mixture, and the laminates are cured according to the manufacturer’s recommended cure cycle with an 8 h hold at room temperature for gelation and an elevated temperature cure of 8 h at 80 °C. After the completion of the cure cycle, six samples are cut from each laminate to a nominal size of 76.2 mm × 76.2 mm (3 in × 3 in); two of the samples are used in this study, with the remaining samples reserved for a future investigation.

2.2. Burn Testing and Ply Orientation Validation
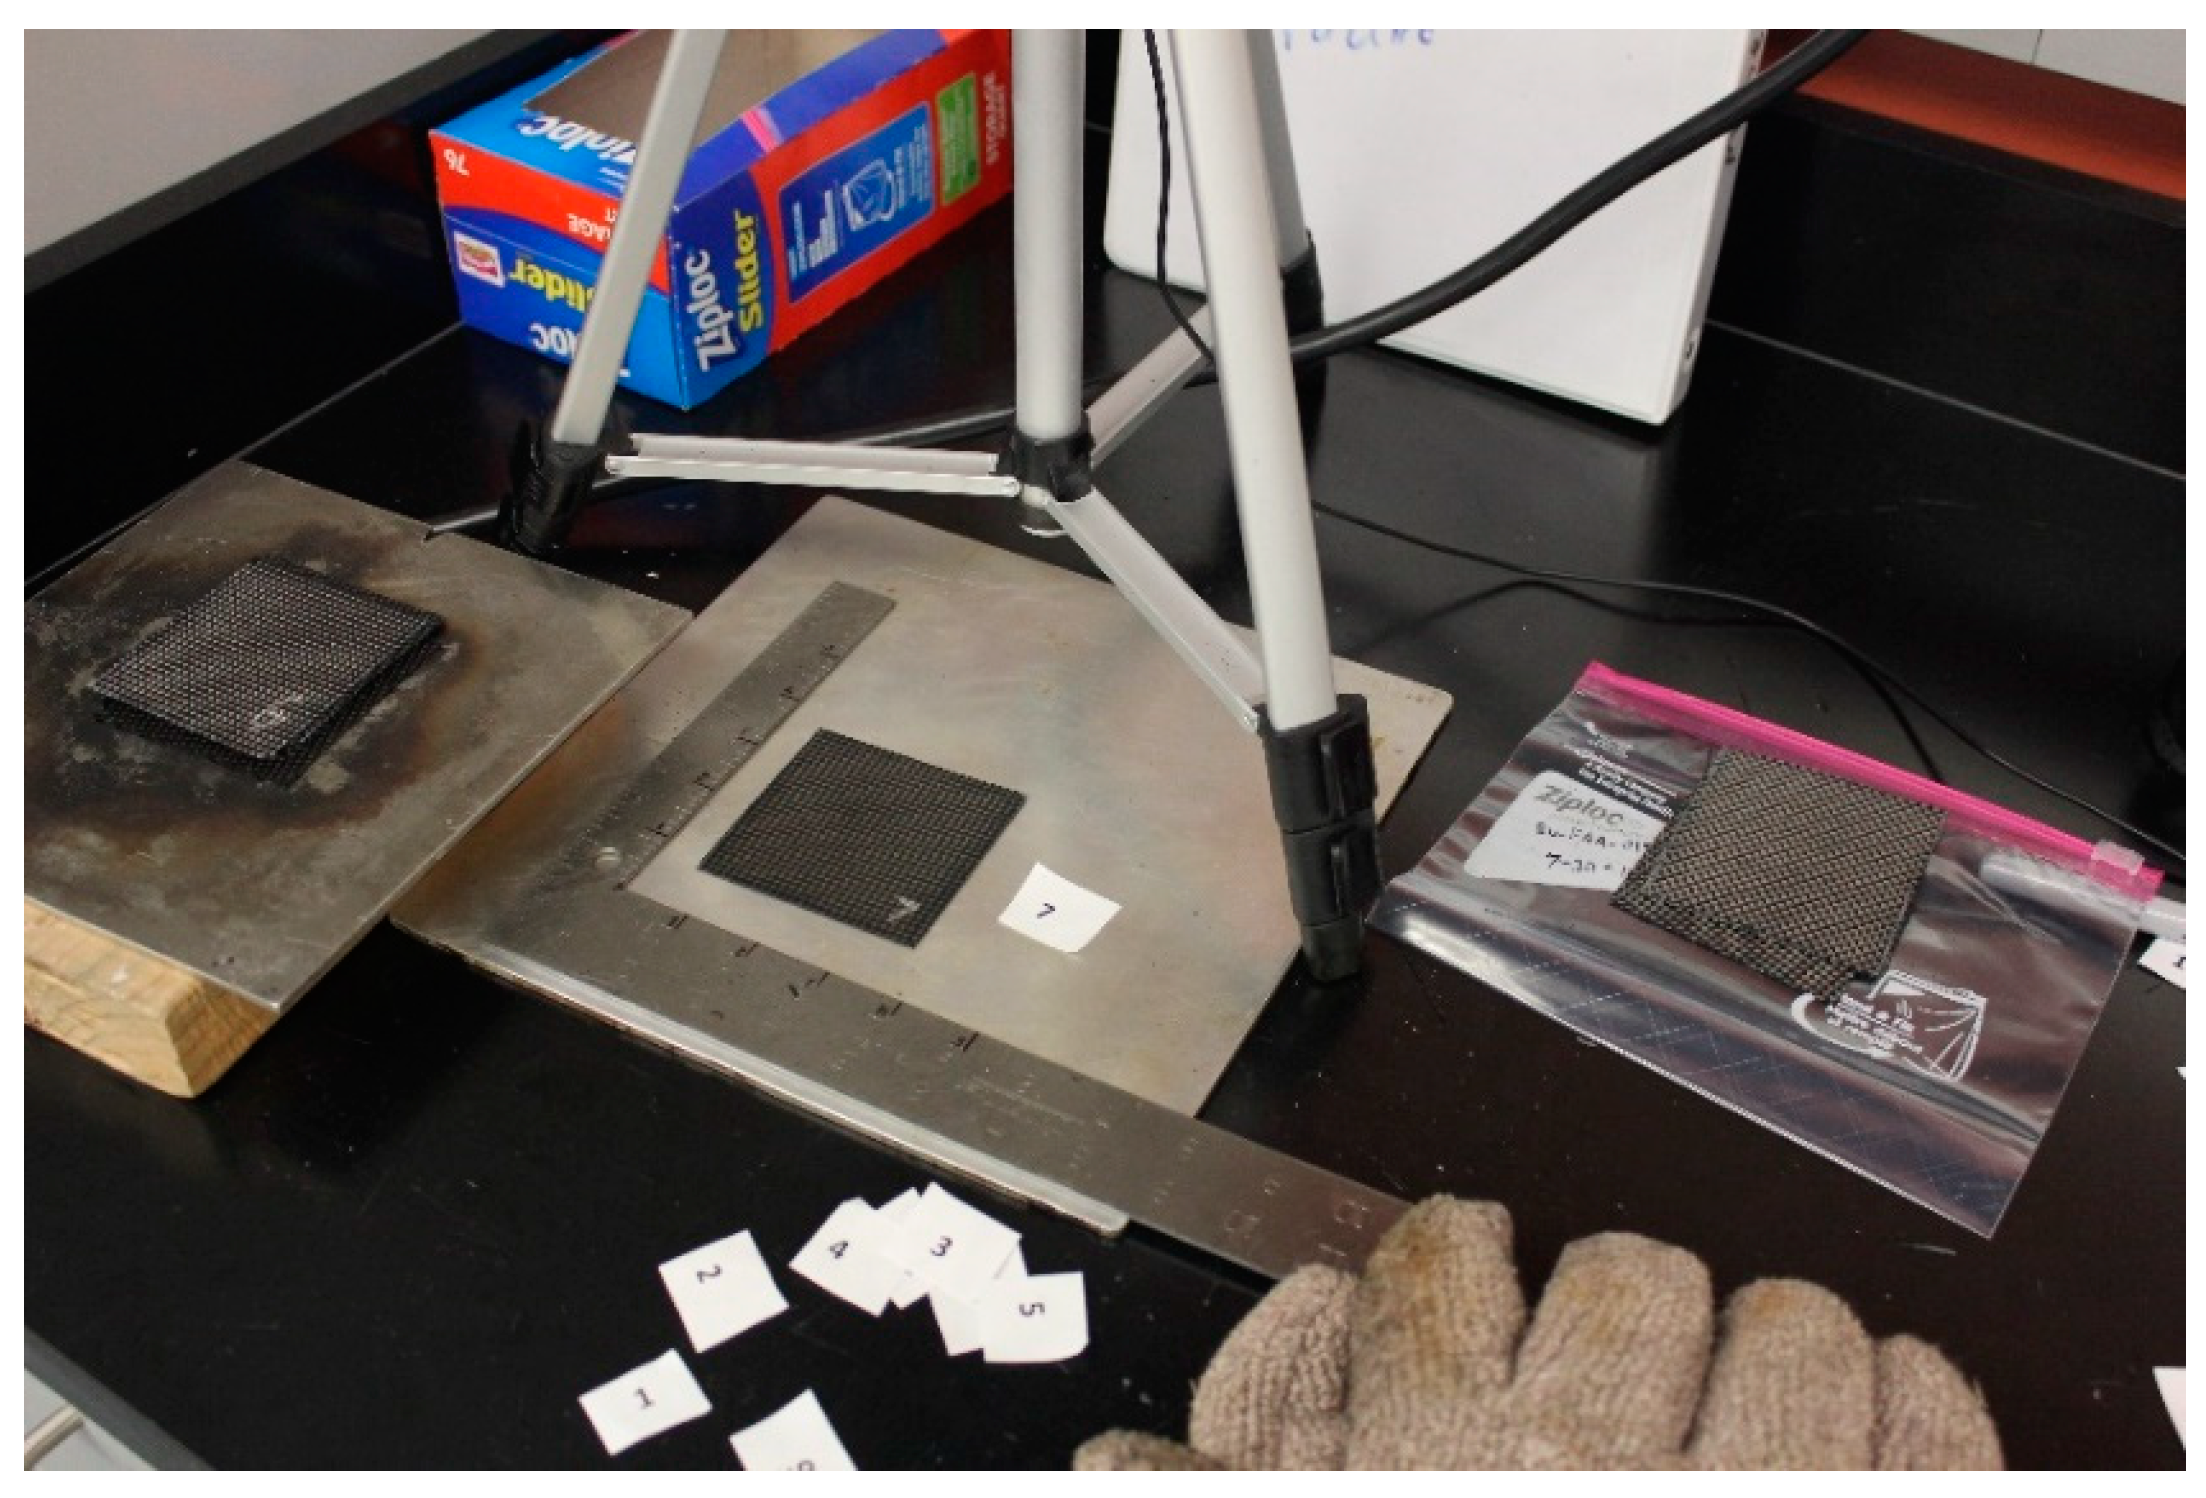
To validate the orientation of all parts within the larger study, one of the samples was used as a witness sample and subjected to a burn test and layer-by-layer microscopy to quantify the as-manufactured ply orientation. The burn testing procedure comprises three steps: placing the composite specimen in a furnace at an elevated temperature, causing the resin to burn off and leaving the underlying fibers; imaging each ply within the laminate using a calibrated overhead camera system; and post-processing the images in the MATLAB (2021a version) environment using custom codes to determine the true orientation of each ply within the laminate. Each witness sample was placed in a furnace on an aluminum plate for twenty minutes at 500 °C to burn off the resin; this provided sufficient time to remove all but nominal amounts of the resin while not causing appreciable decomposition of the carbon fibers. The presented approach is not intended to provide a means to quantify the volume fraction of fibers. That would require an inert atmosphere or the acid digestion method outlined in ASTM D3171, as carbon fibers are susceptible to progressive oxidation outside of an inert gas environment. Thermal digestion in atmosphere is used in this study to remove the resin sufficiently to allow for the individual lamina to be separated while maintaining sufficient rigidity of the individual lamina so as not to disassemble along the individual carbon fiber tows. Figure 1 shows the setup used to capture the images of the plies used to determine orientation. A square was placed within the image to provide a reference orientation, and a digital camera was aligned directly over the composite to minimize any potential angle distortions.
Although the samples were 76.2 mm × 76.2 mm (3 in × 3 in) and square prior to thermal digestion, once the resin binder was removed, the plies could shift slightly during handling, changing their dimensions and shape. The analysis code allows for the quantification of the ply orientation for fabric squares that became misaligned. This is achieved by using the square in the image as the reference frame and then using 3 corners of the ply in the image to map the rotation needed to create a coordinate transformation and skewing to map the ply back to a square. The user then determines ply orientation by selecting multiple points along an individual tow of the ply. In the case that three or more points are clicked along a tow, a linear best fit is used to determine the orientation. Table 2 shows the true orientation for every ply of every part within this study. In total, of the 117 plies analyzed, only 2 plies are more than ±3° off the designed orientation, ply 6 of part 6A and ply 12 of part 12C, both of which are 4° from the as-designed orientation. Note that the plain weave pattern repeats every 90°; thus, ply 12 of part 18C with a value of 89° is only considered to be off by 1° of the as-designed orientation of 0°.

2.3. Scanning Setup

A custom C-scan immersion system filled with the available tap water is utilized to scan each laminate. The scanner was designed and built in-house with commercial off-the-shelf components. An Olympus Focus PX pulser/receiver (Olympus, Breiningsville, PA, USA) is used to excite a spherically focused 15 MHz Accuscan transducer from Olympus and then capture the data in a pulse-echo configuration aligned orthogonal to the surface. The transducer has an element size of 6.35 mm (1/4 in.) and a focal length of 37.03 mm (1.46 in.). The transducer’s measured peak frequency is 15 MHz, with a true center frequency of 14.43 MHz and a −6 dB frequency bandwidth between 9.11 MHz and 19.75 MHz. The transducer was driven with a 190 V negative square wave pulse with a duration of 30 ns. The gain for each scan is set such that the front wall of the part is slightly saturated to compensate for the high attenuation of the ultrasonic signal as it passes through the laminate. For the case of the 18 laminae parts, time-corrected gain (TCG) is utilized, where a linear gain was applied across the part from the front wall to the back wall such that the back wall has an amplitude of 20% to 30% of saturation. The transducer is translated spatially in a raster pattern using BiSlide translation systems from Velmex (Bloomfield, NY, USA), and ultrasonic scans are collected every 0.2 mm over a 50 mm × 50 mm scan area roughly in the center of the fabricated coupon. Once the scan is complete, the scan data is exported to the MATLAB environment for further analysis.

3. Analysis

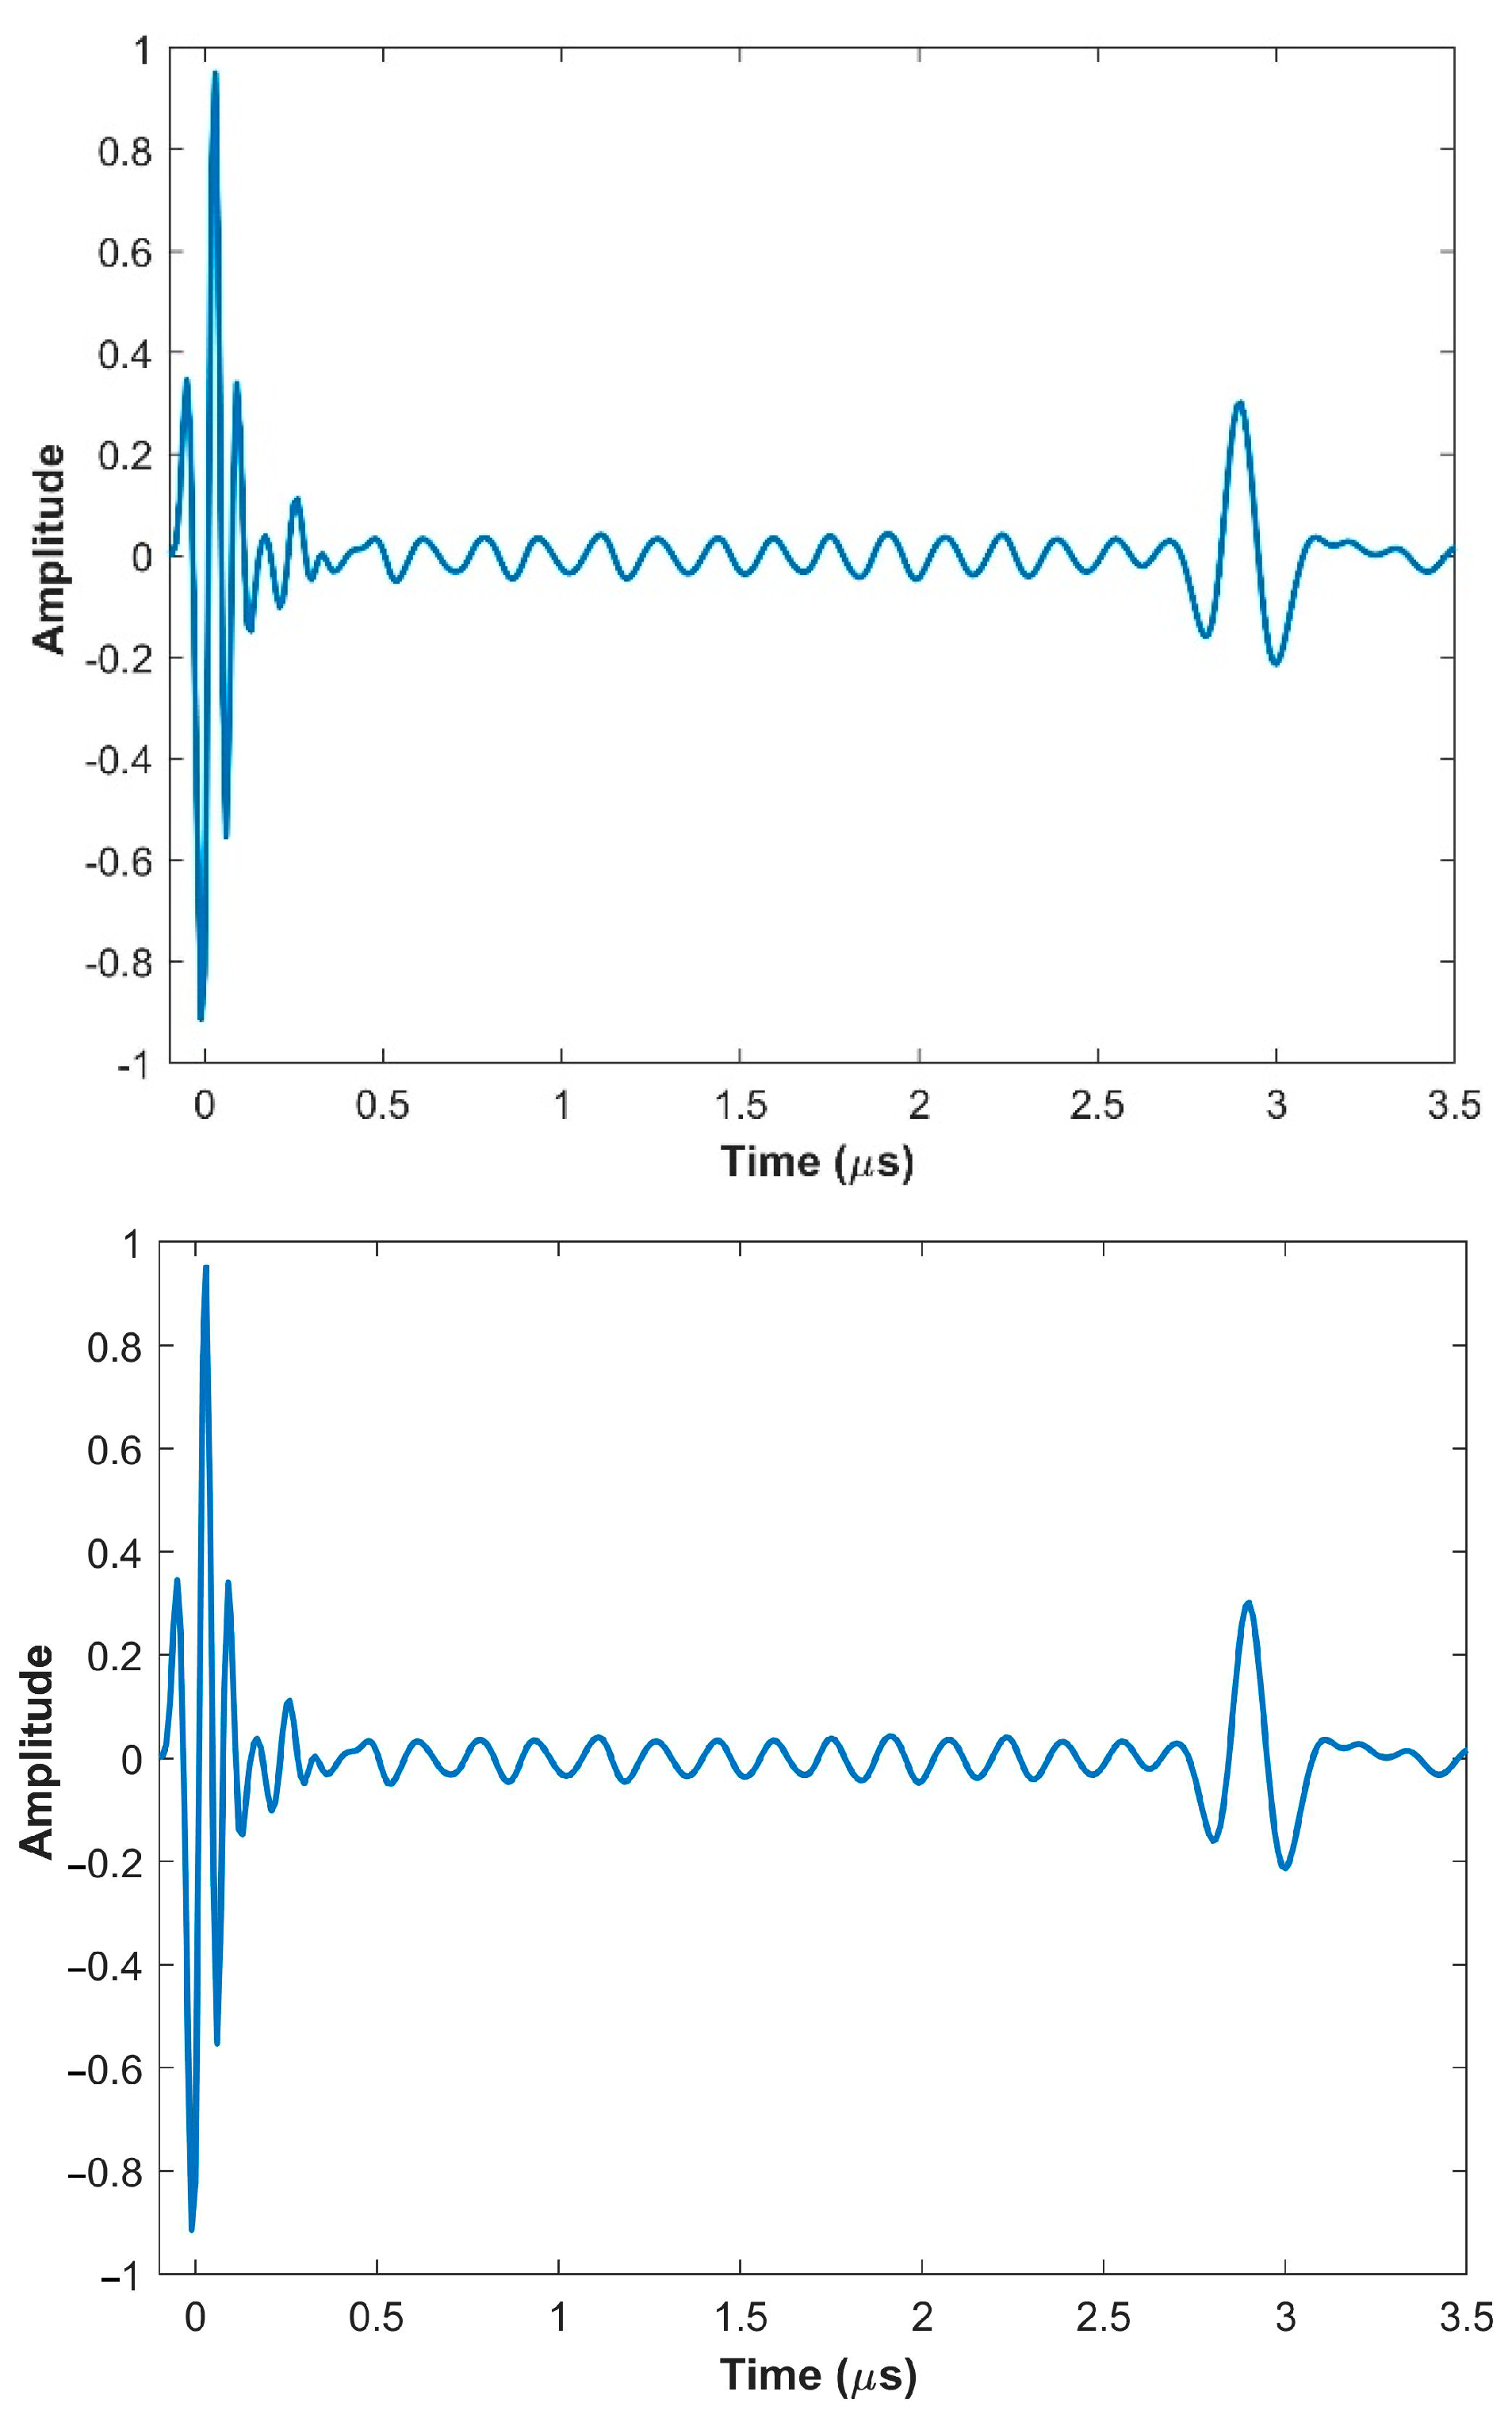
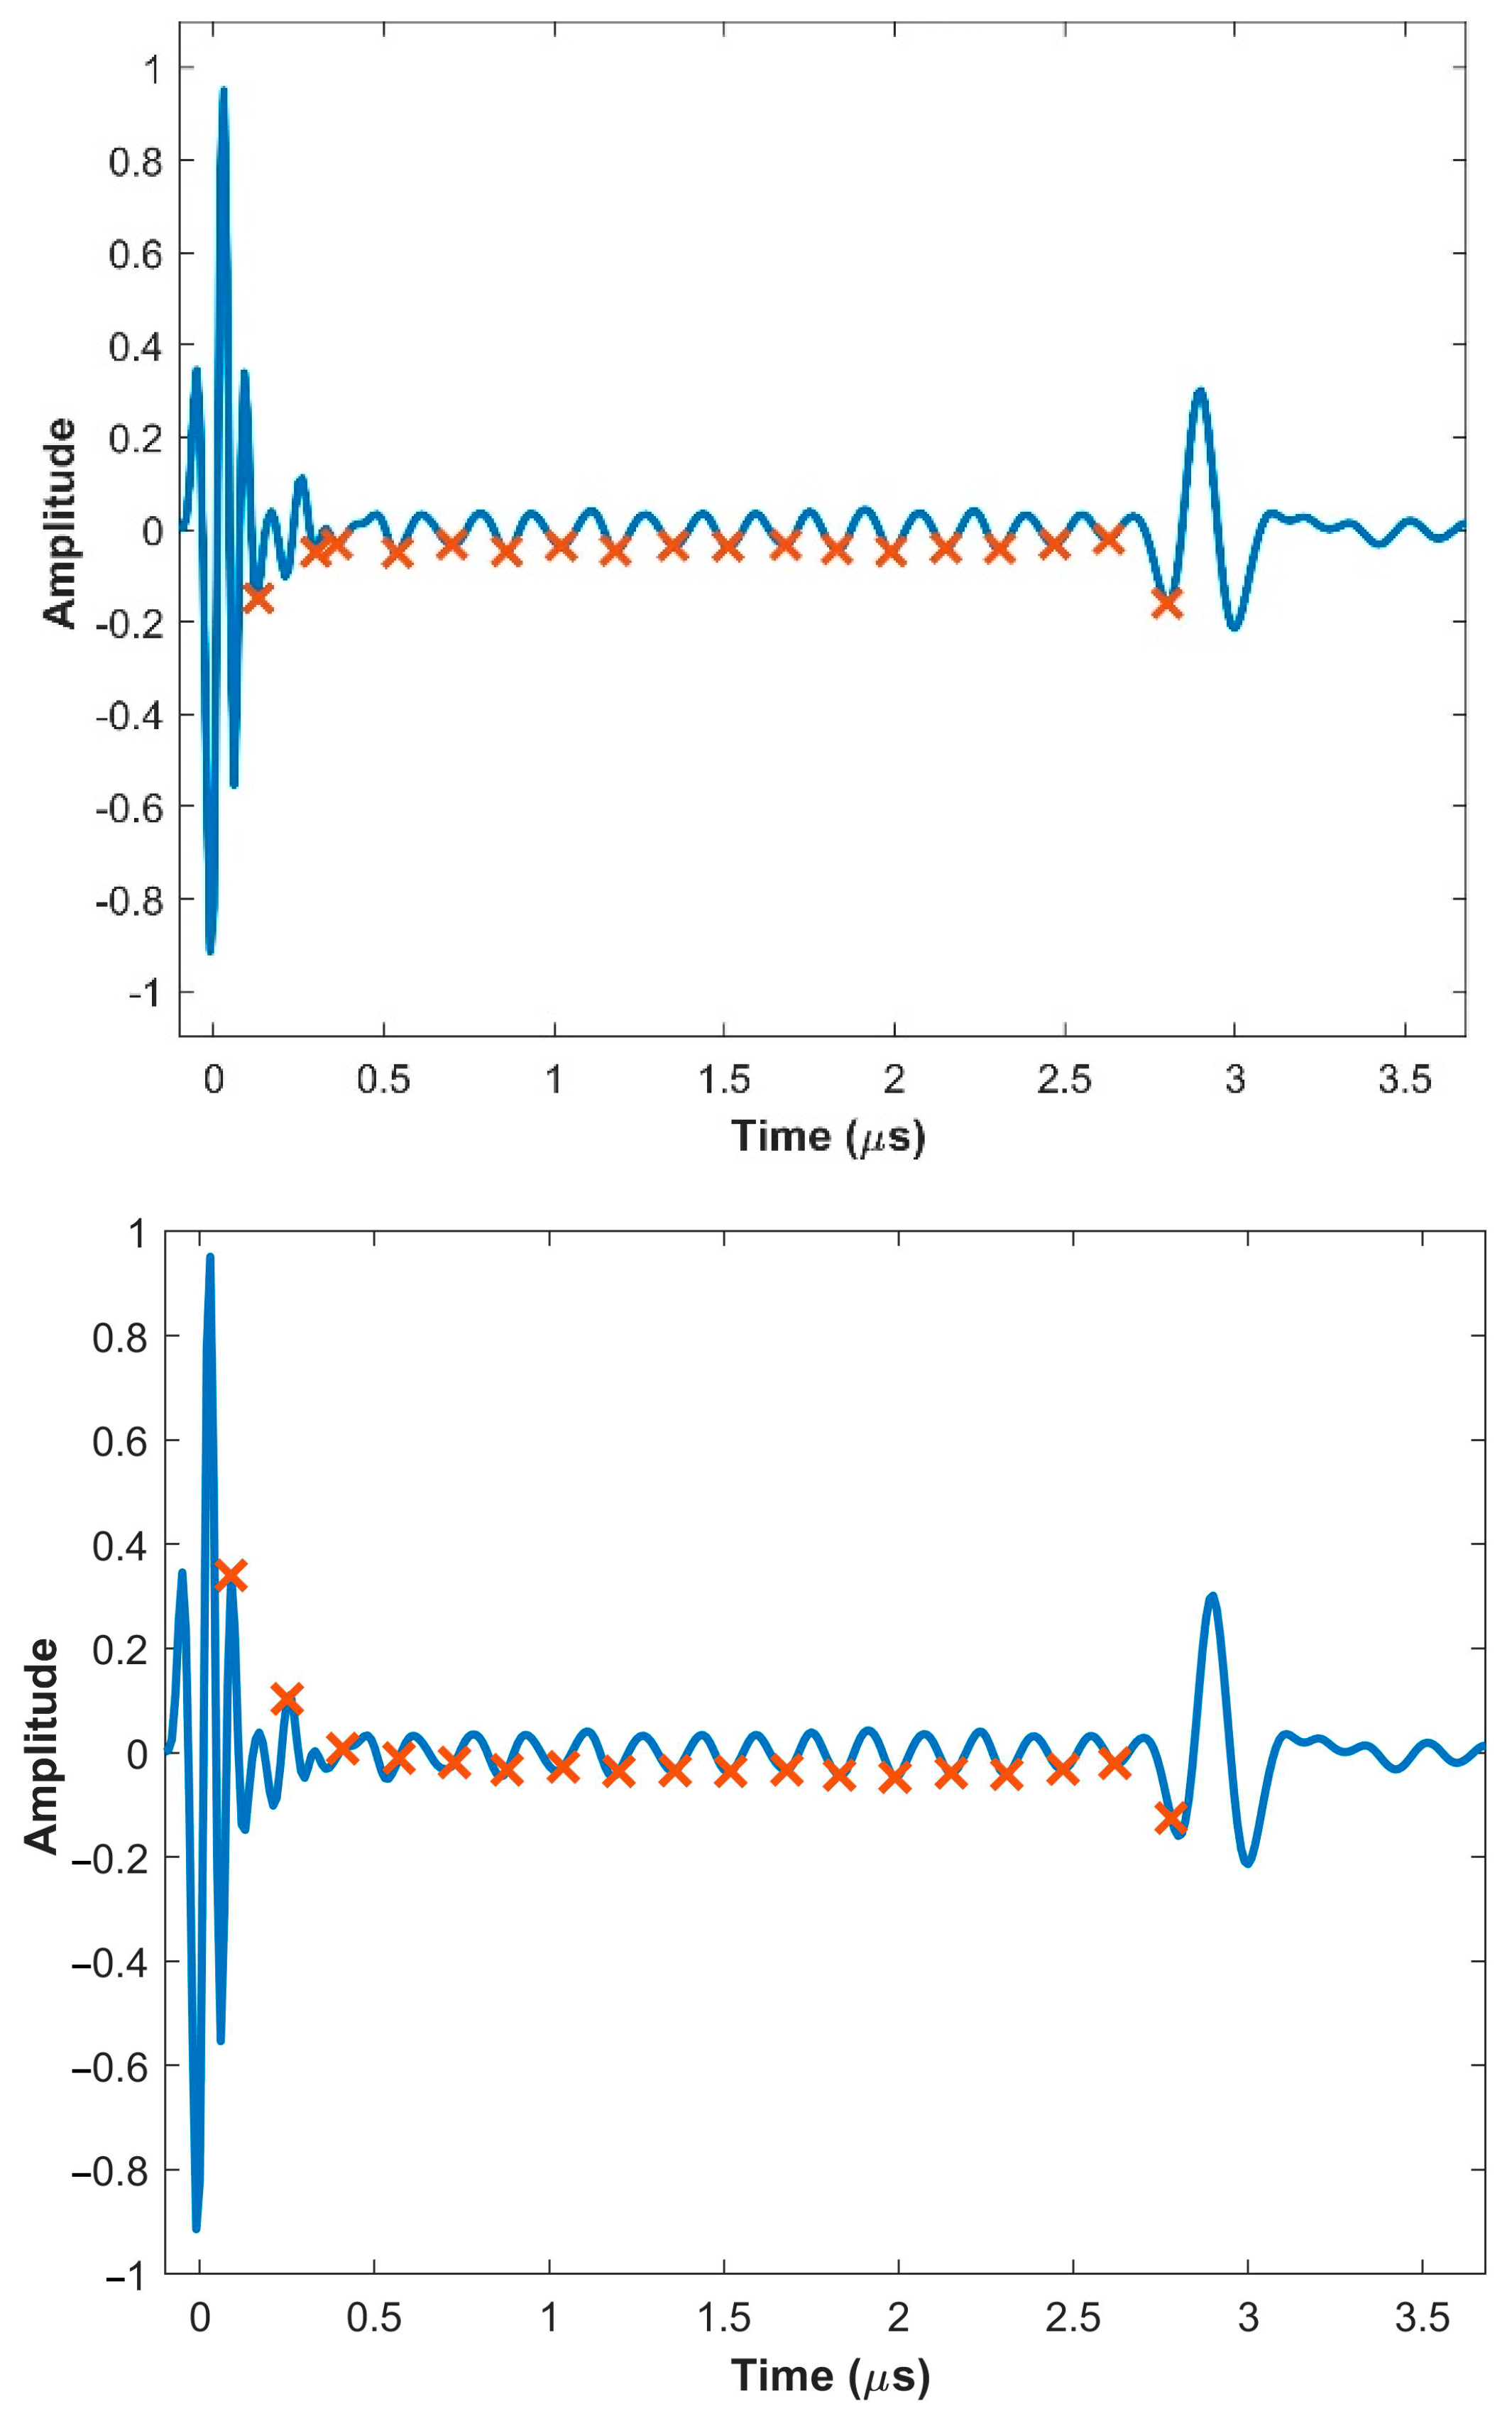
3.1. Alignment of A-Scans

It is imperative that the individual waveforms from each position on the x 1 , x 2 grid, termed A-scans, be aligned in time after scanning and prior to determining the orientation of the plies within the laminate. This alignment in time corresponds directly to the depth dimension x 3 and is caused by subtle movements of the translation system or within the electronic timings. There are several examples in the literature [16,24,38] discussing the need for different methods for the depth alignment of the ultrasonic data to correspond to the front surface of the part. An improvement on the method initially presented in [23] by the current authors is proposed to better align the data to the front wall of the part. In the previous work, a single detection threshold was used to align the ultrasonic waveform data, F ( x 1 , k , x 2 , l , t ) , where the subscripts k and l correspond to the discrete index locations in the x 1 and x 2 dimensions, respectively, from which the individual A-scans are captured. In this study, we investigated detection thresholds from 5% to 100% of the maximum allowable amplitude in increments of 5%, with no difference in results noted for anything from the range of 10% to 80%. For each detection threshold, a two-dimensional third-order polynomial surface is fit to the data and used to shift the ultrasonic data in time. The averaged A-scan, taken by averaging in the x 1 , x 2 plane, is then calculated for the shifted data. The value of the fourth local maxima of the averaged A-scan is then compared for the different detection thresholds. The detection threshold that yields the greatest value of the fourth maximum is chosen as the value that best aligns the scan data. Figure 2 presents the resulting averaged A-scan after aligning the ultrasonic dataset to the front wall reflection of the part. The front wall is defined as the first negative peak and occurs at 0   μ s, whereas the back wall occurs near the initial large (negative) peak occurring near 2.7   μ s in Figure 2. The fourth local maxima is used to align the waveforms instead of the first three local maxima, as the front wall is saturated for some of the captured signals during the scanning process for the thicker parts. After alignment, the ultrasonic scan data is represented as F ( x 1 , k , x 2 , l , t ~ ) , where t ~ = t t 0 x 1 , k , x 2 , l and t 0 represent the time shift for each spatial location in the scanned region. The ultrasonic data F ( x 1 , k , x 2 , l , t ~ ) are the captured signal and are proportional to the voltage created by the piezoelectric element when receiving each ultrasonic signal.

3.2. Determination of Lamina Count

After the scan data has been properly aligned, the total number of laminae in the part is determined from the aligned and averaged A-scan. The approach in this paper is simpler than the work presented in Yang et al. [35] in that no filtering is done to the signal at this stage in the process. It is possible that future works may investigate the use of methods similar to that of Yang et al. to align the data prior to analysis, but that is left for future work. This work also differs from the recent work of Zilidou et al. [36] in that there is no simulated baseline signal from which to normalize the initial front wall reflection. Based on our studies, it was found that using the negative wave peaks yielded the most accurate results. The back wall of the part is identified when the signal amplitude increases significantly, such as the signal around 2.7 ~ 2.9   μ s. Based on internal studies, the best quality image for analysis of the last lamina was found using the first rising in amplitude negative peak. In Figure 2, this occurs at 2.7   μ s. We observe that in the initial ~ 0.3   μ s of the signal in Figure 2, the waveform frequency changes considerably; this is due to subtle ringing from the transducer along with the mode shift occurring from the incident 15 MHz initial wave to the natural mode of the part closer to 5 MHz (see, e.g., [36]). The difference in samples between the onset of the waveform and the signal for the back wall provides an approximate thickness for the laminate as (see, e.g., [39])
d = t   c 2
where d is the distance the wave has traveled, t is the time, and c is the speed of sound of the wave in the medium. The factor of two in Equation (1) is a function of the acoustics of the pulse-echo method. To relate the time it takes for the wave to travel from the front wall to the back wall to the number of lamina, the speed of sound of the composite and the thickness of the lamina must be known. In this case, the speed of sound of the composite was characterized in a previous study [23] as 2890 m/s. Using the characterized speed of sound and the manufacturer’s provided standard thickness of a typical lamina as 0.23 mm (0.009″), an estimated time for the wave to pass through one lamina can be determined using Equation (1). The time of flight for the total part is then divided by the estimated time for the wave to pass through an individual lamina, and the nearest whole number is used to estimate the number of plies in the laminate.
Once the number of plies is determined, the algorithm for ply orientation is seeded with starting locations to search for the start of the ultrasonic response from each ply. The signal from the first ply is assumed to occur approximately 40% of a ply thickness after the first wall, and each initial guess for the next ply is assumed to be a full ply thickness after that location. This is consistent with the work of Zilidou et al. [36] and Yang et al. [35], who identified a rapid mode shape change at the front surface of the part. We found for our specific samples that the use of a 40% reduction in the anticipated thickness for the first ply yielded consistent results of the raw signal. Future studies should employ the methods highlighted in Zilidou et al. and Yang et al. if the specific thickness of the first lamina is desired or if there is an expected change in the thickness of the first lamina. After the initial guesses of the location have been determined, the optimal starting location for gating each C-scan for every lamina is determined. This optimal location, based upon a variety of internal studies, is the closest local minimum to the initial guess for every ply. These local minima are at the resin interface between plies. Once the required shift has been determined for a ply, the next ply’s initial starting point is altered by one half of the required change in the sample to find the minimum. For example, if the algorithm determined that the true location of the resin interface before ply five required shifting forward by six samples, then the starting location for ply six will be shifted forward by three samples before determining the nearest local maximum. This is shown in Figure 3, with the laminar interfaces plotted as red ‘x’s along with the averaged A-scan for part 18C. In the figure, there are 18 identified ‘x’ marks, 17 of which correspond to waveform at the interface between the laminae and the 18th corresponding to the back wall of the laminate. The majority of the ‘x’ marks are similarly spaced in time, with the exception of the first three. This corresponds to the range of the part where the dominant frequency of the captured signal becomes correlated to that of the ply thickness. This mode shift in the front lamina will cause a shift in the valley of the bulk A-scan as the frequency of the transducer is changed. It was found for the investigated laminates that the selected 15 MHz transducer provided the best balance between penetration depth and identification of the first lamina for the fabricated composites, but the optimal transducer for a given part is expected to be a function of the weave type, lamina thickness, and resin system.

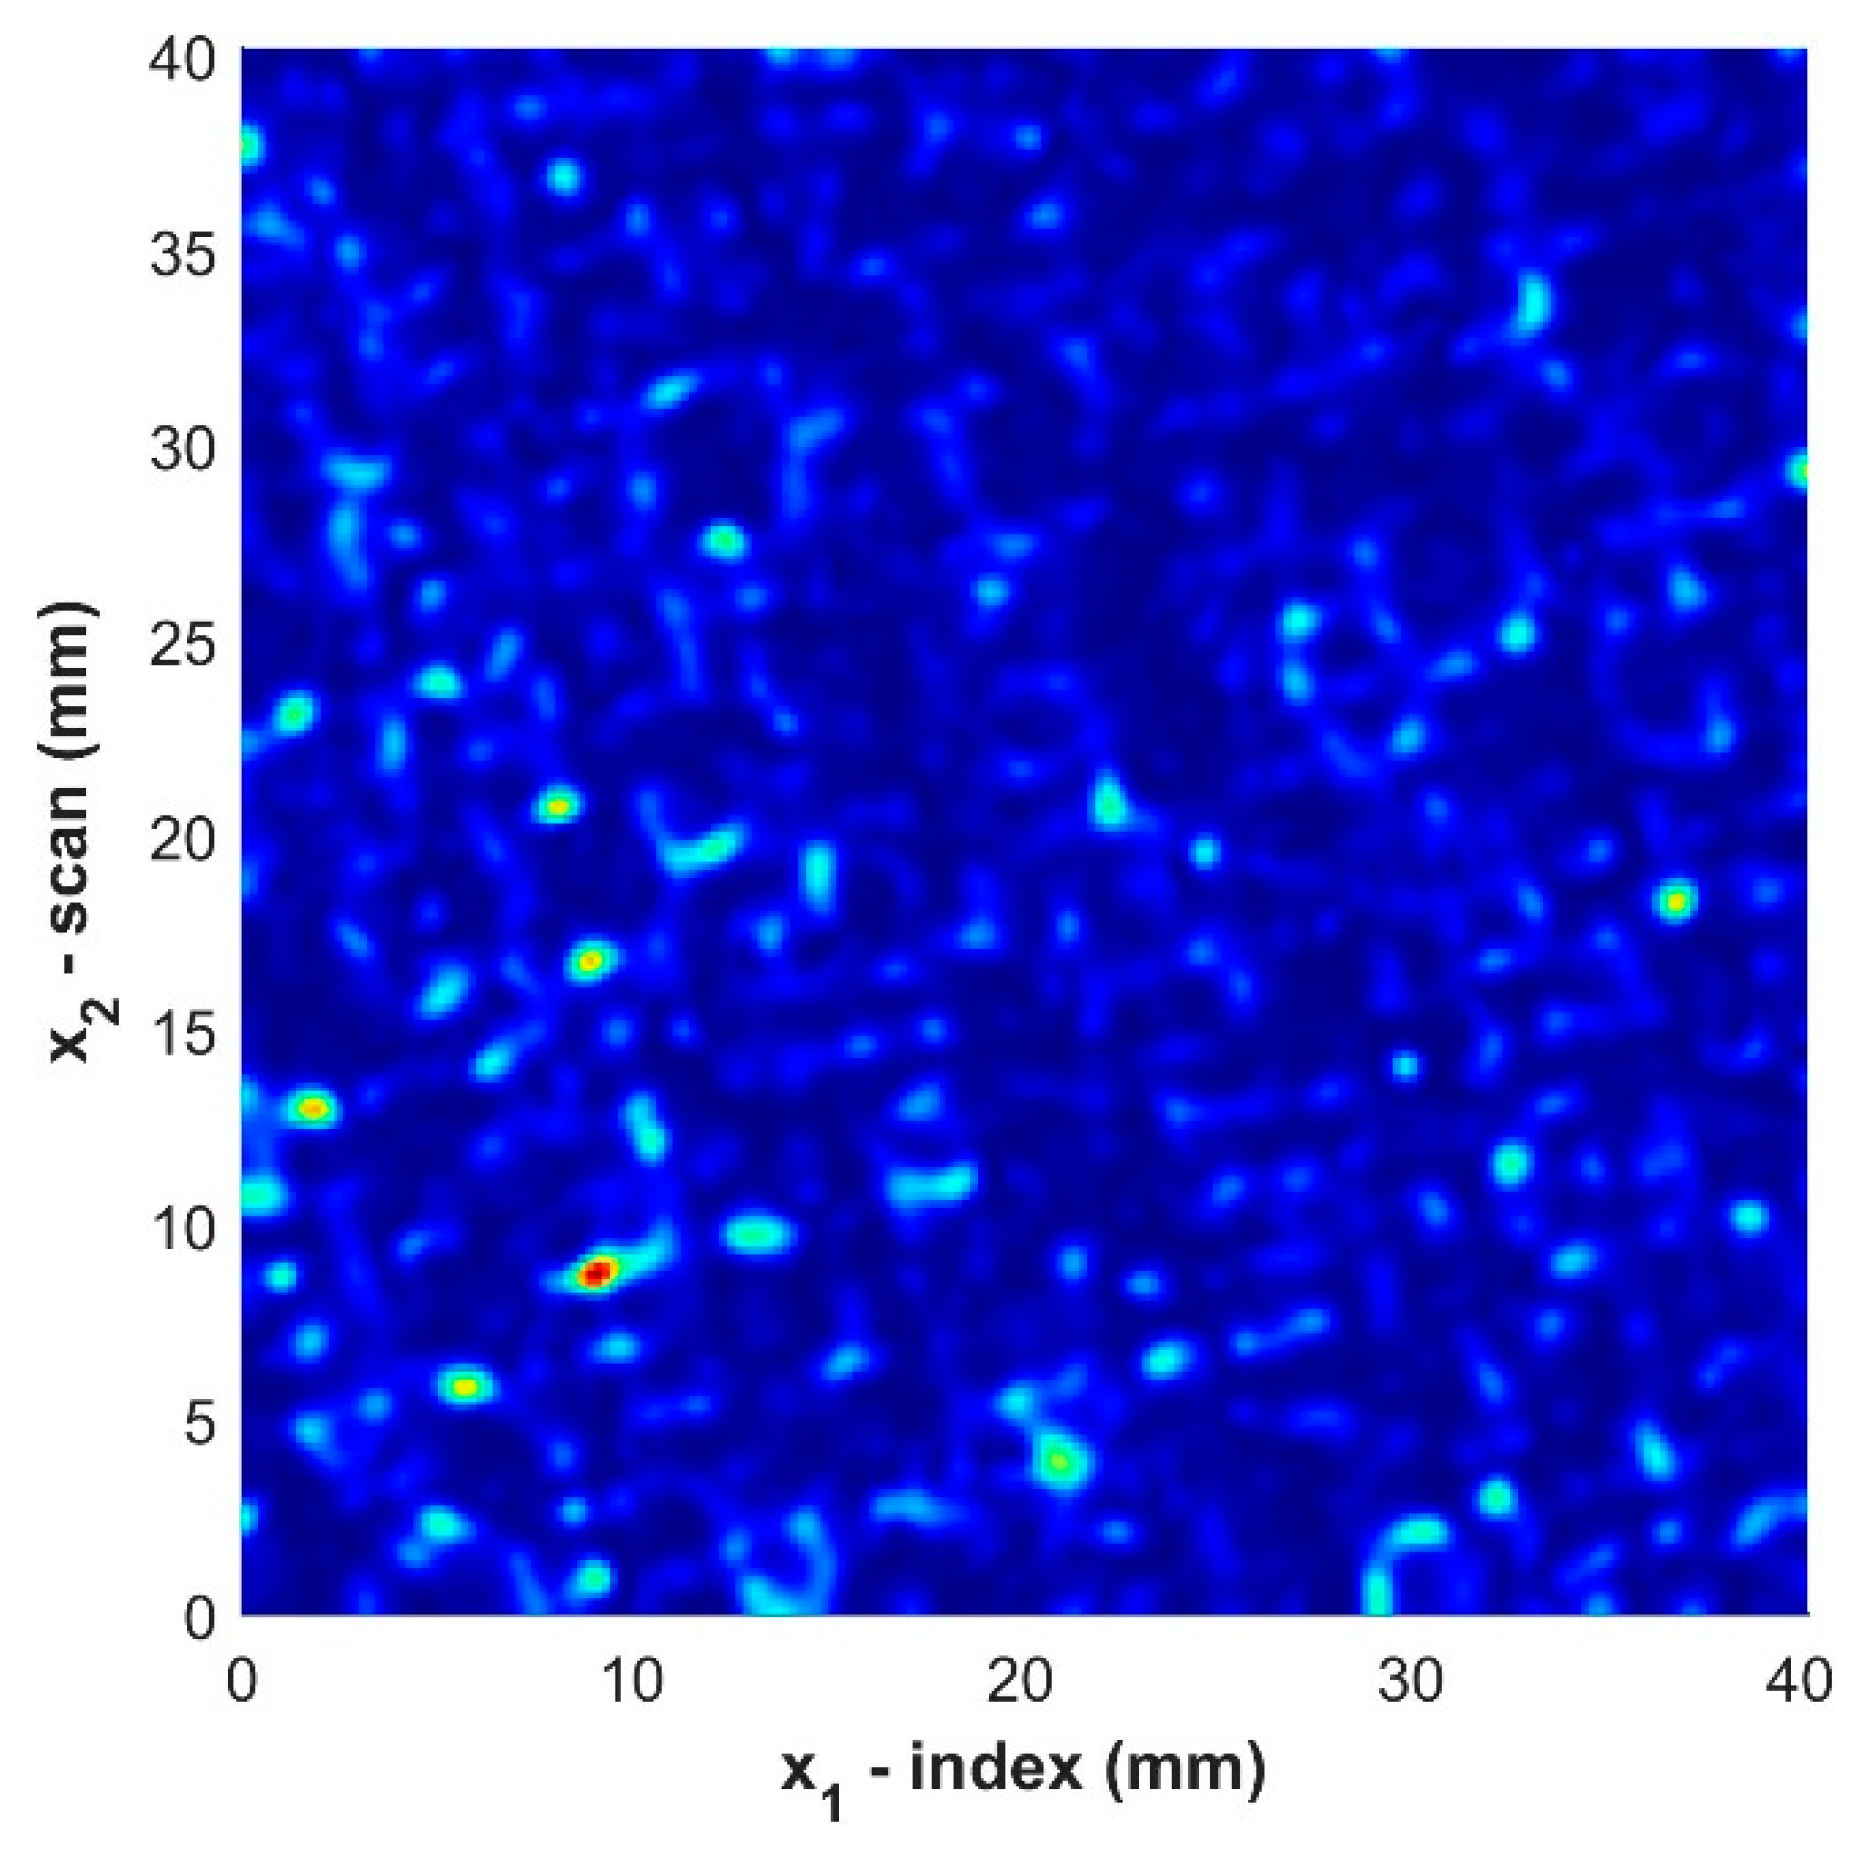
3.3. C-Scans of Individual Plies

The C-scan depiction of a raster scan is often used to show the value of some waveform feature within a gated region of the A-scan across the entire region of the scan. This gated C-scan value may be defined as the averaged amplitude, maximum amplitude, or sum of the amplitude at each point in the raster grid. In this study, we use an alternative criterion for defining the value within the gate at each point in the C-scan, specifically the energy of the signal within the gated region. Prior to calculating the energy within a gate, a spatial Gaussian averaging technique is applied to F x 1 , k , x 2 , l , t ~ as described in [23] over a subregion surrounding the point x 1 , k , x 2 , l . The dataset after the spatial averaging is applied is referred to as F ~ x 1 , k , x 2 , l , t ~ . The energy within a gate is defined as the integral of the square of the signal as
F ^ x 1 , k , x 2 , l , t ~ n = t ~ n t ~ n + Δ t n F ~ x 1 , k , x 2 , l , t ~ 2   d t ~
where t ~ n is the location in time of the minima, depicted in Figure 3, before the ply in the shifted dataset. For all but the first and last plies, the gate duration, Δ t n , corresponds with the time it takes for the wave to pass through half of a ply thickness. In other words,
Δ t n = t ~ n + 1 t ~ n 2 ,   n = 2,3 , , N 1
where N is the number of laminae in the composite. The C-scan image for the fifth ply of part 18C is shown in Figure 4. Notice that the weave pattern of the ply is visible within the generated C-scan.
Other researchers (see, e.g., [12]) have noted difficulty in observing the orientation of the first and last plies using ultrasound. It was observed that small modifications to the region over which the energy of the signal was calculated made it possible to observe the orientation. For this reason, the algorithm treats the gating of the signals for the first and last plies differently than the plies within the core. For the case of the first ply, the gate used for the energy determination encompasses the front wall wave to the identified location of the first ply, i.e., Δ t 1 = t ~ 1 0 . Similarly, the gate duration for the energy determination of the last ply encompasses the time from the interface between the N th and the N 1 th lamina and the back wall of the part, i.e., Δ t N = t ~ B W t ~ N , where t ~ B W is the time when the back wall signal occurs.

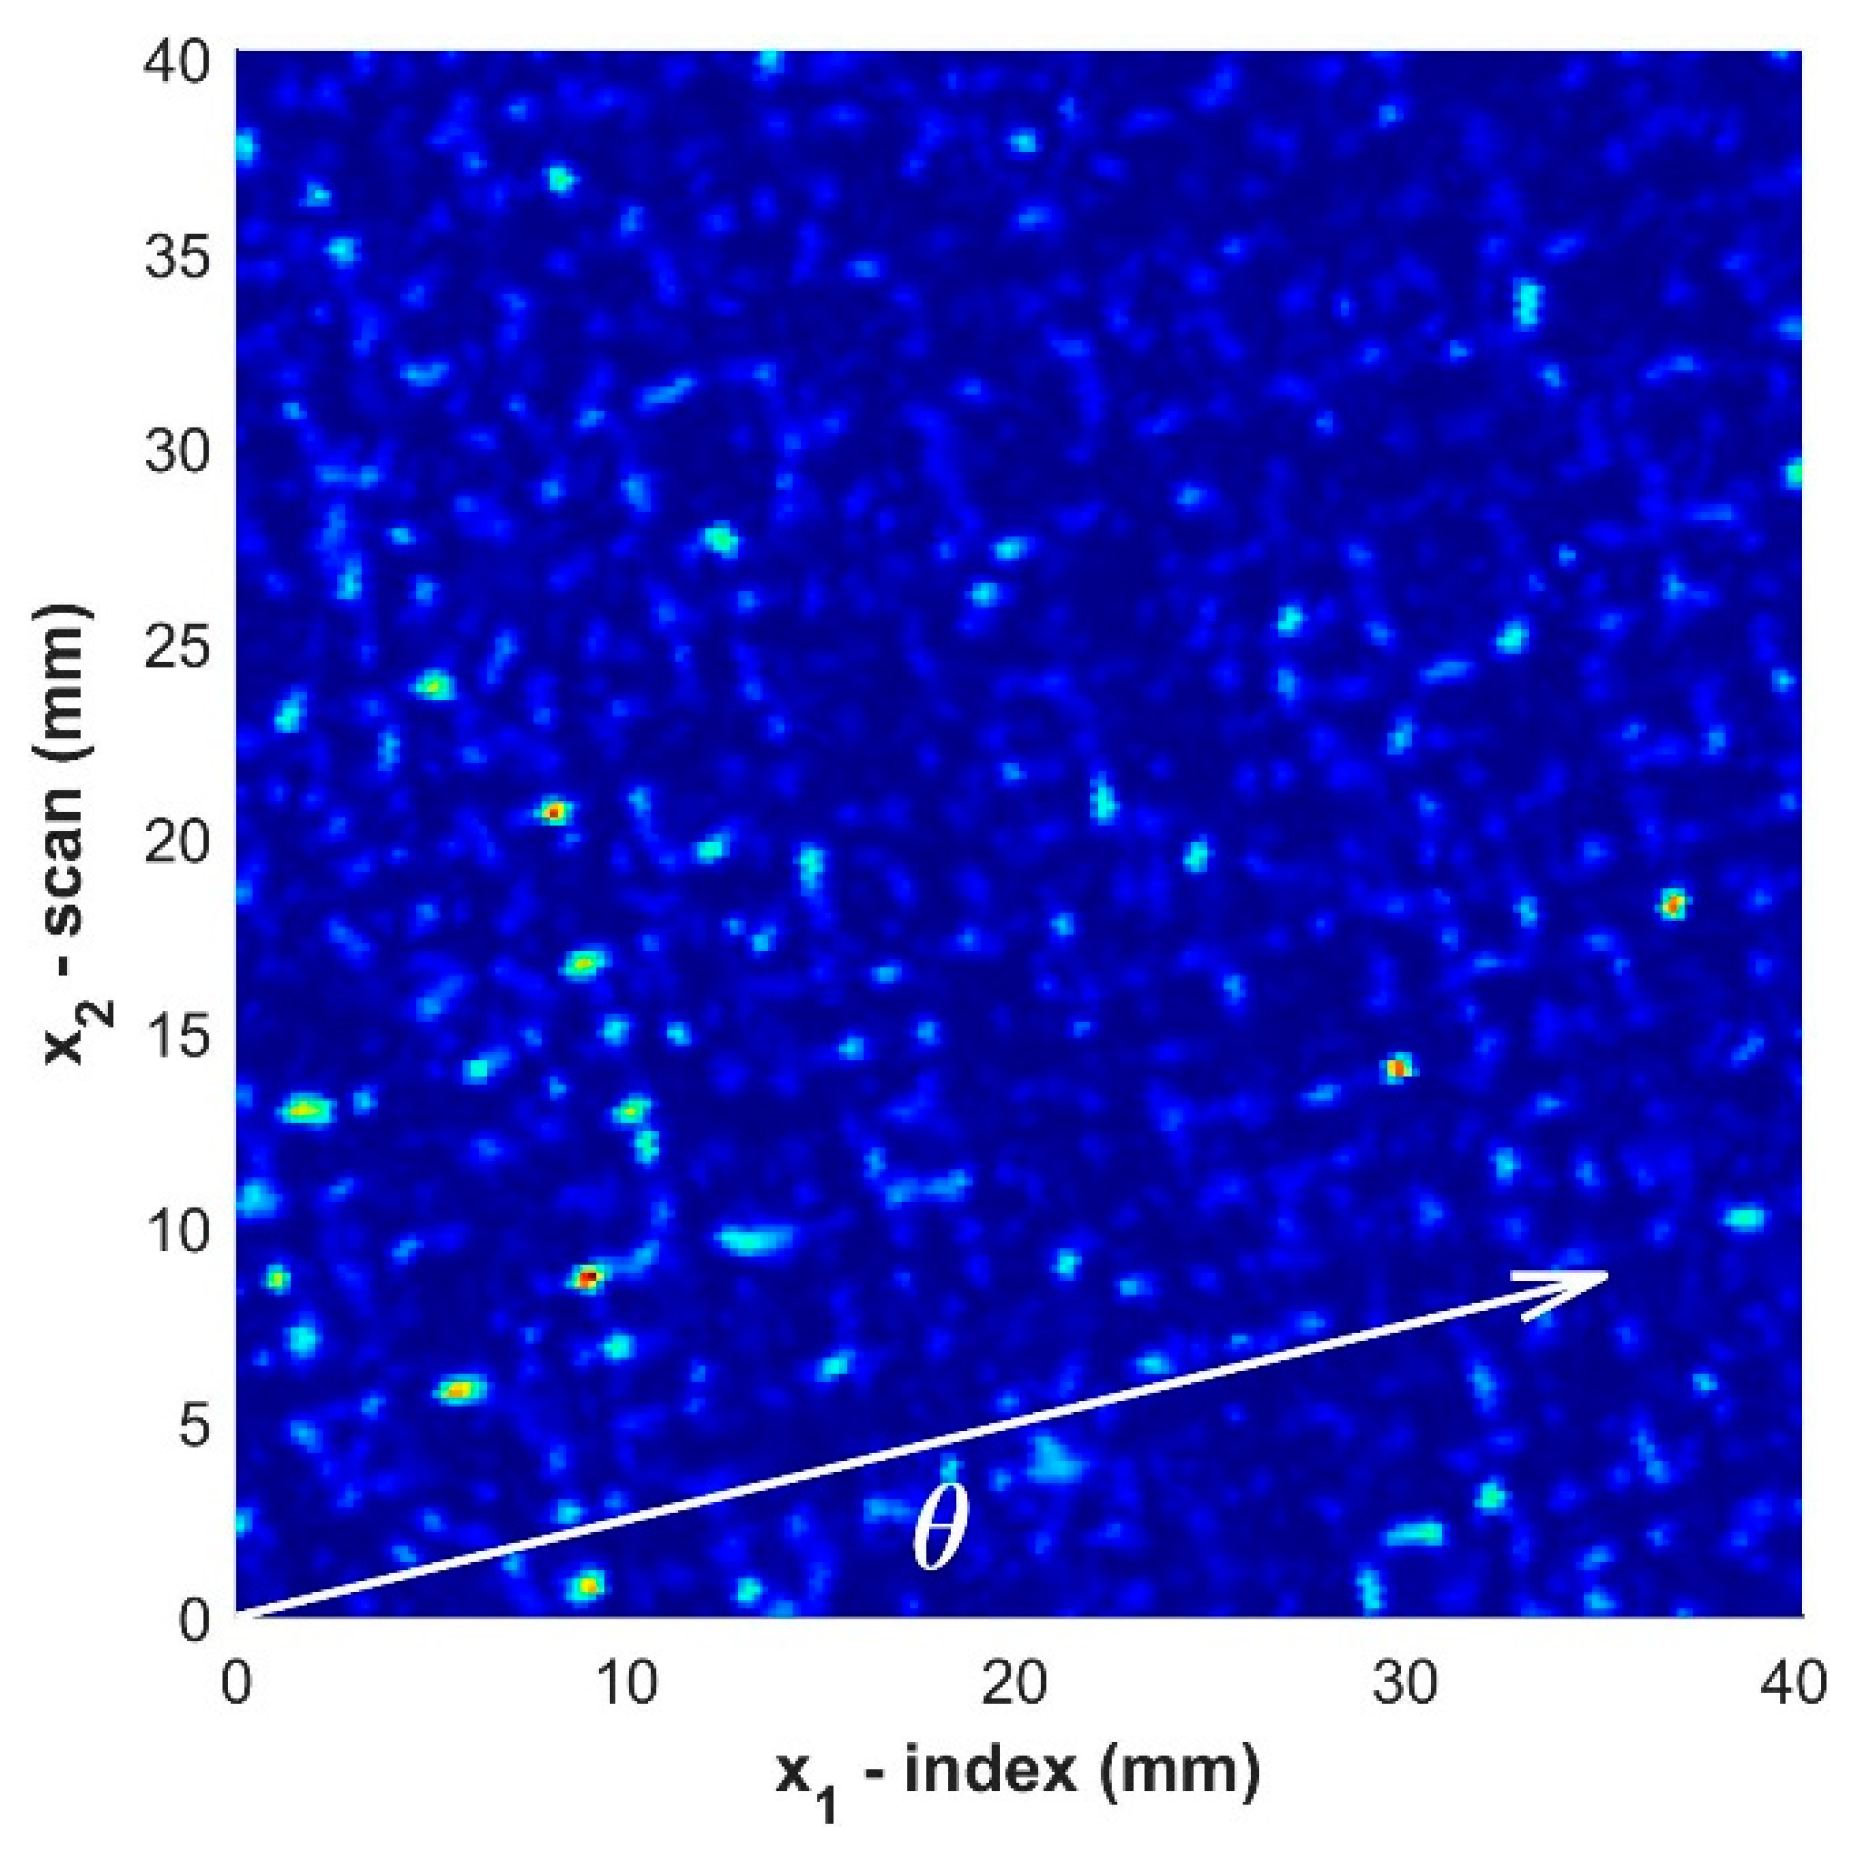
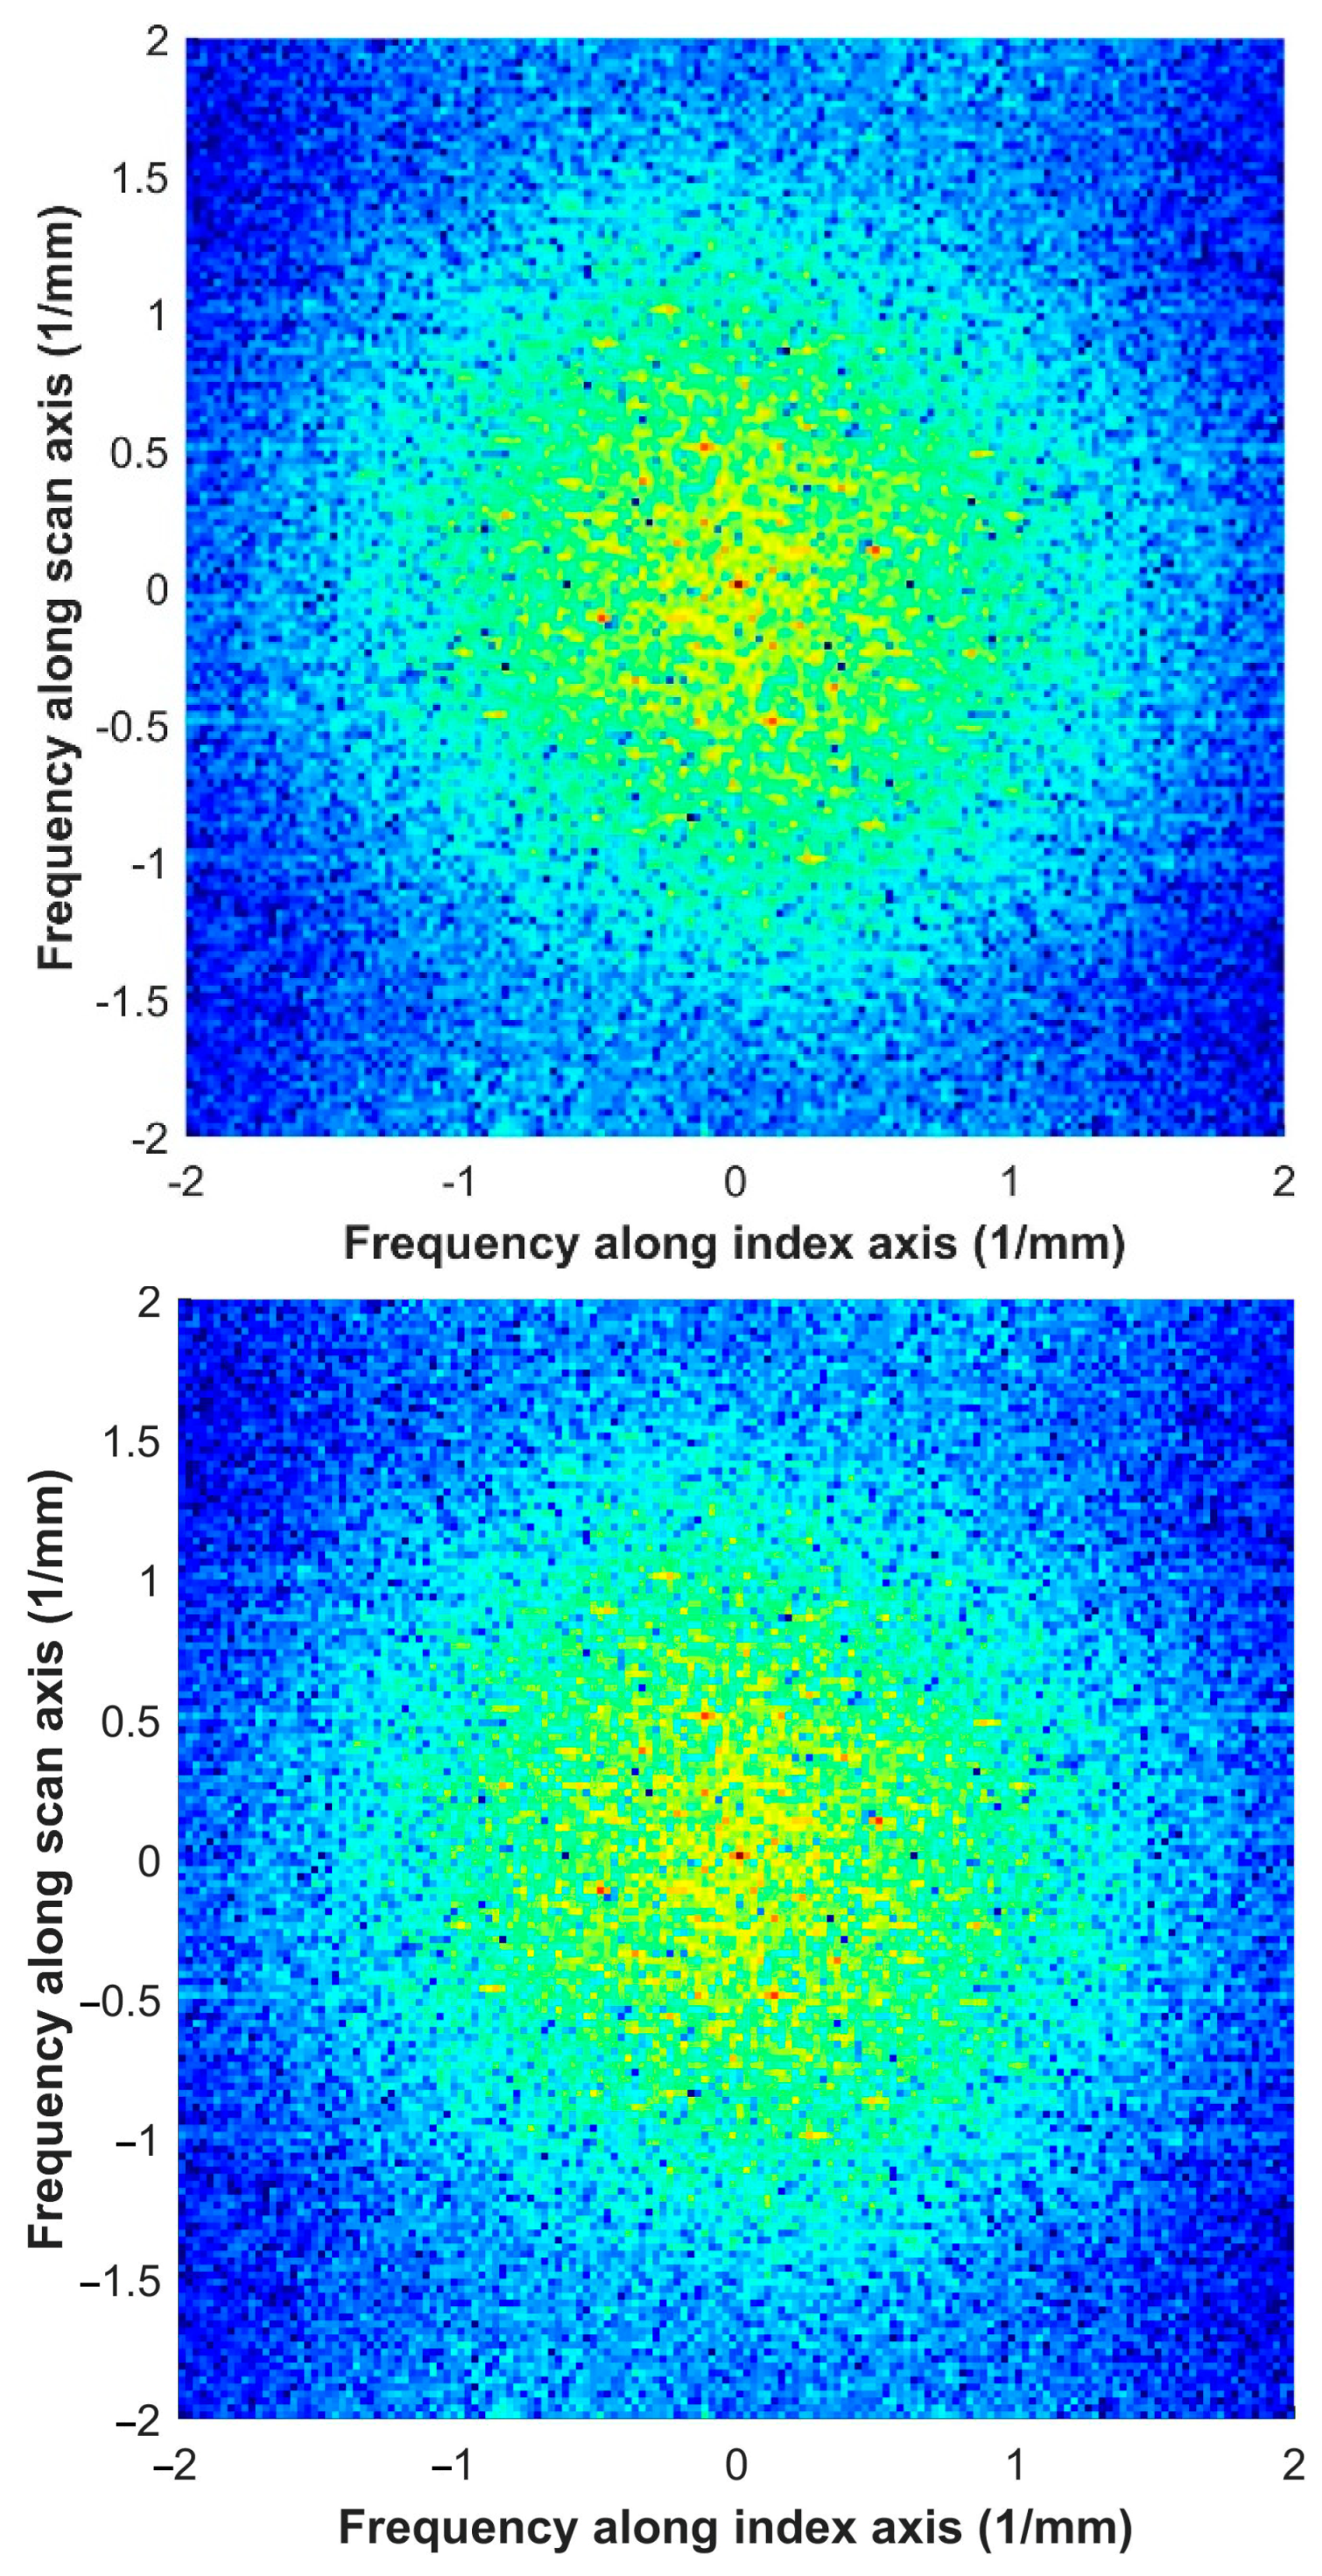
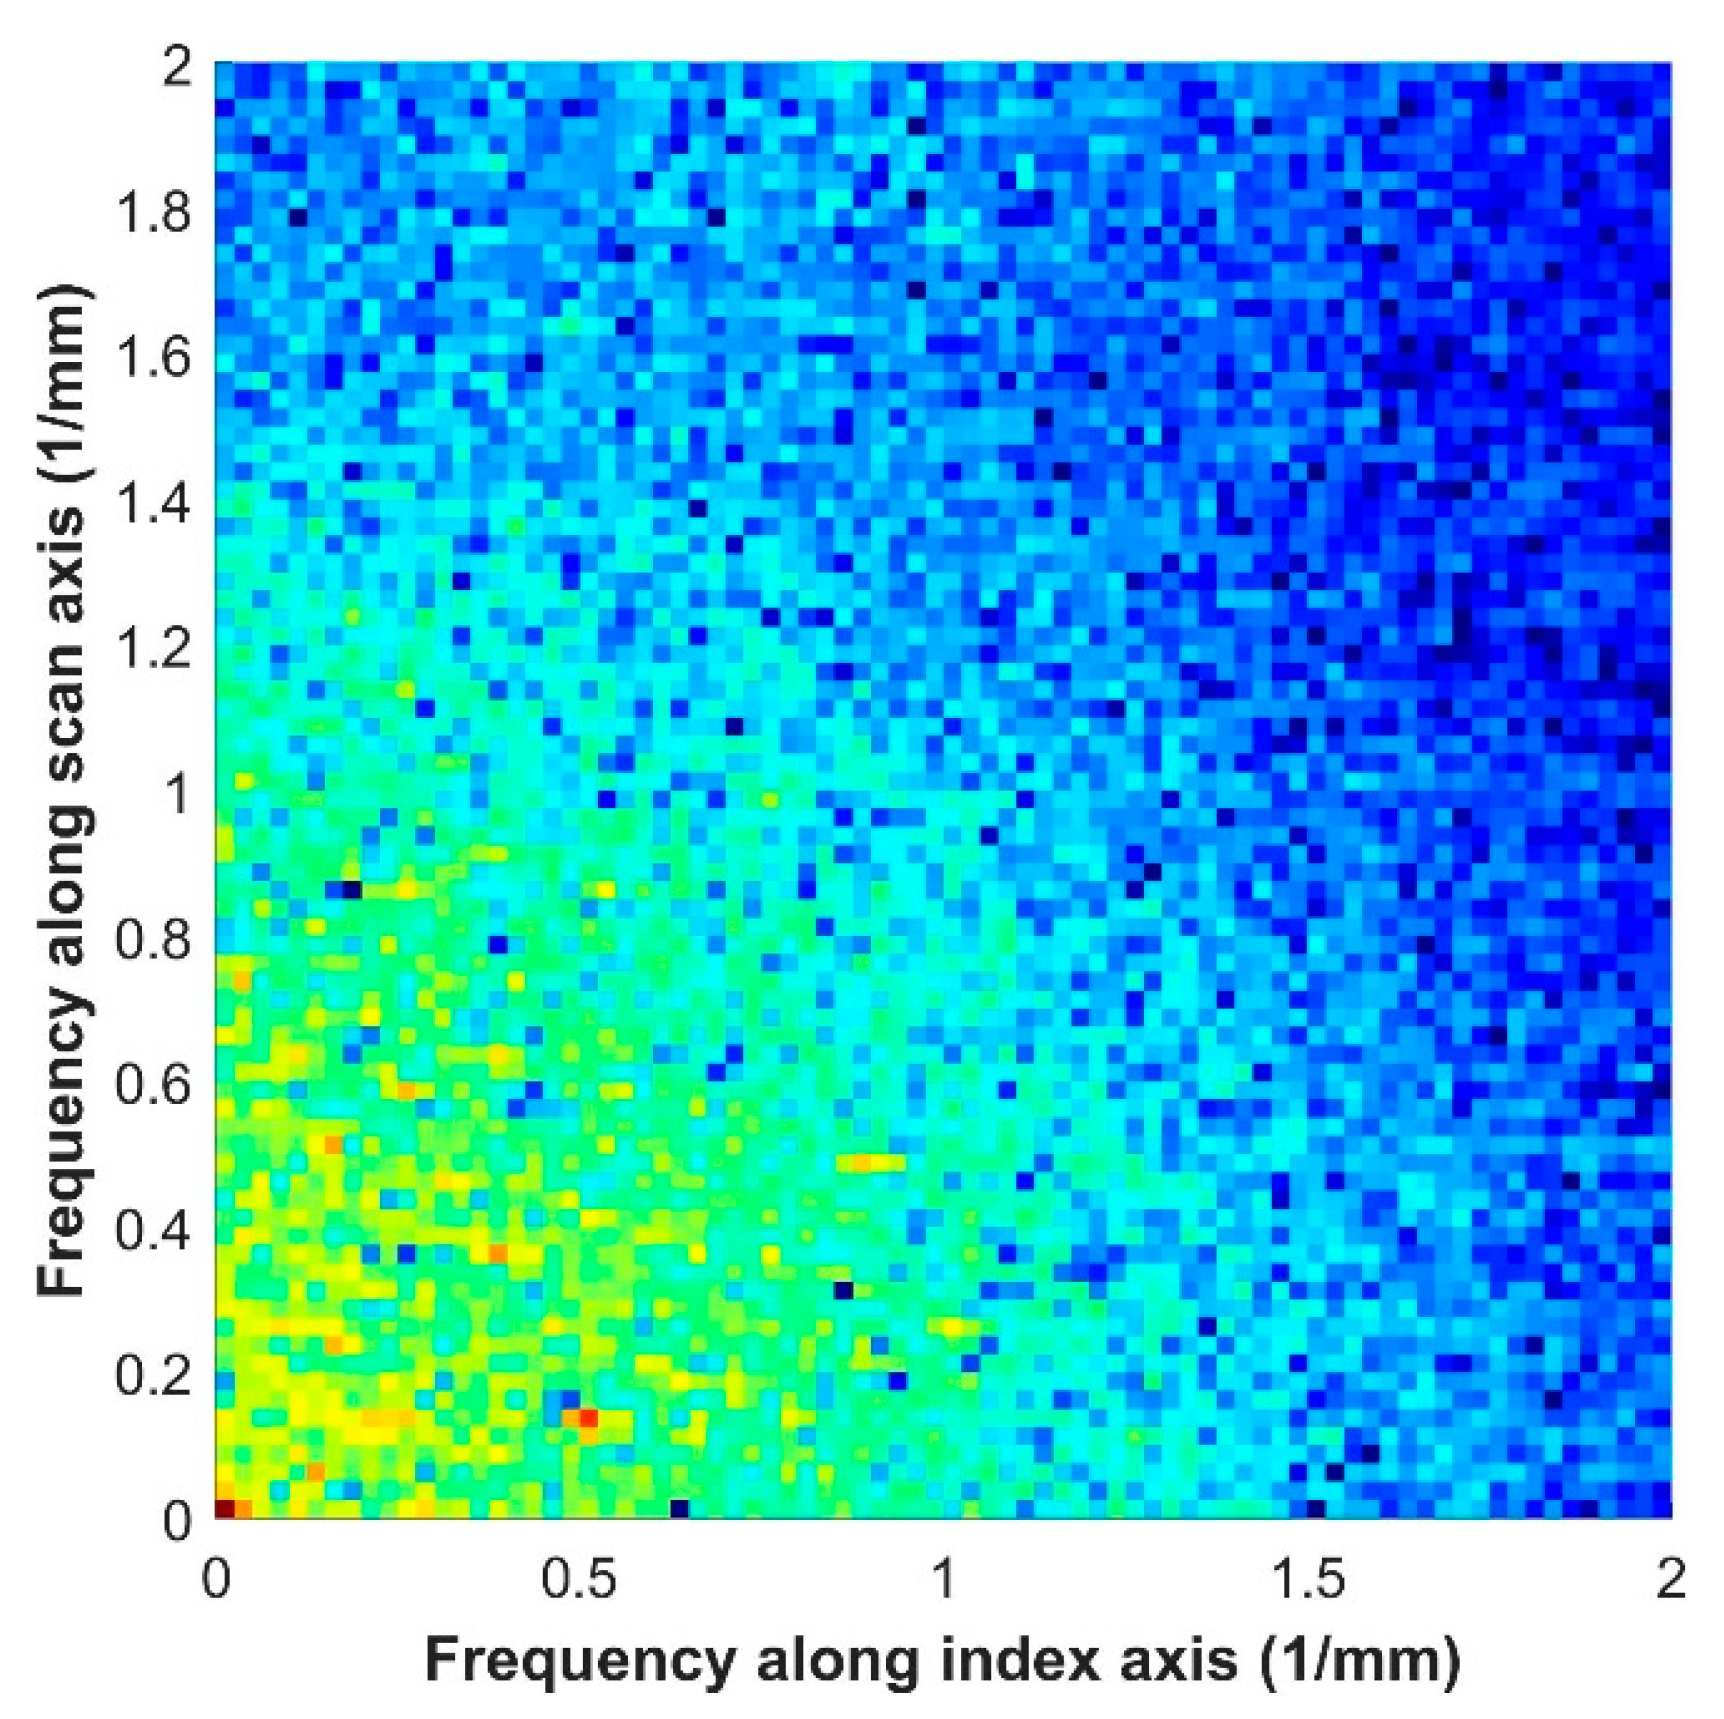
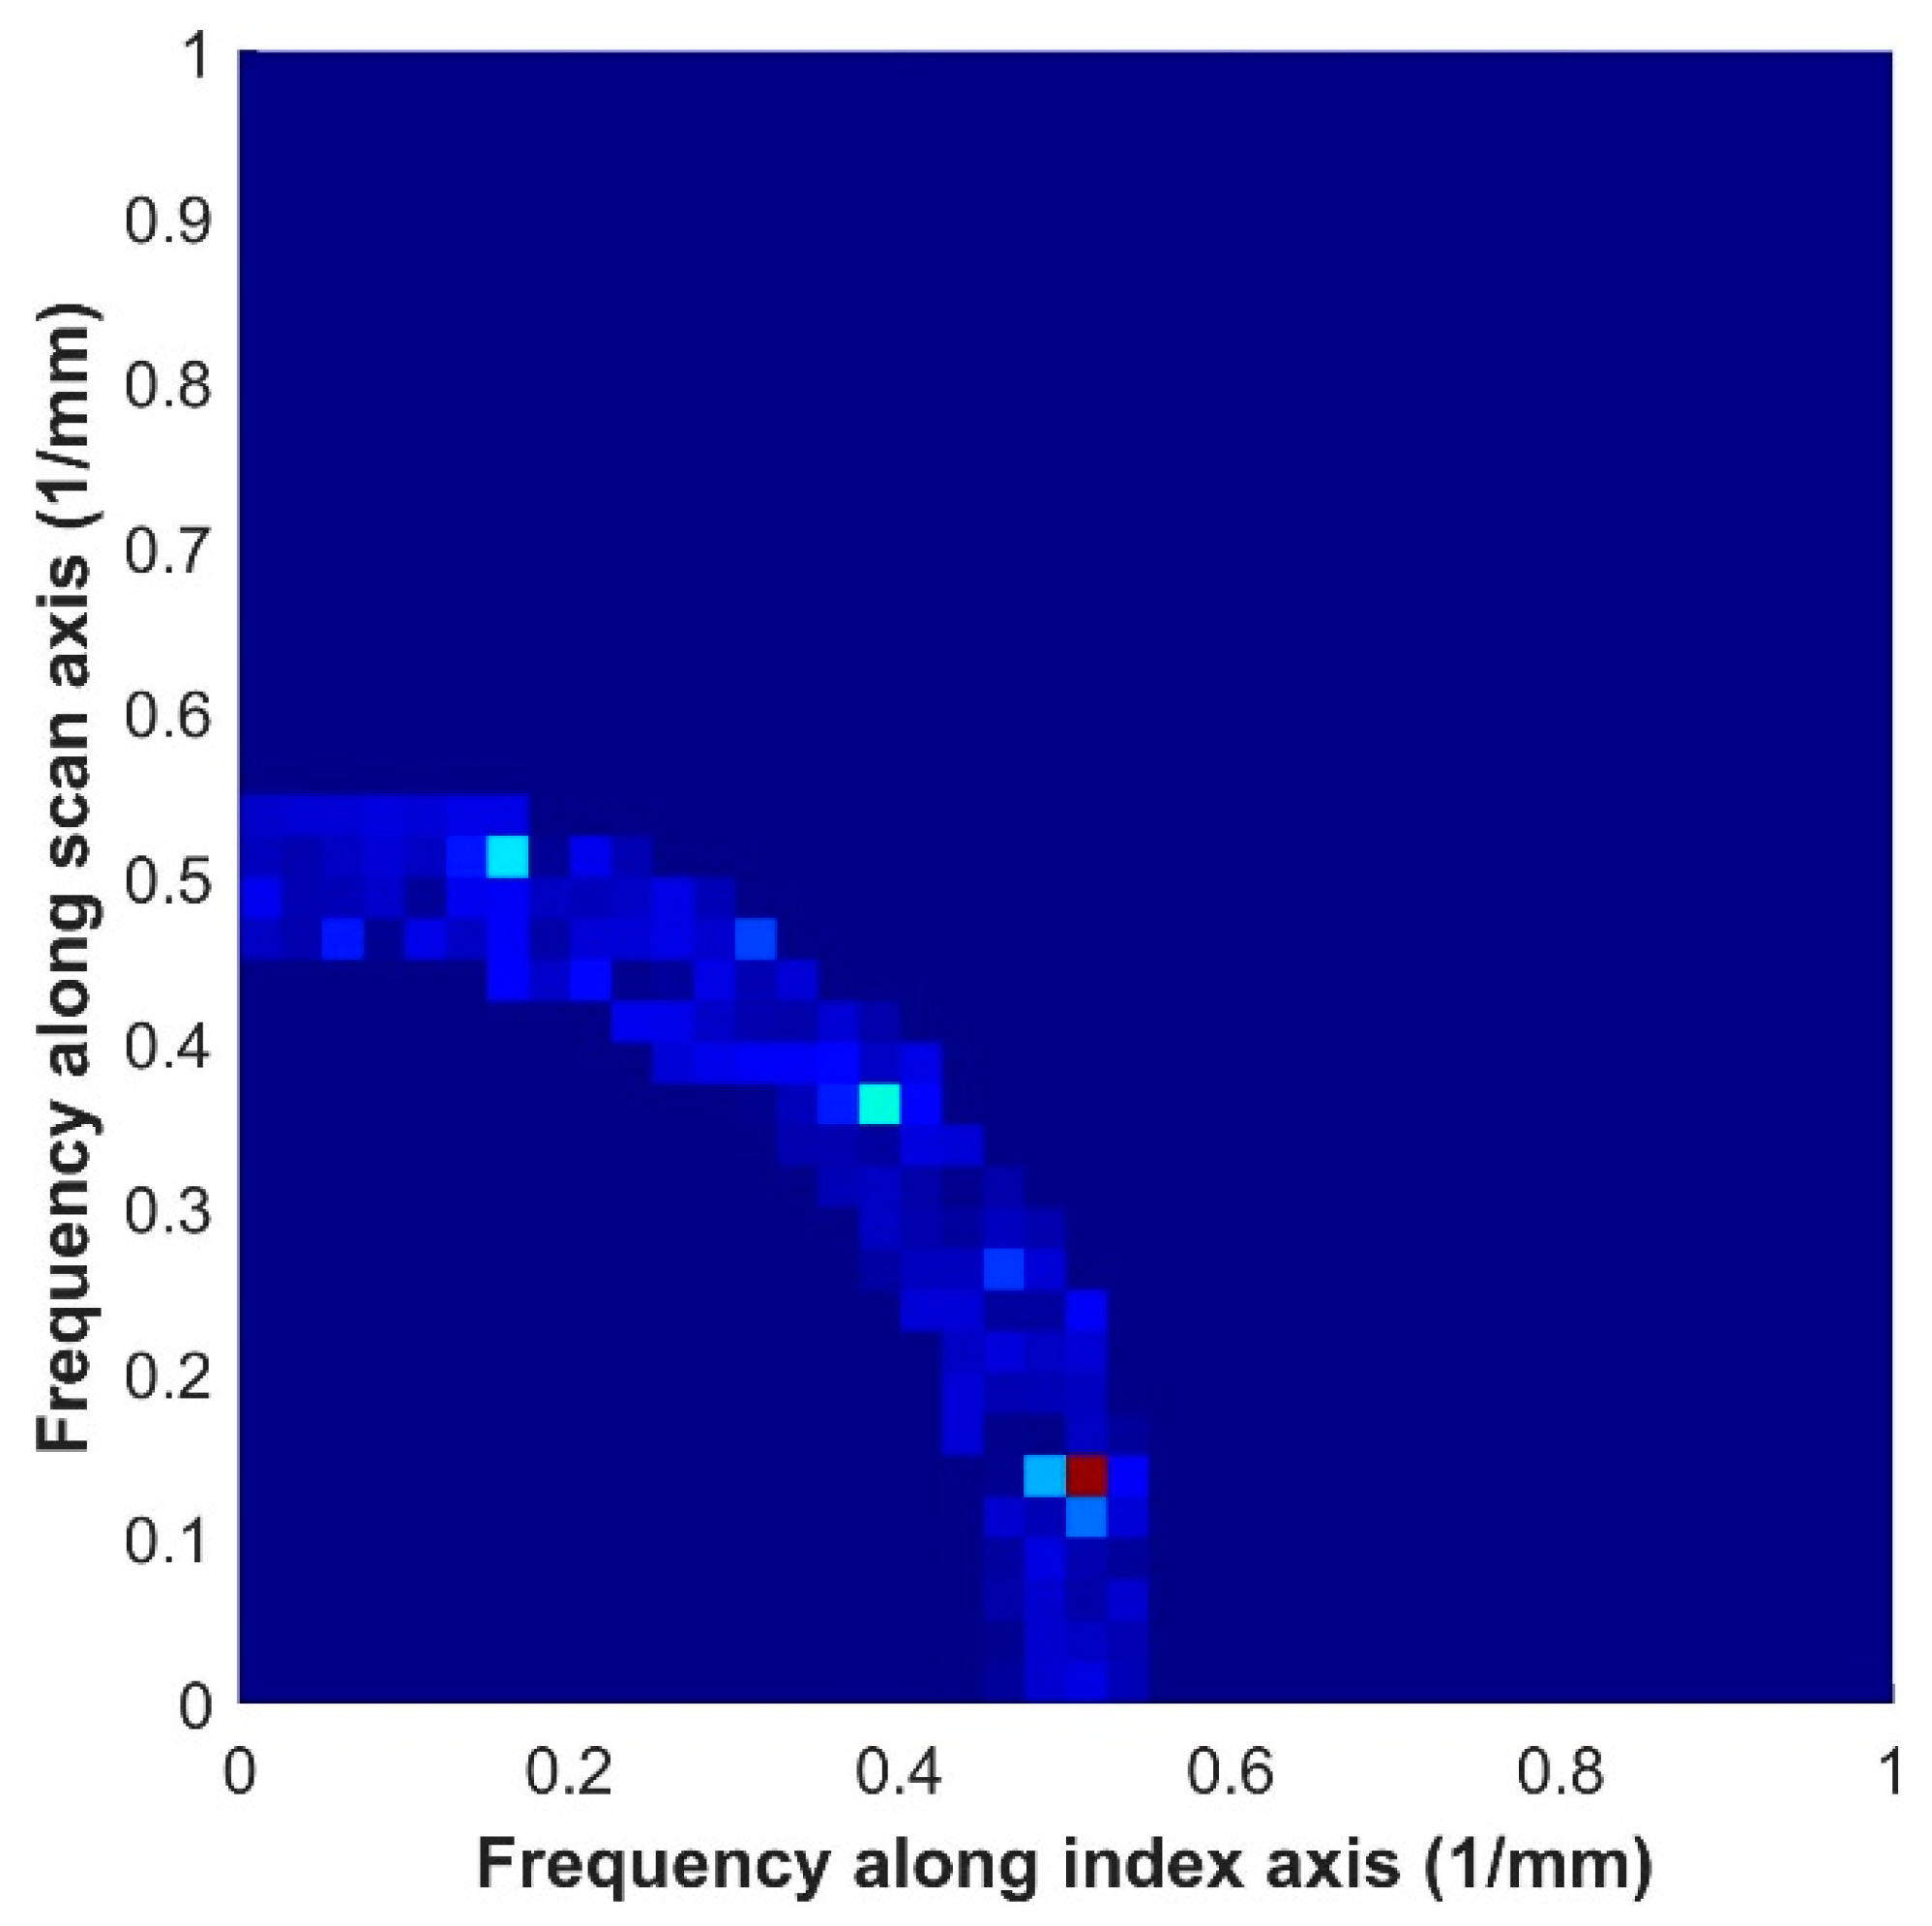
3.4. Identification of Ply Orientation in Frequency Domain

The fast Fourier transform allows for the transformation of a dataset from the spatial dimensions x 1 , x 2 in real space into the frequency domain. The one-dimensional Fourier transform is often used in the temporal domain to identify select features of individual A-scans (see, e.g., [40]), but in the present context, we are using the Fourier transform over the spatial dimensions to capture patterns within the resulting C-scan. Within the spatial frequency domain, the amplitude, angle, and frequency can be represented, but instead of the frequency representing a unit of a Hz (1/s), the units are in inverse distances (i.e., 1/mm). The 2D FFT is calculated for each C-scan using the built-in MATLAB function fft2. Figure 5 shows the two-dimensional transform of the fifth ply in part 18C. The colormap used in the figure is logarithmic to highlight not only the dominant frequencies within the spatial frequency domain but also the other present frequencies that are not present when plotting on a linear scale due to being much smaller in magnitude. The point at the origin f 1 , f 2 = 0,0 , where f i is the spatial frequency in the i th dimension, has the greatest amplitude in the frequency domain. It is worth noting that most of the transformed C-scans have the dominant amplitude at f 1 , f 2 = 0,0 , which corresponds to a fixed vertical offset in the data; thus, the peak frequency is not of use in the present context.
Figure 6 presents a “one-sided” view of the data in the frequency domain that is analogous to the way in which the one-dimensional fast Fourier transform may be viewed as one-sided. This is done by viewing only the data in a single quadrant of Figure 5, as the other four quadrants are some mirrored images of the first. When viewing the data in this manner, we still see the vertical offset at f 1 , f 2 = 0,0 is the most dominant amplitude. The next most dominant amplitude occurs at f 1 , f 2 = 0.50,0.11 . This datapoint corresponds to a dominant feature in the C-scan of the ply that occurs at the angle tan 1 x 2 , l x 1 , k and has a spatial frequency equal to the magnitude of the vector between the 0,0 point and x 1 , k ,   x 2 , l . In this case, this dominant amplitude occurs at an angle of 14° and a frequency of 0.515/mm (13.1/inch). This frequency closely matches the spatial frequency created by the tows of carbon fiber in the plain weave pattern. According to the manufacturer’s specifications and internal measurements for the plain-weave carbon fiber fabric, there are 13 tows per inch, which corresponds to 512 tows per meter. Thus, the angle created by the most dominant amplitude in the frequency space corresponds to a frequency equivalent to the manufactured tows per millimeter.
In all cases, it was not practical to identify only the peak frequency, neglecting the vertical offset peak. If this was done, ghosting of macro features and patterns could cause an error in the angle orientation identification. Thus, a gate in the spatial frequency space, similar to a bandpass filter, is established around the known spatial frequency of the fiber tows of 0.512 mm−1. This is shown in Figure 7 for the one-sided view of the frequency domain after applying a simple bandpass filter in the spatial frequency domain. For this work, all frequencies below 0.45 mm−1 and greater than 0.55 mm−1 were set to zero within the frequency domain. It should be noted that while Figure 4 and Figure 5 presented the colormap on a logarithmic scale, the scale shown in Figure 7 is a linear scale to help highlight the significant amplitude difference at the point (0.50, 0.11), corresponding to a ply orientation of 14°, to the other points within the frequency space.
The ply orientation found in the filtered frequency space is then superimposed on the gated C-scan data, as shown in Figure 8, as a secondary check. Note that in Figure 7, there are three significant peaks, the first at 14°, along with two peaks at an orientation of 43° and 73°. In analyzing all 117 plies in this study, there was a total of 2 instances where the ply orientation was incorrectly identified by the dominant magnitude in the frequency space, but in each of those two cases, the second or third most dominant amplitude contained the correct ply orientation. In the results presented below, only the dominant peak is selected, but from an inspector’s perspective, manually going through each gated C-scan has the potential to increase the accuracy beyond the automated set of results presented here. Thus, a second step, such as that of Figure 9, which shows the first and second orientations for the second lamina of 3B, may be of benefit if an accuracy greater than 98% is required.
Table 3 presents the identified orientations for all parts analyzed and can be compared with the burn test orientations in Table 2. For all 12 laminates, the automated algorithm correctly identifies the total number of plies within the part. It is noted that a 90° orientation offset in the orientation is expected as a plain-weave composite with an equal tow count in both the warp and weft fibers is used; thus, there is no difference between a 0° and 90° ply orientation. For example, for the situation when the identified orientation is 2°, and the actual orientation is 89°, the error is 3°, not 87°.
Table 4 shows the absolute difference between the burn test orientation from Table 2 compared to the identified orientation from Table 3 for each ply of every part in this study and the orientation predicted by the developed algorithm. Of the 117 total plies studied, the algorithm correctly predicted the orientation of 85 plies to within ±1° and 115 plies within ± 3°, for a confidence of, respectively, 73% and 98%. For all 117 laminates, the average error in predicting the ply orientation was 1.4°. For the two plies that were misidentified using the algorithm, a visual inspection of the second and third most dominant frequencies revealed the correct orientation. For the second lamina of part 3B, the second most dominant orientation was found to be 20°, an error of 2° from the burn test verified orientation. In the case of the 17th ply of part 18C, the third most dominant orientation was found to be 41°, also an error of 2° from the burn test verified orientation.

4. Conclusions

A non-destructive technique using immersion, pulse-echo ultrasound is presented for high accuracy and repeatable measurements of the ply orientation within fiber laminates. An algorithm for the determination of the ply orientation is presented, making use of the 2D FFT in the spatial dimension of individual gated signal intensity C-scans corresponding to each individual lamina. Results from the planar frequency intensity are analyzed to identify the angle of each ply in a plain-weave carbon fiber composite. The algorithm was able to predict 85 out of 117 plies within ±1° and 115 out of 117 plies within ±3° of the true orientation from composite panels ranging from 3 plies in thickness to 18 plies. Previous work in the literature has focused on unidirectional composites and quasi-isotropic ply angles, whereas this study presents results for a woven composite covering a wide range of ply orientations and stacking configurations. The results shown in this study demonstrate the potential of ultrasound as a testing and qualifying method for carbon fiber laminates made from woven fabrics.
This improvement in the detection capabilities of ultrasound could be important in the manufacturing, maintenance, and modeling of components, allowing technicians to better quantify the true properties of the as-manufactured laminate in qualifying and accepting a given part. Although the technique is presented for the case of a plain-weave carbon fiber laminate, it is anticipated that the technique may be adapted for other weave pattern composites and will be part of ongoing work by the authors.

Author Contributions

Conceptualization, D.A.J.; methodology, N.J.B. and D.A.J.; software, N.J.B. and D.A.J.; formal analysis, N.J.B. and D.A.J.; investigation, N.J.B.; resources, D.A.J.; data curation, N.J.B.; writing—original draft preparation, N.J.B. and D.A.J.; writing—review and editing, N.J.B. and D.A.J.; visualization, N.J.B. and D.A.J.; supervision, D.A.J.; project administration, D.A.J.; funding acquisition, D.A.J. All authors have read and agreed to the published version of the manuscript.

Funding

The authors express their gratitude for the financial support of Verifi Technologies.

Data Availability Statement

Waveform data can be provided upon request to the corresponding author.

Acknowledgments

The authors would like to thank Ben Blandford and Gary Georgenson for their comments on the manuscript and discussions on potential applications.

Conflicts of Interest

The authors declare no conflict of interest.

References

  1. Barbero, E.J. Introduction to Composite Materials Design, 3rd ed.; CRC Press: Boca Raton, FL, USA, 2017; ISBN 978-1-315-29649-4. [Google Scholar]
  2. Aktaş, A.; Aktaş, M.; Turan, F. The Effect of Stacking Sequence on the Impact and Post-Impact Behavior of Woven/Knit Fabric Glass/Epoxy Hybrid Composites. Compos. Struct. 2013, 103, 119–135. [Google Scholar] [CrossRef]
  3. Caminero, M.A.; Rodríguez, G.P.; Muñoz, V. Effect of Stacking Sequence on Charpy Impact and Flexural Damage Behavior of Composite Laminates. Compos. Struct. 2016, 136, 345–357. [Google Scholar] [CrossRef]
  4. Caminero, M.A.; García-Moreno, I.; Rodríguez, G.P. Damage Resistance of Carbon Fibre Reinforced Epoxy Laminates Subjected to Low Velocity Impact: Effects of Laminate Thickness and Ply-Stacking Sequence. Polym. Test. 2017, 63, 530–541. [Google Scholar] [CrossRef]
  5. Fuoss, E.; Straznicky, P.V.; Poon, C. Effects of Stacking Sequence on the Impact Resistance in Composite Laminates—Part 1: Parametric Study. Compos. Struct. 1998, 41, 67–77. [Google Scholar] [CrossRef]
  6. Davila, Y.; Crouzeix, L.; Douchin, B.; Collombet, F.; Grunevald, Y.-H. Identification and Modelling of the In-Plane Reinforcement Orientation Variations in a CFRP Laminate Produced by Manual Lay-Up. Appl. Compos. Mater. 2018, 25, 647–660. [Google Scholar] [CrossRef]
  7. Heuer, H.; Schulze, M.; Pooch, M.; Gäbler, S.; Nocke, A.; Bardl, G.; Cherif, C.; Klein, M.; Kupke, R.; Vetter, R.; et al. Review on Quality Assurance along the CFRP Value Chain—Non-Destructive Testing of Fabrics, Preforms and CFRP by HF Radio Wave Techniques. Compos. Part B Eng. 2015, 77, 494–501. [Google Scholar] [CrossRef]
  8. Mizukami, K.; Mizutani, Y.; Todoroki, A.; Suzuki, Y. Detection of In-Plane and out-of-Plane Fiber Waviness in Unidirectional Carbon Fiber Reinforced Composites Using Eddy Current Testing. Compos. Part B Eng. 2016, 86, 84–94. [Google Scholar] [CrossRef]
  9. Park, D.-W.; Oh, G.-H.; Kim, H.-S. Predicting the Stacking Sequence of E-Glass Fiber Reinforced Polymer (GFRP) Epoxy Composite Using Terahertz Time-Domain Spectroscopy (THz-TDS) System. Compos. Part B Eng. 2019, 177, 107385. [Google Scholar] [CrossRef]
  10. Smith, R.A.; Clarke, B. Ultrasonic C-Scan Determination of Ply Stacking Sequence in Carbon-Fibre Composites. Insight—Non-Destr. Test. Cond. Monit. 1994, 36, 741–747. [Google Scholar]
  11. Hsu, D.K.; Fischer, B.A.; Koskamp, M. Shear Wave Ultrasonic Technique as an NDE Tool for Composite Laminates Before and After Curing. In Review of Progress in Quantitative Nondestructive Evaluation: Volume 16A; Thompson, D.O., Chimenti, D.E., Eds.; Review of Progress in Quantitative Nondestructive Evaluation; Springer: Boston, MA, USA, 1997; pp. 1975–1982. ISBN 978-1-4615-5947-4. [Google Scholar]
  12. Hsu, D.; Fei, D.; Liu, Z. Ultrasonically Mapping the Ply Layup of Composite Laminates. Mater. Eval. 2002, 60, 1099–1106. [Google Scholar]
  13. Im, K.-H.; Hsu, D.K.; Song, S.-J.; Park, J.-W.; Sim, J.-K.; Yang, I.Y. Ultrasonic Characterization on Sequences of CFRP Composites Based on Modeling and Motorized System. KSME Int. J. 2004, 18, 65–73. [Google Scholar] [CrossRef]
  14. Smith, R.A.; Nelson, L.J.; Mienczakowski, M.J.; Challis, R.E. Automated Analysis and Advanced Defect Characterisation from Ultrasonic Scans of Composites. Insight—Non-Destr. Test. Cond. Monit. 2009, 51, 82–87. [Google Scholar] [CrossRef]
  15. Stair, S.L. Non-Destructive Evaluation of Carbon Fiber-Reinforced Laminated Composites. Ph.D. Thesis, Baylor University, Waco, TX, USA, 2014. [Google Scholar]
  16. Nelson, L.J.; Smith, R.A. Fibre Direction and Stacking Sequence Measurement in Carbon Fibre Composites Using Radon Transforms of Ultrasonic Data. Compos. Part A Appl. Sci. Manuf. 2019, 118, 1–8. [Google Scholar] [CrossRef]
  17. Mehdikhani, M.; Breite, C.; Swolfs, Y.; Wevers, M.; Lomov, S.V.; Gorbatikh, L. Combining Digital Image Correlation with X-Ray Computed Tomography for Characterization of Fiber Orientation in Unidirectional Composites. Compos. Part A Appl. Sci. Manuf. 2021, 142, 106234. [Google Scholar] [CrossRef]
  18. Emerson, M.J.; Jespersen, K.M.; Dahl, A.B.; Conradsen, K.; Mikkelsen, L.P. Individual Fibre Segmentation from 3D X-Ray Computed Tomography for Characterising the Fibre Orientation in Unidirectional Composite Materials. Compos. Part A Appl. Sci. Manuf. 2017, 97, 83–92. [Google Scholar] [CrossRef]
  19. Yoshimura, A.; Hosoya, R.; Koyanagi, J.; Ogasawara, T. X-Ray Computed Tomography Used to Measure Fiber Orientation in CFRP Laminates. Adv. Compos. Mater. 2016, 25, 19–30. [Google Scholar] [CrossRef]
  20. Schöttl, L.; Dörr, D.; Pinter, P.; Weidenmann, K.A.; Elsner, P.; Kärger, L. A Novel Approach for Segmenting and Mapping of Local Fiber Orientation of Continuous Fiber-Reinforced Composite Laminates Based on Volumetric Images. NDT E Int. 2020, 110, 102194. [Google Scholar] [CrossRef]
  21. Moore, P.O. (Ed.) Nondestructive Testing Handbook, 3rd ed.; American Society for Nondestructive Testing: Columbus, OH, USA, 2007; Volume 7, ISBN Nondestructive Testing Handbook, Vol. 7: Ultrasonic Testing (UT), 3rd ed. [Google Scholar]
  22. Non-Destructive Testing and Inspection Market Worth $12.6 Billion by 2024. Available online: https://www.ndt.net/search/docs.php3?id=24191&msgID=0&rootID=0 (accessed on 26 July 2023).
  23. Blackman, N.J.; Jack, D.A.; Blandford, B.M. Improvement in the Quantification of Foreign Object Defects in Carbon Fiber Laminates Using Immersion Pulse-Echo Ultrasound. Materials 2021, 14, 2919. [Google Scholar] [CrossRef]
  24. Mohammadkhani, R.; Zanotti Fragonara, L.; Padiyar, M.J.; Petrunin, I.; Raposo, J.; Tsourdos, A.; Gray, I. Improving Depth Resolution of Ultrasonic Phased Array Imaging to Inspect Aerospace Composite Structures. Sensors 2020, 20, 559. [Google Scholar] [CrossRef]
  25. Ma, M.; Cao, H.; Jiang, M.; Sun, L.; Zhang, L.; Zhang, F.; Sui, Q.; Tian, A.; Liang, J.; Jia, L. High Precision Detection Method for Delamination Defects in Carbon Fiber Composite Laminates Based on Ultrasonic Technique and Signal Correlation Algorithm. Materials 2020, 13, 3840. [Google Scholar] [CrossRef]
  26. Wronkowicz-Katunin, A.; Katunin, A.; Dragan, K. Reconstruction of Barely Visible Impact Damage in Composite Structures Based on Non-Destructive Evaluation Results. Sensors 2019, 19, 4629. [Google Scholar] [CrossRef] [PubMed]
  27. Morokov, E.; Levin, V.; Chernov, A.; Shanygin, A. High Resolution Ply-by-Ply Ultrasound Imaging of Impact Damage in Thick CFRP Laminates by High-Frequency Acoustic Microscopy. Compos. Struct. 2021, 256, 113102. [Google Scholar] [CrossRef]
  28. Blandford, B.M.; Jack, D.A. High Resolution Depth and Area Measurements of Low Velocity Impact Damage in Carbon Fiber Laminates via an Ultrasonic Technique. Compos. Part B Eng. 2020, 188, 107843. [Google Scholar] [CrossRef]
  29. Yang, X.; Ju, B.-F.; Kersemans, M. Assessment of the 3D Ply-by-Ply Fiber Structure in Impacted CFRP by Means of Planar Ultrasound Computed Tomography (pU-CT). Compos. Struct. 2022, 279, 114745. [Google Scholar] [CrossRef]
  30. Pisharody, A.P.; Blandford, B.; Smith, D.E.; Jack, D.A. An Experimental Investigation on the Effect of Adhesive Distribution on Strength of Bonded Joints. Appl. Adhes. Sci. 2019, 7, 6. [Google Scholar] [CrossRef]
  31. Yilmaz, B.; Ba, A.; Jasiuniene, E.; Bui, H.-K.; Berthiau, G. Evaluation of Bonding Quality with Advanced Nondestructive Testing (NDT) and Data Fusion. Sensors 2020, 20, 5127. [Google Scholar] [CrossRef]
  32. Pyzik, P.; Ziaja-Sujdak, A.; Spytek, J.; O’Donnell, M.; Pelivanov, I.; Ambrozinski, L. Detection of Disbonds in Adhesively Bonded Aluminum Plates Using Laser-Generated Shear Acoustic Waves. Photoacoustics 2021, 21, 100226. [Google Scholar] [CrossRef]
  33. Segreto, T.; Bottillo, A.; Caggiano, A.; Teti, R.; Ricci, F. Full-Volume Ultrasonic Technique for 3D Thickness Reconstruction of CFRP Aeronautical Components. Procedia CIRP 2018, 67, 434–439. [Google Scholar] [CrossRef]
  34. Smith, R.A. Use of 3D Ultrasound Data Sets to Map the Localised Properties of Fibre-Reinforced Composites. Ph.D. Thesis, University of Nottingham, Nottingham, UK, 2010. [Google Scholar]
  35. Yang, X.; Verboven, E.; Ju, B.; Kersemans, M. Comparative Study of Ultrasonic Techniques for Reconstructing the Multilayer Structure of Composites. NDT E Int. 2021, 121, 102460. [Google Scholar] [CrossRef]
  36. Zilidou, M.; Smith, R.A.; Wilcox, P.D. Suppression of Front and Back Surface Reflections in Ultrasonic Analytic-Signal Responses from Composites. Ultrasonics 2022, 126, 106815. [Google Scholar] [CrossRef]
  37. Blackman, N.J. Evaluation of Carbon Fiber Laminates via the Use of Pulse-Echo Ultrasound to Quantify Ply-Stack Orientation and Manufacturing Defects. PhD Thesis, Baylor University, Waco, TX, USA, 2021. [Google Scholar]
  38. Nelson, L.J.; Smith, R.A.; Mienczakowski, M. Ply-Orientation Measurements in Composites Using Structure-Tensor Analysis of Volumetric Ultrasonic Data. Compos. Part A Appl. Sci. Manuf. 2018, 104, 108–119. [Google Scholar] [CrossRef]
  39. Schmerr, L.W. Fundamentals of Ultrasonic Nondestructive Evaluation: A Modeling Approach; Springer Series in Measurement Science and Technology; Springer International Publishing: Cham, Switzerland, 2016; ISBN 978-3-319-30461-8. [Google Scholar]
  40. Solomon, C.; Breckon, T. Fundamentals of Digital Image Processing: A Practical Approach with Examples in Matlab; John Wiley & Sons, Ltd.: Hoboken, NJ, USA, 2010; ISBN 978-0-470-68977-6. [Google Scholar]
Figure 1. Example of counting the plies within the laminate and capturing images for each ply to determine orientation.
Jcs 07 00398 g001
Figure 2. Averaged A-scan after alignment of A-scan data.
Jcs 07 00398 g002
Figure 3. Bulk A-scan for part 18C with the location of the 17 laminar interfaces and the back wall used to determine ply orientation marked with a red ‘x’.
Jcs 07 00398 g003
Figure 4. C-scan of fifth ply from part 18C, where color represents the normalized energy of the ultrasonic response.
Jcs 07 00398 g004
Figure 5. Two-dimensional FFT of the fifth ply from part 18C, where color represents the normalized energy and is plotted on a logarithmic scale.
Jcs 07 00398 g005
Figure 6. “One sided” 2D FFT of the fifth ply from part 18C, where color represents the normalized energy and is plotted on a logarithmic scale.
Jcs 07 00398 g006
Figure 7. “One sided” 2D FFT after filtering out frequencies too dissimilar from the weave pattern. Color represents the normalized amplitude and is plotted on a linear scale.
Jcs 07 00398 g007
Figure 8. C-Scan of fifth ply for part 18C with the predicted orientation from the 2D FFT analysis overlaid. The predicted orientation of layer 5, θ , is equal to 14°. The color represents the normalized energy of the gated ultrasonic signal.
Jcs 07 00398 g008
Figure 9. C-Scan of second ply for part 3B. The dominant predicted orientation of layer 2, θ , is equal to 11° and plotted in white, while the second most dominant orientation is 18° and is shown in red. The color represents the normalized energy of the gated ultrasonic signal.
Jcs 07 00398 g009
Table 1. List of laminates studied and their manufactured orientation.
Part NameNumber of PliesManufactured Orientation
3A3[10/85/75]
3B3[12/20/30]
3C3[45/30/45]
6A6[70/60/20/40/30/50]
6B6[15/25/65/65/25/15]
6C6[40/75/15/15/75/40]
12A12[60/60/00/30/60/15/15/60/30/00/60/60]
12B12[50/10/50/70/40/50/70/20/50/10/40/70]
12C12[20/80/40/20/35/60/60/35/20/40/80/20]
18A18[00/15/05/00/85/85/20/35/20/45/70/45/00/70/00/70/05/85]
18B18[25/65/55/15/85/45/20/50/80/80/40/35/25/00/65/10/30/35]
18C18[15/45/30/45/15/45/00/60/45/45/60/00/45/15/45/30/45/15]
Table 2. True Orientation of Laminate Samples After Burn Testing (Units Expressed in Degrees).
Lamina123456789101112131415161718
3A88873
3B101827
3C433143
6A706019422946
6B142265642313
6C397714167342
12A6058132591716583006058
12B48850694147682048104169
12C218039193357593520418024
18A315418787213420466946270171586
18B25665616884423518280423624265123234
18C14432843154315942445789441443284315
Table 3. Non-destructive Characterization of Laminate Orientations (Units Expressed in Degrees).
Lamina123456789101112131415161718
3A88773
3B111129
3C453143
6A705919432947
6B142365652314
6C417914177343
12A61610316117175929906159
12B47847673947672049114371
12C198141193357593320397923
18A017638790233720477147370373687
18B25675717874723518181433525367113335
18C14432943144390594343558743144127014
Table 4. Absolute Error of Non-destructive Characterization (Units Expressed in Degrees).
Lamina123456789101112131415161718
3A010
3B172
3C200
6A010101
6B010101
6C220101
12A131120111011
12B103220101122
12C212000020211
18A322203230121102211
18B011113001111112111
18C0010101011221021431
Disclaimer/Publisher’s Note: The statements, opinions and data contained in all publications are solely those of the individual author(s) and contributor(s) and not of MDPI and/or the editor(s). MDPI and/or the editor(s) disclaim responsibility for any injury to people or property resulting from any ideas, methods, instructions or products referred to in the content.

