Article

Densification of Ceramic Matrix Composite Preforms by Si2N2O Formed by Reaction of Si with SiO2 under High Nitrogen Pressure. Part 1: Materials Synthesis

Laboratoire des Composites ThermoStructuraux (LCTS), UMR 5801, CNRS, CEA, Safran, University Bordeaux, 33600 Pessac, France
*
Author to whom correspondence should be addressed.
J. Compos. Sci. 2021, 5(7), 178; https://doi.org/10.3390/jcs5070178
Submission received: 1 June 2021 / Revised: 25 June 2021 / Accepted: 1 July 2021 / Published: 7 July 2021
(This article belongs to the Special Issue Ceramic-Matrix Composites)

Abstract

:
Ceramic matrix composites (CMCs) have been designed and developed for extreme operating environments. The aim of the present study is to look for a rapid densification process providing a high level of material performance. The fibrous preform was made of Hi-Nicalon S fibers woven in a 3D interlock weave. The matrix was composed of Si2N2O prepared inside the CMCs by reacting a mixture of Si and SiO2 under high nitrogen pressure (1 to 3 MPa). Silica was either impregnated by slurry or obtained by oxidation of silicon grains inside the preform. The synthesis reaction was initiated by heating the impregnated preform by means of a carbon resistor submitted to Joule effect. Composition, homogeneity and porosity of the formed matrix were studied and interpreted as a function of the experimental parameters (nitrogen pressure, heating rate of the preform) as well as the recorded thermal history of the process. The present results show that the matrix formation is almost completed in less than one minute. Melting of silicon has a major influence on the process. Competition was observed between the formation of Si3N4 and Si2N2O, which could be mainly controlled by the heating rate of the preform and the nitrogen partial pressure.

1. Introduction

1.1. Ceramic Matrix Composites

Ceramic matrix composites (CMCs) have been designed and developed for extreme operating environments [1], such as high temperatures, mechanical stress and oxidizing atmospheres. Furthermore, these materials may be submitted to irradiation. They are composed of long filaments made of silicon carbide, carbon or oxide put together in a tow bundle and woven. The preform thus obtained is further embedded in a ceramic matrix. Though composed of brittle ceramic materials, the final composite is damage-resistant due to the presence of a thin pyrocarbon layer between the fibers and the matrix that prevents cracks originating from the matrix from propagating through the reinforcing fibers. CMCs are also lighter than metallic materials: their density ranges between 2 and 3, while Inconel density is as high as 8 kg/m3. These materials are, however expensive, partly due to the price of the high-performance fibers used, but also because of the densification process of the initial preform. Indeed, chemical vapor infiltration (CVI) is a long-lasting process performed at 1000 °C under reduced pressure.
The aim of the present study is to look for an alternative process to the CVI process that would allow for a rapid densification of a fiber preform while providing the same level of material’s performance. To our knowledge, this is the first attempt to densify a CMC by Si2N2O ceramic.

1.2. Choice of the Ceramic Matrix

Silicon-based ceramics such as SiC, Si3N4 or Si2N2O are well known for their attractive properties at high temperatures: high oxidation resistance and high mechanical properties, if we except toughness, which is the common weakness of most of the ceramics. Silicon based ceramics are also well known for their chemical inertness and low density [2]. The mechanical properties of Si2N2O are not as high as those of SiC and Si3N4 due to a more ionic character of the chemical bonding. Although Si2N2O gives lower mechanical strength to the CMC matrix, we focused our work on this compound on the grounds of the enhanced protection against oxidation it provides. Indeed, decomposition kinetics of Si2N2O is slow at high temperatures [3,4], and diffusion of O2 at 1200 °C is three orders of magnitude lower in Si2N2O than it is in SiO2 [5].
Si2N2O is the only ternary compound formed in the Si-O-N chemical system (Figure 1). Its composition and crystal structure have been precisely determined in 1964 (orthorhombic Cmc21) by Brosset and Idrestedt [6] and further refined by Sjoberg et al. [7]. It was only ten years later that the scientific community gradually started to look at its use. Thermodynamic measurements in the range 1200–1350 °C were carried out in the Si-O-N chemical system by Colquhoun et al. in 1973 [8]. They described the limiting conditions for the formation of the various phases in terms of nitrogen or oxygen partial pressures. Weiss et al. [9] first calculated phase equilibria in the C-Si-N-O chemical system. Hillert et al. [10] further assessed the thermodynamic properties of the Si-O-N system, and their data are still the reference. When considering the presence of the gas phase, the binary SiO2-Si3N4 phase diagram calculated by these authors (Figure 2) shows a congruent melting of Si2N2O at 2166 K. More recently, Rocabois et al. [11] measured the standard enthalpy of formation of Si2N2O by high-temperature mass spectrometric vaporization. As Si2N2O is in thermodynamic equilibrium with SiO2 and Si3N4, it is supposed to form at the interface between Si3N4 and SiO2 during the oxidation process of Si3N4. The presence of Si2N2O is assumed to be responsible for the low oxidation rate of Si3N4 [5,12]. However, Ogbuji and Bryan [13] never observed the presence of this compound at the interface between SiO2 and Si3N4 below 1400 °C. Instead, Ogbuji [14] identified a silicon oxynitride solid solution of graded composition.
Si3N4 is also a key compound for the studied process. For a comprehensive review of the properties and synthesis pathways of this compound, the reader is referred to the following articles: [15,16,17,18,19]. Only the information useful for this study is recalled hereafter.
Si3N4 has two allotropic crystalline forms: α-Si3N4 (rhomboedric, space group P31c), which is commonly referred to as the low temperature form, and ß-Si3N4 (hexagonal, space group P63/m), referred to as the high temperature form. Such a classification is, however, in conflict with free energy and density arguments [16]. In addition, the transformation at high temperature of the α-form into the ß-form is not straightforward, and the reverse reaction has never been observed; it is supposed to be too slow [17]. The literature shows that the α–ß transformation can occur only in presence of a liquid phase through the dissolution of the less stable and more soluble α-form, followed by the precipitation of the more stable and less soluble ß-form [18,19,20]. This has been confirmed by the study of the α–ß transformation of high-purity α-Si3N4 single crystals [21]: in the absence of a liquid phase, high-purity α-Si3N4 single crystals are stable up to 2200 °C. In the light of all the studies devoted to Si3N4, the α-form would better be understood as a metastable form of Si3N4 whose formation is the result of specific reaction pathways involving Si vapor or SiO species [22]. Therefore, the formation of the α- and ß-forms of Si3N4 should be considered as the result of two separate reaction mechanisms in kinetic competition [16,23].

1.3. Si-O-N Chemical System

Understanding the chemical reactivity of the Si-O-N system is a key issue for the implementation and control of the process. The reactivity between the various reactants is driven by thermodynamics and proceeds according to kinetics.

1.3.1. Phase Formation and Phase Stability

Si2N2O can be formed by reaction between N2 and a powder mixture composed of Si and SiO2 in the ratio 3/1 (balance Equation (1)). Reaction 1 is exothermic:
3/2 Si (l) + ½ SiO2 (s) + N2 (g) → Si2N2O (s) ΔrH1414 °C = −430 KJ/mol
However, N2 can also react with Si in all its physical states to form Si3N4 (balance Equation (2)). Reaction 2 is more exothermic than reaction 1: −777, −928, −2093 KJ/mol at the melting temperature of Si, when Si is, respectively, in its solid, liquid, gaseous state.
3Si + 2N2 (g) → Si3N4 (s)
The formed Si3N4 can further react at high temperature with SiO2 to form Si2N2O (balance Equation (3)):
Si3N4 (s) + SiO2 (s) → 2Si2N2O (s)
In order to look at the stability of the species formed under the reacting conditions encountered in our reactor, we have undertaken a thermodynamic calculation based on the minimization of the total Gibbs energy of the system under constant total pressure. Calculations were carried out by use of the Gemini II software together with the Coach database [24]. The database includes data related to Si2N2O and Si3N4 but does not make any distinction between the alpha and beta allotropic forms of the latter species, which are, probably very close to each other: the standard molar enthalpies of formation of the two allotropic forms are not discernible except for the uncertainties of the measurements [25]. The calculation shows that, when using an initial elemental composition corresponding to the stoichiometry of balance Equation (1) (N = 4, Si = 4, O = 2), Si2N2O is the only solid species formed in the range of temperature 20 to 1800 °C under a total pressure of N2 in the range 1 to 3 MPa. Moreover, the calculations show that N2 is the main gaseous species above the solid phase, although a significant amount of SiO(g) appears above 950 °C. In contrast, under the same conditions of temperatures and pressures, Si3N4 is formed together with Si2N2O for any surplus of atomic nitrogen over 4, which is in agreement with the isothermal section of the Si-N-O phase diagram (Figure 1).
These results reflect the great thermodynamic stability of Si2N2O as compared to other species in the Si-O-N chemical system. One can, however, wonder to what extent such a calculation is representative of the local conditions inside the preform. Indeed, the local variations of concentration as well as the relative amount of N2 may significantly depart from those used in the calculation. Moreover, it is expected that kinetic constraints play a major role in the formation of solid species during the process, which is, therefore, supposed to be largely out of equilibrium.

1.3.2. Reaction Pathways

The melting temperature of silicon (1414 °C) is right in the middle of the temperature domain where the reaction is expected to occur (1200 to 1600 °C). As the nitriding mechanisms involving solid or liquid silicon are basically different, the two cases must be distinguished.

Reactions Involving Solid Silicon

Our reactive medium is composed of high pressure N2 and a powder mixture composed of Si and SiO2 in the ratio 3/1 in order to form Si2N2O according to balance Equation (1). The amount of Si2N2O expected to form when Si is in its solid state should be very low, because of (i) the complexity of the reactive process involved in its formation and (ii) the short period of time before the melting of silicon during the heating ramp. In contrast, Si3N4 can easily be formed by nitriding solid Si.

Si3N4 Formed by Nitriding Solid Silicon

The literature dealing with the formation of Si3N4 by silicon powder nitriding is abundant, especially because of the industrial importance of the reaction-bonded silicon nitride (RBSN), which is, in some respects, similar to our process. Silicon nitriding produces a 27% volume increase when Si reacts with N2 [26]. However, the volume expansion observed in RBSN materials is almost entirely accommodated within the pore volume, and almost no size-change occurs in the compact during the nitriding process [26]. Note that this volume increase is partially offset by a 10% volume contraction when solid silicon melts.
The large variety of experimental conditions encountered in the literature and the influence of contaminants that can, even at the ppm level, lower the reaction rate or in contrast act as catalyst are sources of discrepancies. Since impurities in both the nitriding atmosphere and solid silicon may have a considerable influence on the mechanisms and kinetics of the nitriding process, a distinction has to be made between the use of high-purity silicon and the one of commercial silicon powders.
  • When using high-purity silicon below its melting temperature, the main following reactions are observed: ß-Si3N4 is formed by reaction between solid Si and N2, while α-Si3N4 forms on the appropriate surface by combination between Si vapor and N2 [15,16,26,27].
After a nucleation and growth process characterized by a linear regime as a function of time, during which the supply of nitrogen to the reaction sites is rate-limiting, ß-Si3N4 can continue to grow as long as N atoms are able to diffuse through the tens of nanometers thick growing layer. Because of the lack of mobility of nitrogen atoms in the Si3N4 lattice, when the layer grows thicker, the growth rate decreases and stops after a while [28]. It was mentioned by some authors that, if the surface mobility of silicon is high enough or if the growing crystal is in contact with liquid Si, N atoms can diffuse in the hexagonal tunnels of the structure along the c-axis of the ß-Si3N4 crystal to provide the reacting surface with nitrogen [29]. Such a diffusion process has, nevertheless, high activation energy.
In the range 1250 °C to the melting temperature of Si, the silicon vaporization rates are high enough to account for the observed reaction rates [30] (grain evaporation rate at 1350 °C: 9.7 10−7 kg.m−2s−1). Jennings [16] noticed that, though the growth of α-Si3N4 can be assimilated to a CVD process, the nature of the surface where the growth mechanism can proceed seems to be as important as the presence of silicon and nitrogen. This has been confirmed by Ekelund and Forslund [31], who tried unsuccessfully to promote epitaxial growth of α-Si3N4 on well-shaped crystals located close to some SiO2 material under nitrogen flow-rate at various temperature and pressure conditions. Rather, Si3N4 was formed preferentially as whiskers from fresh nucleation sites instead of depositing on existing crystal. In contrast to what happens in the case of ß-Si3N4, α-Si3N4 can continue to grow as long as Si vapor is available, that is, as long as the growing layer does not cover the totality of the Si surface. This happens when the Si3N4 layer produced by nucleation and growth is not continuous [32] or when the partial destruction of the growing Si3N4 layer due to its cracking or spalling can provide renewed silicon surfaces. It was suggested in the early 1960s [26] that the stress accumulated in the growing Si3N4 layer due to the 27% expansion in volume generated by the nitriding reaction can induce the spalling of Si3N4 particles, making the Si surface permanently accessible. More recently, Pigeon and Varma [30] have shown that, in the studied temperature range (1250–1400 °C), α-Si3N4 is predominantly formed following an intrinsic single-particle nitriding behavior (sharp interface model). The measured diffusion coefficient is, in this case, many orders of magnitude larger than the value usually measured in polycrystalline α- or ß-Si3N4, thanks to gaseous diffusion through the microcracks generated inside the growing Si3N4.
  • When using commercial silicon powder, the presence of some contaminants can have a strong effect on the nitriding mechanism: in particular, Fe in the solid phase [33,34,35], as well as O2, H2O and H2 [36] in the nitriding atmosphere.
As we introduce silica into our samples, we focus here on the influence of oxygen. Commercial silicon grains are usually covered with a very thin oxide layer (typically a few nanometers); the higher the surface area, the higher the amount of oxygen. Such a layer inhibits the nitriding reaction and causes an induction period, while its preliminary removal by a thermochemical treatment allows a rapid nitriding and the complete conversion of Si grains [37]. In a progress report from Atkinson and Moulson quoted by Moulson [15], it is mentioned that the addition of oxygen to the nitriding atmosphere does not inhibit the Si nitriding process, even though Messier et al. [38] have shown that very low levels of O2 can significantly lower its rate and the degree of nitriding. In contrast, Si grains covered by a 1 µm thick SiO2 layer cannot be nitrided [15]. Moulson [15] has stressed the influence of the gas phase composition on the morphology of the formed α-Si3N4: a dense Si3N4 layer is expected to form from the reaction between Si vapor and N2, while Si3N4 whiskers are expected to form from the reaction between SiO vapor and N2. Wang and Wada [39] have further confirmed that the presence of SiO is required to form whiskers, and Mukasyan and Borovinskaya [40] have suggested that silicon nitride whiskers may also be formed via a vapor–liquid–solid (VLS) mechanism.
The corresponding balance equation is, in our case, the following:
3 SiO (g) + 2 N2 (g) = Si3N4 (s) + 3/2 O2 (g)
It should be noticed that, due to the large thermodynamic stability of both SiO and N2 gaseous species that are the main gaseous species encountered in the thermodynamic equilibria calculated in the studied domain, the Gibbs free energy of reaction 4 is positive in the studied domain of temperature. Therefore, from a thermodynamic point of view, Si3N4 cannot be formed by the nitriding of SiO. When adding H2, the Gibbs free energy of reaction 5 is more favorable, as it is negative up to 1300 °C. This shows why the reaction between SiO and N2 to form Si3N4 requires a sink for the oxygen released by Equation (4) to be thermodynamically feasible.
3 SiO (g) + 2 N2 (g) + 3 H2 (g) = Si3N4 (s) + 3 H2O (g)
Very recently, Yao et al. [41] proposed a schematic of the nitriding process of a commercial silicon powder based on the potential Si-N-O phase diagram calculated at a series of temperatures. Such a diagram represents the domains of thermodynamic stability of the various solids formed in the Si-O-N system as a function of the partial pressures of O2 and N2. The calculations carried out by Yao et al. used thermodynamic data dating back to the early 1980s. Hillert et al. reassessed these data in 1992 [10]. The potential Si-N-O phase diagram presented by these latter authors is close to the one calculated by Yao et al. but extends above the melting temperature of Si and, therefore, includes the liquid slag between the phase fields for Si2N2O and SiO2.

Reactions Involving Liquid Silicon

Above the melting temperature of silicon, the situation is conspicuously different, and the Si grains tend to coalesce and form large volumes of liquid. Because of the high vapor pressure of silicon, Ge et al. [42] have estimated using a simple model that only 50 µs are required for the complete vaporization of 10 µm large Si particles at 1700 °C under 6 MPa N2.
The high vapor pressure of liquid silicon enhances the reactivity between silicon vapor and nitrogen to form α-Si3N4. As mentioned above, if ß-Si3N4 is in contact with liquid silicon, its growth can persist beyond the critical thickness (tens of nanometers), above which diffusion of atomic N through the Si3N4 layer stops. In such a case, the wetting properties of Si3N4 by liquid Si may have some influence, as they are highly sensitive to the surrounding atmosphere. Drevet et al. [43] have shown that, at 1430 °C under Ar flow, the contact with molten silicon is 49°, while it reaches 82° when a thin oxide layer covers Si3N4. This angle measured under vacuum decreases when temperature increases and reaches 12° at 1500 °C [44]. In the presence of N2 atmosphere, Swartz [45] has shown that, at 1430 °C and above 0.01 MPa, the surface of the Si drops rapidly covers with Si3N4 crust, thus preventing them from reaching the thermodynamic equilibrium angle. This crust prevents further interaction between the liquid and the gas phase. Because of the coalescence of the melted Si grains, it is impossible to attain the complete reaction of silicon. The first attempts to form Si3N4 by reaction between silicon powder and high-pressure nitrogen rapidly revealed that, under 10 MPa N2, it was necessary to add some inert ceramic to prevent this phenomenon [46,47]. The added ceramic acts as a thermal sink, which lowers the temperature increase of the material. As expected, increasing the amount of ceramic diluent decreases both the maximum temperature reached and duration of the reaction.
In the temperature domain of this study, the interaction between liquid silicon and solid silica is of prime importance and has, fortunately, been extensively studied because of the importance of this interaction in the production of high-quality silicon crystals by the Czochralski (Cz) method. The wetting angle of liquid Si with either vitreous silica [48] or quartz silica [49] is close to 90°. Silica can dissolve in liquid silicon by means of oxygen atoms diffusion in the melt and the simultaneous emission of SiO gas at the interface between the melted silicon and gas phase. Under reduced pressure and/or at high temperature, SiO gas can be generated at the interface between solid silica and liquid silicon, as revealed by the spreading instability of sessile drops that have been observed by Wachsmuth et al. [50]. The oxygen solubility in liquid Si is low. At the melting temperature of Si, the value of 3.07 1018 atoms/cm3 can be calculated by combining the molar fraction of oxygen given by the assessed thermodynamic data of the Si-O system carried out by Schnurre [51] and the molar volume of liquid Si [52]. This value is in good agreement with that measured by Narushima et al. at the same temperature (3.4 × 10¹⁸ atom/cm3) [53] as well as Hirata and Hoshikawa (2.8 × 10¹⁸ atom/cm3) [54]. The oxygen solubility in solid Si at 1414 °C is 2.68 × 10¹⁸ atoms/cm3 [51], which corresponds to an equilibrium distribution coefficient of oxygen between solid and liquid silicon equal to 0.873 [51]. In contrast to its solubility, the oxygen mobility in liquid Si is high (diffusion constant estimated at D = 3.3 × 10⁻⁴ cm2 s−1 [50]).
It is also important to know the nitrogen solubility of N in liquid Si. Dalaker and Tangstad [55] have measured its value in liquid silicon in equilibrium with a reaction-bonded silicon nitride crucible. The measured value (4.6 × 10¹⁸ atoms/cm3), which is in reasonable agreement with much of the previously published data, is only one-fourth of the oxygen solubility at the same temperature. Interestingly, these authors observed that equilibrium between the melt and Si3N4 is rapidly established, proving on the one hand the rapid dissolution mechanism at the crucible wall and on the other hand the negligible influence of the gas phase composition that has no detectable effect on the nitrogen solubility limit, at least under atmospheric pressure, at which the quoted measures have been carried out.

Si2N2O Formed in the Presence of Liquid Silicon

The range of temperature above the melting temperature of Si is the most favorable to the formation of Si2N2O from a mixture composed of Si/SiO2 (3/1) under high N2 pressure. In the temperature range 1414 to 1500 °C, Pradeille et al. [56] observed the formation of α-Si3N4 and minor traces of ß-Si3N4, in addition to Si2N2O. Miyasaki et al. [57] also observed the presence of α-Si3N4 in addition to Si2N2O at 1450 °C. In contrast, at 1600 °C under 30 MPa total pressure of nitrogen, Radwan et al. [58] observed the formation of a minor amount of ß-Si3N4 in addition to Si2N2O, but no α-Si3N4.
From a thermodynamic point of view, Si2N2O can also be formed by reaction between Si3N4 and SiO2 (balance Equation (3)). Persson et al. [59] have shown that the formation of fully dense Si2N2O is possible from an equimolar amount of SiO2 and Si3N4 using a hot isostatic pressing (HIP) technique, but at a temperature as high as 1900 °C. Only small amounts of α-Si3N4 and ß-Si3N4 (2 wt.% each) are detected in this case. At lower temperature, the rate of solid-state reaction between SiO2 and Si3N4 is extremely slow [60]. Although direct reaction between Si3N4 and SiO2 is thermodynamically possible at lower temperatures, the reaction requires the presence of an oxide additive that forms a liquid phase favoring the dissolution of Si3N4. Al2O3, Y2O3 and MgO are generally used, and Bergman and Heping [61] have shown that, for given time and temperature, the conversion rate to Si2N2O increases when the melting temperature of the added oxide decreases. In our case, molten Si above 1414 °C can play the role of the liquid phase favoring the dissolution of Si3N4 [20]. In contrast to Si3N4 and SiO2, liquid silicon does not wet Si2N2O; a value of 120° was measured by Deng et al. [62].
For the sake of completeness, it must lastly be pointed out that, if the temperature of the material subject to the reaction is too high, the thermal decomposition of both Si3N4 and Si2N2O may be observed. Si3N4 can decompose well below its melting point due to its dissociation into silicon and nitrogen. Bhata and Whitney [63] have shown that ß-Si3N4 decomposes into liquid Si and N2 gas following a first-order kinetics. Such decomposition is inhibited by the presence of Si and strongly inhibited by N2 in excess. Billy et al. 1979 [4] have studied the thermal decomposition of Si2N2O. They have shown that it decomposes into gaseous species SiO and N2 and solid Si3N4, whose allotropic forms are in the ratio α/ß = 2. At higher temperatures, the decomposition of Si3N4 occurs at the expense of the less stable α-form. The presence of nitrogen in the gas phase stabilizes Si2N2O.

2. Materials and Methods
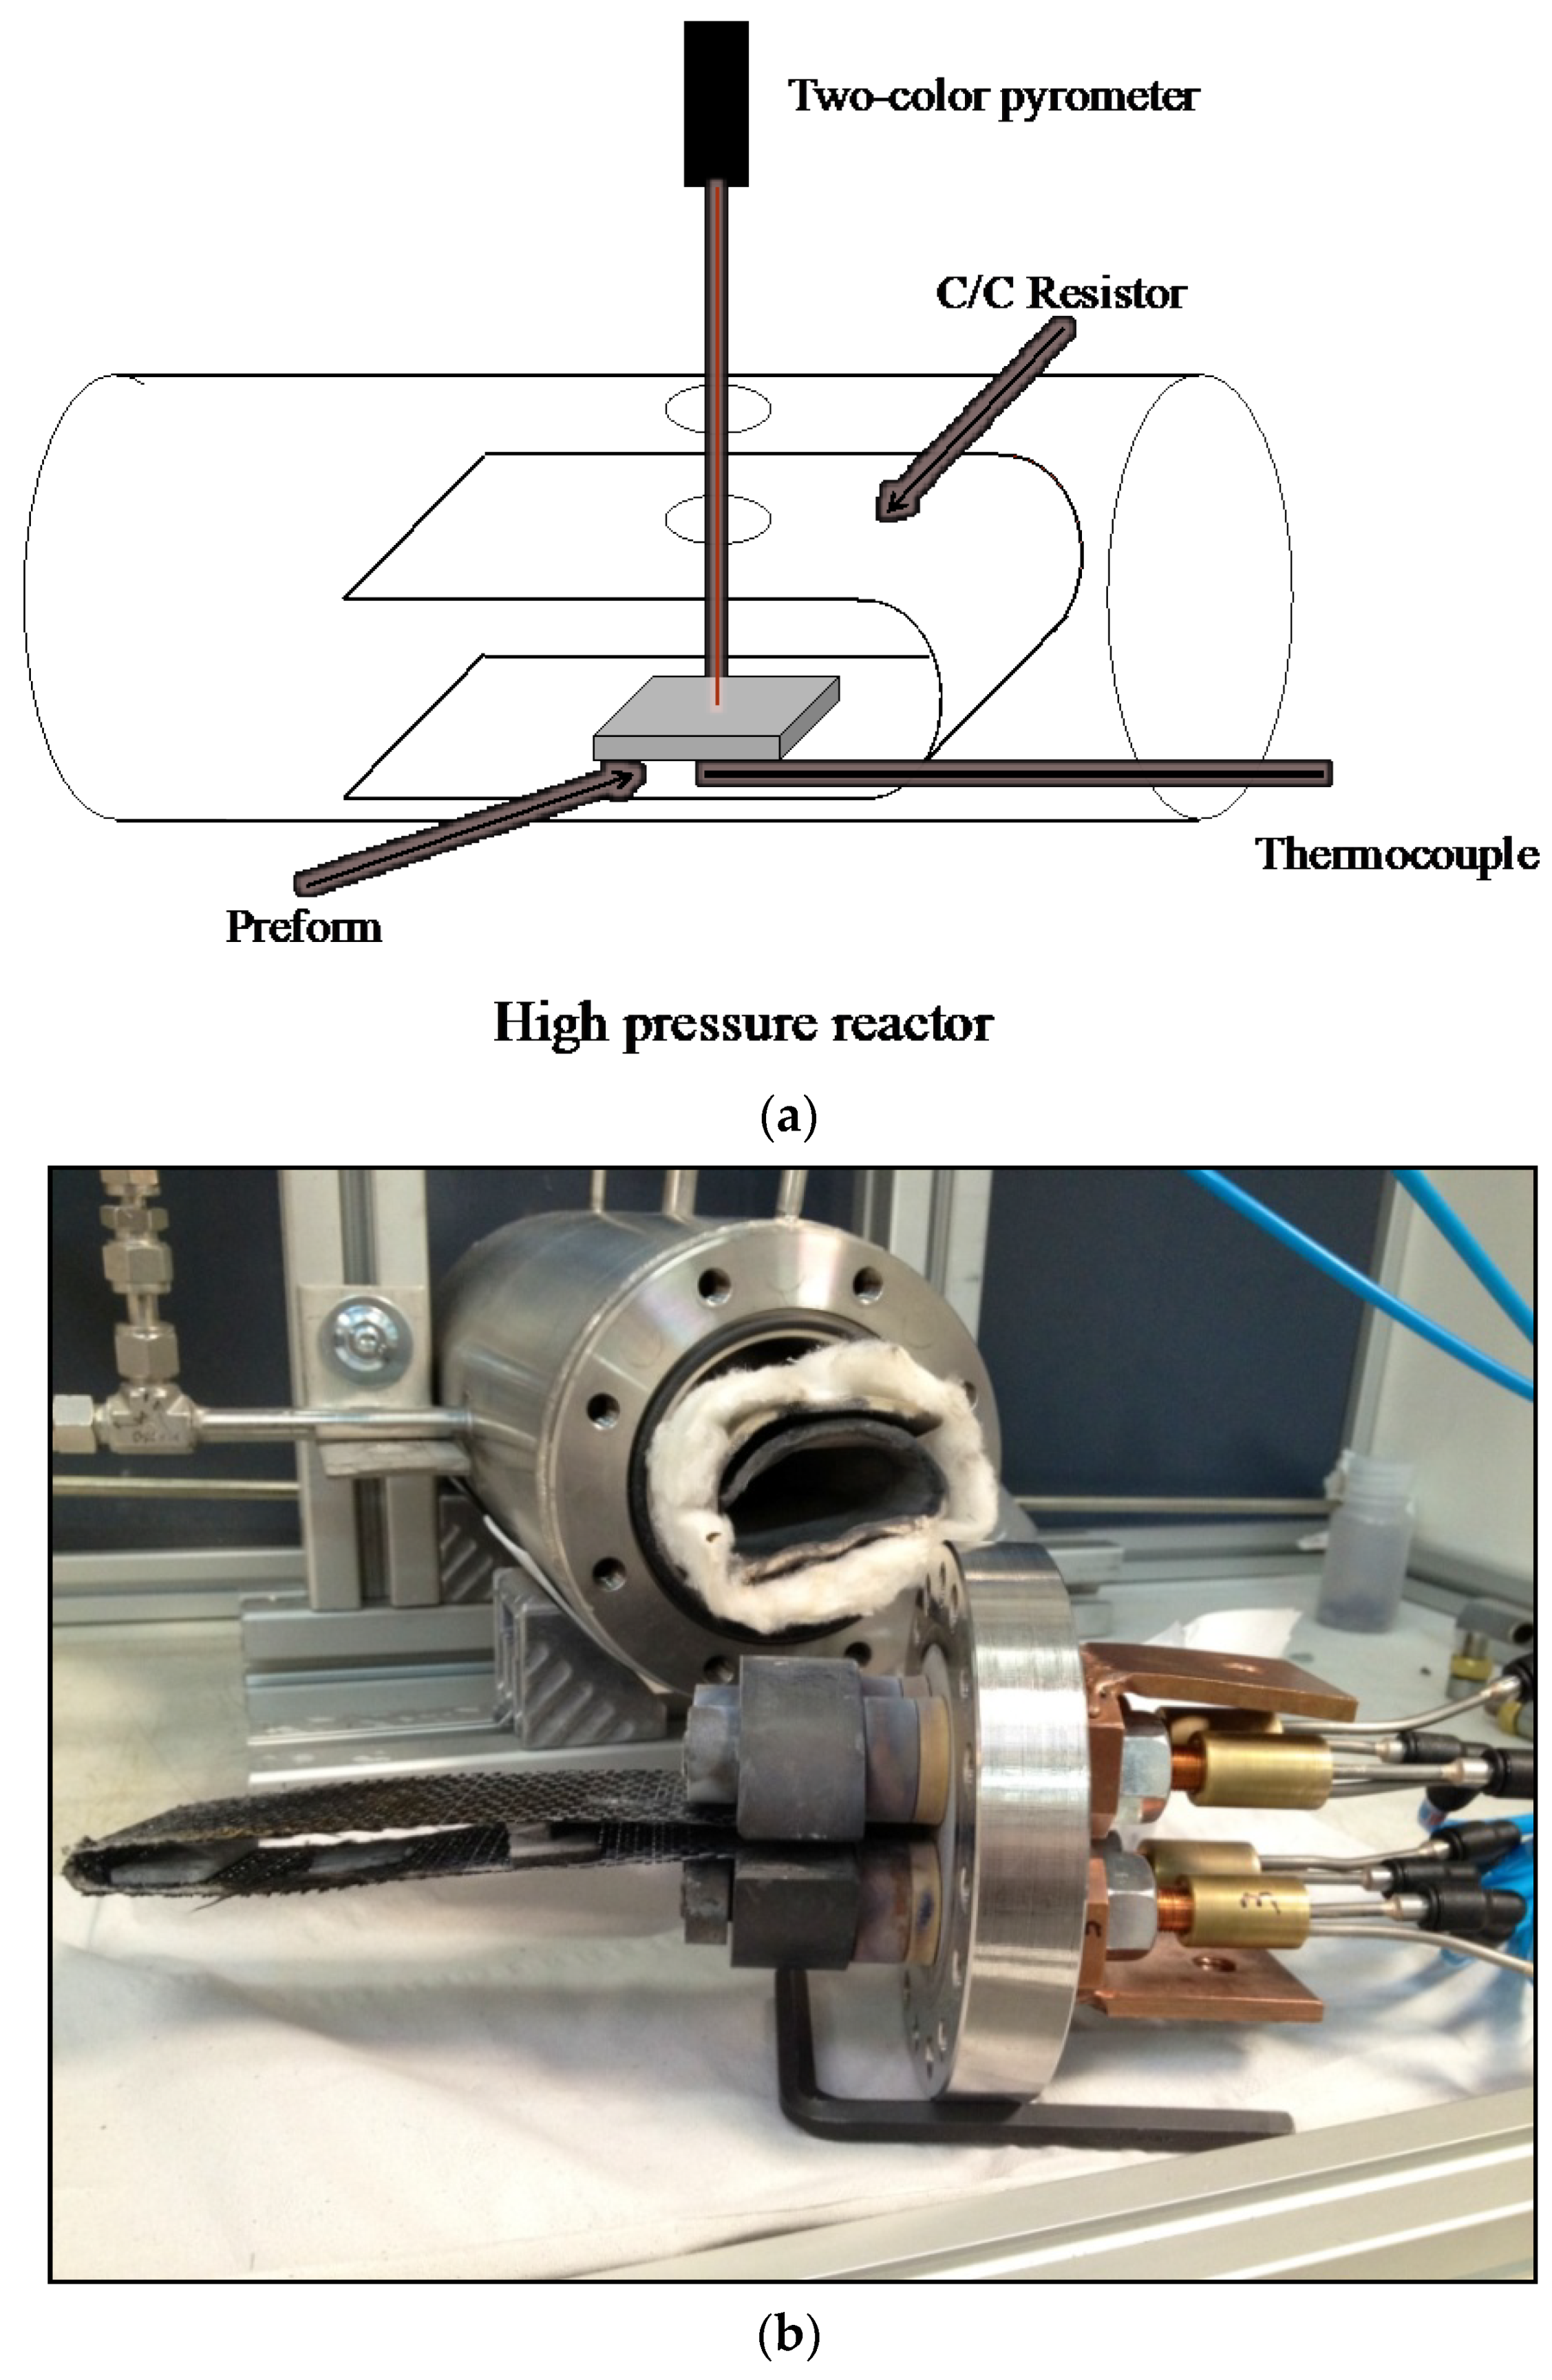
2.1. Reactor

The reaction is initiated by increasing the temperature of the powder using a constant temperature ramp until a critical value is reached, at which the reaction starts.
Powder compaction and total pressure of the gas phase are the two main factors of the process that influence both the reaction yield and composition of the synthetized material. It is usual practice to use a compaction pressure ranging between 100 to 300 MPa to improve thermal transfer in the powder and enhance the reaction kinetics. In our case, the use of CMC prevents from any compaction of the impregnated preform that would damage the reinforcing fibers. Therefore, the pressure of the gas phase is, in our case, the main parameter used to control the reaction. Moreover, the nitrogen gas used to impose the pressure inside the reactor is part of the reaction process: its pressure modifies the nitrogen chemical activity inside the reactor and thus has a critical influence on the composition of the synthetized ceramic. According to literature [56,64], the optimal range of nitrogen pressure used to synthetize Si2N2O is 2 to 3 MPa. From an experimental point of view, the use of high gaseous pressures increase the inertia of the system and enhances the thermal transfer from the heated substrate toward the walls of the reactor. A higher energy and, therefore, electrical intensity, are thus required to reach the reaction temperature. In order to prevent degradation of our water-cooled electrodes, the highest pressure that can be used in our reactor is 3 MPa. We, therefore, studied three nitrogen pressures: 1, 2 and 3 MPa.
The reactor was specifically designed and constructed for this study (Figure 3a,b). It is composed of a vessel made of 316 L inox and designed to withstand a pressure of 20 MPa. The vessel is equipped with a water jacket connected to a cooling device. The samples are heated by means of a resistor submitted to Joule effect. The resistor is made of 2D carbon/carbon composite material provided by Safran Ceramics. It is wrapped around the sample to be treated but not in direct contact with it. For that purpose, the sample is disposed in a mullite crucible, and two shim materials made also of mullite prevent the top surface of the sample from having any contact with the C/C resistor. The resistor is further disposed inside some zirconia felt in order to be thermally and electrically insulated from the metallic vessel.
The temperature of the resistor is controlled by a type S thermocouple, and the temperature of the sample measured by a two-color pyrometer. The thermocouple is located between the two layers of the resistor close to the sample and protected by a ceramic sheath. It is used to control the heating power supplied to the resistor. The pyrometer measures the surface temperature of the sample through a quartz window inserted in the upper part of the vessel and a circular hole cut on the top part of the resistor. The pyrometer signal is recorded in real-time using the Labview software. The total pressure inside the reactor is visually checked by a manometer and monitored by use of a pressure sensor (0–100 bar). Control of the total pressure is required because of the large pressure increase of the gas during the heat treatment.

2.2. Measurement of the Thermal Events Associated with the Chemical Reactions Occurring Inside the Preforms

The heat released during the reaction is key information to understanding the process. Special attention has been paid to this point and the temperature of the preform was continuously monitored during each experiment using a two-color pyrometer. Using such a pyrometer, it was not necessary to correct the measured surface temperature for the thermal radiation emissivity, assuming that the material behaves as a gray body. The recordings started (time 0) at 1100 °C, when the surface temperature of the preform was high enough to be read by the optical pyrometer and maintained until the end of the step temperature. The recorded thermograms were composed of several parts (see figures later in the text): a first linear part corresponding to the heating ramp imposed by the programmable temperature controller, some thermal peaks generated by the reactions occurring inside the preform and a final step temperature again imposed by the programmable temperature controller. The times at which both the melting temperature of silicon, which is a key feature of the process, and step temperature are reached are given in Table 1 for the heating rates used in this study. Either one or two thermal peaks were observed in the thermograms. Their shape and amplitude, which varied according to the experimental conditions, were analyzed using the ORIGIN software. For that purpose, it was necessary to subtract the baseline. When the peaks occur during the heating ramp, the baseline is the ramp of temperature imposed by the temperature controller. When the thermal peak extends in the temperature region where the step temperature is reached, the base line subtracted from the recorded peak is composed of a first part corresponding to the ramp and a second part corresponding to the step of temperature. Such a procedure is justified by the fact that the temperature of the resistor is supposed to be, at all times, the ambient temperature of the sample because of the large surface of the resistor (22 × 5 cm) as compared to the sample surface (2 × 2 cm). The peak obtained by subtracting the baseline was subsequently fitted using a Lorentzian function. When a peak could not be fitted by a single Lorentzian function, it was decomposed into two peaks fitted by a Lorentzian function using the ORIGIN software. We did not observe any peak being the sum of three peaks. Although the regression factors of the fits were good, the uncertainty about the area values measured in arbitrary units was at least 15%, mainly because of the extrapolation of the base lines. The temperature variation of the sample caused by the heat released or absorbed inside the preform depends on (i) the molar mass of the sample, which is constant, and on (ii) the heat capacity of the material that may change during the process depending on the phases that are formed. The heat released or absorbed during the reactions was, therefore, estimated from the areas of the thermal peaks but expressed in arbitrary units and only used to provide a basis for comparison of the thermal events. It should be noted that the surface temperature of the sample measured by the pyrometer was always about 60 °C lower than the temperature measured by the thermocouple located near the sample. Moreover, the surface temperature of the sample is expected to be lower than its bulk temperature when an exothermic reaction occurs inside the sample; the opposite behavior is expected in the case of an endothermic process. At high heating rates, one should also take into account the time shift between the temperature imposed by the carbon resistor and the effective temperature of the sample. All these remarks lead to being careful with the effective bulk temperature of the sample associated with the observed surface temperature.

2.3. Experimental Procedure

The reactor was first evacuated during 30 min. It was further purged three times with nitrogen. The loading nitrogen pressure was then imposed at room temperature. The reactor was heated at a constant rate in the range 50 to 300 °C/min with a temperature set of 1430 °C so as to ensure the melting of silicon. Such a procedure is aimed at studying a wide variety of situations in which silicon may or may not react before its melting. The reaction usually started during the heating ramp and generated a heat pulse. When the temperature set was reached, it was maintained during 10 min, and the reactor was further cooled down to room temperature at a controlled rate. As the total amount of nitrogen gas was introduced into the reactor at one time at the beginning of the experiment, the loading nitrogen pressure at room temperature was calibrated so that the desired pressure of nitrogen was reached at 1430 °C.

2.4. Nature and Preparation of the 3D Preform

The fibrous preform, manufactured by Safran Ceramics, was made of Hi-Nicalon S fibers woven in a 3D interlock weave. The choice of high-performance fibers was dictated by the exothermic nature of the reactions occurring in the preform. Although the time during which the fibers are exposed to high temperatures is short, the heat released may have detrimental effect on the fibers if they are not designed to withstand high temperatures.
The preform was submitted to the same process used to prepare CMC materials. It was first submitted to chemical vapor infiltration (CVI) with hydrocarbon precursors in order to deposit a thin layer of pyrocarbon on the surface of the fibers. The preform was further predensified by growing a layer of ß-SiC a few micrometers thick. Such a layer, which acts as a consolidation layer, provides the stiffness required to handle the preform. Two typical thicknesses of ß-SiC were used: 1 and 5 µm, corresponding to a preform porosity of 53 and 35%, respectively. The use of a 5 µm thick SiC consolidation layer requires less matrix material to be formed by reaction, and the mechanical properties of the preform are enhanced. It furthermore provides a better protection to the fibers against the heat released by the reaction. In contrast, it has two main drawbacks: the access of the powder slurry to the fiber network is reduced, especially to the intra-porosity of the multifilament yarns, and the heat released by the reaction is weakened. The latter phenomenon results from (i) a lower amount of powder mixture introduced inside the preform and (ii) the thermal sink behavior of SiC that absorbs part of the heat released and thus limits the maximum temperature reached.

2.5. Powder and Slurry Preparations

We used commercial silicon and silica powders as starting materials:
-
Aldrich Silicon powder, 325 mesh, purity 99% (trace of metals, nature not specified)
-
Aldrich Silicon dioxide with a quartz structure, 0.5–10 μm grain size (80% in the range 1–5 μm), purity 99% (trace of metals, nature not specified)
We chose to use crystallized silica in order to easily check for its residual presence, which was postmortem measured by XRD.
In order to enhance the grain size homogeneity and decrease the mean grain size to improve the impregnation process, the powders were ground by use of a NETZSCH MiniPur grinding system. Powders were transported in a closed-loop system by a low viscosity liquid and ground by yttria-stabilized zirconia spheres having a diameter of 300 µm. We checked for the absence of metallic pollution caused by the spheres by using electron probe micro analysis using wavelength dispersive spectroscopy (EPMA–WDS Cameca SX 100, operating at 7 kV and 10 nA) applied to the ground powders. Silicon was ground in a mixture of isopropanol and ethanol to prevent any reactivity, while silica was ground in distilled water. The grain size was adjusted down to 600 nm, thanks to an ongoing control of the attrition process using a laser particle size analyzer. The FRITSCH Analysette 22 nanotec used for that purpose measures the grain size distribution in the range 0.01 to 2000 µm. Typical initial and final grain sizes of silicon and silica powders are displayed in Figure 4a,b respectively. A grain size of 600 nm was used for all the experiments presented in this paper.
Powder impregnation into the preform was carried out by suction of a powder slurry composed of a mixture of silicon and silica in the proportions required to form Si2N2O, i.e., Si/SiO2 = 3 according to balance Equation (1). We used a volume load of 20% in distilled water to optimize the viscosity of the slurry. After preparation, the slurry had to be stable at least until its use for the impregnation process. Its stability was controlled by means of pH adjustment. As a thin layer of SiO2 is always present at the surface of silicon grains, both silica and silicon show electrostatic repulsion between grains. However, the wettability of silicon strongly depends on the thickness of the oxide layer formed on exposure to air. When the oxide layer is very thin, the wettability is low, and a surfactant has to be added to the solution [65]. We therefore increased the thickness of the oxide layer up to a few nanometers at the surface of silicon grains by means of a heat treatment in air at 600 °C during 6 h.
In an aqueous medium, SiO2 forms Si-OH (silanols) groups at its surface [66]. Acidic pH favors the formation of SiOH2+, though SiO is formed with basic pH [65]. pH adjustment was obtained by use of a strong base: tetramethylammonium hydroxyde (TMAH). TMAH favors the decomposition of silanol groups, increases the negative charge at the surface of the grains and, thus, the absolute value of the zeta potential. The chemical stability of the suspension increases with pH [67], and a pH higher than 6 is required to insure its stability [68]. However, when pH is greater than 10, the oxide layer is dissolved, and silicon hydrolysis proceeds according to the following balance equation [69]:
Si (s) + 2H2O (l) → SiO2 (s) + 2H2 (g)
In order to limit the influence of this reaction whose kinetics are enhanced by small grain size, a pH value of 9 was found to provide a good stabilization of the slurry during the impregnation process, while avoiding the hydrolysis reaction of silicon.

2.6. Powder Impregnation of the Preform

The preform samples were square-shaped (20 × 20 mm) and 3.6 mm thick. Impregnation was carried out by suction of submicron powder slurry. For that purpose, a pressure was imposed to the top part of the preform in contact with the slurry by means of nitrogen under 4 bars, while the bottom part was evacuated under primary vacuum. This pressure difference on the two sides of the sample forces the slurry to go through the preform. A fiberglass filter disposed at the bottom of the preform retained particles, while the liquid was aspired downwards. Impregnation proceeded throughout two hours. The preform was then dried in an oven at 100 °C for one hour. The weight gain measured after impregnation revealed that the suction process filled between 50 and 55% of the initial open porosity of the preform, which corresponds to a remaining percentage of open porosity lying in the range 20 to 25%. No noticeable macroporosity was observed after drying, the powder being uniformly spread into the preform. The open porosity of the preform after impregnation was measured by mercury porosimetry using a Micromeritics Autopore IV 9500 porosimeter. The pore size distribution shows a monomodal distribution centered at 50 nm (Figure 5). Grain size of the powder, stabilization of the slurry and weaving pattern of the preform are the main parameters that controlled the impregnation process.

2.7. Silica Powder Produced by Oxidation of Silicon Powder Inside the Preform

In our standard process, a mixture of powders composed of silicon and silica was introduced into the preform by suction of slurry. It is also possible to form silica inside the preform by oxidizing part of the impregnated silicon. Two main advantages are expected from this modified process: (i) the volume increase resulting from oxidation of silicon into silica improves the densification of the matrix, and (ii) the silica layer formed by oxidation around the Si grains is expected to limit the reaction between Si and N2, thus limiting the formation of Si3N4. In order to optimize the oxidation process, thermogravimetric (TGA SETARAM TAG24) studies were carried out under ambient air. The heating rate was 15 °C/min, and two temperature steps were tested: 900 °C and 1000 °C. The measured weight gain gives the amount of silica formed by oxidation of silicon. If all the silica needed for the reaction (i.e., Si/SiO2 = 3) is provided by oxidation of the silicon powder, the weight gain is close to 40%. TGA results show that more than 4 h and 1 h 15 min are respectively required at 900 °C and 1000 °C to reach a weight gain of about 40%.
We also studied a mixed process in which a part of the silica needed for the reaction was still introduced into the preform in the form of slurry, and a part of it was obtained by in situ oxidation of the silicon introduced in the form of slurry. The powder suspension used to prepare the slurry was composed in this case of 73 wt.% of silicon and 27 wt.% of silica, and a weight gain of about 20% was obtained. The result of the oxidations carried out on both green bodies and preforms impregnated by powders are displayed in Table 2. In the case of preforms, the calculation of the variation in weight (Table 2) assumes that the silicon carbide fibers are not oxidized. This assumption is not entirely true, because the weight gains calculated in such a case are slightly higher than those calculated in the case of green bodies. However, under the same experimental conditions, weight gains in both cases are about the same and close to those expected. XRD analysis of silicon green bodies after oxidation process reveals a bump at small angles, which is characteristic of the presence of amorphous silica.

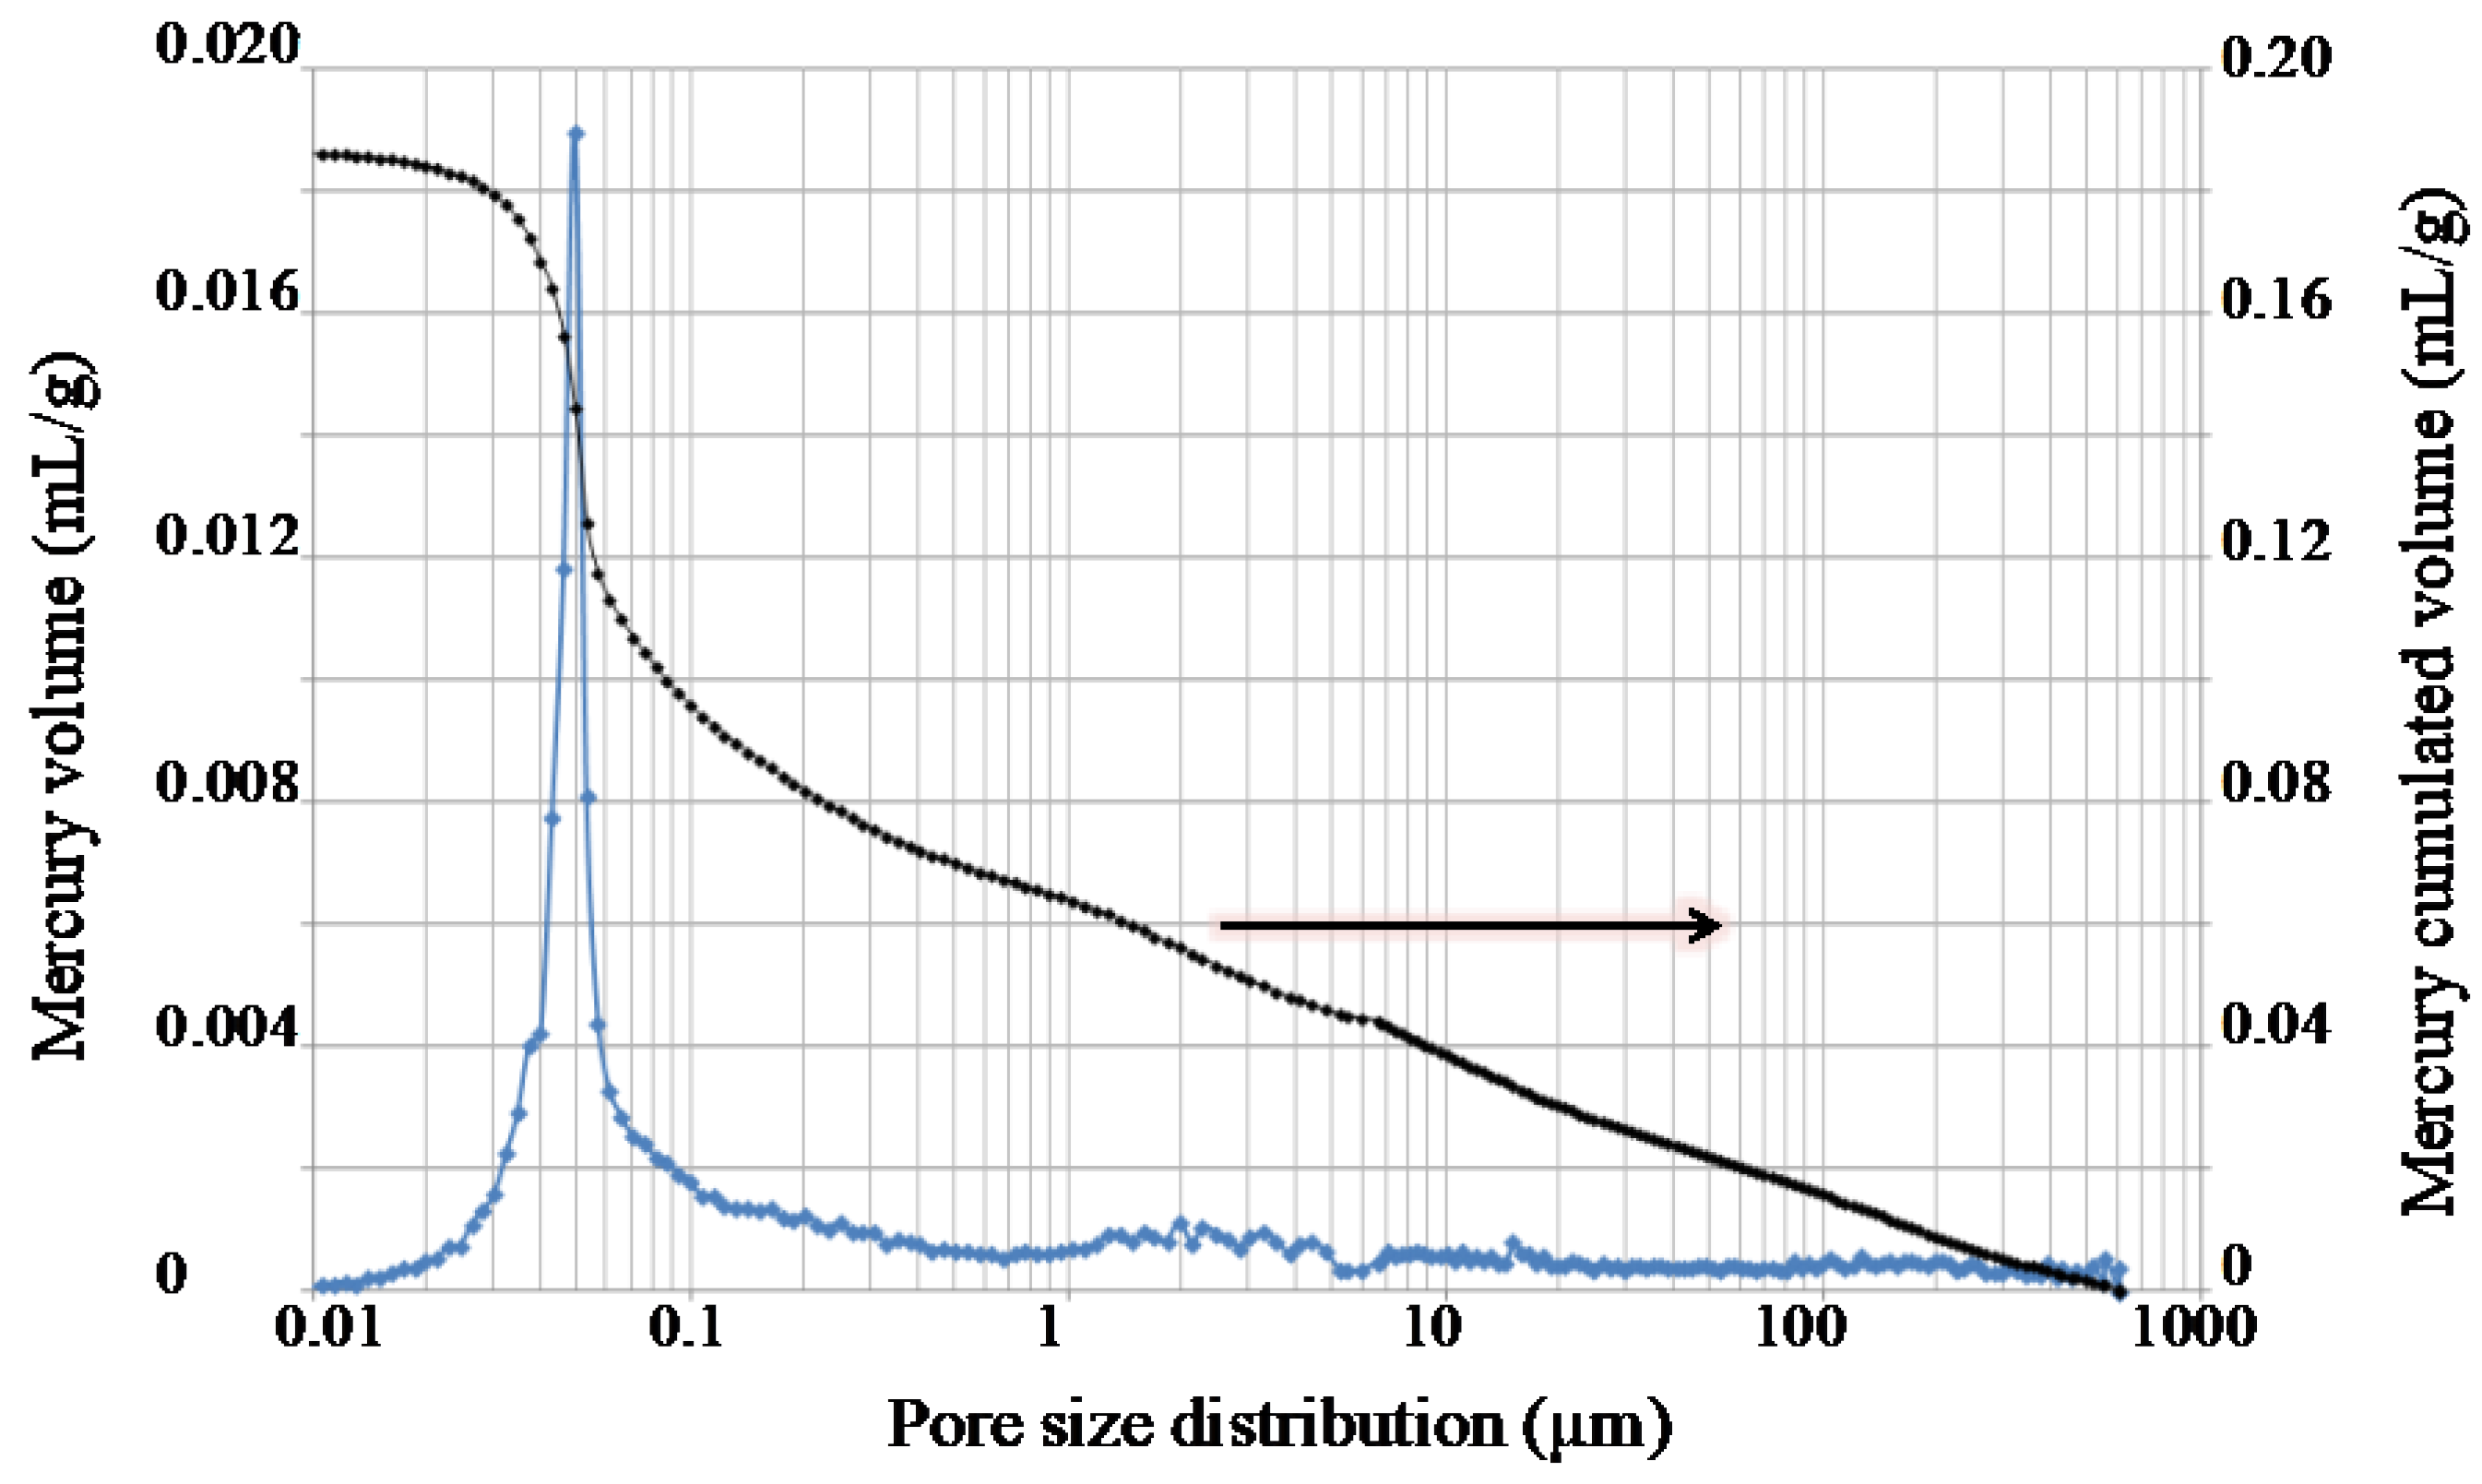
2.8. Characterization of the Processed Composites

The prepared samples were observed by scanning electron microscopy (SEM FEI QUANTA 400 FEG V3) equipped with energy dispersive X-ray spectrometry (EDS) that allowed for making cartographies of chemical elements. The crystallized phases were characterized and quantified by X-ray diffraction (Bruker D8 advance equipped with copper anticathode Lambda Kα1-2). Analysis was carried out on a cross-section in the center of the sample. The peak intensities were deduced from their integrated surfaces using the Topas software. Composition of the material was calculated by fitting the theoretical spectrum to the experimental one (method without standard). A limited angular range of 2θ (16 to 32°) was used. It corresponds to the angular range of presence of the expected phases in the matrix while excluding peaks related to SiC belonging to both the fibers and consolidation layer.
A typical XRD spectrum of the processed composite is presented in Figure 6. Only peaks related to the matrix material are revealed on the spectrum. Among the starting materials, peaks related to silica (quartz) were never observed after the reaction, which means that the entire amount of silica introduced into the preform was consumed. In contrast, peaks related to silicon were or were not observed according to the experimental conditions. The maximum content of unreacted silicon left after the reaction could reach about 20 wt.% but was mainly lower than 3 wt.% in the whole range of parameters investigated. Silicon and alpha and beta silicon nitride as well as silicon oxynitride were also indexed. In addition to the peaks related to the Si2N2O Sinoite structure ([6,7] orthorhombic Cmc21, red peaks Table 3), supplementary peaks (orange peaks) were observed and could not be indexed using our database. The unknown phase was identified on the ground of a phase belonging to the Si-Al-O-N chemical system. The characterized structure corresponds to a compound initially reported by Bowden et al. [70] as Si1.8Al0.2O1.2N1.8. This phase has the same sheet structure as O’-SiAlON (Si2−xAlxO1+xN2−x) but with a different stacking arrangement. It has been synthetized by Bowden below 1350 °C, but it transforms to conventional O’-SiAlON above this temperature. Because the peaks related to such a phase were slightly shifted in our diffraction diagram as compared to the values published by Bowden et al. [70], a new Si2N2O structure with the same space group (Bba2) as Si1.8Al0.2O1.2N1.8 was simulated and compared with the XRD spectrum of a green body sample prepared in our reactor. Using this sample, the XRD analysis could be performed over a wide angular range (10–70 2θ°), since the silicon carbide from the fiber preform was absent. The crystal–chemical parameters of the Bba2 Si2N2O phase were extracted directly by Rietveld refinement and fitted by least squares method. The parameters thus obtained were used in XRD analysis (Table 3). Apart from the crucible holding our samples and two shim materials that were both made of mullite, aluminum is not part of our experimental setup nor of the material used during the experimental procedure. Due to the chemical stability of the mullite and the short residence time at high temperature during our process, aluminum is less likely coming from the mullite parts. Furthermore, the postmortem observation of these parts did not reveal any trace of corrosion nor interaction with the sample or the resistor. We nevertheless carried out EPMA–WDS analysis on a cross-section of our samples in the whole matrix domain to check for the presence of aluminum. Though Al corresponds to 4 wt.% of the composition of the sought phase, Al signal was always under the detection threshold (0.2 wt.%) of the probe. We therefore assume that the phase identified in the matrix is isostructural with Si1.8Al0.2O1.2N1.8, but without including aluminum or at least at a very low concentration.

3. Results

As already mentioned, the reactions of formation of Si3N4 and Si2N2O are in competition in the present material synthesis. Time–temperature history, nitrogen pressure that imposes the nitrogen chemical activity and powder grain size that modifies the grain reactivity are all factors that may influence the composition of the formed matrix. In addition, these factors are not independent. A first set of experiments was carried out to check for the effect of both the nitrogen pressure and heating rate. For that purpose, we used preforms consolidated with a 1µm thick SiC layer, and a powder mixture Si/SiO2 (3/1) was introduced into the preform by suction of slurry. Experimental conditions, composition of the formed materials as characterized by XRD and residual open porosity of the matrix as measured by mercury porosimetry are gathered in Table 4. The amount of powder introduced into the preforms was measured by the weight variation of the preform before and after suction of slurry. The preform was dried after slurry suction before weight measurement.

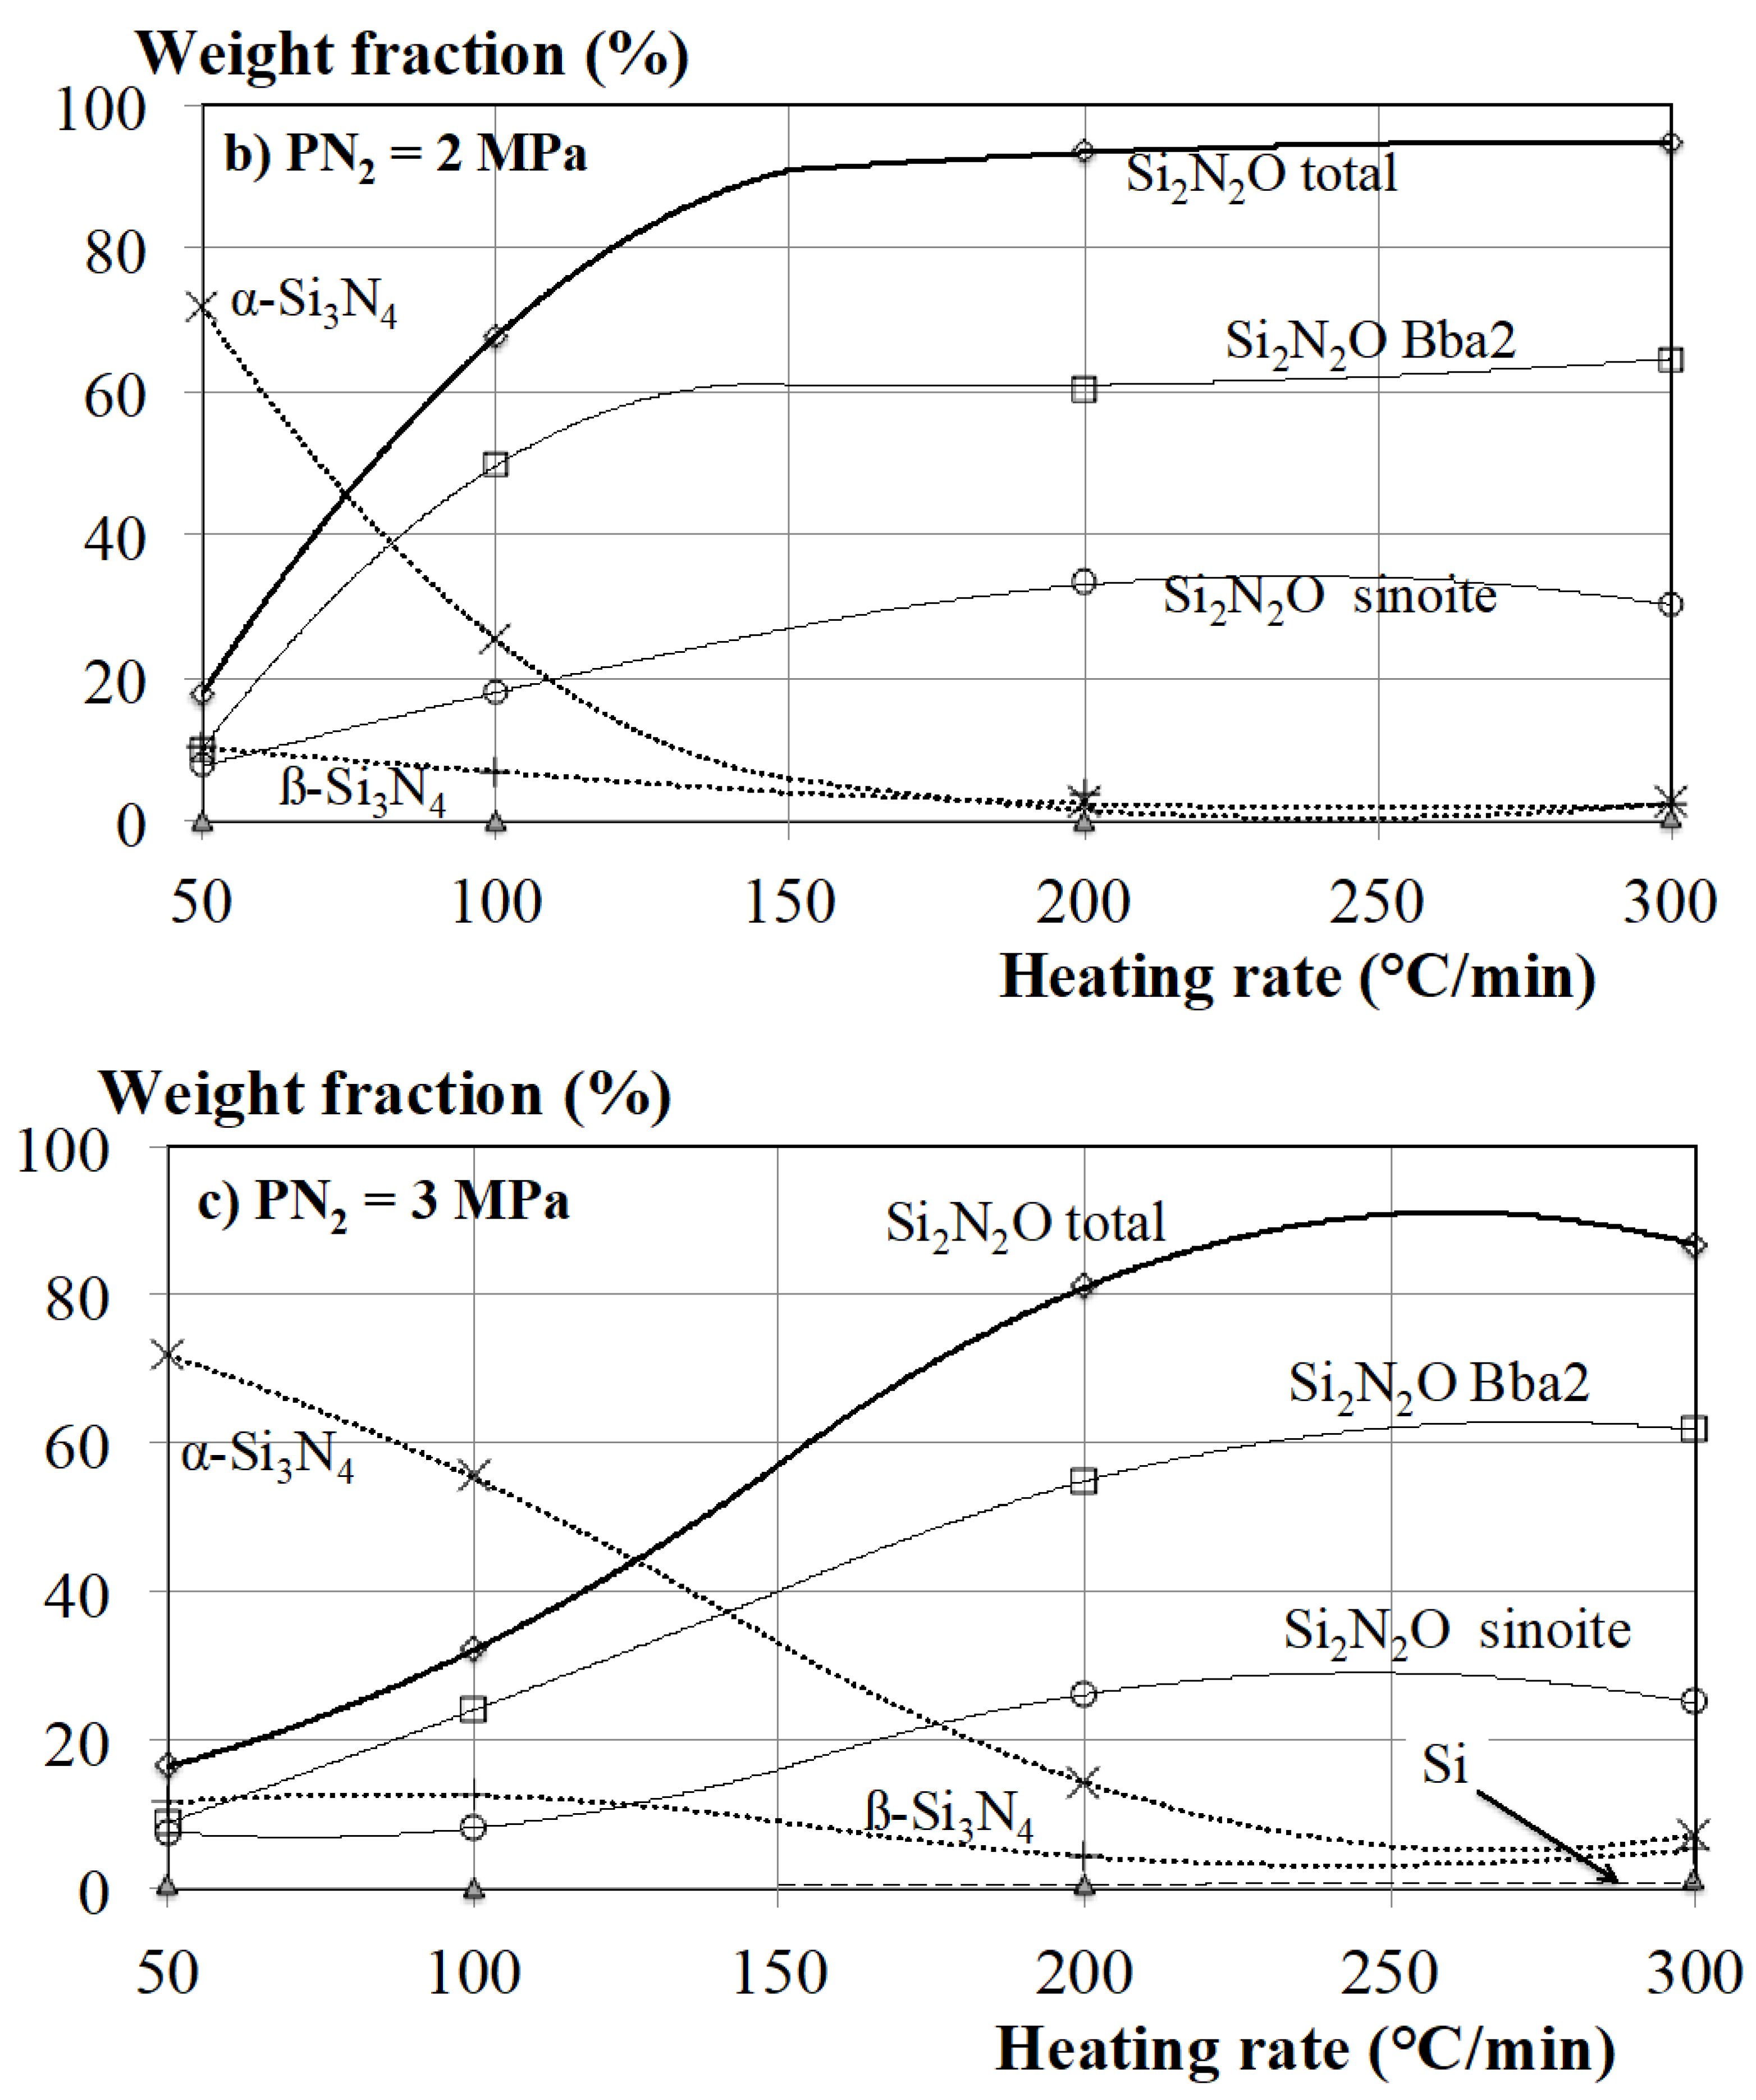
3.1. Effect of Both the Nitrogen Pressure and Heating Rate of the Sample on the Composition of the Processed Material

The effect of both the nitrogen pressure and heating rate on the composition of the processed material can be observed in Figure 7a–c. The weight percentage of each phase was determined from XRD analysis, as described in the previous section.
As a general trend, for given nitrogen pressure, the amount of α-Si3N4, which is the main phase formed at the lowest heating rate, decreases as the heating rate increases. Simultaneously, the ratio of Si2N2O (both the sinoite and Bba2 allotropic forms) increases. The ß-Si3N4 wt.% is, in any case, lower than the one of α-Si3N4. Itis, in all the studied conditions, lower than about 10 wt.%. In the same way, for α-Si3N4, its ratio decreases when the heating rate increases. Increasing the nitrogen pressure tends to increase the ratio of α-Si3N4 at low heating rate and the ratio of Si2N2O at high heating rate. The maximum content of Si2N2O (97 wt.% for the sum of the sinoite and the Bba2 allotropic forms) is observed at a nitrogen pressure of 2 MPa and a heating rate in the range 200 to 300 °C/min. Increasing the nitrogen pressure tends to shift the formation of high amount of Si2N2O toward higher heating rates.
Bba2 Si2N2O is the main phase formed in the studied domain. High nitrogen pressure favors its formation at the expense of the sinoite form. As the sinoite Cmc21 form is the only stable phase described in the literature, the Bba2 allotropic form should be considered as a metastable phase whose formation is favored by the reaction path induced by the process.

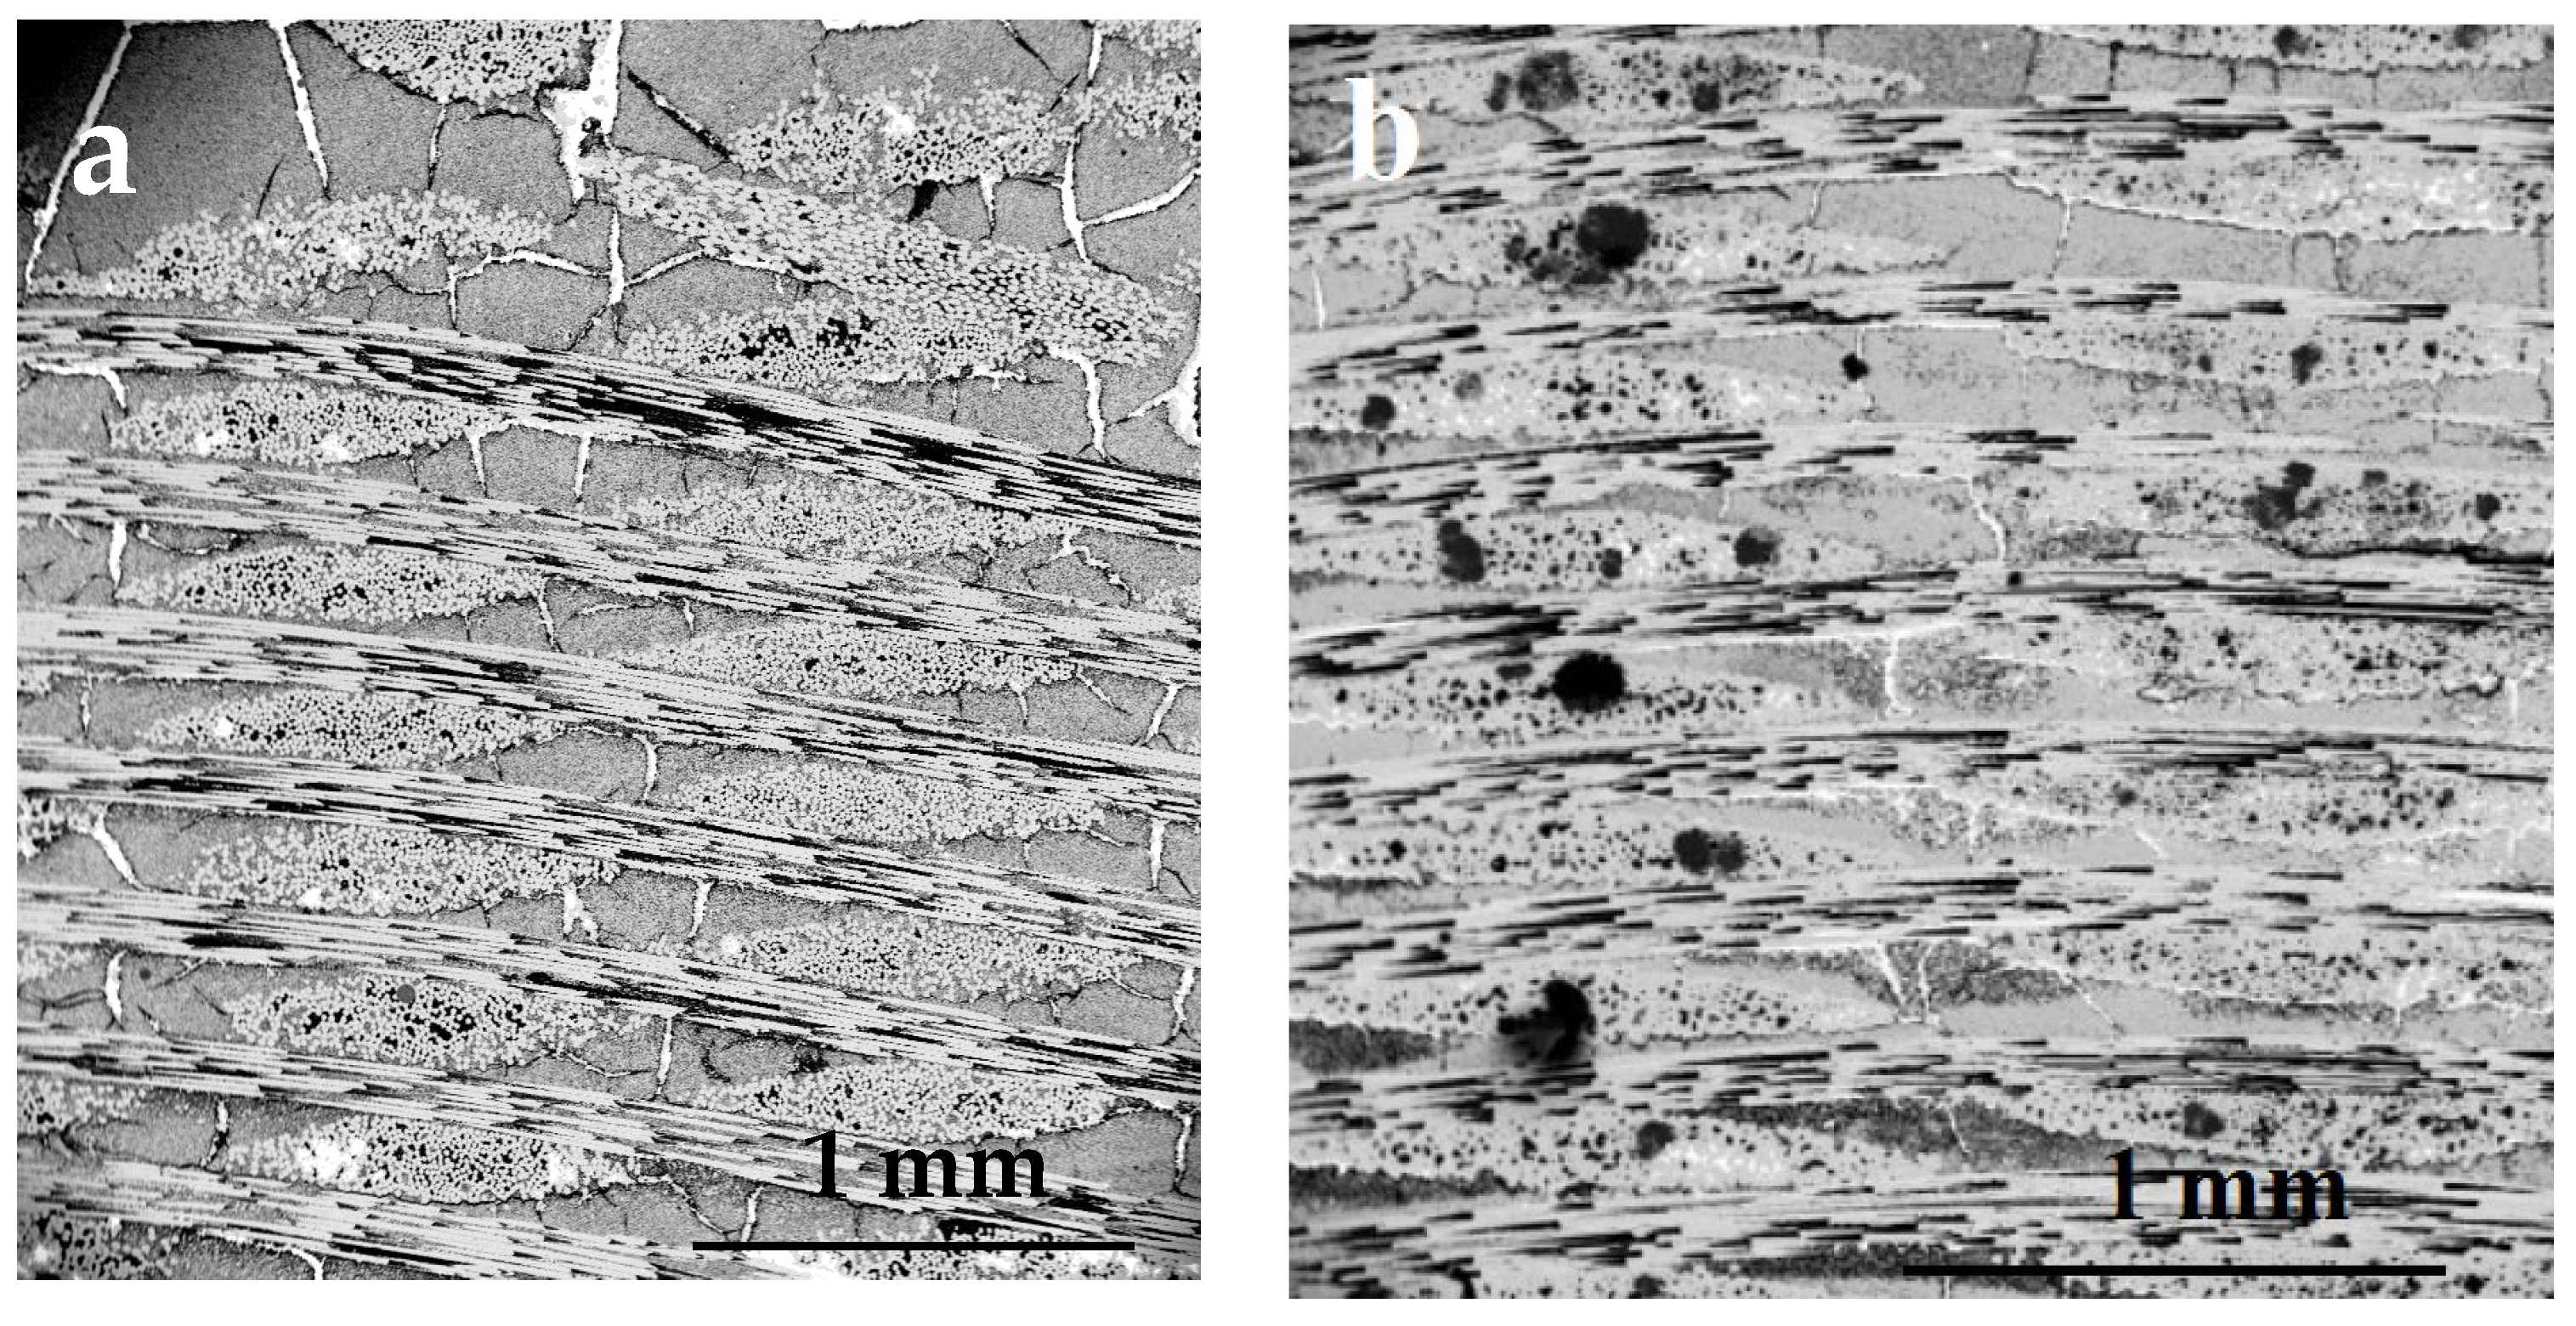
3.2. SEM Observation of the Processed Composites

The SEM images presented later in the text are back-scattered electron (BSE) images. The BSE signal is strongly related to the atomic number (Z) of the phase present in the sample. The white domains represent solidified silicon, and the darkest, the porosities. The gray SiC fibers gathered in bundles can be easily identified. The SEM observations of samples processed at a heating rate equal or lower than 100 °C/min reveal a matrix weakly bonded that shows many heterogeneous domains where unreacted grains are observed. At heating rates higher than 100 °C/min, the matrix is much more coherent and homogeneous, and no grain can be observed on SEM pictures. Composites processed at a heating rate in the range 200 °C/min to 300 °C/min are very similar to each other.
Figure 8 shows SEM pictures carried out on a cross-section of a sample prepared at a heating rate of 200 °C/min, which corresponds to the highest ratio of Si2N2O. SEM picture in Figure 8a is typical of composites processed under 1 MPa nitrogen pressure. Large cracks are observed, which tend to trap liquid silicon by capillarity above the melting temperature of silicon. This phenomenon prevents silicon from reacting completely with nitrogen and depletes the silicon content in some other parts of the matrix, thus creating porosities. The composition of the matrix, as determined by XRD analysis, reveals residual silicon content lower than 3 wt.%. The residual porosity ranges between 21 and 23% and should be compared to the initial porosity, which is 53% in the case of a 1 µm thick SiC layer of consolidation. By use of the Scherrer method, the grain size is estimated to be a hundred nanometers.
Matrices prepared under 3 MPa nitrogen pressure (Figure 8b) are similar to those prepared under 2 MPa. Silicon percolation still occurs inside the cracks, although this phenomenon is less marked than under 1 MPa.

3.3. Study of the Thermal Peaks Measured by Optical Pyrometry

At low heating rates (50 and 100 °C/min), two exothermic peaks are observed (Figure 9a–c and Figure 10a,b): they are clearly distinct at 50 °C/min and partially superposed at 100 °C/min.
At 50 °C/min, the features of the two exothermic peaks fitted with the ORIGIN software are gathered in Table 5. The first peak observed when increasing the temperature occurred well below the melting temperature of Si. The thermal peak observed at higher temperature was more exothermic. It started at about 1270 °C and was, perhaps, partially initiated by the heat released by the reactions associated to the previous peak, at least under 1 MPa nitrogen pressure. The maximum temperature measured at the surface the thermal peak observed at high temperature was still lower than the melting temperature of Si, though very close to it under a nitrogen pressure of 3 MPa. Because the surface temperature of the sample is lower than its bulk temperature, it can be assumed that the melting temperature of Si can be reached inside the sample during the reaction process associated with this second peak.
At 100 °C/min, the observed exothermic peak can be decomposed into two superposed peaks (Figure 10a,b). The features of these two peaks can be related to the features of the peaks observed at 50 °C/min and will, therefore, be named henceforth in the text peak 1 for the peak exhibiting a low exothermicity and peak 2 for the other.
At higher heating rates (200 and 300 °C/min, Figure 11, Figure 12 and Figure 13), an endothermic peak occurs in any case, and only one exothermic peak is observed at the same time. This endothermic peak should be associated with the melting of silicon, which is the only endothermic event occurring in the course of our reaction process. Depending on its magnitude, the endothermic peak can be observed as a shoulder on the exothermic peak (Figure 11a) or even as an incursion below the base line (Figure 11b). In such conditions, both the exothermic and endothermic peaks start almost at the same time. However, the maximum or minimum of, respectively, the exothermic and endothermic peaks may occur before or after each other, according to the experimental conditions.

3.4. Modified Process Involving Silica Produced by Oxidation of Silicon inside the Preform

In the previous sections, the process involved powders composed of silicon and silica, both introduced simultaneously into the preform by suction of slurry. We also studied a modified process involving formation of all or part of the silica required for the reaction by in situ oxidation of the silicon powder.
The results described in the previous section have shown that a heating rate of 300 °C/min and a nitrogen pressure of 2 MPa were the most favorable experimental conditions to maximize the Si2N2O content and, conversely, minimize the Si3N4 content. It was furthermore observed that, in such conditions, the reaction peak starts almost simultaneously with the melting of silicon but ends before the whole silicon has melted (Figure 12). These experimental conditions were thus used to study the effect of in situ oxidation of silicon on the properties of the formed matrix. Both the composition and rate of open porosity of the samples described in this section are gathered in Table 6. Henceforth in the text, we will name modified process 1 the process in which the whole silica amount present in the preform before the reaction is obtained by in situ oxidation of silicon grains during 1 h and 15 min at 1000 °C in air, and modified process 2 the process in which a part of the silica powder is still introduced in the form of slurry and the complement required to reach the stoichiometry of the reaction is formed by oxidation of silicon grains at a temperature of 900 °C during 1 h in air of the silicon introduced in the form of slurry.
The sample 13 in Table 6 was processed using the same heating rate and nitrogen pressure (300 °C/min, 2 MPa), as, for our reference, sample 8 produced using the standard process (Table 3 and Table 6) but by applying the modified process 1. Three remarkable facts emerge immediately from an examination of the measured properties of sample 13 in Table 6: (i) as expected, the residual open porosity of the matrix is very low as the result of an improved volume increase generated by the oxidation of silicon; (ii) the ratio of unreacted silicon is very high, which is the result of the reduced access of nitrogen to the solid silicon due to the presence of the silica shell; and (iii) ß-Si3N4 is not detected, which confirms that this allotropic form is grown by reacting solid Si with N2. When the accessibility of nitrogen to the silicon grains is impeded by the presence of the silica shell, the reaction starts at a higher temperature and requires the melting of silicon, which happens before the reaction starts, as confirmed by the fit of the exothermic peak (Figure 13). At the melting temperature of silicon, liquid silicon rapidly diffuses in the porosity of the impregnated preform by capillary effect, where it coalesces in the form of extended domains composed of pure silicon, as observed postmortem in Figure 14. The measured composition also reveals a ratio of the total amount of Si2N2O significantly lower than in sample 8 and a correlative higher Si3N4 content. We reproduced this experiment using a nitrogen pressure of 3 MPa to improve the reactivity of the powders and found the same results: (i) matrix composition similar to the one of sample 13 and including a high amount of unreacted silicon, and (ii) a decomposition of the thermal peak that exhibits the melting of silicon before the exothermic reaction starts. ß-Si3N4 was not detected.
We then used the modified process 2. Such a modified process is a compromise that allows taking advantage of the expansion of the silica grains when oxidized in situ while limiting the silica thickness at their surface. Such a process was tested under 2 MPa nitrogen pressure and various heating rates: 50, 100, 200, 300 °C/min. The composition and residual open porosity of the samples are gathered in Table 6. The variation of composition of these samples as a function of the heating rate is displayed in Figure 15a and compared in Figure 15b to the same variation of composition of samples prepared with the standard process, where the whole silica is impregnated in the form of slurry.
The variations displayed in Figure 15a,b are very similar: a high heating rate promotes the formation of Si2N2O at the expense of that of Si3N4 and tends to also increase the amount of unreacted silicon. The ratio of Si3N4 formed at 50 °C/min is, as expected, much lower when part of the silicon powder is oxidized in situ due to the presence of the silica shell. Using the modified process 2, the residual unreacted silicon was lowered down to an acceptable value. At the same time, the residual open porosity was significantly increased: 24% as compared to 13.5% at 300 °C/min.
Looking at the microstructure of the matrix in Figure 16a,b, it is observed that, when a part of the silica required for the reaction is formed by in situ oxidation of silicon, the homogeneity of the matrix is improved, and less cracks are formed. This improvement is mainly due to the volume increase generated by in situ partial oxidation of silicon, the porosity thus reduced improving the binding of the matrix.
These results show that in situ oxidation of silicon to form the silica required for the reaction of formation of Si2N2O very much improves the density of the matrix. Conversely, the ratio of Si3N4 in the processed matrix is higher than in the standard process. It was expected that the presence of a silica shell at the surface of the silicon grains would limit the amount of Si3N4 formed by reacting N2 with solid Si. Actually, such a layer turned out to limit, at the same time, the formation of Si2N2O, while Si3N4 can also be formed by reacting N2 with liquid Si. When silica grains are encapsulated in silica layer, the reaction starts after the melting of silicon, as shown in Figure 13. We therefore looked at increasing the thickness of the SiC consolidation layer to lower the residual open porosity while maintaining a low level of unreacted silicon.

3.5. Influence of the Thickness of the SiC Consolidation Layer

All the previous results were obtained using preforms consolidated with a 1 µm thick layer of ß-SiC. We look in this section at the effect of a 5µm thick layer of ß-SiC on the reaction as well as on the microstructure, the composition and the residual open porosity of the matrix. We used both the standard and modified process 2. We focused our work on the highest heating rates (200 and 300 °C/min) that are the only ones able to form a matrix including a high ratio of Si2N2O. A nitrogen pressure of 2 MPa was chosen for the same reasons. The properties of the matrix obtained under these different experimental conditions are presented in Table 7. The reference samples produced using the standard process are, in this case, sample 7 at 200 °C/min and sample 8 at 300 °C/min.
In Table 7, it is immediately obvious that, when using the process involving Si and SiO2 powders introduced in the form of slurry (samples 18 and 20), an increase of the thickness of the SiC layer lowers the residual open porosity. The porosity is lowered even more if the in situ partial oxidation of the Si powder is carried out, which confirms the observations detailed in the previous section. However, at the same time, the unreacted residual Si increases. The total amount of Si2N2O formed in the matrix is also lower when the SiC layer is 5 µm thick. If we are looking for a compromise between the maximum ratio of Si2N2O and the minimum of both unreacted residual Si and residual open porosity, the properties of sample 18 can be considered optimal. All other things remaining equal, the in situ partial oxidation of Si (sample 19), even though it significantly decreases the residual open porosity, leaves an amount of unreacted Si, which is not acceptable. The same holds true if we compare samples 20 and 21.
The effect of the thickness of the SiC consolidation layer on the microstructure of the formed matrix is clearly observed in Figure 17. Increasing SiC thickness lowers the number of cracks. The unreacted silicon that fills these cracks at the Si melting temperature is now preferentially located at the interface between the tows and the matrix. When the SiC layer is thin (1 µm), the space left between the fiber tows is large and can be easily filled by the slurry, and the intra-tow porosity can be filled, as well. In contrast, a thicker SiC layer (5 µm) lowers the porosity available for the slurry impregnation. Consequently, the amount of impregnated powder introduced into the preform is lowered by 30 to 40%, and the powder no longer fills the intra-tow porosity. In the latter case, both the lessened amount of powder introduced into the preform and increased amount of SiC, which acts as thermal sink, contribute to damp the reaction and lower its exothermicity.
When the SiC consolidation layer is 5 µm thick and silicon is partially oxidized in situ using the modified process 2 (samples 19 and 21 in Table 7), though the amount of unreacted silicon is enhanced, the coalescence of liquid silicon either inside the cracks or inside the main porosities, as well as its preferential concentration at the interface between the fiber tows and the matrix, are no longer observed.

4. Discussion

The various possible reactions listed in the introduction section of the paper are the following:
  • The formation of α-Si3N4 and ß-Si3N4 should be considered as independent of each other.
α-Si3N4 grows by reaction between nitrogen and gaseous silicon. Such a reaction requires the prior vaporization of Si, which is high above 1250 °C and provides enough vapor to account for the observed growth rate.
ß-Si3N4 grows either from a solid–gas reaction between solid Si and N2 or when the growing crystal is in contact with liquid Si by diffusion of N atom along the c-axis of ß-Si3N4 crystal [29]. The latter mechanism has, however, a high activation energy and should, therefore, be negligible at the time scale of our process. ß-Si3N4 can also be formed by transformation of α-Si3N4 into ß-Si3N4. It has been shown (18, 19, 21) that no direct α-ß transformation is observed without the help of a dissolution–precipitation mechanism that requires a liquid. The literature shows that liquid silicon can be the medium for this transformation [20], which requires the prior fusion of Si. However, the dissolution/precipitation process is a slow process, and the formation of ß-Si3N4 by such a transformation should be negligible at the time-scale of the observed reactions, which last, at most, 3 min.
  • Two different pathways, both of which require the presence of liquid Si and a dissolution process, can contribute to the formation of Si2N2O:
    A reaction involving SiO2 in contact with liquid silicon including dissolved N atoms.
    A reaction involving Si3N4 in contact with liquid silicon including dissolved O atoms coming from SiO2 also in contact with liquid Si. However, the presence of high nitrogen pressures stabilizes Si3N4 and tends to inhibit this reaction.
The thermograms recorded during the reaction of formation of the matrix provide meaningful information that can aid understanding of the processes taking place during the various exothermic reactions in competition in our chemical system.
At 50 °C/min (Figure 9a–c), the first peak observed when increasing the temperature occurs well below the melting temperature of Si. The associated reaction does not release a large amount of heat per unit of time but proceeds during a long period of time and stops after a while. Such a reaction, which should not involve liquid Si, can be attributed to the nitriding of silicon at low temperature. The two allotropic forms of Si3N4 may be involved in the reaction process. The growth of ß-Si3N4 formed by reacting solid Si with N2 is a rather slow process and is, therefore, not very exothermic. It stops when the thickness of the Si3N4 layer prevents N atoms from diffusing through the growing layer. Due to the low vapor pressure of Si at 1200 °C, the growth of α-Si3N4 formed by reacting Si vapor with N2 is not very exothermic as well. The growth stops when Si3N4 covers the whole surface of the silicon grains. The fact that both the surface and height of the peak decrease when N2 pressure increases can result from the rapid coverage of Si grains by Si3N4 at high nitrogen pressure. Because of the difference between the exothermicity of the two reactions that are responsible for the formation of ß-Si3N4 and α-Si3N4, and also because of the low ß-Si3N4/α-Si3N4 measured ratio (Table 4), the formation of α-Si3N4 should be the main exothermic contribution to this thermal peak.
At 50 °C/min, the thermal peak observed at higher temperature is more exothermic and may involve liquid silicon. Moreover, if we assume that the uniform coverage of silicon grains by Si3N4 is the reason why the reaction associated with the peak observed at lower temperature stops after a while, the melting of Si is the only event that can trigger a new reaction process. The melting of Si should be, in this case, progressive and the formed liquid be simultaneously involved in the formation of Si2N2O. Two arguments are in support of this hypothesis: (i) the endothermic peak associated with the massive melting of Si, which is observed at higher heating rates, is not observed here, and (ii) almost no unreacted Si is remaining in the samples (Table 4). The increase of nitrogen pressure does not significantly modify the surface of this peak but, in contrast, enhances its height, showing that the heat is released in a shorter period of time.
It should be noticed that the amount of heat released during the reaction corresponding to peak 1 (Table 5) as a function of the nitrogen pressure is inconsistent with the correlative variation of the amount of α-Si3N4 formed in the samples (Table 4). This point has to be discussed together with the nature of the reactions that contribute to the formation of Si2N2O. Si2N2O can form by reacting N atoms dissolved in liquid Si with SiO2 (balance Equation 1) or by reacting O atoms coming from SiO2 or O dissolved in liquid Si with Si3N4 (balance Equation (3)). Both reactions are supposed to proceed through a dissolution/precipitation process. It was shown in the introduction section that, at the melting temperature of Si, the solubility of O atoms is low, and the solubility of N atoms even lower, as its value is only one-fourth of the oxygen solubility [51,55]. However, the low atom solubility of O and N is offset (i) by the high oxygen mobility in liquid Si [50] and (ii) by the rapidity at which equilibrium between Si liquid and Si3N4 is established, proving its rapid dissolution mechanism [55]. Because both reactions can occur in our case, these two different paths of synthesis may be at the origin of the two allotropic forms of Si2N2O that are observed in our samples. If we look now at the variation of composition of the samples as a function of nitrogen pressure (Figure 18, Table 4), it can be clearly observed that the amounts of α-Si3N4 and Si2N2O Bba2 vary in quasicomplementary opposite ways, while the amount of the sinoite form of Si2N2O is almost unchanged. This suggests that the reactions of formation of α-Si3N4 and Si2N2O Bba2 are in competition and involve some common transient step. When the formation of Si3N4 precedes the formation of Si2N2O under high nitrogen pressure, and when the two reactions are well-separated in time (Figure 9b,c), the further transformation of Si3N4 into Si2N2O at higher temperature is limited because of its slow kinetics, so Si3N4 is, by far, the major species formed. In contrast, under 1 MPa nitrogen pressure (Figure 9a), because of the partial overlapping of the reaction of formation of Si3N4 and that of Si2N2O Bba2, this latter species can form in significant amounts at the expense of the formation of Si3N4.
At 100 °C/min (Figure 18b), the situation is less clear, because the reactions of formation of α-Si3N4 and Si2N2O Bba2 clearly overlap (Figure 10) and should, therefore, be in competition. Under 3 MPa nitrogen pressure, the formation of Si3N4 slightly precedes the formation of Si2N2O Bba2 (Figure 10a), and α-Si3N4 is the main species formed in the matrix. In contrast, under 2 MPa nitrogen pressure, the two reactions occur at the same time, and Si2N2O Bba2 is formed at the expense of α-Si3N4, thus becoming the predominant species.
At higher heating rates, (200 or 300 °C/min) the massive melting of Si is at the origin of the endothermic peak observed in all cases in the thermograms. This liquid medium enhances all reactions: either direct reactions involving liquid Si or reactions with the Si vapor. In such a case, all reactions occur simultaneously, and, by decomposition of the recorded peak using the ORIGIN software, only one exothermic peak is obtained in addition to the endothermic peak. Under high nitrogen pressure (2 or 3 MPa), the thermal events occur during the heating ramp, while, under 1 MPa nitrogen pressure, which is a pressure that requires higher temperatures to start the nitriding reaction, the thermal events span over the heating ramp and the heating step. It should be noticed that, when the massive melting of Si occurs during the reaction process, the composition of the matrix is less affected by the heating rate. The nitrogen pressure is, in that case, the main factor controlling the composition of the matrix (Figure 9, Table 4).
Many authors have observed that, at the melting of Si, large liquid domains tend to form. These domains are responsible for the reduction of the surface area of Si exposed to nitrogen, thus enhancing the amount of unreacted silicon remaining in the CMC. In our case, such a massive Si melting favors the residual presence of unreacted silicon when the nitrogen pressure is not high enough (samples 3 and 4 in Table 4). In contrast, the highest nitrogen pressure (3 MPa) that enhances both its reactivity and the dissolution of N atoms in liquid Si partly offset this influence. To prevent agglomeration of the Si grains at the melting temperature, Billy et al. [5] have applied an oxidation preliminary step to their Si/SiO2 mixture at 1350 °C to form a silica shell around the silicon grains. Our results show that this solution is not very effective. The thickest silica layer that coats our Si grains is obtained when the whole silica required for the reaction of formation of Si2N2O is formed in situ by oxidation of Si grains. In such a case (sample 13 in Table 6, prepared using the modified process 1), the massive melting of Si is still observed (Figure 13), and extended domains of pure Si are observed postmortem (Figure 14). The best strategy to prevent Si agglomeration in the liquid state has been applied to optimize the RBSN process [17]. It consists in a two-stage, time–temperature schedule, where an initial nitriding stage of the silicon grains allows build-up of a restraining skeletal microstructure of bridging Si3N4 that retains the silicon grains prior to the complete nitriding at a higher temperature. A similar scenario probably happens to our samples when heated at 50 °C/min and may explain why an endothermic peak corresponding to the massive melting of Si is not observed.
Our results can be compared with those of Pradeilles et al. [56], who used a similar reaction to form Si2N2O. As in the present case, their reaction was ignited when the temperature of a sample submitted to a 90 °C/min heating rate was high enough. The silicon grains were either mixed with amorphous silica (Zeosil) (mixture A) or embedded in SiO2 using a colloidal silica solution (mixture B). In the range of nitrogen pressure used by these authors (2 to 100 MPa), the reaction was always ignited at the melting temperature of Si. The solid formed after completion of the reaction of mixture A under various nitrogen pressures was composed of α-Si3N4, Si2N2O, unreacted Si (about 20 wt.%) and ß-Si3N4. α-Si3N4 was the preponderant species. They observed, as we do, that the Si2N2O content increases when the nitrogen pressure decreases. When the silicon grains are embedded in silica (mixture B), ß-Si3N4 is no longer formed, which is what we also observe when a thick layer of silica coats the silicon grains (sample 13 in Table 6). This confirms that solid silicon is involved in the formation of ß-Si3N4. Note that we used finer silicon grain size than those used by Pradeilles et al. [56] (0.6 µm as compared to 45 µm). This should enhance the reactivity of our mixture toward lower temperature. Ziegler et al. [22] have shown that a fine starting silicon grain size enhances the amount of the alpha-modification of Si3N4 as the result of a larger specific surface that enhances the evaporation rate of silicon. According to these authors, the nitriding reaction starts at temperatures of between 1000 and 1150 °C as a function of the silicon grain size, which is in agreement with our observations.
The detrimental influence of high nitrogen pressure on the formation of Si2N2O can be interpreted from a thermodynamic point of view by the use of the potential Si-N-O phase diagram calculated by Hillert et al. [10]. It shows that a high nitrogen pressure favors, as expected, the formation of Si3N4. The experiments carried out by Goursat et al. [71] confirm this effect. They studied the influence of the ratio N2/O2 on Si/SiO2 mixtures. They have shown that a low N2/O2 ratio favors the formation of SiO2, while a high ratio favors the formation of Si3N4. Between these two domains, Si2N2O is formed. The best ratio for the formation of Si2N2O lies, according to these authors, in the range 2 to 3.
Let us look now at the modified processes that we tested to optimize the properties of the formed matrix: our first attempt (MP1) to improve the densification of the matrix by taking benefit of the volume increase induced by in situ oxidation of Si was not totally successful. It was very efficient to lower the residual open porosity of the matrix but had detrimental effect on the amount of unreacted silicon left in the matrix (sample 13 in Table 6). The mixed process (MP2), in which only a part of the silica required for the reaction was obtained by in situ oxidation of Si grains happened to be a good compromise in terms of Si2N2O content, unreacted silicon left in the matrix and residual open porosity (sample 15 in Table 6). When applied to preforms equipped with a thick SiC consolidation layer (5 µm), such a process allowed significant decrease of the residual open porosity, because the initial open porosity of the preform was lower. However, the remaining unreacted Si could not be lowered below 8 wt.%, which is too high a value.

5. Conclusions

The present results show that reacting Si and SiO2 under high nitrogen pressure is a way to densify CMC preforms with Si2N2O. Such a process is very rapid, and the matrix formation is almost completed in less than one minute. Si2N2O was chosen as the matrix component because of its attractive properties, but this choice was made difficult because of the competing reaction of formation of Si3N4. After optimization of the composition and residual open porosity of the matrix, CMCs with attractive properties (part 2 of the present article) were obtained.
The main results are the following:
  • Two allotropic forms of Si2N2O, as evidenced by XRD, are formed during the reactions occurring inside the preform: the well-known sinoite form and an additional new form of Si2N2O isostructural with the already-described Bba2 Si1.8Al0.2O1.2N1.8 phase, but without including aluminum. This second Si2N2O form is the main phase formed in all the experiments carried out in this study.
  • At low heating rate (50 °C/min), the reaction of formation of Si3N4 and that of Si2N2O are successive and separated in time and, thus, in temperatures. The first reaction observed when increasing temperature is the formation of Si3N4, while silicon is still in the solid state: both the formation of α-Si3N4 by reaction between nitrogen and gaseous silicon and formation of ß-Si3N4 by reaction between nitrogen and solid silicon. Both reactions stop after a while, when the Si grains are entirely covered by Si3N4. The formation of Si2N2O occurs at a higher temperature, when the silicon grains begin to melt. It is observed that, when the two reactions overlap under 1 MPa nitrogen pressure, the formation of Bba2 Si2N2O seems to be in competition with that of α-Si3N4.
  • At a higher heating rate (100 °C/min), the reaction of formation of Si3N4 and that of Si2N2O clearly overlap, but their exothermic signatures can be easily identified by fitting the exothermic peak with two components. The time sequence of the two reactions is responsible for the main phase formed.
  • At the highest heating rates (200 or 300 °C/min), the massive melting of Si occurs, which is characterized by a strong endothermic peak. Only one exothermic peak is observed in these conditions, which is totally or partially superposed with the endothermic peak. The melting of Si and the exothermic reaction start at almost the same time, which suggests that all the reactions take place in the presence of Si in its liquid state.
  • The formation of silica inside the preform by partial oxidation of the silicon grains impregnated in the form of slurry lowers the residual porosity of the matrix thanks to the volume expansion induced by the Si oxidation process. In contrast, a silica shell at the surface of the silicon grains limits its reaction with nitrogen, which is responsible for a large amount of residual unreacted silicon left in the formed composite.
  • A mixed process that combines the impregnation of a part of silica in the form of slurry and the other by partial oxidation of silicon also introduced into the preform in the form of slurry is a good compromise in terms of Si2N2O content, unreacted silicon left in the matrix and residual open porosity.

Author Contributions

B.T. carried out the experimental part of this work as part of his thesis for which he was co-supervised by R.P. and F.T. R.P. proposed the original idea for the work. F.T. wrote this publication. All authors have read and agreed to the published version of the manuscript.

Funding

This work was partially funded by Safran Ceramics (Safran group).

Acknowledgments

The authors thank Safran Ceramics (Safran group) for financial support to this work and Fabrice Rossignol (IRCER Limoges France) for helpful discussions for the preparation of powder suspensions.

Conflicts of Interest

The authors declare no conflict of interest.

References

  1. Naslain, R. Design, preparation and properties of non-oxide CMCs for application in engines and nuclear reactors: An overview. Compos. Sci. Technol. 2004, 64, 155–170. [Google Scholar] [CrossRef]
  2. Washburn, M.E. Silicon oxynitride refractories. Am. Ceram. Soc. Bull. 1967, 46, 667. [Google Scholar]
  3. Lortholary, P.; Billy, M. Etude du Systeme Silicium-Oxygène-Azote. IV. Dégradation Thermique de l’oxynitrure Si2N2O. Bull. Soc. Chim. Fr. 1975, 5–6, 1057–1061. [Google Scholar]
  4. Billy, M.; Labbe, J.C.; Lortholary, P. Stabilité et Mécanisme de Décomposition Thermique des Oxynitrures de Silicium et de Germanium. Mater. Chem. 1979, 4, 189–200. [Google Scholar] [CrossRef]
  5. Billy, M.; Boch, P.; Dumazeau, C.; Glandus, J.C.; Goursat, P. Preparation and properties of new silicon oxynitride based ceramics. Ceram. Int. 1981, 7, 13–18. [Google Scholar] [CrossRef]
  6. Brosset, C.; Idrestedt, I. Crystal structure of silicon oxynitride, Si2N2O. Nature 1964, 201, 1211. [Google Scholar] [CrossRef]
  7. Sjoberg, J.; Helgesson, G.; Idrestedt, I. Refinement of the structure of Si2N2O. Acta Cryst. 1991, C47, 2438–2441. [Google Scholar] [CrossRef]
  8. Colquhoun, I.; Wild, S.; Grieveson, P.; Jack, K.H. Thermodynamics of the Silicon-Nitrogen-Oxygen system. In Proceedings of the British Ceramic Society, N°22, Ceramics for High-Temperature Engineering; Godfrey, D.J., Ed.; British Ceramic Society: Stoke-on-Trent, UK, 1973; pp. 207–227. [Google Scholar]
  9. Weiss, J.; Lukas, H.L.; Lorenz, J.; Petzow, G.; Krieg, P. Calculation of heterogeneous phase equilibria in oxide-nitride systems. I The quaternary system C-Si-N-O. Calphad 1981, 5, 125–140. [Google Scholar] [CrossRef]
  10. Hillert, M.; Jonsson, S.; Sundman, B. Thermodynamic calculation of the Si-O-N system. Z. Metallkd. 1992, 83, 648–654. [Google Scholar]
  11. Rocabois, P.; Chatillon, C.; Bernard, C. Thermodynamics of the Si–O–N system: II, stability of Si2N2O(s) by high-temperature mass spectrometric vaporization. J. Am. Ceram. Soc. 1996, 79, 1361–1365. [Google Scholar] [CrossRef]
  12. Jacobson, N.S. Corrosion of silicon-based ceramics in combustion environments. J. Amer. Ceram. Soc. 1993, 76, 3–28. [Google Scholar] [CrossRef] [Green Version]
  13. Ogbuji, L.U.J.T.; Bryan, S.R. The SiO2-Si3N4 interface, Part I: Nature of the interphase. J. Am. Ceram. Soc. 1995, 78, 1272–1278. [Google Scholar] [CrossRef]
  14. Ogbuji, L.U.J.T. The SiO2-Si3N4 interface, Part II: O2 permeation and oxidation reaction. J. Amer. Ceram. Soc. 1995, 78, 1279–1284. [Google Scholar] [CrossRef]
  15. Moulson, A.J. Review: Reaction-Bonded Silicon Nitride—Its formation and properties. J. Mater. Sci. 1979, 14, 1017–1051. [Google Scholar] [CrossRef]
  16. Jennings, H.M. Review: On reactions between silicon and nitrogen. J. Mater. Sci. 1983, 18, 951–967. [Google Scholar] [CrossRef]
  17. Riley, F.L. Silicon Nitride and Related Materials. J. Am. Ceram. Soc. 2000, 83, 245–265. [Google Scholar] [CrossRef]
  18. Messier, D.R.; Riley, F.L.; Brook, R.J. The α/β silicon nitride phase transformation. J. Mater. Sci. 1978, 13, 1199–1205. [Google Scholar] [CrossRef]
  19. Sarin, V.K. On the α to ß phase transformation in silicon nitride materials. Sci. Eng. A 1988, 105, 151–159. [Google Scholar] [CrossRef]
  20. Park, J.Y.; Kim, J.R.; Kim, C.H. Effects of Free Silicon on the α to ß Phase Transformation in Silicon Nitride. J. Am. Ceram. Soc. 1987, 70, C240–C242. [Google Scholar] [CrossRef]
  21. Suematsu, H.; Mitomo, M.; Mitchell, T.E.; Petrovic, J.J.; Fukunaga, O.; Ohashi, N. The α-ß transformation in silicon nitride single crystals. J. Am. Ceram. Soc. 1997, 80, 615–620. [Google Scholar] [CrossRef]
  22. Ziegler, G.; Heinrich, J.; Wotting, G. Relationships between processing, microstructure and properties of dense and reaction-bonded silicon nitride. J. Mater. Sci. 1987, 22, 3041–3086. [Google Scholar] [CrossRef]
  23. Rossetti, G.A., Jr.; Denkewicz, R.P., Jr. Kinetic interpretation of α- and β-Si3N4 formation from oxide-free high-purity silicon powder. J. Mater. Sci. 1989, 24, 3081–3086. [Google Scholar] [CrossRef]
  24. Gemini Sofware Used to Calculate Thermodynamic Equilibrium in Chemical Systems by Minimization of the Gibbs Free Energy, Coach Associated Database Thermodata Grenoble. Available online: http://thermodata.online.fr/gem1ang.html (accessed on 7 July 2021).
  25. O’Hare, P.A.G.; Tomaszkiewicz, I.; Beck, C.M.; Seifert, H.J. Thermodynamics of silicon nitride. I. Standard molar enthalpies of formation at the temperature 298.15 K of α-Si3N4 and β-Si3N4. J. Chem. Thermodyn. 1999, 31, 303–322. [Google Scholar] [CrossRef]
  26. Thompson, D.S.; Pratt, P.I. The Structure of Silicon Nitride 33–51 in Science of Ceramics; Stewart, G.H., Ed.; Academic Press: New York, NY, USA, 1967; Volume 3. [Google Scholar]
  27. Longland, P.; Moulson, A.J. The growth of α- and ß-Si3N4 accompanying the nitriding of silicon powder compacts. J. Mater. Sci. Lett. 1978, 13, 2279–2280. [Google Scholar]
  28. Atkinson, A.; Moulson, A.J.; Roberts, E.W. Nitriding of high-purity silicon. J. Am. Ceram. Soc. 1976, 59, 285–289. [Google Scholar] [CrossRef]
  29. Jennings, H.M.; Richman, M.H. Structure, formation mechanisms and kinetics of reaction-bonded silicon nitride. J. Mater. Sci. 1976, 11, 2087–2098. [Google Scholar] [CrossRef]
  30. Pigeon, R.G.; Varma, A. Quantitative kinetic analysis of silicon nitriding. J. Mater. Sci. 1993, 28, 2999–3013. [Google Scholar] [CrossRef]
  31. Ekelund, M.; Forslund, B. Kinetics of silicon nitride formation by gas-phase routes in the Si–C–O–N system. J. Mater. Chem. 1992, 2, 1079–1086. [Google Scholar] [CrossRef]
  32. Sheldon, B.W.; Rankin, J.; Haggerty, J.S. Formation of reaction-bonded silicon nitride from silane derived silicon powders: Nucleation and growth mechanisms. J. Am. Ceram. Soc. 1995, 78, 1624–1632. [Google Scholar] [CrossRef]
  33. Boyer, S.M.; Moulson, A.J. A mechanism for the nitriding of Fe-contaminated silicon. J. Mater. Sci. 1978, 13, 1637–1646. [Google Scholar] [CrossRef]
  34. Barinova, T.V.; Barinov, V.Y.; Kovalev, I.D.; Mukhina, N.I. Effect of iron-compound additives on self-propagating high-temperature synthesis of Si2N2O. Refract. Ind. Ceram. 2019, 60, 305–308. [Google Scholar] [CrossRef]
  35. Dervisbegovic, H.; Riley, F.L. The influence of iron and hydrogen in the nitriding of silicon. J. Mater. Sci. Lett. 1979, 14, 1265–1268. [Google Scholar]
  36. Dervisbegovic, H.; Riley, F.L. The role of hydrogen in the nitriding of silicon powder compacts. J. Mater. Sci. 1981, 16, 1945–1955. [Google Scholar] [CrossRef]
  37. Rahaman, M.N.; Moulson, A.J. The removal of surface silica and its effect on the nitridation of high-purity silicon. J. Mater. Sci. 1984, 19, 189–194. [Google Scholar] [CrossRef]
  38. Messier, D.R.; Wong, P.; Ingram, A.E. Effect of oxygen impurities on the nitriding of high-purity silicon. J. Am. Ceram. Soc. Discuss. Notes 1973, 56, 171–172. [Google Scholar] [CrossRef]
  39. Wang, M.-J.; Wada, H. Synthesis and characterization of silicon nitride whiskers. J. Mater. Sci. 1990, 25, 1690–1698. [Google Scholar] [CrossRef] [Green Version]
  40. Mukasyan, A.S.; Borovinskaya, I.P. Structure formation in SHS nitrides. Int. J. SHS 1992, 1, 55–77. [Google Scholar]
  41. Yao, G.; Li, Y.; Jiang, P.; Jin, X.; Long, M.; Qin, H.; Kumar, R.V. Formation mechanisms of Si3N4 and Si2N2O in silicon powder nitriding. Solid State Sci. 2017, 66, 50–56. [Google Scholar] [CrossRef]
  42. Ge, C.C.; Li, J.T.; Xia, Y.L. On the mechanism of self-propagating high-temperature synthesis (SHS) of Si3N4. Int. J. Self Propagating High Temp. Synth. 1996, 5, 107–117. [Google Scholar]
  43. Drevet, B.; Voytovych, R.; Israel, R.; Eustathopoulos, N. Wetting and adhesion of Si on Si3N4 and BN substrates. J. Eur. Ceram. Soc. 2009, 29, 2363–2367. [Google Scholar] [CrossRef]
  44. Whalen, T.J.; Anderson, A.T. Wetting of SiC, Si3N4, and carbon by Si and Binary Si alloys. J. Am. Ceram. Soc. 1975, 58, 396–399. [Google Scholar] [CrossRef]
  45. Swartz, J.C. Atmosphere effects on wetting of Si3N4 by Liquid Si. J. Am. Ceram. Soc. Discuss. Notes 1976, 59, 272–273. [Google Scholar] [CrossRef]
  46. Hirao, K.; Miyamoto, Y.; Koizumi, M. Synthesis of silicon nitride by a combustion reaction under high nitrogen pressure. J. Am. Ceram. Soc. 1986, 69, C60–C61. [Google Scholar]
  47. Hirao, K.; Miyamoto, Y.; Koizumi, M. Combustion reaction characteristics in the nitriding of silicon. Adv. Ceram. Mater. 1987, 2, 780–784. [Google Scholar] [CrossRef]
  48. Sangiorgi, R.; Muolo, M.L.; Chatain, D.; Eustathopoulos, N. Wettability and work of adhesion of non-reactive liquid metals on silica. J. Am. Ceram. Soc. 1988, 71, 742–748. [Google Scholar] [CrossRef]
  49. Weiß, D.; Gebensleben, T.; Diestel, L.; Alphei, L.; Becker, V.; Becker, J.A. The influence of crystallographic orientation on the wetting of silicon on quartz single crystals. J. Mater. Sci. 2011, 46, 3436–3444. [Google Scholar] [CrossRef] [Green Version]
  50. Wachsmuth, D.; Gebensleben, T.; Weiß, D.; Becker, V.; Alphei, L.D.; Becker, J.A. SiO gas emission and triple line dynamics of small silicon droplets on quartz. J. Cryst. Growth 2012, 355, 122–128. [Google Scholar] [CrossRef]
  51. Schnurre, S.M.; Gröbner, J.; Schmid-Fetzer, R. Thermodynamics and phase stability in the Si-O system. J. Non Cryst. Solids 2004, 336, 1–25. [Google Scholar] [CrossRef]
  52. Assael, M.J.; Armyra, I.J.; Brillo, J.; Stankus, S.V.; Wu, J.; Wakeham, W.A. Reference Data for the density and viscosity of liquid Cadmium, Cobalt, Gallium, Indium, Mercury, Silicon, Thallium, and Zinc. J. Phys. Chem. Ref. Data 2012, 41, 033101. [Google Scholar] [CrossRef] [Green Version]
  53. Narushima, T.; Matsuzawat, K.; Mukaitt, Y.; Lguchi, Y. Oxygen solubility in liquid silicon. Mater. Trans. JIM 1994, 35, 522–528. [Google Scholar] [CrossRef]
  54. Hirata, H.; Hoshikawa, K. Oxygen solubility and its temperature dependence in a silicon melt in equilibrium with solid silica. J. Cryst. Growth 1990, 106, 657–664. [Google Scholar] [CrossRef]
  55. Dalaker, H.; Tangstad, M. Temperature dependence of the solubility of nitrogen in liquid silicon equilibrated with silicon nitride. Mater. Trans. 2009, 50, 2541–2544. [Google Scholar] [CrossRef]
  56. Pradeilles, N.; Record, M.C.; Marin-Ayral, R.M. A modified SHS method for Si2N2O elaboration. J. Eur. Ceram. Soc. 2006, 26, 2489–2495. [Google Scholar] [CrossRef]
  57. Miyazaki, H.; Yoshida, S.; Sato, Y.; Suzuki, H.; Ota, T. Fabrication of radiative cooling materials based on Si2N2O particles by the nitriding of mixtures of silicon and silicon dioxide powders. J. Ceram. Soc. Jpn. 2013, 121, 242–245. [Google Scholar] [CrossRef] [Green Version]
  58. Radwan, M.; Kashiwagi, T.; Miyamoto, Y. New synthesis route for Si2N2O ceramics based on desert sand. J. Eur. Ceram. Soc. 2003, 23, 2337–2341. [Google Scholar] [CrossRef]
  59. Persson, J.; Käll, P.O.; Nygren, M. Interpretation of the parabolic and nonparabolic oxidation behavior of silicon oxynitride. J. Am. Ceram. Soc. 1992, 75, 3377–3384. [Google Scholar] [CrossRef]
  60. Du, H.; Tressler, R.E.; Spear, K.E.; Pantano, C.G. Oxidation studies of crystalline CVD nitride. J. Electrochem. Soc. 1989, 136, 1527–1536. [Google Scholar] [CrossRef]
  61. Bergman, B.; Heping, H. The influence of different oxides on the formation of Si2N2O from SiO2 and Si3N4. J. Eur. Ceram. Soc. 1990, 6, 3–8. [Google Scholar] [CrossRef]
  62. Deng, S.; He, G.; Wang, L.; Meng, Q.; Yang, Z.; Li, J.; Jiang, L. Combustion synthesis of Si2N2O powder for photovoltaic silicon casting applicatio. Ceram. Int. 2021, 47, 5795–5802. [Google Scholar] [CrossRef]
  63. Batha, H.D.; Whitney, E.D. Kinetics and mechanism of the thermal decomposition of Si3N4. J. Am. Ceram. Soc. 1973, 56, 365–369. [Google Scholar] [CrossRef]
  64. Li, X.; Zhang, L.; Yin, X. Study on in-situ reaction synthesis and mechanical properties of Si2N2O ceramic. Ceram. Int. 2012, 39, 3035–3041. [Google Scholar] [CrossRef]
  65. Hackley, V.A.; Paik, U.; Kim, B.H.; Malghan, S.G. Aqueous processing of sintering reaction-bonded silicon nitride: Dispersion properties of silicon powder. J. Am. Ceram. Soc. 1997, 80, 1781–1788. [Google Scholar] [CrossRef]
  66. Yao, D.X.; Xia, Y.F.; Zeng, Y.P.; Zuo, K.H.; Jiang, D.L. Porous Si3N4 ceramics prepared via slip casting of Si and reaction bonded silicon nitride. Ceram. Int. 2011, 37, 3071–3076. [Google Scholar] [CrossRef]
  67. Xu, G.L.; Zhang, J.J.; Song, G.Z. Effect of complexation on the zeta potential of silica powder. Powder Technol. 2003, 134, 218–222. [Google Scholar] [CrossRef]
  68. Tourbin, M. Caractérisation et Comportement de Suspensions Concentrées de Nanoparticules sous Écoulement: Application aux Processus D’agrégation et de Rupture. Ph.D. Thesis, Université de Toulouse, Toulouse, France, 2006. [Google Scholar]
  69. Ramachandra, R.R.; Roopa, H.N.; Kannan, T.S. The characterisation of aqueous silicon slips. J. Eur. Ceram. Soc. 1999, 19, 2763–2771. [Google Scholar]
  70. Bowden, M.E.; Barris, G.C.; Brown, W.M.; Jefferson, D.A. A new, low-temperature polymorph of O’-SiAlON. J. Am. Ceram. Soc. 1998, 81, 2188–2190. [Google Scholar] [CrossRef]
  71. Goursat, P.; Lortholary, P.; Billy, M. Etude du système silicium-oxygène-azote I. Préparation de l’oxynitrure Si2N2O. Rev. Int. Tempér. Réfract. 1971, 8, 149–154. [Google Scholar]
Figure 1. Isothermal section of the ternary Si-N-O phase diagram. The diagram is unchanged up to 2166 K, which is the temperature of the congruent decomposition in the presence of the gas phase, according to reference [11].
Jcs 05 00178 g001
Figure 2. Section of the Si-N-O phase diagram parallel to the SiO2-Si3N4 section calculated by Hillert et al. [10]. The diagram was calculated with an excess of 0.3% Si to avoid unusual features of the SiO2-Si3N4 phase diagram caused by degeneracy when the compositions of SiO2, Si2N2O, liquid slag and gas are all located on the section. The phases in parenthesis are induced by the presence of Si in excess. Their amounts go to zero as the excess of Si goes to zero. The following symbols are used by the authors: LS: liquid slag (mainly SiO2), LM: liquid metal (pure Si), G: gas, SN: Si3N4, SNO: Si2N2O.
Jcs 05 00178 g002
Figure 3. Schematic diagram of the reactor (a) and photograph showing the resistor wrapped around the sample and connected to the electrodes (b).
Jcs 05 00178 g003
Figure 4. (a) Silicon grain size distribution before and after attrition. Right distribution curve: as received from Aldrich. Left distribution curve: silicon powder after attrition during 7 h. (b) Silica grain size before and after attrition. Right distribution curve: as received from Aldrich. Left distribution curve: silica powder after attrition during 4 h 30.
Jcs 05 00178 g004
Figure 5. Pore size distribution of a preform after impregnation.
Jcs 05 00178 g005
Figure 6. Typical X-ray diffraction pattern of the matrix.
Jcs 05 00178 g006
Figure 7. (ac): Variation of the matrix composition characterized by XRD as a function of the heating rate for various nitrogen pressures: (a) PN2 = 1 MPa, (b) PN2 = 2 MPa, (c) PN2 = 3 MPa. The standard process was used, and the thickness of the SiC layer was 1 µm.
Jcs 05 00178 g007aJcs 05 00178 g007b
Figure 8. SEM pictures at different magnifications of composite material prepared under 1 MPa (a) or 3 MPa (b) nitrogen pressure. Heating rate 200 °C/min. Thickness of the SiC layer: 1 µm.
Jcs 05 00178 g008
Figure 9. (ac) Thermograms of the samples 1, 5 and 9 of Table 4, respectively. The thickness of the SiC layer is 1 µm.
Jcs 05 00178 g009
Figure 10. (a,b) Thermograms and corresponding curve fits of the exothermic peaks: (a) sample 6 Table 4, 100 °C/min, PN2 = 3 MPa, (b) sample 10 Table 4, 100 °C/min, PN2 = 2 MPa. The thickness of the SiC layer is 1 µm.
Jcs 05 00178 g010
Figure 11. (a,b) Thermograms and corresponding curve fits of the exothermic peaks: (a) sample 3 Table 4, 200 °C/min, PN2 = 1 MPa, (b) sample 4 Table 4, 300 °C/min, PN2 = 1 MPa. The thickness of the SiC layer is 1 µm.
Jcs 05 00178 g011aJcs 05 00178 g011b
Figure 12. Thermogram of sample 8 (Table 4). The standard process was used at 300 °C/min under 2 MPa nitrogen pressure. The thickness of the SiC layer is 1 µm.
Jcs 05 00178 g012
Figure 13. Thermogram of sample 13 (Table 6). The modified process 1 was used at 300 °C/min under 2 MPa nitrogen pressure. The thickness of the SiC layer is 1 µm. The modified process 1 was used.
Jcs 05 00178 g013
Figure 14. SEM photograph of sample 13 (Table 6) showing extended domains of solidified silicon. The modified process 1 was used at 300 °C/min under 2 MPa nitrogen pressure. Thickness of the SiC layer: 1 µm.
Jcs 05 00178 g014
Figure 15. Variation of composition and residual open porosity as a function of the heating rate of sample (a) prepared using partial formation of silica by oxidation of silicon inside the preform (Table 6) and (b) prepared using a mixture of silicon and silica powders, both introduced into the preform by slurry (Table 4).
Jcs 05 00178 g015
Figure 16. Comparison between SEM photographs showing cross-sections of (a) a composite prepared using the standard process (Si and SiO2 powders both introduced in the form of slurry) and (b) a composite prepared using modified process 2 (part of the silica is formed by partial oxidation of silicon (900 °C, 1 h)). Experimental conditions for both samples: 200 °C/min, PN2 = 2 MPa.
Jcs 05 00178 g016
Figure 17. Comparison between SEM photographs showing cross-sections of a composite prepared using the standard process (Si and SiO2 powders both introduced by slurry). The thickness of the SiC layer is 1 µm in the photograph (a) and 5 µm in the photograph (b). Experimental conditions for both samples: 200 °C/min, PN2 = 2 MPa.
Jcs 05 00178 g017
Figure 18. (a,b) Variation of composition of samples prepared using the standard process at a heating rate of 50 °C/min (a) and 100 °C/min (b) under various nitrogen pressures (Table 4). The thickness of the SiC layer is 1 µm.
Jcs 05 00178 g018aJcs 05 00178 g018b
Table 1. Time(s) required to reach the melting temperature of Si and the step temperature of 1430 °C. Time (0) begins when the preform reaches 1100 °C.
Heating Rate (°C/min)Time Required to Reach the Melting Temperature of Si (1414 °C) (s)Time Required to Reach the Step Temperature of 1430 °C (s)
50377396
100188198
2009499
3006366
Table 2. Weight gains observed after oxidation of either raw powder of silicon or preform impregnated with silicon powder. Heating rate 15 °C/min. Samples were maintained at 900 °C during 1 h. GB = green body, Pref = Preform.
GB 1GB 2GB 3Pref. 1Pref. 2Pref. 3
Weight before oxidation (g)2.621.550.952.532.612.59
Weight after oxidation (g)3.021.801.102.692.782.75
Total weight gain (%)15.416.415.817.617.317.2
Initial mass of silicon (g)1.911.130.690.640.690.68
Silicon weight gain (%)21.222.521.724.223.823.6
Table 3. Space group and lattice parameters of: (i) natural and synthetic sinoite Si2N2O and (ii) Bba2 Si1.8Al0.2O1.2N1.8 given in the literature and compared with the parameters obtained by Rietveld refinement on the diffraction diagram of the Bba2 phase synthetized in this study.
Si2N2O
(Natural Sinoite)
Brosset and Idrestedt (1964) [6]
Si2N2O
(Synthetic Sinoite)
Sjoberg et al. (1991) [7]
Si1.8Al0.2O1.2N1.8
Bowden et al. (1998) [70]
Si2N2O Our Simulation
Space groupCmc21Cmc21Bba2Bba2
a (nm)0.88430.887170.884880.88102
b (nm)0.54730.549090.537520.53698
c (nm)0.484350.485040.483550.48355
Table 4. Experimental conditions and corresponding composition and porosity of the materials processed using silica introduced into the preform in the form of slurry and a preform predensified with a SiC layer of 1 µm.

Sample
Heating Rate (°C/min)N2
Pressure (MPa)
Si2N2O TotalSi3N4 TotalSi
wt%
Residual Open
Porosity (%)
Filled Open Porosity (%)Si2N2O
Cmc21
wt%
Si2N2O
Bba2
wt%
Si2N2O
Bba2/
Cmc21
Si3N4
Alpha
wt%
Si3N4
Beta
wt%
150141.358.70.030.74110.131.23.151.86.9
2100174.824.80.427.34833.741.11.217.37.5
3200187.49.43.229.24436.351.11.46.23.2
4300179.117.73.229.94236.342.81.212.55.2
550217.882.10.129.7437.710.11.371.810.3
6100267.732.20.127.24818.049.72.825.36.9
7200293.46.40.224.45333.360.11.82.73.7
8300294.74.90.430.04230.264.52.12.62.3
950316.483.30.329.1447.68.81.271.811.5
10100338.361.70.026.9485.233.16.452.69.1
11200380.918.60.527.94626.154.82.114.34.3
12300386.612.50.929.64324.961.72.57.25.3
Table 5. Features of the two peaks observed when using a heating rate of 50 °C/min. The peak height is measured above the base line. The width of the peak is measured at its half maximum.
N° SampleHeating Rate (°C/min)N2 Pressure (MPa)Area (A.U.)Center (s)Width (s)Height (°C)
Peak 1
150130362237526
550221191855624
950313421695416
Peak 2
150118583112842
550217723042153
950318832921675
Table 6. Variation of the composition and residual open porosity as a function of the experimental conditions used to densify the preforms. Sample 8 is the reference sample of Table 4, introduced into this table for a matter of comparison. N2 pressure = 2 MPa. The preforms were predensified with a 1 µm thick SiC layer. The filled open porosity is the percentage of open porosity filled by the reaction starting from the measured open porosity of the preform before impregnation but after formation of the SiC consolidation layer. Process: STD = standard process, MP1 = modified process 1, MP2 = modified process 2.

Sample
ProcessHeating Rate (°C/min)Si2N2O TotalSi3N4 TotalSi
wt%
Residual Open
Porosity (%)
Filled Open
Porosity (%)
Si2N2O
Cmc21
wt%
Si2N2O
Bba2
wt%
Si2N2O
Bba2/Cmc21
Si3N4
Alpha
wt%
Si3N4
Beta
wt%
8STD30094.74.90.4304230.264.52.12.62.3
13MP130065.89.924.313.573.92045.82.39.90
14MP230084.413.91.723.854.238.4461.25.48.5
15MP220087.510.22.322.955.839.847.71.24.75.5
16MP210081.617.4124.752.539.342.31.114.33.1
17MP25055.943.30.82159.523.232.71.437.95.4
Table 7. Variation of the composition and residual open porosity as a function of the experimental conditions used to densify preforms. Samples 7 and 8 are the reference samples of Table 4 introduced into this table for a matter of comparison. The preforms were predensified with a 5 µm thick SiC layer. N2 pressure = 2 MPa. The filled open porosity is the percentage of open porosity filled by the reaction starting from the measured open porosity of the preform before impregnation but after formation of the SiC consolidation layer. Process: STD = standard process, MP2 = modified process 2.
ProcessHeating Rate (°C/min)Si2N2O TotalSi3N4 TotalSi
wt%
Residual Open Porosity (%)Filled Open Porosity (%)Si2N2O
Cmc21
wt%
Si2N2O
Bba2
wt%
Si2N2O
Bba2/
Cmc21
Si3N4
Alpha
wt%
Si3N4
Beta
wt%
7STD20093.46.40.224.45333.360.11.82.73.7
18STD20078.221.20.615.954.623.155.12.416.34.9
19MP220072.317.510.29.971.640.731.60.812.25.3
8STD30094.74.90.430.04230.264.52.12.62.3
20STD30068.528.53.014.359.223.844.71.919.39.2
21MP230080.111.58.410.470.237.642.51.16.94.6
Publisher’s Note: MDPI stays neutral with regard to jurisdictional claims in published maps and institutional affiliations.

