Article

Effect of Different Types of Block Copolymers on Morphology, Mechanical Properties, and Fracture Mechanisms of Bisphenol-F Based Epoxy System

Institut für Verbundwerkstoffe GmbH (IVW), Technische Universität Kaiserslautern (TUK), Erwin-Schrödinger-Strasse, Building 58, 67663 Kaiserslautern, Germany
*
Author to whom correspondence should be addressed.
Current affiliation: University Bordeaux, CNRS, Bordeaux INP, LCPO, UMR 5629, F-33600 Pessac, France.
J. Compos. Sci. 2019, 3(3), 68; https://doi.org/10.3390/jcs3030068
Submission received: 31 May 2019 / Revised: 19 June 2019 / Accepted: 1 July 2019 / Published: 4 July 2019
(This article belongs to the Special Issue Feature Papers in Journal of Composites Science in 2019)

Abstract

:
The effect of adding different types of soft block copolymer on the tensile properties, fracture mechanic properties, and thermo-mechanical properties of bisphenol F based epoxy resin were studied. Two different self-assembling block copolymers, (a) constituting of a center block of poly (butyl acrylate) and two side blocks of poly (methyl) methacrylate-co-polar co-monomer (BCP 1) and (b) poly(ethylene oxide)-b-poly(butylene oxide) (PEO-PBO) diblock copolymer (BCP 2), were used with an epoxy-hardener system. The maximum fracture toughness and fracture energy were measured as KIc = 2.75 MPa·m1/2 and GIc = 2.37 kJ/m2 for the 10 wt % of BCP 1 modified system, which were 366% and 2270% higher in comparison to reference epoxy system, and a 63% reduction in tensile strength was also observed. Similarly, for BCP2 modified systems, the maximum value of KIc = 1.65 MPa·m1/2 and GIc = 1.10 kJ/m2 was obtained for epoxy modified with 12 wt % of BCP2 and a reduction of 32% in tensile strength. The fracture toughness and fracture energy were co-related to the plastic zone size for all the modified systems. Finally, the analysis of the fracture surfaces revealed the toughening micro-mechanisms of the nanocomposites.

1. Introduction

Epoxies are highly cross-linked thermoset polymers which exhibit high modulus, high strength and low creep and are used in wide range of applications e.g., automotive, aerospace, electronics, adhesives, etc. At the same time, the high crosslink density makes them inherently brittle materials as they are unable to resist crack initiation and propagation effectively i.e., epoxies have low fracture toughness.
To enhance the toughness of brittle epoxy polymers, the most common method is to add the multiphase structure with a distinct rubbery (softer) phase in the epoxy matrix. Generally, the rubber particles are blended with the epoxy thermoset resin before curing them with the hardener. The different types of rubber modifiers that have been in practice so far are a carboxyl-terminated copolymer of butadiene and acrylonitrile (CTBN) [1], an amine-terminated copolymer of butadiene and acrylonitrile (ATBN) [2], rubbers having end groups like amine [3] and hydroxyl [4]. Liu et al. [5] from their work reported that, with an incorporation of 5 wt % of the BCP material into bisphenol A-based epoxy resin, there was an improvement in the fracture toughness of 100% over the neat epoxy resin. This is because in general, at lower BCP wt % in epoxy resin, they may self-assemble into micro/nanostructures following different morphologies: Vesicles, spherical micelles and wormlike micelles. The structure formed with such interactions mainly depends on parameters like block length, molecular weight, composition, and matrix-block interaction.
Barsotti et al. [6] reported a higher value of fracture toughness for an epoxy system modified with block copolymer poly (methyl methacrylate)-b-poly (butyl acrylate)-b-poly (methyl methacrylate) (MAM) than that of the epoxy system modified with CTBN at the same wt % of loading. Different researchers from their research have summarized that the BCPs are capable of toughening the epoxy system to a higher toughness when compared to traditional homopolymers and random copolymer toughening agents, but they also tagged the same BCPs as a reason for the reduction of elastic modulus, tensile strength and also the glass transition temperature [7,8,9,10,11,12]. Barsotti et al. [6] compared the fracture toughness improvement ability of block copolymer and CTBN in the same epoxy system but using another block copolymer poly (methyl methacrylate)-b-poly (butyl acrylate)-b-poly (methyl methacrylate) (MAM). These researchers reported that MAM modified epoxies have a significantly higher fracture toughness than the CTBN modified epoxies by adding the same wt % loading. They reported that, for example, in a dicyandiamide (DICY) cured DGEBA epoxy, 5 wt % MAM modified epoxy gave a value of KIc = 1.64 MPa·m1/2 while a value of KIc = 1.32 MPa·m1/2 was measured for a 5 wt % CTBN modified epoxy. Pearson et al. [13] compared the fracture toughness improvement ability of SBM block copolymer, core-shell rubber particles, and CTBN rubber on a lightly cross-linked piperidine cured epoxy. These researchers found that the SBM block copolymers could continuously toughen the epoxies up to 25 wt % of the SBM when added, while a plateau or a peak of fracture toughness was observed at about 10 wt % for the core-shell rubber particle or CTBN modified epoxies. More importantly, the maximum value of KIc for the SBM modified epoxies was reported to nearly approach 5 MPa·m1/2, while the core-shell rubber particle or CTBN modified epoxies reached a plateau or maximum at about 3 MPa·m1/2. Wu et al. [14] studied the structure and properties of epoxies modified with PBO-PEO diblock copolymers by varying the composition of the diblock copolymers. These researchers found that the fracture energy of the block copolymer modified epoxies was dependent on the morphologies of the modified epoxies. They reported that, for the same block copolymer loading, epoxies with dispersed branched worm-like micelles have the highest fracture toughness. The results from the past research have demonstrated that block copolymer toughening has the potential to provide a higher toughness improvement compared to traditional homopolymers and random copolymer toughening agents.
The following key research questions were addressed in this study. (a) To which extent can the bisphenol F based epoxy system be toughened by different block copolymers? (b) To which extent and in which way do different BCP’s affect or alter other mechanical properties, e.g., stiffness, strength, and viscoelastic properties of the epoxy system? (c) Which tangible relationships between matrix toughness, other mechanical properties, and the material’s structural features (morphology) can be derived for nanocomposites?

2. Materials and Methods

In the present work, Epikote Resin 862 (diglycidyl ether of bisphenol F) liquid epoxy resin supplied by Hexion Inc, was used as a base matrix [15] which has an epoxy equivalent weight (EEW) of 169 g eq−1. The anhydride based curing agent CH141 (H) and accelerator (CR144) was supplied by Sika chemicals. The resin, hardener, and accelerator used in the ratio of 100:100:1.7. A poly [(methyl methacrylate-co-polar comonomer]-b-poly (butyl acrylate] (PMMA-b-PBuA-b-PMMA) MAM di-block copolymer (BCP 1) D51N was supplied as powder by Arkema, France, was used as the toughening agent. The second block copolymer consists of poly(ethylene oxide)-b-poly(butylene oxide) (PEO-PBO) diblock copolymers (BCP 2) which was supplied as liquid by Dow chemical company under the trade name FORTEGRATM 100. The BCP concentration was varied systematically from 2 to 12 wt %. In the preparation of BCP1 nanocomposites, the required amount of BCP1 was mixed with preheated epoxy resin and the mixture was dispersed in a propeller (Dispermat, Getzmann GmbH, Reichshof, Germany) at 90 °C until transparent mixture was obtained ensuring complete melting of BCP1 in the epoxy. After that, the modified epoxy was cooled down to 55 °C and mixed with a stoichiometric amount of curing agent by stirring for 5–10 min at 350 rpm. On the contrary preparation of BCP2 based composites were bit easier as BCP2 was in liquid state, the required amount of BCP2 was mixed with preheated epoxy resin, and the mixture was dispersed in a propeller at 55 °C for 20 min. The mixture was then cast into glass molds to produce tensile samples and into steel molds for compact tension (CT) specimens, respectively. The samples were cured in two steps at 80 °C for 4 h and at 130 °C for 18 h. In Table 1 notation (EP_ x Y) EP denotes the reference bisphenol F based epoxy system, x represents the wt % used, and Y represents the modifier.

2.1. Differential Scanning Calorimetry

DSC was performed on a Mettler-Toledo DSC1 STAR® system (Mettler-Toledo GmbH, Giessen, Germany) to determine the glass transition temperature (Tg) of the epoxy systems. Firstly, the cured sample material was weighed (~7–13 mg) and placed in a crucible, sealed with lids with the help of a crucible sealing press. In the first cycle, the sample was heated from room temperature up to 200 °C and cooled down to room temperature and again heated to 200 °C with a heating rate of 10 °C/min.

2.2. Dynamic-Mechanical Thermal Analysis

In the present study, the storage modulus, the loss modulus, and tan δ of all the bulk samples were measured by dynamic mechanical thermal analysis using a Q800 V7.5 Build 127 DMTA machine from TA Instruments in 3 point bending mode operating at 1 Hz, on specimens of 60 mm × 10 mm × 4 mm. The glass transition temperature, Tg of the bulk epoxy samples was determined by the peak value of tan δ. The temperature range was set from −120 °C to 200 °C with a heating rate of 2 °C/min.

2.3. Mechanical Properties

Tensile tests were conducted at 23 °C on a universal testing machine (Zwick 1474, Zwick Roell AG, Ulm, Germany) in a tensile configuration according to standard DIN EN ISO 527-2. Dog-bone shape (ISO 572-2 type 1B) samples were used for the testing. The testing speed was chosen to be 2 mm/min with a 10 kN load cell; a precision sensor-arm extensometer was used to determine the specimen strain.

2.4. Fracture Test

Linear elastic fracture mechanics (LEFM) allows measuring the intrinsic fracture toughness of brittle solids [16]. Independent of the specimen geometry, the LEFM provides information about the initiation of cracks in epoxy nanocomposites. The plane strain fracture toughness (KIc) of the composites was determined experimentally at 23 °C by using compact tension (CT) samples under tensile loading conditions according to the ISO 13586 and at strain rate of 0.2 mm/min. The thickness B and the width W of specimens were chosen to be 4 mm and 30 mm, respectively. These samples were tested in a universal testing machine (Zwick 1474, Zwick Roell AG, Ulm, Germany). Prior to testing, a notch was machined and then sharpened by tapping a fresh razor blade into the material, so that a sharp crack was initiated with a length ao (0.45·W ≤ ao ≤ 0.55·W). The fracture toughness KIc was then calculated by Equation (1), where F is the maximum force observed in the load-displacement curve, and ao is the initial crack length for calculating α = a/W and f (a/W) as follows [17]
K I c =   F B W   · f a / W
f a W = f α =   2 + α   1 α 3 / 2 · 0.866 + 4.64 α 13.32 α 2 +   14.72 α 3   5.60 α 4
The knowledge of the critical stress intensity factor KIc, the elastic modulus Et and Poisson’s ratio ν (~0.35) [18] allows calculating the critical energy release rate GIc.
G I c = K I c 2 1   υ 2 E t

2.5. Microscopy Studies

The fractured surfaces of the CT tested nanocomposites were studied with the help of a field emission scanning electron microscope (SEM SUPRATM 40 VP, Carl Zeiss NTS GmbH, Oberkochen, Germany). Before scanning, the surfaces of the samples were sputtered with a thin layer of gold and platinum for 70 s using a sputtering device (SCD-050, BAL-TEC AG., Balzers, Liechtenstein). A white light profilometer (FRT MicroProf, FRT GmbH, Bergisch Gladbach, Germany) was employed to measure the surface roughness of fractured compact tension samples in non-contact mode. It has a lateral resolution of 1 μm, the vertical resolution of 3 nm, x/y scan range: 100 mm × 100 mm and z- scan range: 3 mm. An atomic force microscope (AFM) was used to determine the morphology of the bulk material. In the present work, Multimode AFM (MMAFM-2)/Serial nos. 7410 with Nanoscope 3a controller and Nanoscope® 3a software version 5.31R1 from Digital instruments/Hysitron (Minneapolis, MN, USA) was used which has a lateral resolution of 2 nm, vertical resolution of 2 nm, a x/y scan range of 0.3–120 μm, and a z scan range of 0–5 μm. In the present work, AFM was performed in tapping mode to obtain the morphology of epoxy nanocomposites. A smooth surface of the samples was obtained using power microtome. The phase and height images were captured at 512 × 512-pixel resolution and scan speed of 1 Hz was selected.

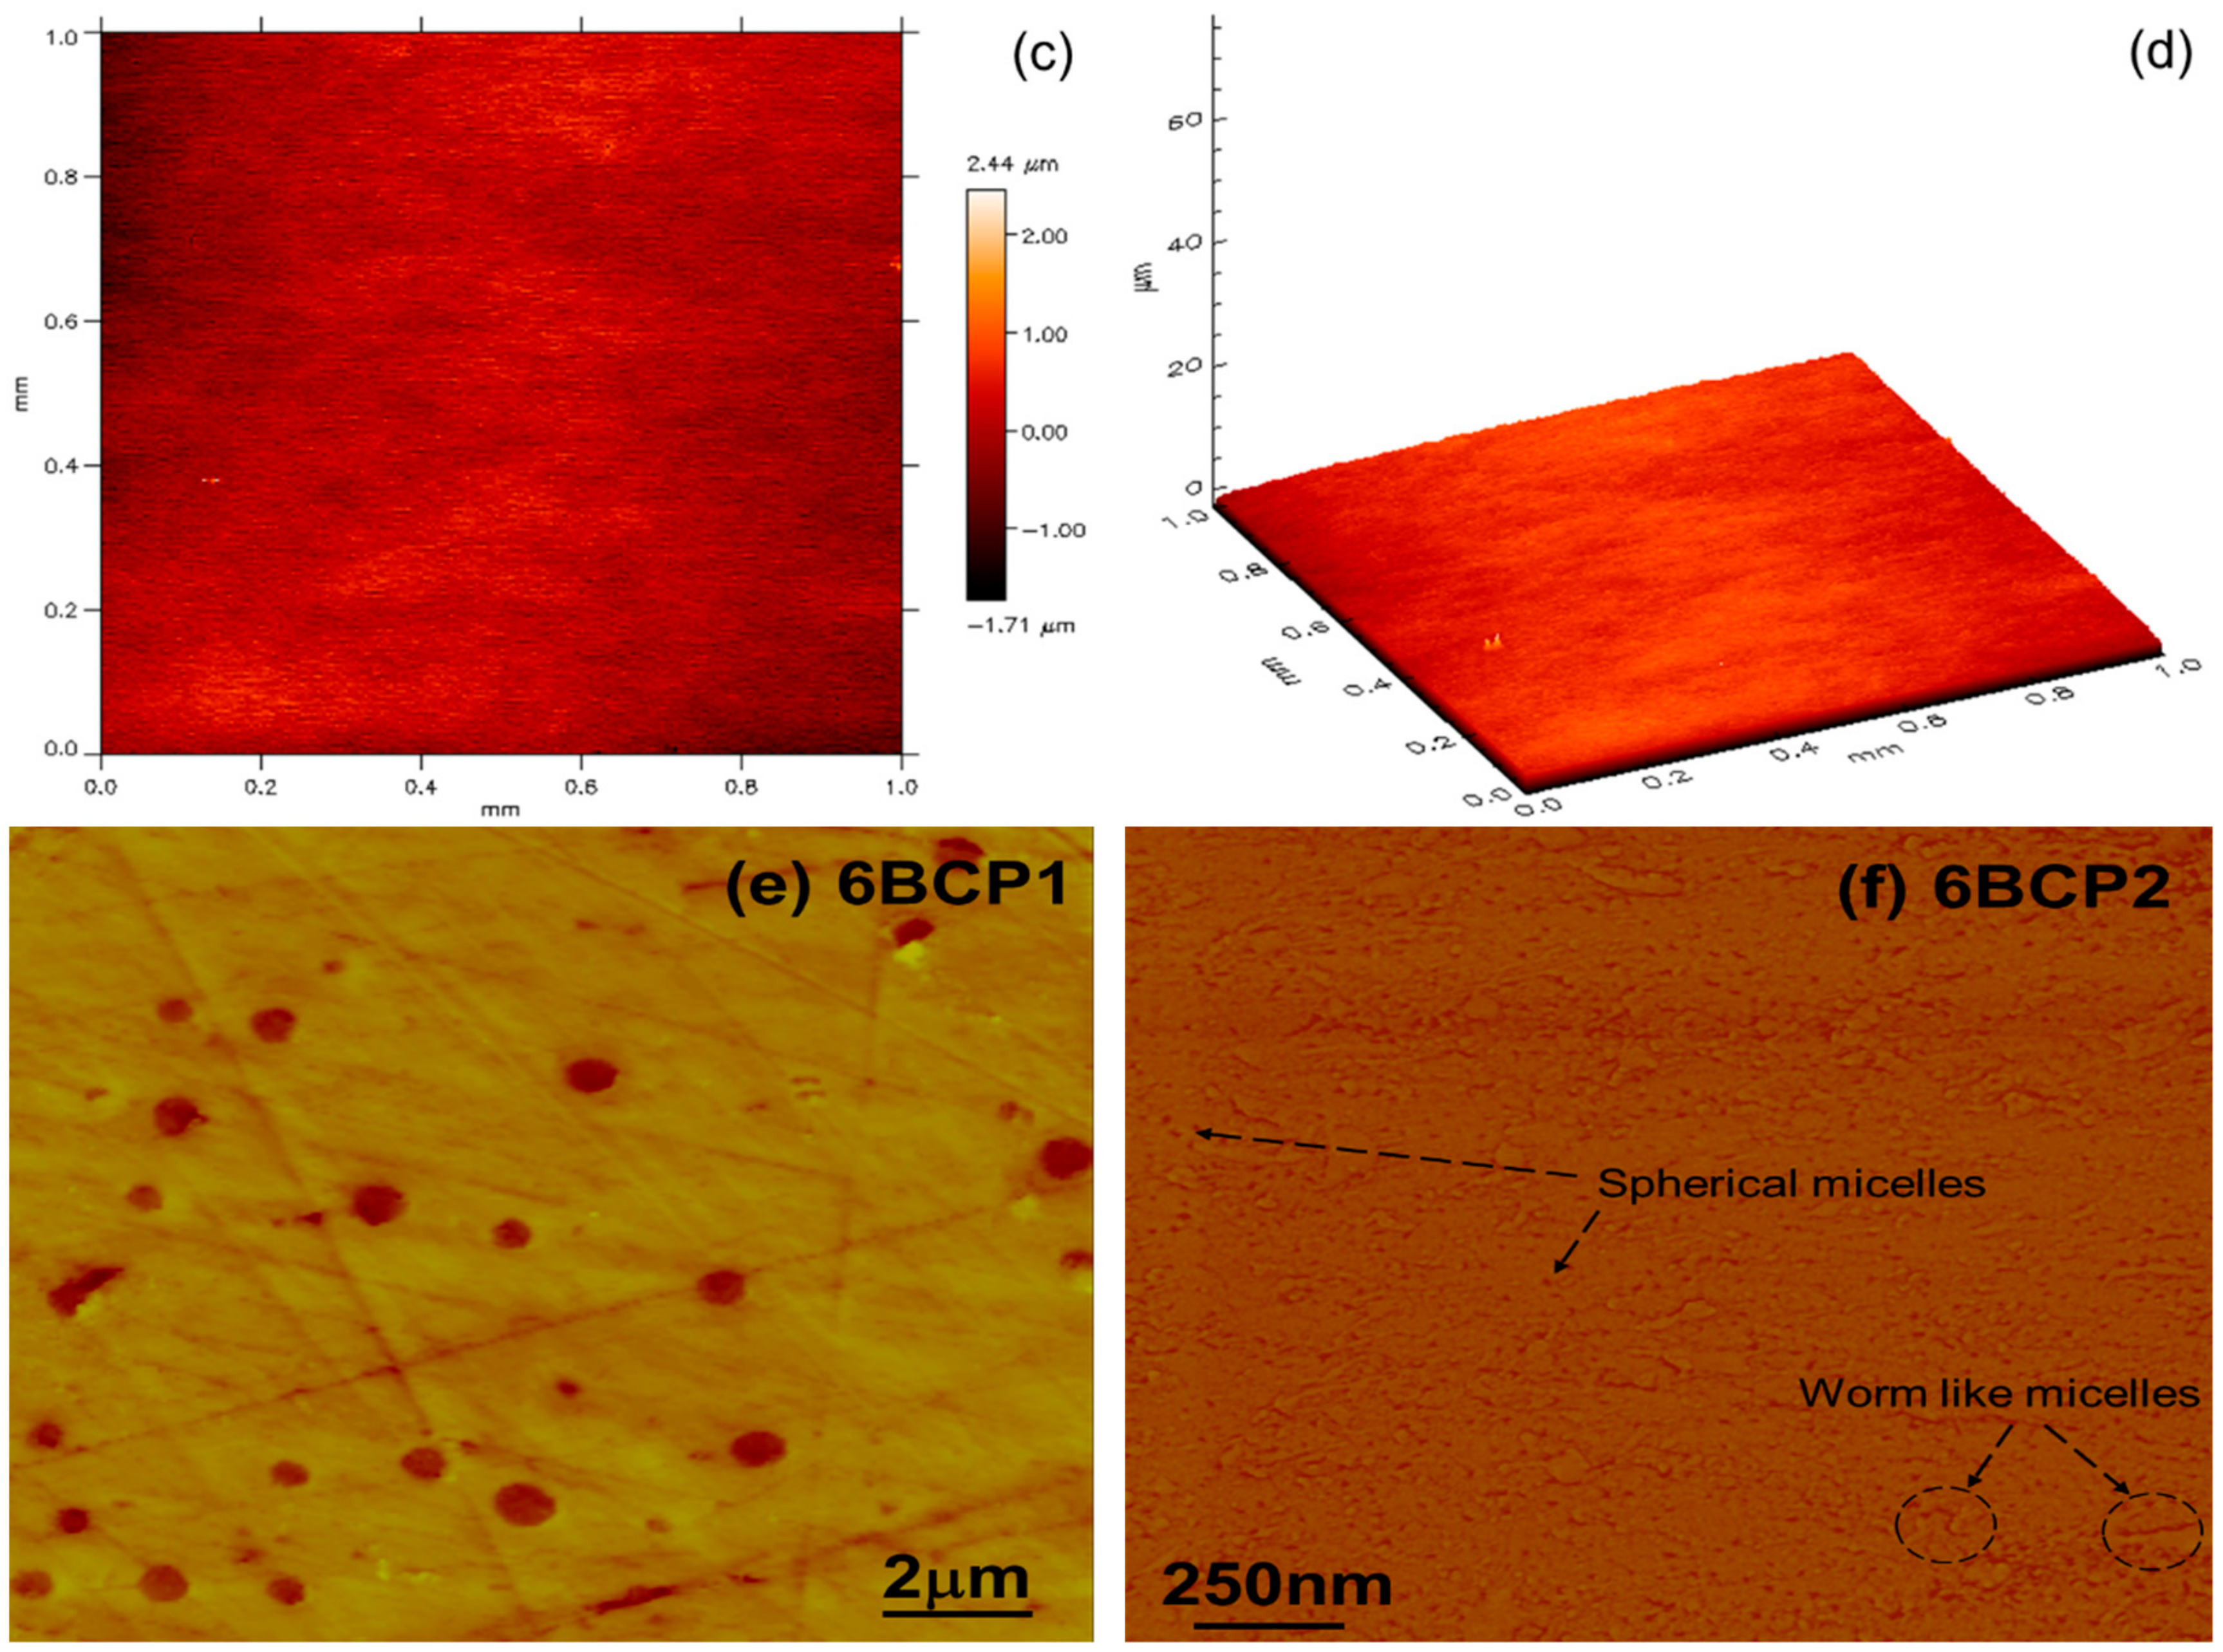
3. Results and Discussion

3.1. Glass Transition Temperature and Viscoelastic Properties

The glass transition temperature (Tg) was determined using DSC and DMA (tan δ curve) the results were summarized in Table 2. However, there was a slight difference between the Tg values due to the difference in principle of measurement for DSC and DMA plus difference in the heating rate. Addition of both type of BCP systems does not have any drastic effect on the Tg of modified systems. The position of the peak in tan δ at 140 °C remains unchanged for BCP1 system, indicating that complete phase separation occurred. For EP_BCP2 systems, the minor change in Tg was attributed to the formation of nanostructures (nanostructuration) in the composites [19] and another reason may be the smaller wt % of the BCP in the resulting composite systems [20,21,22].
Figure 1 shows the variation in the storage modulus and tan δ values with temperature for BCP1 and BCP2 systems respectively. Small shoulders were observed next to the main α relaxation of the epoxies on the tan δ curves of the EP_12BCP1 modified epoxies (Figure 1a), and a similar shoulder was not observed on the tan δ curve of the unmodified epoxy. These shoulders represent the micro-phase separation of the PMMA block occurred in the BCP1 modified epoxy during the polymerization process because the α relaxation of PMMA has been reported to be in the same temperature range (about 100 °C) as the small shoulders [21,23,24]. The main relaxation around 140 °C was associated with the glass transition temperature of the epoxy-rich phase, where larger segments of the polymer became mobile. The β-transition peak (Tβ) was observed at −88 °C. The shift of this relaxation to lower temperature compared to the one of the neat EP network (~−70 °C) indicates a plasticization effect induced by the incorporation of PbuA blocks in the epoxy network. The same phenomena has already been observed for miscible DGEBA-MCDEA/homo PMMA blends [23]. The DMA tests also show a very small tan δ peak at −36 °C and 91 °C for the BCP1 modified epoxies, corresponding to the presence of phase separated PbuA and PMMA at high concentrations of BCP1. For BCP2 modified systems a minor peak was observed at −65 °C which corresponds the phase separated.

3.2. Tensile Properties

The tensile properties of both types of BCP modified EP system were shown in Table 3. A modulus of 3410 MPa and a tensile strength of 92 MPa were measured for the reference EP system. The addition of BCP1 reduces the modulus and tensile strength of the epoxies, which was expected because the D51N type BCP1 was softer than the epoxy and it contains the softer phase content in the medium range [25]. Till 6 wt % of BCP1 the mechanical properties decrease linearly, and for 8 wt % of BCP1 sudden decrease in tensile strength was observed. For EP_12BCP1 system, the tensile strength and tensile modulus were measured as 31 MPa and 2700 MPa, respectively. Similarly, EP system was modified with BCP 2, and it can be observed that for system EP_12BCP2 the value of tensile strength and elastic modulus was reported as 61 MPa and 2300 MPa, respectively. In case of BCP2 modified systems with increasing wt % of BCP2, tensile strength and elastic modulus decrease linearly. Figure 2a showing the representative stress strain curves of different BCP1 modified systems, it can be observed that from 4 wt % onwards, a slight deviation was observed in the curves before the yield strength as compared to reference system which indicates the formation of voids during the tensile testing which was not observed in the case of BCP2 modified systems. This phenomenon of void formation also led to stress whitening in tensile samples during the tensile tests. During stress whitening, BCP1 particles debond from the matrix and form micro-voids which scatter light and cause whitening in the tensile samples during the testing. A similar phenomenon was reported by chen et al. [21].

3.3. Fracture-Mechanics Properties

The fracture toughness, KIc, and fracture energy, GIc, of the unmodified epoxy and epoxies modified with BCP were measured in mode I using compact tension (CT) tests. The results were summarized in Table 3. The mean values for KIc and GIc of the unmodified epoxy were measured as 0.59 MPa·m1/2 and 0.1 kJ/m2, respectively. For the BCP1 modified epoxies, a steady increase of the values of the KIc, and the GIc was observed with the increasing concentration of BCP1 up to 10 wt%. The maximum values of KIc = 2.75 MPa·m1/2 and the GIc = 2.37 kJ/m2 were measured for EP_10BCP system. These were 366% and 2270% increase compared to the reference system. For EP_12BCP1 system, sudden decrease was observed in the values of KIc = 1.45 MPa·m1/2 and the GIc = 0.69 kJ/m2. These values were in line with the fracture toughness reported by researchers [10,21,22]. For BCP2 modified systems, the fracture toughness and fracture energy increased with the increase in concentration of BCP2 till 12 wt%. The KIc = 1.65, MPa·m1/2 and GIc = 1.04 kJ/m2 was reported for EP_12BCP2 system.

3.4. Fractography Studies

The toughening mechanisms responsible for the increase in fracture toughness due to matrix modification can be explained by analyzing the fracture surfaces of the unmodified and modified epoxy composites using a scanning electron microscope (SEM). The fracture surfaces for the unmodified epoxies, as shown in Figure 3a, for the anhydride-cured epoxy, show a smooth fracture surface, which was a typical behavior of brittle materials. This indicates a lack of plastic deformation during the fracture process. Only small-scale river lines were observed at the crack tip, which were caused by the presence of some local mixed-mode I/III stresses [26].

3.4.1. BCP Modified Epoxies

The fracture surface of diblock BCP1 modified epoxies exhibits very rough and multi planar fracture surface with evenly dispersed micron size cavities. In BCP1 modified epoxy, as the filler content is increased, the size of the cavities was also found to increase. Figure 3 shows micrographs of different wt % of BCP1 modified with anhydride curing agent. From Figure 3b, the radius of the micron sized fillers were found to be in the range of ~(400 nm–1600 nm).
The main mechanisms observed are cavitation, crack pinning, small spherical inclusions, debonding of particles, followed by shear band yielding of the epoxy matrix. Cavitation is regarded as one of the significant energy absorbing processes, and the role of cavitation is to relieve the triaxial stress, and thereby promote the matrix shear banding. Cavitation of the micron sized BCP1 particles and subsequent plastic void growth for epoxies process absorbs energy, hence increasing the toughness. For 2 wt % to 6 wt %, spherical inclusions (see Figure 3b) were observed on the fracture surface responsible as the main mechanism for the resulting fracture toughness besides crack pinning, which has fractional influence for the improvement of fracture toughness. Phase inversion was observed in the modified epoxies containing more than 8 wt % BCP1. Figure 3c shows the partial phase partly phase inverted epoxy containing 8 wt % BCP1 on which both the MAM-rich domains and the epoxy-rich domains can be clearly seen. For both 8 wt % and 10 wt % the same identical partly phase-inverted features were observed with epoxy and MAM rich domains. The significant improvement in fracture toughness resulted due to the co-continuous morphology obtained from the reticulated epoxy-rich and BCP-rich phase, which form a hard and soft composite domain. When the crack propagates through this structure, the brittle epoxy phase fractured and the BCP phase was elongated across the fracture surfaces (Figure 3b,c) which led to increased energy absorption before the final fracture. The BCP1 can be expected to possess a low yield stress and relatively high ductility due to the presence of PMMA and PbuA blocks in BCP1 which have low yield stress values as compared to a neat epoxy system. Hence as the crack opens, the BCP particles will deform and absorb energy, thus increasing the measured fracture energy. Fraaije and Sevink [27] predicted several phase-separated nanostructures within macrophase-separated block copolymer spherical particles using self-consistent field simulations. Moreover, at 12 wt %, the epoxy-BCP1 mixture is fully phase inverted (Figure 3d), which leads to drastic decrease in fracture properties. Table 4 shows the surface roughness values of fractured surface of CT samples which clearly exhibit in increasing trend in surface roughness values with increasing wt % of BCP1.
The fracture surface of the epoxies did not change much but appeared rough after the addition of the BCP2, as shown in Figure 4b–d. The surface roughness of fractured samples measured with white light profilometry shows an increasing trend in surface roughness with an increase in BCP content (see Table 4). Because of the nanostructuration of BCP2 in epoxy systems via a self-assembling mechanism, the exact morphology of nanostructure domains cannot be identified through SEM images, which was also reported by other researchers as well [8,28], so AFM was performed to see the morphology (Figure 5f). Furthermore, small scale matrix tearing was observed on the fracture surfaces of the BCP2 modified epoxies with all morphologies. These features indicate the enhanced plastic deformation of the epoxies. The obtained morphologies were in a good agreement with the work of researchers [11,21]. The toughening mechanisms involved in the BCP2 modified anhydride cured epoxy composites can be proposed. The filler particles can induce shear yielding in the matrix by building up a change in stress state. This may result in the formation of voids, cavities, and debonding effects in the process zone at the crack tip vicinity [29]. Some researchers suggested the toughening mechanism as pullout and bridging for nanoscale micelles [21,30].
However, a large difference between the dimensions of nanoscale micelles (~25 nm–50 nm) and crack tip opening displacement (CTOD) [31] that was measured for EP_12BCP2 as 38.8 µm using Equation (4); these mechanisms hardly provide any significant toughening. In Equation (4), E represents the young’s modulus; σ y represents tensile yield strength, KIc represents fracture toughness, GIc represents fracture energy and ν represents the Poisson’s ratio for the epoxy system.
C T O D =   K I c E σ y 1 ϑ 2 = G I c σ y
Based on the fractography evidence, the following mechanisms were proposed for EP _BCP2 systems: (a) cavitation of micelles (spherical and worm-like) and (b) enhanced plastic deformation/tearing due to localized plasticization effect of the epoxy/PMMA mixing region. The micelles formed in an epoxy network were in nanometer range, thus it created a very large contact area between micelles and epoxy matrix; during the crack propagation, the large surface area between these interfaces absorbed more energy before the final fracture of the material; further, with the increase in BCP concentration, the interface area increased leading to more fracture energy absorption and high surface roughness of the fractured samples. The toughening mechanism was supported by the observation of the enhanced matrix tearing and enlarged plastic zone size (Table 4).

3.4.2. Plastic Zone Size

The plain strain dimension of plastic zone size can be quantified by Irwin’s model, assuming that the zone was circular and crack occurs in the matrix, by using Equation (5) [31] where KIc is the fracture toughness, and σ yt is the tensile true yield stress of the bulk polymer. A plastic zone radius of 2.18 µm was calculated for EP system; the maximum plastic zone size of 347 µm was calculated for EP_10 BCP, and all the other modified systems plastic zone size fall between these two limits (see Table 4).
r y = 1 6 π K I c σ y t 2
The plastic zone was considerably larger than the radius of BCP particles observed in the SEM images, so these particles fit in the plastic zone range and toughen the matrix by the events such as cavitation, plastic void growth (for BCP), and shear yielding, compelling the material to dissipate more energy before the fracture.

4. Conclusions

An anhydride cured epoxy system was modified using two different types of block copolymers, namely, BCP1 (containing PbuA and PMMA blocks) and BCP2 (PEO-PBO blocks). The microstructure, mechanical properties, fracture mechanic properties, and toughening mechanisms were identified. The BCP1 phase separated into dispersed micron-size particles till 6 wt % of BCP1 and into a co-continuous microstructure for 8 wt % and 10 wt %, and complete phase inversion was observed at 12 wt % of BCP1. The addition of BCP2 to the epoxy was found to form a nanostructure with no traces of macrophase separation. The glass transition temperature remained unaffected with the addition of both the block copolymer systems. The elastic modulus and ultimate tensile strength decreased linearly with increase in wt % of BCP1 because of the relative softness of PMMA and PbuA present in BCP1. However, a sudden drop was observed in the tensile strength from 8 wt % BCP1 onwards. Significant increase in the fracture toughness KIc and fracture energy GIc were measured because of addition of BCP1, and maximum values of KIc = 2.75 MPa·m1/2 and GIc = 2.37 kJ/m2 were measured for the EP_ 10 BCP1 system. The main toughening mechanisms for EP_BCP1 systems were observed as cavitation of micron-size BCP1 particles followed by void growth, shear yielding, and minor contribution from crack pinning. The co-continuous morphology resulted in higher fracture toughness and fracture energy of BCP1 system. Similarly for BCP2 systems, no macrophase separation occurred; the tensile strength and tensile modulus steadily decreased with increase in BCP2 wt %, and maximum values KIc = 1.65 MPa·m1/2 and GIc = 1.04 kJ/m2 were observed for 12 wt % of BCP2 system. The toughening mechanisms for BCP2 modified EP systems were cavitation of the spherical micelles and the enhanced plastic deformation of the epoxy matrix due to the plasticization effect of epoxy/PMMA mixing region. The obtained morphology of the nanocomposites depends mainly on thermodynamics between the block copolymers and hardener systems. Depending on the property requirement, the type of block copolymer is selected.

Author Contributions

A.B. and B.W. conceived and designed the experiments; A.B. prepared the nanocomposite and performed all the tests; A.B. and B.W. analyzed the data; A.B. wrote the paper.

Funding

This research received no external public funding.

Acknowledgments

The authors gratefully acknowledge the provision of the materials by Arkema and Dow chemicals.

Conflicts of Interest

The authors declare no conflict of interest.

References

  1. Sultan, J.N.; McGarry, F. Effect of rubber particle size on deformation mechanisms in glassy epoxy. Polym. Eng. Sci. 1973, 13, 29–34. [Google Scholar] [CrossRef]
  2. Ratna, D. Toughened Thermoset Resins. In Handbook of Thermosets; Smithers—A Smithers Group Company: Shawbury, UK, 2009; pp. 187–188. [Google Scholar]
  3. Kishore, K.S. Analysis of deformation behaviour and fracture features in glass-epoxy composites toughened by rubber and carbon additions. J. Mater. Sci. Lett. 1992, 11, 86–88. [Google Scholar]
  4. Riew, C. Rubber, Chemistry and Technology; Rubber Division, American Chemical Society: Akron, OH, USA, 1985; p. 622. [Google Scholar]
  5. Liu, J.; Thompson, Z.J.; Sue, H.J.; Bates, F.S.; Hillmayer, M.A.; Dettlof, M.; Jacob, G.; Verghese, N.; Pham, H. Toughening of Epoxies with Block Copolymer Micelles of Wormlike Morphology. Macromolecules 2010, 43, 7238–7243. [Google Scholar] [CrossRef]
  6. Barsotti, R.; Fine, T.; Inoubli, R.; Gerard, P.; Schmidt, S.; Macy, N.; Magnet, S.; Navarro, C. Nanostrength Block Copolymers for Epoxy Toughening; Thermoset Resin Formulators Association: Chicago, IL, USA, 2008. [Google Scholar]
  7. Kishi, H.; Kunimitsu, Y.; Nakashima, Y.; Imade, J.; Oshita, S.; Morishita, Y.; Asada, M. Relationship between the mechanical properties of epoxy/PMMA-b-PNBA-b-PMMA block copolymer blends and their three-dimensional nanostructures. Express Polym. Lett. 2017, 11, 765–777. [Google Scholar] [CrossRef]
  8. Kishi, H.; Kunimitsu, Y.; Nakashima, Y.; Abe, T.; Imade, J.; Oshita, S. Control of nanostructures generated in epoxy matrices blended with PMMA-b-PnBA-b-PMMA triblock copolymer. Express Polym. Lett. 2015, 9, 23–25. [Google Scholar] [CrossRef]
  9. Klingler, A.; Wetzel, B. Fatigue crack propagation in triblock copolymer toughened epoxy nanocomposites. Polym. Eng. Sci. 2017, 57, 579–587. [Google Scholar] [CrossRef]
  10. Klingler, A.; Bajpai, A.; Wetzel, B. The effect of block copolymer and core-shell rubber hybrid toughening on morphology and fracture of epoxy-based fibre reinforced composites. Eng. Fract. Mech. 2018, 203, 81–101. [Google Scholar] [CrossRef]
  11. Bajpai, A.; Alapati, A.; Klingler, A.; Wetzel, B. Tensile properties, fracture mechanics properties and toughening mechanisms of epoxy systems modified with soft block copolymers, rigid TiO2 nanoparticles and their hybrids. J. Compos. Sci. 2018, 2, 72. [Google Scholar] [CrossRef]
  12. Bajpai, A.; Alapati, A.K.; Wetzel, B. Toughening and Mechanical Properties of Epoxy Modified with Block Co-polymers and MWCNTs. Procedia Struct. Integr. 2016, 2, 104–111. [Google Scholar] [CrossRef] [Green Version]
  13. Pearson, R.; Bacigalupo, L.; Liang, Y.; Marouf, B.; Oldak, R. Plastic zone size—Fracture toughness correlations in rubber-modified epoxies. In Proceedings of the 31st Annual Meeting of the Adhesion Society, Austin, TX, USA, 17 February 2008. [Google Scholar]
  14. Thio, Y.; Wu, J.; Bates, F. The role of inclusion size in toughening of epoxy resins by spherical micelles. J. Polym. Sci. Part B Polym. Phys. 2009, 47, 1125–1129. [Google Scholar] [CrossRef]
  15. Hexion Inc. Product Specifications for the EPON862 and Technical Data Sheet; Hexion Inc.: Columbus, OH, USA, 2005. [Google Scholar]
  16. Moore, D. Application of Fracture Mechanics to Polymers, Adhesives and Composites; Elsevier Science: Amsterdam, The Netherlands, 2003. [Google Scholar]
  17. Plastics—Determination of Fracture Toughness (GIc and KIc)—Linear Elastic Fracture Mechanics (LEFM) Approach; ISO 13586:2000(E); ISO (the International Organization for Standardization): Geneva, Switzerland, 2000.
  18. Kinloch, A.J. Stresses in Adhesive Joints. In Adhesion and Adhesives: Science and Technology; Springer: Berlin, Germany, 1987; p. 209. [Google Scholar]
  19. Fan, W.; Wang, L.; Zheng, S. Nanostructures in thermosetting blends of epoxy resin with polydimethylsiloxane-block-poly(ε-caprolactone)-block-polystyrene ABC triblock copolymer. Macromolecules 2009, 42, 327–336. [Google Scholar] [CrossRef]
  20. Redline, E.M.; Declet-Perez, C.; Bates, F.S.; Francis, L.F. Effect of block copolymer concentration and core composition on toughening epoxies. Polymer 2014, 55, 4172–4181. [Google Scholar] [CrossRef]
  21. Chen, J.; Taylor, A.C. Epoxy modified with triblock copolymers: Morphology, mechanical properties and fracture mechanisms. Mater. Sci. 2012, 47, 4546–4560. [Google Scholar] [CrossRef]
  22. Chong, H.M.; Taylor, A.C. The microstructure and fracture performance of styrene–butadiene–methylmethacrylate block copolymer-modified epoxy polymers. Mater. Sci. 2013, 48, 6762–6777. [Google Scholar] [CrossRef]
  23. Ritzenthaler, S.; Girard-Reydet, E.; Pascault, J.P. Influence of epoxy hardener on miscibility of blends of poly(methyl methacrylate) and epoxy networks. Polymer 2000, 41, 6375–6386. [Google Scholar] [CrossRef]
  24. Ritzenthaler, S.; Court, F.; David, L.; Girard-Reydet, E.; Leibler, L.; Pascault, J.P. ABC Triblock Copolymers/Epoxy—Diamine Blends. 1. Keys To Achieve Nanostructured Thermosets. Macromolecules 2002, 35, 6245–6254. [Google Scholar] [CrossRef]
  25. Arkema. Technical Data Sheet—Nanostrength® Epoxy Application; Arkema: Paris, France, 2013. [Google Scholar]
  26. Hull, D. Fractography: Observing, Measuring and Interpreting Fracture Structure Topography; Cambridge University Press: Cambridge, UK, 1999. [Google Scholar]
  27. Fraaije, J.; Sevink, G. Model for pattern formation in polymer surfactant nanodroplets. Macromolecules 2003, 36, 7891–7893. [Google Scholar] [CrossRef]
  28. Dean, J.; Grubbs, R.B.; Saad, W.; Cook, R.; Bates, F. Mechanical properties of block copolymer vesicle and micelle modified epoxies. J. Polym. Sci. Part B Polym. Phys. 2003, 41, 2444–2456. [Google Scholar] [CrossRef]
  29. Bagheri, R.; Pearson, R.A. Role of plastic cavitation in rubber toughened epoxies. Polymer 1996, 37, 5597–5600. [Google Scholar] [CrossRef]
  30. Wu, J.; Thio, Y.S.; Bates, F.S. Structure and properties of PBO-PEO diblock copolymer modified epoxy. J. Polym. Sci. Part B Polym. Phys. 2005, 43, 1950–1965. [Google Scholar] [CrossRef]
  31. Kinloch, A.J.; Young, R.J. Fracture Behaviour of Polymers; Elsevier Applied Science: New York, NY, USA, 1983. [Google Scholar]
Figure 1. Graph showing (a) tan δ and (b) storage modulus, with respect to temperature for the EP_BCP1 systems. (c) tan δ and (d) storage modulus, with respect to temperature for the EP_BCP2 systems.
Jcs 03 00068 g001
Figure 2. Representative stress-strain curves for epoxy modified systems with (a) BCP1 and (b) BCP2.
Jcs 03 00068 g002
Figure 3. SEM micrograph showing the fracture surface of different epoxy systems modified with BCP1. White arrow indicates the direction of crack propagation.
Jcs 03 00068 g003
Figure 4. SEM micrograph showing the fracture surface of different epoxy systems modified with BCP2. White arrow indicates the direction of crack propagation.
Jcs 03 00068 g004
Figure 5. (a) 2D and (b) 3D profilometry micrograph showing the topography of the fractured surfaces for EP_6BCP1 and (c,d) for EP_6BCP2 systems, respectively. AFM (height) images of (e) 6BCP1 and (f) 6BCP2 modified systems.
Jcs 03 00068 g005aJcs 03 00068 g005b
Table 1. Composition and nomenclature of bulk epoxy based composites.
SeriesBCP (wt %)BCP (vol.%)
EP_H00
EP_2 BCP122.14
EP_4 BCP144.26
EP_6 BCP166.39
EP_8 BCP188.50
EP_10 BCP11010.62
EP_12 BCP11212.72
EP_2 BCP222
EP_4 BCP244
EP_6 BCP266
EP_8 BCP288
EP_10 BCP21010
EP_12 BCP21212
Table 2. Glass transition temperature (Tg) of EP_BCP systems.
BCP1
(wt %)
Tg (°C)
DSC
Tg (°C)
tan δ
BCP2
(wt %)
Tg (°C)
DSC
Tg (°C)
tan δ
01411400141140
21421372140137
41401364137136
61421376138136
81421368138136
1014213510137135
1214314012138137
Table 3. Tensile and fracture mechanics properties of reference epoxy system modified with different type of block copolymers measured at 23 °C.
SystemEt (MPa)σm (MPa)εm (%)KIc (MPa·m1/2)GIc (kJ/m2)
EP3410 (±68)92 (±0.7)5.7 (±0.01)0.59 (±0.09)0.10 (±0.05)
EP_2BCP13280 (±24)88 (±0.5)5.6 (±0.03)1.5 (±0.20)0.60 (±0.20)
EP_4BCP13140 (±11)83(±1.9)4.9 (±0.66)1.91 (±0.10)1.01 (±0.11)
EP_6BCP12930 (±10)80 (±0.9)5.3 (±0.44)2.20 (±0.02)1.44 (±0.04)
EP_8BCP12830 (±6)40 (±0.7)1.8 (±0.07)2.32 (±0.10)1.66 (±0.14)
EP_10BCP12800 (±22)34 (±0.2)1.3 (±0.01)2.75 (±0.12)2.37 (±0.20)
EP_12BCP12700 (±10)31 (±1.9)1.3 (±0.12)1.45 (±0.08)0.69 (±0.06)
EP_2BCP23400 (±31)90 (±0.3)5.2 (±0.2)0.70 (±0.09)0.13 (±0.07)
EP_4BCP23150 (±32)84 (±0.3)5.1 (±0.2)0.95 (±0.05)0.25 (±0.06)
EP_6BCP22960 (±29)79 (±0.5)5.1 (±0.3)1.12 (±0.12)0.37 (±0.11)
EP_8BCP22840 (±20)75 (±0.5)5.0 (±0.5)1.25 (±0.11)0.48 (±0.13)
EP_10BCP22570 (±11)70 (±0.4)5.4 (±0.6)1.37 (±0.14)0.64 (±0.12)
EP_12BCP22300 (±10)61 (±0.4)5.5 (±0.6)1.65 (±0.13)1.04 (±0.13)
Table 4. Surface roughness values of CT fractured samples for different EP _BCP systems measured from while light profilometry and predicted plastic zone size of nanocomposites.
SystemSurface Roughness (µm)Plastic Zone Predicted (µm)
EP0.1572.18
EP_2 BCP10.28315.4
EP_4 BCP10.35128.1
EP_6 BCP10.47840.1
EP_8 BCP10.544178.6
EP_10 BCP11.557347.2
EP_12 BCP15.176116.1
EP_2 BCP20.1672.2
EP_4 BCP20.1833.1
EP_6 BCP20.1966.8
EP_8 BCP20.20510.7
EP_10 BCP20.21620.3
EP_12 BCP20.23038.8

