Article

Bio-Composites Reinforced with Strontium Titanate Nanoparticles: Mechanical Behavior and Degradability

by
Amarilis Declet-Vega
,
Nelson Sepúlveda-Ramos
,
Sandra Crespo-Montoya
and
Oscar Marcelo Suárez
*
Nanotechnology Center, University of Puerto Rico—Mayagüez, P.O. Box 9000, Mayagüez, PR 00681, USA
*
Author to whom correspondence should be addressed.
J. Compos. Sci. 2019, 3(1), 7; https://doi.org/10.3390/jcs3010007
Submission received: 28 November 2018 / Revised: 12 December 2018 / Accepted: 2 January 2019 / Published: 9 January 2019
(This article belongs to the Special Issue Current Research and Development in Composite Materials)

Abstract

:
Bio-polymer-based composites are appealing cost-effective and environmentally friendly materials for electronic applications. This project relates to bio-composites made of chitosan and cellulose and reinforced with strontium titanate nanoparticles. Upon their fabrication, relevant parameters studied were the acetic acid concentration, the cellulose content, and the amount of strontium titanate nanoparticles. The specimens were characterized using thermogravimetric and degradation analyses, as well as via creep and tensile tests. The results revealed how higher cellulose levels lowered the ultimate tensile strength and the degradation temperature of the bio-composites. Moreover, when nanoparticles are present, higher cellulose levels contributed to their tensile strength. Additionally, more acidic solutions became detrimental to the mechanical properties and the thermal degradation temperature of the composites. Furthermore, the creep studies allowed determining elastic coefficients and viscous coefficients using the Burgers’ model. Those creep results suggest that higher amounts of SrTiO3 (STO) nanoparticles raised the composites creep strain rate. As a whole, the study provides a baseline characterization of these novel bio-composites when subject to aggressive environments.

1. Introduction

Chitosan and cellulose are among the most studied biopolymers due to their biocompatibility, biodegradability, and non-toxicity [1,2]. Additionally, their fabrication is unsophisticated and cost-effective, which makes them attractive for researchers interested in developing new composites made of a polymeric matrix and reinforced with nanoparticles.
In this respect, Hosokawa et al. fabricated bio-composites made of chitosan and cellulose and studied their mechanical properties [3]. They proved that the crosslinking between chitosan and cellulose have a direct effect on the mechanical properties. Additionally, these authors discovered that the carbonyl groups (C=O) and carboxyl groups (C–OH) in the cellulose structure affect their interaction with the amine groups of the chitosan. The cellulose oxidation-reduction can increase the number of carbonyl and carboxyl groups present in the biopolymer. To fabricate these chitosan-cellulose films, chitosan was dissolved in an aqueous acetic acid solution while the cellulose fibers were diluted in another aqueous solution after the oxidation or reduction method. Then, a small amount of chitosan was added to the cellulose solution, which contained glycerol. Afterward, the researchers measured the tensile strength and the swelling degree of the dry polymeric films. These authors also demonstrate how higher swelling degree (i.e., increasing water content) was detrimental to the tensile strength of the composites. This research also demonstrated that the said swelling degree rose for lower pH values.
Furthermore, Nonni et al. fabricated chitosan/poly (vinyl alcohol) fibers with CaCO3 nanoparticles to improve the mechanical properties of the composites [4]. The CaCO3 nanoparticles were precipitated via vapor diffusion of CO2 into a CaO aqueous solution. Chitosan was dissolved in acetic acid solution. Then, polyvinyl alcohol (PVA) and CaCO3 nanoparticles were incorporated to the chitosan solution. The resulting material was utilized to fabricate the fibers via electrospinning. The effect of nanoparticles loading in the composite observe was evaluated using tensile tests. The ultimate tensile strength decreased from 37.3 MPa for non-reinforced biopolymers (no CaCO3 nanoparticles) to 10.7 MPa for 3 wt. % CaCO3. Then, more CaCO3 led to an ultimate tensile strength increase of only 9 MPa. The Young’s modulus, however, rose significantly from 15.7 MPa (without nanoparticles) to 912.5 MPa with 4 wt. % CaCO3. From the different samples configuration, the one bearing better mechanical properties was the 4 wt. % CaCO3 specimen, which made it a promising alternative as artificial cartilage. Such bioinspired composites have been surveyed extensively in a prior publication.
Moreover, Hande et al. fabricated chitosan-cellulose polymeric films using two methods [5]. In the first one, chitosan dissolved in an acetic acid solution that, then, was magnetically stirred in an ice bath, as cellulose was added. The resulting solution was poured into a Petri dish and dried in vacuum at 30 °C. In the second method, the chitosan-cellulose polymeric films were prepared in a high-pressure reservoir. The resulting solution was poured onto a Petri dish and let dry as in the first method. All chitosan-cellulose films showed a similar thermal behavior observed through a thermogravimetric analysis. Up to 120 °C, water evaporation occurred since the films absorbed much water due to the hydrophilic behavior of cellulose. From 120 °C to 400 °C, depolymerization of chitosan chains (cleavage of the glycosidic linkages upon dehydration) took place. Finally, a significant weight loss was observed at 296 °C and was associated with the scission of the polymer chains. The authors concluded that cellulose did not change the thermal stability of the polymer films. This finding provided an insight to the present research where the stability of the biopolymeric matrix is analyzed.
Ibrahim et al. the mechanical and thermal behavior of polyester-oil palm ash composites [6]. Using a tensile testing machine at 5 mm/min deformation rate, they discovered that increasing the filler contents caused the ultimate tensile strength to decrease from 26.8 MPa to 13 MPa as the nanofillers percent rose from 0 to 30%. Such strength loss was attributed to the weak interaction of the filler with the polymer matrix. Besides, the authors discovered that the thermal stability improved with the amount of nanofillers: from 293.55 °C without oil palm ash to 401.72 °C for 30% oil palm ash. Once again, strain rate values and the effect of the matrix/reinforcement on the loss of the strength hints of potential problems in load transfer that is to be analyzed in the present work.
Further, it is well-known that biopolymers can undergo a four-stage creep behavior under stresses below the yield strength; such creep strain can be controlled by adding nanosized reinforcements. Within this context, our interest in polymer composites reinforced with nanoparticles led us to a J.L. Yang et al. work [7]. They studied the progressive deformation of polyimide nanocomposites and found that their creep resistance raised with the addition of the nanoparticles without sacrificing their tensile strength. Thus, the second part of the present work deals with creep strain of the biopolymer composites.
The biopolymer-based composites discussed above did not include ferroelectric particles that could open the door to bio-materials with appealing dielectric properties and biodegradable features. Thus, the present research addresses the fabrication and properties of bio-composites containing chitosan, cellulose, and SrTiO3 (STO) nanoparticles as reinforcements. These composites present unique characteristics suitable for electronic applications such as capacitors, transductors, and actuators [8]. Hence, if these composites must undergo high stresses and temperatures upon service, characterization of their mechanical and thermal properties becomes mandatory. For instance, in electrical circuits, these dielectric composites could be placed between metallic plates, which can lead to high stresses. Furthermore, the applied electric field can raise the temperature of the electrical component and degrade the polymeric matrix of the composite. Hence, this research assesses the behavior of the composites subject to tensile tests and degradation experiments.

2. Materials and Methods

The ensuing sections discuss the required precursors to synthesize the matrix. Since the nanoparticles could agglomerate, the composites needed individual fabrication steps to formulate a layered structure.

2.1. Materials Selection

The composites were fabricated using poly (D-glucosamine) deacetylated chitosan ((C6H11O4N)n, 75% deacetylation), cellulose powder (cotton linens), and SrTiO3 nanoparticles. To prepare the chitosan solution, acetic acid glacial ((CH3CO2H), 99.7%) was utilized. Furthermore, 4-methylmorpholine N-oxide solvent ((C5H11NO2), 50 wt. % in water) was required for the cellulose solution. The fabrication of the composites encompassed two parts: (a) synthesis of chitosan-cellulose composites, and (b) fabrication of the chitosan-cellulose composites containing SrTiO3 nanoparticles.

2.2. Sample Preparation

2.2.1. Fabrication of the Biopolymeric Matrix

As aforementioned, we used a chitosan and cellulose mixture via sol-gel casting. The as-provided chitosan was dissolved in a water/acetic acid solution and magnetically stirred. The concentration of chitosan was set to only 1.5 v% because the solution viscosity rose excessively at higher chitosan concentrations. Additionally, we studied two concentrations of acetic acid: 1.25 v% and 2.50 v% as this acid affects the swelling degree of the composites [3].
The as-provided cellulose was dissolved in 4-methylmorpholine N-oxide (NMMO) solvent and mechanically stirred at 65 °C to favor dissolution. As discovered in prior works, the addition of cellulose can increase the water content in the polymeric films [9], which is detrimental to the mechanical and thermal properties of these composites [10,11]. Hence, to further scrutinize this behavior, we also evaluated two concentrations of cellulose: 0.5 v% and 1.0 v%.
Upon preparing the said stock solutions of chitosan and cellulose, we worked on three small solutions containing 5 v%, 15 v%, and 25 v% cellulose. In other words, there were three smaller solutions containing 1.5 v% chitosan and 0.5 v% cellulose, and another three ones bearing 1.5 v% chitosan and 1.0 v% cellulose. Afterward, the smallest solutions were mechanically stirred, poured onto Petri dishes, and finally dried in an oven at 40 °C. A basic solution was utilized to remove the films from the petri-dishes, and again the films were left to be dried.

2.2.2. Fabrication of Bio-Ferroelectric Composites

As stated in our previous publication, the high density of STO (i.e., 5.118 g/cm3, which is three times the density of the polymeric solution), represents a challenge to fabricate the composites [8] by curbing the nanoparticles dispersion in the film. To prevent this, we opted to prepare layered composites via solution casting. Accordingly, each layered composite consisted of a chitosan-cellulose layer followed by a chitosan-cellulose layer containing the STO nanoparticles.
The stock solutions of chitosan (dissolved in a water/acetic acid solution) and 0.5 v% cellulose (dissolved in an NMMO solvent) formed the first layer. The nanoparticles levels selected, i.e., 10 wt. % and 20 wt. %, were dispersed at this stage. For the second layer, we readied additional solutions of chitosan with two level of cellulose: 15 v% and 25 v%. Hereafter, the solutions were transferred above the first chitosan-cellulose polymeric layer (containing the nanoparticles) and dried at 40 °C.

2.3. Characterization

As aforementioned, because of their potential use in aggressive environments, the characterization of our composites encompassed structure, mechanical, and thermal tests. The ensuing sections discuss the details of the techniques used.

2.3.1. Structure Analysis

Fourier transform infrared spectroscopy (FTIR) allowed analyzing the structure of the samples. The FTIR unit emits light in the infrared region to study vibrations and rotations of the bonds present in the specimen. The energy provided by the FTIR is absorbed according to the bond’s frequency, permitting their identification. The FTIP apparatus operated at a range of 4000 cm−1 to 600 cm−1. For each run, the accumulation of scans was 200 at a resolution of 4 cm−1.

2.3.2. Thermal Analysis

A thermogravimetric analyzer (TGA), operated at a 5 °C/min temperature ramp from 25 °C to 500 °C with a nitrogen atmosphere revealed the degradation temperature (Tdeg) of the composites. The samples were placed on a weight scale, which recorded the mass loss of the samples as a function of temperature. To determine the degradation temperature of the composites, the first derivate of the mass loss vs. temperature curve was obtained by the TGA. After that, the Tdeg was defined as the minimum of that first derivate.

2.3.3. Tensile Test Analysis

A low force tensile testing machine permitted to assess the composites ultimate tensile strength. The deformation rate was set to 1 mm/min at room temperature (25 °C). For the dimensions of the samples, the ASTM D-1708 standard was used: 22 mm gauge length, 5 mm wide and 5 mm radius fillet.

2.3.4. Thermomechanical Analysis

A Mettler Toledo® thermomechanical analyzer (TMA) allowed acquiring the creep deformation of the composite materials as a function of time, as well as their glass transition temperatures (Tg). To this purpose, 10 mm long by 5 mm wide samples underwent a 5 °C/min temperature ramp from 25 °C to the desired experiment temperature in an air atmosphere. The applied force was set constant at 1.0 N for 3 h (duration of the creep test).

3. Results and Discussion

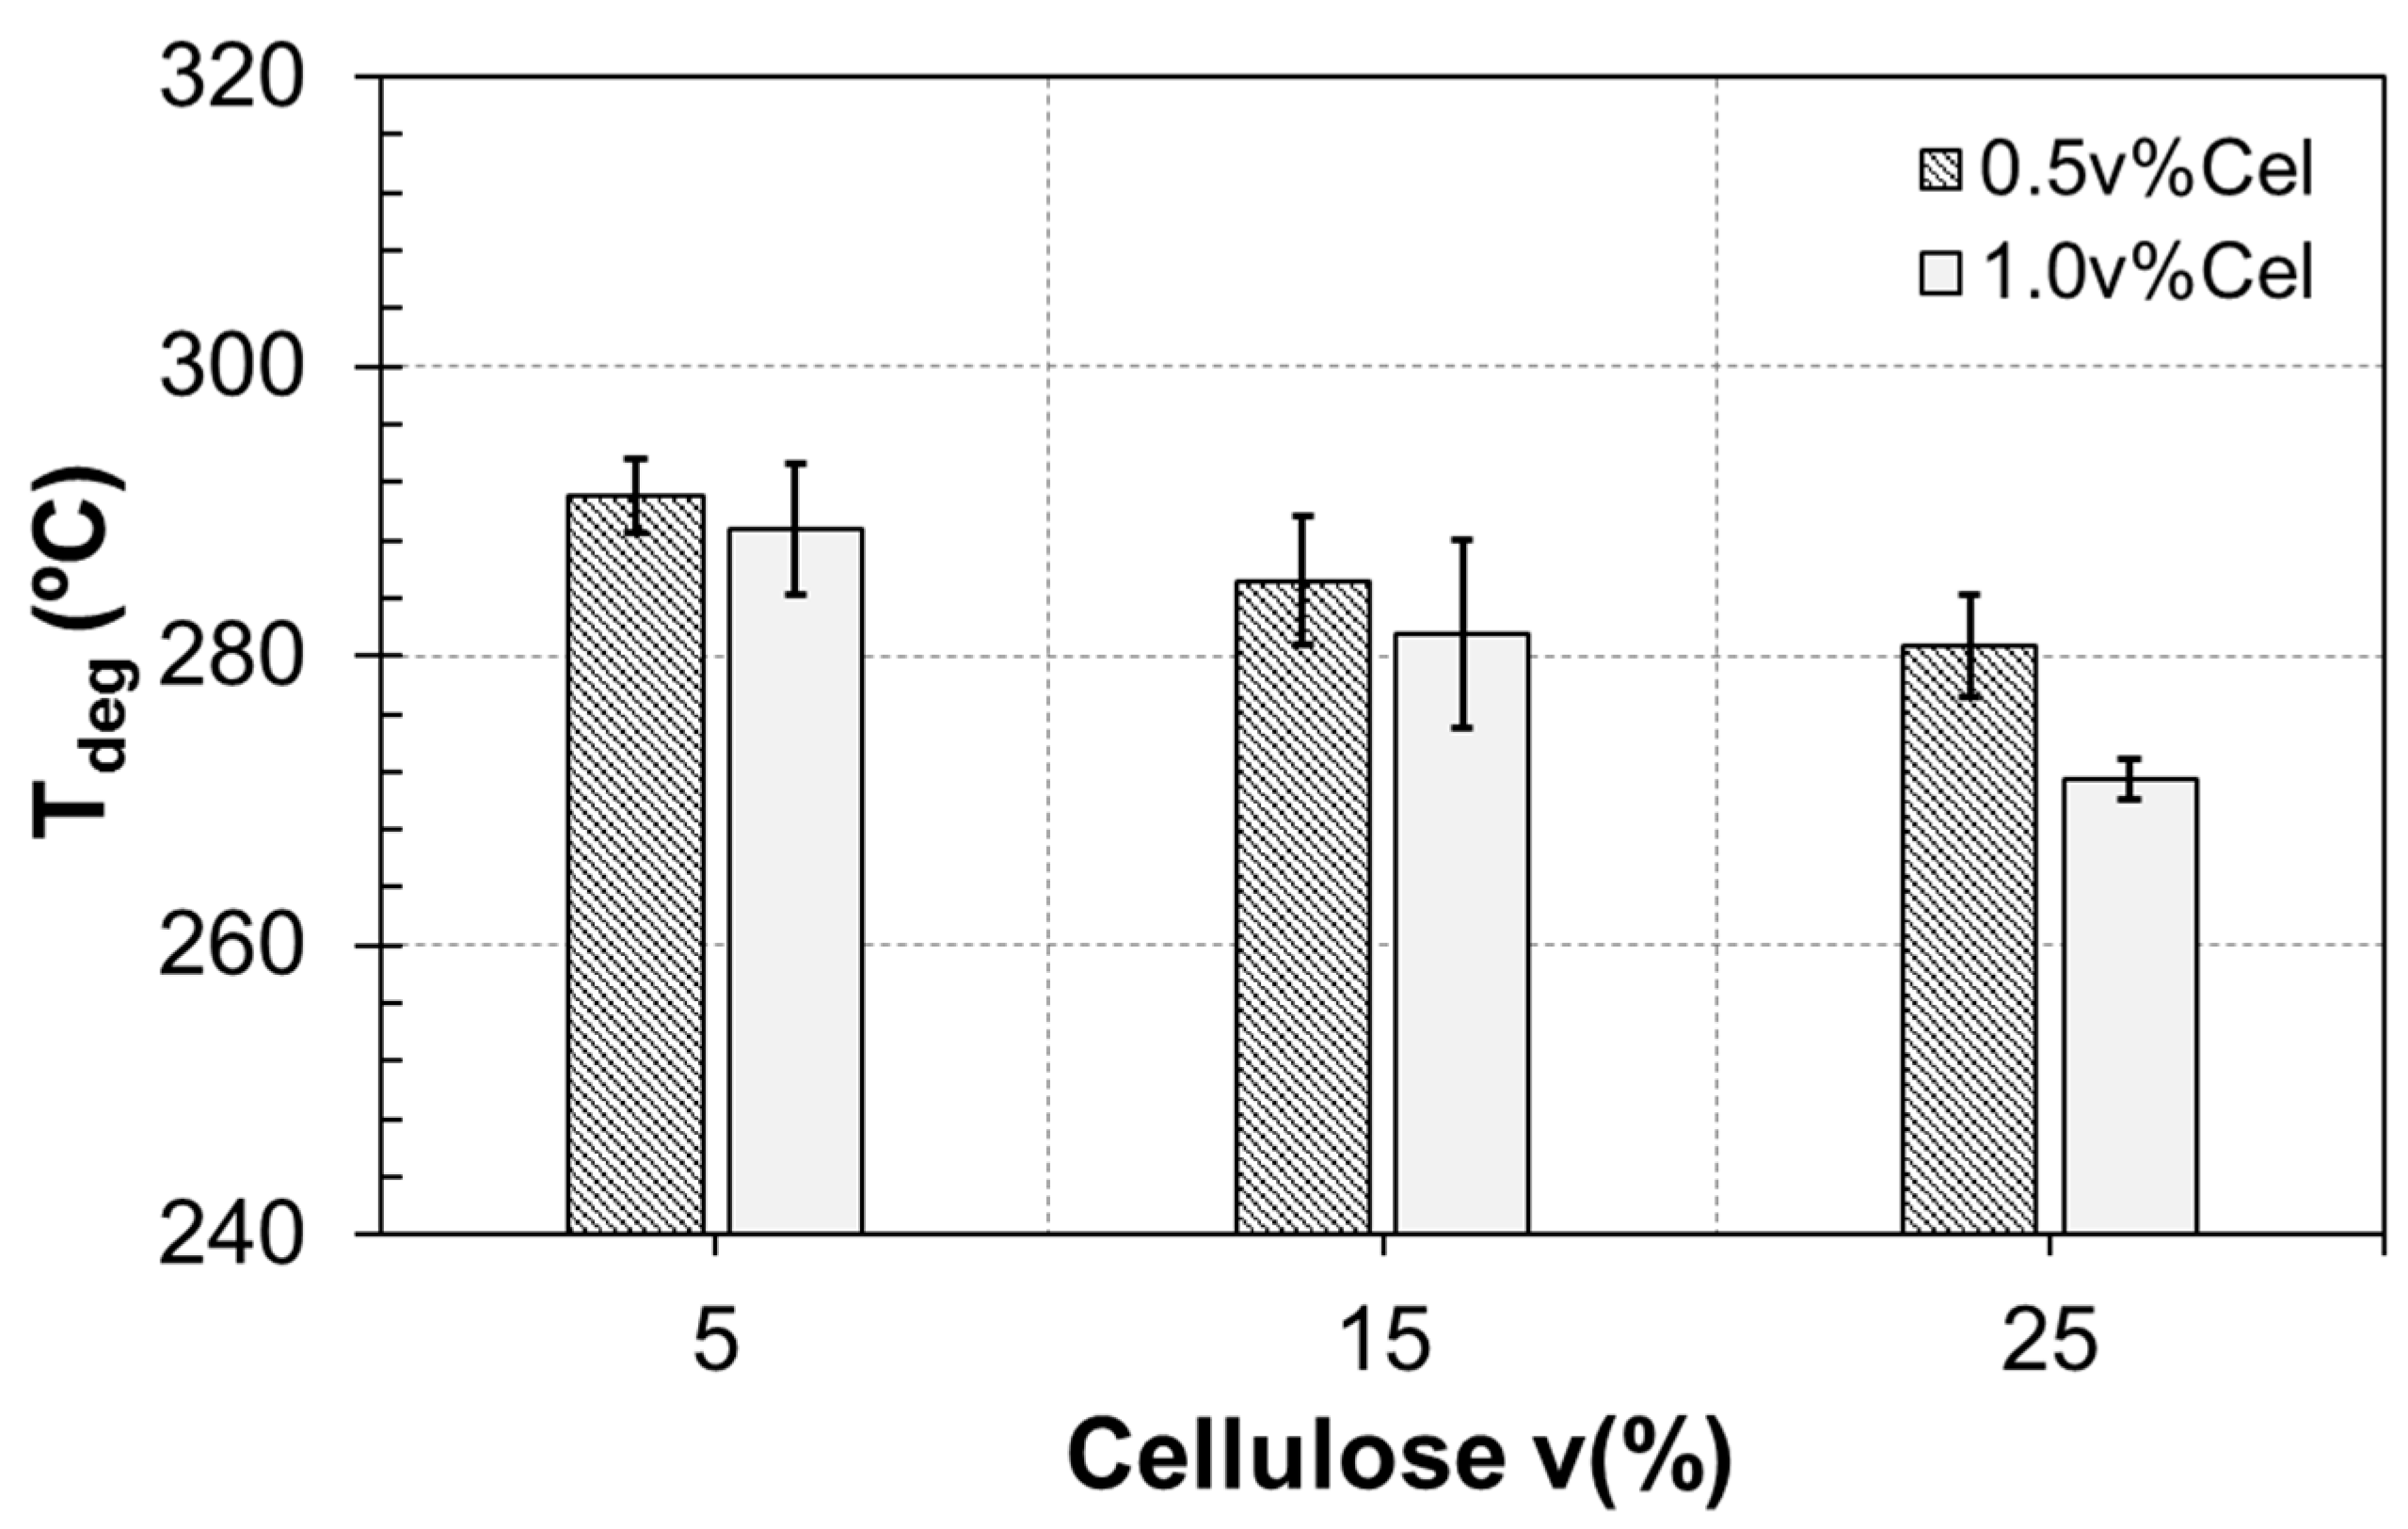
3.1. Thermogravimetric Analysis

Figure 1 suggests that higher cellulose concentrations lowered the degradation temperature of the bio-composites made of chitosan and cellulose. This detrimental effect on the Tdeg is due to the water content, which depends on the chitosan dissolution in the water/acetic acid medium and the addition of cellulose. Cellulose possesses three hydroxyl groups, which interact with the water molecules. This interaction raises the water content in the polymeric matrix by two possible means: (a) bonding of water molecules to the (–OH) groups; or (b) confinement of water molecules between the polymer chains due to intermolecular hydrogen bonds [10,11]. To remove the water retained in the polymer films, higher temperatures are required in the drying process. However, one must keep in mind that the drying process (higher temperatures) can damage the chemical structure of the polymer chains.
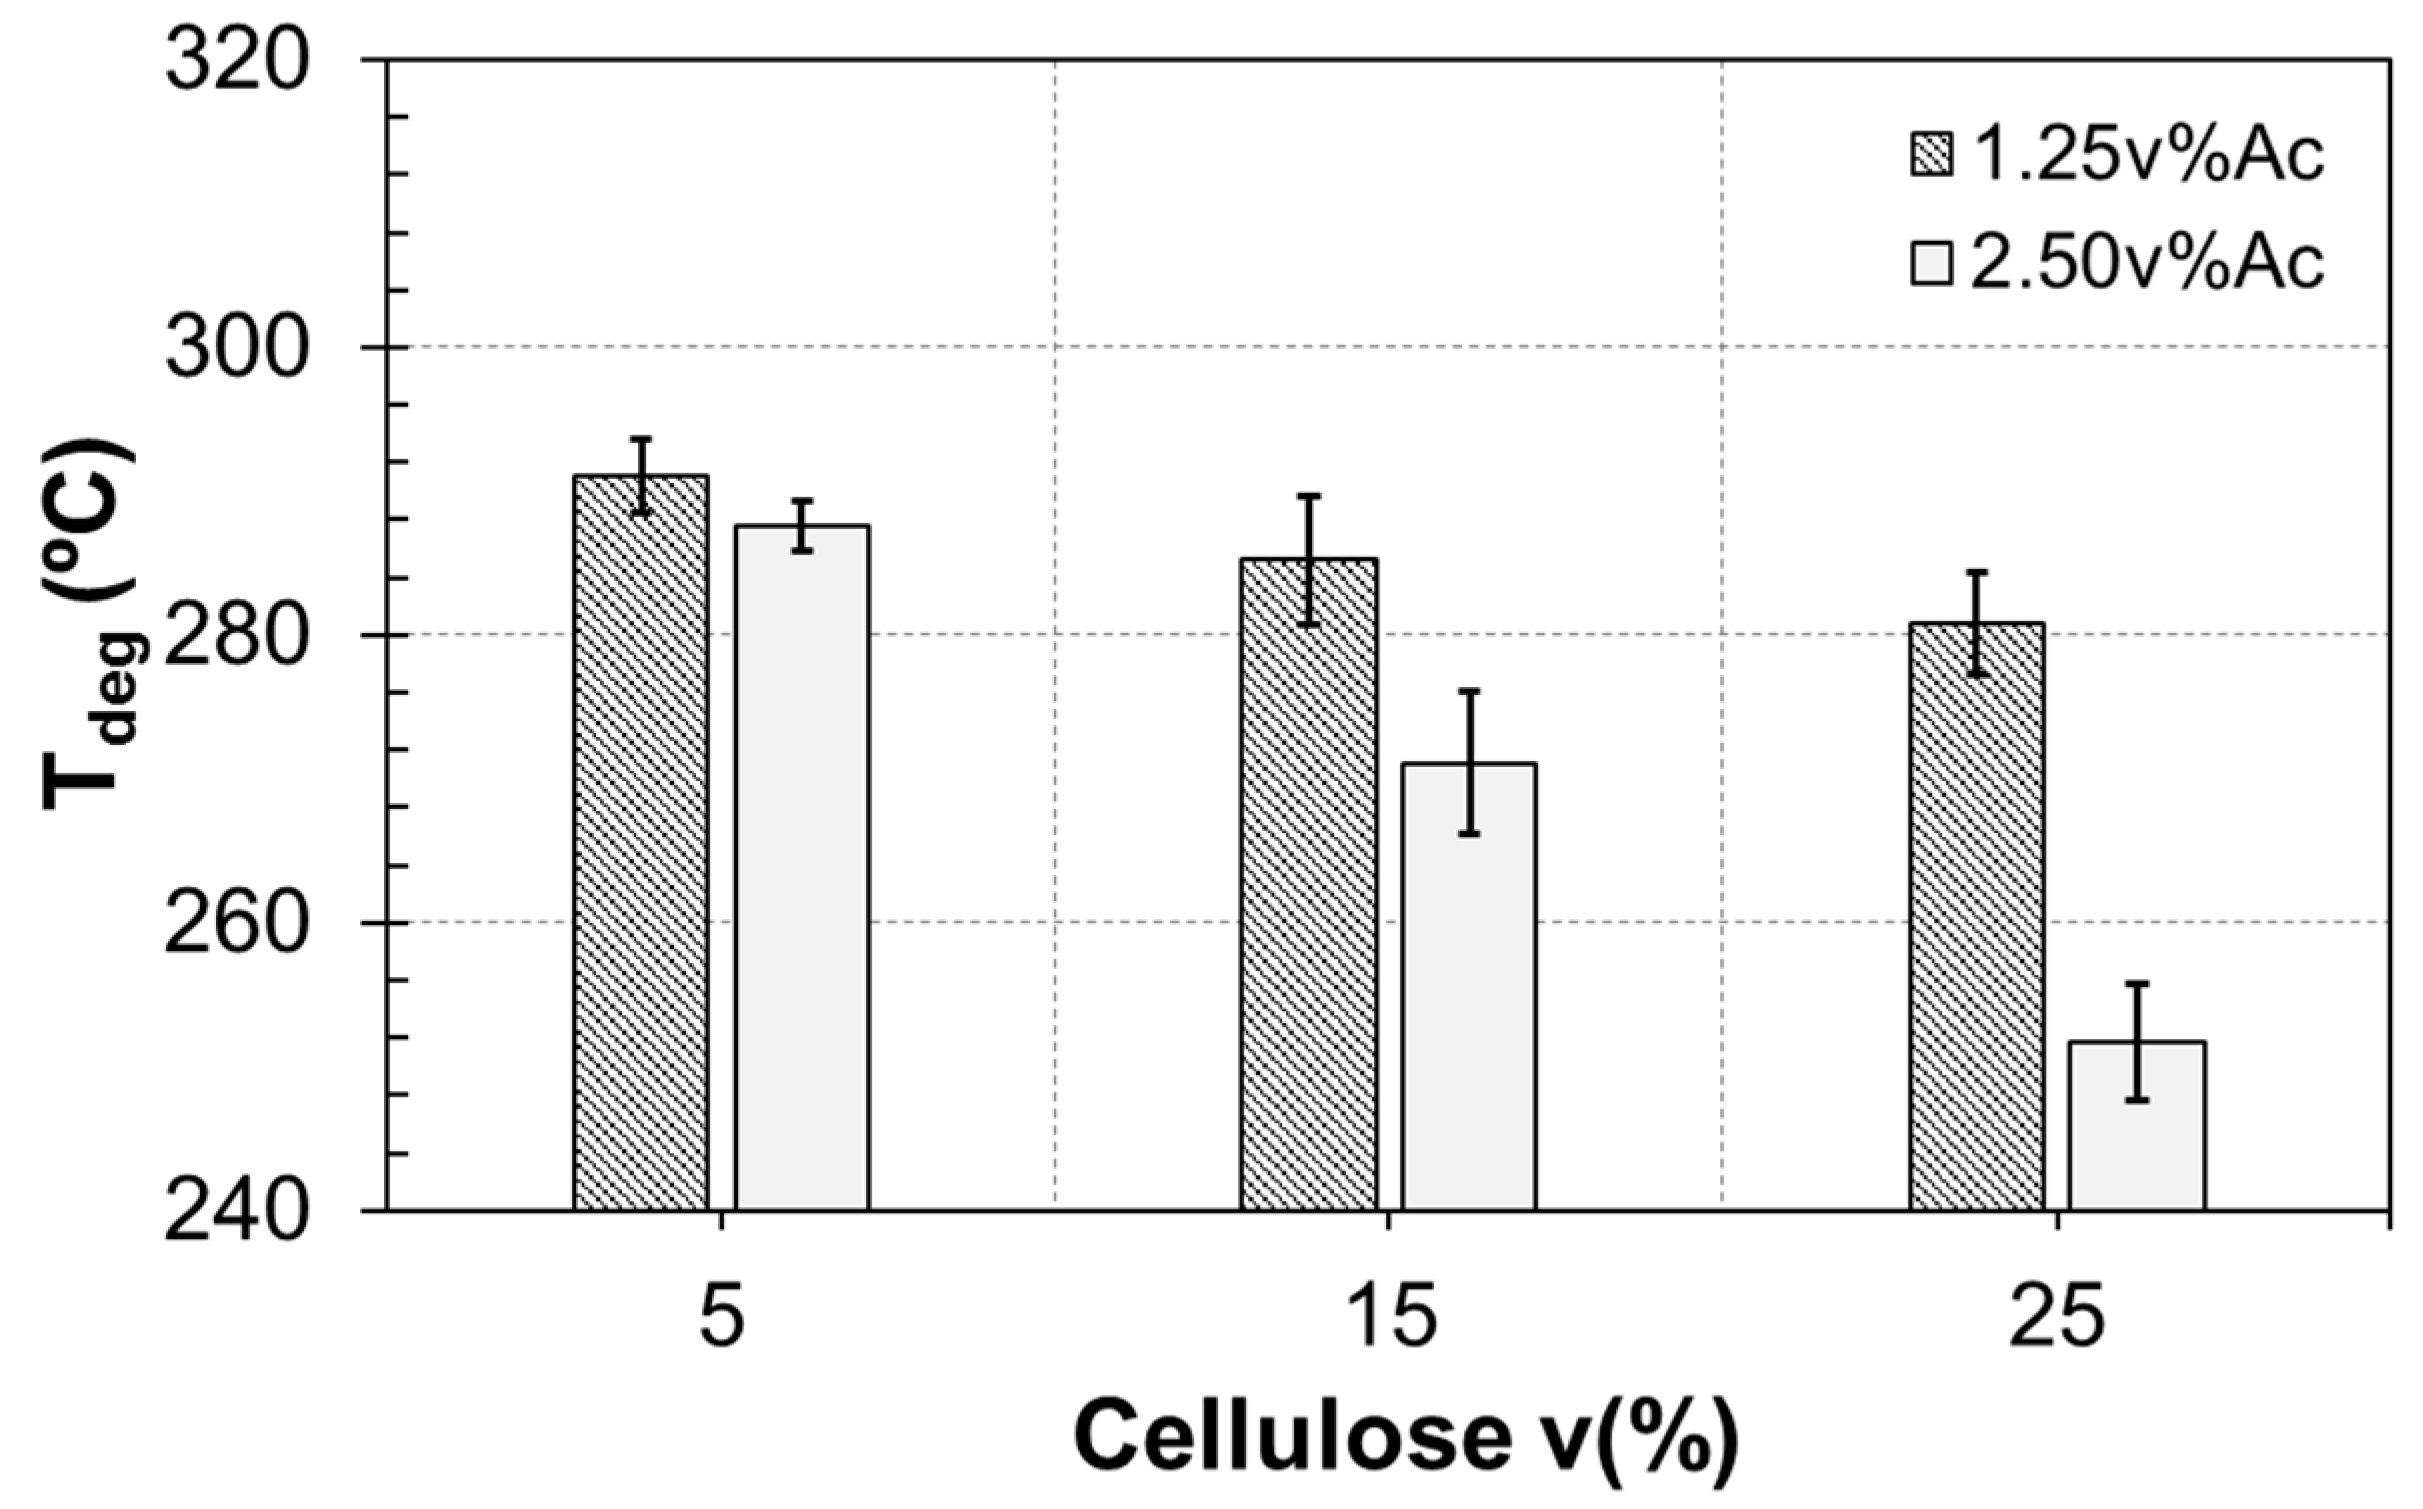
After studying the effects of the cellulose concentration, we analyzed the acetic acid concentration because previous findings reported that higher concentrations of acetic acid increased the water content in the polymeric films, which is required for the chitosan dissolution [3,12]. For that reason, we evaluated two acetic acid concentrations: 1.25 v% and 2.50 v%. The results indicate that cellulose lowered the degradation temperature of the bio-composites when more acetic acid was used in the synthesis. When we compared the acid concentration effect to each other, we observed lower Tdeg for higher concentrations, according to Figure 2. One must recall that, as the water content increased, the swelling degree of the composites also increased, following Hosokawa et al. [3].
The swelling degree of the composites is directly affected by the crosslinking between chitosan and cellulose, which originates from the Schiff base reaction [3,12]. In the said base reaction, the hydrogen ions of the primary amino groups chitosan (–NH2) interact with the aldehyde groups (–COH) of the cellulose leading the formation of (–CH=N–) groups at a pH of 6.0 [3,12,13]. In other words, at this pH level, partial deprotonation of the anime groups occurs. When the pH falls below 6, the anime groups (–NH2) exist in the protonated form (NH+); increasing the electrostatic repulsion between the polymer chains. Higher electrostatic repulsions allow the entry of more water molecules between polymer chains. Thus, the swelling degree increases, resulting in a lower cross-linking degree of the polymer chains.
Even though the addition of STO nanoparticles slightly increased the composites Tdeg, larger amounts of nanoparticles lowered considerably that Tdeg, when one compares the 0 wt. % and 20 wt. % samples. For low nanoparticle amounts, the interfacial polymer-nanoparticles adhesion dominates [6,14]. Furthermore, the nanoparticles agglomerates can affect the composites Tdeg by cutting down the interaction between the nanoparticles and the polymer matrix. Additionally, the nanoparticles could have increased the porosity in the polymeric matrix, eventually affecting the bulk mechanical properties [14].

3.2. Tensile Test Analysis

Figure 3 reveals that higher concentrations of cellulose are detrimental to the composites ultimate tensile strength (UTS). This strength decreased 3.5 MPa as the amount of cellulose raised from 5 v% to 25 v%. Additionally, we found that more acetic acid (1.25 v% and 2.50 v%) led to weaker composites (Figure 4). The UTS diminished as the volume percentage of cellulose increased from 5 v% to 25 v%, as in Figure 3. After comparing the acetic acid concentrations, we observed a reduction of 7 MPa. As stated in the previous section, higher amounts of cellulose and acetic acid augment the water content in the polymer films.
As mentioned in the previous section, the cellulose addition and STO nanoparticles slightly augmented the pH values, which favors the interaction between chitosan and cellulose. Thus, the resulting water content in the polymeric films became smaller. However, the increase in pH is not enough to improve the UTS values of the STO-reinforced composites because more nanoparticles lessened the polymer-nanoparticles interfacial energy causing cracks through the nanoparticles, according to the literature [6].

3.3. Degradation Analysis

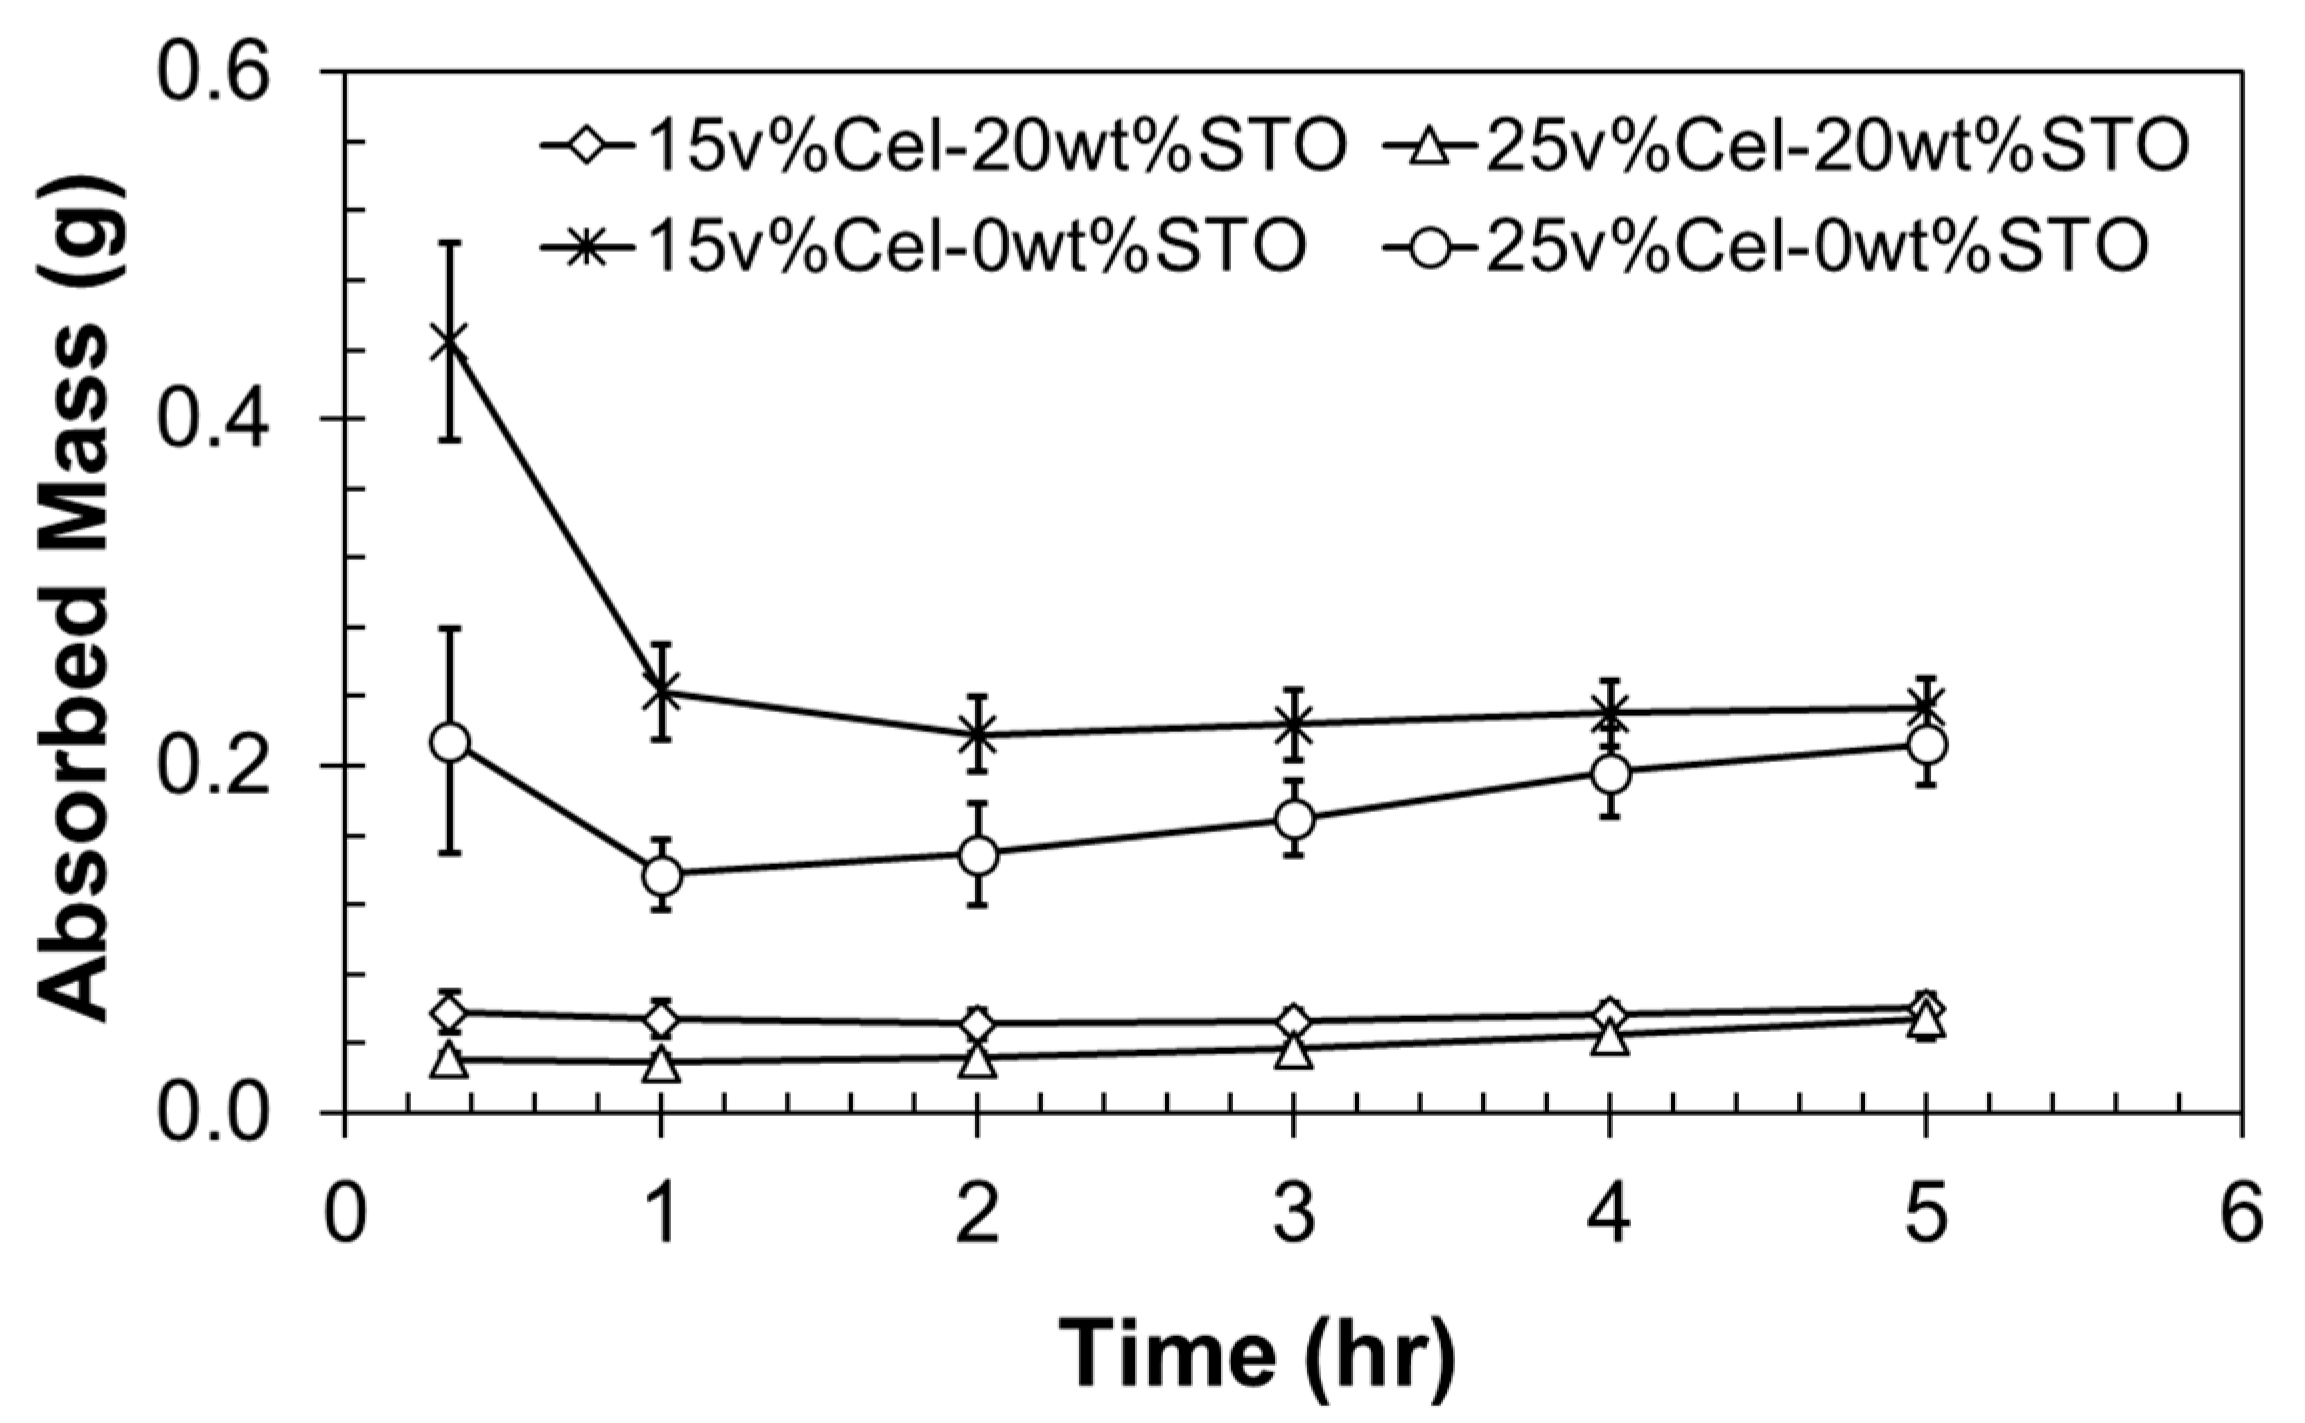
As an ancillary investigation, the composites underwent a simplified degradation protocol in three media: a strongly acidic HCl solution, a less acidic CH3COOH one, and deionized water. To this purpose, we prepare the media with the acids and deionized water to attain a given pH in Petri dishes: hydrochloric acid (pH 3.3), acetic acid (pH 4.1), and water (pH 6.5). The pH value of the deionized water is not 7.0 due to the removal of minerals. Then, we submerged the composites in the corresponding media for a given time, which was recorded to assess the progression of the material weight loss.
Figure 5, Figure 6 and 
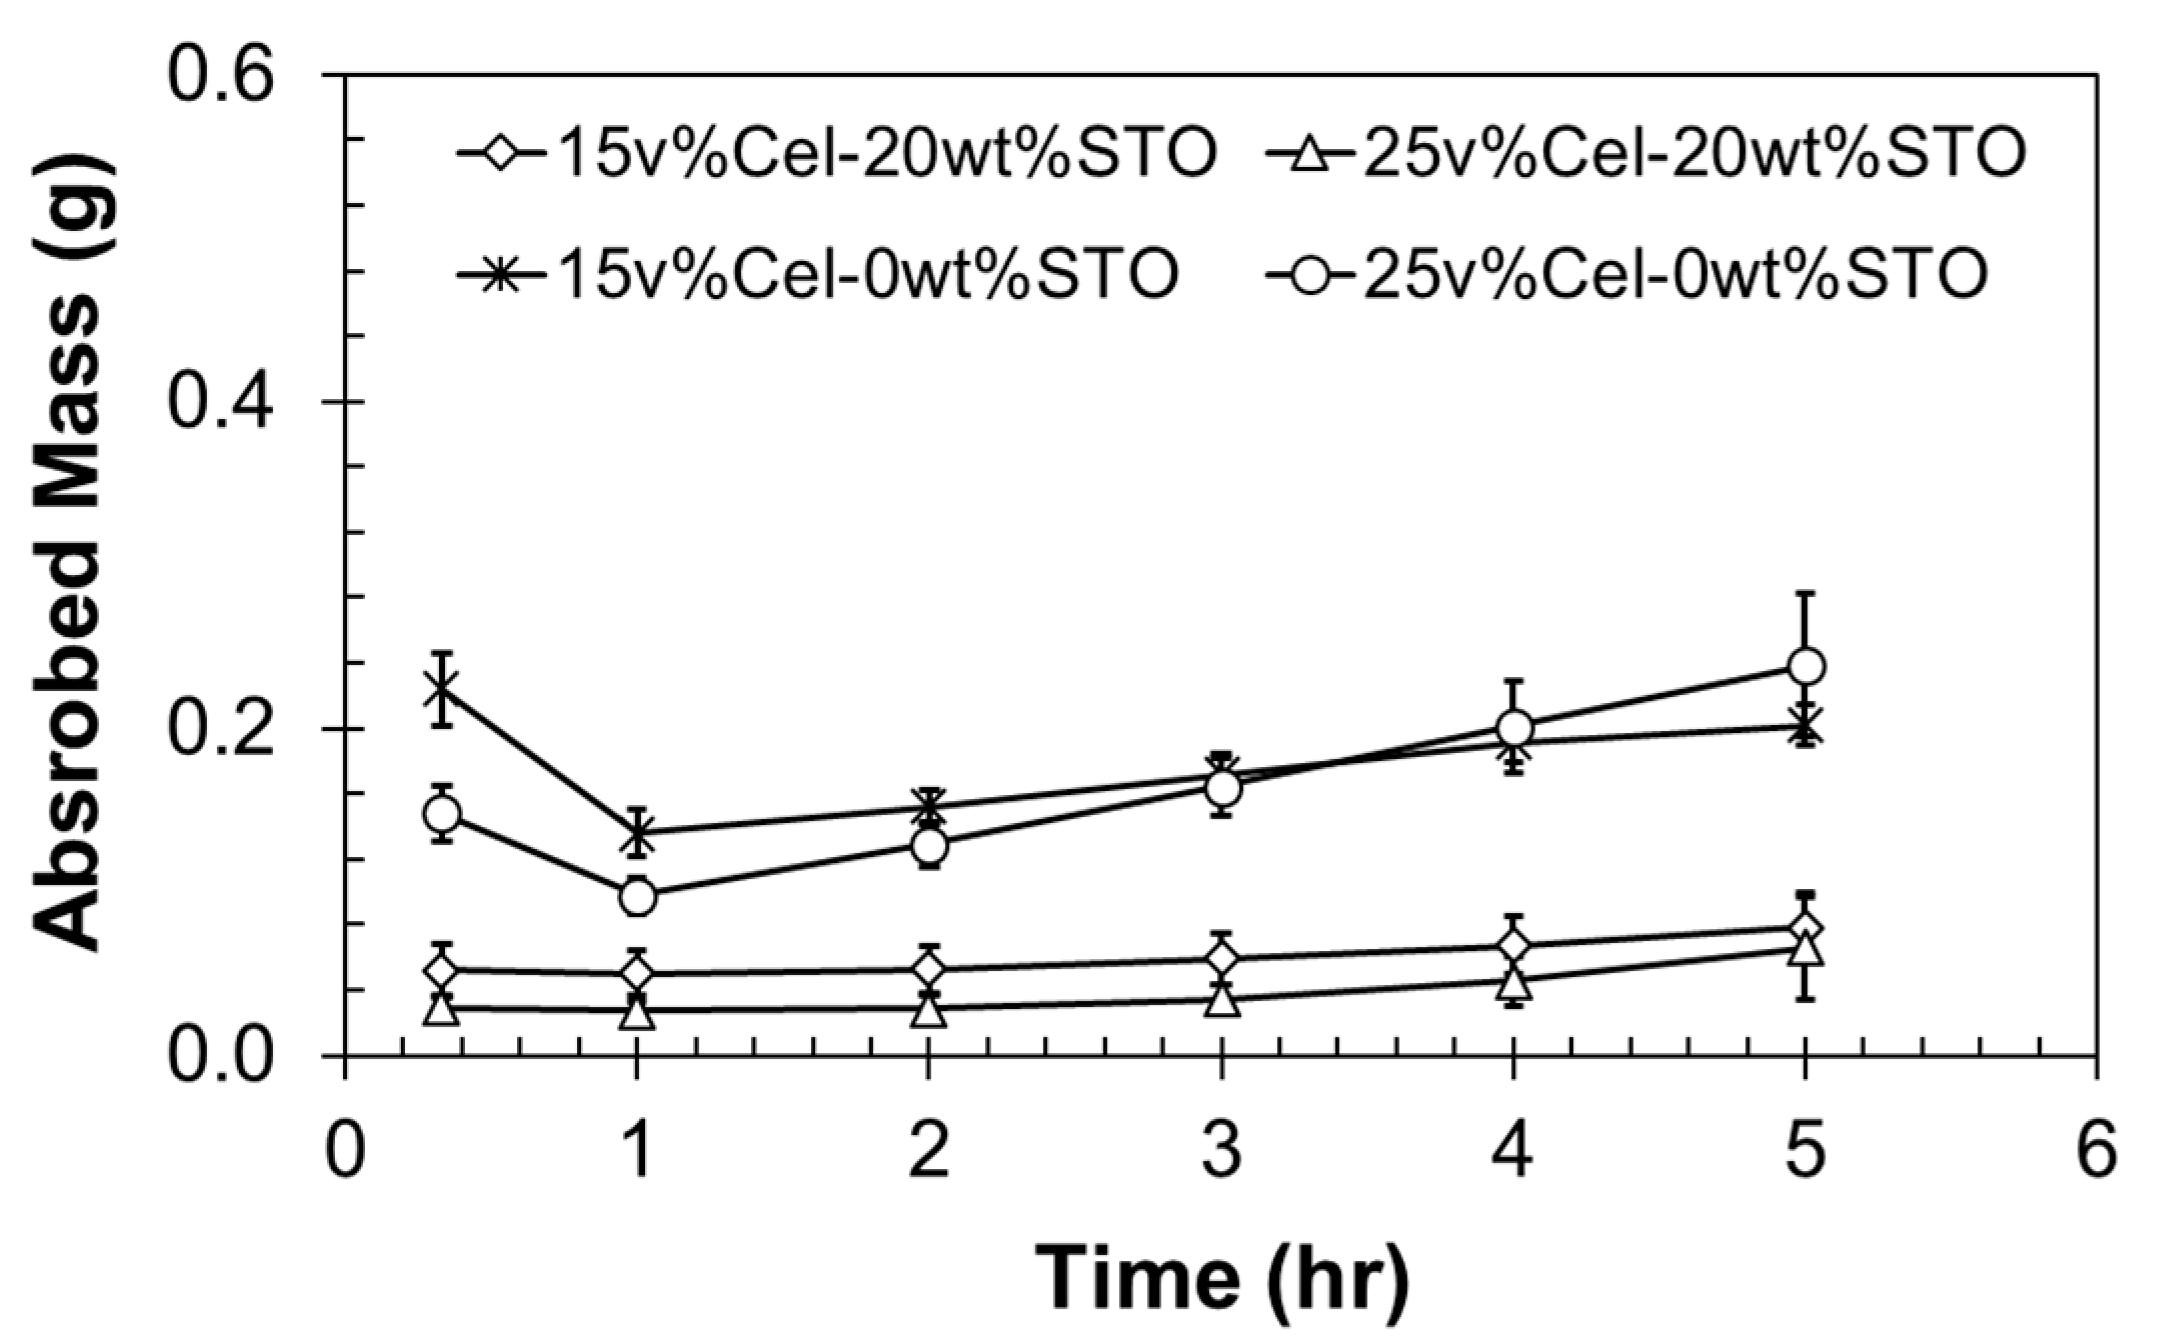
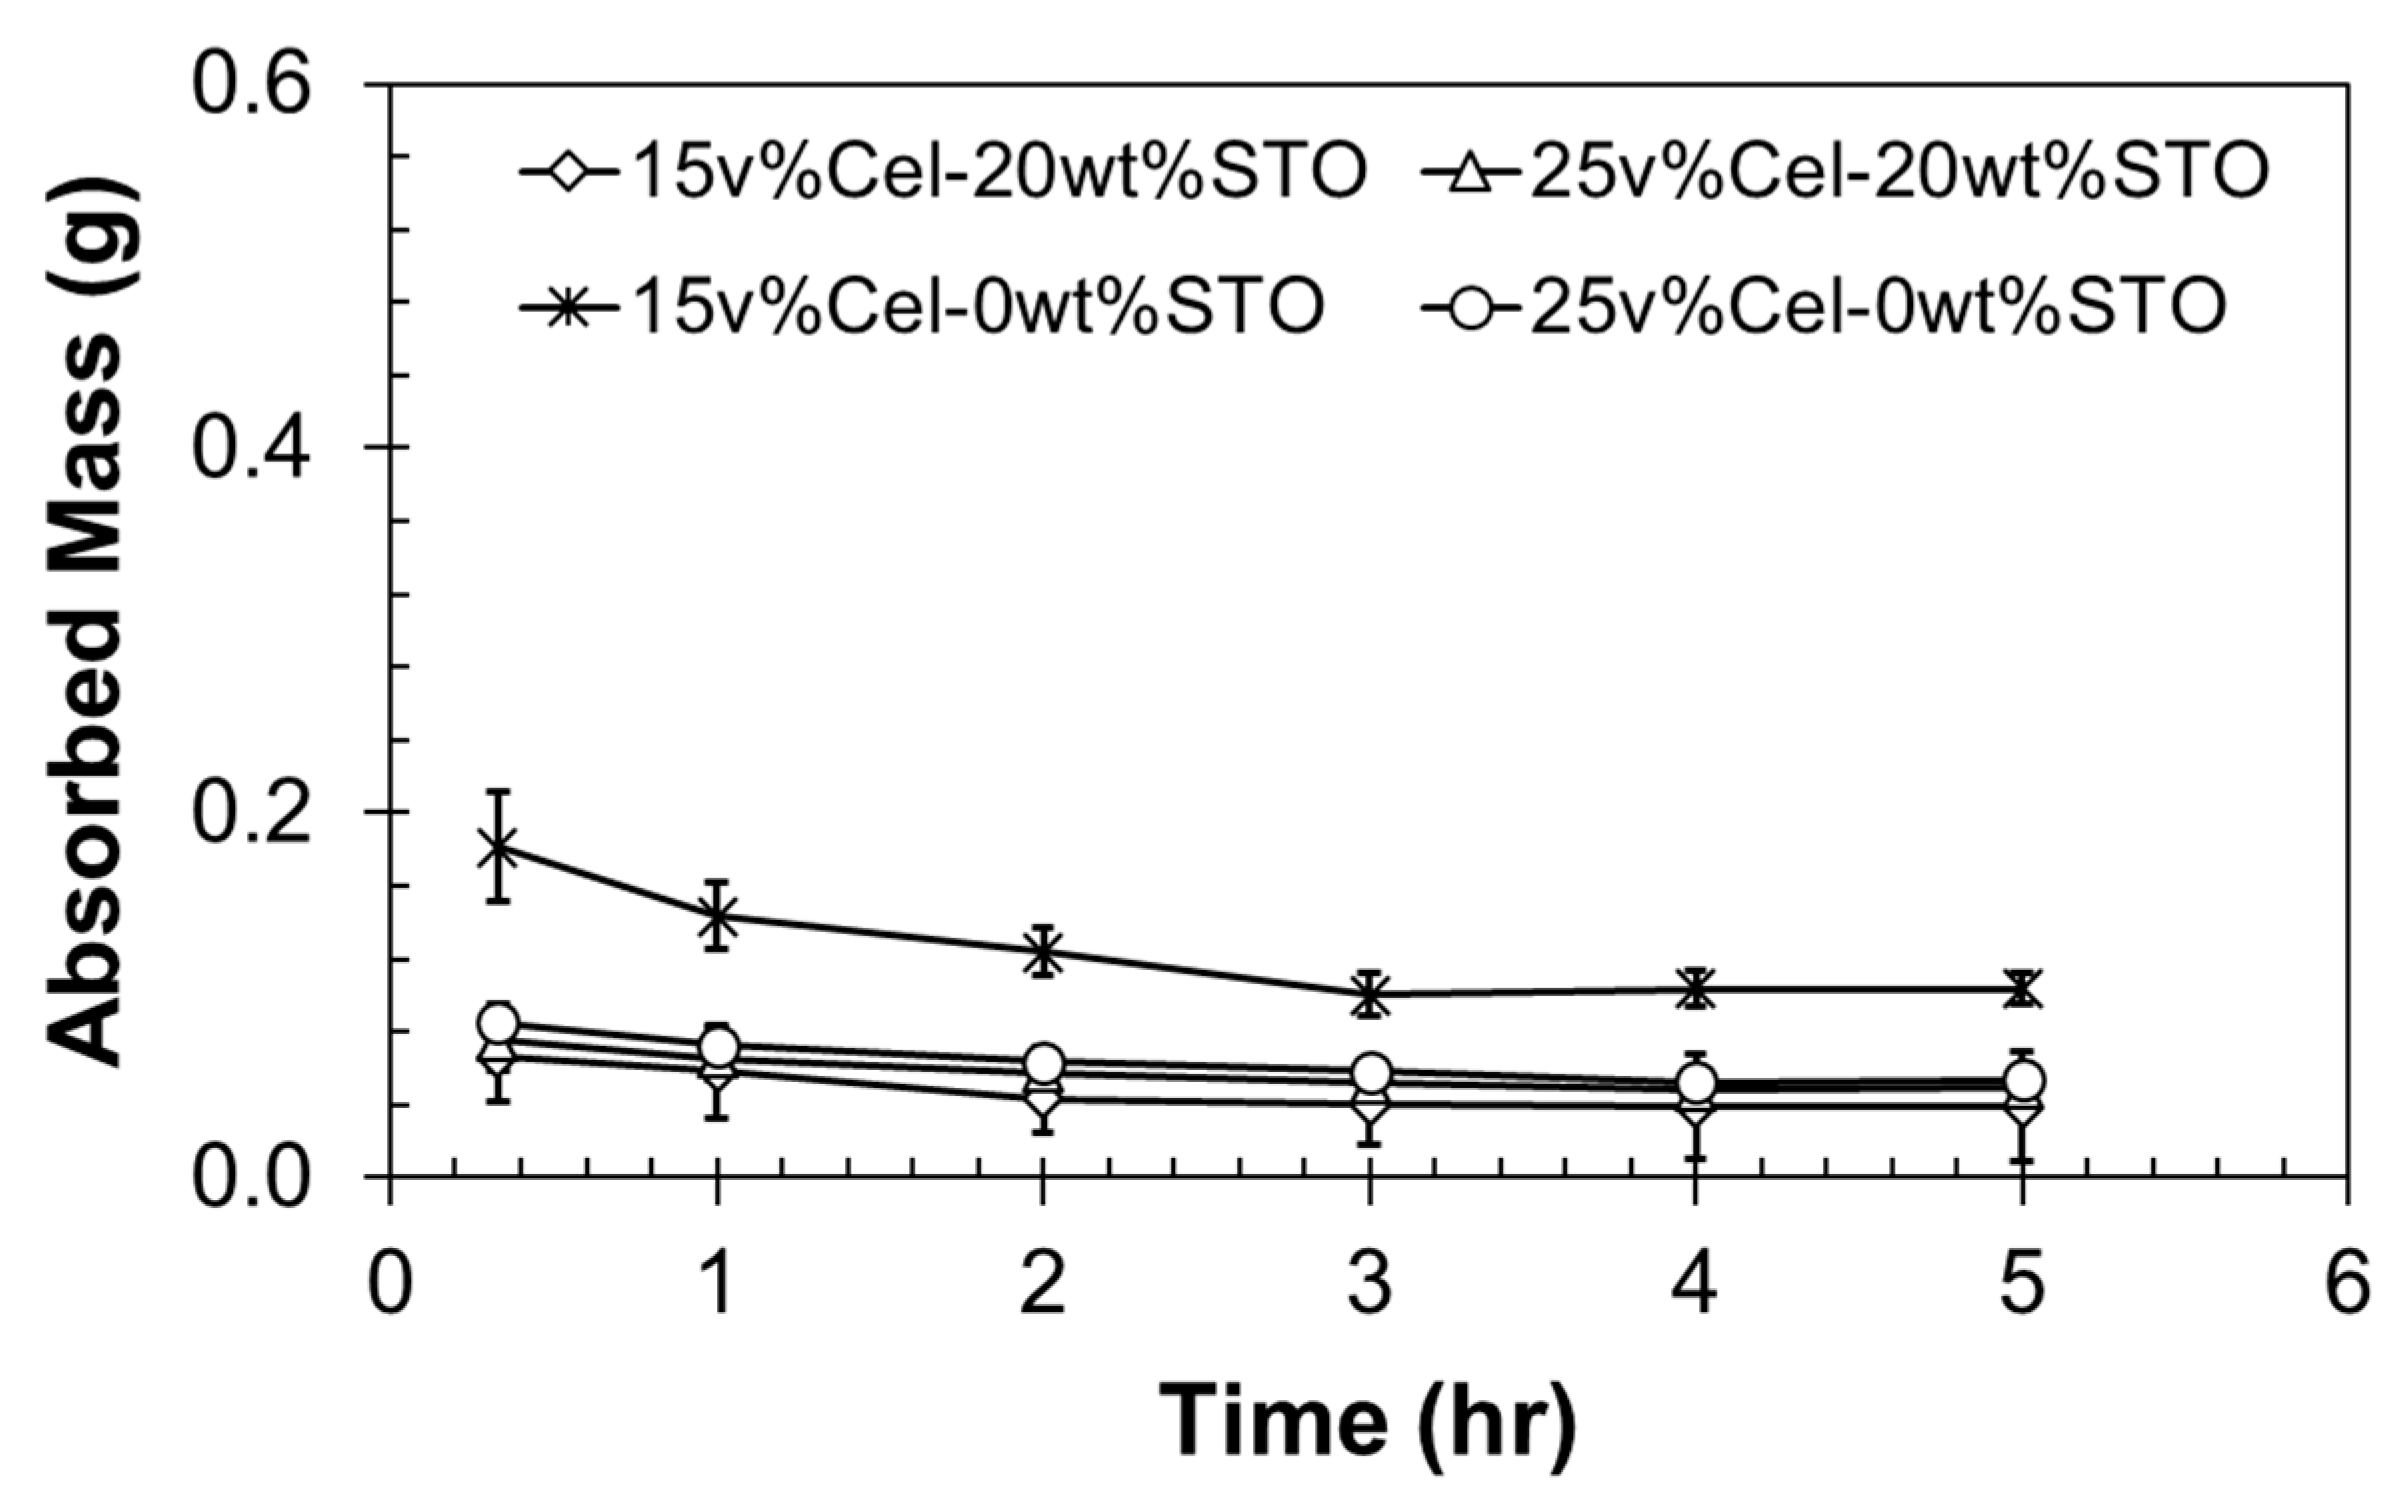
Figure 7 present the absorbed mass of the polymer-STO composites as a function of time in hydrochloric acid, acetic acid, and water, respectively. The combined addition of cellulose and nanoparticles delayed the degradation of the polymeric films, which is also affected by the solution utilized. For hydrochloric acid, the absorbed mass ranged from 0.02 g to 0.45 g while for acetic acid this falls between 0.02 g and 0.23 g, and for water, 0.04 g to 0.18 g. These figures also revealed an exciting behavior: after we placed the composite in the solution, the absorbed mass increased rapidly for 0.33 h. After this time, the absorbed mass lowered to eventually increase for times longer than 2 h. The bio-composites degraded fast in hydrochloric acid solution compared to acetic acid solution and, naturally, water.
Naturally, HCl is considered a strong acid compared to CH3COOH. Stronger acids dissociate entirely into its ions as the weak acids partially do the same. Thus, the complete dissociation of the strong acids increased the protonation of the amine groups of the chitosan. As stated before, at pH values below 6.0, the amine groups (–NH2) are protonated, forming (NH+) groups [3,12,13]. These groups raise the negative charges, increasing the electrostatic repulsion between the polymer chains and more water molecules relocate between the chains. 
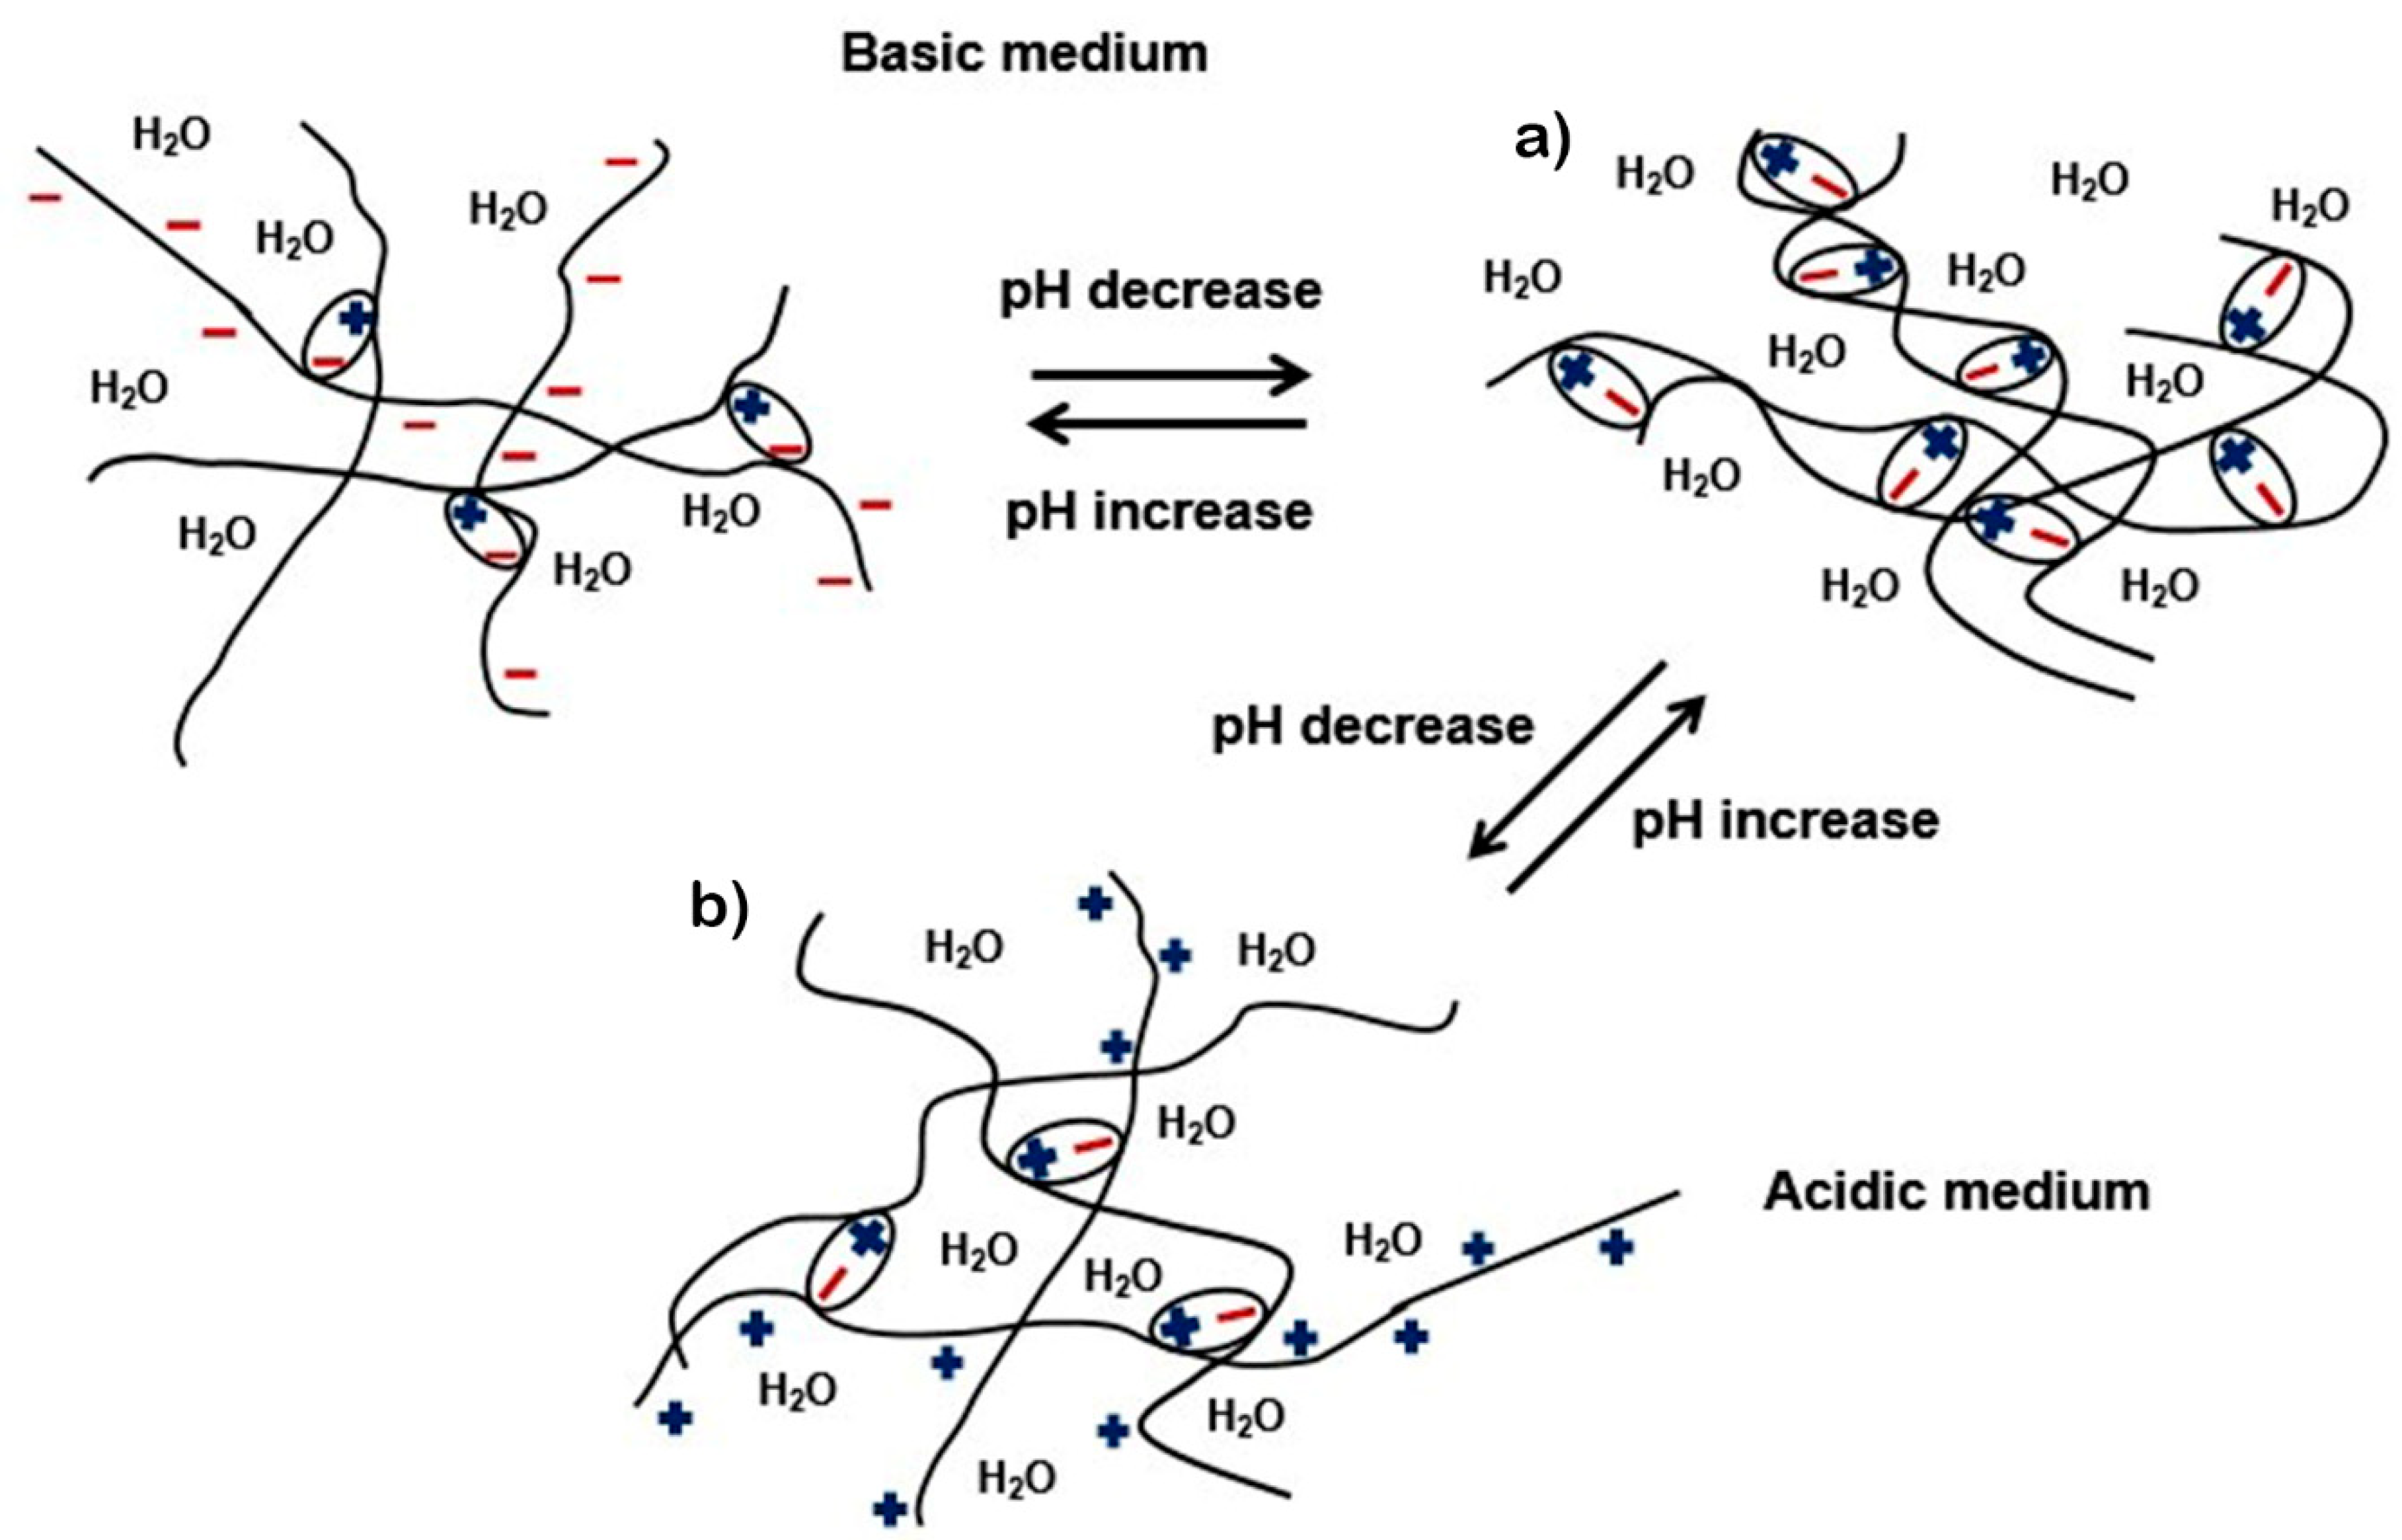
Figure 8 provides a schematic of this mechanism.
Also, the reaction reached the maximum protonation at 0.33 h, eventually decreasing due to pH changes from acid level to basic level. As a result, the swelling of the bio-composites decreased. This reversible reaction is dramatically affected by the pH of the solution.
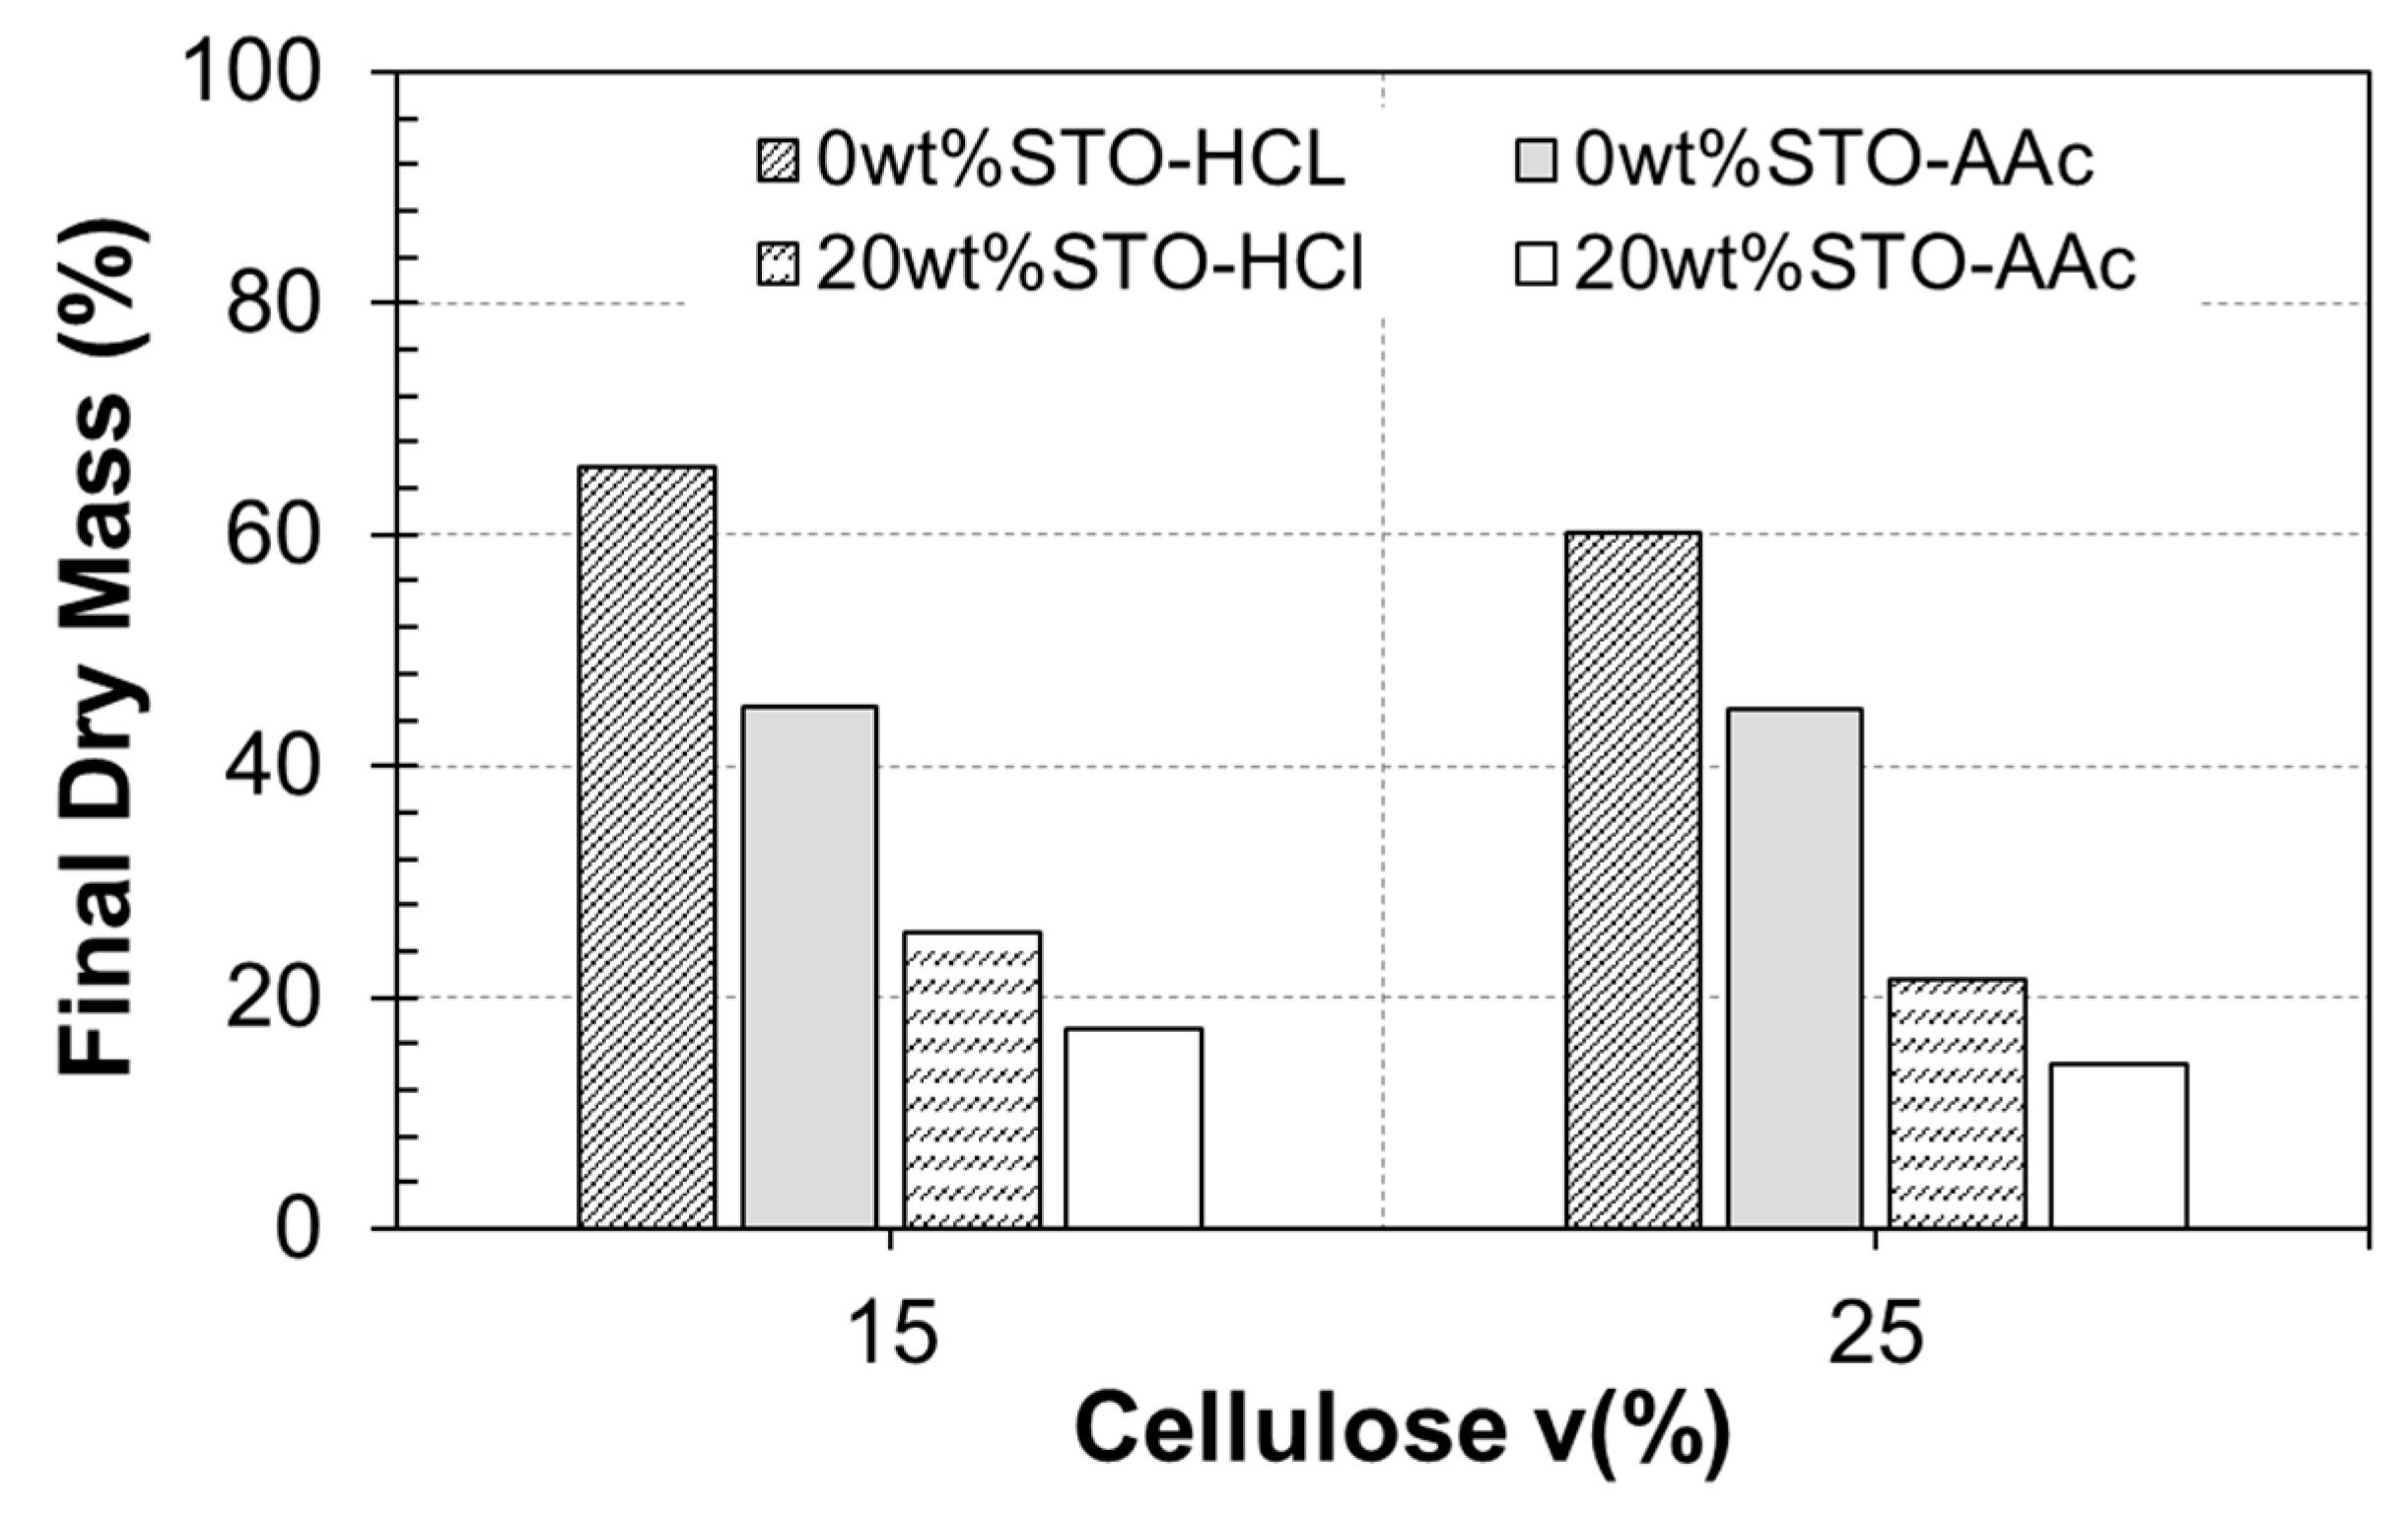
Figure 9 provides the dry mass percent after degradation. As expected, the addition of cellulose and STO nanoparticles lowered the composites Tdeg. When the effects of HCl and CH3COOH were compared, our results indicated, as expected, that the polymer degraded faster in the stronger acid.
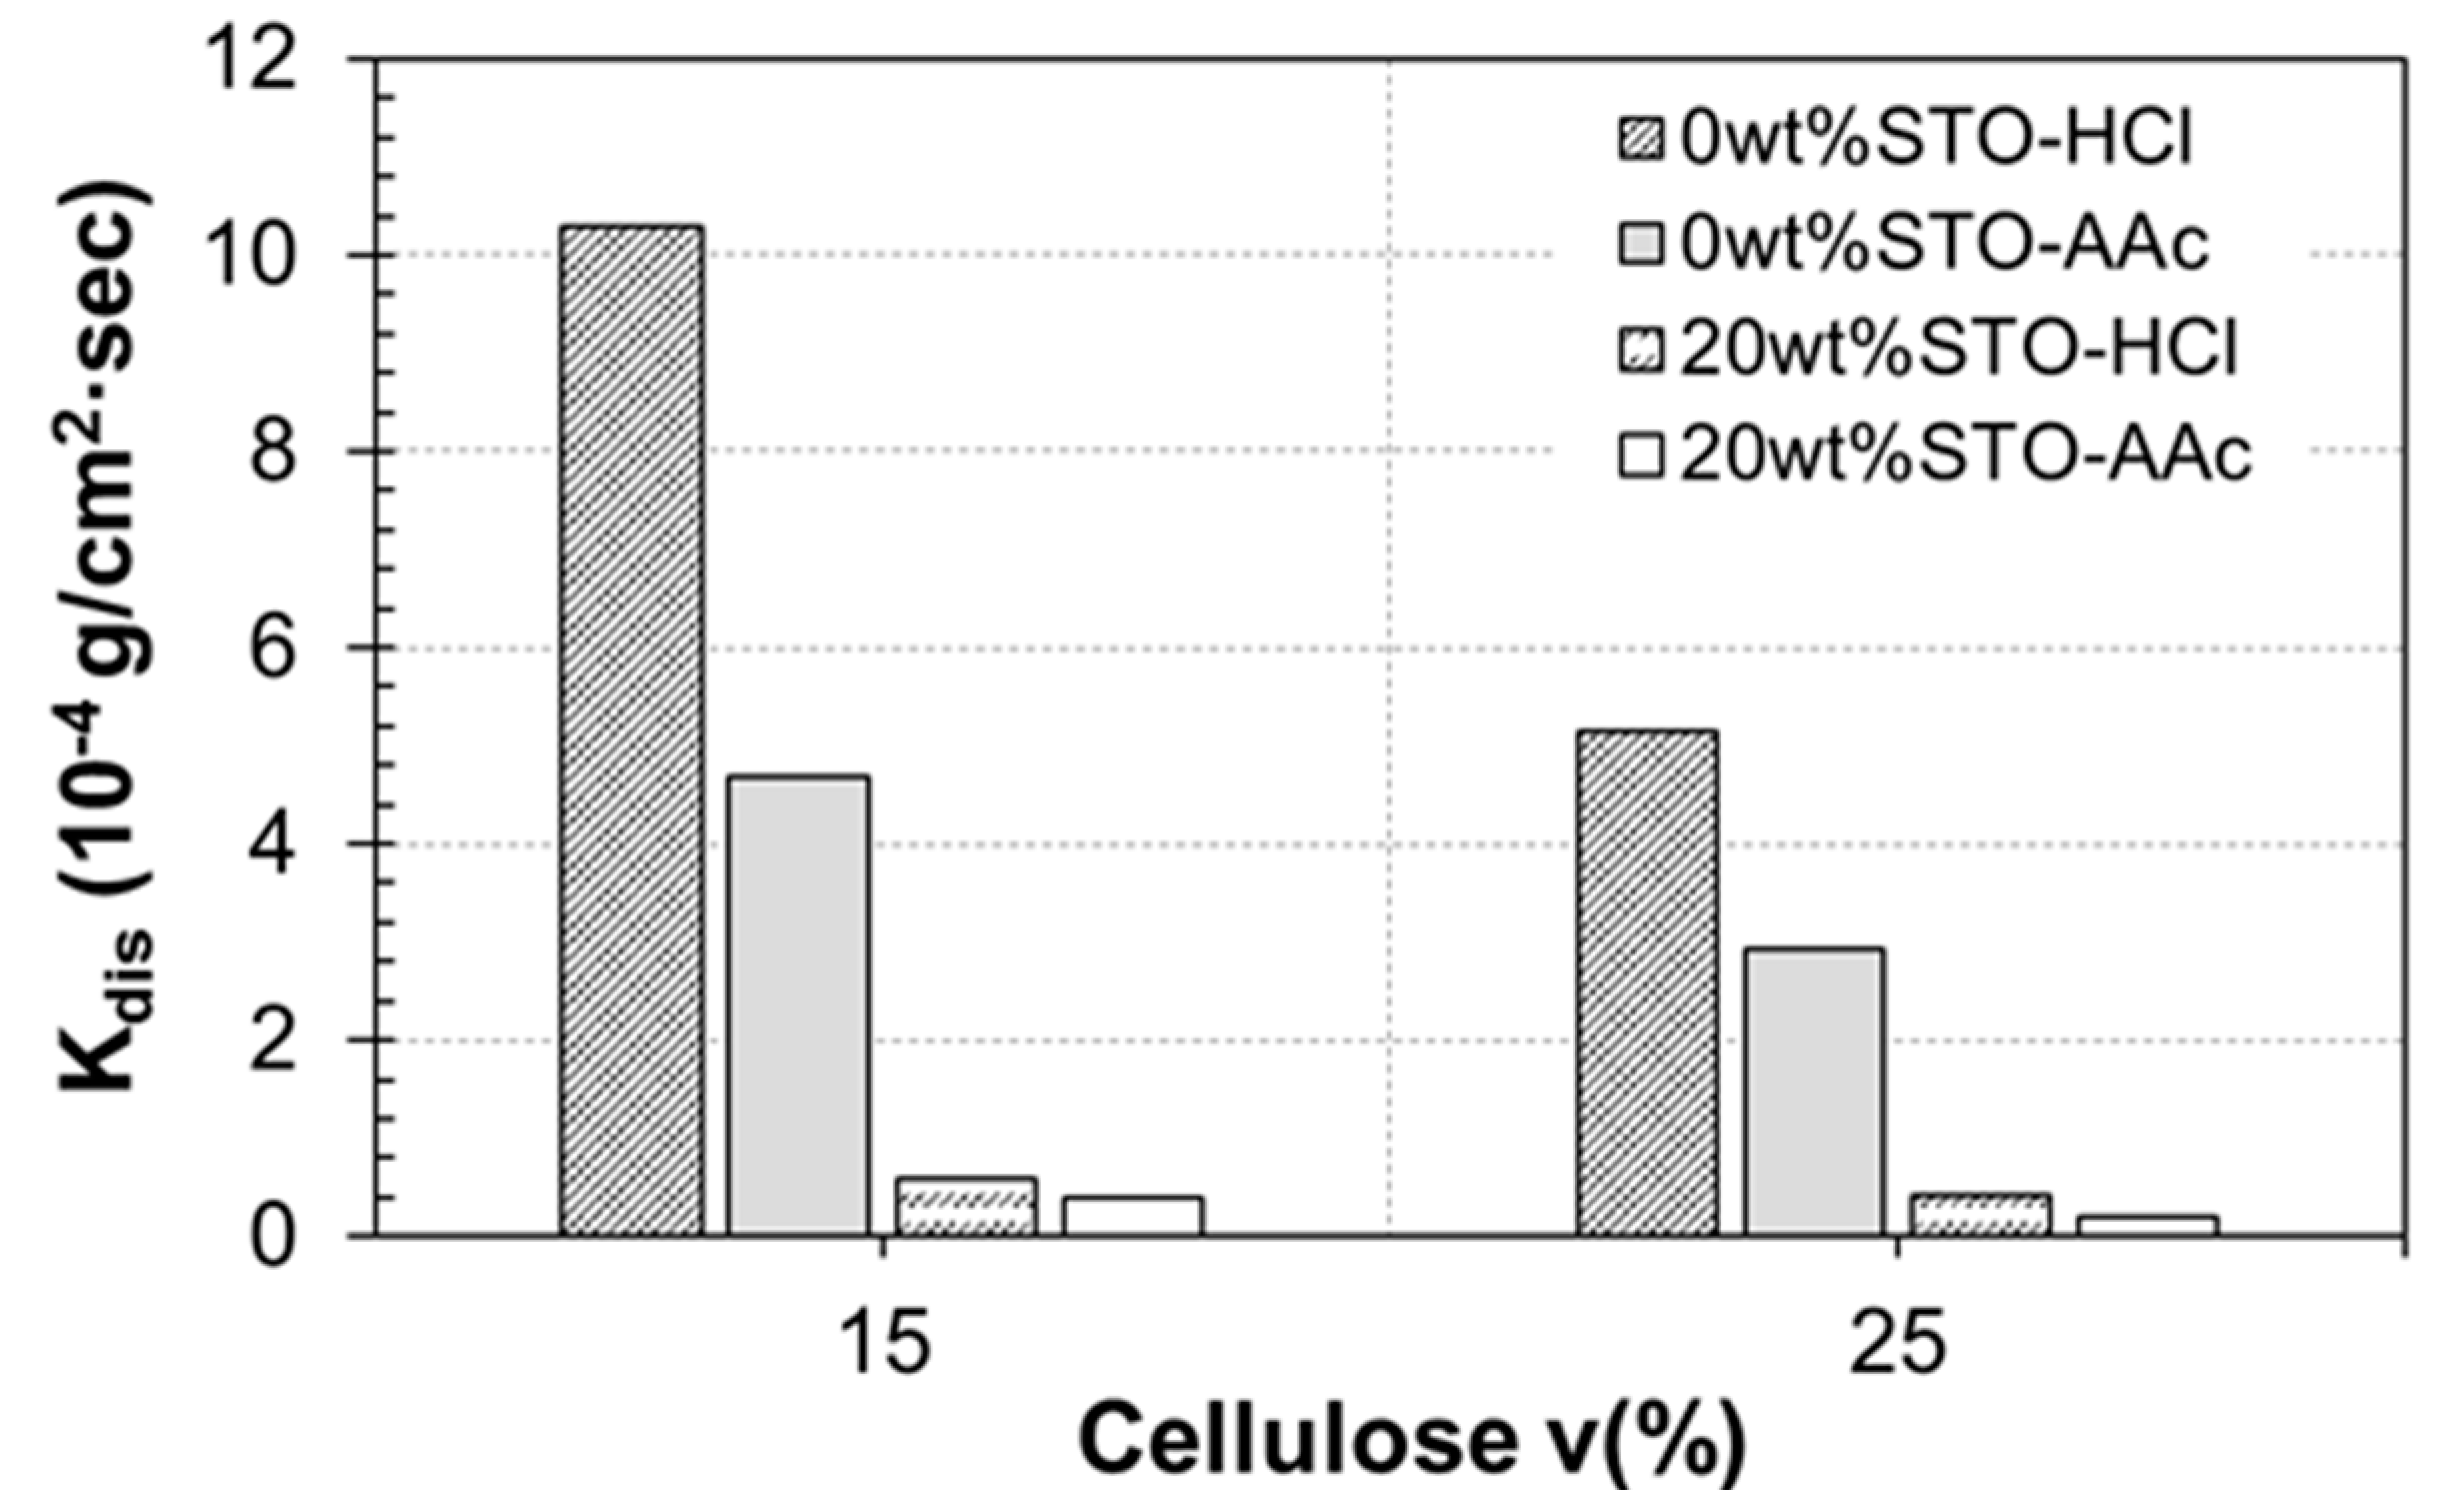
Subsequently, the dissolution rate constant (kdis) was obtained using Equation (1) and shown in Figure 10 [16].
Mpt = Mp0 − kdis × At × t
In Equation (1), Mpt and Mp0 are defined as the dry mass at time t and time t = 0, respectively, while At represents the surface area of the specimen at time t. Clearly, kdis decreased at higher amounts of cellulose and STO nanoparticles. In addition, as mentioned earlier, HCl caused the nanocomposites to degrade faster.
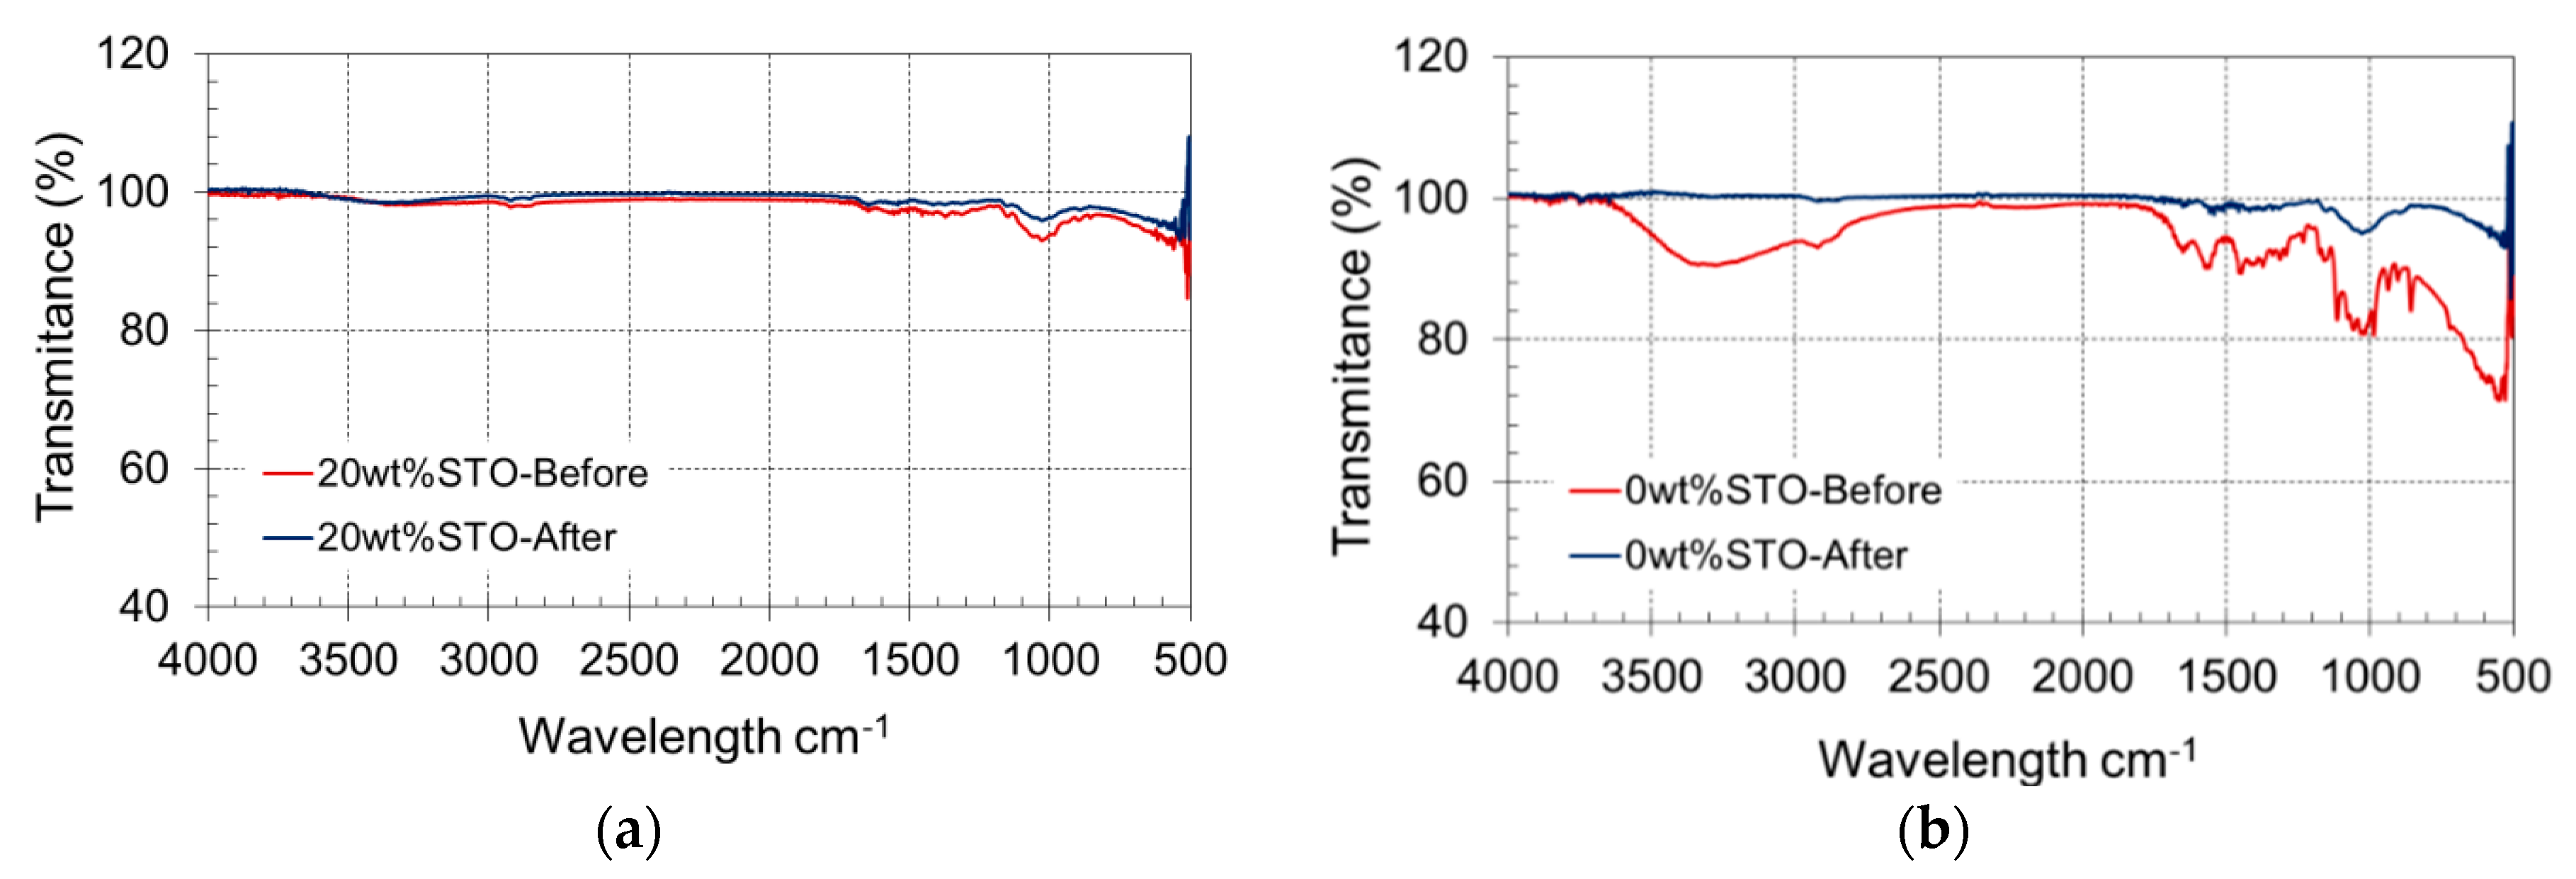
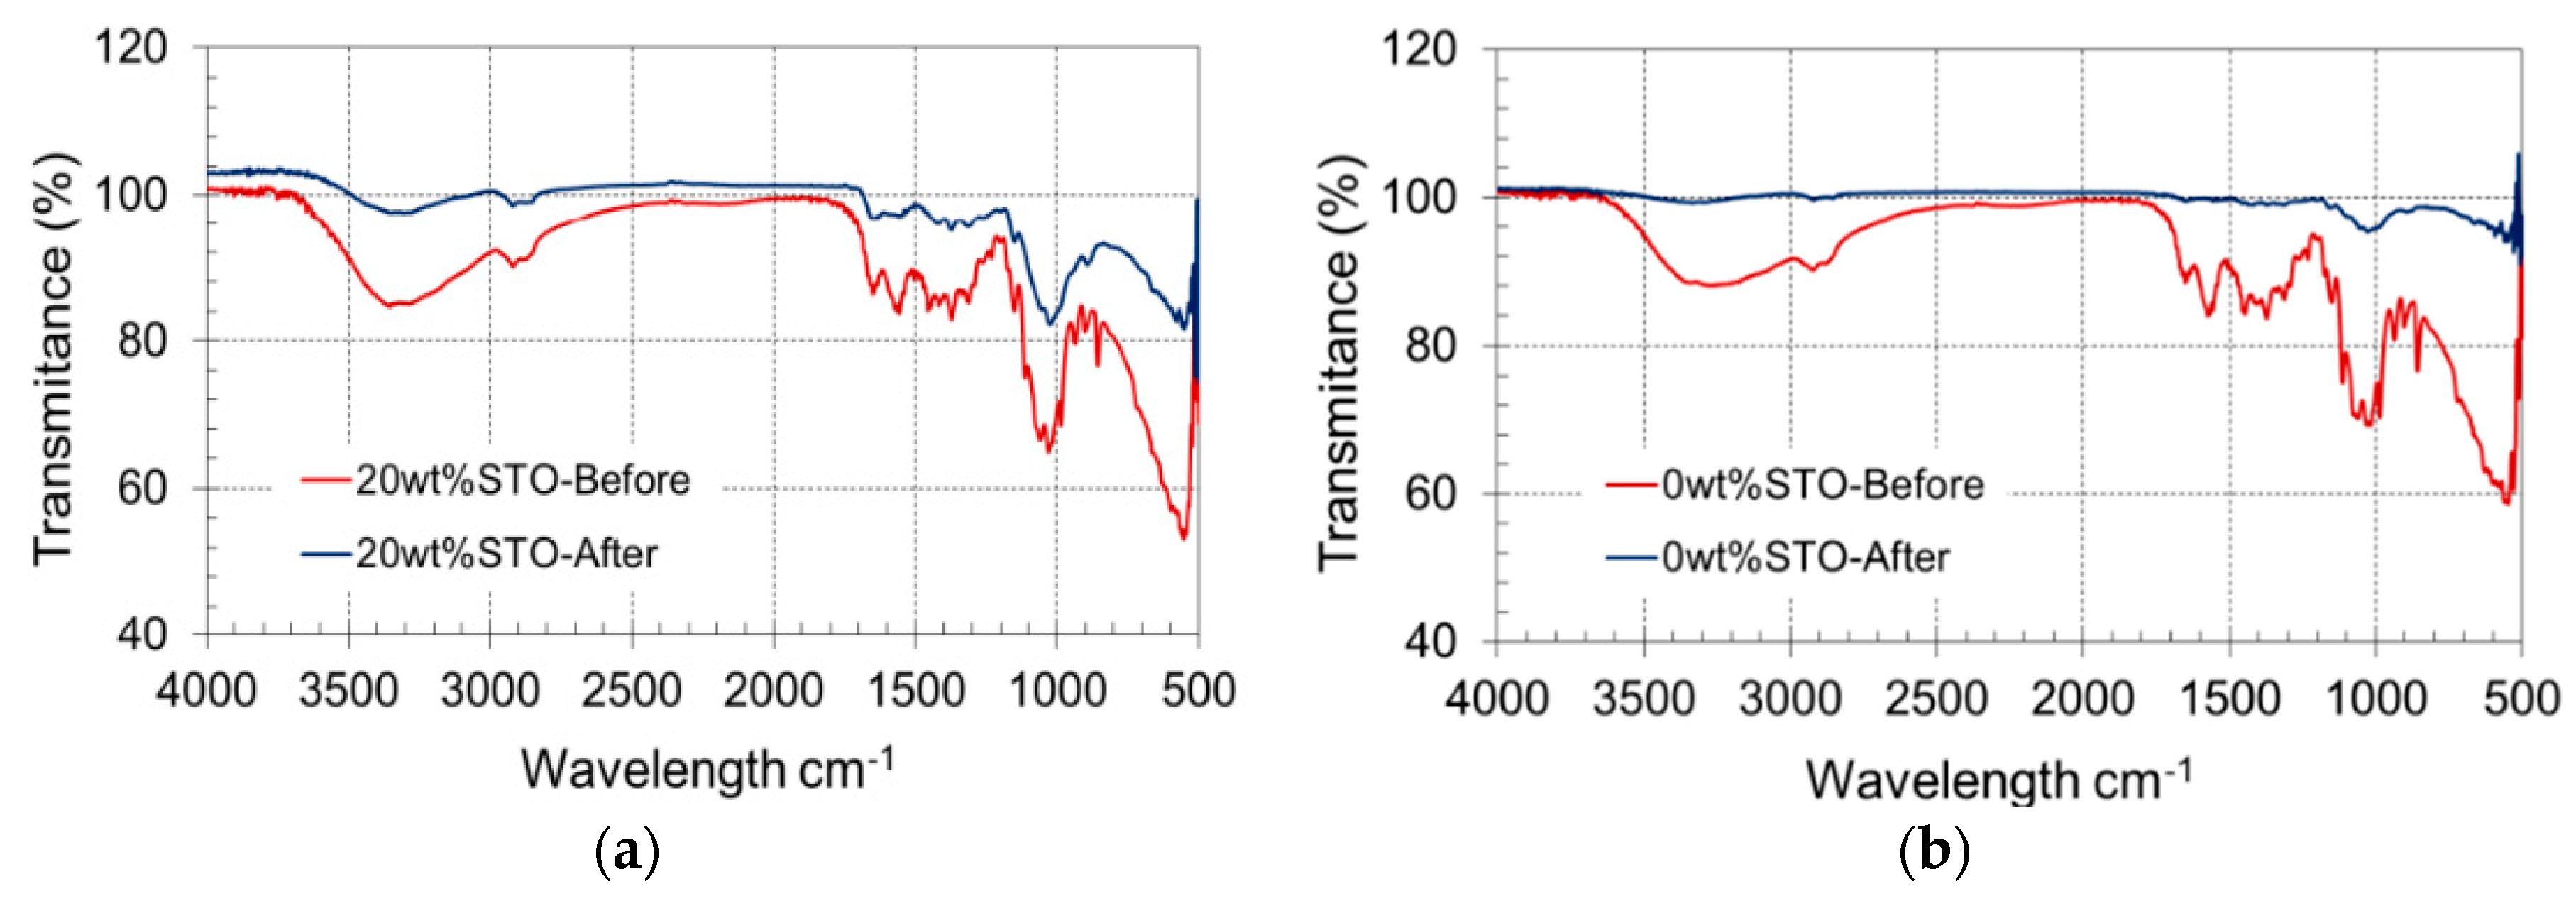
Figure 11 and Figure 12 show the FTIR spectra of bio-composites made of 25 v% of cellulose degraded in HCl and CH3COOH solutions. The spectrum reveals a band at 3400 cm−1 characteristics of (–OH) groups, two bands at 1650 cm−1 and 1560 cm−1, which represent the amide I and (–NH2), respectively [12]. Moreover, the spectra show a band near 1733 cm−1 characteristic of (–CHO), which corresponds to cellulose [12].
As stated by Davidson, polymer degradation can be evaluated using FTIR [17]. The spectra would show real bands and negative bands. Additionally, the bands can change their shape and position. Our FTIR analysis demonstrated the degradation effects on the bio-composites after exposure to NaCl and CH3COOH (Figure 11 and Figure 12).
In the degraded polymers, the characteristic bands of chitosan and cellulose disappeared. However, the spectrum reveals a band near 1072 cm−1, which is characteristic of (C–O) groups, present in the chitosan and cellulose structures. Furthermore, the results suggest that the STO nanoparticles presence reduced the degradation of the bio-composites, which agrees with the results presented in a prior section.
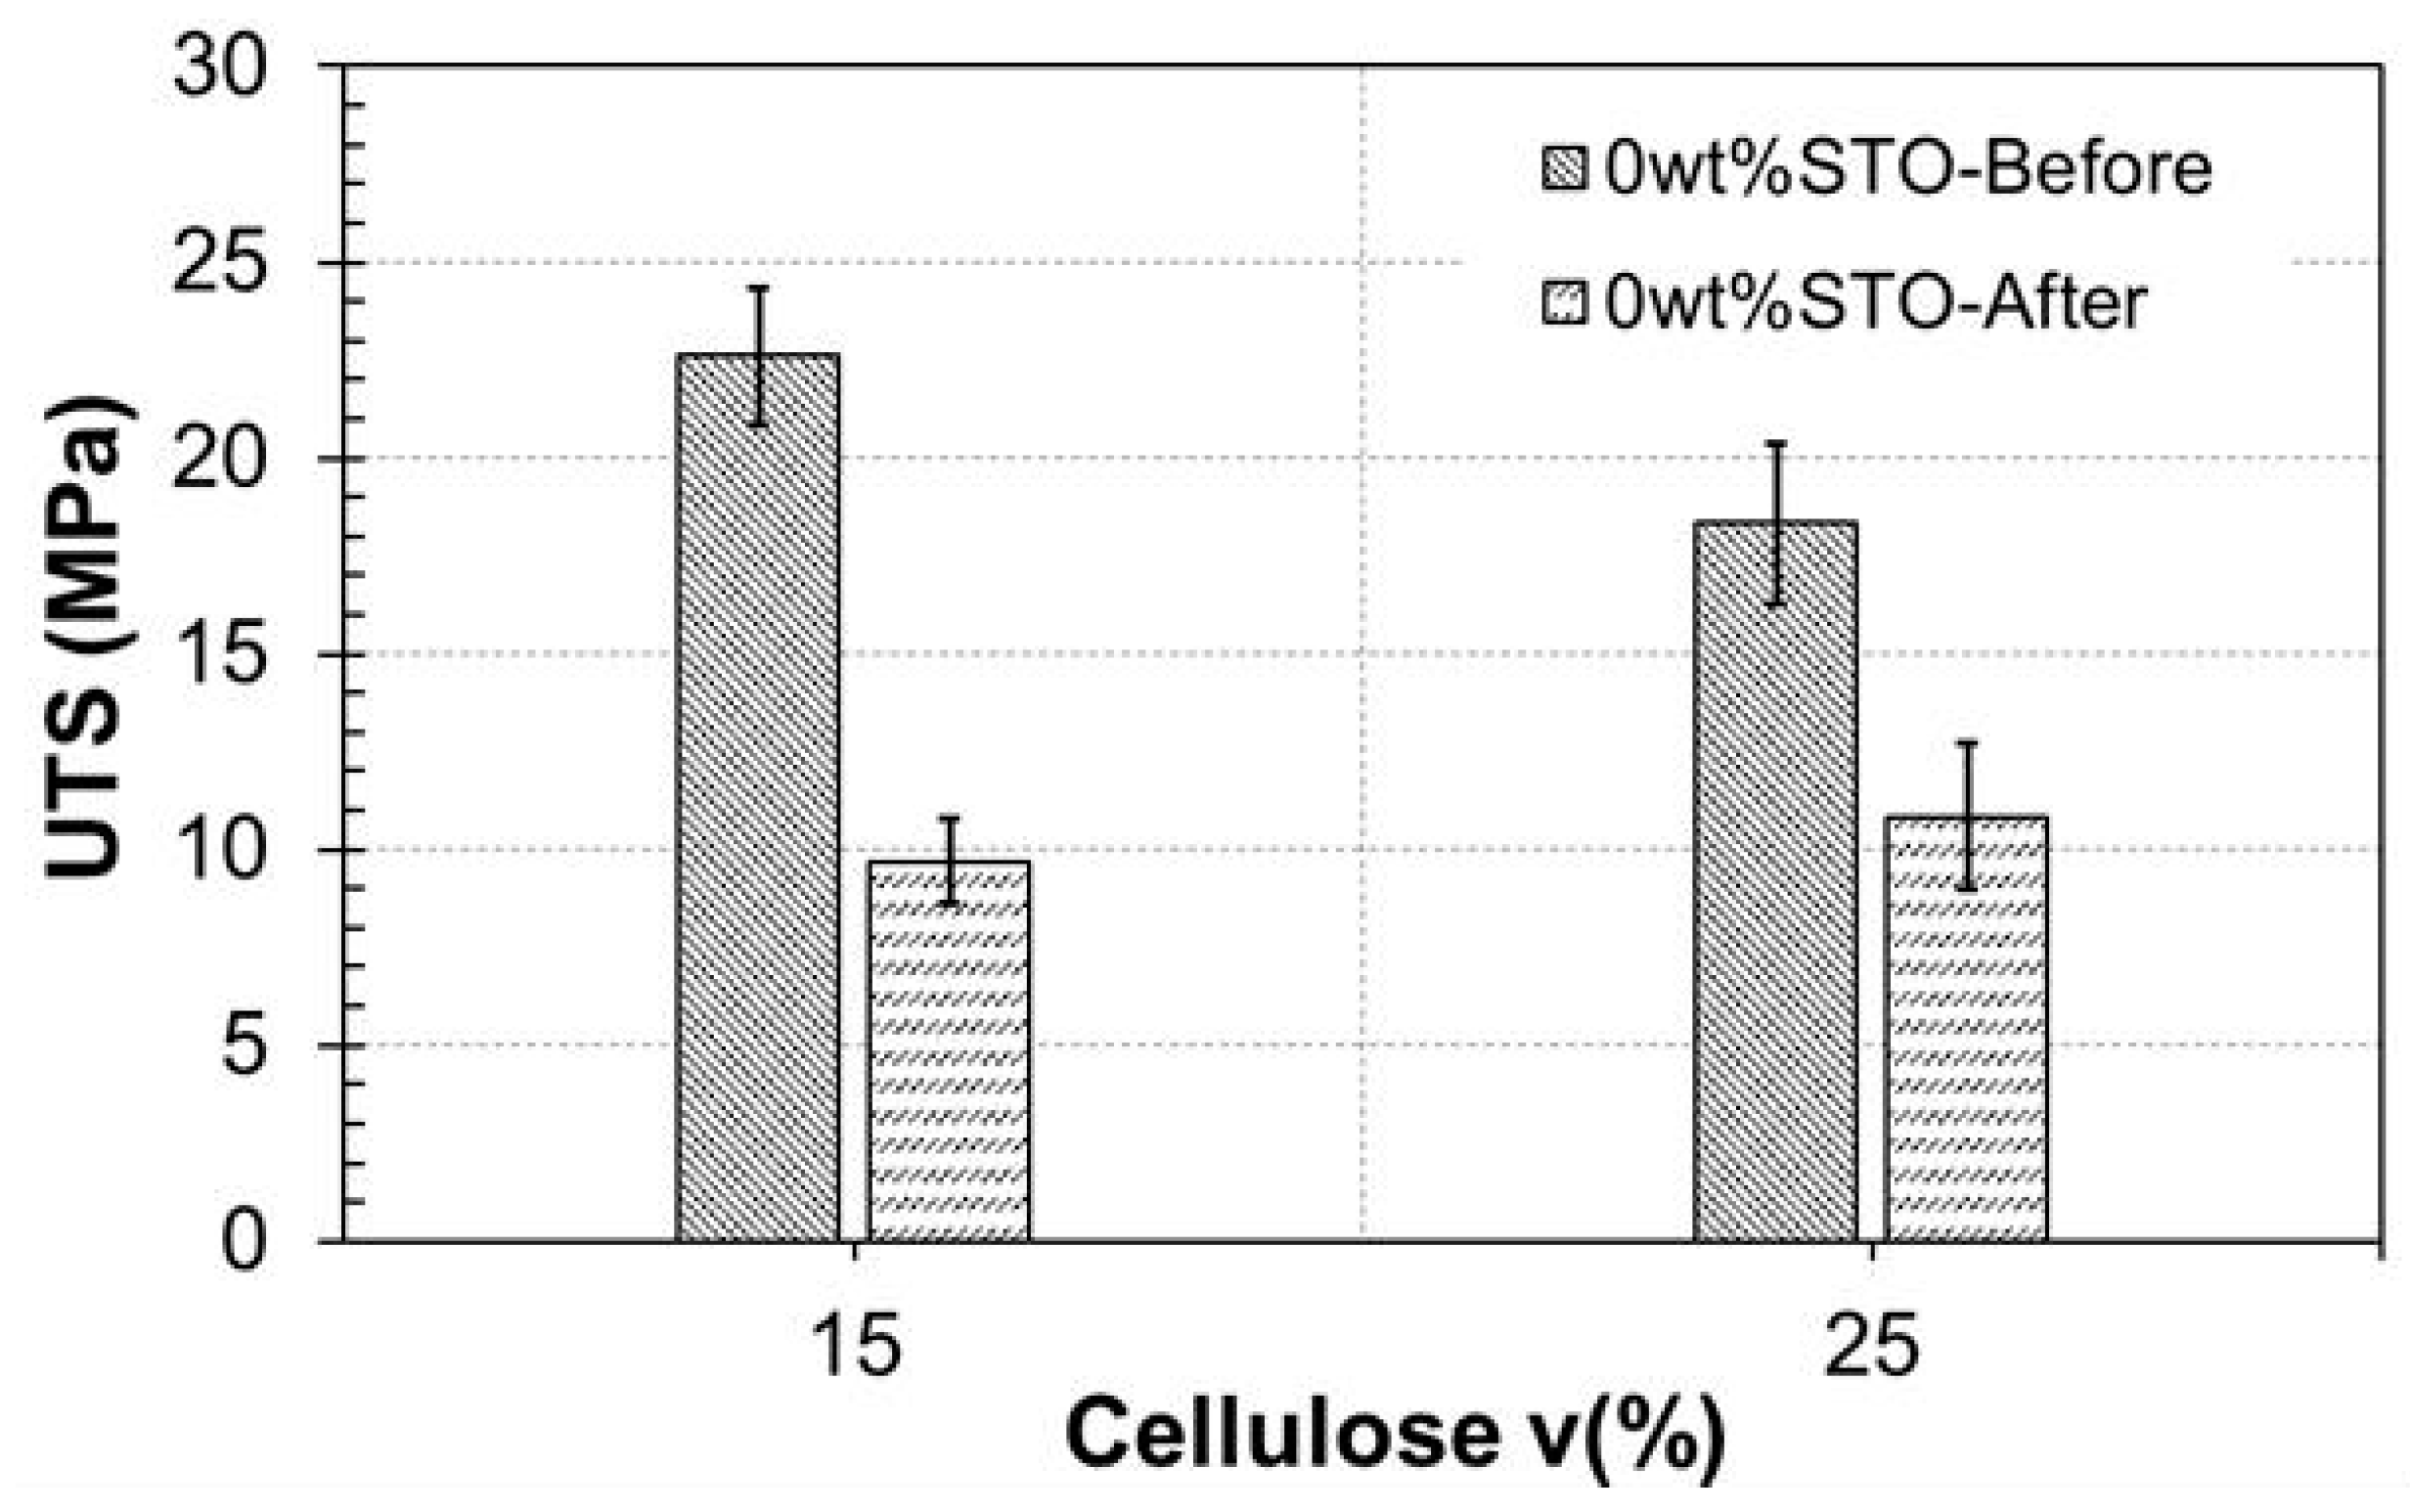
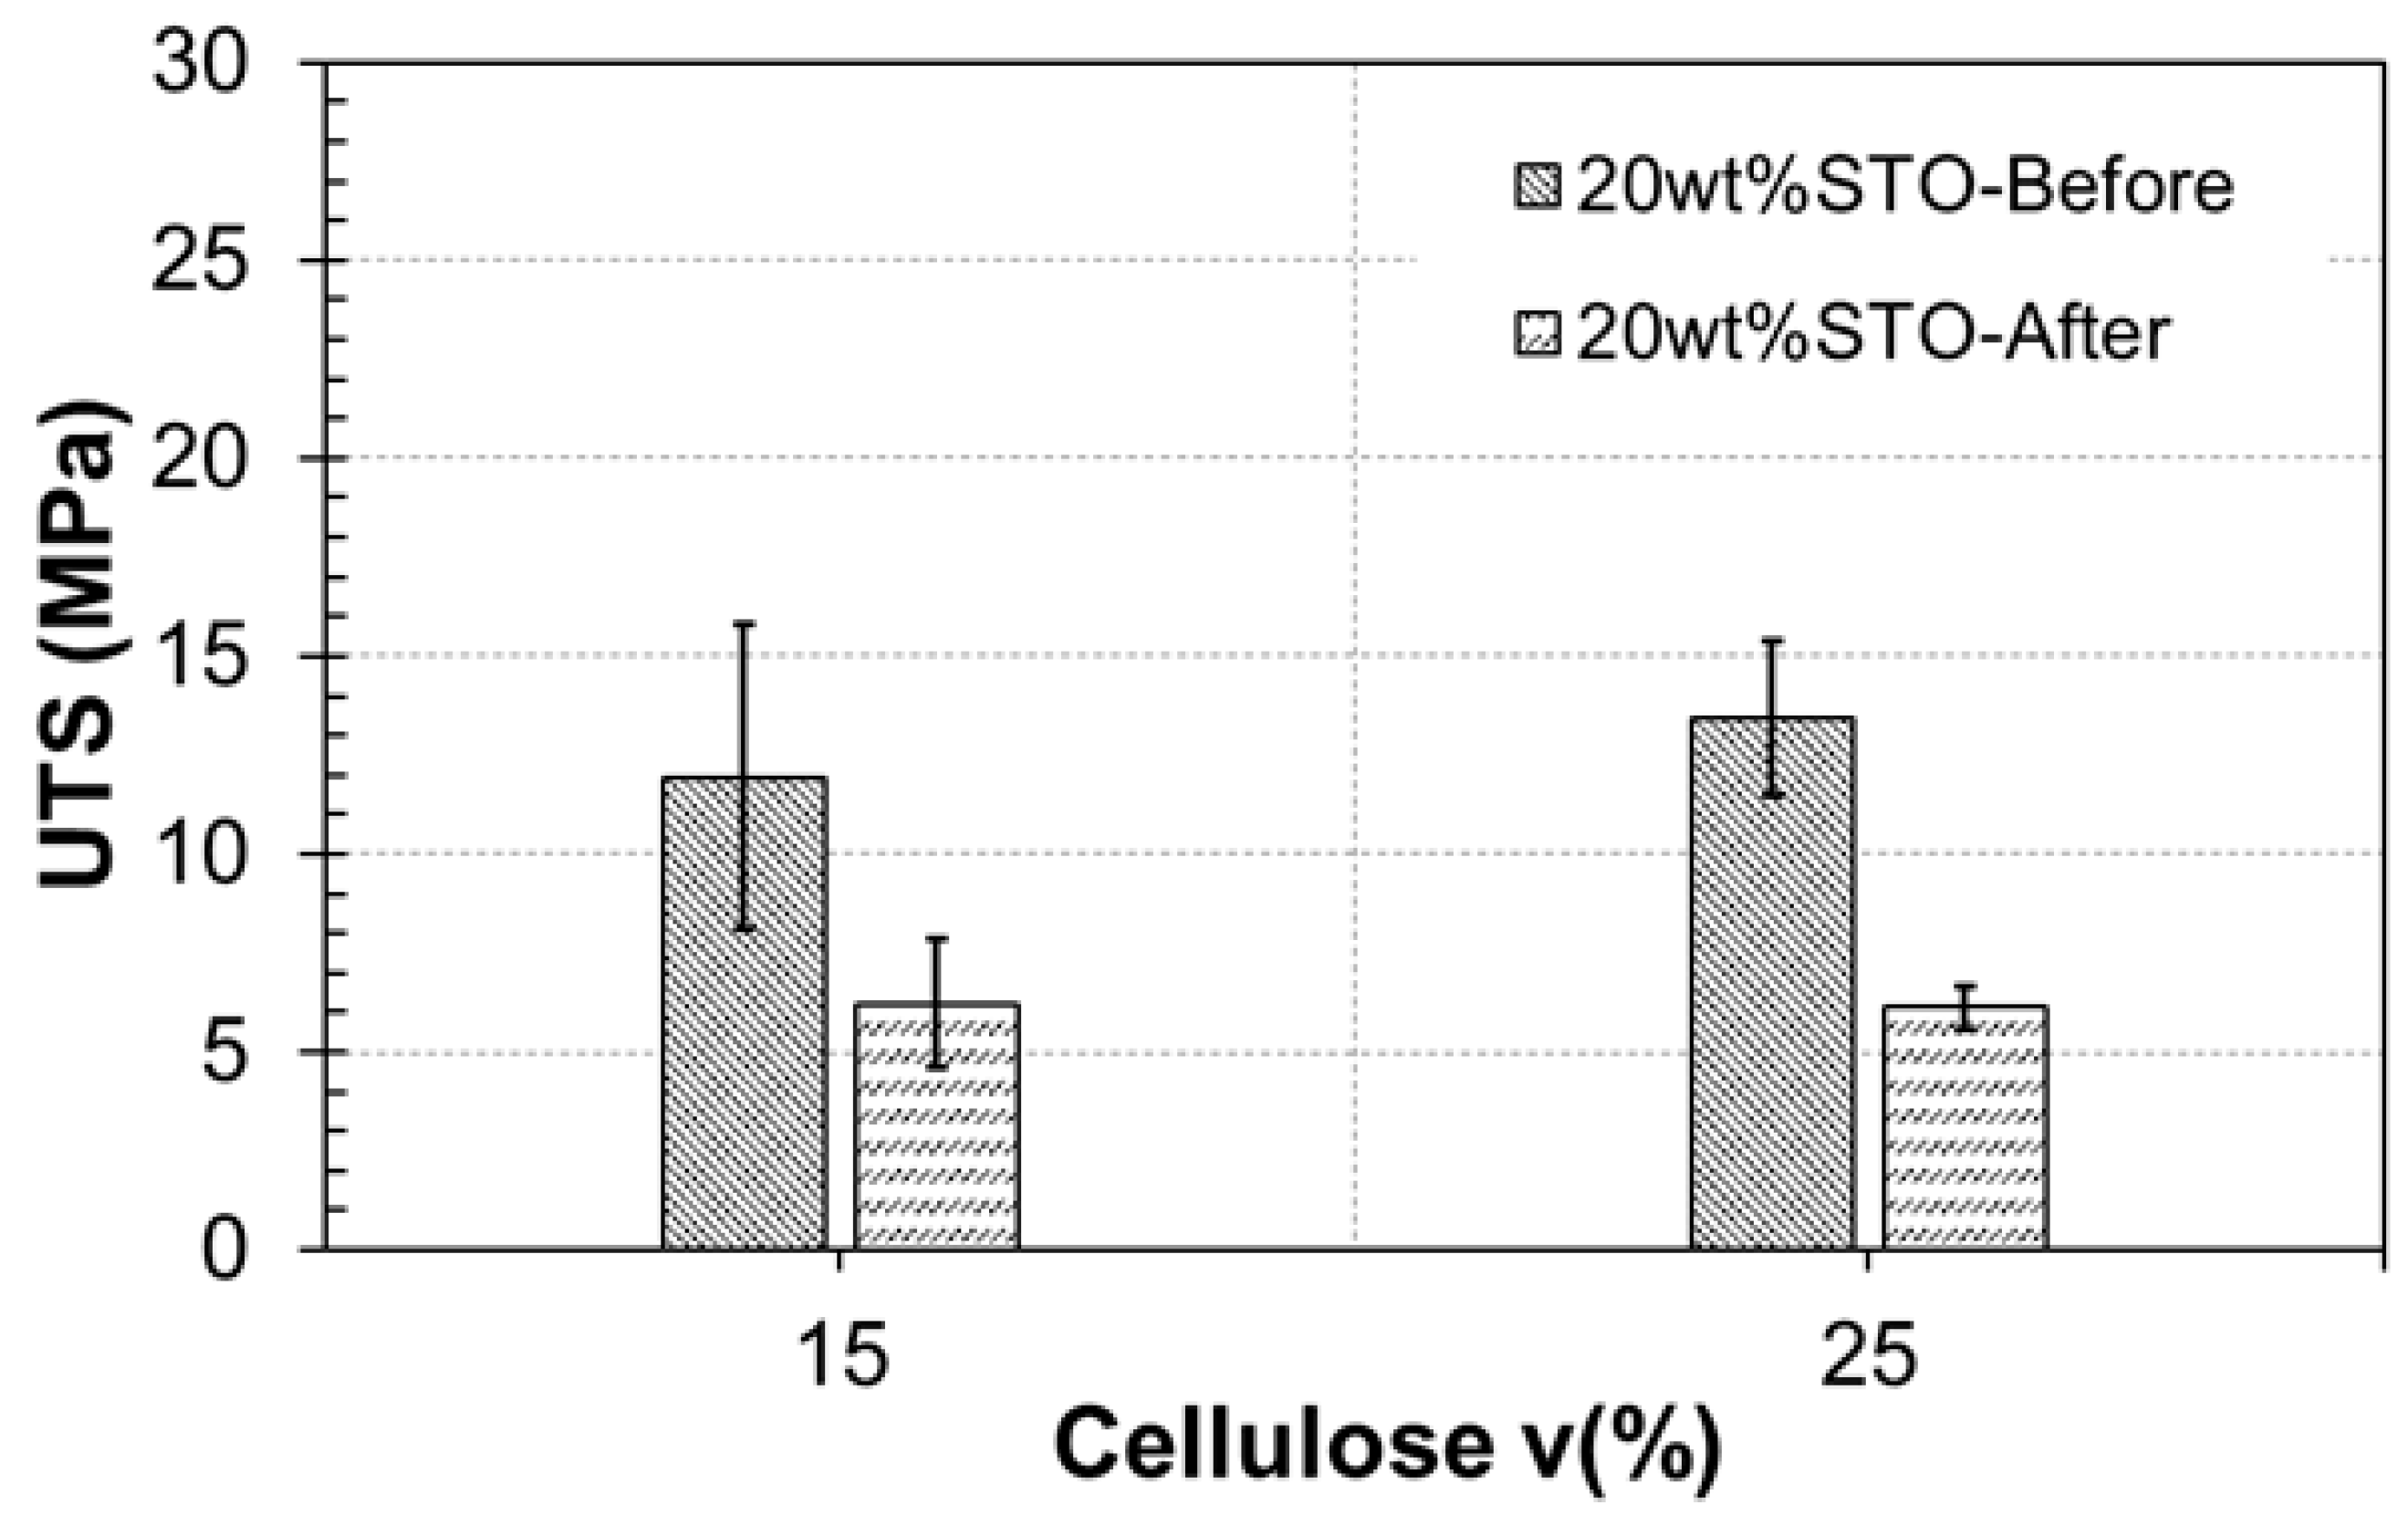
The next step to complete a degradation study was to assess the UTS of our bio-composites after degradation in the stronger acidic solution: the HCl solution. As mentioned previously, we observed higher degradation in bio-composites submerged in the HCl solution than in the acetic acid one. As expected, Figure 13 and Figure 14 reveal how tensile strength diminished after degradation at two different composite loadings (amount of reinforcement). The results are as expected since as polymers degrade, loss of mass and scission of chains affects the mechanical strength of the material. The stability of the material is further compromised when a load is applied.

3.4. Creep Behavior Analysis

The creep study took place at two temperatures, i.e., 25 °C and 100 °C, under a constant applied load of 1.0 N. Before discussing in detail, the creep deformation, we deem important to report that the obtained glass transition temperature (Tg) of the composites ranged between 210 °C to 220 °C. Hence, we decided to conduct our creep analysis below the Tg of the composites to simulate better operation conditions of devices made with these biopolymer composites. In other words, we did not reach the highest possible deformation of the composites.
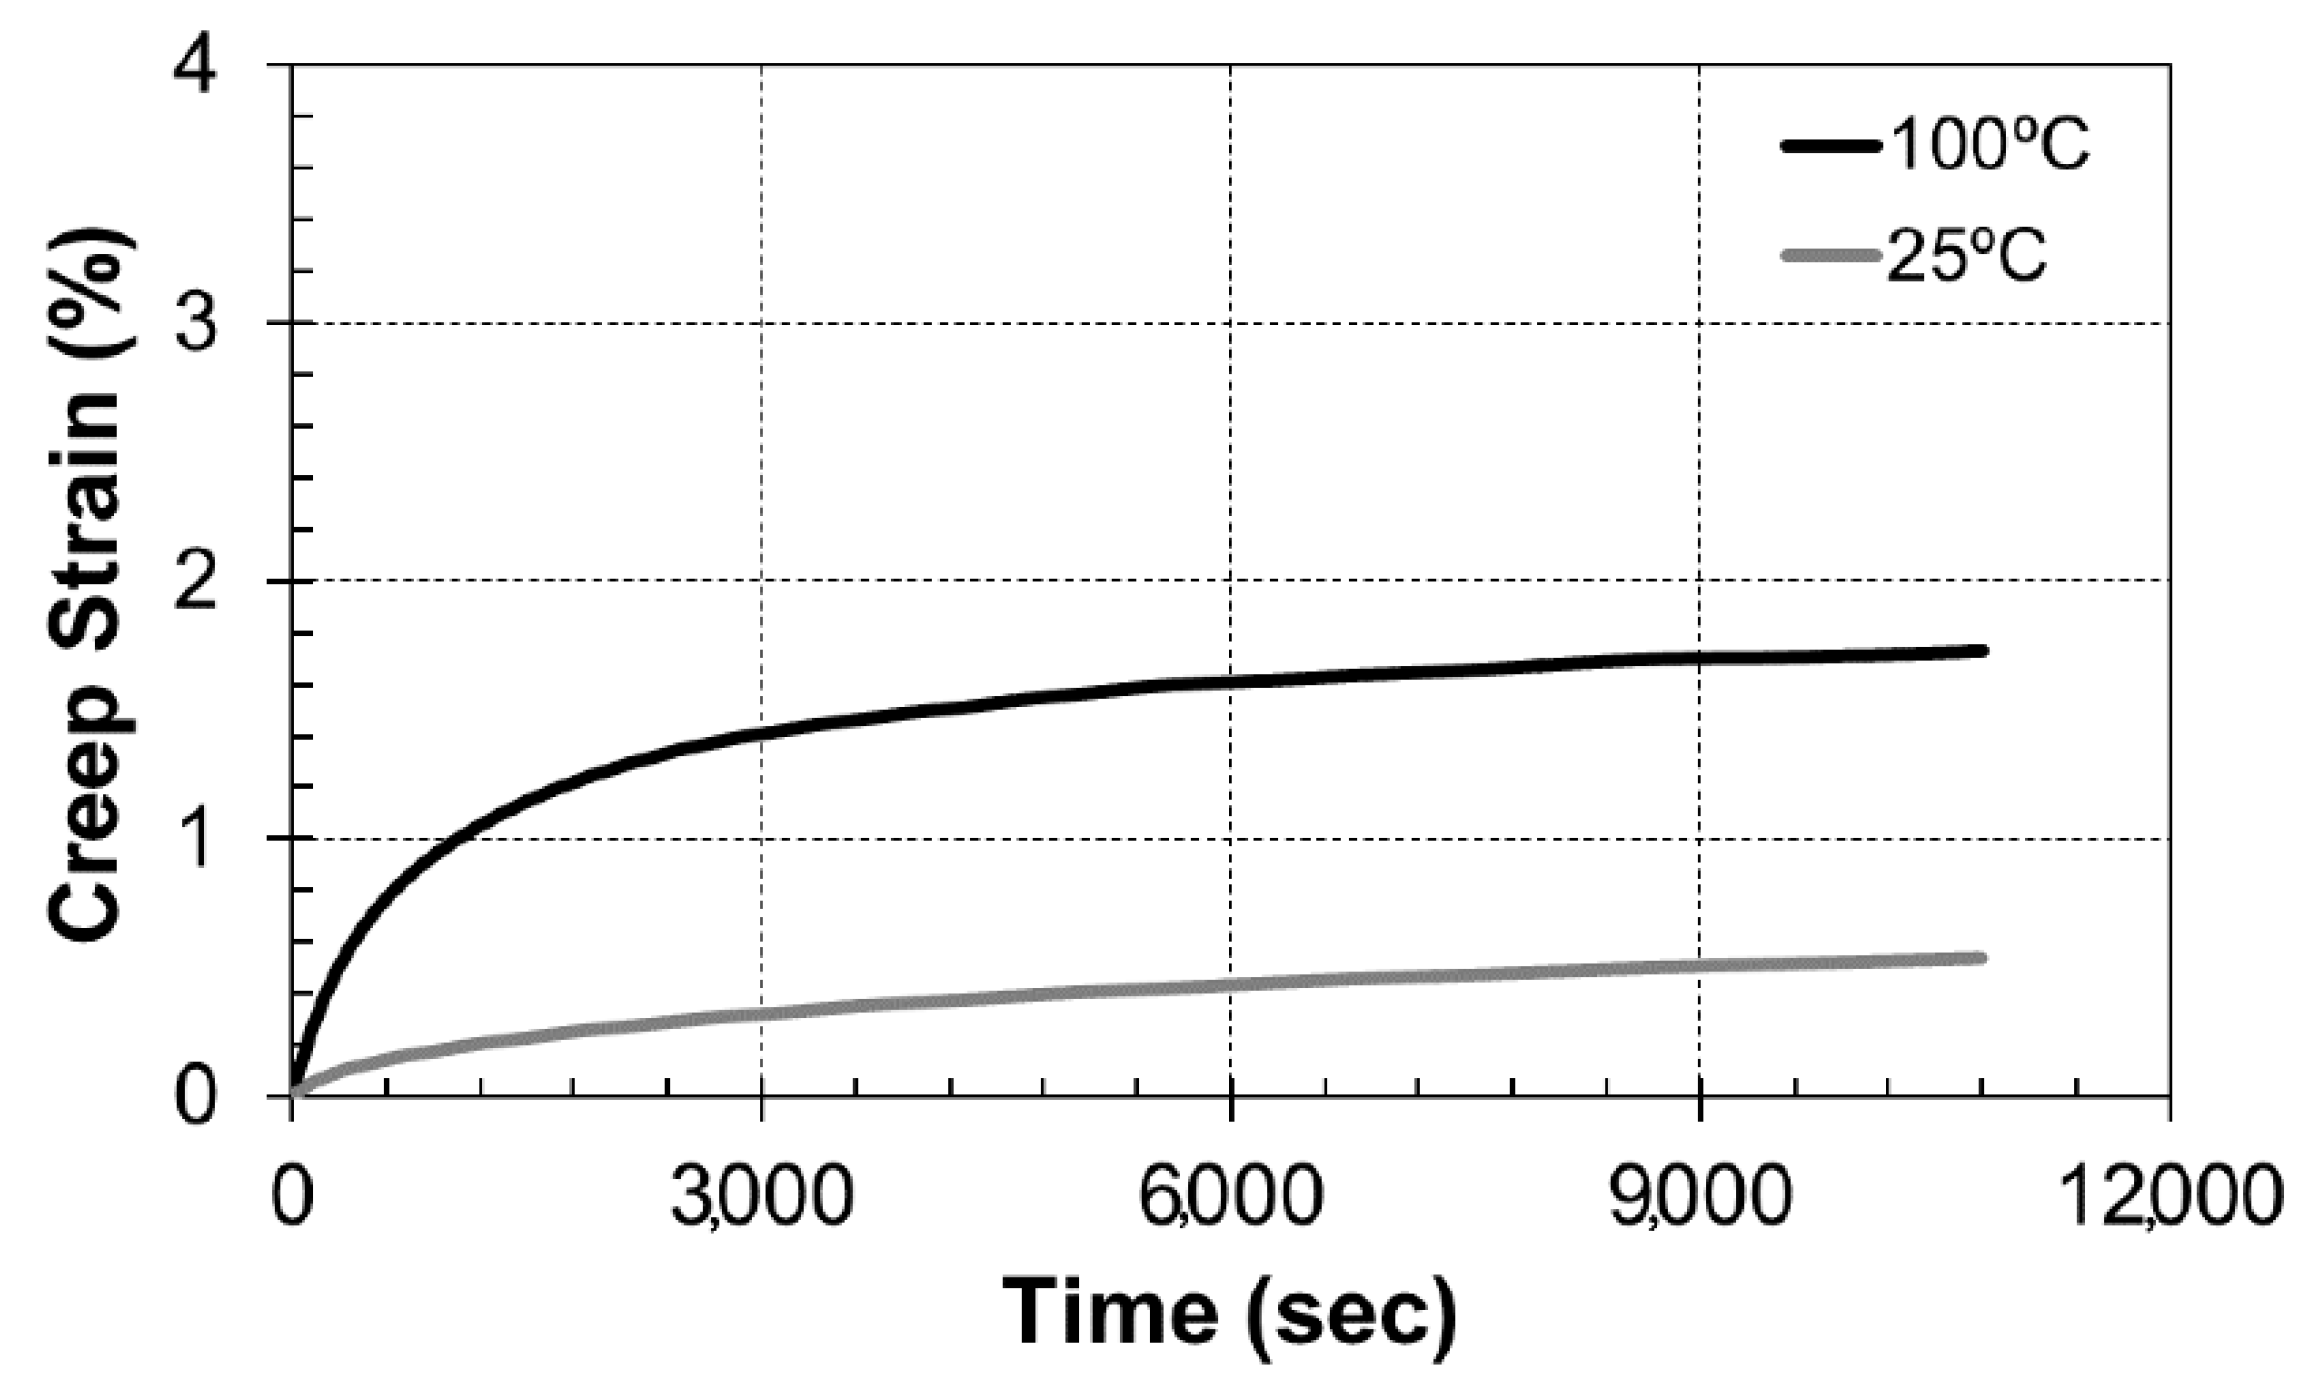
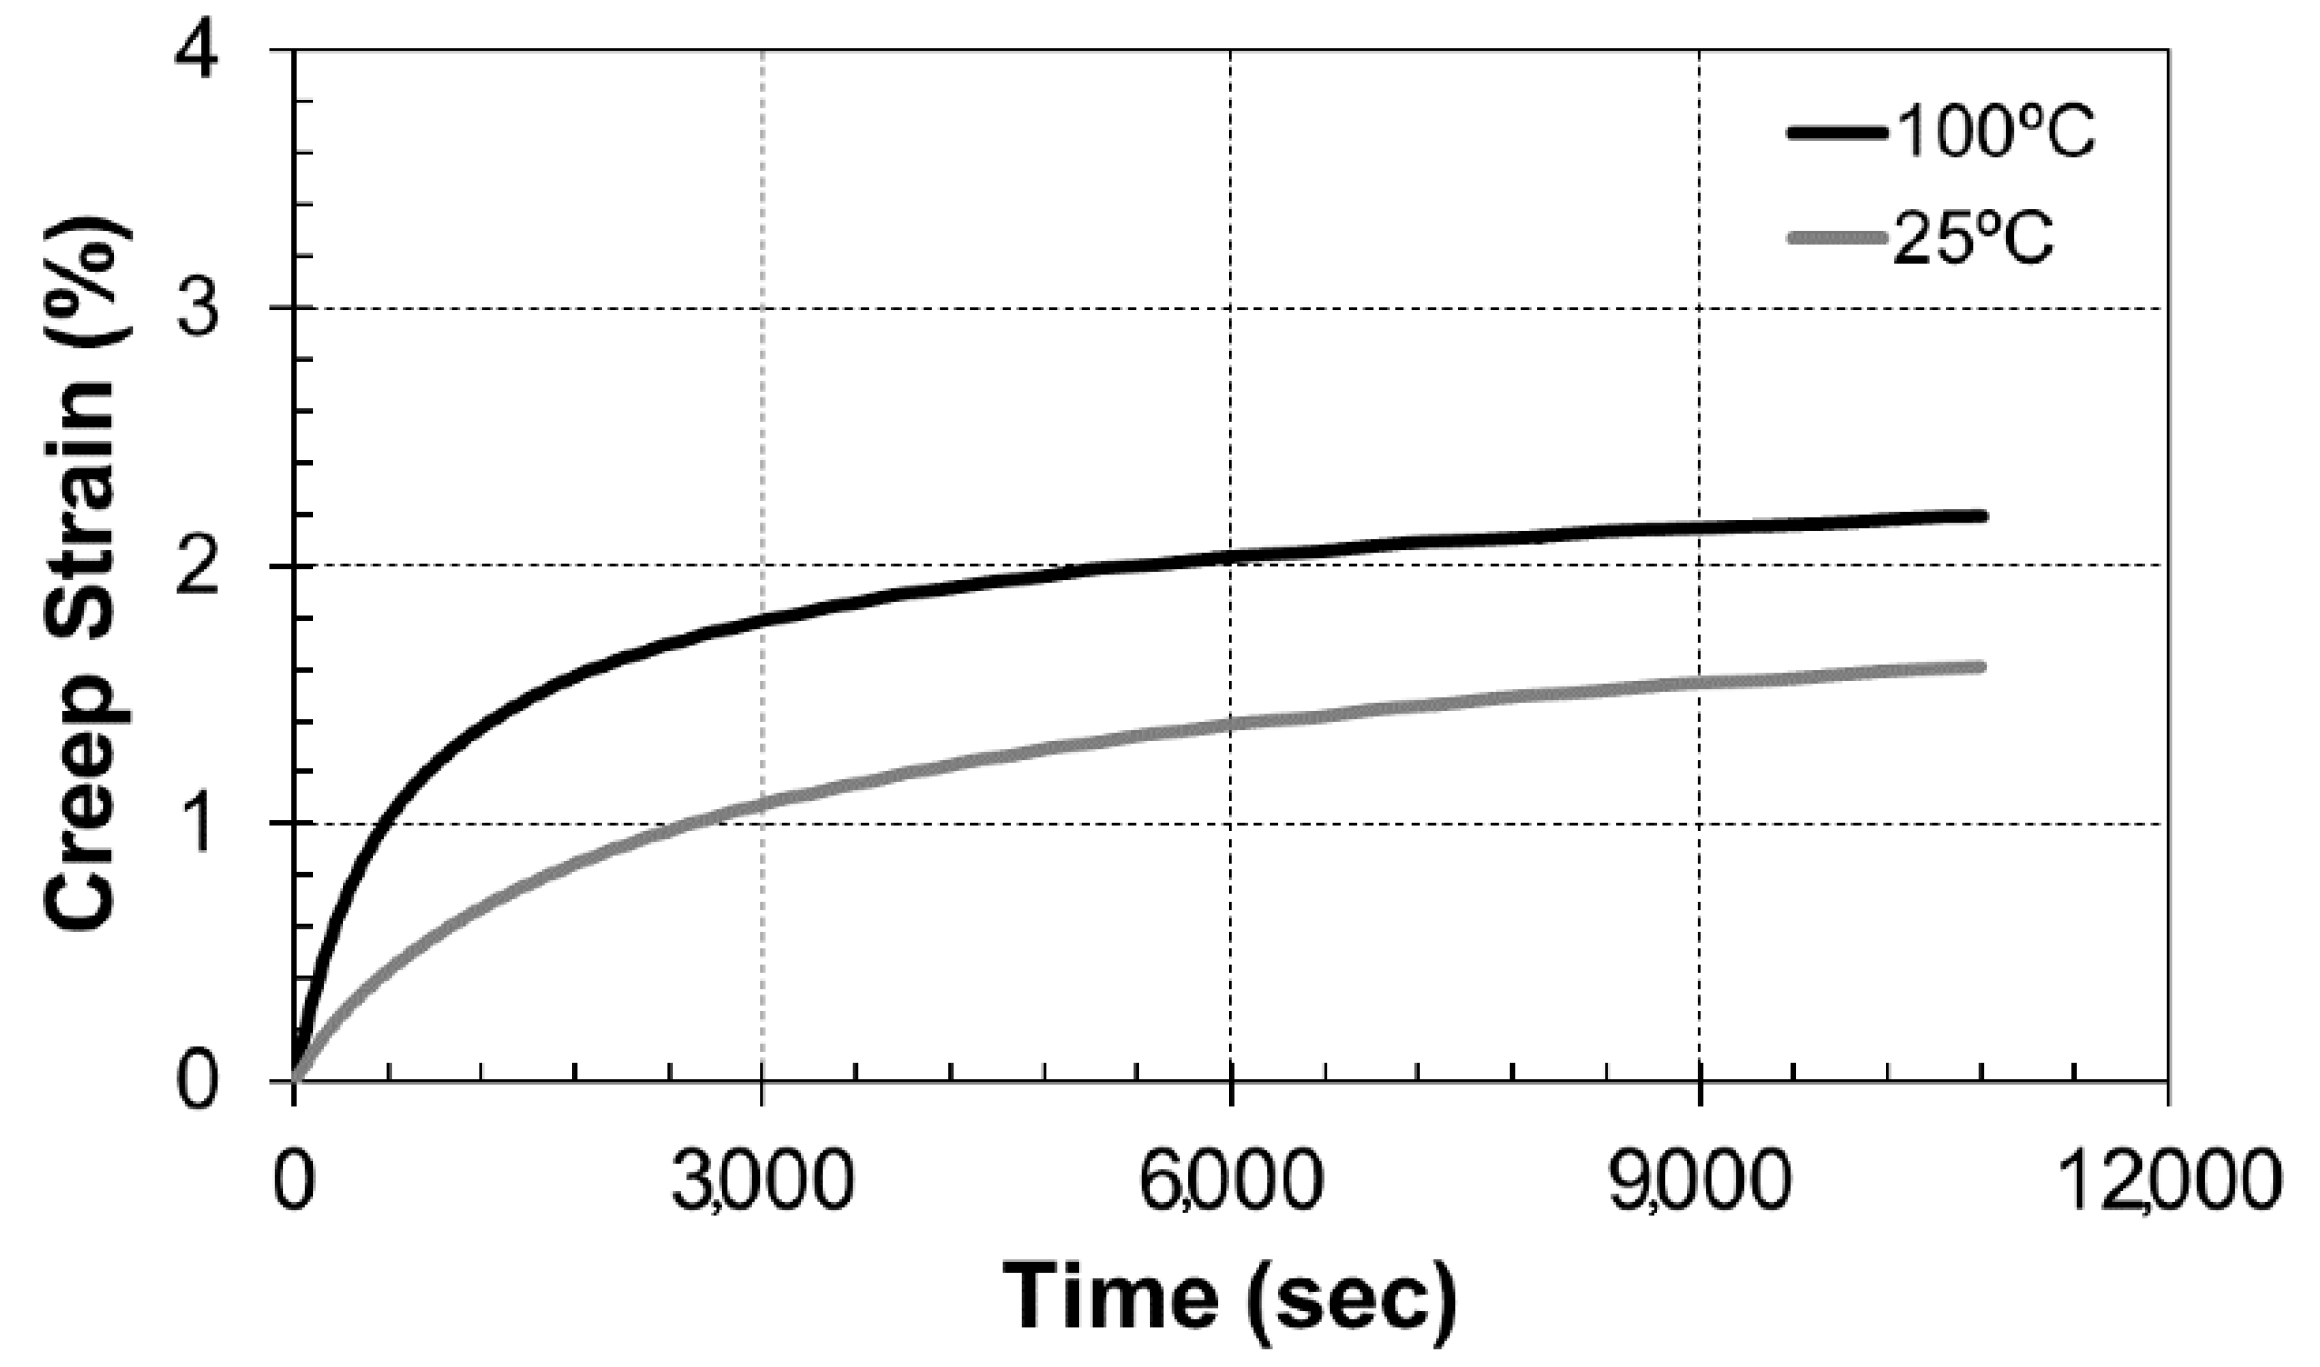
The measured creep strain as a function of time at 25 °C and 100 °C are presented in Figure 15 and Figure 16 for the matrix and a composite containing 20 wt. % STO nanoparticles. For the sake of brevity, we limited the analysis of the creep behavior of these composites to the instantaneous deformation, primary stage, and an incomplete secondary stage (when the strain rate kept constant). We could not reach the tertiary stage as the time required exceeded the one allotted to this research. Nonetheless, our results revealed clearly that the overall strain of the polymer/STO nanoparticles composites was higher than the chitosan-cellulose ones (no STO particles). We attributed such unexpected behavior to the viscosity of the solution upon fabrication of the composites. High viscosity in polymers delays the creep strain by hampering the mobility of the polymer chains. Additionally, and as expected, the creep strain rose with temperature.
Contrary to previous findings, the composites containing STO nanoparticles yielded higher creep deformation, which we attributed to several factors. Chitosan (present in larger amounts than cellulose in the polymeric matrix) possesses higher stiffness and resistance to deformation that lowered the creep deformation of our composites. When nanoparticles are present in the polymeric matrix, one must consider several factors affecting the creep deformation. In effect, as stated by Yang et al., creep deformation is altered by amorphous regions and crystallized chains, the/polymeric matrix/nanoparticles interface, bridging segments between nanoparticles, and even dangling polymeric ends [7].
As mentioned, the amorphous and crystalline regions could influence the creep behavior of our composites. In our case, the composite matrix was made of semi-crystalline polymers. When a load is applied to the crystalline chains, they rapidly respond to the mechanical stress and transfer the applied loads. However, the amorphous regions act as dumping sites to create a Voigt’s or Zener’s viscoelastic behavior [18,19,20]. Henceforth, a time slag allows withstanding the load as the chains are less oriented throughout the bulk polymer. Even if the polymer has high crystalline regions, the creep deformation is, therefore, slowed down.
When reinforcing particles are added to the polymeric matrix, they could alter the local crystallinity of the material, as indicated by Yang et al. [7]. However, in our case, we proved that the addition of the particles did not affect the crystallinity of the polymeric matrix. At the beginning of this section, we indicated that our test temperature never exceeded the Tg. This was not modified with the addition of the nanoparticles, as the Tg values fell between 210° to 220° for all these composites.
Furthermore, at this point, one must indicate that despite our careful attempts, some reinforcing strontium titanate nanoparticles agglomerated likely due to the electrostatic forces among them. As the polymer/STO interface is relevant to the creep strain response, the agglomerates could have slipped at higher shear stresses. This could lead to crack nucleation nigh the agglomerates. Thus, under the applied load of 1 N, the crack propagation likely continued through the polymeric matrix as a slow velocity deformation took place.
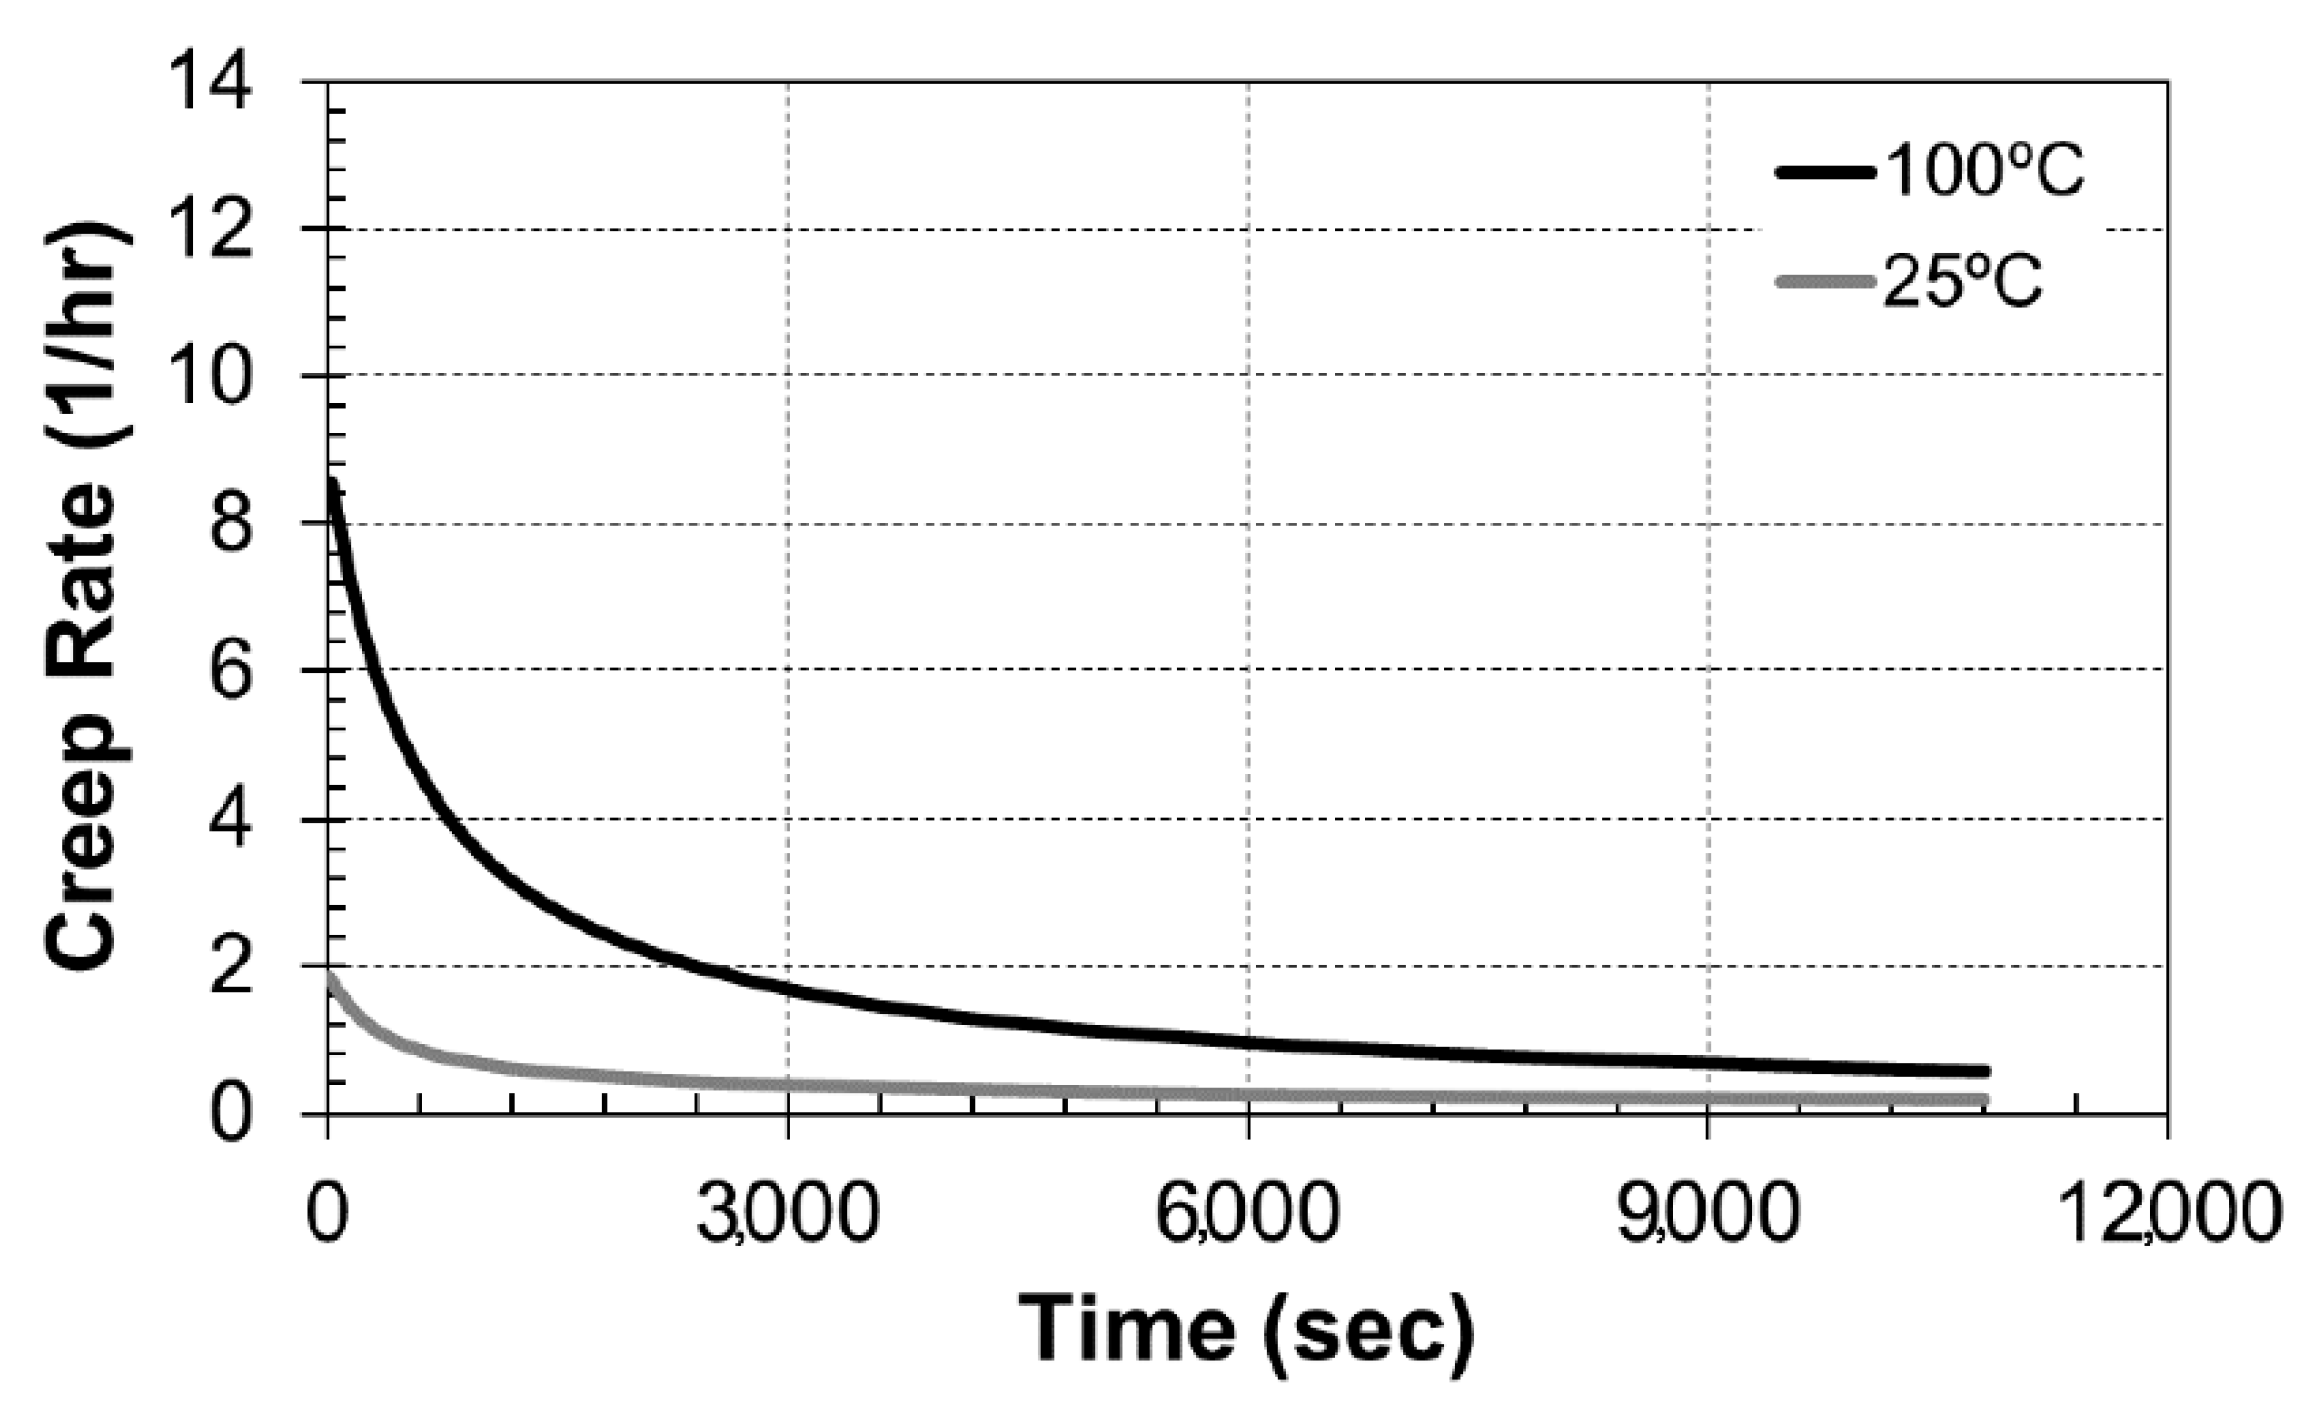
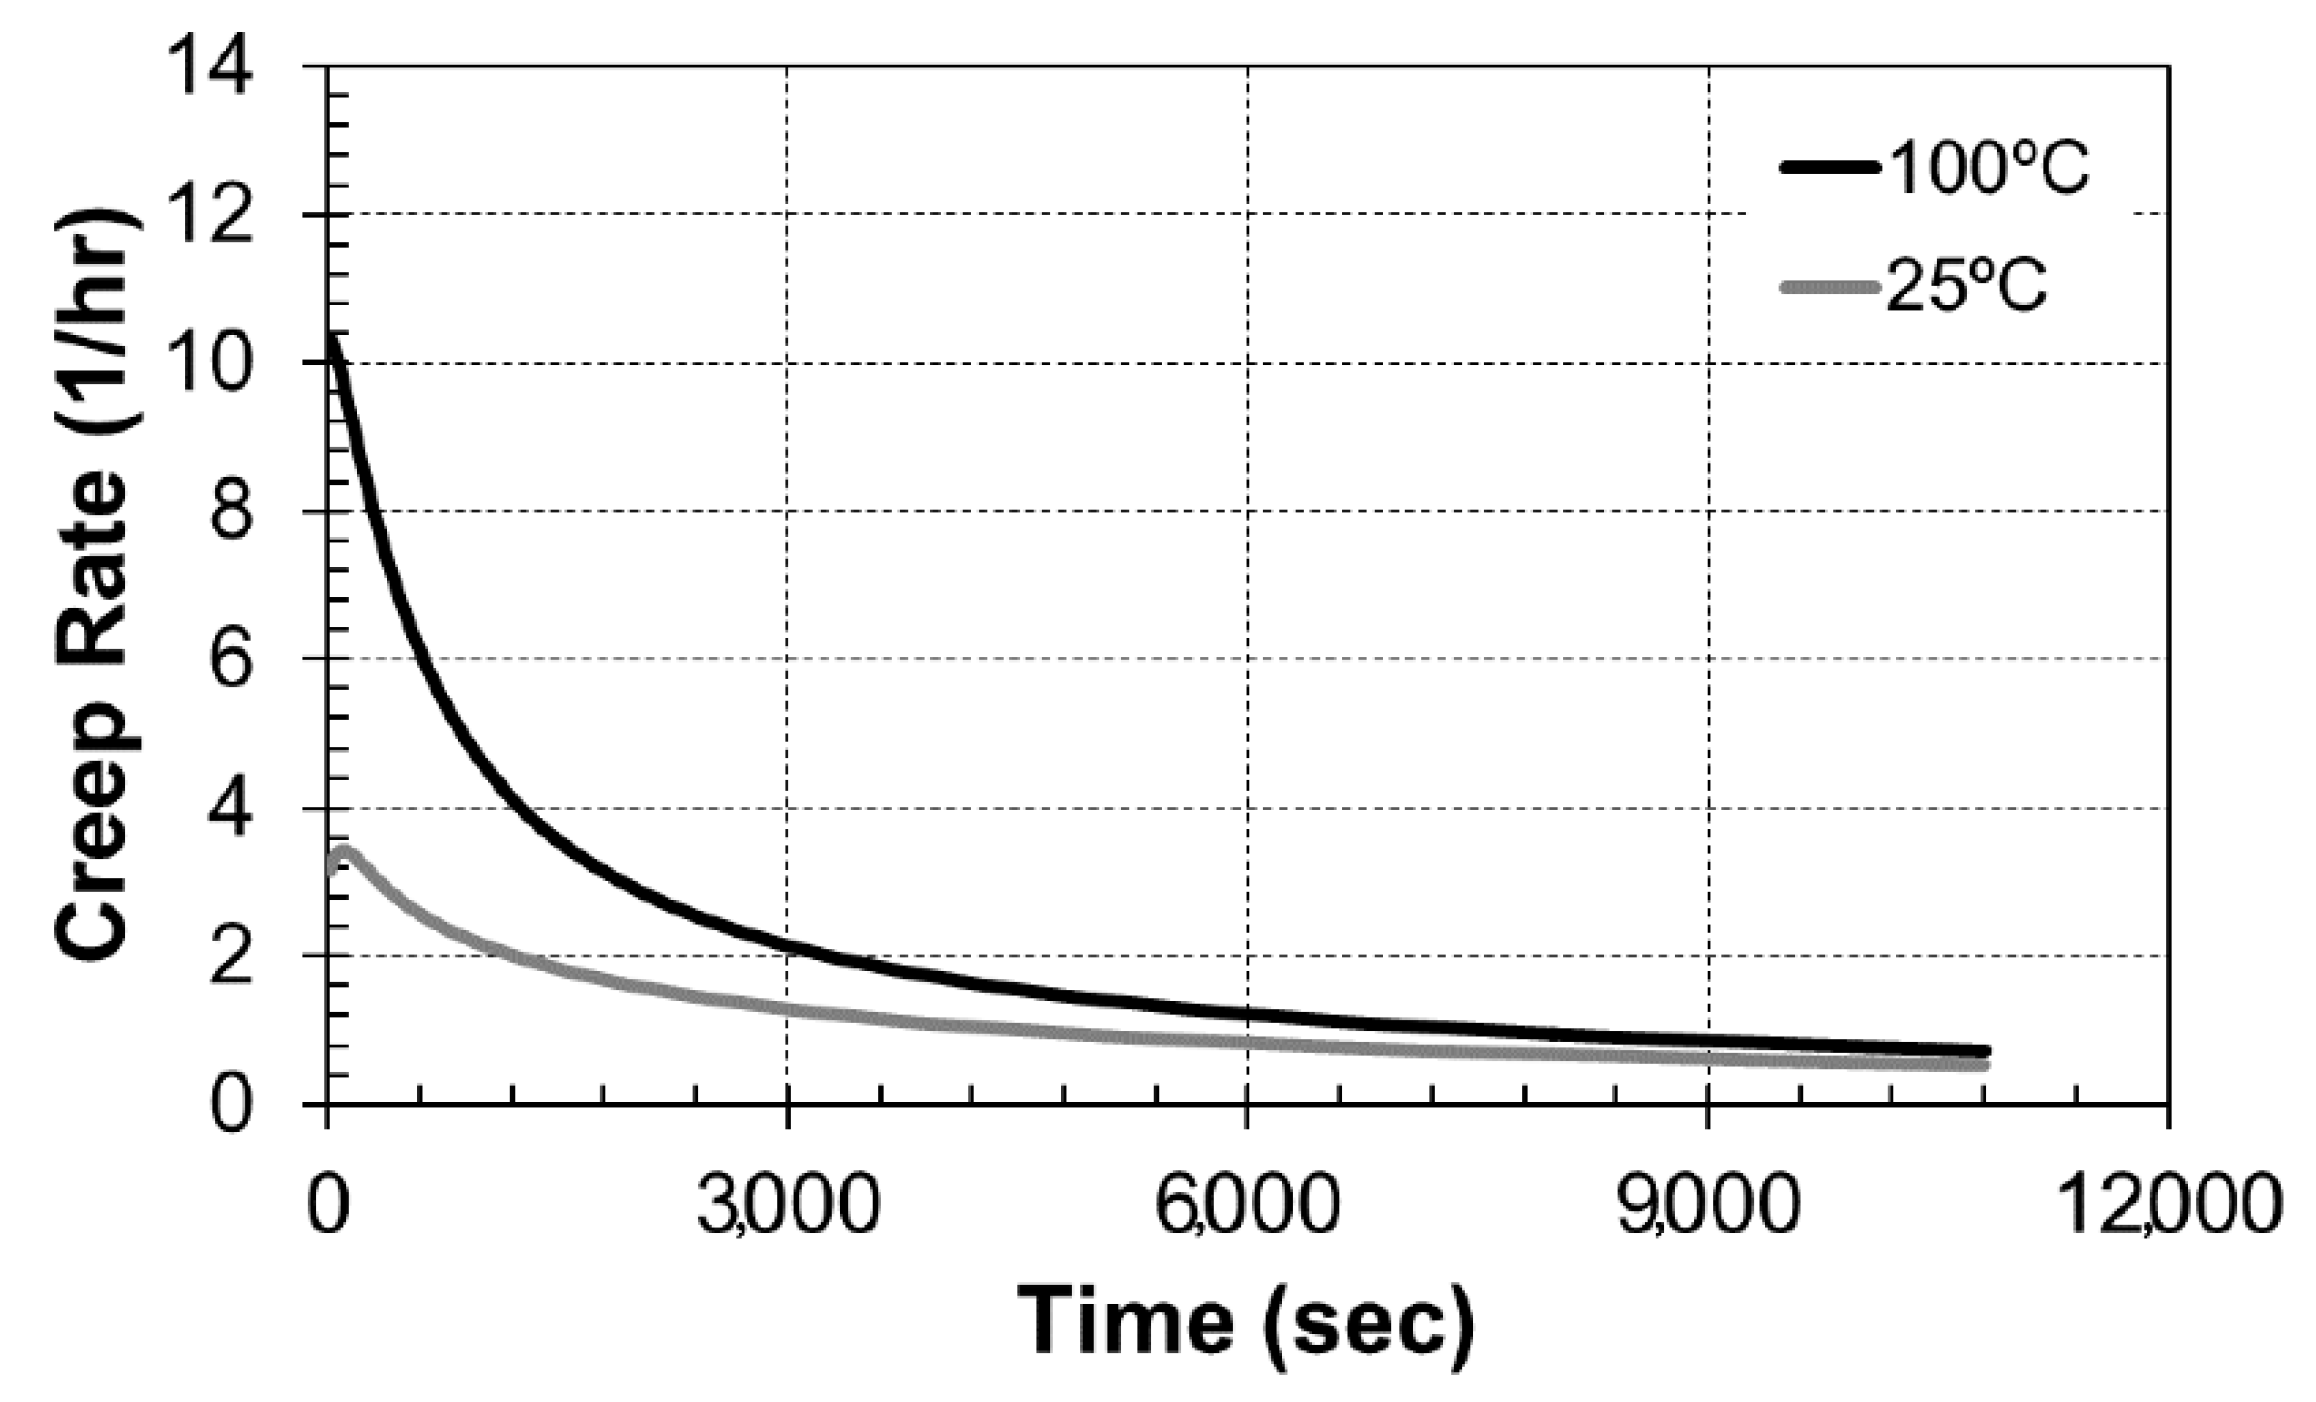
3.4.1. Creep Rate

Naturally, the dimensional stability of the nanocomposites was determined by the creep rate, i.e., the velocity of the creep strain provided by the TMA. According to Figure 17 and Figure 18, a higher creep rate is apparent in composites reinforced with 20 wt. % STO nanoparticles. Additionally, and as expected, higher temperatures increased the creep rate of our composites. Further, those figures show how the creep rate decreased and led a constant creep rate (secondary creep stage). The steep reduction in creep rate could be due to the hardening caused by the orientation of the polymer chains under stress [19]. After 1.5 h (i.e., onset of the secondary creep stage), the polymer chains reached a dynamic equilibrium.

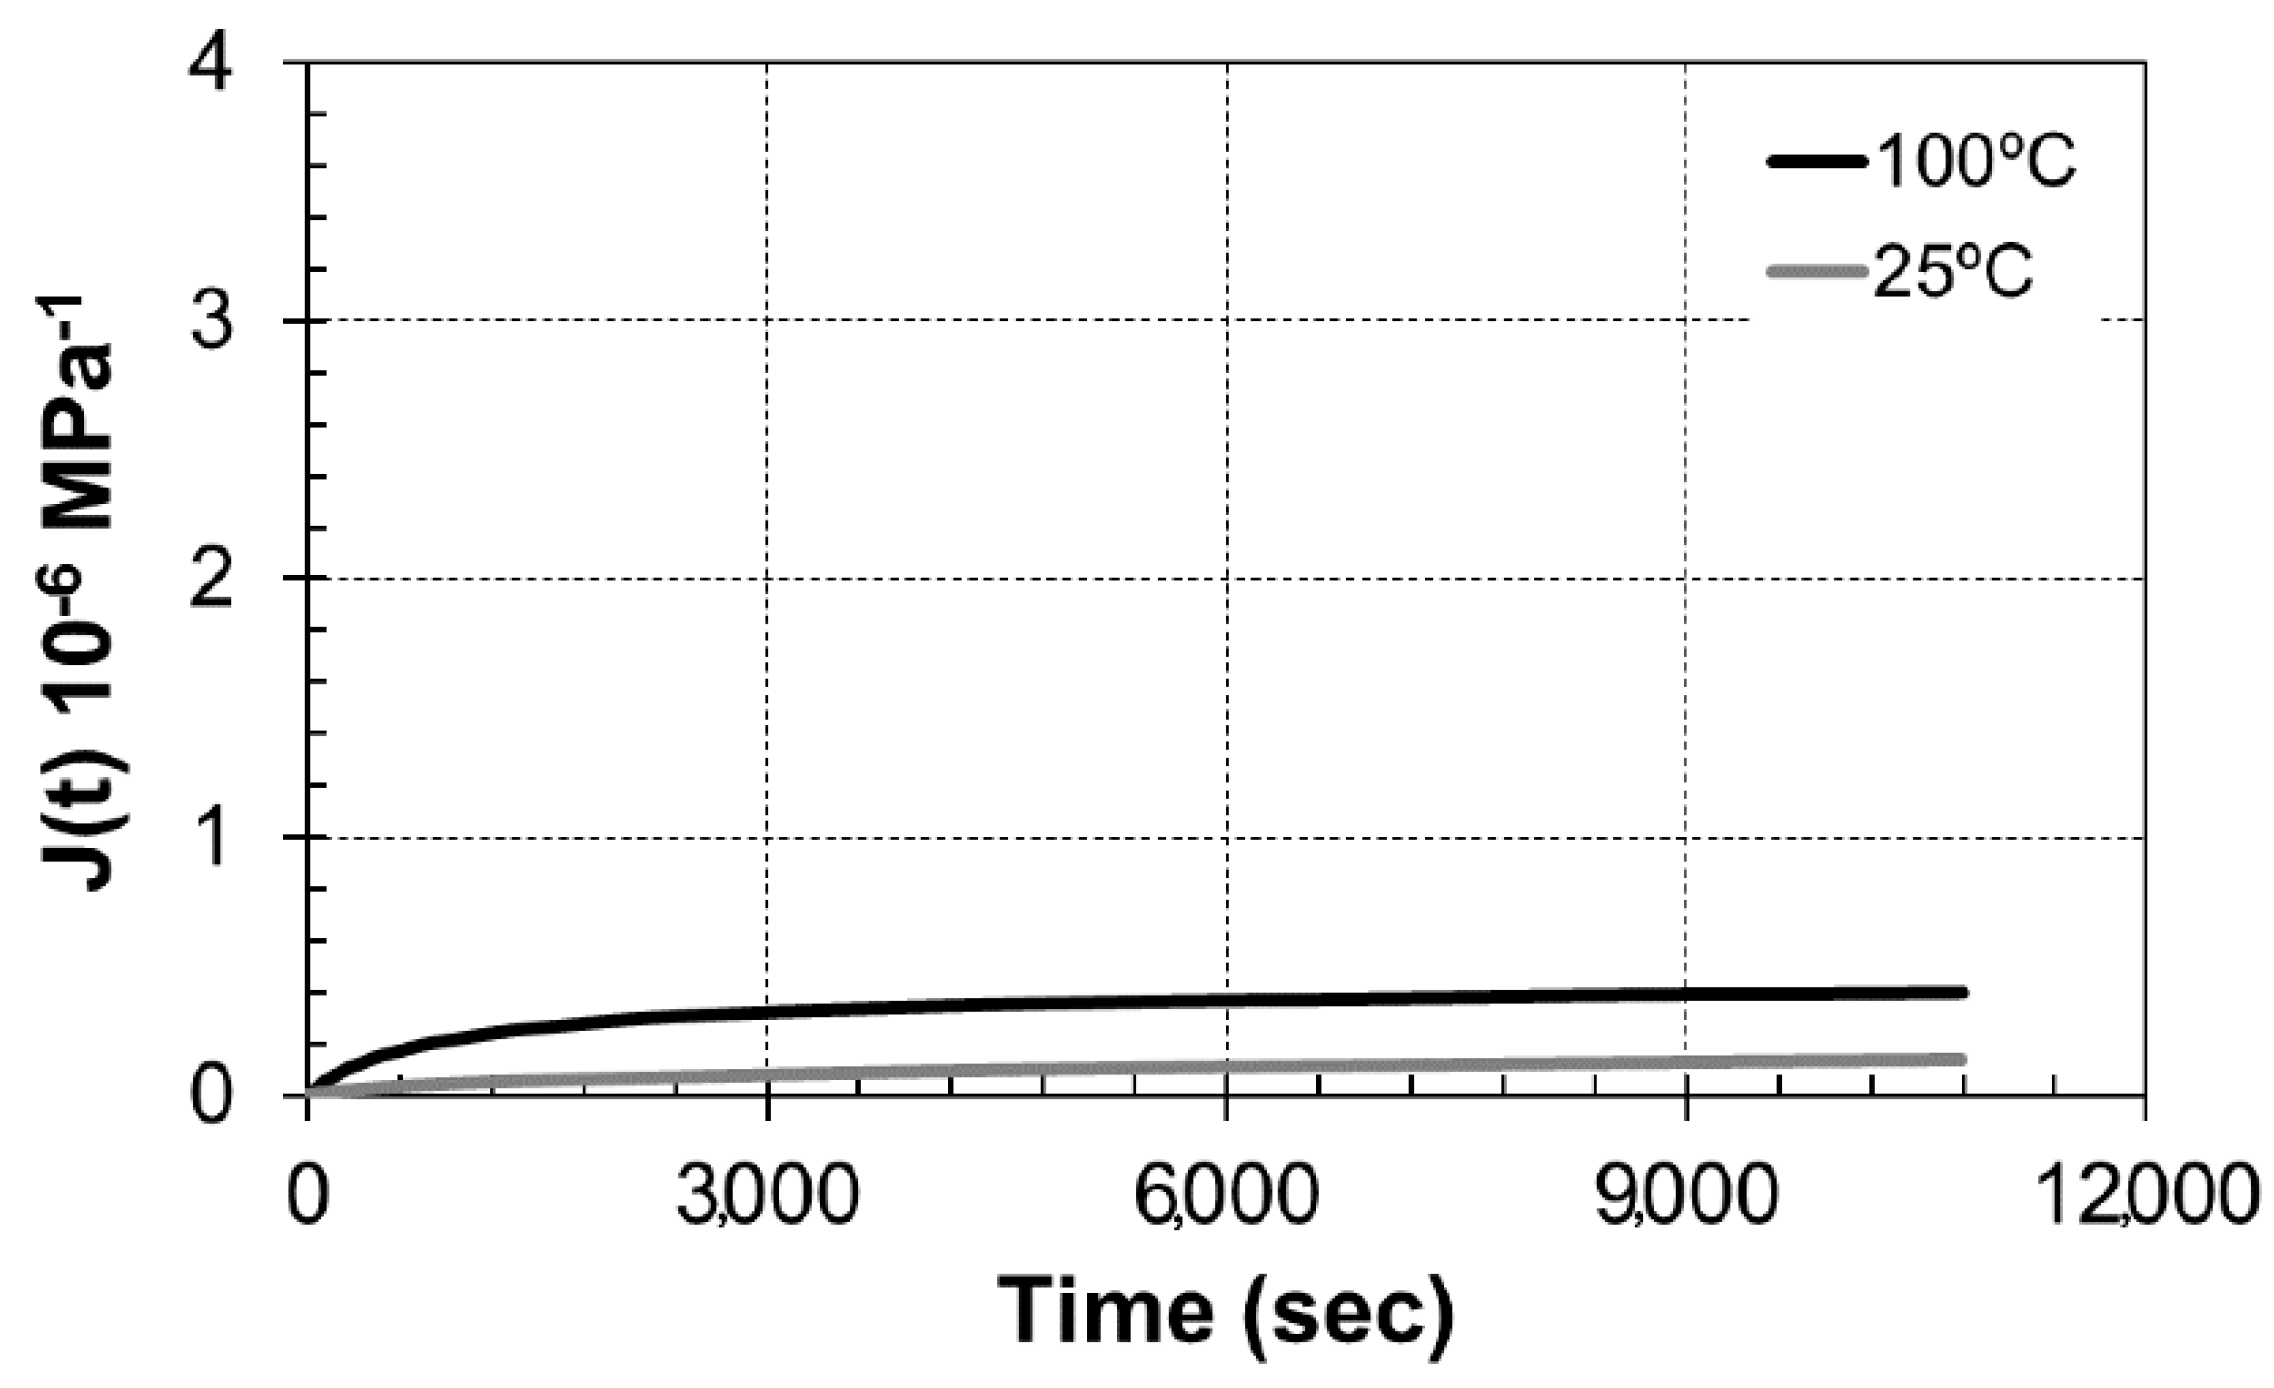
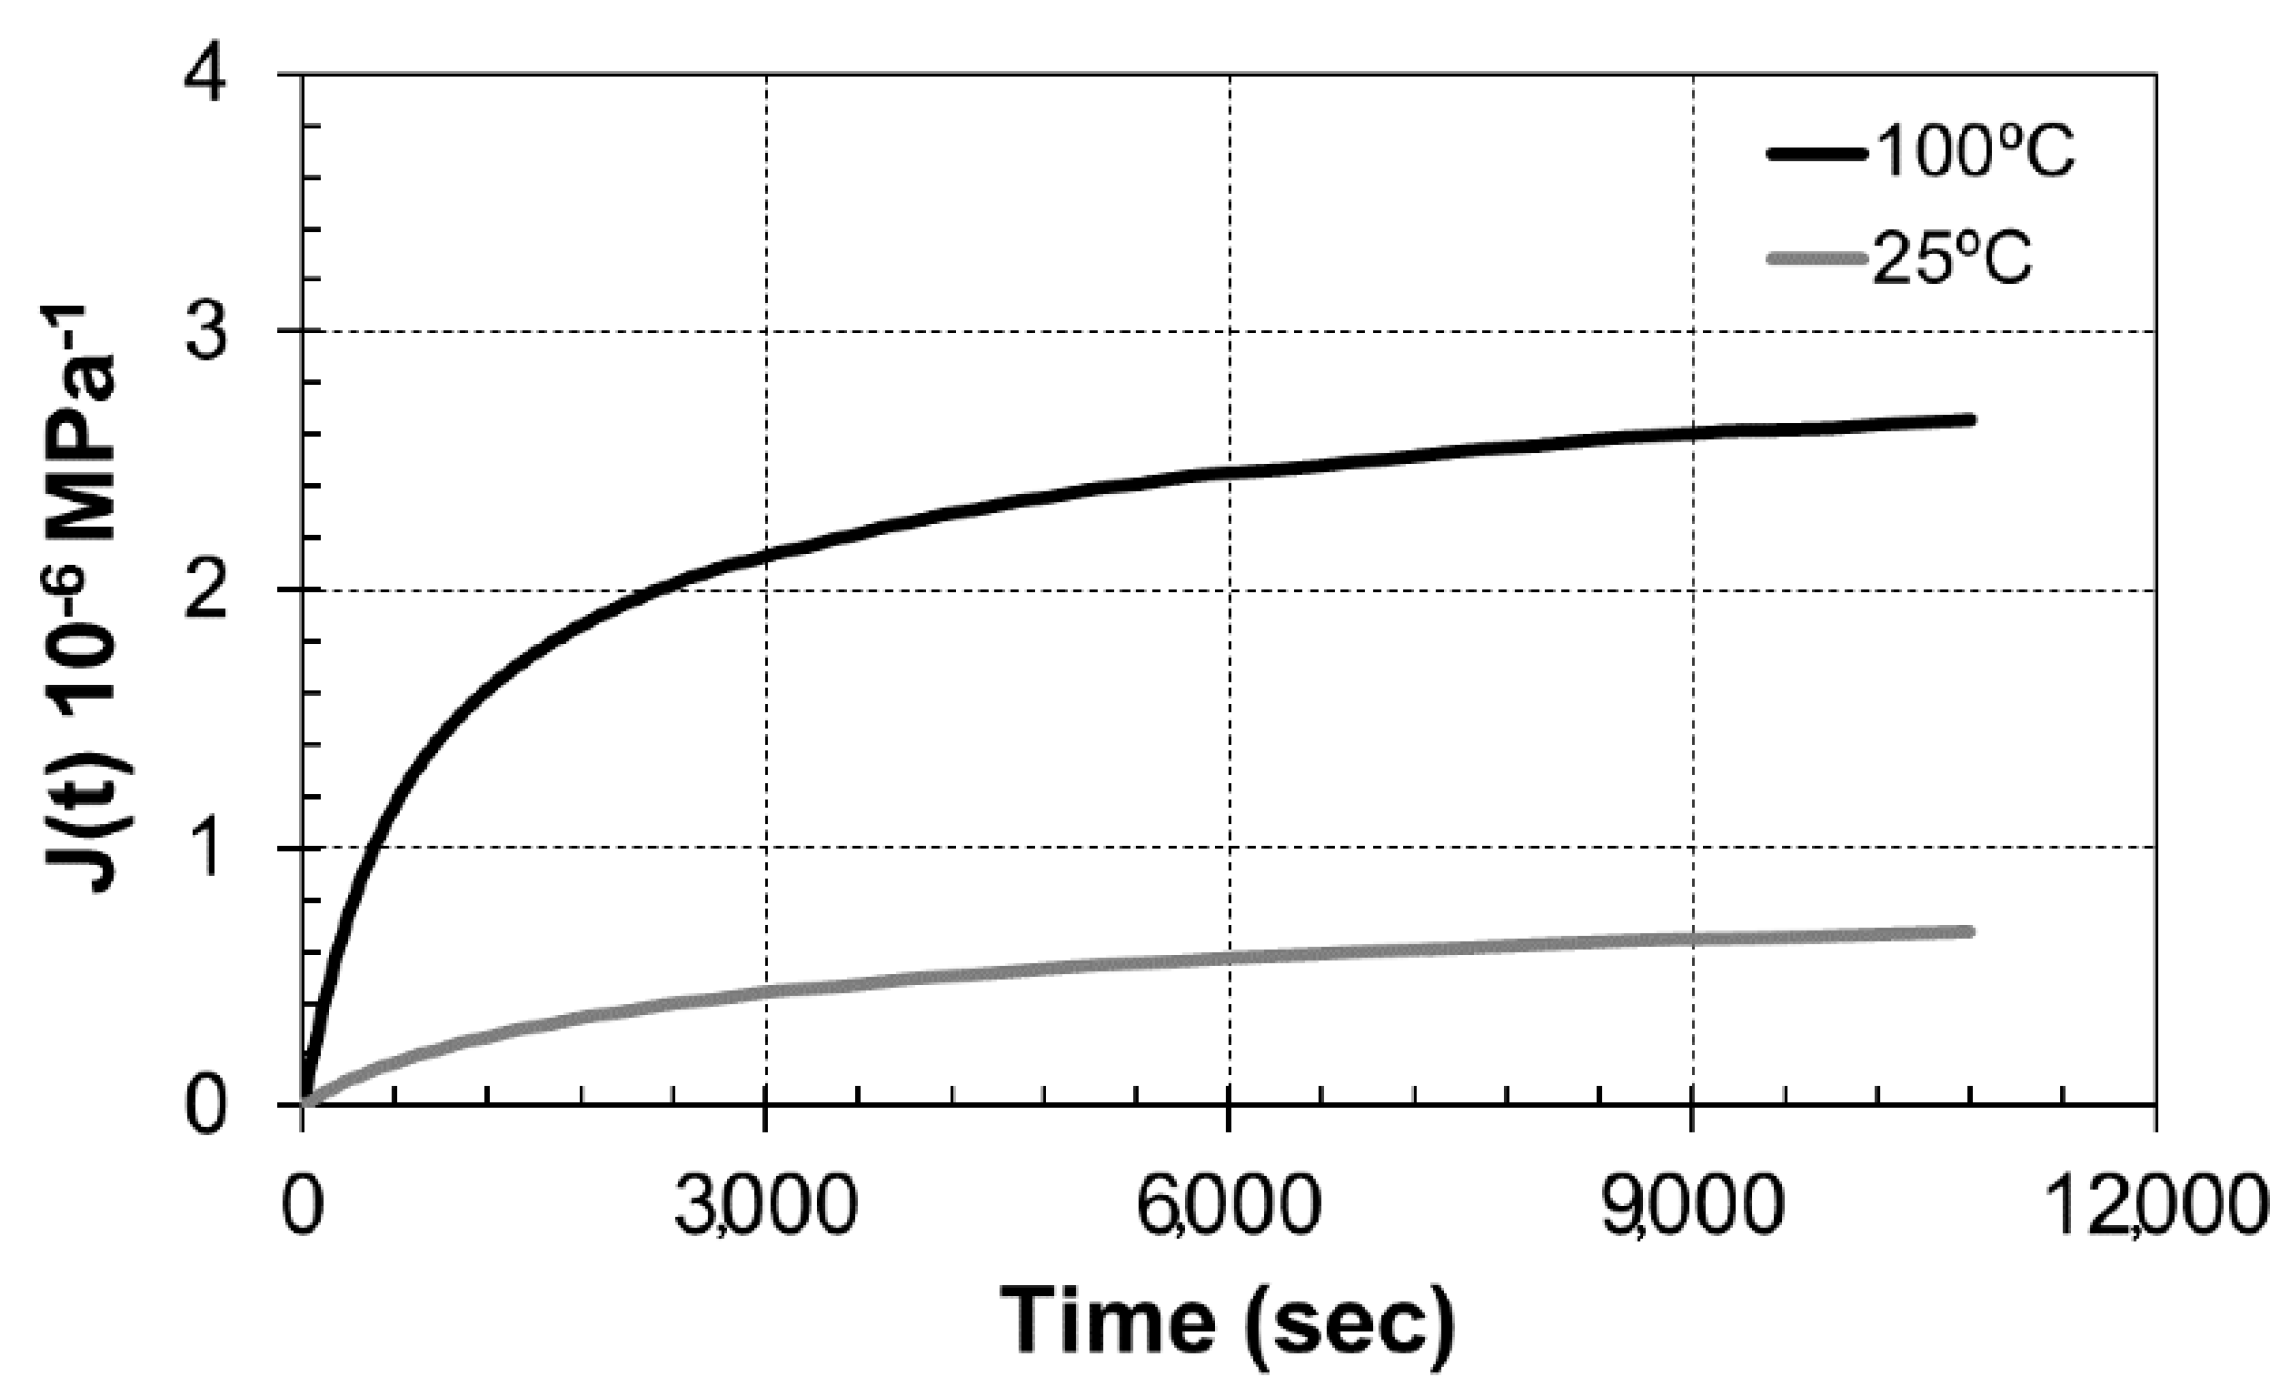
3.4.2. Creep Compliance

The TMA unit, operated at 25 °C and 100 °C (below Tg) and applying a 1.0 N constant load, allowed acquiring the creep compliance curves as a function of time, shown in Figure 19 and Figure 20. Clearly, the graphs showed that, as expected, at higher temperatures, when the mobility of the polymer chains increases, the creep deformation of the composites is also higher.

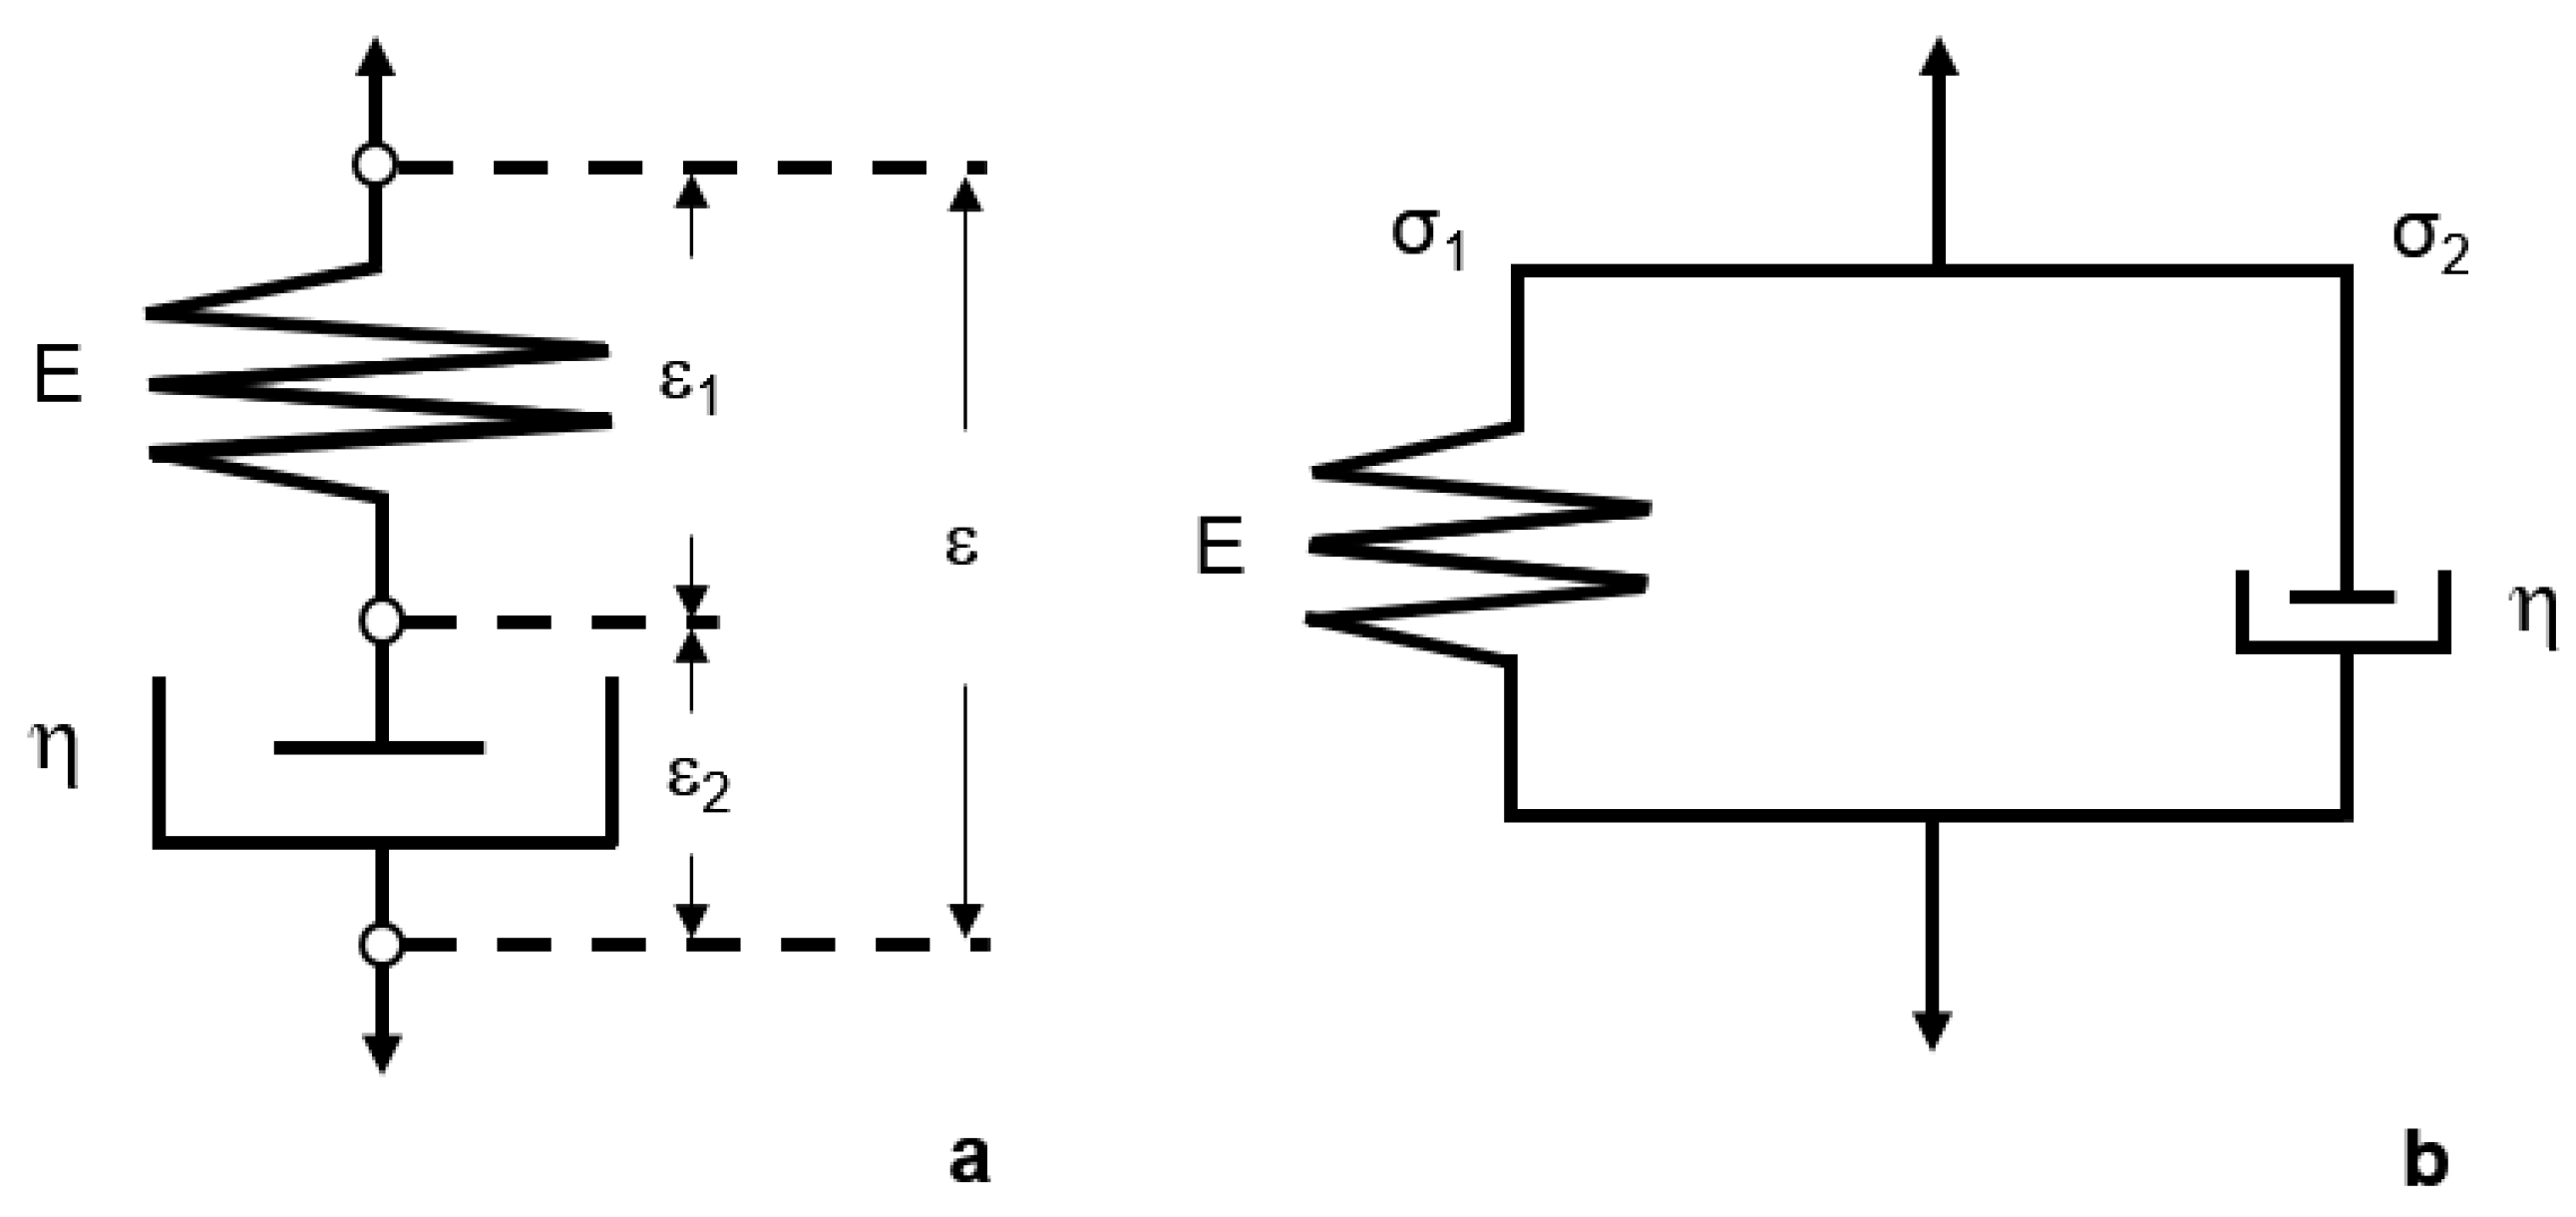
3.4.3. Creep Compliance: Burger Model

It is well known that viscoelastic behavior upon creep is modeled using springs and dashpot arranged in series or parallel to formulate different models. Relevant in biopolymeric applications, the Maxwell model consists of springs and dashpots connected in series [21], while the Kelvin–Voigt model a parallel arrangement of spring and dashpots [22], as shown in Figure 21. In our creep compliance analysis, we utilized the Burger’s model, which combines both according to Equation (2) [23].
ε = σ E 1 + σ E 2 [ 1 e ( E 2 × t η 2 ) ] + σ η 1 t
In Equation (2), ε represents the true strain, while σ is the true stress; E1 represents the elastic recovery and E2, the rubbery elasticity of the bio-composites. Also, η is the coefficient of viscosity of the bio-composites. The shear creep compliance J(t), which is important in polymers, is defined as the change in strain as a function of time under constant stress and is modeled following Equation (3) [23].
J ( t ) = ε 2 ( t ) ε 1 ( t ) σ 0
In Equation (2), ε is the strain as a function of time and σ 0 , the constant applied stress. One can then modify Equation (3) with Equation (2) to obtain Equation (4).
J = 1 E 1 + 1 E 2 [ 1 e ( E 2 × t η 2 ) ] + t η 1
The coefficients E1, E2, η1, and η2 in the Burger’s model allowed analyzing the viscoelastic behavior of the composites; they are shown in Table 1. At 100 °C, E1 for 0 wt. % STO nanoparticles were higher than for 20 wt. % STO nanoparticles, indicating that the instantaneous deformation was lower for the bio-composites without nanoparticles. In other words, the polymer-STO nanoparticles composites suffered more deformation under an applied load and temperature. Similarly, the E2 value for 0 wt. % STO nanoparticles presented higher creep deformation than those from the bio-composites bearing titanate nanoparticles with a higher permanent deformation. Conversely, the coefficients of viscosity (η1 and η2) were lower for the composites with STO nanoparticles, leading to more permanent creep strain. When η1 and η
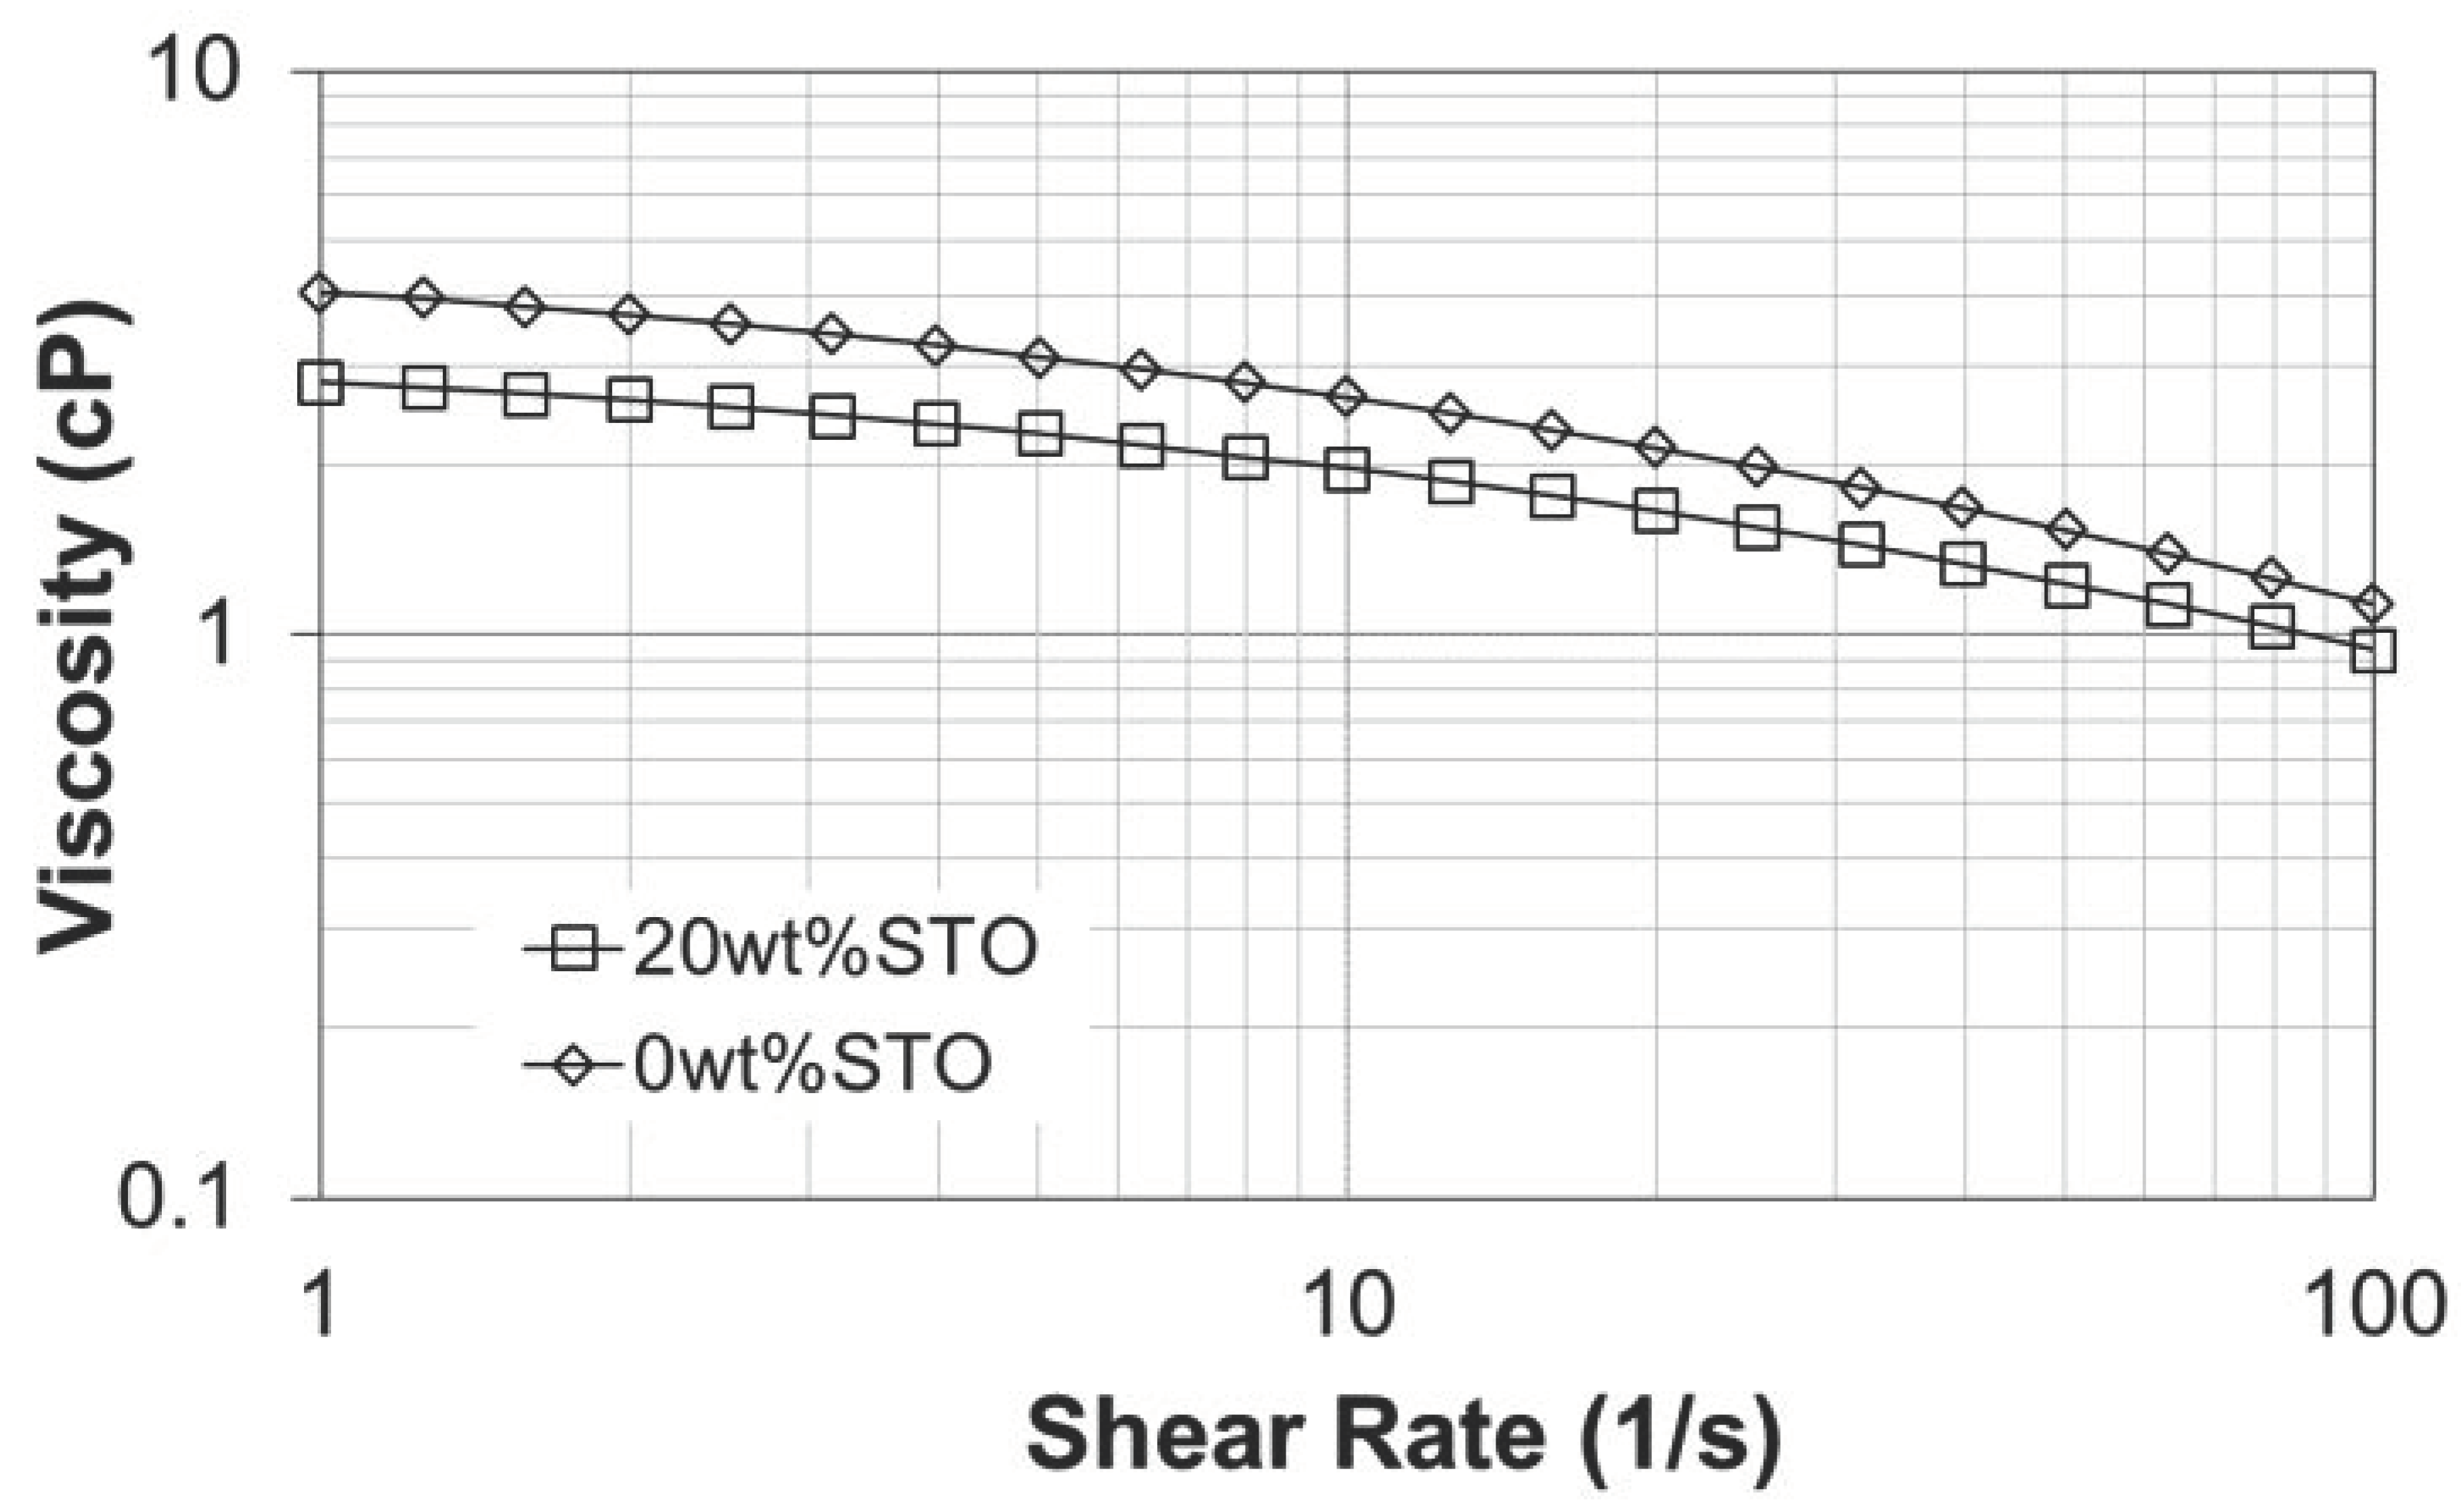
2 were compared, one observed that the coefficients of viscosity for the bio-composites containing 20 wt. % STO nanoparticles were lower than for the material without nanoparticles. This suggests that the viscous flow of the polymer chains is higher at 20 wt. % STO nanoparticles. When no STO nanoparticles are present, there is a reduction in the mobility of the polymer chains due to the higher viscosity. This result compelled us to analyze the viscosity of the solution.
To assess the viscosity effects on the creep deformation of the composites, we analyzed the viscosity of the solutions containing 20 wt. % STO and without STO. The results from Figure 22 suggest that the bio-composites containing 20 wt. % STO nanoparticles displayed less viscosity than those with 0 wt. % STO nanoparticles.
Recent studies demonstrated how the addition of nanoparticles could decrease the viscosity of a polymer solution. Tuteja et al. stated that the viscosity of the solution could be affected by the entanglement of the polymer chains, the interparticle half-gap and the morphology of the nanoparticles [24,25]. As the polymer chains are entangled, the available free volume increases reducing the viscosity of the composite. Similarly, the interparticle half-gap (h) and the radius of gyration (Rg) plays an essential role in the viscosity effect. When h is less than Rg, the viscosity values were lower due to the diffusion of the nanoparticles, which are larger than the polymer chains. Thus, the nanoparticles do not participate in the entanglement of the polymer chains; decreasing the viscosity of the solution. Additionally, only spherical particles (like the ones used in this research) can decrease the viscosity compared to other materials like nanoclays and carbon nanotubes due to their morphology [25].
As stated initially, we also studied the creep strain at 25 °C. At this temperature, the Burger’s model cannot predict the creep behavior of the composites. Contrary to the viscoelastic behavior observed at higher temperatures (with polymer chains mobility is affected by temperature), at 25 °C the elastic behavior is more explicit (dominant) than the viscous one.
Previous studies explored the diverse electrical characteristics of capacitors made using the bio-composite studied in this project to compare those capacitors with commercial ones [8,9]. Those findings proved that these types of bio-composites are suitable for a range of electronic devices. The present research expands those prior investigations by providing a comprehensive study of their mechanical and thermal properties of composite material. Furthermore, it addresses a critical query for electronic devices: their ability to handle mechanical stresses as well as high temperatures and aggressive corrosive environments. One must note that previously we found that higher levels of cellulose raised the water content, which is detrimental to the current density in the devices. In this present research, we furthered the study of these bio-composites to provide a better understanding of their mechanical and thermal properties. We are confident that the present detailed research combined with the wealth of information on ferroelectric bio-composites will lay the foundation for future research that uses this material to fabricate novel electronic devices [25,26].

4. Conclusions

The present investigation discusses mainly the mechanical behavior of cellulose-chitosan bio-composites reinforced with strontium titanate nanoparticles, prepared by sol-gel casting. The ensuing analysis revealed how those properties depended on the interaction between cellulose and the strontium titanate nanoparticles. This could have resulted from the water pick up induced by cellulose whereas the nanoparticles affected the interfacial matrix-reinforcements bonding. Furthermore, higher concentrations of acetic acid upon fabrication lowered the strength and altered the thermal degradation due to an increase in the water content.
The degradation studies corroborated that the composites are highly degraded in hydrochloric acid, even more so than in acetic acid solution or, naturally, water. The lower pH when the protonation of the anime groups occurs led likely to the formation of (NH+) groups raising the electrostatic repulsions between chains.
Furthermore, the creep studies of chitosan-cellulose and polymer-STO nanoparticles composites revealed that their creep compliance was more prominent at 100 °C. Additionally, when STO nanoparticles were present higher creep compliance occurred. This was attributed to the nanoparticles agglomeration that could have led to higher shear stresses and cracks propagating through the polymeric film at a slow velocity. For composites without nanoparticles, higher amounts of chitosan increased the brittleness of the composites due to the biopolymer’s characteristic high stiffness and resistance to deformation.
Based on the literature, the observed creep behavior of the composites below the glass transition temperature and ensuing viscosity reduction can be attributed to the interaction of the nanoparticles with the polymer chains. Apparently, the nanoparticles did not participate in the entanglement of the polymer chains, reducing the viscosity of the solution upon fabrication.
In closing, this research provides an unsophisticated approach to manufacture flexible and bio-compatible electronics with tunable capabilities made of bio-composites containing strontium titanate nanoparticles. In short, this present project involves a thorough study of the thermal and mechanical properties of bio-composites containing ferroelectric nanoparticles that serve as a groundwork for novel environmentally friendly electronic devices.

Author Contributions

Conceptualization, A.D.-V. and O.M.S.; methodology, investigation, and formal analysis, A.D.-V. and S.C.-M.; writing—original draft preparation, A.D.-V. and S.C.-M.; writing—review and editing, N.S.-R. and O.M.S.; supervision, project administration, funding acquisition, O.M.S.

Funding

This work was supported by the US National Science Foundation under grant No. 0833112 and 1345156 (Centers for Research Excellence in Science and Technology program).

Acknowledgments

The authors would also like to thank the invaluable assistance of the technical personnel of the Materials Laboratories of the University of Puerto Rico-Mayaguez. The administrative support provided by the personnel of the Nanotechnology Center is kindly acknowledged.

Conflicts of Interest

The authors declare no conflict of interest.

References

  1. Shukla, S.K.; Mishra, A.K.; Arotiba, O.A.; Mamba, B.B. Chitosan-based nanomaterials: A state-of-the-art review. Int. J. Biol. Macromol. 2013, 59, 46–58. [Google Scholar] [CrossRef]
  2. Cheba, B.A. Chitin and Chitosan: Marine Biopolymers with Unique Properties and Versatile Applications. J. Biotechnol. Biochem. 2011, 6, 149–153. [Google Scholar]
  3. Hosokawa, J.; Nishiyama, M.; Yoshihara, K.; Kubo, T.; Terabe, A. Reaction between Chitosan and Cellulose on Biodegradable Composite Film Formation. Ind. Eng. Chem. Res. 1991, 30, 788–792. [Google Scholar] [CrossRef]
  4. Declet, A.; Reyes, E.; Suárez, O.M. Calcium carbonate precipitation: A review of the carbonate crystallization process and applications in bioinspired composites. Rev. Adv. Mater. Sci. 2016, 44, 87–107. [Google Scholar]
  5. Celebi, H.; Kurt, A. Effects of Processing on the Properties of Chitosan/Cellulose Nanocrystal Films; Elsevier Ltd.: New York, NY, USA, 2015. [Google Scholar] [CrossRef]
  6. Ibrahim, M.S.; Sapuan, S.M.; Faieza, A.A. Mechanical and Thermal Properties of Composites from Unsaturated Polyester Filled with Oil Palm Ash. J. Mech. Eng. Sci. 2012, 2, 133–147. [Google Scholar] [CrossRef]
  7. Yang, J.-L.; Zhang, Z.; Schlarb, A.K.; Friedrich, K. On the characterization of tensile creep resistance of polyamide 66 nanocomposites. Part II: Modeling and prediction of long-term performance. Polymer 2006, 47, 6745–6758. [Google Scholar] [CrossRef]
  8. Declet-Vega, A.; Sepúlveda-Ramos, N.; Martínez-Santos, J.; Suárez, O.M. Study of electrical properties of biocomposites containing ferroelectric nanoparticles. J. Compos. Mater. 2017, 51, 1979–1985. [Google Scholar] [CrossRef]
  9. Declet-Vega, A.; Sepúlveda-Ramos, N.; Suárez, O.M. On the Mechanical and Dielectric Properties of Biocomposites Containing Strontium Titanate Particles. In Ferroelectrics and Their Applications; Irzaman, H., Ed.; IntechOpen: London, UK, 2018; pp. 73–88. [Google Scholar]
  10. Mazeau, K. The hygroscopic power of amorphous cellulose: A modeling study. Carbohydr. Polym. 2015, 117, 585–591. [Google Scholar] [CrossRef]
  11. Ping, Z.; Nguyen, Q.; Chen, S.; Zhou, J.; Ding, Y. States of water in different hydrophilic polymers—DSC and FTIR studies. Polymer 2001, 42, 8461–8467. [Google Scholar] [CrossRef]
  12. Azevedo, E.P. Aldehyde-Functionalized Chitosan and Cellulose: Chitosan Composites: Application as Drug Carriers and Vascular Bypass Grafts. Univ. Iowa Res. 2011. Available online: http://ir.uiowa.edu/etd/1119%0ARecommended (accessed on 1 March 2016).
  13. Strnad, S.; Sauperl, O.; Fras-Zemljic, L. Cellulose Fibres Funcionalised by Chitosan: Characterization and Application. In Biopolymers; Elnashar, M., Ed.; InTechOpen: London, UK, 2010; pp. 181–200. [Google Scholar]
  14. Jamil, M.S.; Ahmad, I.; Abdullah, I. Effects of Rice Husk Filler on the Mechanical and Thermal Properties of Liquid Natural Rubber Compatibilized High-Density Polyethylene/Natural Rubber Blends. J. Polym. Res. 2006, 13, 315–321. [Google Scholar] [CrossRef]
  15. Lee, H.S.; Yee, M.Q.; Eckmann, Y.Y.; Hickok, N.J.; Eckmann, D.M.; Composto, R.J. Reversible swelling of chitosan and quaternary ammonium modified chitosan brush layers: Effects of pH and counter anion size and functionality. J. Mater. Chem. 2012, 22, 19605–19616. [Google Scholar] [CrossRef]
  16. Miller-Chou, B.A.; Koenig, J.L. A review of polymer dissolution. Prog. Polym. Sci. 2003, 28, 1223–1270. [Google Scholar] [CrossRef] [Green Version]
  17. Davidson, R. Polymer Degradation Studies by FTIR. Prog. Pac. Polym. Sci. 1992, 2, 101–111. [Google Scholar]
  18. Herna, A.; Herna, J.; Sa, J. fractional Maxwell model. Polym. Test. 2002, 21, 325–331. [Google Scholar]
  19. Pupure, L.; Varna, J.; Joffe, R. Methodology for macro-modeling of bio-based composites with inelastic constituents. Compos. Sci. Technol. 2018, 163, 41–48. [Google Scholar] [CrossRef]
  20. Rath, A.; Mathesan, S.; Ghosh, P. Nanomechanical characterization and molecular mechanism study of nanoparticle reinforced and cross-linked chitosan biopolymer. J. Mech. Behav. Biomed. Mater. 2015, 55, 42–52. [Google Scholar] [CrossRef]
  21. Guessasma, S.; Sehaki, M.; Lourdin, D.; Bourmaud, A. Viscoelasticity properties of biopolymer composite materials determined using finite element calculation and nanoindentation. Comput. Mater. Sci. 2008, 44, 371–377. [Google Scholar] [CrossRef]
  22. Plaseied, A.; Fatemi, A. Tensile Creep and Deformation Modeling of Vinyl Ester Polymer and Its Nanocomposite. J. Reinf. Plast. Compos. 2009, 28, 1775–1788. [Google Scholar] [CrossRef]
  23. Tuteja, A.; Mackay, M.E.; Hawker, C.J.; Van Horn, B. Effect of ideal, organic nanoparticles on the flow properties of linear polymers: Non-einstein-like behavior. Macromolecules 2005, 38, 8000–8011. [Google Scholar] [CrossRef]
  24. Tuteja, A.; Duxbury, P.M.; Mackay, M.E. Multifunctional Nanocomposites with Reduced Viscosity. Macromolecules 2007, 40, 9427–9434. [Google Scholar] [CrossRef]
  25. Neagu, A.M.; Curecheriu, L.P.; Cazacu, A.; Mitoseriu, L. Impedance Analysis and Tunability of BaTiO3–Chitosan Composites: Towards Active Dielectrics for Flexible Electronics. Compos. Part. B 2014, 66, 109–116. [Google Scholar] [CrossRef]
  26. Kannan, B.R.; Kalidhasan, S.; Krishna Kumar, A.S.; Rajesh, N.; Venkataraman, B.H. An Integrated Use of Biopolymer-Ceramic Composites Towards Capacitor and Environmental Application. Polym.-Plast. Technol. Eng. 2014, 53, 626–630. [Google Scholar] [CrossRef]
Figure 1. Thermogravimetric analyzer (TGA) analysis for bio-composites made of 1.5 v% chitosan and 0.5 v% and 1.0 v% cellulose using 1.25 v% of acetic acid.
Jcs 03 00007 g001
Figure 2. TGA analysis for bio-composites made of 1.5 v% chitosan/0.5 v% cellulose considering 1.25 v% and 2.50 v% of acetic acid.
Jcs 03 00007 g002
Figure 3. Ultimate tensile strength of bio-composites made of 1.5 v% chitosan/(0.5 v% and.1.0 v%) cellulose and 1.25 v% of acetic acid.
Jcs 03 00007 g003
Figure 4. Ultimate tensile strength of bio-composites made of 1.5 v% chitosan/0.5 v% cellulose fabricated with 1.25 v% and 2.50 v% of acetic acid.
Jcs 03 00007 g004
Figure 5. Absorbed mass as a function of time for bio-composites made of chitosan, cellulose, and STO nanoparticles and degraded in hydrochloric acid solution (pH 3.3).
Jcs 03 00007 g005
Figure 6. Absorbed mass as a function of time for bio-composites made of chitosan, cellulose, and STO nanoparticles, degraded in acetic acid solution (pH 4.1).
Jcs 03 00007 g006
Figure 7. Absorbed mass as a function of time for bio-composites made of chitosan, cellulose and STO nanoparticles, degraded in water (pH 6.5).
Jcs 03 00007 g007
Figure 8. Polymer chains under different pH values: (a) pH 7.0; (b) pH 4.0 [15].
Jcs 03 00007 g008
Figure 9. Dry mass for bio-chitosan/cellulose composites reinforced with STO nanoparticles.
Jcs 03 00007 g009
Figure 10. Dissolution rate constant kdis for bio-composites made of chitosan, cellulose, and STO nanoparticles.
Jcs 03 00007 g010
Figure 11. (a) Fourier transform infrared spectra for bio-composites made of 25 v% of cellulose exposed to HCl solution with 0 wt. % STO; (b) 20 wt. %.
Jcs 03 00007 g011
Figure 12. (a) Fourier transform infrared spectra for bio-composites made of 25 v% of cellulose in HCl solution with 0 wt. % STO; (b) 20 wt. %.
Jcs 03 00007 g012
Figure 13. Tensile analysis for degraded bio-composites made of 15 v% and 25 v% of cellulose in hydrochloric acid solution.
Jcs 03 00007 g013
Figure 14. Tensile analysis for degraded bio-composites made of 15 v% and 25 v% of cellulose in hydrochloric acid solution.
Jcs 03 00007 g014
Figure 15. Creep strain as a function of time for a nanocomposite made of 15 v% cellulose and 0 wt. % STO nanoparticles.
Jcs 03 00007 g015
Figure 16. Creep strain as a function of time for a nanocomposite made of 15 v% cellulose and 20 wt. % STO nanoparticles.
Jcs 03 00007 g016
Figure 17. Creep rate as a function of time for a nanocomposite made of 15 v% cellulose and 0 wt. % STO nanoparticles.
Jcs 03 00007 g017
Figure 18. Creep rate as a function of time for a nanocomposite made of 15 v% cellulose and 20 wt. % STO nanoparticles.
Jcs 03 00007 g018
Figure 19. Creep compliance as a function of time for a nanocomposite made of 15 v% cellulose and 0 wt. % STO nanoparticles.
Jcs 03 00007 g019
Figure 20. Creep compliance as a function of time for a nanocomposite made of 15 v% cellulose and 20 wt. % STO nanoparticles.
Jcs 03 00007 g020
Figure 21. (a) Maxwell model and (b) Kelvin–Voigt model.
Jcs 03 00007 g021
Figure 22. Viscosity study of bio-composites made with 15 v% cellulose containing 0 wt. % STO and 20 wt. % STO nanoparticles.
Jcs 03 00007 g022
Table 1. Burger coefficients for the bio-composites without STO nanoparticles and containing 20 wt. % STO nanoparticles.
Bio-CompositeTemperatureE1 (Pa−1)E2 (Pa−1)η1 (Pa−1)η2 (Pa−1)
without STO100 °C4.64.8239,4604330
with STO100 °C2.02.1132,8701540

