Article

Influence of the Reaction Injection Moulding Process on the Thermomechanical Behaviour of Fast Curing Polyurethane

by
Peter Lehmenkühler
1,2,* and
Markus Stommel
2,3,4
1
Chair of Plastics Technology, TU Dortmund University, Leonhard-Euler-Str. 5, D-44227 Dortmund, Germany
2
RIF Institut für Forschung und Transfer e.V., D-44227 Dortmund, Germany
3
Institute of Polymer Materials, Leibniz-Institut für Polymerforschung Dresden e.V., Hohe Str. 6, D-01069 Dresden, Germany
4
Faculty Mechanical Engineering, Institute of Material Science, Technical University Dresden, D-01062 Dresden, Germany
*
Author to whom correspondence should be addressed.
J. Manuf. Mater. Process. 2022, 6(3), 53; https://doi.org/10.3390/jmmp6030053
Submission received: 8 March 2022 / Revised: 1 April 2022 / Accepted: 28 April 2022 / Published: 3 May 2022

Abstract

:
In this contribution, the influence of the reaction injection moulding process on the thermomechanical material behaviour of aliphatic hexamethylene diisocyanate (HDI) based fast curing polyurethane is demonstrated. Uniaxial tensile tests, temperature-frequency dependent dynamic mechanical thermal analysis (DMTA) and Differential Scanning Calorimetry (DSC) are used to show the differences in properties for ten different sets of process parameters. The mould and resin components temperature, the mass flow during the filling process and the residence time during the reaction process of the polyurethane are varied in several stages. Further experiments to determine the molar mass of the molecular chain between two crosslinking points of the polyurethane are used to explain the process influences on the thermomechanical properties. Thus, a direct correlation between manufacturing and material properties is shown. In addition, the mutual effect of the different parameters and their overall influence on the material behaviour is presented.

1. Introduction

With the increasing demand for coated injection moulded parts, by combining thermoplastic injection moulding with reaction injection moulding (RIM), two-component injection moulding has been developed to reduce the overall process time and improve the hybrid structure. Through this combination technique, injection-moulded components can be directly coated with a reactive polyurethane layer by using modern tools without transferring the thermoplastic components to a second tool for the coating process [1,2,3,4]. In the RIM, the components of the polyurethane, polyol and polyisocyanate, which are initially stored separately, are injected into a cavity under pressure. Depending on the material chemistry and expected reaction, the resin is injected with a specific mixing ratio into the cavity via a unique mixing head. The two components react and form the urethane group during the polyaddition process [2,5,6,7].
Varying injection moulding process parameters can strongly influence the properties of produced thermoplastic components. In recent decades, the influences of the process variables on thermoplastics are studied in detail [8]. Typical material property influencing process-related parameters are the temperature of the mould cavity, the melt temperature, the injection pressure, the packing pressure, the holding pressure, the filling speed, the cooling time, and the cycle time [9,10,11,12]. Both Kalay et al. and Leyva-Porras et al. show for PP and LDPE, respectively, that a high mould temperature favours a high modulus of elasticity, while a too high melt temperature reduces it [13,14].
For elastomeric polyurethanes, especially manufactured by the RIM process, there are currently only a few experimental studies on the process parameter influence on mechanical properties. Nishimura et al. show the influence of the injection speed on the mechanical properties and the glass transition temperature. A higher speed slightly lowers the glass transition temperature [6].
Besides that, extensive studies have been carried out on the process influence on thermoplastic polyurethane (TPU) that can be taken into account [2,15,16,17,18]. As with other thermoplastics, injection moulded TPU is influenced by mould and melt temperatures as well as process times. In addition, a high mould temperature favours the mechanical properties and a long cycle time reduces them [17]. Furthermore, a high injection pressure increases the mechanical properties of TPU [15,18]. Investigations of polyurethanes regarding the process influences are also detailed carried out in the literature on polyurethane foams. Contrary to the processing of thermoplastics, the injection moulding process is not used here but the RIM process. Particular attention is paid to the foam structure, including the pore structure [5,19,20]. Here, it can be seen that a higher mould temperature favours the number of pores and thus reduces the density, thermal and mechanical properties [13,20]. Löhner confirms this influence and also shows in his investigations the influence of the volume flow of the polyurethane mixture and the influence of the component temperature of polyol and polyisocyanate during the injection. The Young’s Modulus of the material increases with the increase of the resin components temperature, whereas it is reduced with increasing material volume flow [19]. In addition to the process parameters analogous to injection moulding, there is also an influence of the injection speed of the blow agent, which determines the number of cavities. A high number of cavities has a considerable influence on the thermomechanical properties of polyurethane foam [5,19,20].
In this work, the authors show the influence of reaction injection moulding process parameters on a fast curing polyurethane cast elastomer. Especially for fast curing elastomeric polyurethane systems, no state of the research is known to the author. Moreover, no relevant publications of process dependent material properties of non-foam polyurethanes have been found. The relevant influence of process parameters has to be investigated before manufacturing functional components. If the polyurethane serves as a surface finish or as a functional part of the later component, the change in thermomechanical properties has to be taken into account. A slight reduction of the materials properties could lead to an error in case of exploited dimensioning of the component.
Different parameters are considered based on the above-described process influences plastic materials within the injection moulding process, including TPU, PU foams, and especially in the RIM process. In this case, they are varied within the recommended specifications range of the supplier. This is followed by the mechanical and thermal investigation of the materials using uniaxial tension, dynamic mechanical, thermal analysis (DMTA) and dynamic differential scanning calorimetry (DSC).
The authors will show that known process parameters for the injection moulding of thermoplastics; in particular, TPU and polyurethane foams can be transferred to the reaction injection moulding of fast curing highly crosslinked polyurethanes which contain no crystallinity, leading to a qualitative change in the material properties. Furthermore, a direct dependency of the process parameters of the RIM to the crosslinking will be shown, attributing the molecular mass between the crosslinking points (Mc). It will be worked out which parameters are transferable from foams and which must apply specifically to fast curing polyurethanes.

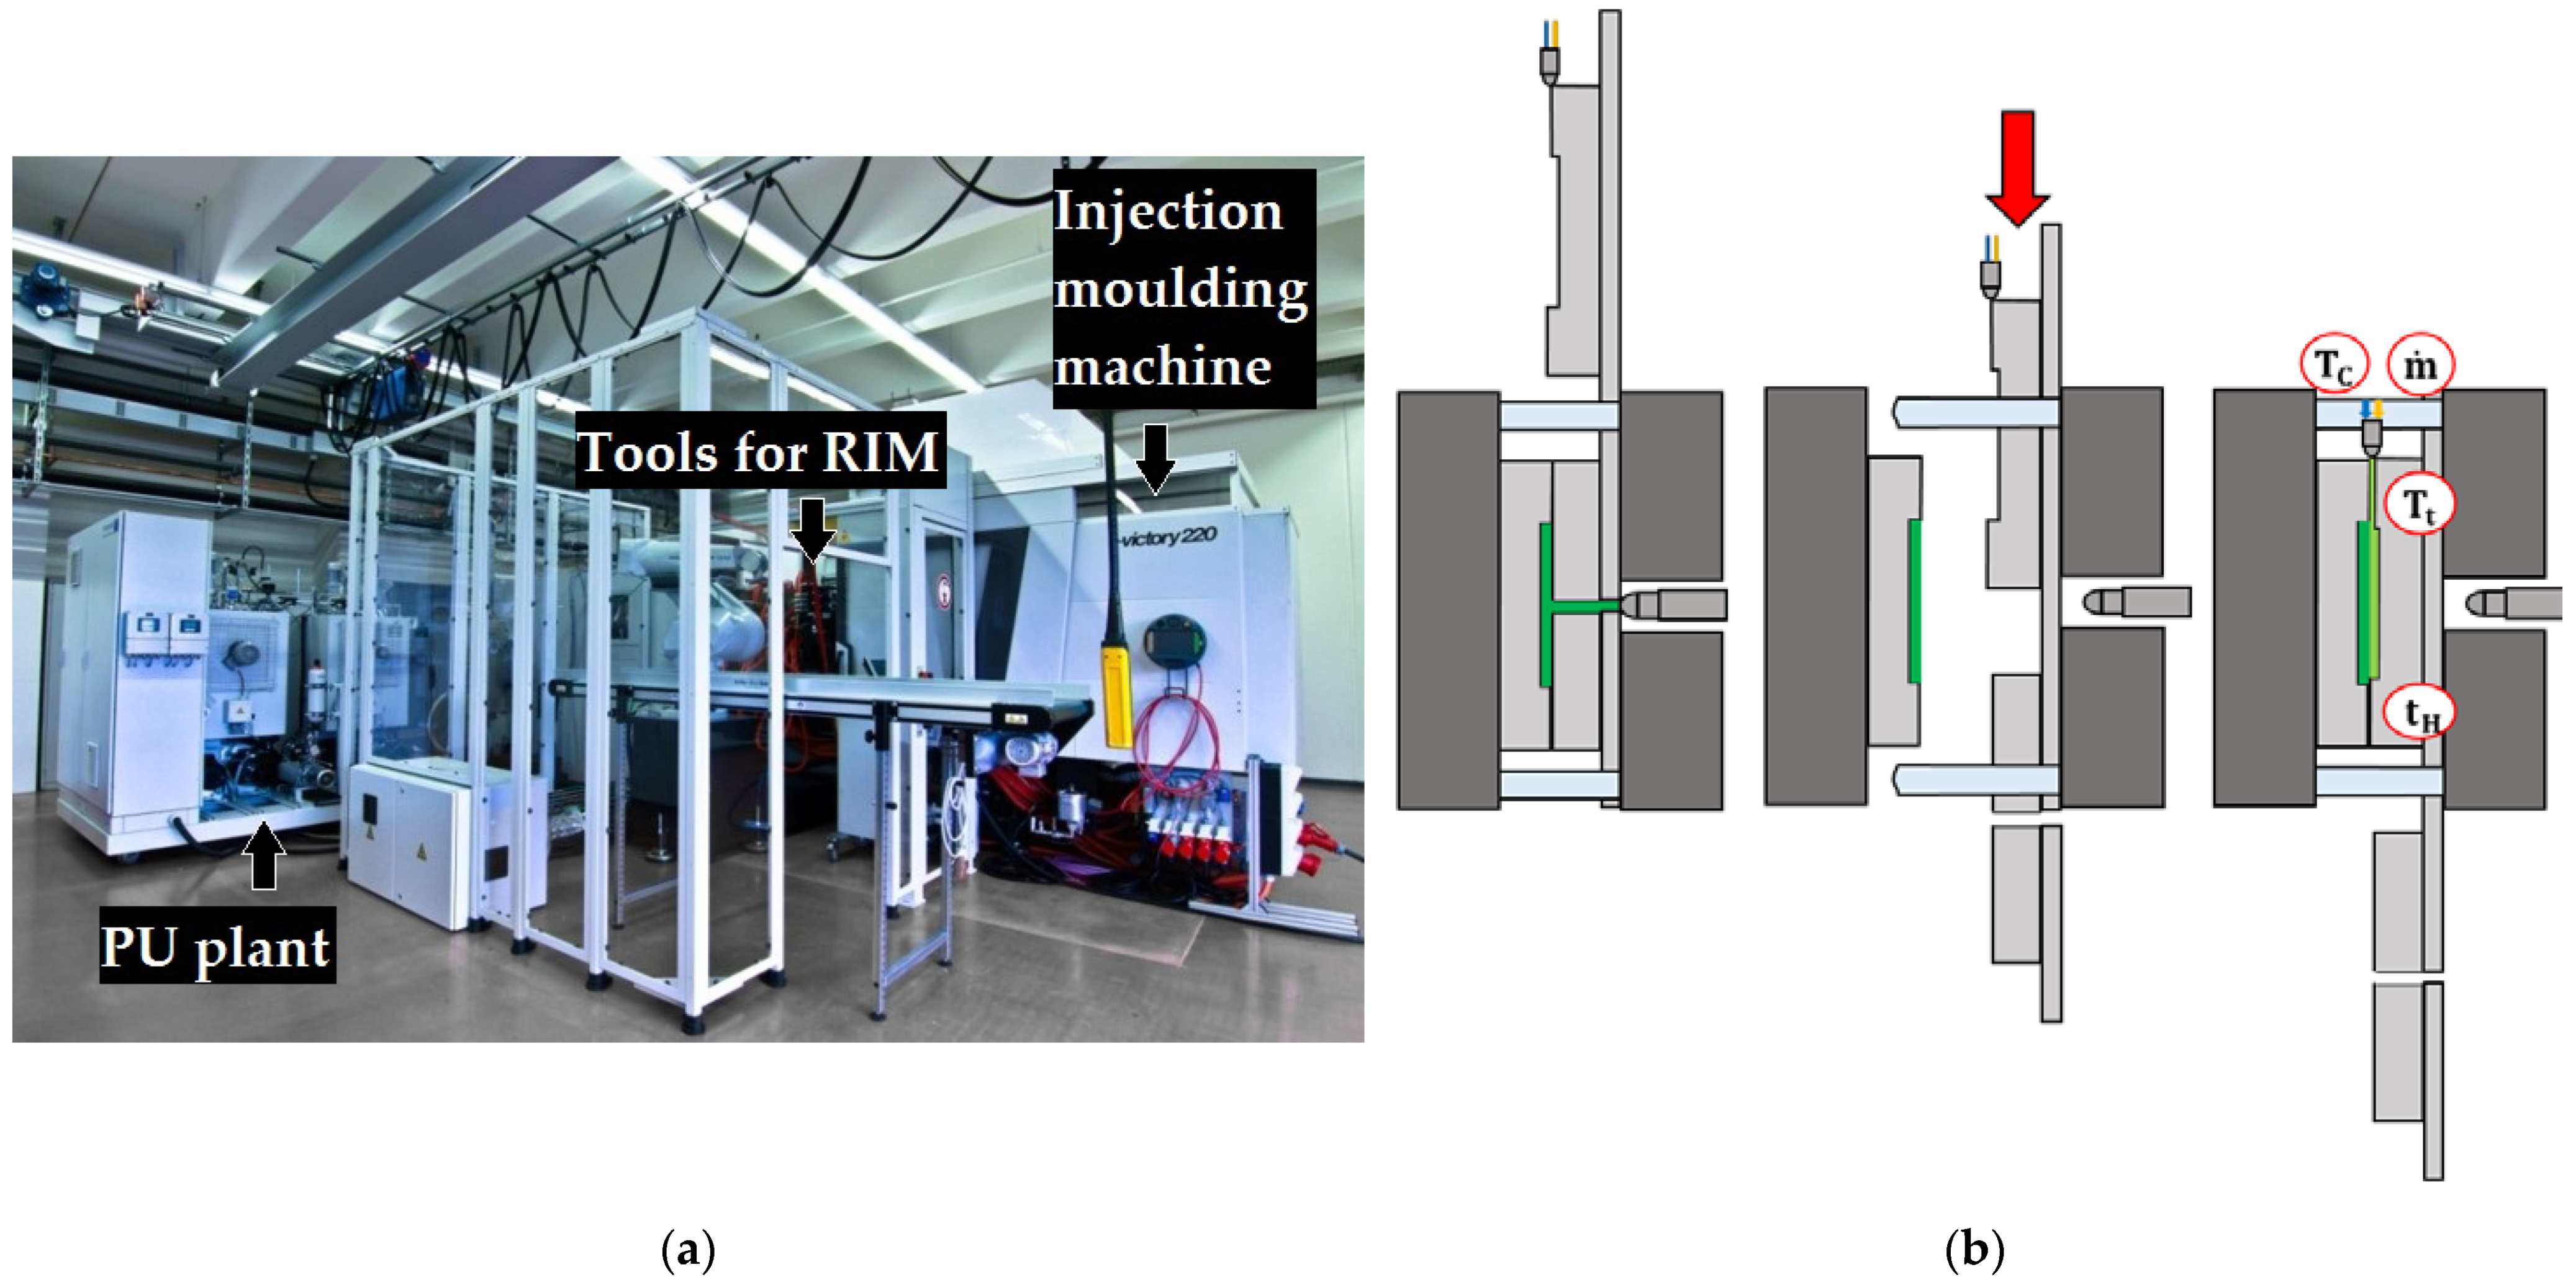
2. Materials and Methods

The polyurethane casting elastomer puroclear® from Rühl Puromer AG (Friedrichsdorf, Germany) was used to investigate the process influence on the material behaviour of fast curing polyurethane. The polyurethane system is based on an aliphatic hexamethylene diisocyanate (HDI) and a butanediol, which are used in a mixing ratio of 2.3 to 1. The fully transparent material is suitable for hand potting (gelation time < 20 s) and machine potting using RIM. In the RIM process, the samples are injected under high pressure into a plate-shaped cavity with dimensions of 100 mm × 30 mm × 1 mm (length, width, thickness) using the injection moulding machine of the type Engel e victory 220 (Schwertberg, Austria) and the mixing system of the type Hennecke Streamline 65 (Sankt Augustin, Germany). Both the PU plant and the injection moulding machine are shown in Figure 1a. The tooling and the manufacturing process for the plate-shaped samples is schemed in Figure 1b. In summary, the whole tool consists of three moulds. The first is a fixed mould at the ejector side of the injection moulding machine (left side). At the right side, two different moulds for the nozzle side are shown at Figure 1b. The first two moulds are needed to manufacture a thermoplastic plate (dark green), which stays in the mould after the manufacturing. After cooling the thermoplastic part, the injection moulding tool opens and the mould at the nozzle side is slid away afterwards. The new mould for the polyurethane coating (light green) is then aligned to the tool at the ejector side and the mould is closed again [2,3,4,7]. In the final step, the polyurethane is injected into the third mould and forms a coating on top of the thermoplastic. In this specific case, the mentioned plate-shaped cavity for the specimens is ensured using a core, which substitutes the thermoplastic only at this place. Here, the polyurethane is manufactured without a thermoplastic base material.
Specimens for the DMTA and tensile test are milled out from the polyurethane plates. Afterwards, all test specimens are stored at standard climatic conditions until they are completely saturated. This needs to be done in order to prevent the mechanical properties of different process variants from being influenced by different saturated conditions. For this purpose, the samples are gravimetrically analyzed at regular intervals. After 14 days, no further increase in weight can be observed.
The process variables chosen within the Design of Experiment (DoE) were the mould temperature ( T t ), the residence time of the polyurethane reaction ( t H ), the mass flow of the polyurethane mixture ( m ˙ ) , and the component temperature of both the polyol and the isocyanate ( T C ) . The choice of process variables is based on the results of [6,15,16,17,18,19]. The representing localities to change the parameters are shown in red cycles in Figure 1b. All process variables are chosen to be comparable to the literature and do not exceed the manufacturer’s datasheet. Table 1 shows the ten parameter sets of the DoE. The orange highlighted line indicates the standard settings and is referred to as the second parameter set in the following. First, the mould temperature of the polyurethane cavity is varied by ±10 °C, as shown in [19]. This is followed by a successive increase in the residence time by 20 s, after which the polyurethane mass flow is varied by ±1 g/s. Following this, the resin components temperature is increased by 5 °C, analogous to [19]. Finally, the residence time and the component mass flow are changed simultaneously to investigate the mutual effect of these process variables.
After conditioning the test specimens, the uniaxial tensile properties for the type 1 BA specimens are determined according to DIN EN ISO 527-2 using the Shimadzu (Kyoto, Japan) type AG-X plus. A test velocity of 30 mm/min is used, corresponding to a strain rate of approximately 0.8 s 1 . Digital image correlation (DIC) is used to determine the true strain optically. Here, the true strain in the tensile direction is converted into a stress–strain diagram, and the true strain transverse to the tensile direction is used to calculate the true cross-sectional area, which is used to calculate the true stress.
To determine the process influences on the viscoelastic properties of polyurethane, temperature–frequency sweeps are performed with the DMTA. Here, the Explorer 25N from Netzsch Gabo Instruments (Ahlden, Germany) is used. The clamped test specimens are initially cooled down to 0 °C. Starting from this initial state, the DMTA is executed within a frequency range of 0.5–20 Hz and a frequency step of 2 Hz up to a test temperature of 80 °C. The frequency sweeps are repeated every 5 °C up to this temperature. This was continued sequentially up to a temperature of 80 °C, whereby the samples were each held at the target temperature for 240 s in order to achieve temperature equilibrium. The temperature range is limited here by selecting 40 °C before and after the glass transition, as this ensures an accurate representation of the glass transition [21]. The nominal quasi-static applied strain amounts 0.5% during the loading process, and the nominal dynamic strain is 0.2%. The previously conducted tensile tests guaranteed a linear viscoelastic material behaviour in this strain range so that nonlinear material effects are negligible.
These examinations are combined with Differential Scanning Calorimetry using a PerkinElmer (Waltham, MA, USA) DSC8500 to investigate the thermal material properties as a function of the manufacturing process. For this purpose, test specimens weighing of 10 ± 0.2 mg are separated from the manufactured panels and tested with a heating rate of 20 K/min [21,22]. Two heating cycles are performed to separate the reversible and irreversible material reactions. In each run, the samples are heated from 0 °C to 150 °C to determine the thermal properties. This is followed in each case by cooling to 0 °C at the same heating rate with reheating to 150 °C. Up to temperatures of 150 °C, it can be safely assumed that no decomposition and thus damage to the material occurs for this system.

3. Results and Discussion

All experiments are carried out in a standard air-conditioned laboratory to exclude the influence of temperature and humidity fluctuations. Furthermore, the respective measurements were carried out immediately consecutively to prevent the samples from ageing. The following section reveals the differences of the mechanical material properties of each parameter set including the molecular explanation of the differences. After that, the thermal differences are shown and explained. The section finishes with the mutual effects of the parameter set variation.

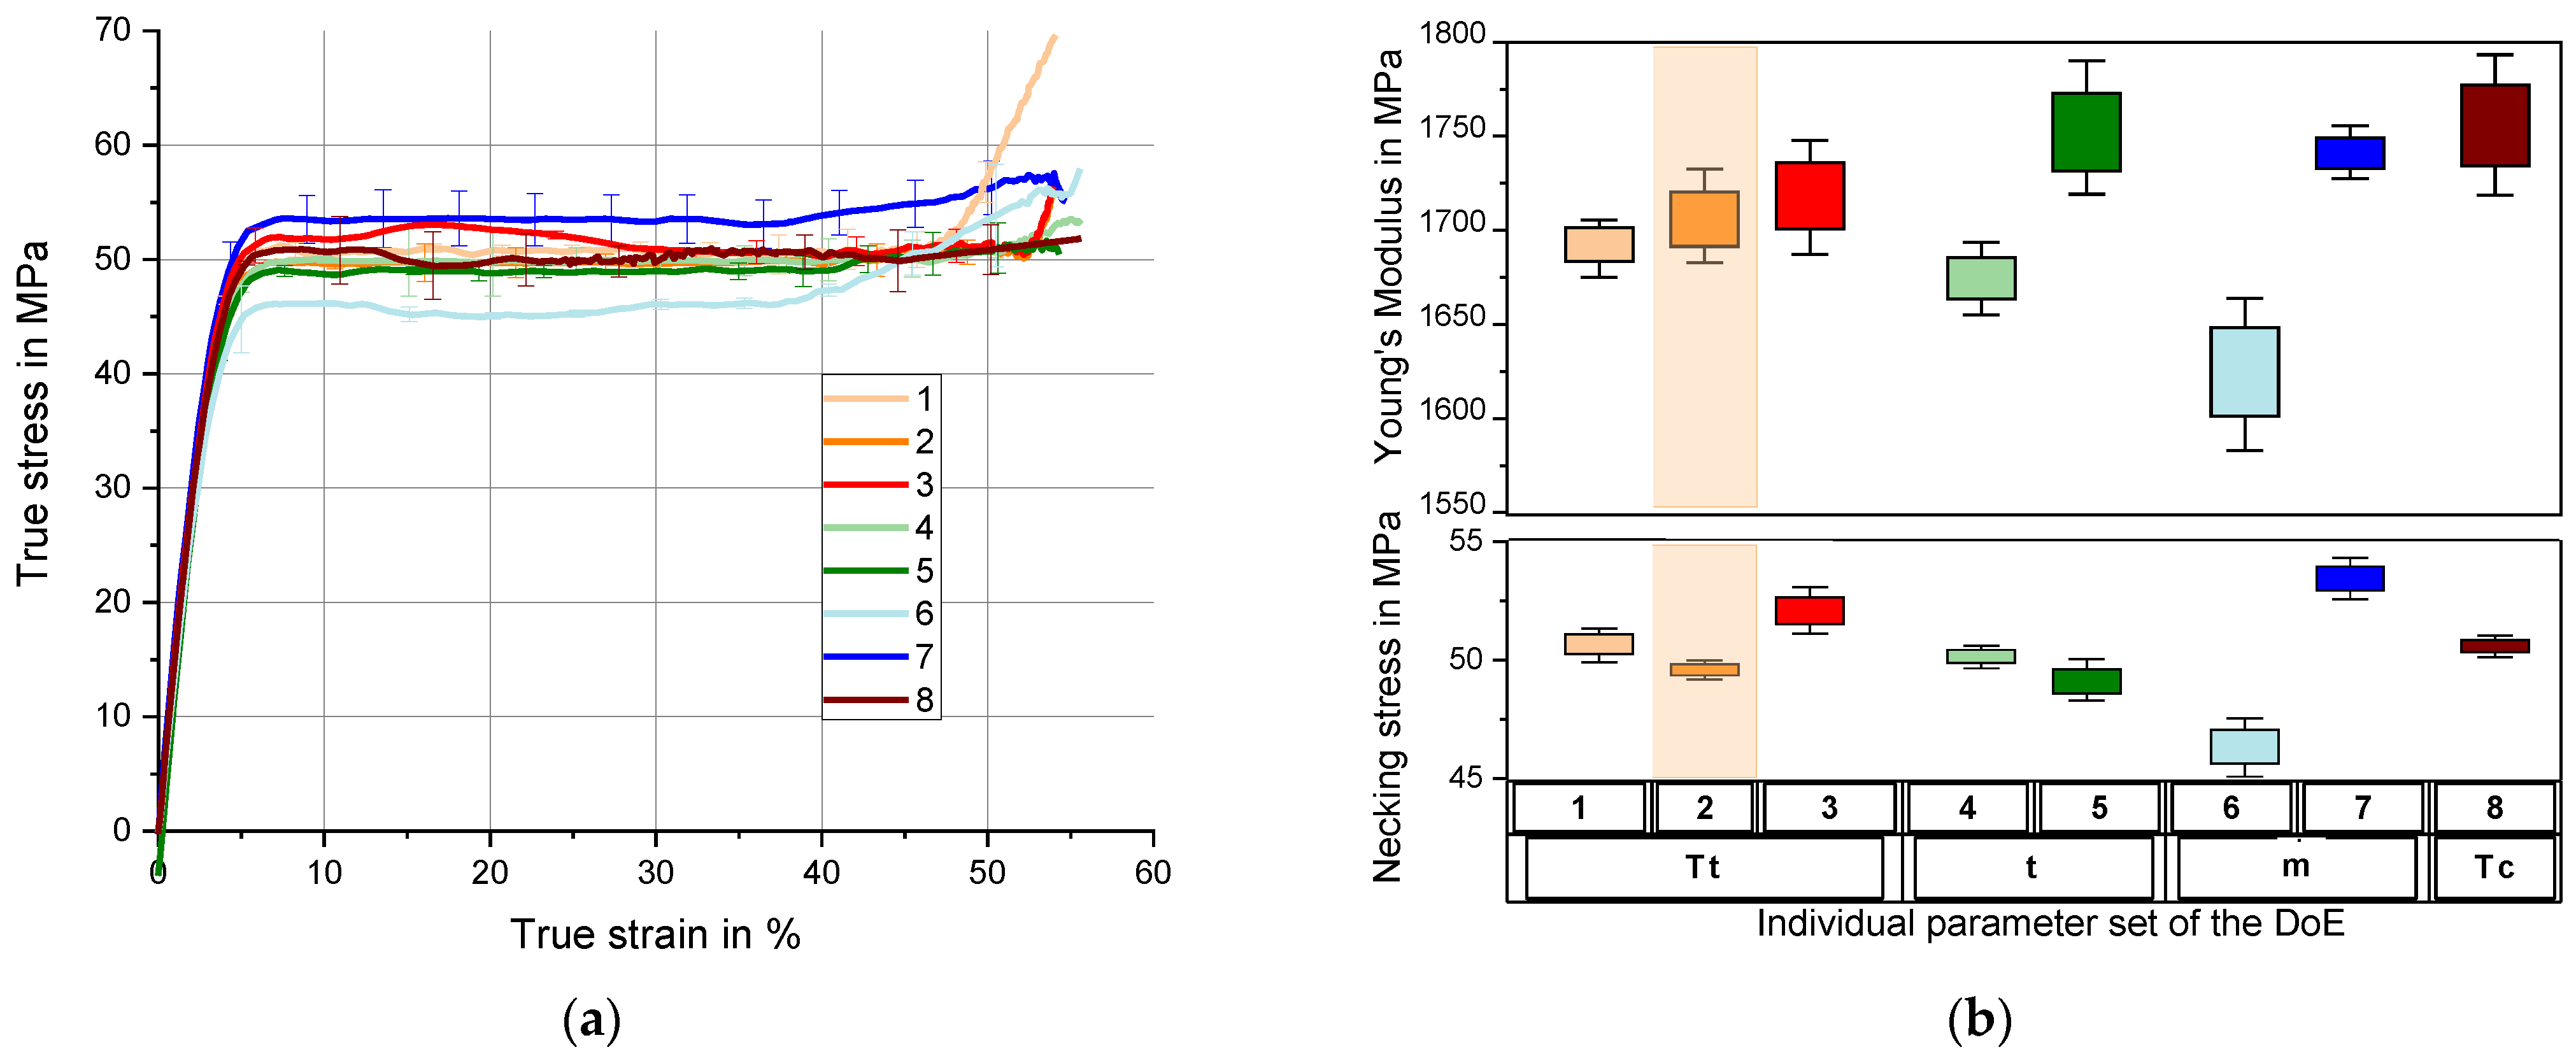
3.1. Process Influence at the Mechanical Material Properties

The uniaxial tensile tests carried out according to the method described in Section 2 can be seen as a stress–strain diagram in Figure 2a.
Three tensile specimens were tested for each variation of the process variables. A stress–strain curve characteristic for a polyurethane elastomer comparable to [23,24] and a tensile strength of up to 60 MPa comparable to [25] was observed as test results. Initially, the stress–strain relationship is linear. When the necking stress is reached, necking of the tensile test specimens can be observed as a reduction of the specimen’s cross-section. Thus, the stress remains almost constant at an ongoing elongation of up to 35%. After reaching a maximum elongation of the molecular chains, the stress increases rapidly until fracture [26]. It has to be mentioned that a plastic flow known for thermoplastic polyurethane does not appear here as the puroclear® is a crosslinked polyurethane type. To prove that the remaining set of specimens loaded beyond the necking state is still reversible after unloading, the puroclear® specimens were stored into an oven at 80 °C. Thereby, a complete recovery of the specimens to the initial geometry can be observed. This leads to the suggestion that the specimens exhibit a nonlinear-viscoelastic deformation with relaxation times on a longer time scale, which is fully reversible after an accelerating heat exposure.
Figure 2b compares the characteristic values of the tensile test dependent on the parameter set. The top figure shows an overview of the Young’s Modulus as a function of the process parameters. The modulus is determined according to EN ISO 527 [27]. The bottom picture shows the process dependent necking stress.
It should be noted that the bottom labels describe the respective process variable and upper labels show the parameter set. In addition, the orange sample refers to the reference setting (see Table 1). The Young’s Modulus differs in particular between that of the parameter sets six with 1620 MPa (light blue) and eight 1755 MPa (brown) by more than eight percent (see Figure 2b). In direct comparison, it is noticeable that an increase in the mould temperature results in an increase of the Young’s Modulus; here, the mean Young’s modulus increases by an increase of 20 K, from 1690 MPa to 1720 MPa, which fits the temperature effect for thermoplastics [13,14,17]. The materials Young’s Modulus can also be improved by increasing the resin components temperature, also observed by [19,20].
Similarly, but much more strongly, the mass flow of the polyurethane m ˙ influences the Young’s Modulus. Increasing the mass flow from 15 g/s (parameter set 6 light blue) to 17 g/s (parameter set 7—dark blue) increases the modulus of elasticity by 7.5%. For the residence time of the polyurethane reaction in the mould, no significant trend can be identified regarding an influence on the Young’s Modulus. Initially, the Young’s Modulus decreases with an increase in time by 20 s (set 2 to set 4) but then increases again for about 5% (set 5). For both the process variables of mass flow and the resin components’ temperature, the same trend can be seen for necking stress at 5% true strain. As the value of the parameter increases, the necking stress also increases. Again, this is more influenced by m ˙ than by T C . In case of m ˙ , the lower and upper process parameter differ for 7.1 MPa about 15.5%. For T C , it is just 2%. The trend is inversely proportional to the Young’s Modulus by increasing the residence time, although this trend is only weakly defined. An increase in the mould temperature initially leads to a slight drop in the necking stress of 2%, while it is increased afterwards up to 5%.
As part of the temperature-frequency sweep described in Section 2, Figure 3a shows the storage modulus (E′) in MPa and the unitless loss factor tan(δ) as a function of temperature at a loading frequency of 4.5 Hz. The frequency selected corresponds to the strain rate of the tensile test at a dynamic strain amplitude of 0.2%, so that the storage modulus at 23 °C from Figure 3b and the Young’s Modulus (Figure 2b) are comparable. The storage modulus for uniaxial loading in tension direction is calculated from the quotient of stress and strain amplitude multiplied by the cosine of the phase shift δ between stress and strain response (see Equation (1)). The ratio of the loss modulus (E″) and the storage modulus is the loss factor tan(δ) (see Equation (2)).
E = σ 0 ε 0 cos ( δ )
tan ( δ ) = E E
In the saturated state (23 °C/50% rel. hum.), the polyurethane system exhibits a glass transition of approx. 45 °C. With an average of 1780 MPa at 0 °C, the storage modulus within the energy-elastic range initially falls slightly. It then drops sharply, due to the glass transition point of the material, towards the entropy-elastic plateau to an average of 17 MPa at 75 °C. The loss factor initially increases almost linearly up to 30 °C, with further increasing temperatures, and a substantial nonlinear increase appears for all process variants due to the glass transition and the change into the rubber-elastic range. After a temperature increase above 60 °C, the loss factor drops sharply again. At 80 °C, it is again at the level of 40 °C. Only the process set 6 is shifted towards the lower temperatures by about 5 °C for the shown properties. Basically, both the storage modulus and the loss factor for polyurethane elastomers show typical values that are comparable with those in the literature [6,23,24,28].
Figure 3b shows the loss factor and the storage modulus at 23 °C. As with the Young’s Modulus from graph 2b, they are arranged according to the process parameter. First of all, it can be observed that the comparatively low storage modulus of parameter set 6, which is almost 11% smaller than the reference in orange. In contrast, the loss factor is 20% higher and shows a more significant standard deviation. Considering the individual process variables in relation to each other, an increase of the storage modulus from 1635 to 1680 MPa can be seen for the increase in mould temperature. The loss factor initially rises from 0.06 to 0.075 with an increase in the mould temperature and decreases again to 0.065 with higher mould temperatures. Increasing the residence time has a similar effect on the materials storage modulus as increasing the mould temperature. An extension of the time by 20 s in each process variant leads to stiffening the material by almost 20 MPa each. The loss factor decreases here from 0.075 via 0.072 to 0.065. In addition to the significant jump of the storage modulus increase from the variant with the lowest mass flow to the reference setup, a further increase in the mass flow shows an additional slight stiffening of the material. This is reciprocal for the loss factor. Increasing the resin components’ temperature has almost the same effect as increasing the mass flow. The influences on the temperature are discussed in detail within the scope of the investigations of Section 3.3.

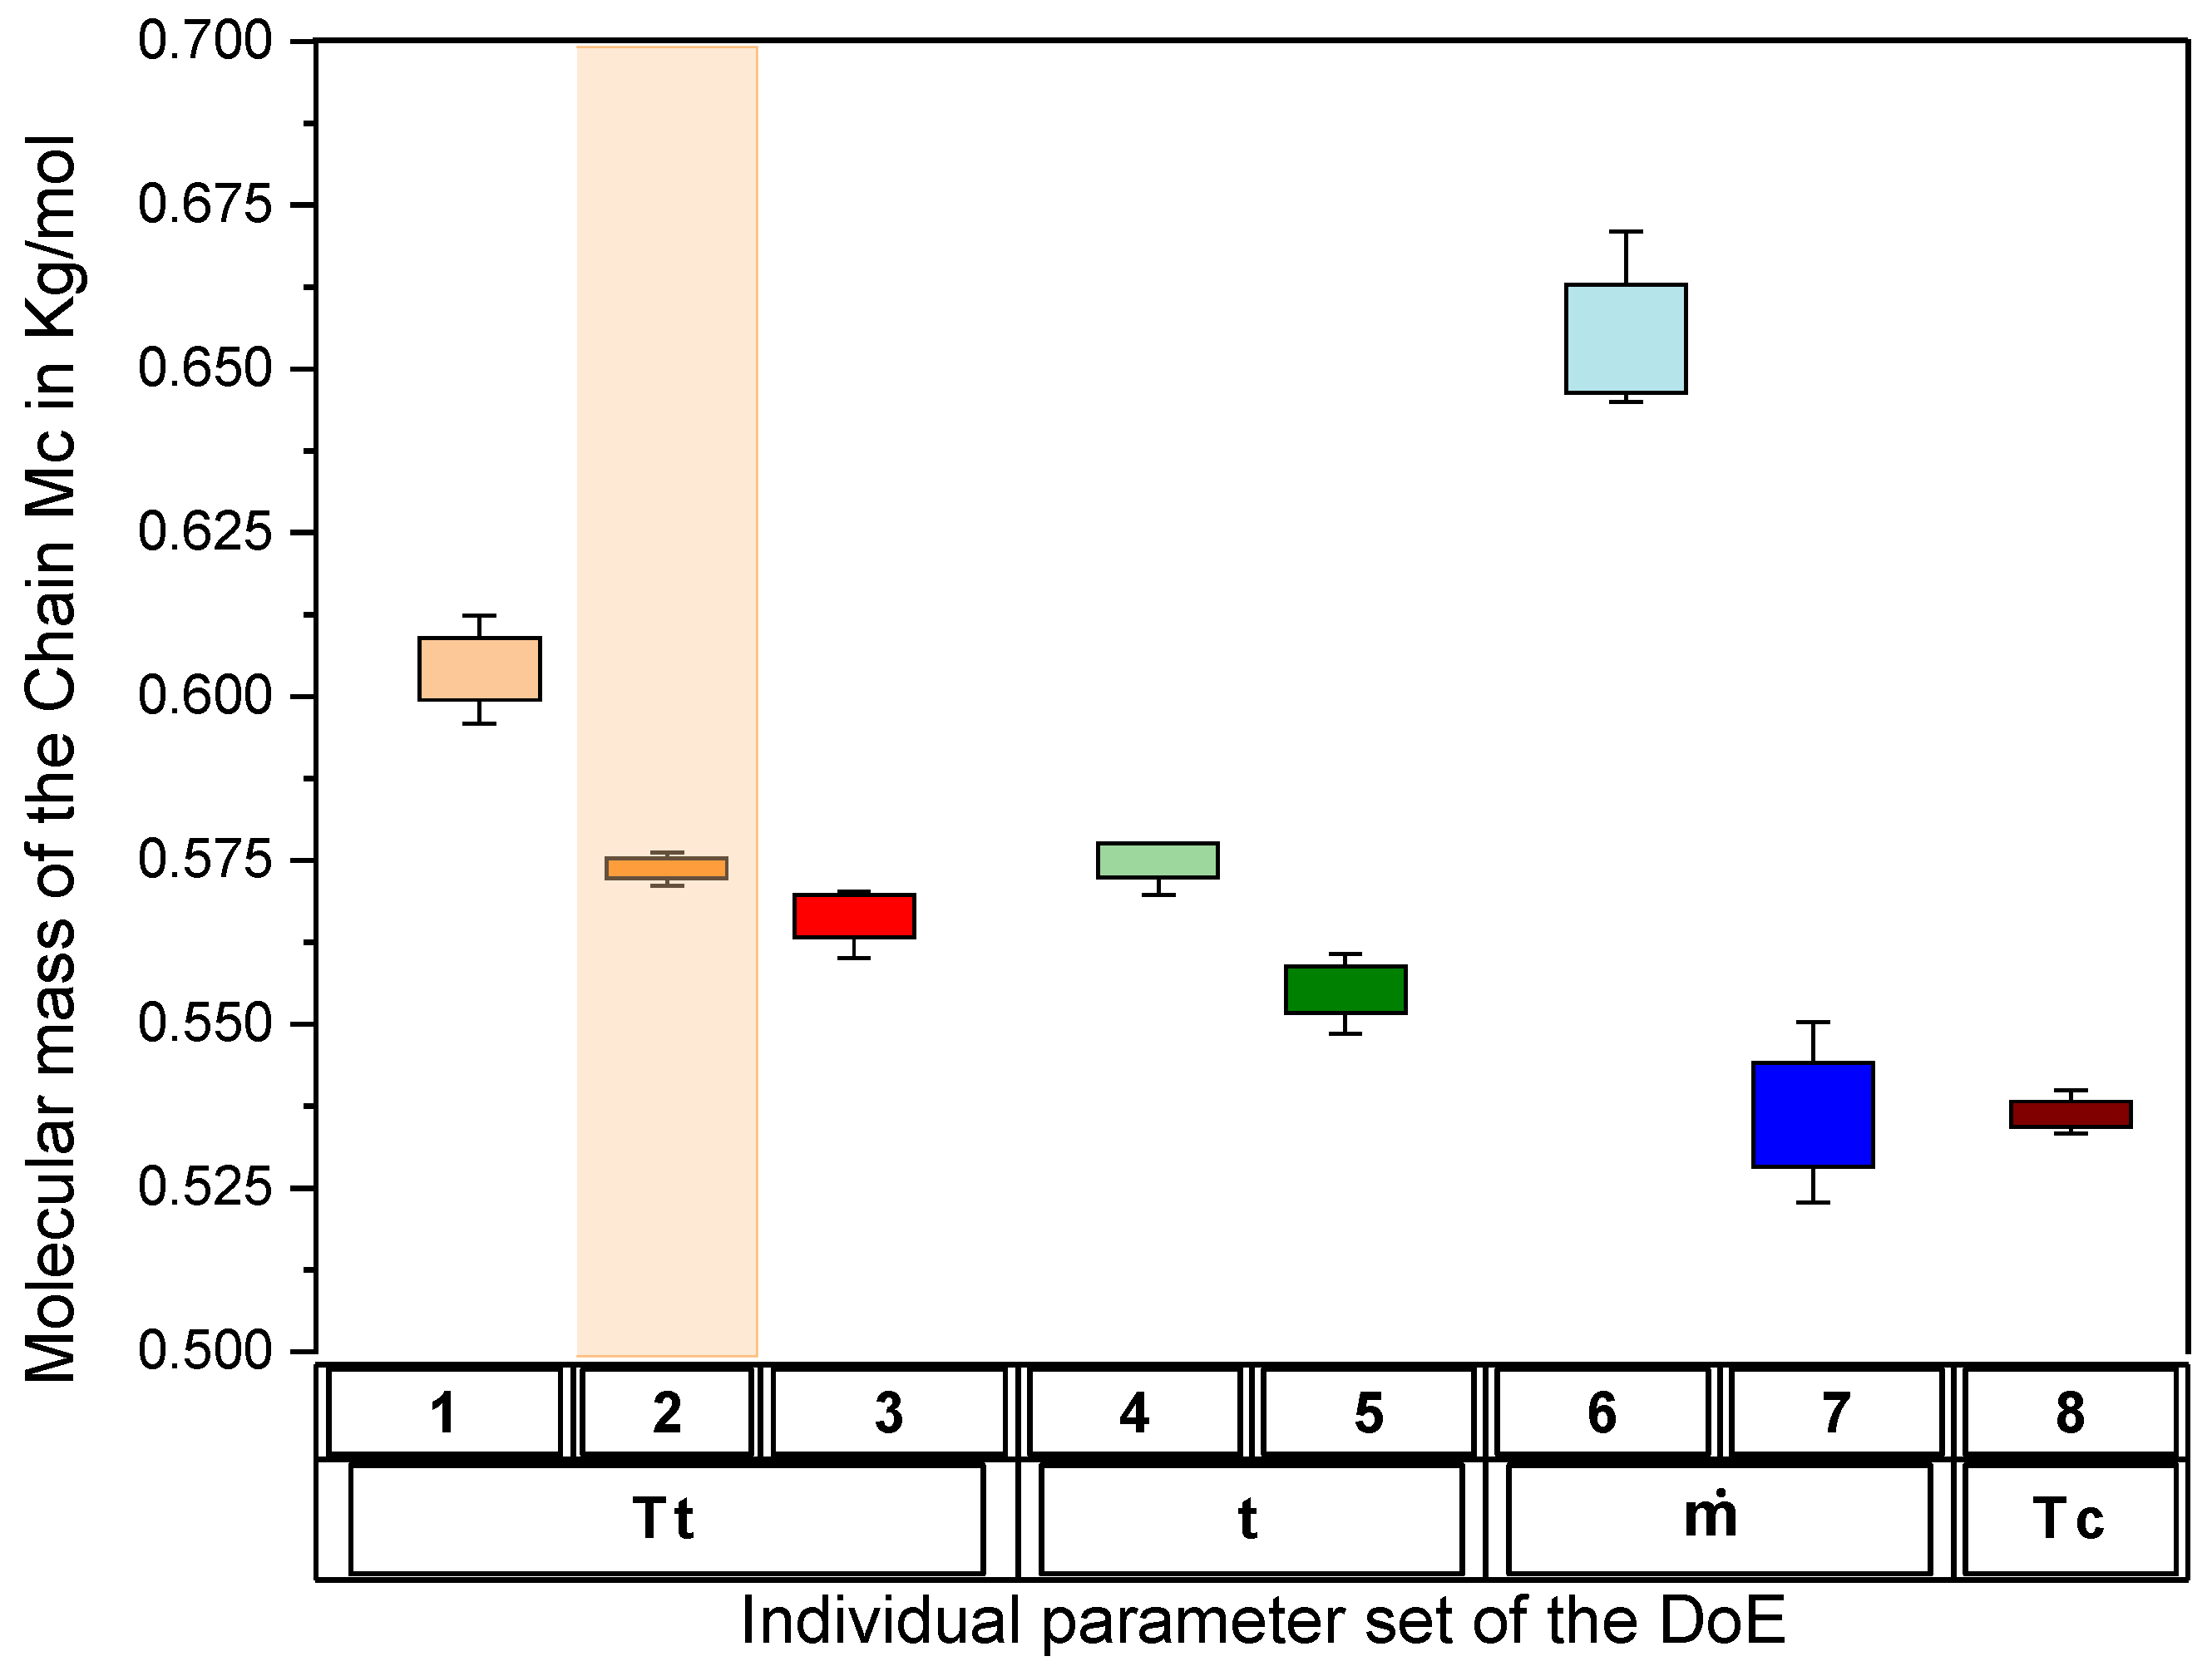
3.2. Explanation of the Mechanical Differences of the Parameter Sets

The variants’ differences in the mechanical properties can be explained using the model for describing the molecular structure of crosslinked polymers according to Flory and Rehner [29]. The model correlates the mechanical material properties of crosslinked polymers to the length of the shortest chain within a three-dimensional network. The length of the chain refers to the molar mass between two cross-linkages. Assuming an isotropic material behaviour, the Young’s Modulus of the polymer can be determined by deforming the chain [29]. Thus, the modulus can be made directly dependent on the molecular weight of the chain ( M c ) (see Equation (3)). In addition to a defined temperature T and the gas constant R, the density ρ of the polymer at the defined temperature is also a component of the equation:
E = 3 ρ ( T ) R T M c
However, the assumption is limited to the rubber-elastic state and small deformations [29,30,31]. In [26], Schwarzl uses Flory’s approach to describe the rubber-elastic material behaviour of vulcanised rubber materials.
By means of Equation (3), Flory refers in [31] to the reduction of the fracture stress and the fracture elongation in combination with the increase of molecular weight M c ; this is caused by a reduction of the cross-link density. For polyurethane elastomers, Zoran [32] proves the dependence of the tensile strength on the molecular weight. He shows that a lower M c causes a higher tensile strength [32]. Tcharkhtchi, Farzaneh [33] and Kästner [34] state the same conclusion, relating the storage modulus determined with DMTA to the calculated M c according to Flory. Furthermore, the strength of PU also increases with the decrease of the molar mass of the chain.
In [35,36], the authors relate a decrease in swelling processes of polyurethane to the reduction of M c and explain this with the increase in crosslink density. Segiet and Jerusalem also demonstrate with their Equation (4) for poly(2-ethyl-2-oxazoline) a decrease in storage modulus with the increase of M c and confirm the dependence of swellability. Furthermore, they illustrate the influence of M c on the glass transition Tg, which decreases with an increase of M c [37,38,39].
With reference to the research of Flory [29], Segiet and Jerusalem [38] establish the following equation for M c for viscoelastic materials below and above the glass transition temperature:
M c = 2 ( 1 + υ ) ρ ( T ) R T g 1 3 E ( T )
Here are υ the Poisson’s ratio and g the gel content. The density ρ ( T ) was determined using a material expansion test under the assumption of isotropy. While the mass stays the same, the volume differs. The temperature dependent storage modulus E(T) was measured using DMTA at the corresponding temperature in the rubber-elastic range. For the process dependent material used here, this is valid at 90 °C. During the necessary measurement by means of a temperature sweep from 0 to 120 °C with the Explorer 25N from Netzsch Gabo Instruments, the linear expansion coefficient necessary for calculating the change in Volume can be determined. As described in [40,41], the thermal expansion curve exhibits a bilinear characteristic for polyurethane. The expansion coefficient is then calculated via the thermal expansion as a function of temperature. To determine the gel content, samples with dimensions of 10 × 10 mm2 were stored for 48 h at 80 °C in deionized water [42,43,44]. Prior to this, the samples were dried at 80 °C in vacuum until equilibrium of the weight. Subsequently, after the samples are stored in deionized water, they are dried again until equilibrium [38,45]. The gel content is then calculated as the quotient of the mass before conditioning and the mass after the second drying phase [38]. Using the tensile tests presented in Section 3.1, the Poisson’s ratio is determined.
Finally, according to Equation (4), the molecular mass Mc in Kg/mol shown in Figure 4 is obtained for the individual parameter sets.
Comparing the molecular mass M c and the Young’s Modulus from Figure 2b as well as the storage modulus from Figure 3b, a correlation to the molecular mass of the chain can be seen. The Young’s Modulus and the storage modulus both increase as M c decreases compared to the reference in orange. Nevertheless, the dependency is not proportional. Especially for the direct comparison between sets 5 and 7, a higher Young’s and storage modulus can be seen for set 5, while the M c is lower. A closer view of this difference will be taken regarding the thermal properties. The necking stress before the flow process can be explained analogously to the modulus of the material. The lower the molar mass of the chain, the higher the necking stress, according to [32]. For the used fast curing polyurethane, this fits all sets besides sets 2 and 5. In total, a confirmation of the process influence on the mechanical properties can be given by the individual molecular mass of the chain of each parameter set.

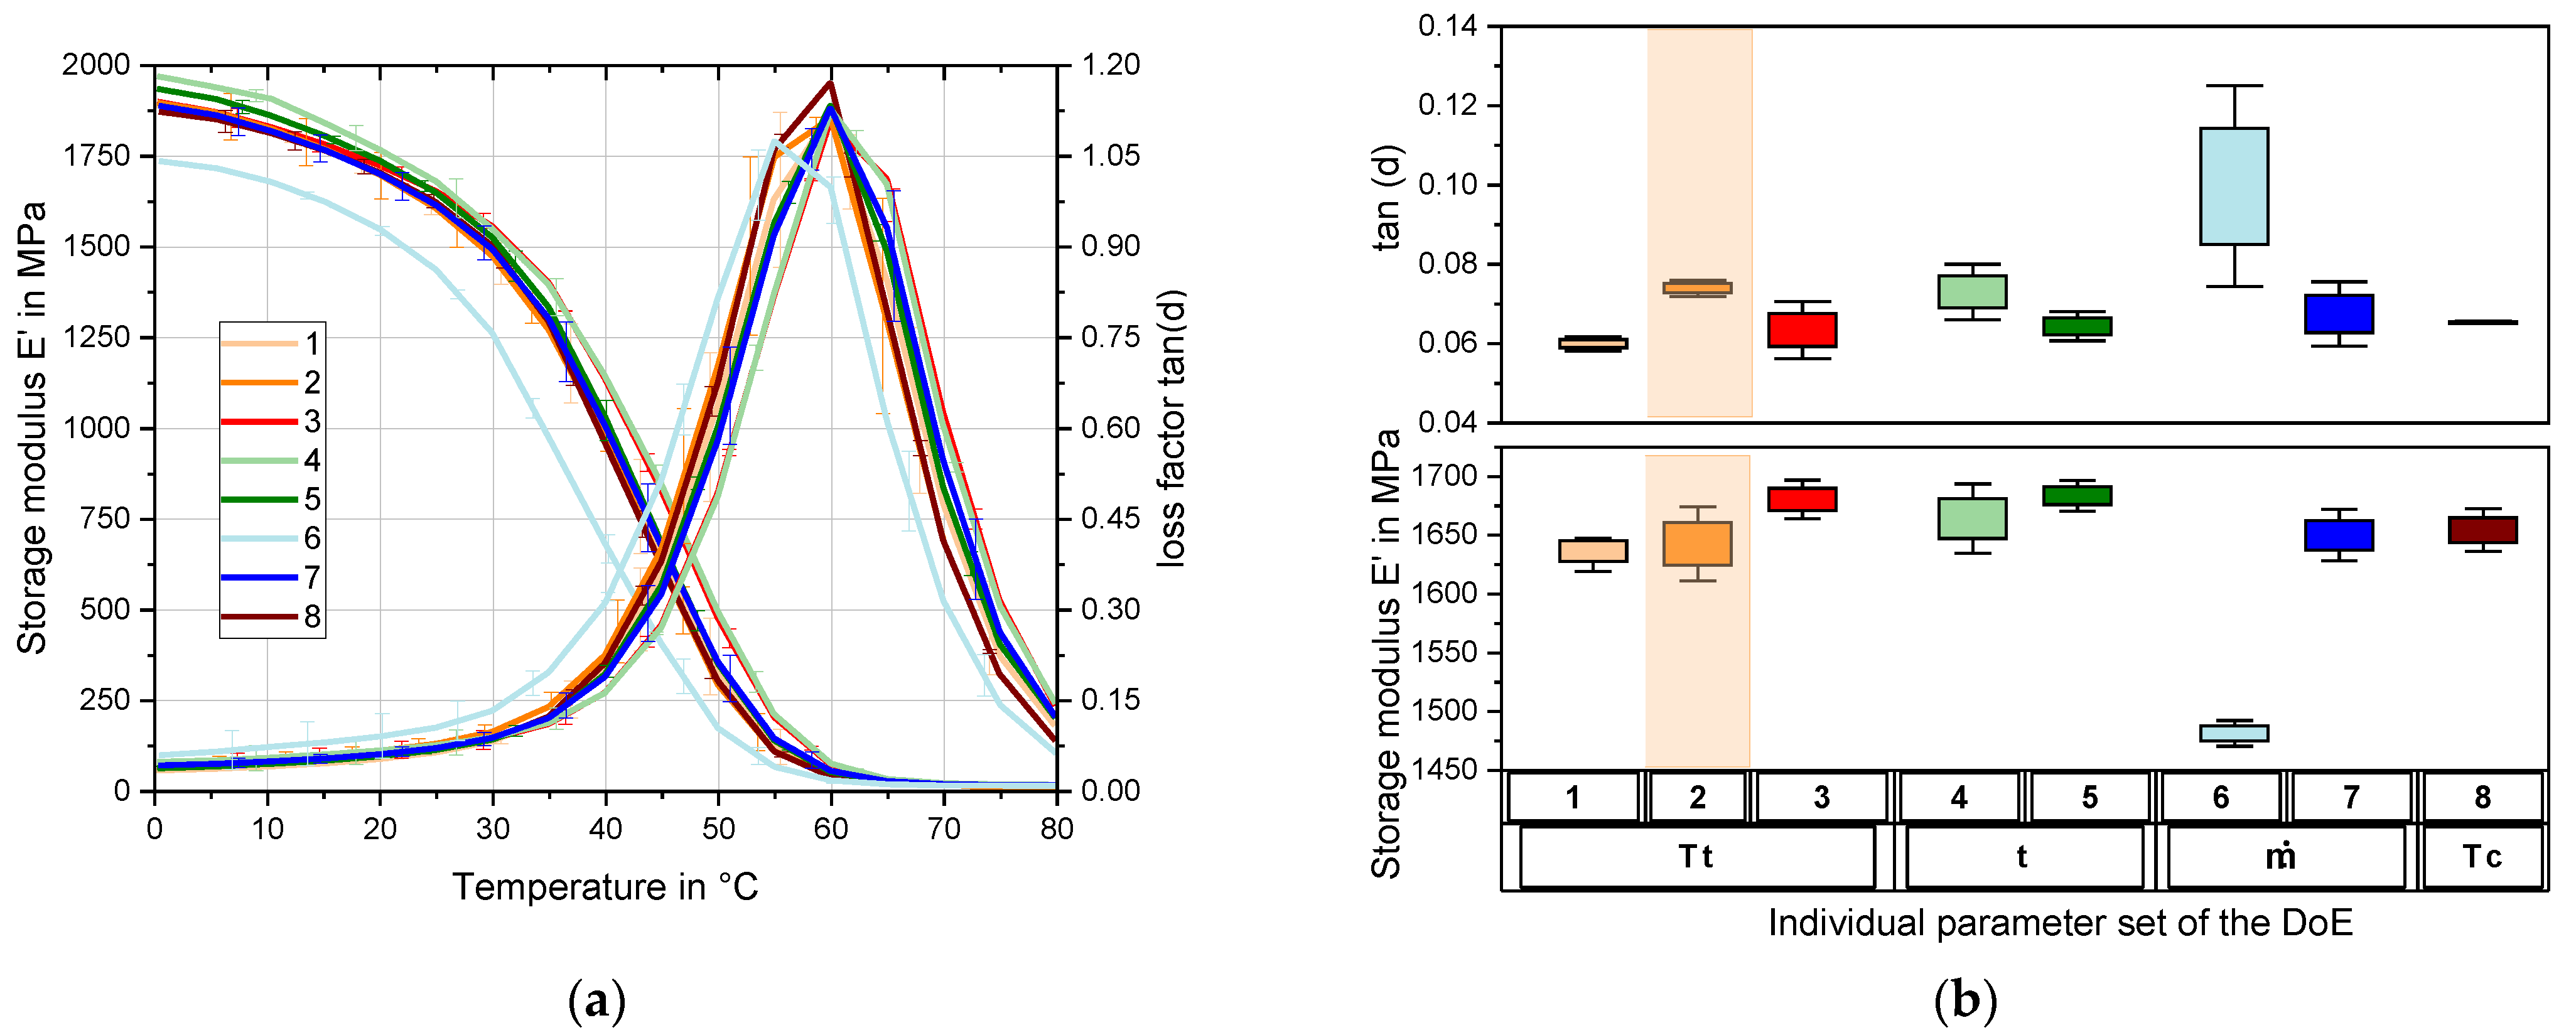
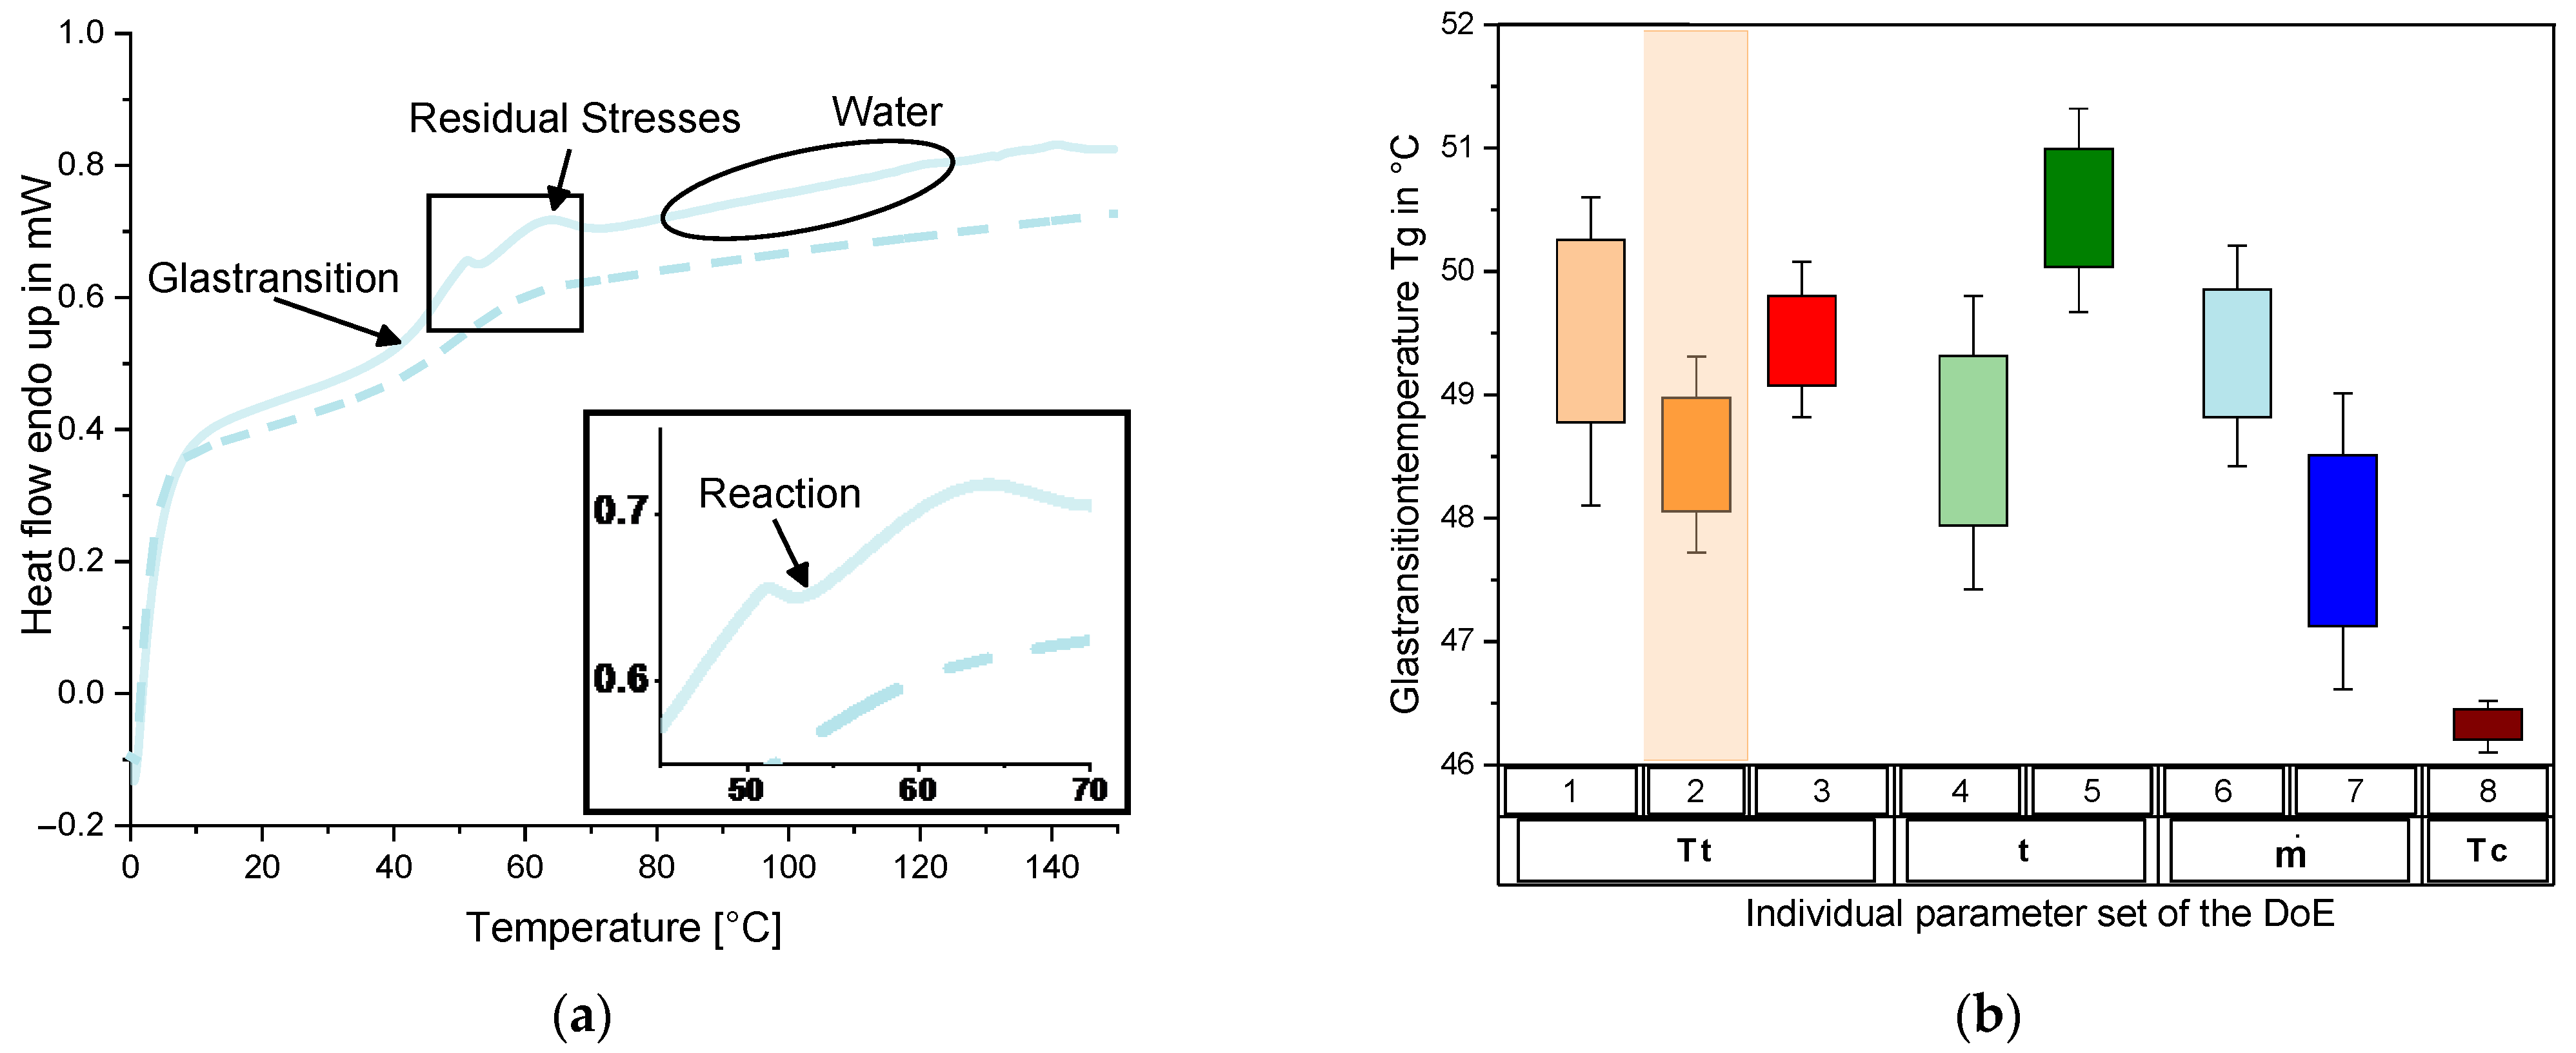
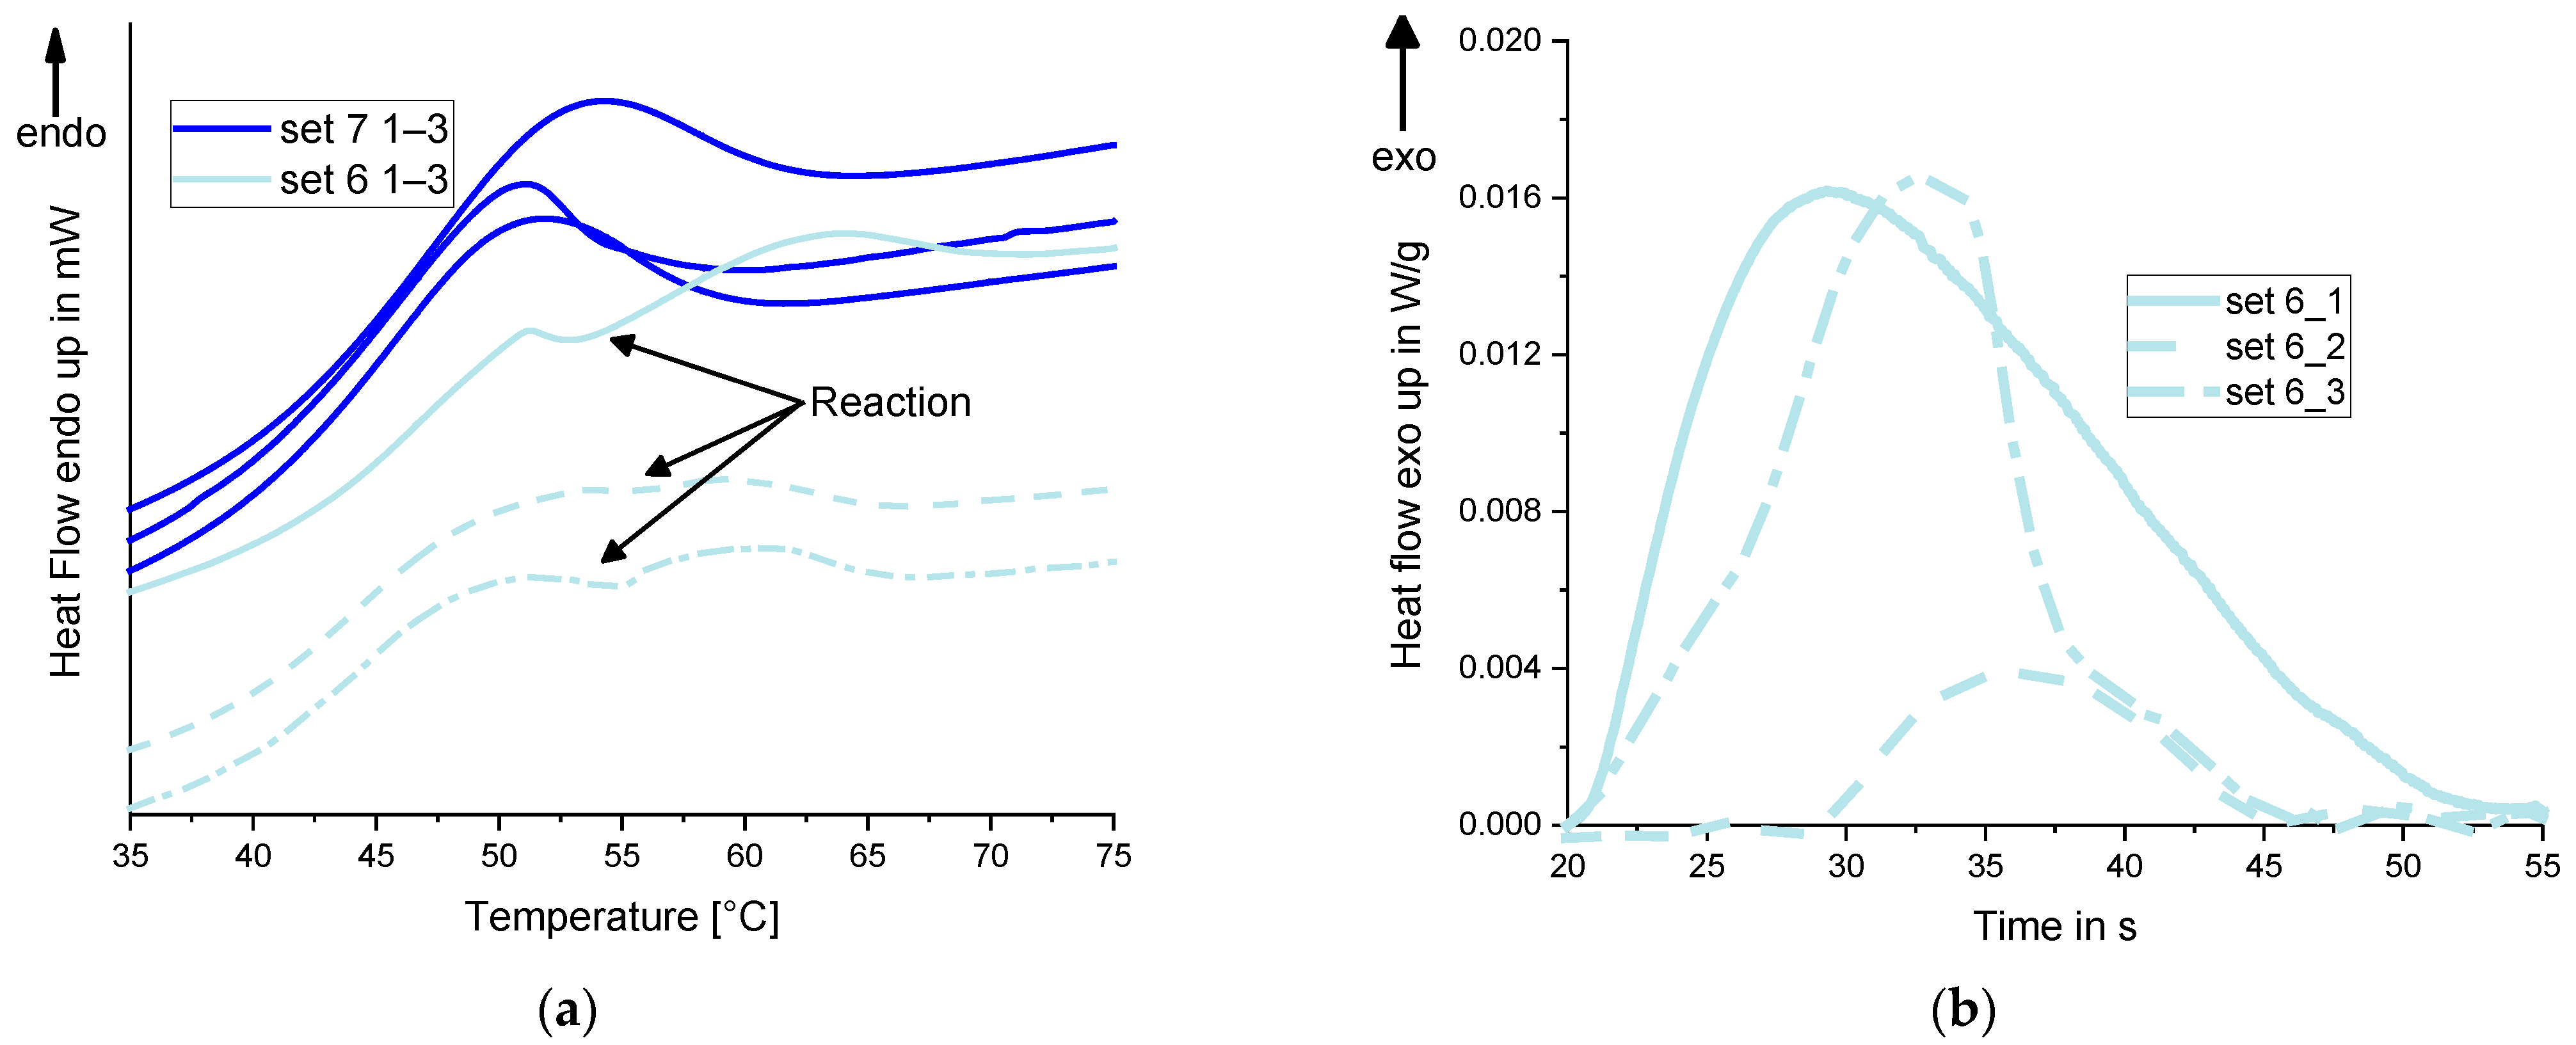
3.3. Process Influence at the Thermal Material Properties

In the previous section results, the focus lies in evaluating the process-specific mechanical properties. In the case of plastics, these are directly related to the position of the glass transition zone to the considered temperature range. Towards the DMTA, a more precise method for characterizing the glass transition zone is its evaluation with the Dynamic Differential Scanning Calorimetry (DSC). In addition, the DSC can be used to evaluate the reaction kinetics of reactive resin systems, such as the degree of curing or potential post-crosslinking processes, which can be related to the corresponding processing parameters.
Figure 5a exemplary shows the thermograms of the DSC analysis carried out using the example of measurements of the process influences of parameter set 6. The continuous line refers to the first and the dashed line to the second heating cycle. In the first run, irreversible effects such as the evaporation of water, the reduction of residual stresses and occurring post-reactions become visible. Here, in addition, the glass transition can be observed in the form of an endothermic step between 40 °C and 55 °C. The glass transition temperature is determined by an inflection point at 45.1 °C in the saturated state of the sample in the first run and 49.4 °C for the dry sample in the second run. In the example of set 6, water evaporation is shown in a bulging flattening of the first heating curve [17]. In addition, preparation-related residual stresses occur during the first heating run. These show up in the form of an endothermic peak immediately after passing the glass transition zone. Shortly before, a reaction downstream of the process becomes apparent in the form of a slight exothermic dip (see Figure 5a—marked black rectangle).
In the second heating cycle, irreversible effects of the first run can be pointed out, and the purely material-specific glass transition is shown, free of specimen preparation effects or environmental influences. First of all, it should be noted that all variants show slight differences in the shape of the glass transition zone. For the quantitative differentiation, the glass transition temperature is determined according to [21,46] using two extrapolated baselines and a tangent of inflexion. The highest glass transition temperature (Tg) is determined in set 5 with 50.6 °C (see Figure 5b), whereas set 8 has the lowest value with a Tg of 46.4 °C. If the individual process parameters are considered concerning reference set 2, an increase in the glass transition temperature is seen for the increase in the residence time. An increase in the resin components’ temperature and the mass flow leads to a decrease in Tg. There is no unambiguous trend for the increase in the mould temperature. From sets 1 to 3, the glass transition temperature initially drops from 49.9 °C to 48.5 °C, after which it increases again to 49.3 °C with a further increase in the mould temperature for set 3, but still beneath the Tg of set 1. The glass transition temperature shows a strong dependence on the molar mass of the chain. Besides set 1, it can be noticed that the lower the molecular mass of the chain (Figure 4) is, the higher the glass transition temperature results. This is due to the increased degree of cross-linking at a lower M c [47,48].
Segiet confirmed this dependence for poly(2-ethyl-2-oxazoline) [37,38,39]. Besides the direct comparison to the reference set, this assertion is true. However, comparing sets 7 and 8, an almost similar molecular mass of the chain of 0.535 Kg/mol and 0.536 lead to a difference of 1.5 °C for the glass transition temperature. This cannot be explained by the authors. It is assumed that this is related to fewer non-covalent interactions. Long et al. describe in [49] the influence of the molecular weight between crosslinks on the thermomechanical properties of different polymers. They explain a lower Tg for epoxy thermosets, while the M c is also lower, with the higher motion of the network structure due to less non-covalent interactions.
The dependence of the loss factor in Figure 3b can be attributed to the glass transition temperature. The viscous part of the stress response in the form of the loss modulus increases due to the better sliding of the chains caused by a lower glass transition temperature. This is directly included in the calculation of the loss factor. As a result, the loss factor also increases at temperatures closer to the glass transition temperature. The higher loss factor of set 2 compared to sets 1 and 3 can be explained this way. Combining the effect of a lower Tg while M c is similar, the vast differences concerning the necking stress of sets 7 and 8 can also be explained. The almost 7% higher stress of set 7 can be attributed to the sets’ higher glass transition temperatures.
Comparing the glass transition temperatures of the parameter sets for the DSC (Figure 5b) and the DMTA (Figure 3b), Tg is increased by 12% on average after the heating process of the DSC, while set 6 is increased by 31%. Zhou et al. describe the influence of water on the glass transition temperature of polyurethane up to a weight percentage of 15%. Their experimental results showed a shift of Tg of 10% to lower temperatures if the sample is fully saturated. While this is genuinely material dependent, the amount of change fits with the average change of Tg of the parameter sets mentioned before [50]. Taking this into account, some side effect must have influenced the material properties of parameter set 6.
Taking a closer look to the first heating cycle of all samples of set 6 compared to set 7, the curves show a slight exothermal reaction (see Figure 6a). This shows the incomplete cross-linking of the material in its original network and a reaction with free isocyanates [51]. For all three samples, there is a post-curing within the heating curve of the DSC. This effect is only seen for the samples of process set 6. All other process settings do not lead to any post-crosslinking and behave like shown for set 7.
Figure 6b shows the specific heat flow in the mentioned area of the post-curing-reaction over time, which results from the curves of the first heating period (Figure 6a). According to [21,52], the specific change of the enthalpy Δ H is determined using Equation (5) including the specific heat capacity c p over the temperature:
Δ H =   c p d T
The change of the enthalpy of each sample is compared in Table 2. Here, samples one and three of set 1 show a similar size ratio. Sample two reacts with only 14% of the enthalpy of sample one.
Based on the literature, the lower Young’s and storage modulus and the necking stress of the samples of set 6 compared to the others can be explained by the post-reaction detected through DSC [53,54]. Heijkants shows in [53] in detail a Young’s Modulus that is about 15% higher for a polyurethane system with a 30% higher reaction enthalpy.

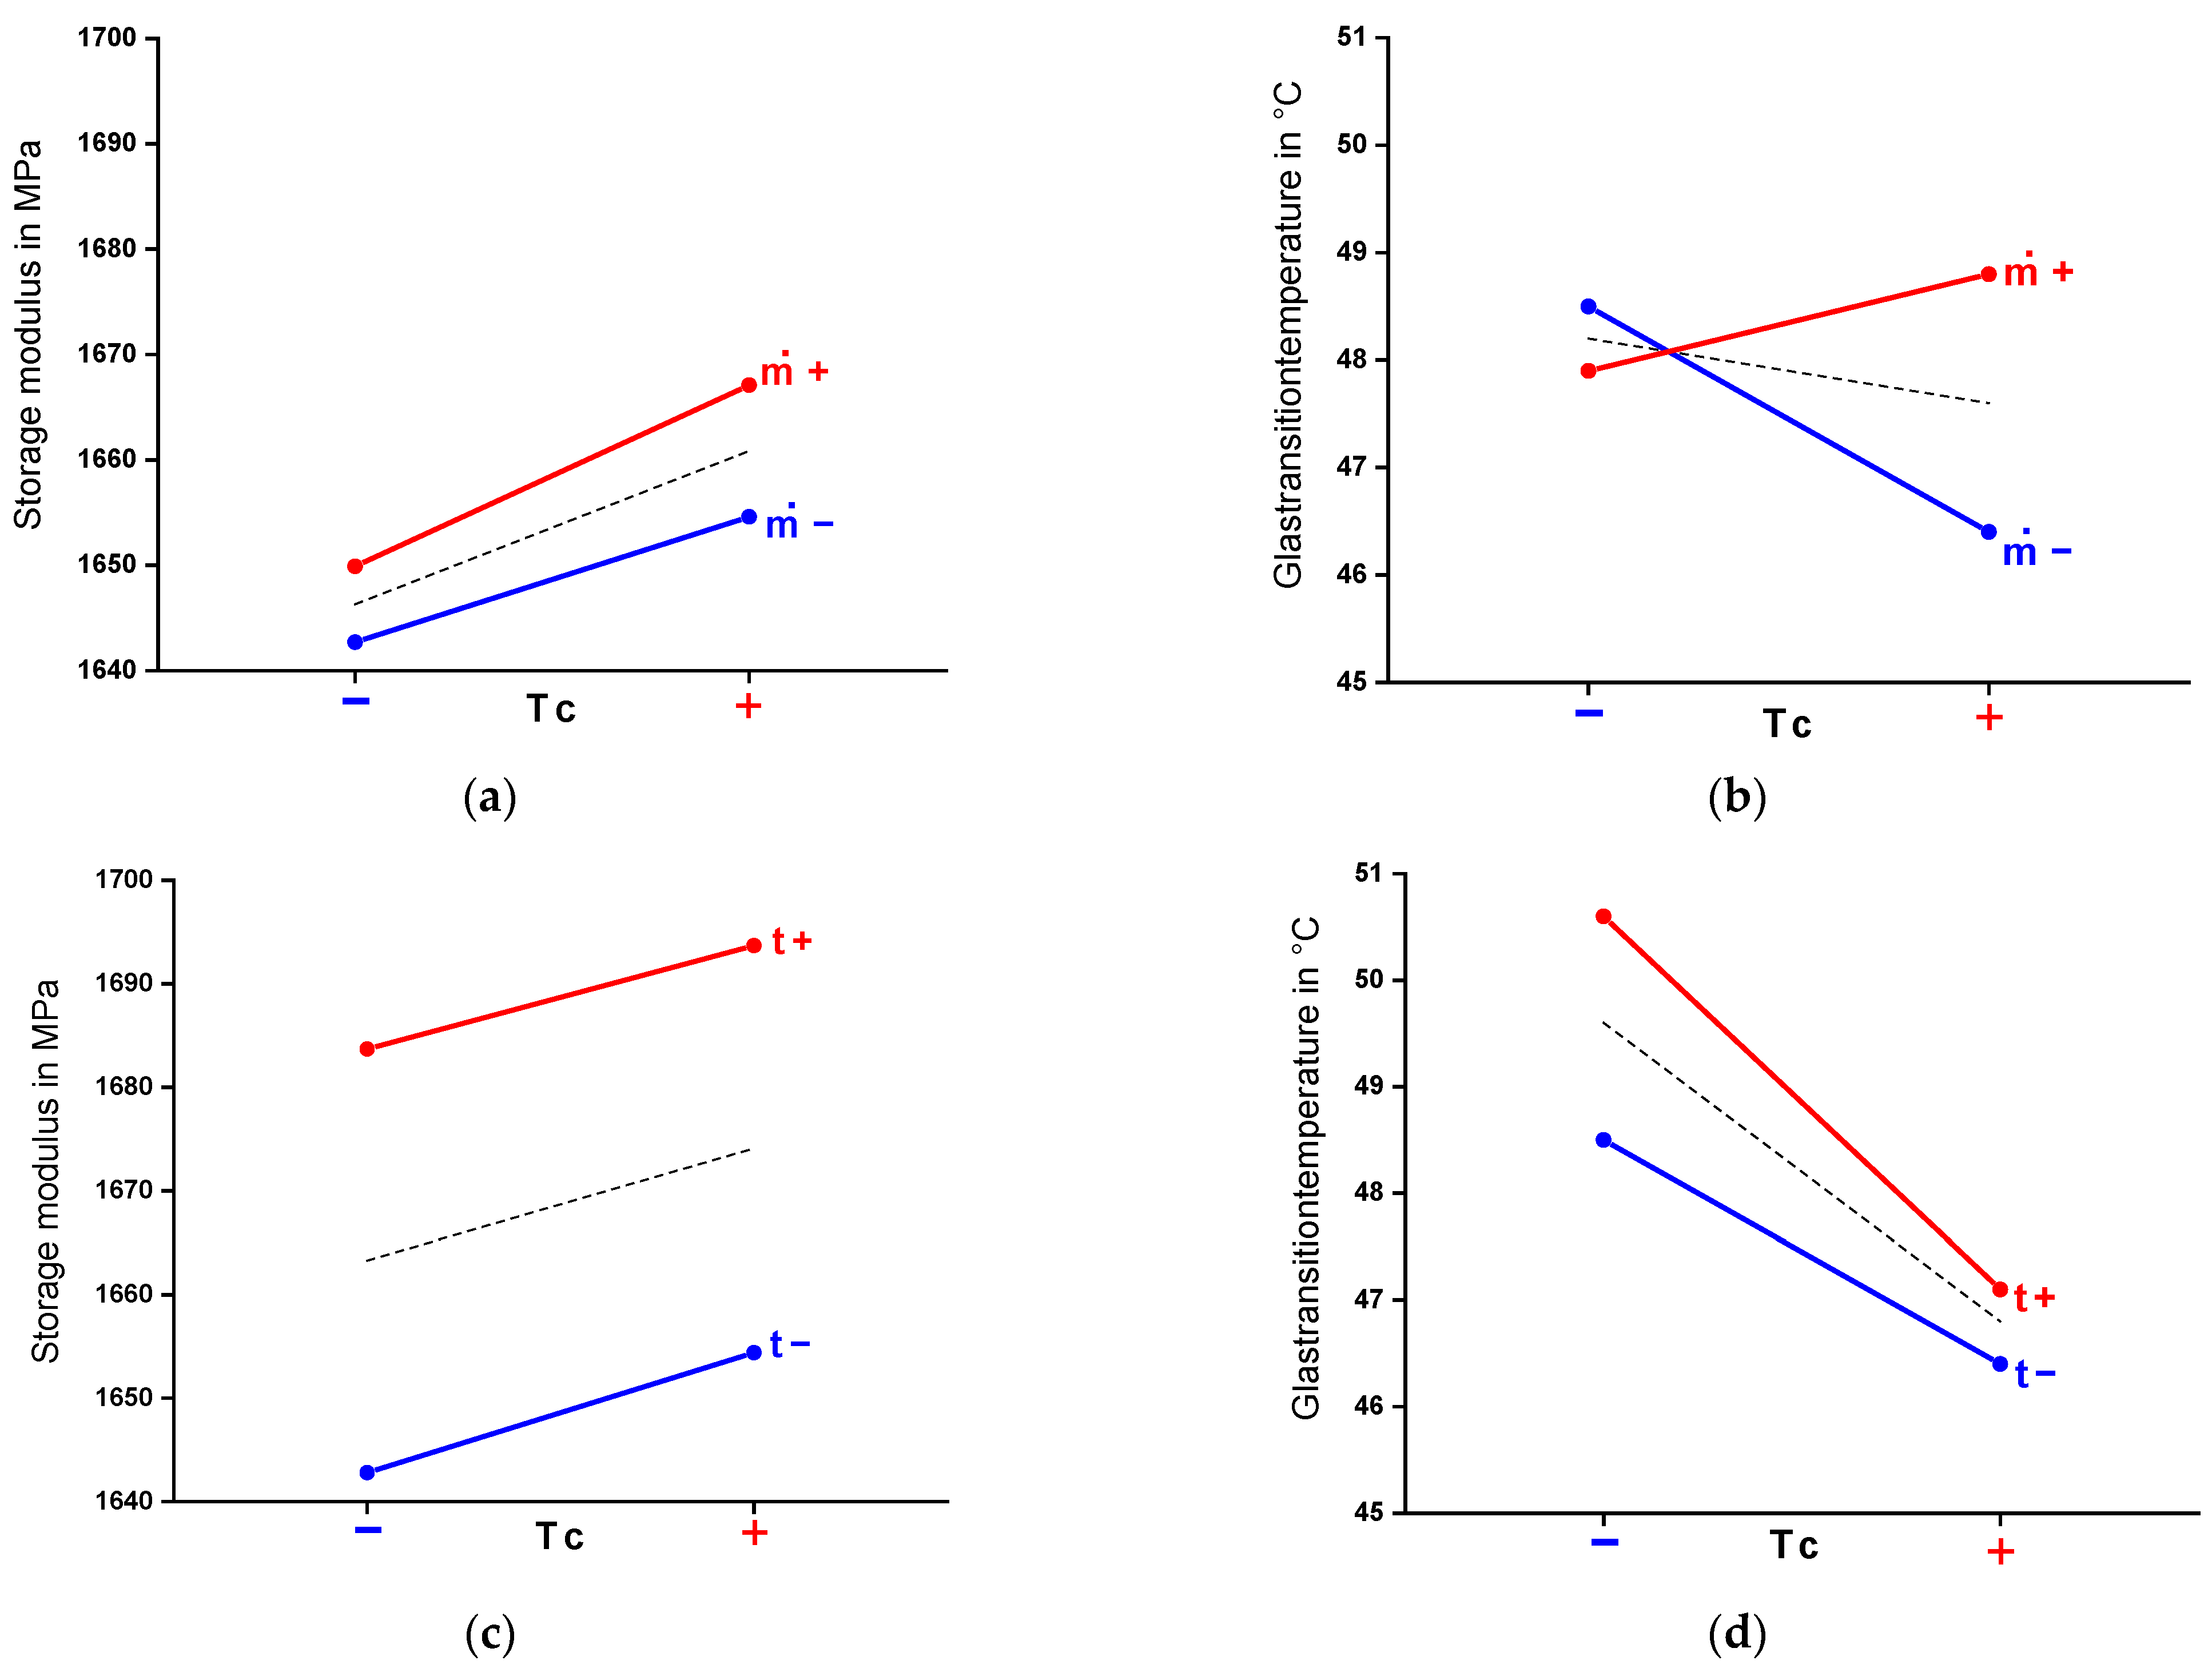
3.4. Mutual Effects of the Analysed Process Variables

Considering the analyzed effects of the sections above including their explanations, this knowledge can describe the mutual effects of the parameter sets 9 and 10. First, set 9 varies the mass flow and the component temperature at once and second, and set 10 varies the residence time and the component temperature at once. Regarding the parameter sets 5, 7, 9 and 10, the mutual effects of the process parameters ( t H ), ( m ˙ ) and ( T C ) can be examined. Therefore, the storage modulus and the glass transition temperature for each set is investigated at four different levels.
The red plus depicts a high level of the parameter and the blue minus a low level. The blue dots represent the low values, and the red dots the high values of the simultaneously varied parameter. The dashed line is formed over the respective mean values and illustrates the interaction between the parameters [55,56]. By means of the coloured lines connecting the coloured dots, conclusions about the interdependence can be drawn visually. If all lines run parallel to each other, there are no interdependencies between the selected parameters for the respective property. If there is an intersection, the parameters show significant, particularly strong mutual effects. Figure 7a,c show the interaction plot of the considered factors on the storage modulus, and Figure 7b,d on the glass transition temperature.
Figure 7c shows two parallel lines for the variations between residence time and resin components’ temperature. This indicates that there is no interdependence of the parameters concerning the material’s storage modulus. Increasing the resin components’ temperature increases the modulus independently of the residence time. The same applies to the increase of the residence time as a function of the resin components’ temperature. Varying both parameters at once leads to the expected change of the modulus. However, for the glass transition temperature, a slight mutual effect between the resin components temperature and the residence time is shown (Figure 7d). In case of an increase in the resin components temperature with a constant residence time, the glass transition temperature falls by just under 4.5%. However, if the residence time is increased in parallel, the glass transition temperature is reduced by 7.4% compared to the lower resin components temperature, whereby the glass transition temperature is still above the temperature with a low residence time. This can be reasoned by the higher drop of the glass transition temperature while increasing the component temperature.
In contrast, the increase of Tg due to a higher residence time is less effective. An increase in the mass flow rate leads to the opposite effect on an increase in the resin components’ temperature. Figure 7a also shows slight interdependencies. Here, increasing the temperature of the resin components increases the storage modulus by 0.7%. However, with a simultaneous increase in mass flow, the modulus increases slightly more by 1%. Strong interdependencies are shown for the two parameters when considering the glass transition temperature (Figure 7b). Here, the two lines of variation of Tc and m ˙ intersect. While an increase in the resin components temperature at a low mass flow reduces the glass transition by 4.5%, a high resin components temperature and simultaneous increase in mass flow leads to an increase in the glass transition temperature by 1.8%. The reason for this could be a better mixing during the resin’s injection process, resulting in a higher crosslinking density. A higher component temperature decreases the viscosity of the injected mixture, while a higher mass flow also predicts a better mixing.

4. Conclusions

This work focuses on investigating the process influences of RIM on the thermomechanical properties of fast curing polyurethanes. In this context, the authors show the limited number of published research works. They have selected and investigated contributing parameters from the injection moulding process of thermoplastics and the processing of polyurethane foams. Three parameters are investigated at three levels and a fourth parameter at two levels. The aim is to verify parameter influences for fast curing polyurethanes and an extension of new influences. The impact on the mechanical properties is shown through tensile tests and DMTA. Furthermore, the influence of the process on the thermal properties is shown by means of DSC and DMTA. It is shown that an increase of the mold temperature by 20 °C can increase the Young’s Modulus by 2% and the necking stress by 3%. Moreover, the residence time favours the rise of the Young’s Modulus more, but it slightly reduces the maximum necking stress simultaneously. An increase of the mass flow and the components temperature also improves the Young’s Modulus. Similar effects are shown for the storage modulus. In addition to the changes of mechanical properties, just by varying the process parameters, the glass transition temperature of the sets differs between 46 °C and 51 °C for an increase of 5 °C of the component temperature.
In addition, interdependencies between parameters can be determined, especially between the resin components’ temperature and the mass flow during the filling process. Using a calculated crosslinking density of the material according to Flory and Rehner, the authors are able to relate the thermomechanical properties to the chemical structure of the polyurethane and thus explain the differences in the thermomechanical results. In particular, a proof that this model is usable for temperatures below the glass transition temperature is given by the shown results. For the first time, the process influence of the RIM process on fast curing polyurethanes is shown and explained by the chemical crosslinking. A dependency of the parameters on the molecular structure of the polymer can be conducted. Moreover, the authors show that there is a definite dependency for crosslinked polyurethane elastomers on the molecular weight of the chain between the crosslinking points—leading to the finding that a shorter chain leads to a higher crosslink density, which benefits a high elasticity. Nevertheless, material-dependent values like the glass transition temperature also have to be taken into account. In addition to that, no explicit trend for the glass transition can be achieved by investigating one parameter at once. Strong mutual effects can appear during the variation of the component temperatures and the mass flow while injecting polyurethane.
The findings of this work can be used to understand the processing influence of the RIM process. They allow for estimating the influence of the process parameters on the later components’ thermomechanical properties according to their later mechanical applications. Nevertheless, a future product, for instance, a high-quality surface made out of fast curing polyurethane, has to be verified against individual requirements depending on the parameter set. For example, environmental degradation effects on the thermal or UV stability can be affected differently by the processing than the thermomechanical properties. A higher amount of crosslinking will be more critical for ageing resistance than the height of the glass transition temperature. Further experiments have to be done in this case for the relation of the processing influence to the stability properties. Ultimately, the process parameter dependency regarding the respective challenge needs to be checked individually. Considering parameter set 6 especially, one process parameter can decide over undesired side effects like a post crosslinking of the material. Such effects can lead to a later minor defect of the final coating of the product or even a failure of the whole part itself. Furthermore, the reduction of the Young’s Modulus of almost 8% and of the glass transition temperature by 31% before fully crosslinked, gained by slightly reducing the mass flow, could lead to a huge change of the functional component properties. The resistance against an abuse of force could be lowered and fall below the designed minimum.

Author Contributions

Conceptualization, P.L.; methodology, P.L.; validation, P.L. and M.S.; formal analysis, P.L. and M.S.; investigation, P.L.; resources, P.L.; data curation, P.L.; writing—original draft preparation, P.L.; writing—review and editing, M.S.; visualization, P.L.; supervision, M.S.; project administration, P.L.; funding acquisition, P.L. and M.S. All authors have read and agreed to the published version of the manuscript.

Funding

This research was funded by the German Federal Ministry for Economy and Energy (BMWK), Grant No. ZF4101115BL8.

Data Availability Statement

The data presented in this study are available on request from the corresponding author.

Acknowledgments

The authors thank KOSTAL Automobil Elektrik GmbH & Co. KG for the possibility to use their production facilities, the material contribution, and all the support while manufacturing. Moreover, the authors want to thank Rühl PUROMER GmbH for the chemical consultation and the material.

Conflicts of Interest

The authors declare no conflict of interest. The funders had no role in the design of the study; in the collection, analyses, or interpretation of data; in the writing of the manuscript, or in the decision to publish the results.

References

  1. Kim, S.-W.; Lee, H.-S. Analysis of impingement mixing for coating in injection mold. J. Korea Soc. Die Mold Eng. 2019, 13, 1–9. [Google Scholar]
  2. Bürkle, E.; Wobbe, H. Kombinationstechnologien auf Basis des Spritzgießverfahrens; Carl Hanser Verlag GmbH & Co. KG: Munich, Germany, 2016. [Google Scholar]
  3. Park, J.-L.; Lee, H.-S. Analysis for injection molding and in-mold coating of automotive armrests. J. Korea Soc. Die Mold Eng. 2019, 13, 45–54. [Google Scholar]
  4. Nummy, A. Direct Coating Technology for Improved Piano Black Appearance and Scratch Resistance. SAE Int. J. Mater. Manuf. 2018, 11, 261–266. [Google Scholar] [CrossRef]
  5. Yacoub, F.; MacGregor, J. Analysis and optimization of a polyurethane reaction injection molding (RIM) process using multivariate projection methods. Chemom. Intell. Lab. Syst. 2003, 65, 17–33. [Google Scholar] [CrossRef]
  6. Nishimura, H.; Kojima, H.; Yarita, T.; Noshiro, M. Phase structure of polyetherpolyol-4,4′-diphenylmethane diisocyanate-based reaction injection molded (RIM) polyurethanes. Polym. Eng. Sci. 1986, 26, 585–592. [Google Scholar] [CrossRef]
  7. Kang, C.; Song, Y.S. Enhancement in Surface Property via In-Mold Coating Process. Macromol. Res. 2021, 29, 185–190. [Google Scholar] [CrossRef]
  8. Singh, G.; Verma, A. A Brief Review on injection moulding manufacturing process. Mater. Proc. 2017, 4, 1423–1433. [Google Scholar] [CrossRef]
  9. Dang, X.-P. General frameworks for optimization of plastic injection molding process parameters. Simul. Model. Pract. Theory 2014, 41, 15–27. [Google Scholar] [CrossRef]
  10. Rahimi, M.; Esfahanian, M.; Moradi, M. Effect of reprocessing on shrinkage and mechanical properties of ABS and investigating the proper blend of virgin and recycled ABS in injection molding. J. Mater. Process. Technol. 2014, 214, 2359–2365. [Google Scholar] [CrossRef]
  11. Kusić, D.; Kek, T.; Slabe, J.M.; Svečko, R.; Grum, J. The impact of process parameters on test specimen deviations and their correlation with AE signals captured during the injection moulding cycle. Polym. Test. 2013, 32, 583–593. [Google Scholar] [CrossRef]
  12. Mok, S.; Kwong, C.; Lau, W. A Hybrid Neural Network and Genetic Algorithm Approach to the Determination of Initial Process Parameters for Injection Moulding. Int. J. Adv. Manuf. Technol. 2001, 18, 404–409. [Google Scholar] [CrossRef]
  13. Kalay, G.; Bevis, M.J. Processing and physical property relationships in injection-molded isotactic polypropylene. 1. mechanical properties. J. Polym. Sci. Part B Polym. Phys. 1997, 35, 241–263. [Google Scholar] [CrossRef]
  14. Leyva-Porras, C.; Esneider-Alcalá, M.A.; Teran, A.T.; Márquez-Lucero, A.; Aguilar-Martínez, J.A. Effect of Molding Parameters on Young’s Modulus of an Injection Molded Low-Density Polyethylene (LDPE). Ind. Eng. Chem. Res. 2013, 52, 5666–5671. [Google Scholar] [CrossRef]
  15. Gopi, J.; Nando, G.B. Effect of processing parameters on phase morphology and mechanical properties of thermoplastic polyurethane and polydimethylsiloxane rubber blends. Int. J. Plast. Technol. 2015, 19, 288–308. [Google Scholar] [CrossRef]
  16. Li, D.; Zhai, T.; Gong, Q.; Fei, G.; Xia, H. Effect of processing temperature on structure and properties of microinjection moulded thermoplastic polyurethane/multiwalled carbon nanotube composites. Plast. Rubber Compos. 2015, 44, 197–205. [Google Scholar] [CrossRef] [Green Version]
  17. El-Shekeil, Y.; Sapuan, S.M.; Zainudin, E.; Khalina, A. Optimizing Processing Parameters and Fiber Size for Kenaf Fiber Reinforced Thermoplastic Polyurethane Composite. Key Eng. Mater. 2011, 471–472, 297–302. [Google Scholar] [CrossRef]
  18. Mi, H.-Y.; Jing, X.; Peng, J.; Turng, L.-S.; Peng, X.-F. Influence and prediction of processing parameters on the properties of microcellular injection molded thermoplastic polyurethane based on an orthogonal array test. J. Cell. Plast. 2013, 49, 439–458. [Google Scholar] [CrossRef]
  19. Löhner, M.; Drummer, D. Influence of Processing Parameters in Reaction Injection Foam Molding for Multi-Layer Parts on Foam Structure and Mechanical Properties. Appl. Mech. Mater. 2015, 805, 131–138. [Google Scholar] [CrossRef]
  20. Jackovich, D.; O’Toole, B.; Hawkins, M.C.; Sapochak, L. Temperature and Mold Size Effects on Physical and Mechanical Properties of a Polyurethane Foam. J. Cell. Plast. 2005, 41, 153–168. [Google Scholar] [CrossRef]
  21. Ehrenstein, G.W.; Riedel, G.; Trawiel, P. Praxis der Thermischen Analyse von Kunststoffen, 2., völlig überarb. Aufl.; Hanser: Munich, Germany, 2003; ISBN 3446223401. [Google Scholar]
  22. Puszka, A. Thermal and Mechanical Behavior of New Transparent Thermoplastic Polyurethane Elastomers Derived from Cycloaliphatic Diisocyanate. Polymers 2018, 10, 537. [Google Scholar] [CrossRef] [Green Version]
  23. Yi, J.; Boyce, M.C.; Lee, G.F.; Balizer, E. Large deformation rate-dependent stress–strain behavior of polyurea and polyurethanes. Polymer 2006, 47, 319–329. [Google Scholar] [CrossRef]
  24. Sarva, S.S.; Deschanel, S.; Boyce, M.C.; Chen, W. Stress–strain behavior of a polyurea and a polyurethane from low to high strain rates. Polymer 2007, 48, 2208–2213. [Google Scholar] [CrossRef]
  25. Dany, R. Untersuchungen zum Mischungsverhalten von Flüssigkristallinen Polyurethanen mit Herkömmlichen Polyurethanen und Mit Vinylchloridpolymeren. Ph.D. Thesis, Technische Universität Berlin, Berlin, Germany, 2006. [Google Scholar]
  26. Schwarzl, F.R. Polymermechanik: Struktur und Mechanisches Verhalten von Polymeren; Springer: Berlin/Heidelberg, Germany, 2011; ISBN 3-540-51965-3. [Google Scholar]
  27. DIN EN ISO 527; Normenausschuss Kunststoffe. Deutsches Institut für Normung e.V.: Berlin, Germany, 2012.
  28. Fortman, D.J.; Sheppard, D.T.; Dichtel, W.R. Reprocessing Cross-Linked Polyurethanes by Catalyzing Carbamate Exchange. Macromolecules 2019, 52, 6330–6335. [Google Scholar] [CrossRef]
  29. Flory, P.J.; Rehner, J. Statistical Mechanics of Cross-Linked Polymer Networks I. Rubberlike Elasticity. J. Chem. Phys. 1943, 11, 512–520. [Google Scholar] [CrossRef]
  30. Mizera, K.; Ryszkowska, J. Thermal properties of polyurethane elastomers from soybean oil-based polyol with a different isocyanate index. J. Elastomers Plast. 2019, 51, 157–174. [Google Scholar] [CrossRef]
  31. Flory, P.J. Effects of Molecular Structure on Physical Properties of Butyl Rubber. Rubber Chem. Technol. 1946, 19, 552–598. [Google Scholar] [CrossRef]
  32. Petrović, Z.S.; Ilavský, M.; Dušek, K.; Vidaković, M.; Javni, I.; Banjanin, B. The effect of crosslinking on properties of polyurethane elastomers. J. Appl. Polym. Sci. 1991, 42, 391–398. [Google Scholar] [CrossRef]
  33. Tcharkhtchi, A.; Farzaneh, S.; Abdallah-Elhirtsi, S.; Esmaeillou, B.; Nony, F.; Baron, A. Thermal Aging Effect on Mechanical Properties of Polyurethane. Int. J. Polym. Anal. Charact. 2014, 19, 571–584. [Google Scholar] [CrossRef] [Green Version]
  34. Kästner, S. Eine einfache Theorie des mechanischen und dielektrischen Relaxationsverhaltens während der Bildung eines Polymernetzwerkes aus reaktiven Oligomeren. Acta Polym. 1980, 31, 341–347. [Google Scholar] [CrossRef]
  35. Li, S.; Vatanparast, R.; Lemmetyinen, H. Cross-linking kinetics and swelling behaviour of aliphatic polyurethane. Polymer 2000, 41, 5571–5576. [Google Scholar] [CrossRef]
  36. Ionescu, M. Polyols for Polyurethanes: Chemistry and Technology, 3rd ed.; De Gruyter: Berlin, Germany, 2019; ISBN 9783110640335. [Google Scholar]
  37. Segiet, D.; Raidt, T.; Özdem, H.; Weckes, S.; Tiller, J.C.; Katzenberg, F. Thermo-/moisture-responsive shape-memory effect of poly(2-ethyl-2-oxazoline) networks. J. Polym. Sci. Part B Polym. Phys. 2019, 57, 1053–1061. [Google Scholar] [CrossRef]
  38. Segiet, D.; Jerusalem, R.; Katzenberg, F.; Tiller, J.C. Investigation of the swelling behavior of hydrogels derived from high-molecular-weight poly(2-ethyl-2-oxazoline). J. Appl. Polym. Sci. 2020, 58, 747–755. [Google Scholar] [CrossRef]
  39. Cluff, E.F.; Gladding, E.K. Relation of structure to properties in polyurethanes. J. Appl. Polym. Sci. 1960, 3, 290–295. [Google Scholar] [CrossRef]
  40. Fuith, A.; Reinecker, M.; Sánchez-Ferrer, A.; Mezzenga, R.; Mrzel, A.; Knite, M.; Aulika, I.; Dunce, M.; Schranz, W. Dynamic- and Thermo-mechanical Analysis of Inorganic Nanotubes/Elastomer Composites. Sens. Tranducers 2011, 12, 71–79. [Google Scholar]
  41. Lee, S.H.; Shin, S.-R.; Lee, D.-S. Sorbitol as a Chain Extender of Polyurethane Prepolymers to Prepare Self-Healable and Robust Polyhydroxyurethane Elastomers. Molecules 2018, 23, 2515. [Google Scholar] [CrossRef] [Green Version]
  42. Szycher, M. (Ed.) Szycher’s Handbook of Polyurethanes, 2nd ed.; CRC Press: Boca Raton, FL, USA, 2012; ISBN 978-1-4398-3958-4. [Google Scholar]
  43. Fang, Z.; Zhou, M.; Zhong, J.; Qi, Y.; Li, L.; Dong, Q. Preparation and properties of novel ultraviolet-cured waterborne polyurethanes. High Perform. Polym. 2013, 25, 668–676. [Google Scholar] [CrossRef]
  44. Stepanski, H.; Leimenstoll, M. Polyurethan-Klebstoffe; Springer Fachmedien Wiesbaden: Wiesbaden, Germany, 2016; ISBN 978-3-658-12269-0. [Google Scholar]
  45. Kampouris, E.; Andreopoulos, A. Gel content determination in cross-linked polyethylene. Biomaterials 1989, 10, 206–208. [Google Scholar] [CrossRef]
  46. DIN EN ISO 11357; German Norm. 1–42. Deutsches Institut für Normung e.V.: Berlin, Germany, 2016.
  47. Krol, P. Synthesis methods, chemical structures and phase structures of linear polyurethanes. Properties and applications of linear polyurethanes in polyurethane elastomers, copolymers and ionomers. Prog. Mater. Sci. 2007, 52, 915–1015. [Google Scholar] [CrossRef]
  48. Chattopadhyay, D.; Sreedhar, B.; Raju, K. The phase mixing studies on moisture cured polyurethane-ureas during cure. Polymer 2006, 47, 3814–3825. [Google Scholar] [CrossRef]
  49. Long, T.R.; Elder, R.M.; Bain, E.D.; Masser, K.A.; Sirk, T.W.; Yu, J.H.; Knorr, D.B.; Lenhart, J.L. Influence of molecular weight between crosslinks on the mechanical properties of polymers formed via ring-opening metathesis. Soft Matter 2018, 14, 3344–3360. [Google Scholar] [CrossRef]
  50. Zhou, Y.; Choi, P. Molecular dynamics study of water diffusion in an amphiphilic block copolymer with large difference in the blocks’ glass transition temperatures. Front. Chem. Sci. Eng. 2017, 11, 440–447. [Google Scholar] [CrossRef]
  51. Olejnik, A.; Gosz, K.; Piszczyk, Ł. Kinetics of cross-linking processes of fast-curing polyurethane system. Thermochim. Acta 2020, 683, 178435. [Google Scholar] [CrossRef]
  52. Stanko, M.; Stommel, M. Kinetic Prediction of Fast Curing Polyurethane Resins by Model-Free Isoconversional Methods. Polymers 2018, 10, 698. [Google Scholar] [CrossRef] [PubMed] [Green Version]
  53. Heijkants, R.G.; Van Calck, R.V.; Van Tienen, T.G.; De Groot, J.H.; Buma, P.; Pennings, A.J.; Veth, R.P.; Schouten, A.J. Uncatalyzed synthesis, thermal and mechanical properties of polyurethanes based on poly(ε-caprolactone) and 1,4-butane diisocyanate with uniform hard segment. Biomaterials 2005, 26, 4219–4228. [Google Scholar] [CrossRef] [PubMed] [Green Version]
  54. Lin, T.A.; Lou, C.-W.; Lin, J.-H. The Effects of Thermoplastic Polyurethane on the Structure and Mechanical Properties of Modified Polypropylene Blends. Appl. Sci. 2017, 7, 1254. [Google Scholar] [CrossRef] [Green Version]
  55. Wan, H.; Bian, J.; Wu, J.; Sun, X.; Wang, Y.; Jia, Z. Prediction of Seasonal Frost Heave Behavior in Unsaturated Soil in Northeastern China Using Interactive Factor Analysis with Split-Plot Experiments and GRNN. Water 2019, 11, 1587. [Google Scholar] [CrossRef] [Green Version]
  56. Şimşek, B.; Uygunoğlu, T. A full factorial-based desirability function approach to investigate optimal mixture ratio of polymer concrete. Polym. Compos. 2018, 39, 3199–3211. [Google Scholar] [CrossRef]
Figure 1. Manufacturing overview; (a) manufacturing plant at KOSTAL Automobil Elektrik GmbH & Co. KG (Lüdenscheid, Germany); (b) scheme of the RIM tooling.
Jmmp 06 00053 g001
Figure 2. Uniaxial Tension Tests; (a) true stress–strain-behaviour dependent on different process parameters; (b) Young’s Modulus and necking stress dependent on process parameters (reference in orange).
Jmmp 06 00053 g002
Figure 3. DMTA Analysis; (a) temperature dependent storage modulus und loss-factor at 4.5 Hz; (b) process dependent values at 23 °C for the Storage Modulus and the Loss Factor (reference in orange).
Jmmp 06 00053 g003
Figure 4. Molecular mass of the chain between the crosslinking points (reference in orange).
Jmmp 06 00053 g004
Figure 5. DSC Analysis; (a) temperature dependent heat flow (parameter set 6) for the first heat cycle (continuous line) and the second heat cycle (dashed line); (b) glass transition temperature for all processes in the second heat cycle (reference in orange).
Jmmp 06 00053 g005
Figure 6. Proof of a post-reaction; (a) comparison of the first heat cycle of parameter set 6 and 7; (b) exothermic area fraction of the post-reaction to calculate the enthalpy.
Jmmp 06 00053 g006
Figure 7. Interaction plots; (a) interdependence between T c and m ˙ in consideration of E′; (b) interdependence between T c and m ˙ in consideration of Tg; (c) interdependence between T c and t in consideration of E′; (d) interdependence between T c and t in consideration of E .
Jmmp 06 00053 g007
Table 1. Design of Experiments setup.
Parameter Set T t in °C t H in s m ˙ in g/s T C in °C
180601665
290601665
3100601665
490801665
5901001665
690601565
790601765
890601670
990601770
10901001670
Table 2. Change in enthalpy of each sample.
Sample Name Enthalpy   Δ H   in   J / g  
6-10.271
6-20.038
6-30.181
Publisher’s Note: MDPI stays neutral with regard to jurisdictional claims in published maps and institutional affiliations.

