1. Introduction
Producing businesses participate in a global supply market and deal with a dynamization in manufacturing associated with personalized products through shorter product cycles and consequently smaller quantities of individual product variants [
1,
2,
3]. Originally known as rapid prototyping, the innovation of creating a three-dimensional object layer by layer has evolved as 3D printing and has gained importance for the production of prototype parts across many applications [
4]. Additive manufacturing (AM) does not require forming or cutting tools, coolants or other aids used in conventional manufacturing. The technology enables design optimization combined with the ability to produce custom parts on demand. This has led to an increasing number of single parts and small batches of complex components, often with functional integration, being produced using 3D printing [
5].
Though the shape of polymers is well mastered by the available AM methods, the adaptation to metallic and ceramic masses is subject to several challenges. Materials used in AM are based on conventional compositions still tailored to conventional manufacturing, not considering the directional thermal gradients occurring during AM, resulting in severely textured microstructures associated with anisotropic structural properties [
6,
7,
8]. The manufacturing chain for ceramic components is not completed with the production of the 3D part geometry, but represents just an intermediate step and is followed by the generation of the final material characteristics through thermal processing by means of debinding and sintering [
9,
10,
11,
12]. Furthermore, some AM techniques are not applicable for the production of ceramic components. With regard to the shaping of technical ceramics, powder printing is suitable for creating porous structures. Suspension, paste or feedstock-based processes are used to produce components with high density. In these processes, the powdered raw materials are first homogeneously dispersed in a binder system, since these dispersions can be applied very well, despite a high packing density. Multi-material jetting (CerAM MMJ, previously CerAM T3DP [
13]), enables the additive processing of both metallic and ceramic materials [
14]. The processed materials demonstrate particularly high solid contents (up to 67% by volume) and are applied dropwise. Thus, it is possible to deposit droplets of different materials side by side and manufacture multi-material components [
15,
16].
The droplets can be adapted to the component to be produced by a large degree of freedom in parameterization. Therefore, large volumes can be processed very quickly and fine structures can be displayed in detail, based on droplet size. The droplet method offers advantages, as the material of the ceramic highly filled suspensions is deposited droplet by droplet, and thus the material is applied at a defined position in a spatially resolved manner. In addition to accurately separated areas, material gradients within a component can be realized [
17,
18,
19]. Through the specific selection of materials, the modification of the starting powders as well as the targeted adjustment of the feedstock properties, the shrinkage behavior can be adjusted in a manner that permits defect-free co-sintering and final densities of up to 99% of the theoretical density can be achieved [
13,
14].
Despite many additive manufacturing methods being more established and reliable than a few years ago, there are still challenges in the use of this relatively young technology [
20]. Geometric deviations, internal stresses and anisotropic mechanical properties limit the practicability of additively manufactured components [
21]. Industrial products typically have to have a certain surface roughness and meet tight dimensional and shape tolerances that cannot be achieved with rapid prototyping methods without a profound knowledge of the printing process [
22]. This leads to the need to implement closed-loop monitoring and the control of AM processes in order to ensure that the industry can benefit from AM technology [
23,
24,
25].
Data-driven methods such as data mining (DM) and machine learning (ML) contribute to the development and optimization of new materials and the related manufacturing processes beyond the limits of existing empirical knowledge [
26,
27]. Data-driven methods also enable an increase in production efficiency [
28,
29,
30], accompanied by methods for condition monitoring and demand-oriented maintenance increasing plant availability [
31]. However, production-relevant data for the condition monitoring of individual machine components or for process optimization are often not fully utilized. Instead, users tend to rely on traditional methods and experience-based knowledge when commissioning processes that are bound by deadlines and various restrictions. As a result, process or machine failures occur unnoticed during the production process due to the lack of real-time detection, and the quality and reproducibility of the products cannot be guaranteed [
32]. In the case of additive manufacturing processes, with the building times per component often lasting several hours, this becomes very expensive and hinders the further spread of the process.
Recent works aim to present an overall framework of big data-based analytics to optimize the production performance of additive manufacturing process, showing benefits to customers, manufacturers, the environment and even all aspects of the manufacturing phase [
33]. Further studies link structure and properties by a mechanistic model and clustering analyses to capture a variety of material responses, illustrating the process–structure relationship [
34]. Certain studies show that the numerous influencing factors emerging from AM processes motivate the need for novel rapid design and optimization approaches, for which purpose data-mining is proposed as an effective solution [
35].
Dynamic mechanical analysis (DMA), to measure the mechanical material properties of printed components and composite structural elements, as well as construct a reliable finite element model, which is validated by thermoelastic strain analysis (TSA), has proven to enable predictions of the performance of new structural elements before printing [
36]. Further studies focus on the numerical and experimental investigation of the mechanical behavior of periodic cellular 3D single-material cellular structure and the corresponding co-continuous composite material, using multi-material fused deposition modelling (FDM) technology to fabricate different volume fractions of the desired geometry [
37]. Recent publications use the approach of the statistical design of experiments in order to successfully determine the relationship between the influencing factors and target variables as accurately as possible with optimum experimental effort, for example for FDM [
38] or also for metal additive manufacturing with directed energy deposition [
39].
Within the scope of this task, the process understanding is to be increased by applying the methods of quality management in order to be able to fully exploit the potential of CerAM MMJ. The acquisition of a thorough understanding of the process is addressed, which comprehensively describes the trilateral correlation between the machine, material and process parameters.
The complexity of the CerAM MMJ requires a systematic approach to experimental design. One-factor-at-a-time methods are unsuitable here since correlations among several influencing factors are not recognized and experiments only produce optimal results by chance. Therefore, methods of statistical design of experiments (DoE) were applied. DoE allows the many factors to be varied to reflect the effects and interactions. Despite the DoE, the experimental programs can become very extensive for many parameters. For this reason, single factor preliminary tests were carried out to determine the most influential factors and to reduce the detailed test series to these. The identification of key influences aims to enable the optimization of droplet geometry according to the target properties by the means of a multifactorial design of experiments.
2. Experimental Procedure
The process chain of CerAM MMJ can be categorized into the three sequential process steps of feedstock production, green part production and thermal post-treatment, further structured into debinding and sintering (see
Figure 1). This can be followed by the ablative finishing of functional surfaces resulting in the final component. The semi-finished products of the individual process stages must fulfil the defined target properties that form interfaces between individual process steps. As final component characteristics occur during thermal post-treatment, the process stage of green part production is not initially assigned the direct target characteristics included in process monitoring, which makes it important to identify the cause-and-effect relationships to this process step in experimental investigations. In order to determine the interaction between the processing steps, intermediate results in the form of parameters (shape, dimension, possibly locally resolved into thick or thin walls, radii of curvature, etc.) must exist on the green part, which allow conclusions to be drawn about correlations or shrinkage.
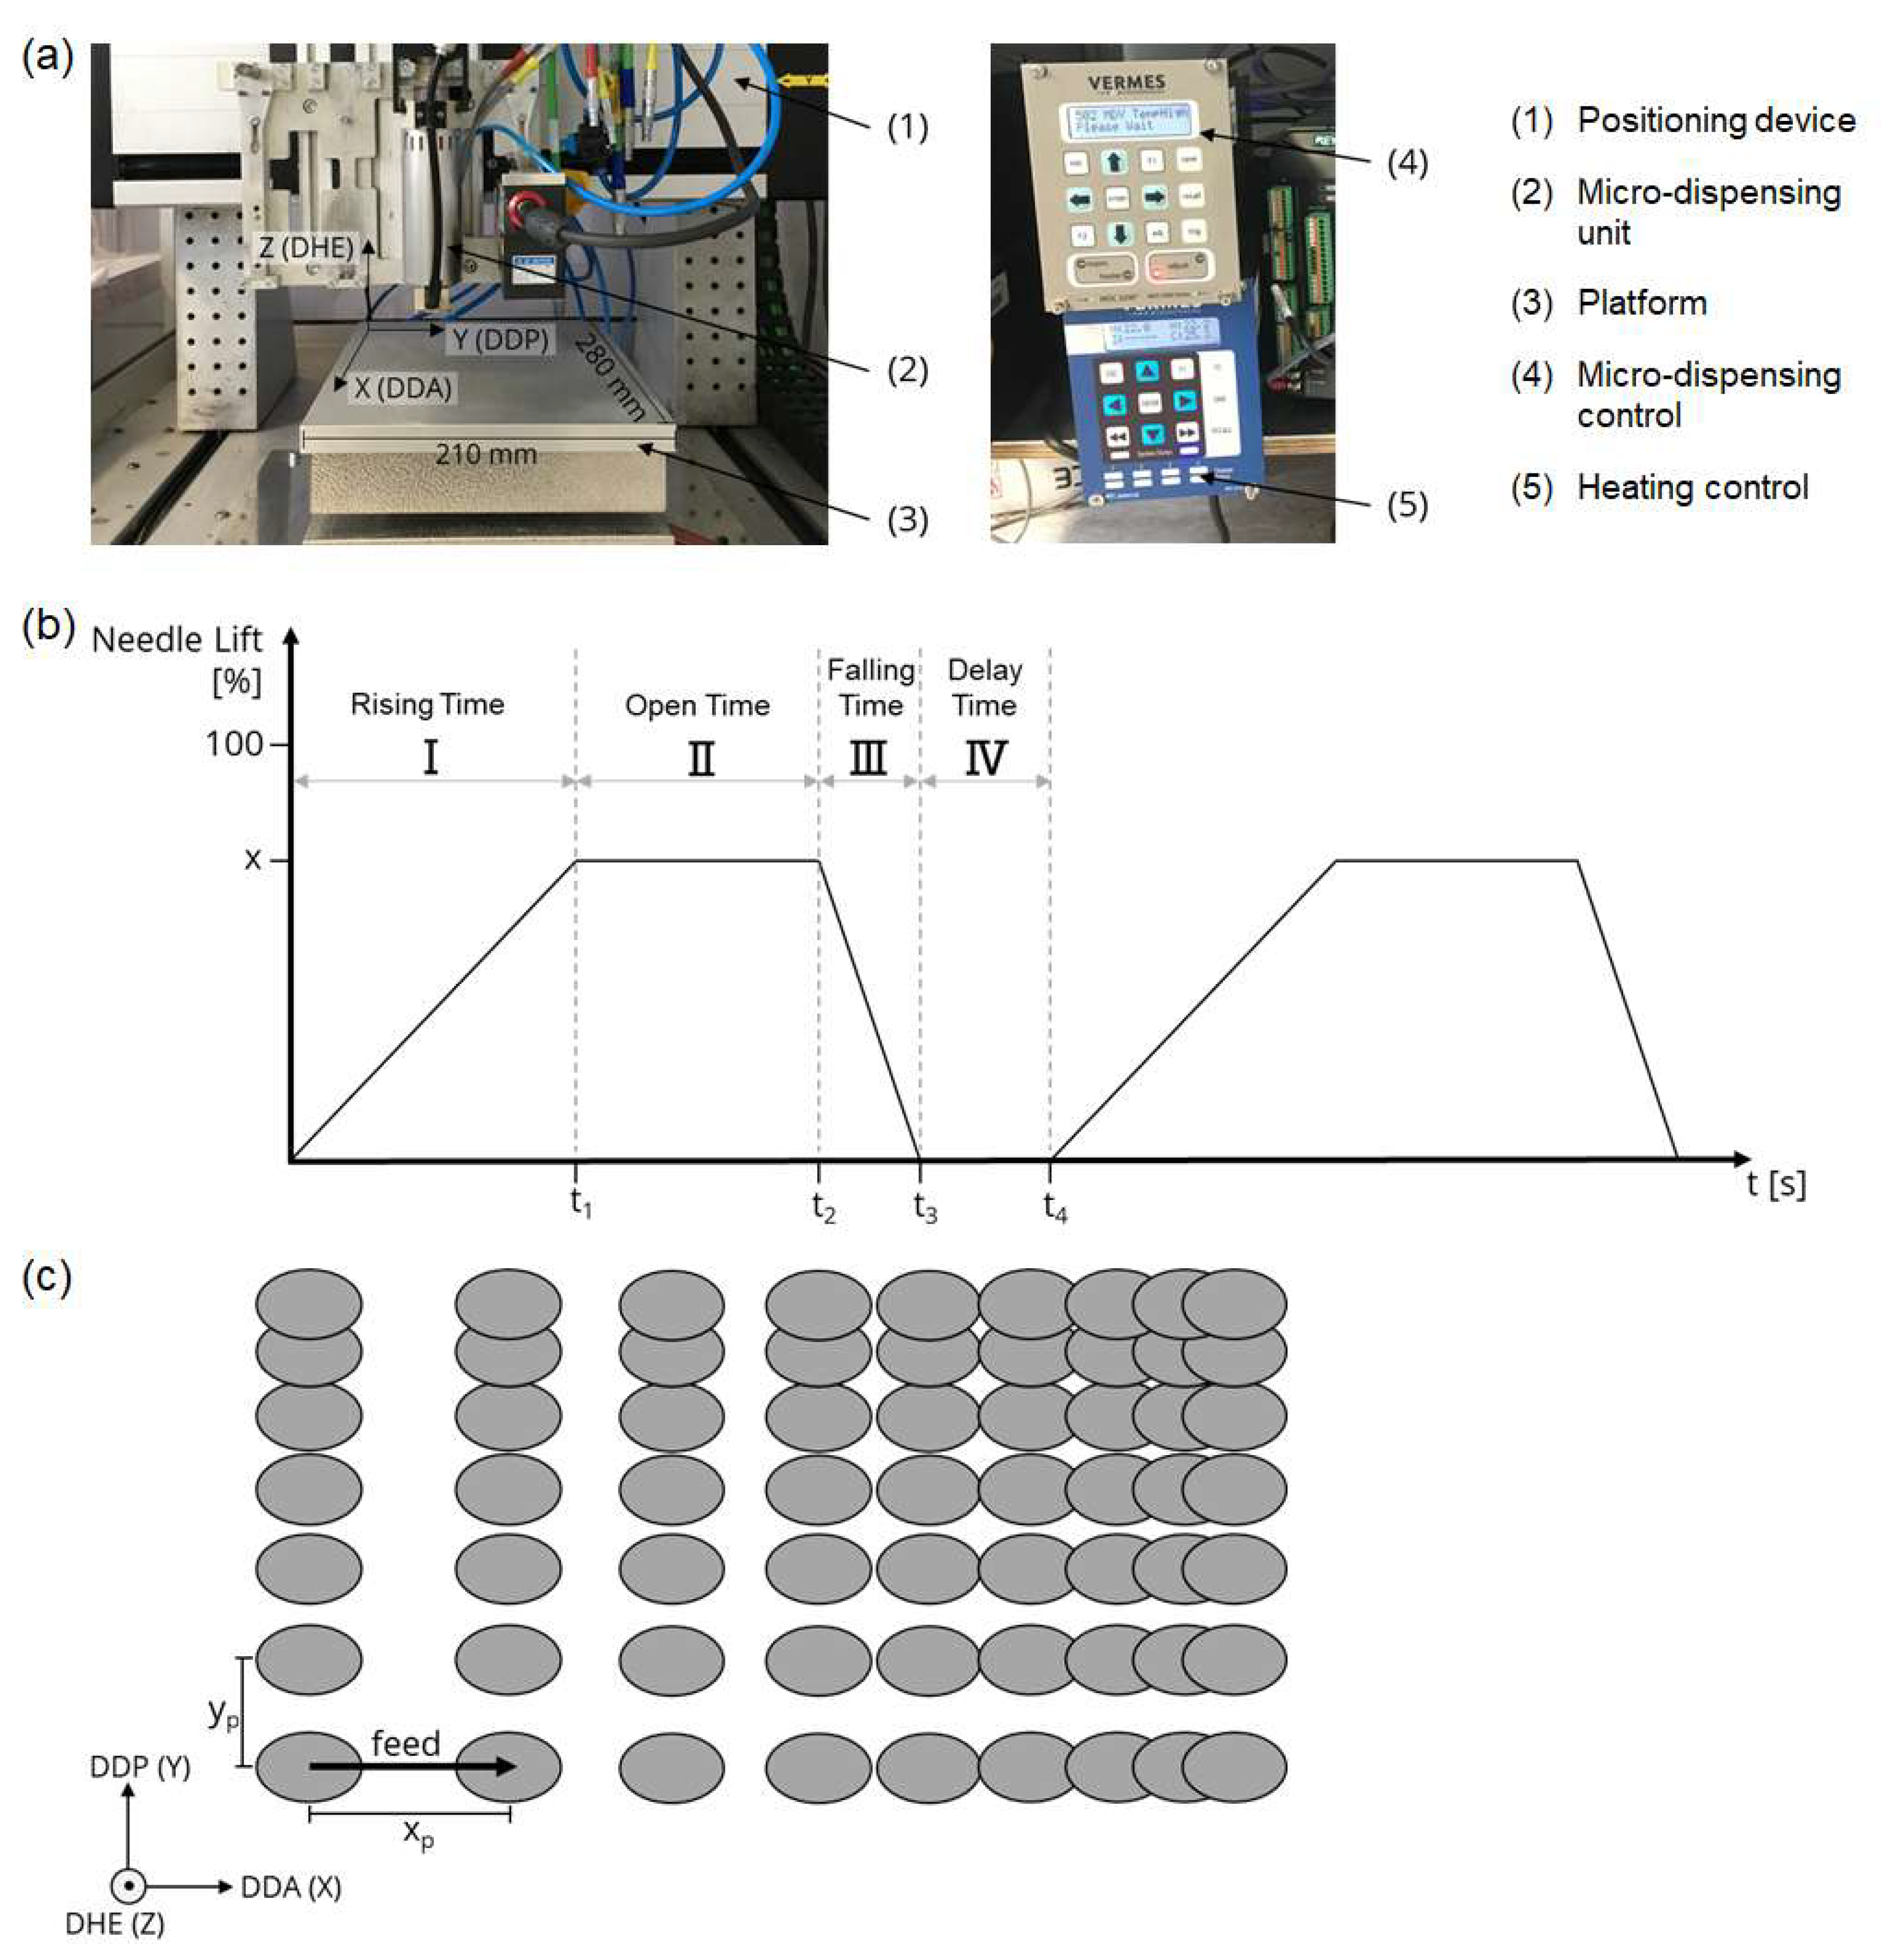
The system for CerAM MMJ (see
Figure 2a) consists of a positioning device (1), a micro-dispensing unit (2) and the platform (3), with a prototype control system driving these components. Orthogonal linear drives (ISEL Automation KG) enable the positioning of the dosing system along cartesian coordinates with a maximum travel speed of 22.5 mm·s
−1. The build plate (3), which can be heated up to 100 °C by an integrated heating bed, permits a maximum build size of 280 × 210 mm. The maximum total build space is described through a maximum z-coordinate travel of 120 mm. A micro-dispensing system (Vermes Microdispensing GmbH) consisting of micro-dispensing valve, cartridge heater, nozzle heater and controls (4) is used for the controlled deposition of the thermoplastic feedstock. In the dispensing unit, a piezo actuator, connected by a lever, realizes the tappet stroke of the micro-dosing valve. The interaction of the components permits the dosing of high to ultra-high viscosity media with a maximum viscosity of 2000 Pa·s. The heatable micro-dispensing system enables the selective and parameterizable deposition of the feedstock in droplets, constituting the basis for the generation of further component geometries via the preliminary features like lines and surface patterns. The material used for the described experiments in thermoplastic 3D printing is silicon nitride Si
3N
4.
The dosing process constitutes a cycle consisting of four phases defined by five parameters (see
Figure 2b). At the beginning of the dosing cycle, the tappet of the dosing unit is in a closed state. The parameter rising time (RT) defines the time in which the tappet switches to the open state. This causes a depression in the nozzle chamber, resulting in feedstock flowing into the chamber. The period in which the tappet remains in open state is defined by the open time (OT), in which the dosing medium is given time to fill the nozzle compression space in a defined manner. The switch back to the closed state of the dosing unit is described by the falling time (FT). The delay time (DT) describes the time lag until the dosing starts again. The needle lift represents the percentage stroke of the dosing tappet and thus the maximum dosing volume. Since the parameters RT and FT specify the time required for this, a correlation between these variables and the needle lift with the tappet speed is given. In addition to the variables describing the dosing cycle, other relevant dosing parameters define the environmental conditions of the dosing process, including cartridge temperature, nozzle temperature and air supply pressure.
The
Figure 2c illustrates the key geometric output variables used for evaluation in this study: the droplet dimension in the feed direction, the drop diameter aligned (DDA), the droplet dimension perpendicular to the feed (DDP), and the droplet height (DHE). The basis for the generation of components by the CerAM MMJ are the feedstock droplets deposited by the MDS as the smallest volume elements. The transition from line structures to area structures results from the overlapping of the lines in the y-coordinate yp. The repetitive generation of spatial structures eventually facilitates the generation of complex component 3D geometries. A non-contact laser profile scanner LJ-V7020 (Keyence) was used for the surface measurement of the generated structures. Based on two-dimensional height profilometer data from the laser scanner, through the linear movement of the profilometer across the specimen, the derivation of three-dimensional height profiles was compiled for test evaluation. All the measurements for the proposed optimization approach were recorded with the described laser scanner profilometer and processed with software according to the procedure described in the following section.
3. Process Data Management
It has already been mentioned that the understanding of the interactions both within the individual process steps such as CerAM T3DP and across the whole process chain should be generated in a data-driven way. This requires a holistic, technology-oriented data acquisition, an integrative data management and suitable algorithms for the data analysis. The basis for both the technology-oriented data acquisition and the design of experiments, and last but not least, the data analysis is a graphical process model. The graphical process model [
40,
41] of the process chain CerAM MMJ is created based on the technological sequence (
Figure 1), the machines, tools and test equipment used with the associated influencing parameters (
Figure 2a–c). Supporting methods for the discussion of relevant influencing parameters can be the Ishikawa diagram (see
Figure 3). The Ishikawa Diagram is the graphical representation of the causes (major causes, with sub-branches for root causes) that lead to or significantly influence a result (part quality). The input for the cause-and-effect diagram is based on experience knowledge, the results of preliminary investigations or literature references.
Influencing factors that are hardly variable, hardly reproducible or not measurable due to missing instrumentation can be identified and excluded for further considerations. This permits a limitation of the influencing variables to be considered and thus a reduction in the experimental effort. Influences of the group “machine” are not suitable as test variables due to missing detectability and poorly definable changes according to factor levels. By cleaning and calibrating the dosing system, as well as carrying out reference runs before the start of a test plan, the influence is reduced anyway. Steps prior to commissioning the system minimize the effect of the secondary influence of the “preparation of the system” on the printing process. In close cooperation with the process operators and training on the plant, the influence of “experience” is also excluded from consideration. The environmental conditions summarized in the group “Medium” can be measured, but not factorially controlled. Therefore, these influences are to be dealt with as noise. Finally, all influences caused by post-processing steps are eliminated, as thermal post-treatment is omitted. By applying the cause-effect diagram, it has become possible to reduce the scope of the influencing variables to be investigated to a number of nine (highlighted in grey in the
Figure 3). Then, the experimental designs are drawn up based on these constraints.
The graphical process model visualizes the dependencies of individual process steps on other process steps. The material flow chart identifies the production of the feedstock, 3D printing, finishing (green part), debinding, sintering, and finishing (white or sintered part) as key process steps. In the following, the focus is on the production of the feedstock and on the AM of the green part. In order to achieve a suitable and effective scope of experiments, a statistical design of experiments (DoE) is implemented [
42]. The creation of a prognosis serves to determine which analysis methods are to be applied to the experimental data, according to which the data acquisition strategy is aligned.
The subsequent focus of work is the development of a data management system in order to be able to collect, process and store the data belonging to the parameters of influence defined in advance. The software must be configured in a manner permitting all the data to be recorded in the required condition. Therefore, machine interfaces, data input masks and data import filters must be configured. An important aspect of data management is the definition of an identification system that enables the material flow or test items to be tracked and unambiguously assigned to the data. Each test specimen requires a unique identifier, which must also be recorded as a parameter. Based on the technological process chain (
Figure 4a), an engineering workflow (
Figure 4b, showing section of engineering workflow for the AM process step) can be derived, which contains steps to be executed and ensures that the required process knowledge is available. The activities design of experiments, fabrication of test specimens and the evaluation of predefined characteristics are assigned to the processes. The data can be assigned to instruction design, experimental design, work instruction, process raw data (sensors), process raw data (machine), meta data template, evaluation instruction, process parameters, sample body properties, and cause–effect correlation.
During the acquisition of the relevant experimental data and the analysis and synthesis of the acquired data, the characteristics of the components instances and the state changes of the process and resource instances are logged and stored in the database. The assignment of responsibilities and appropriate resource planning for the implementation of the data management plan must be taken into account. In order to guarantee this, specifications such as ID, project, owner, contact, creation date, processing date, format, software, size and number must be defined for the meta data. All the knowledge gained from the modelling and analyses is stored systematically and in a structured manner to enable effective reusability and thus form a process knowledge database. Insights are identified process windows (as manufacturing parameters), material parameters (as a basis for simulation applications), models of cause–effect relationships (as a basis for process control) and process models (as a basis for process planning). The transfer of the demands on the required data management from a methodological and production–technological point of view achieved with the concept developed makes no claim to comprehensiveness, from which follows the need for the successive development of the data management plan.
The data collected during the test series are evaluated by in-house programmed software. The data processing starts with reading in the recorded raw data, containing z-values stored line by line, i.e., the height coordinates. This file consists of up to 15,000 height profiles, which can be combined into a three-dimensional height profile by additionally specifying the trigger rate during the measurement and the travel speed of the measuring head. Once the data are imported, error values are filtered out, whereby all the values less than −5.2 mm are regarded as error values due to the limited measuring range in z coordinates and are replaced by the global minimum. Then, a conversion to a grayscale image is carried out, whereby the measured values are normalized to a value between zero and one by 256 increments. This permits computing the image background by applying various filters, such as the median filter, and describing the background with polynomials, and subsequently subtracting the image background from the grayscale image, thus creating a corrected grayscale image. The image foreground thus consists of segmentation sections, which represent objects and are labelled. From the generated objects, the maximum droplet dimensions in cartesian coordinates as well as the surface and volume can be determined, which enables a classification into the object classes droplets, satellites and residual. As a result of the data processing, output files are created, which are stored in a project folder containing a summary file, covering all the segmented droplets with their characteristics, as well as overview images of the overall data and the individual droplets and a processing protocol is generated.
4. Results and Discussion
The DMAIC methodology proposes in the first phase the definition of the target condition [
43]. For the description of the intended condition, the following target values are introduced for the produced droplets:
These are evaluated according to their significance for product quality, and thus enable an evaluation of the structures produced, taking into account several target values in parallel. The resulting sum of the assessment finally permits a quantitative comparison of the different test series within a ranking.
Figure 5 shows a comparison of the target parameters for the droplets produced showing poor circularity and a high amount of satellite particles (
Figure 5a), or good circularity and a low amount of satellite particles (
Figure 5b).
Following the definition of the starting or central points for the optimization experiments, the description of the main effects of the test variables is carried out. Therefore, the relationships with the output variables (droplet dimensions in the feed direction DDA, droplet dimension perpendicular to the feed DDP and drop height DHE) are functionally described by including all the factor levels of a test variable, indicating the response of the output variables to the defined change of the test variable within the value range investigated.
Figure 6 summarizes the effects of the test variables falling time (FT) and needle lift (NL) for the preliminary tests. The graphs of the function including the droplet samples per test ID, the model equations and the slopes around the initial point are given. A comparative examination of the slopes makes evident that the main effects are quantified, but are not suitable for a comparison of the effect strengths. The first derivation of the model equations for the output variable DDA could indicate that the falling time has a greater influence on the droplet diameter DDA than the needle lift. The increase just indicates how the output quantity changes when the test quantity changes by the value one. Thus, an increase in the falling time FT by 1.00 ms results in a reduction of the drop diameter DDA by 703.16 µm. Instead, increasing the needle lift NL by 1% increases the drop by 11.014 µm. Due to the defined value range of the test variables, it is not possible to change the falling time FT by 1.00 ms. In contrast, changing the needle lift NL by 1% is unproblematic. The gradients are not dimensionless and do not allow an estimation of the effect strengths of individual test variables. By including the results of the hypothesis tests, a unitless comparison can be made and at the same time the significance of the effects can be evaluated.
Regression analyses were carried out for the test variables and the gradients were calculated at the initial point (see
Table 1).
In order to assess the significance of the modeled main effects and to calculate sensitivity, null hypotheses are tested. Only the result data of the starting point as well as those of the adjacent factor levels are included in the analysis, since these reflect the value range to be tested within the optimization experiments according to the centrally composed experimental designs (CCD) design. Thus, three subsets with different sample sizes and standard deviations are analyzed, which makes the application of the Welch test necessary [
44,
45]. For the assessment of the significance of the main effects, a probability of error of five percent is accepted, thus the test can correctly conclude a significant correlation with a probability of 95% [
46]. Since six factors of influence were given a positive significance assessment and a reduction to four parameters is required, the selectivity of the tests is included in the evaluation.
Under the recommended choice of a β-error of 10%, the selectivity test indicates the minimum difference that a sample must deviate from the mean value of the sub population in order to be classified with a 90% probability as not belonging to the corresponding sub population. Thus, the selectivity represents a minimum deviation value of the output quantity, which must be initiated during the optimization experiments under constant experimental conditions [
46].
As a result of the statistical methods, the increase in the model function at the initial point of the optimization, as well as the necessary deviation of the output variable to prove an effect, can be specified.
Figure 7 shows the correlation between these two results on the needle lift effect.
As shown in
Figure 7, the rise triangle enables the evaluation of a theoretical minimum factor level FS
min,DDP according to Equation (1):
FS
min,DDP indicates the minimum alteration of the test variables necessary to generate results from a different subpopulation with 90% probability, representing the minimum factor level for the optimization experiments. The calculated selectivities of the tests and the resulting minimum factor levels are listed in
Table 2.
For a comparison of the effect scores, the minimum factor levels are put in relation to the material-specific value range of the test size (see
Table 3). The resulting ratios define the percentage alteration of the test variable necessary to produce selective results at the initial point of optimization. The calculated results are dimensionless, permitting a quantitative comparison among each other and enabling the reduction of the number of test parameters. The factors are chosen which require relatively small changes. The test variables feed rate, open time and nozzle temperature require comparatively large percentage alterations and are therefore less suitable for further investigation. The parameters falling time, needle lift, rising time and air supply pressure are further investigated.
With the elaborated technological correlations, the necessary boundary conditions for the establishment of a response surface design are given, with the minimum theoretical factor levels to be replaced by practically appropriate values, FSprak (see
Table 3). The practical factor levels are chosen higher in amount, preferring round values.
This enables an experimental design to be set up, which provides response surfaces as results, permitting the prediction of an output variable in the investigated variable space. Centrally composed experimental designs (CCD) as representatives of the response surface designs are suitable for the realization of contour plots. In doing so, the experimental design should fulfil the properties of orthogonality and rotatability [
47].
Since correlations occur in mixing more than two factors within an experimental design, it is necessary to set the parameters not to be visualized to zero for the split consideration of two factors.
Figure 8a,b compares the effects and interactions of several test variables on droplet height DHE. The number of isolines, each of which limits a value range of 5 µm, indicates the magnitude of the effects. The alteration of the air supply pressure ASP and the rising time RT causes a maximum change of the droplet height DHE in the test range of about 15 µm, in contrast, the influence of the falling time FT and the needle lift NL on the droplet height DHE is significantly stronger with changes of more than 50 µm. The distance between the contour lines provides further information about stronger or weaker effects. For example, the effect of both variables on the droplet height DHE is stronger with a needle lift NL of more than 40%. The fact that
Figure 8a shows comparatively few contour lines implies that the two factors have little influence and do not interact strongly. This gives an indication that the factor levels are unsuitable and should be adjusted retroactively. The simultaneous representation of two influencing variables permits an estimation of the most efficient modification of the target characteristics by the means of the method of sharpest slopes, since the shortest path to a maximum or minimum is given by a vector which intersects the isolines at right angles and points to the desired target (see
Figure 8b) [
38]. Increasing the needle lift NL by 1% and simultaneously reducing the falling time FT by about 0.01 ms effectively reduces the droplet height DHE. The vector can be extrapolated beyond the variable space, whereby in the case of non-linear response contours the direction of a maximum or minimum is only approximated [
48].
The contour plots in
Figure 8c,d show the effect on the standard deviation of the droplet dimensions. The contour plot shown in
Figure 8c shows the minimal effect of open time OT compared to needle lift NL. While the variation of the needle lift NL has a minimum effect at B %, the variation of the open time OT does not cause a substantial change in the standard deviation. In contrast, the contour plot in
Figure 8d represents a punctual extremum in the fringe area of the variable space, whereby the curves of the isolines support this assumption. Since an extrapolation of the response surface in nonlinear contours only permits approximations, the possibility must be considered that the extremum has a line-like continuation in the adjacent variable space.
The methodology for process knowledge discovery can generally be transferred to other AM processes. It is recommended to start with a definition of technological process limits and material limitations. Then, in a screening phase, significant influencing variables are to be identified. This includes the definition of the starting point of the optimization, the evaluation of the most significant parameters in relation to relevant process parameters (in the case of CerAM MMJ drop dimensions (X,Y,Z)) using regression models’ statistical tests, as well as the determination of reasonable factor levels. Finally, in the optimization phase a response surface methodology (central composite design) is used to improve the results of a specific variable by optimizing the factors. The developed methodology can be applied to any feedstock. It should be noted that the influencing factors depend not only on the process parameters but also on the material (specific heat capacity, thermal conductivity or specific surface of the powders) and the feedstock required for shaping (flow behavior, etc). While the effect of the parameters under consideration remains the same, the range of values can change significantly. Exceeding defined parameter limits leads to drops with characteristics unsuitable for the manufacturing process. For example, if the falling time is too low, the drops may burst on the printing substrate, while if the falling time is too high, no more drops are applied and the material collects at the nozzle. Another effect of using unsuitable process parameters is that the defined standard deviation is exceeded. For the manufacturing process, the reproducibility of the drops is an essential point.
In general, the statistical design of experiments requires an already existing fundamental understanding of the relationships between the variables investigated, otherwise unsuitable parameter windows will be considered strong discontinuities in the correlations which will be subject to a lack of sampling precision. The analysis of the interactions is only carried out via geometric state variables, and not, for example, on the basis of material investigations, which is why no conclusions can be drawn about the further effects on component properties. Possible causes of potential process errors or uncertainties include the sedimentation of the suspension, blocking at the nozzle opening by grains and the incomplete melting of the suspension. Analysis errors result from the inadequate tilt correction of the real building platform as well as incorrect regressions due to the infringement of scanning criteria. In any case, prevention requires discovery first, which can only be ensured by holistic empirical knowledge, which is acquired by examining the functional relationships of parts, assemblies and components as well as processes and sub-process steps.

 ,
, 


