Article

A Lightweight, Robust Exploitation System for Temporal Stacks of UAS Data: Use Case for Forward-Deployed Military or Emergency Responders

Spatial Sciences Institute, University of Southern California Dana and David Dornsife College of Letters, Arts and Sciences, Los Angeles, CA 90089, USA
*
Author to whom correspondence should be addressed.
Drones 2019, 3(1), 29; https://doi.org/10.3390/drones3010029
Submission received: 21 February 2019 / Revised: 16 March 2019 / Accepted: 20 March 2019 / Published: 22 March 2019

Abstract

:
The availability and precision of unmanned aerial systems (UAS) permit the repeated collection of very-high quality three-dimensional (3D) data to monitor high-interest areas, such as dams, urban areas, or erosion-prone coastlines. However, challenges exist in the temporal analysis of this data, specifically in conducting change-detection analysis on the high-quality point cloud data. These files are very large in size and contain points in varying locations that do not align between scenes. These large file sizes also limit the use of this data for individuals with low computational resources, such as first responders or forward-deployed soldiers. In response, this manuscript presents an approach that aggregates data spatially into voxels to provide the user with a lightweight, web-based exploitation system coupled with a flexible backend database. The system creates a robust set of tools to analyze large temporal stacks of 3D data and reduces data size by 78%, all while being able to query the original point cloud data. This approach offers a solution for organizations analyzing high-resolution, temporal point-clouds, as well as a possible solution for operations in areas with poor computational and connectivity resources requiring high-quality, 3D data for decision support and planning.
Keywords:
UAS; drone; 3D; voxel; point cloud

1. Introduction

1.1. Unmanned Aerial System (UAS)-Derived Three-Dimensional (3D) Data More Ubiquitous

Improvements in computation as well as in precise and repeated collection from satellite, aerial, and UAS are making 3D data more commonplace [1]. The advent of UAS means that the acquisition of 3D data is shifting from aerial or satellite-based to UAS-based collection methods because they are easy to fly, cheap, and mobile [2]. Advances in technology created a vast inventory of UAS with differing categorizations based on size, weight, operating range, and certification potential [3]. As UAS have become more commonplace, regulatory bodies and associations formed in order to develop policies and standards on all aspects of civil aviation activity [1]. UAS fill the gap between terrestrial collection, which is limited by accessibility, and airborne or space-based collection with sensors at 20 MP and endurance of 20 minutes for an inexpensive quadcopter [4]. As platforms, UAS with fixed wings are also collecting increasingly larger areas with endurance of over an hour with 18-MP sensors [5]. Additionally, improvements in miniaturization allow for different sensors, such as multispectral, thermal, and Light Detection and Ranging (LIDAR) to be carried on UAS. With ground-reference GPS points or more expensive UAS-based real-time kinetic (RTK), georeferencing is down to horizontal and vertical accuracies of 3 cm and 5 cm, respectively [5].
Three-dimensional imagery analysis occurs through the formation of the data into a point cloud, which is comprised of a 3D coordinate system where each point contains a set list of attributes, including but not limited to the color (e.g., red, green, blue, near-infrared), location, and time of acquisition [6]. Preprocessing of image data must occur in order to provide the best final product for analysis. This processing entails photo alignment, geometry building, and the texture construction if required [7]. UAS photogrammetry opens various new applications in close-range aerial environments and introduces low-cost alternatives to traditional manned aerial photogrammetry [8,9]. These qualities make UAS all the more valuable, both operationally and in research. Operationally, they are increasingly being used in such fields as forestry and agriculture, archaeology and cultural heritage, environmental surveying, traffic monitoring, and most recently in 3D reconstructions of man-made structures [10]. According to a recent analysis of keywords relating to ‘UAS’ and ‘Drone’, UAS are increasingly cited in academic literature as they become more accessible and as technology permits new uses of them [2].

1.2. Challenges with UAS-Derived 3D Analysis

While the greatest advantage of UAS is the fast delivery of high-quality temporal and spatial resolution image information, the space needed to manage and store resulting data is large. Organizations are finding themselves with very large quantities of high-resolution spatial data with UAS serving as cheap, convenient collection platforms. After processing the most detailed data, and correspondingly the largest file size, is a 3D point cloud (LAS, the industry standard for 3D data). The 3D point cloud points are adaptively concentrated in areas to preserve edges and on difficult-to-process textures, such as trees, all while avoiding an accumulation of points within a flat surface [10].
On average, the authors produced a 113 MB point cloud after only an 8-min flight with an inexpensive 12-MP camera on a quadcopter. Repeated flights over high-interest areas quickly result in large temporal ‘stacks’ of point clouds of their selected projects. Temporal exploitation of this data is difficult because of the large file sizes (only one scene can be brought up at once), and point clouds contain points in varying locations that do not align between scenes. Additionally, significant computational resources are needed simply to render single scenes of point cloud data, limiting use for deployed military or first responders with limited computational or connectivity resources.
In response, this manuscript details a workflow and a system created to address the shortcomings of analysis of UAS-derived 3D data. Specifically, this workflow transforms LAS data derived from UAS collection with ground control points through a custom python-based voxelization code. These voxels, or 3D squares, are then placed in a MongoDB with the original LAS data placed in an accompanying PostGres database. A lightweight rendering service was created as a front-end with the ability to ‘reach-back’ to query and analyze the 3D data in a number of ways, including by individual voxel across a scene or over time. The size of a single scene rendered on the front-end was reduced by approximately 78% (from 115 MB to 25 MB). While this requires additional experimentation, it may provide a solution for forward-deployed individuals to render and compare scenes quickly for applications before and after an event, such as an explosion or landslide.

2. Material and Methods

2.1. Study Area

In order to develop a reliable temporal stack of 3D geospatial data, imagery was routinely collected with a DJI Phantom 4 drone over a study area in Pasadena, California (Figure 1). The location was selected as the study area because it is located within FAA-permitted airspace and contains a diversity of 3D features, including trees, a baseball field, and a two-story residential building. The drone was flown with a 20-M camera at 75 degrees off-nadir for a total of 11 flights. These eight-minute missions were flown between August and September 2018 at variable times of the day to enable potential analysis of change throughout the day and year. Each collection resulted in an average of 57 images that were later processed into 3D scenes using Pix4D [11]. The study area provided the collection of high-resolution 3D geospatial data that was critical for the testing and development of the resulting voxelization workflow and visualization system.

2.2. Preprocessing and Data

After the imagery was collected, photogrammetric processes within Pix4D converted two-dimensional (2D) imagery into 3D LAS files. Digital photogrammetry is a process employing pixel matching of overlapping images to produce 3D renderings of the 2D data [12,13]. Pix4D is a sophisticated software that provides a number of processing options to determine the level of resolution and accuracy of a resulting 3D scene [11]. After preliminary testing of the processing options, a standard set of processing options was established for the processing of each drone flight image collection (Table 1 and Table 2).
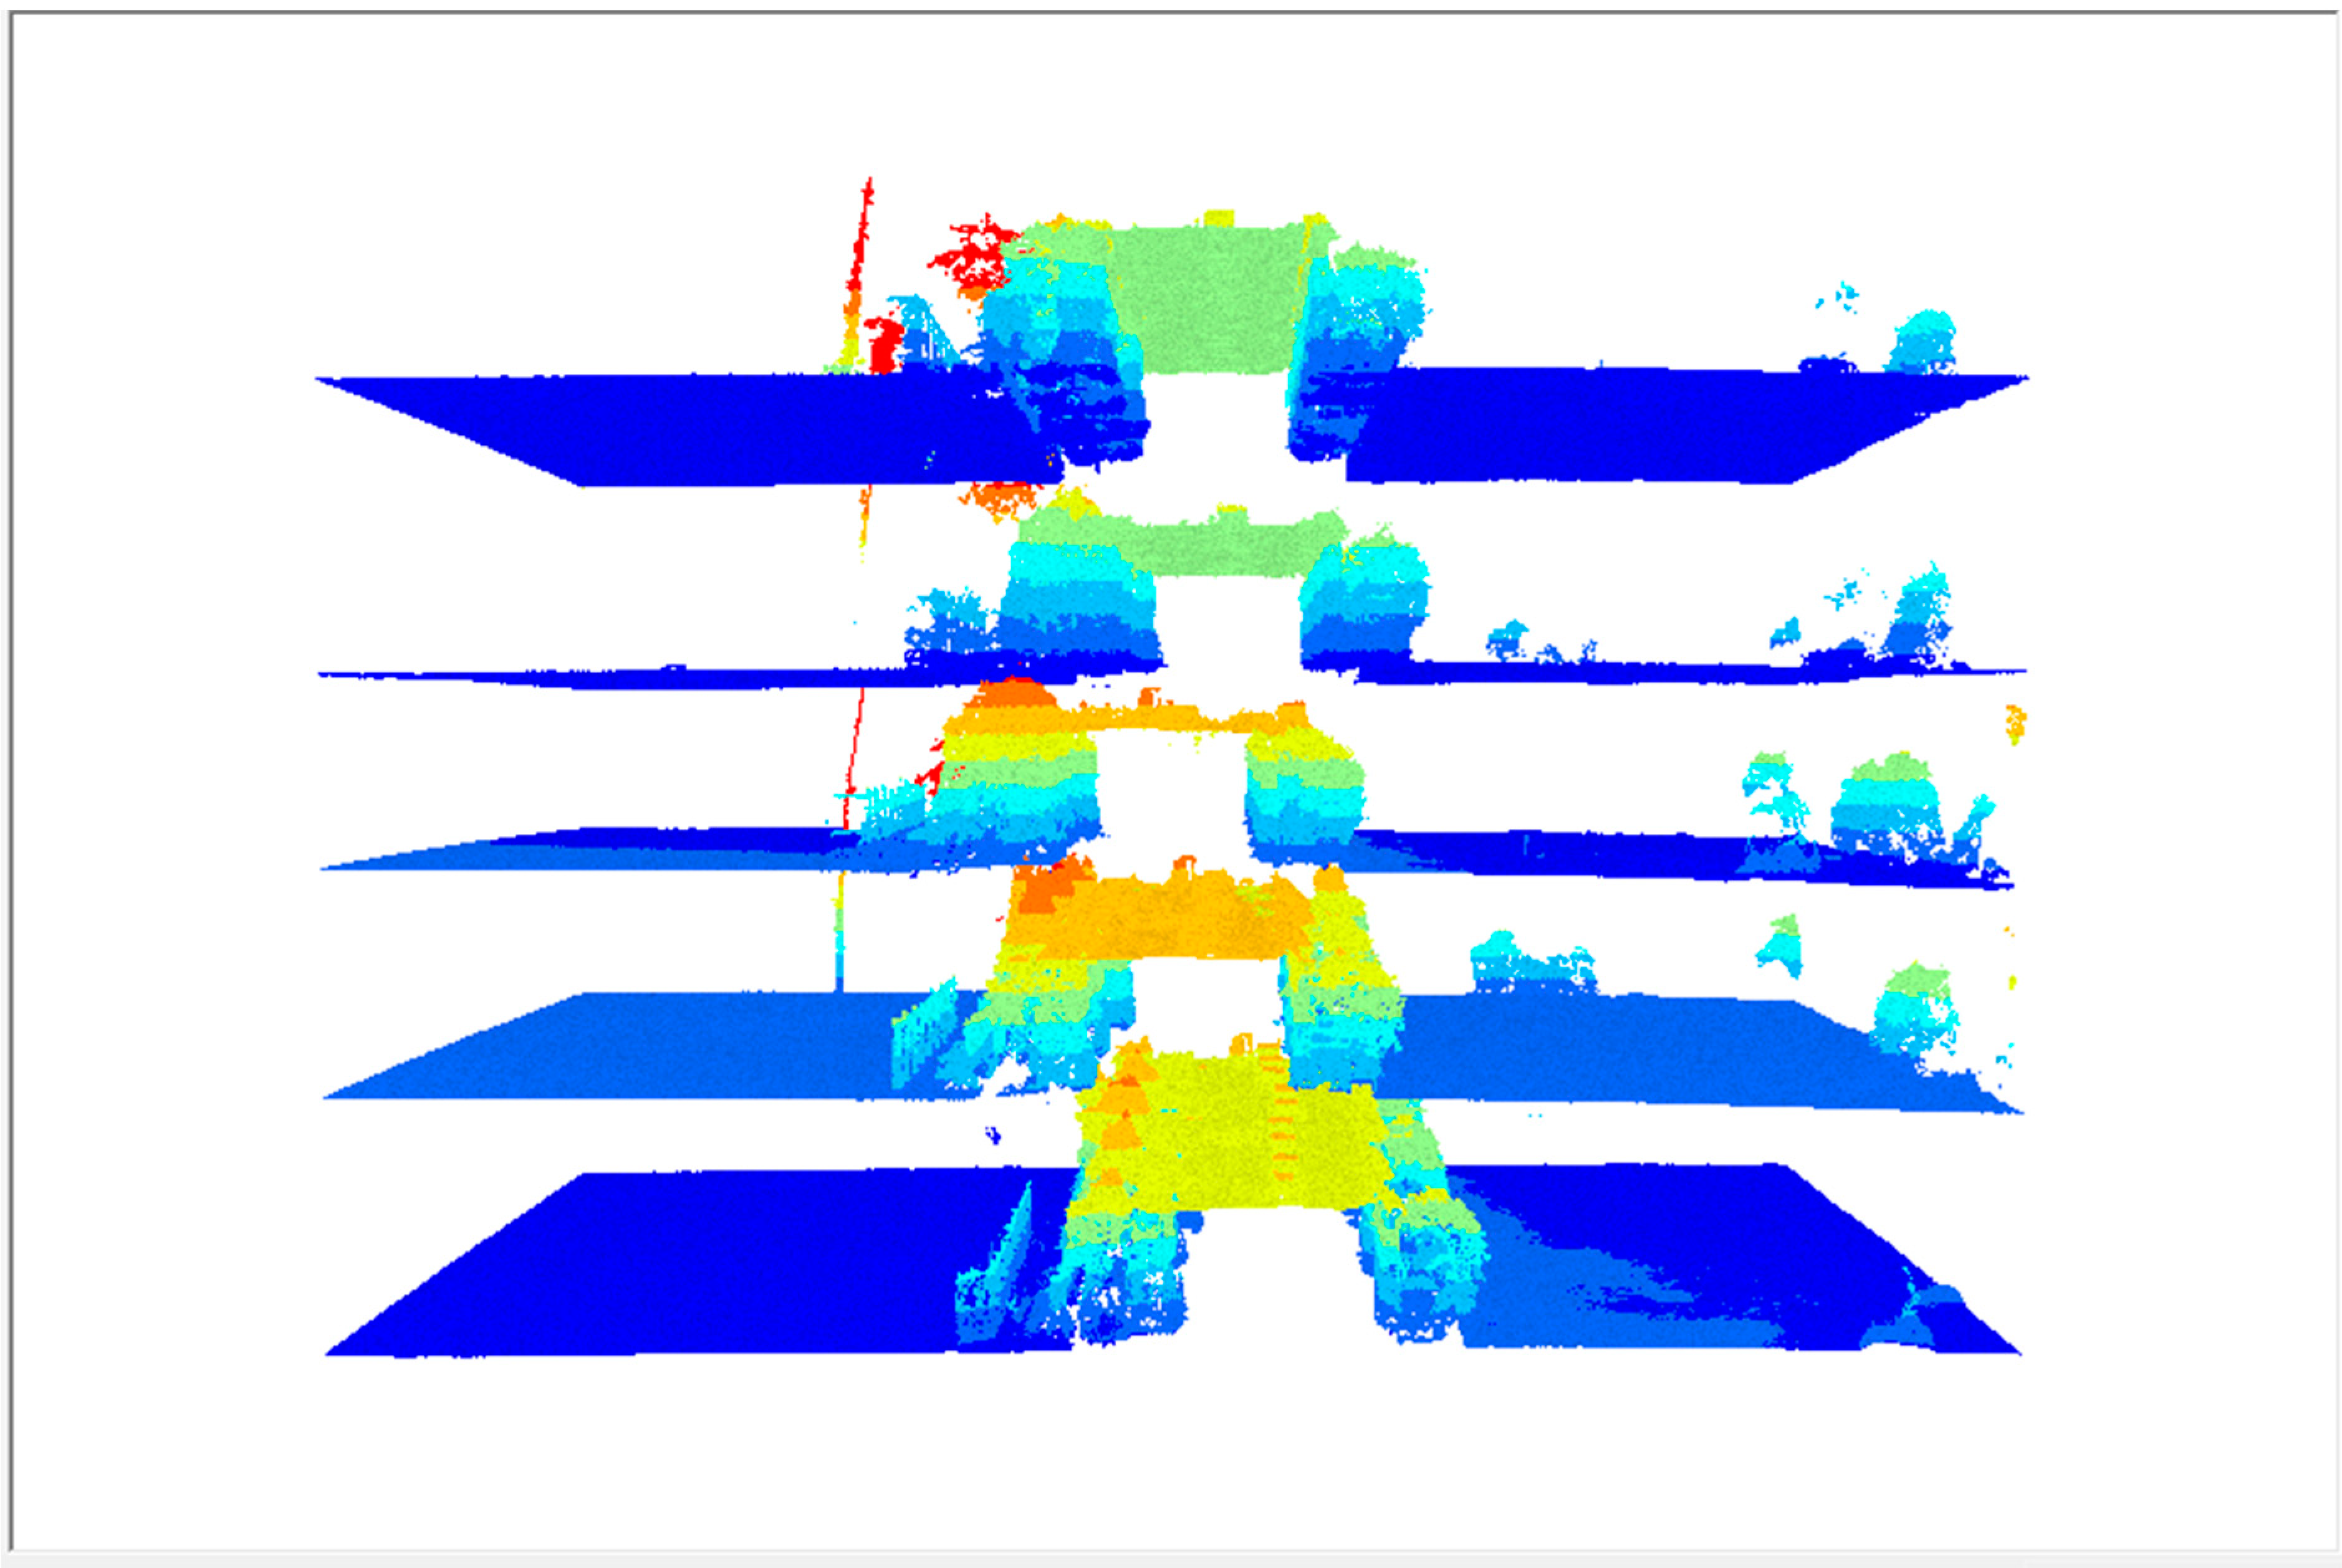
Initial processing options of accurate geolocation and geometrically verified matching were employed to help georegister images using GPS information contained in the metadata of each image (Figure 2). In the point cloud densification options, the image scale was set to one-half instead of one because setting it to one takes significantly more processing time despite leading to a very similar output. The minimum number of matches could have been increased to four matches to reduce artifacts in the scene, but this was not seen as a necessity for the scope of this study. After processing each of the scenes with the specified processing options, the resulting average LAS file size was 113.13 MB. Using Pix4D, all 11 sets of imagery from the drone were converted into 3D LAS files. A systematic error in GPS technology, however, required further georectification processes within Pix4D to align all the scenes in absolute space.
There were minor differences in the georegistration of each LAS scene due to the accuracy of GPS being limited to around 3 m in horizontal space and around 5 m in vertical space [14]. In order to geolocate and georegister each scene to the correct place in absolute space correctly, five ground control points (GCPs) were selected and then used to reprocess each scene within Pix4D. Utilizing GCPs to enhance photogrammetric processing is a manual process requiring the matching of each GCP to a corresponding location from at least two images within a scene. Once each GCP is tied to at least two images, the software adjusts the 3D coordinates of each point so the scene aligns precisely with the outline of the GCPs. The GCP error on average was 3.8 cm. After employing GCPs and reprocessing each scene, all scenes appeared to have accurate georegistration and alignment together in absolute space.

2.3. Computing Resources

All data were processed on a Windows 10 Enterprise 2016 workstation. The 64-bit operation system was built with two 3.5 GHz processors and 64 GB of installed memory. A GeForce TITAN X graphics card significantly aided processing time. The exploitation system was also installed on solid state drives on this system.

3. Theory and Calculation

3.1. Voxelization

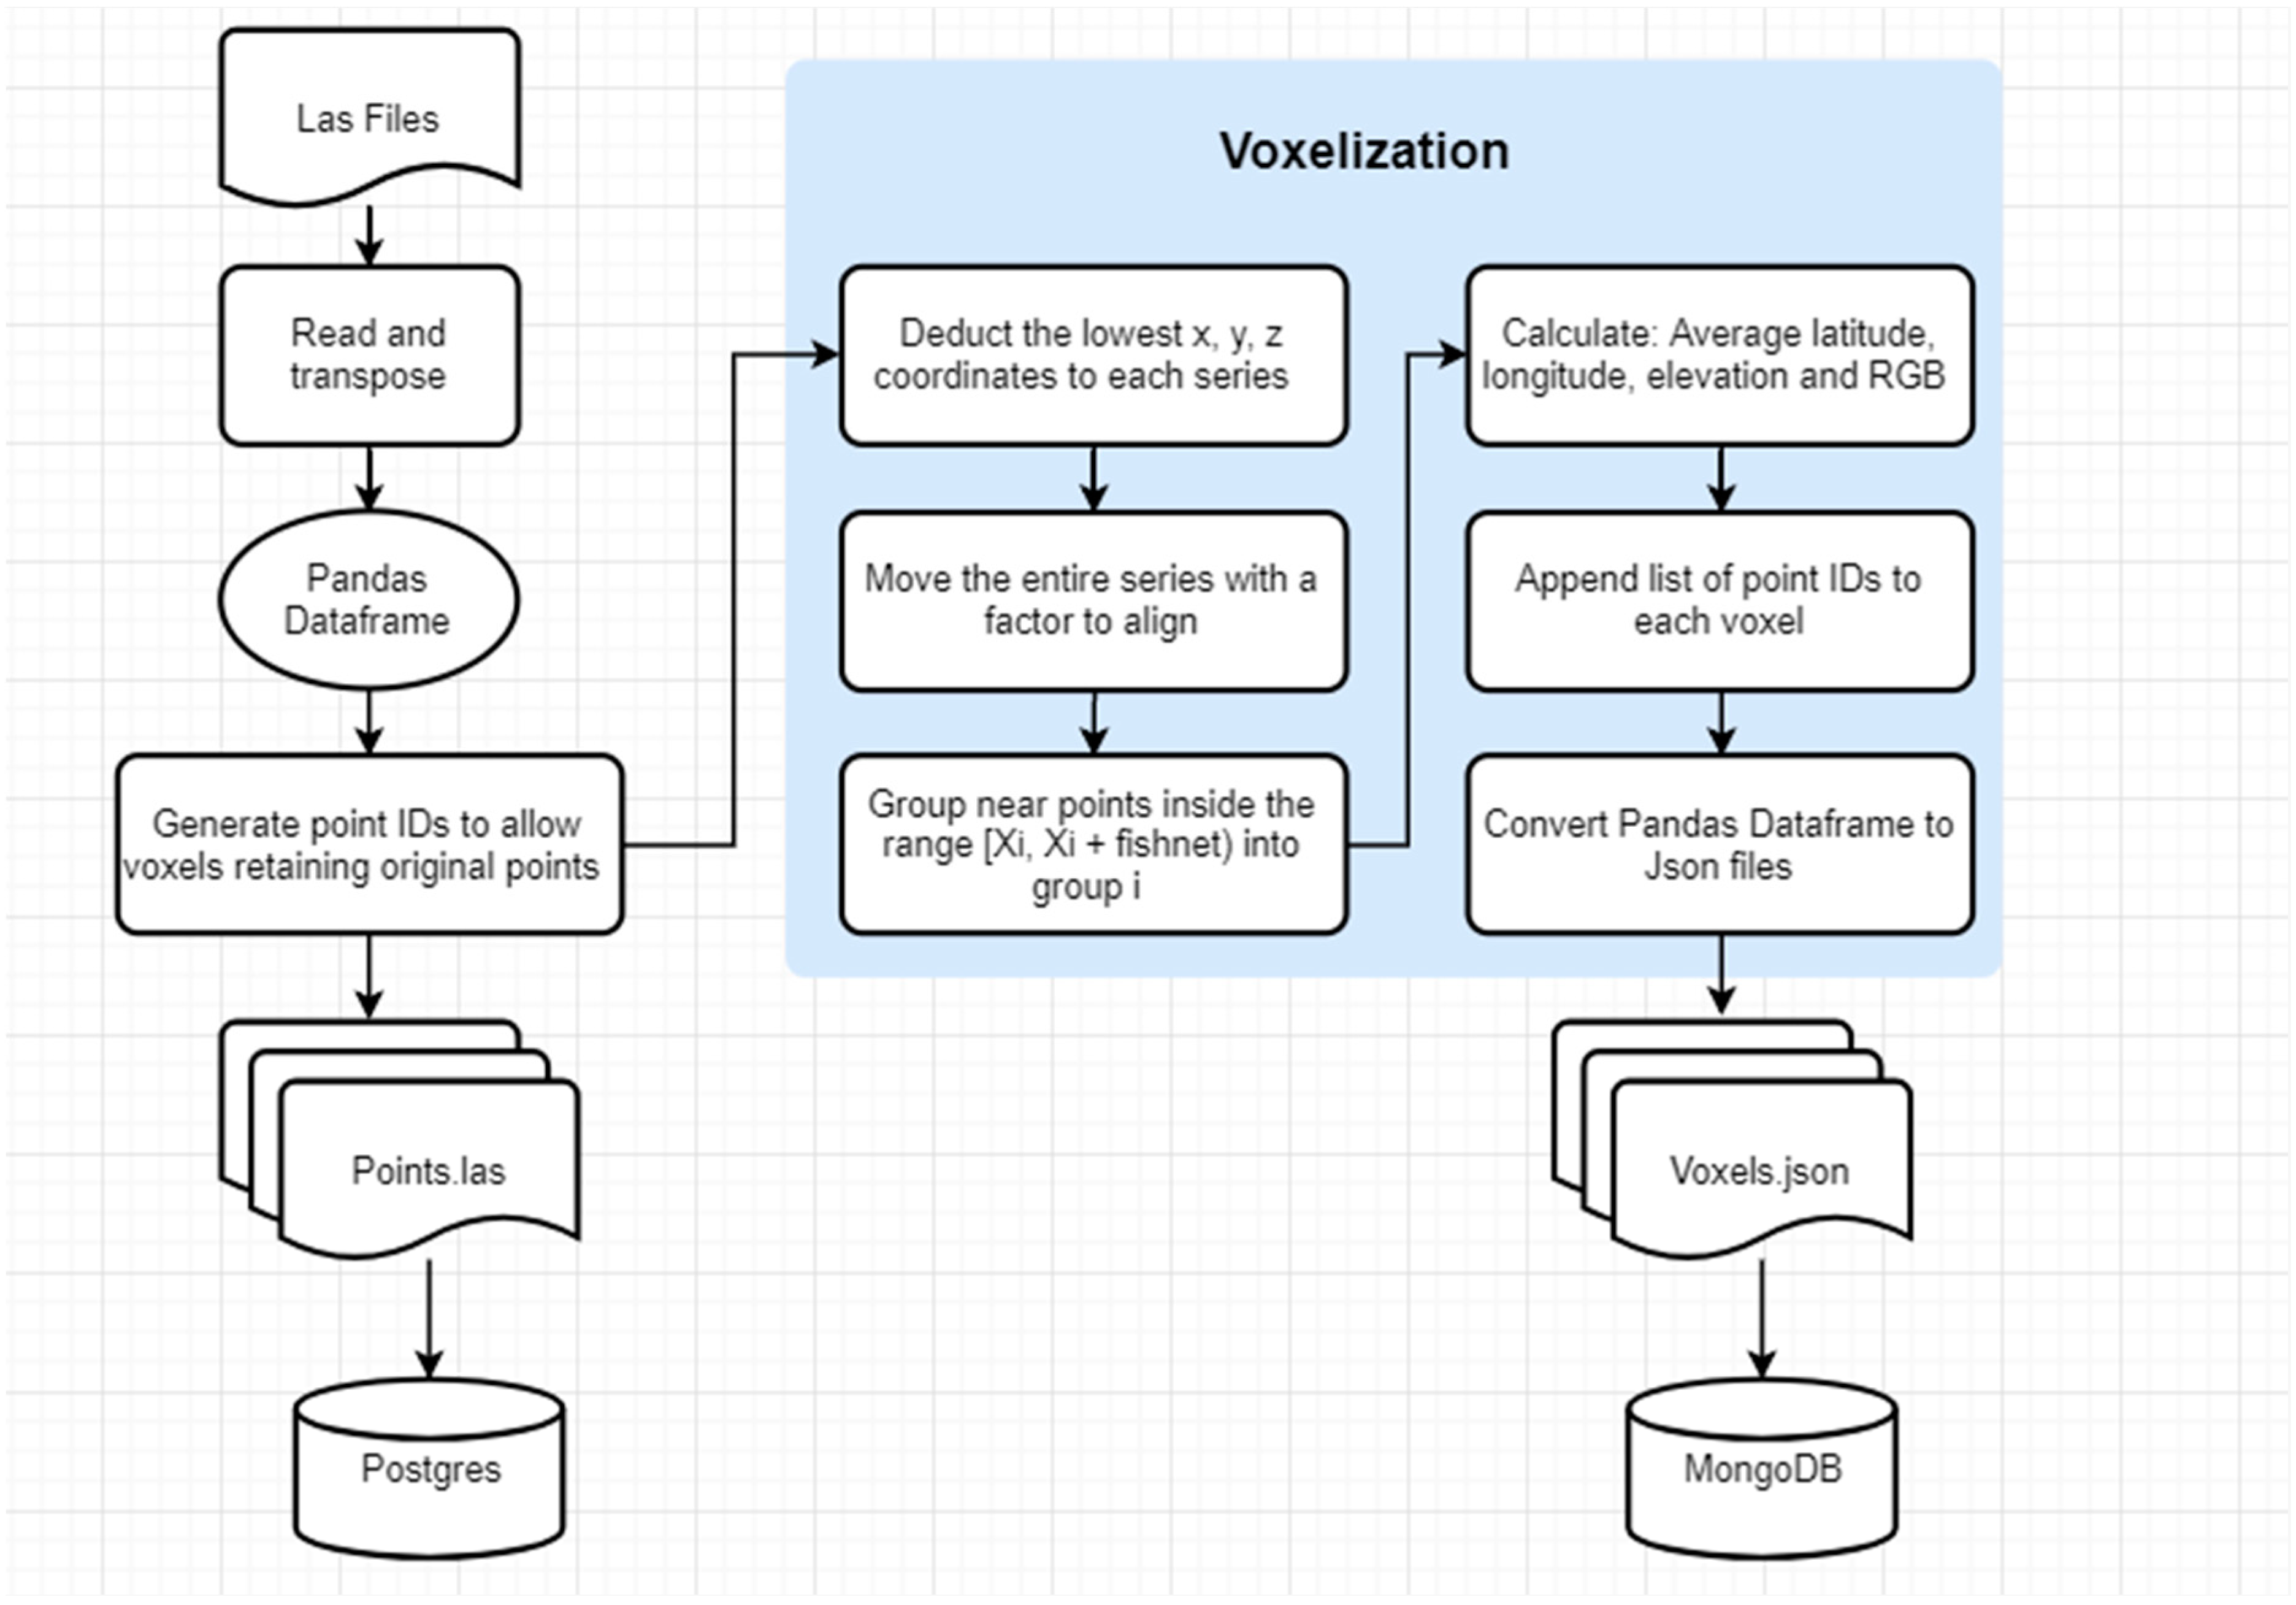
Voxelization is a process used to cluster adjacent points into a group retaining representative data for optimization of time performance of scene rendering and data analysis [15]. Developed in Python, LAS datasets are imported into pandas (Figure 3). DataFrame for user-friendly manipulation. This point cloud segmentation clusters the entire cloud into smaller parts, lowering the time necessary for calculations and analysis [16]. In order to improve performance by reducing processing time, calculations were performed on the entire series simultaneously instead of through looping over arrays. The use of voxels, a higher-level geometric structure, is more robust and flexible than a single key point or feature lines because voxels have fewer geometric constraints [17].
Assuming original observations are accurate, the algorithm groups 3D point cloud data within non-overlapping fishnets into voxels. This idea is similar to clustering but prioritizes the representative of each group to locate in the same place over time. As a result, the comparison of colors and/or other attributes is based on absolute coordinates. Absolute coordinates are fitting for this data since the system largely links data across time and space. Prior to scaling, the first step in preprocessing the data is normalization of the series to have a minimum of zero. Since each scene has a different minimum, an adjustment factor is needed to ensure that all voxels reside on the same wireframe. The factor is computed as:
F a c t o r ( x ) = m i n i m u m ( x )   %   ( f i s h n e t   × u n i t ( x ) )
Note that in our case, the elevation unit is in meters while longitude and latitude are in degrees. Based on this formula π 180 M r cos φ , Earth’s average meridional radius Mr is 6,367,449 m. As a result, we approximate 1 degree of latitude or longitude equal to 92,133.39 m. Although use of a projected coordinate system can be more accurate for the voxelization process, voxelization is a largely aggregative process that is meant for quick rendering and visualization of high-density point clouds. Voxelization provides an estimate for underlying point cloud data, and therefore original Universal Transverse Mercator (UTM) point cloud data should be used for any further analyses.

3.2. Database (MongoDB and PostGres)

The system used both MongoDB and PostgreSQL to make the front-end both lightweight and allow for an in-depth analysis of data (Table 3). MongoDB is used to store voxels for front-end scene rendering because it keeps data as JSON-like documents, allowing fields to differ from row to row. With this flexibility of database schema, the system tolerates different input structures from multiple types of sensors, such as optical or hyperspectral, without conflicts. Furthermore, MongoDB’s real-time aggregation feature allows the system to powerfully access and analyze voxel data. On the other hand, PostgreSQL stores original LAS files to avoid storage of redundant field descriptions for each cell.
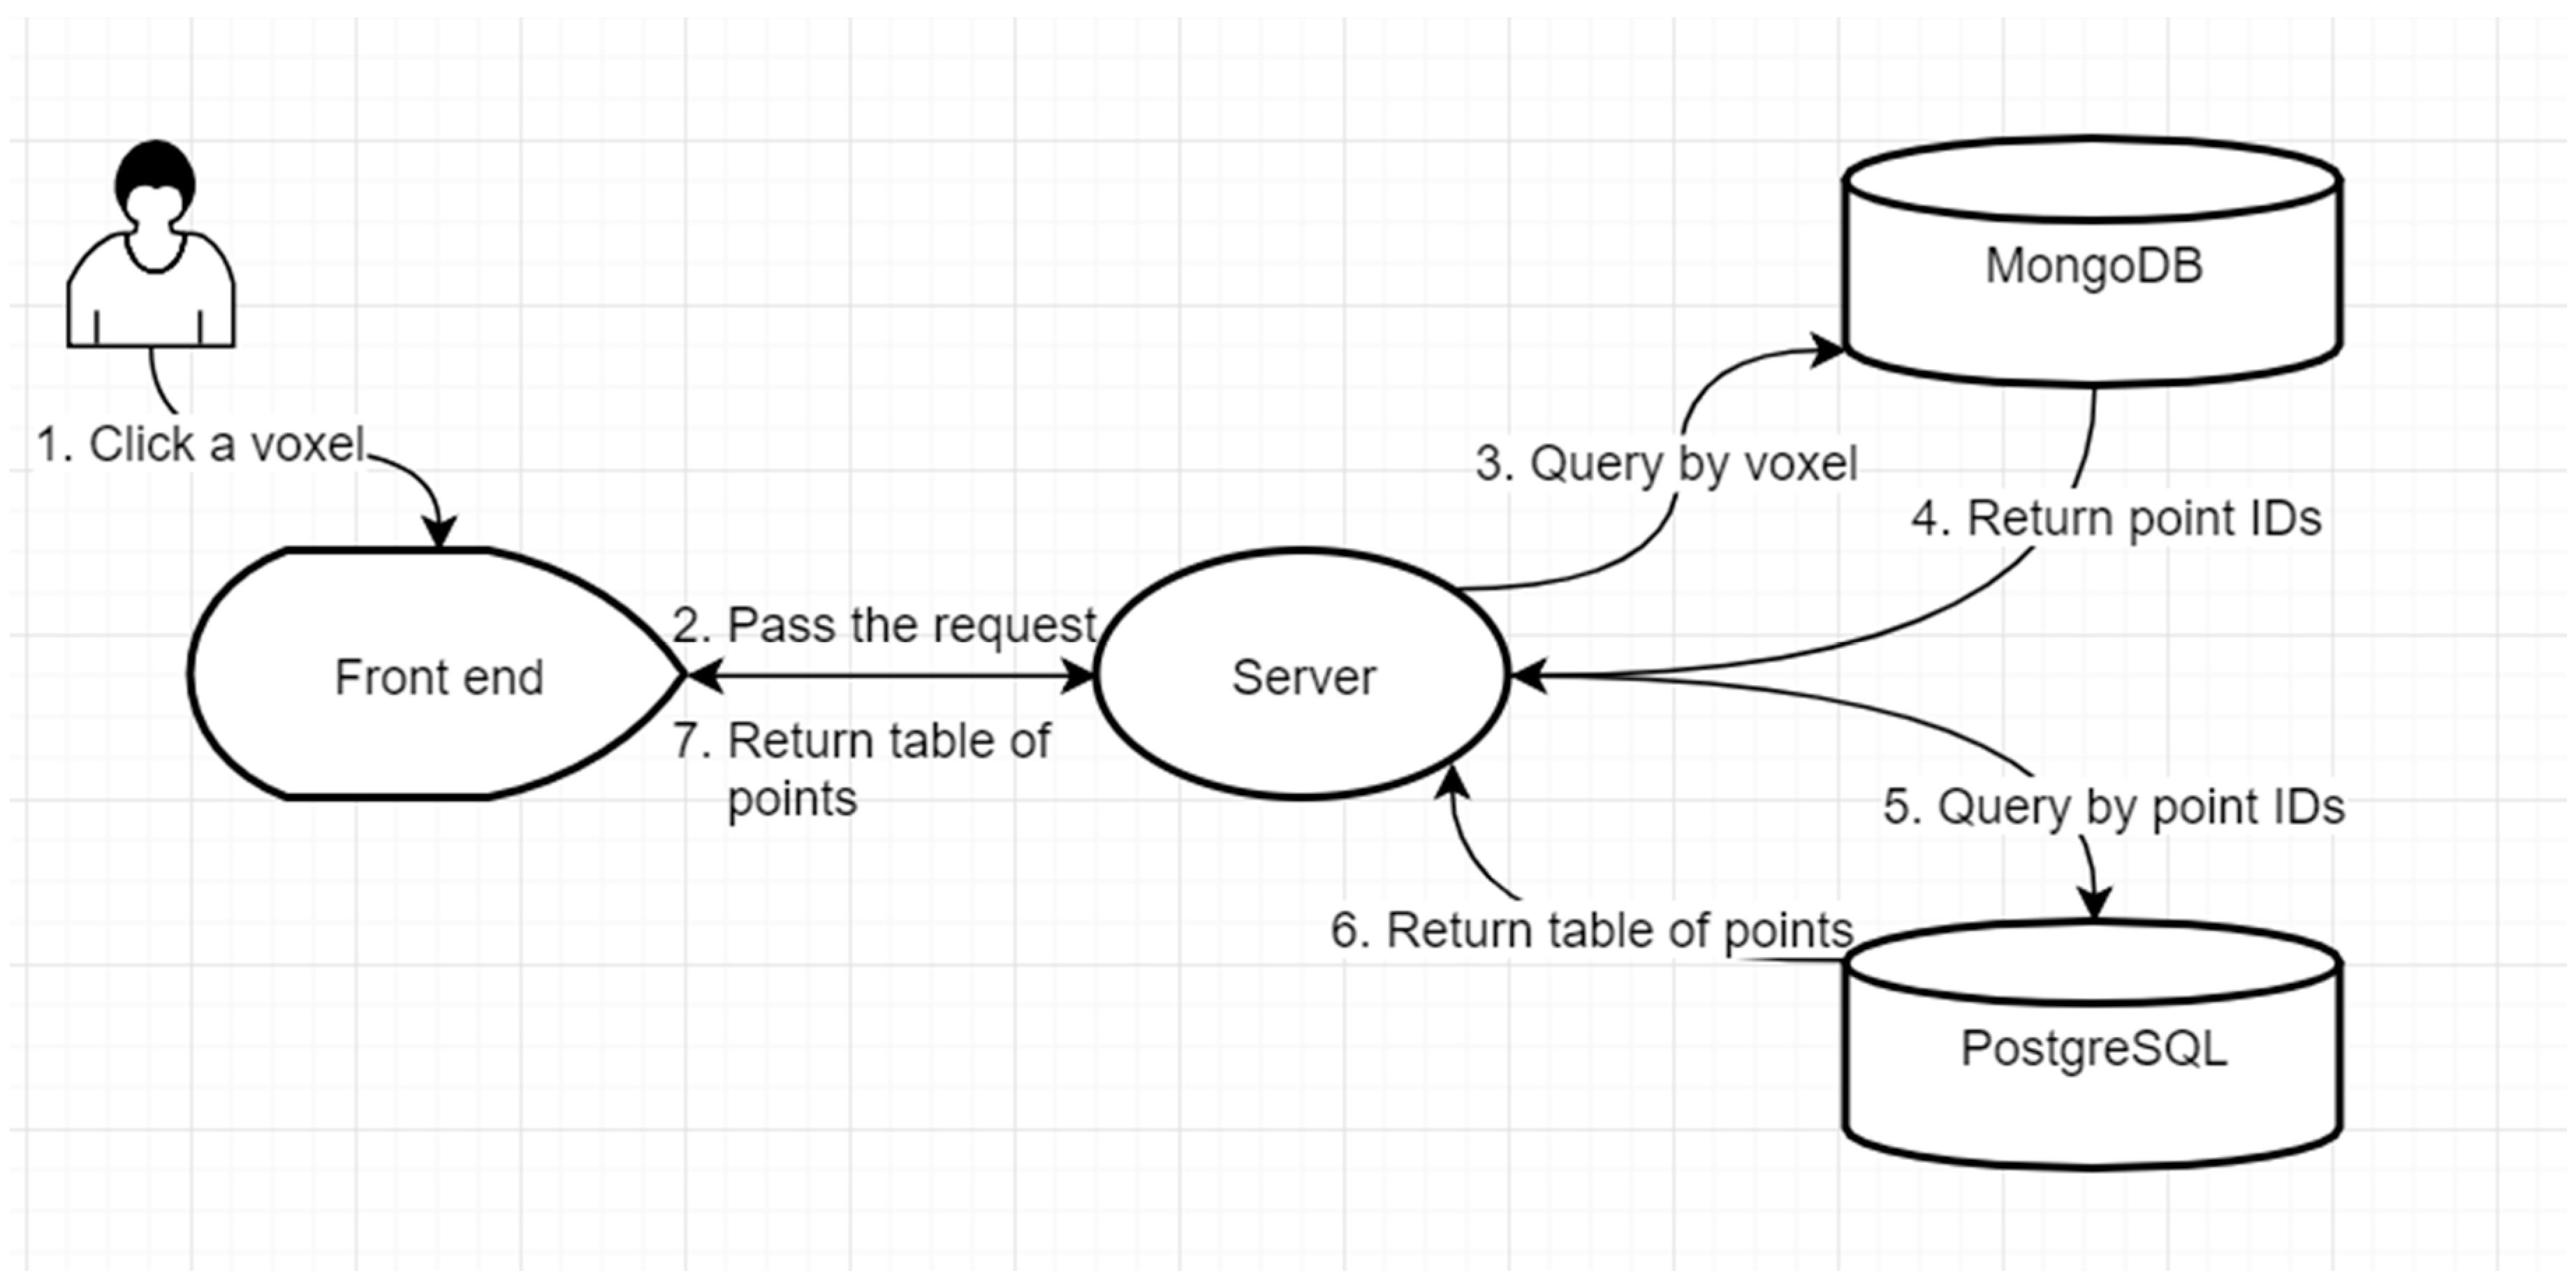
Our system allows analysts to check original data points located in a voxel (Figure 4). After a user clicks on a landscape model, the server will reach out to MongoDB and access voxel information by time and location. Using the list of point IDs to obtain corresponding rows in PostgreSQL, the server then returns the table containing point data to the user. This feature ensures the stability and accuracy of the system.

3.3. CesiumJS Front-End

CesiumJS is a state-of-the-art web-based 3D geospatial engine chosen for the front-end of the system due its ability to quickly visualize and render 3D data. A cloud computing approach for object-based image analysis is essential in classification and analysis of data from UAS [18]. As a web-based system, the front-end is lightweight and easily customizable with JavaScript. Aside from basic visualization, CesiumJS is also equipped with specialized time-based rendering, which is considered a critical area of interest in this study. CesiumJS is a large library but can be tailored to run with minimal library resources and even offline. Most the heavy computation work with the library is taken care of by the server and not the front-end device. There are also other web-based point cloud visualization platforms, such as Potree; however, Cesium is more widely supported and documented, making it a good platform for development and production.
Using CesiumJS, a custom User Interface (UI) was created and then linked to the voxel database to permit the visualization of voxels and to provide access to underlying voxel data from a database. Within the UI, a voxel scene can be selected by a user. Once a scene is selected, the voxels are obtained from the database using a database query and then plotted into the Cesium application. After the voxels are plotted, individual voxels can be clicked on, providing the user with a display of the voxel’s attribute information from the database. By linking the Cesium application to the backend voxel database, database queries can quickly retrieve voxels for rendering and investigation within Cesium.

4. Results

4.1. Front-End Rendering

The voxelization workflow creates a noticeably smaller 3D file size, and rendering is quick within the CesiumJS front-end. For a single scene, approximately 26 MB needs to be passed into the Cesium application, which is significantly less than the original 113 MB point cloud for that scene. Rendering takes an average of 9.98 s with full rendering across three axes. The system offers real-time 3D interaction after a scene has been loaded into the viewer (Figure 5). It takes on average 9.98 s to load a scene into the viewer, but once loaded it can interact in real time.

4.2. Query and Analysis Tools

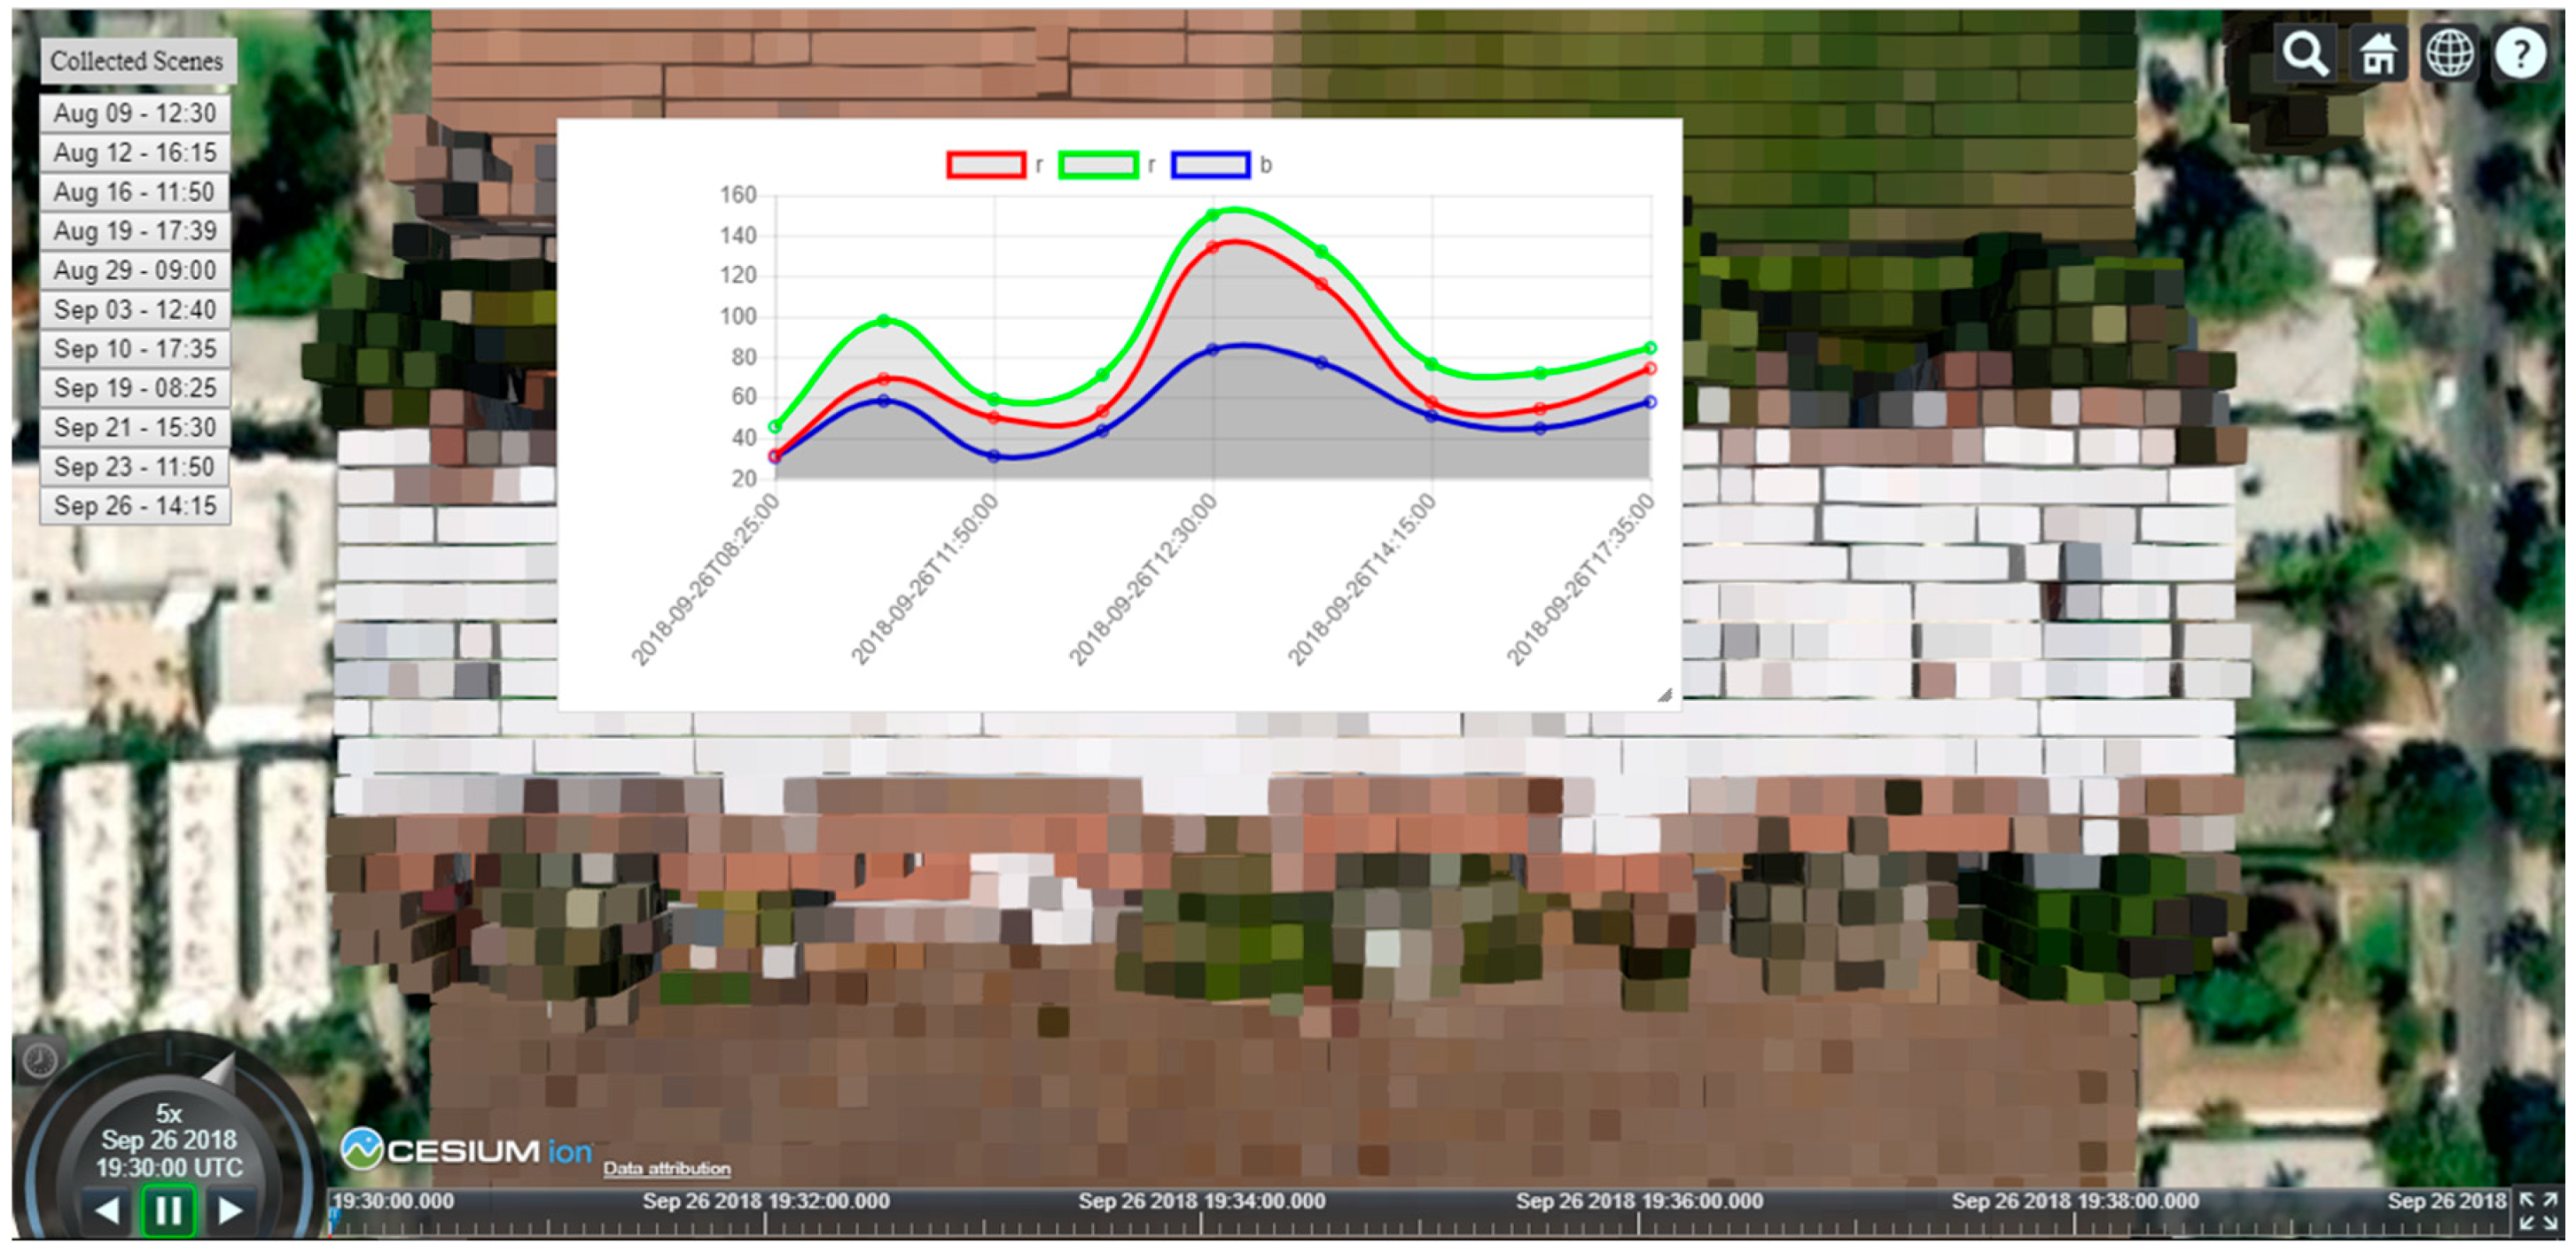
We created a sophisticated analysis toolbox including tools that allow for temporal exploitation of the voxel data (Table 4). The first tool permits temporal retrieval of attribute data from a selected voxel location (Figure 6). In the UI of the Cesium application, a right click on a voxel and selection of the “Graph RGB Values” button creates a dynamic graph displaying voxel RGB values over the time of day. In the background, the function mines the 3D coordinates at the selected voxel location and then queries the database for voxels in other scenes that possess a voxel in the same location. The database then returns the time of day and the RGB values of identified voxels. These values are plotted on a graph to observe the change over time in attribute values. It takes on average 1.17 s to query the database. The current dataset possesses attribute values for RGB; therefore, if other attribute data were collected, the graphing function could be easily customized to display the change of those attributes as well. By permitting accessibility to temporal values of voxel data, the tool enables swift assessment of large stacks of spatiotemporal data.
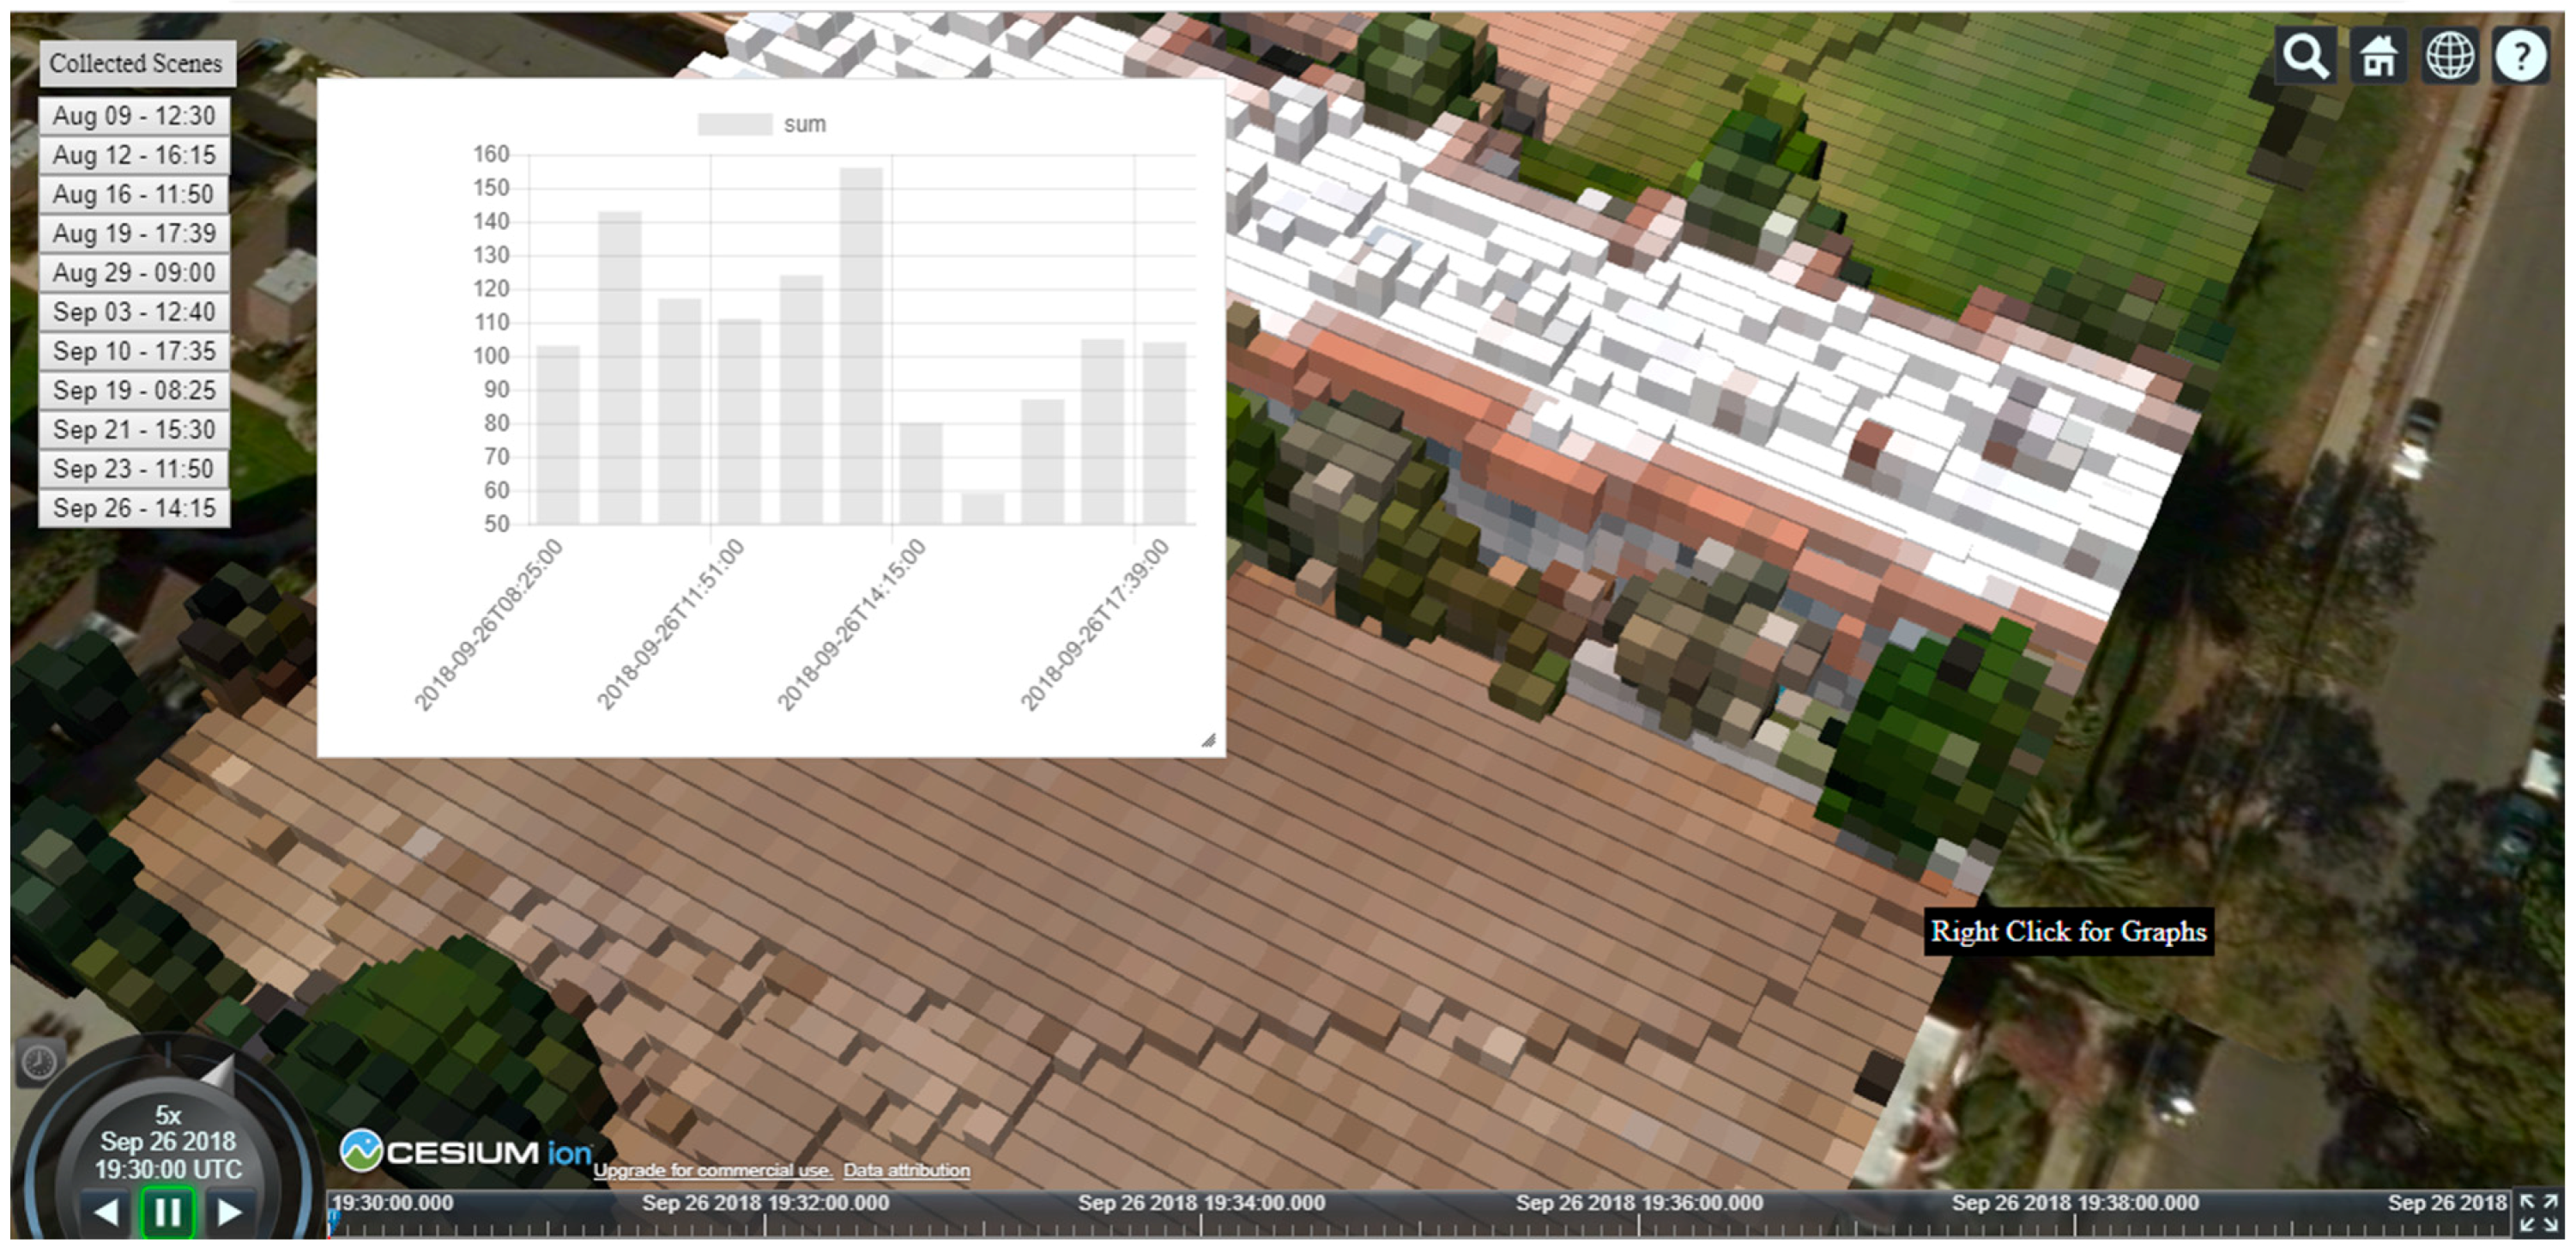
The second tool implements a similar process to create a graph plotting a count of the number of raw point count points of the selected voxel over time (Figure 7). With voxelization as an aggregation process, the fidelity of voxel data is related to the number of raw points comprising a voxel. Voxels with smaller point counts will possess lower fidelity and confidence, while voxels with higher point counts can be used with more confidence. This tool was created as an embedded quality control metric to plot the count of raw points within a voxel over time. This is useful in assessing the relative quality of the voxel data and for the detection of outliers. It is imperative to investigate differentiation of point counts in cases where voxel count is generally identical or very similar, but differs in another scene. Providing a tool to retrieve the point count of each voxel across time allows for quality assessment of the voxel data in determining whether the outlier is due to a sensor error or a true data point requiring further analysis.

5. Discussion and Conclusions

The robust platform was designed for maximum flexibility in allowing LAS from any platform (e.g., satellite, aerial, terrestrial) and any sensor (e.g., LIDAR, multispectral, hyperspectral). Even for individuals not requiring reduced computational power, the system allows analysts to perform complicated tasks, including identification of the clustering metric of voxel clustering metrics over time and quick voxel change detection. Clustering metrics provide direct quality control information of the data assisting in the assessment of the reliability of data, while change detection analysis helps with identification of any noticeable trends or outliers in the data stack. The system enables a number of potential 3D change detection applications, such as potential debris detection and volumetric estimation post disaster, improvised explosive device (IED) detection in combat zones, or volumetric forestry change analysis within deforestation zones [19,20,21].
While the initial project only entailed a 3D temporal analysis system, we found that the render is so lightweight that forward-deployed individuals can take advantage of the system in a variety of situations. The tool’s use cases vary from single scene visualization mission planning to more complicated analysis, such as pre- and post-disaster change detection analysis. To date, we have developed several analytic tools and plan to build additional customizable functions, including rendering scenes by point count for visualization of quality metrics and temporal analysis tools. While this requires additional experimentation, it is of promising value to forward-deployed military and first responders through quick 3D visualization and assessment of temporally aligned data.
As organizations repeatedly seek to collect very-high-resolution 3D data through affordable UAS and other platforms, the desire to perform temporal analysis and change detection will continue to increase. At the same time, organizations will want reach-back to the highest fidelity data, the point cloud points. Very large file sizes and points in varying locations that do not align between scenes currently prevent such analysis. In response, this manuscript presents an approach that aggregates data spatially into voxels, providing a lightweight, web-based exploitation system with a robust backend database. This approach offers a unique and comprehensive solution for organizations conducting temporal analysis of high-resolution point-clouds, as well as a possible solution for those who still require 3D data for decision support and planning but are operating in areas with poor computational and connectivity.

Author Contributions

Conceptualization, A.M.; Data curation, A.M., Y.-H.C., and K.M.; Formal analysis, A.M., Y.-H.C., and K.M.; Funding acquisition, A.M.; Investigation, A.M., Y.-H.C., and K.M.; Methodology, A.M., Y.-H.C., and K.M.; Project administration, A.M.; Resources, A.M.; Software, A.M., Y.-H.C., and K.M.; Supervision, A.M.; Validation, A.M., Y.-H.C., and K.M.; Visualization, A.M., Y.-H.C., and K.M.; Writing—original draft, A.M., Y.-H.C., K.M., and R.W.; Writing—review & editing, R.W.

Funding

This work was supported by the Aerospace Corporation under the “Development of Geospatial Techniques and Tools” grant [Award ID: 009264-00004].

Acknowledgements

The authors would like to thank the analysts at the Aerospace Corporation for their guidance and feedback which helped to develop this system.

Conflicts of Interest

The authors have no competing interests to declare.

Abbreviations

The following abbreviations are used in this manuscript:
AGLAbove Ground Level
FAAFederal Aviation Administration
GCPGround Control Point
GPSGlobal Positioning System
LASLog ASCII Standard
LIDARLight Detection and Ranging
RBGRed Blue Green
RTKReal Time Kinetic
UASUnmanned Aerial System

References

  1. Colomina, I.; Molina, P. Unmanned aerial systems for photogrammetry and remote sensing: A review. ISPRS J. Photogramm. Remote Sens. 2014, 92, 79–97. [Google Scholar] [CrossRef] [Green Version]
  2. Chabot, D. Trends in drone research and applications as the Journal of Unmanned Vehicle Systems turns five. J. Unmanned Veh. Syst. 2018, 6, vi–xv. [Google Scholar] [CrossRef]
  3. Van Blyenburgh, P. 2013–2014 RPAS Yearbook: Remotely Piloted Aircraft Systems: The Global Perspective 2013/2014; UVS International: Paris, France, 2013. [Google Scholar]
  4. DJI. Phantom 4 Pro Specs. Available online: https://www.dji.com/phantom-4-pro/info (accessed on 11 January 2019).
  5. Sensefly. eBee RTK Technical Specifications. Available online: http://www.sensefly.com/ (accessed on 14 January 2019).
  6. Pajić, V.; Govedarica, M.; Amović, M. Model of Point Cloud Data Management System in Big Data Paradigm. ISPRS Int. J. Geo-Inf. 2018, 7, 265. [Google Scholar] [CrossRef]
  7. Siebert, S.; Teizer, J. Mobile 3D mapping for surveying earthwork projects using an Unmanned Aerial Vehicle (UAV) system. Autom. Constr. 2014, 41, 1–14. [Google Scholar] [CrossRef]
  8. Colomina, I.; de la Tecnologia, P.M. Towards a New Paradigm for High-Resolution Low-Cost Photogrammetry and Remote Sensing. In Proceedings of the ISPRS XXI Congress, Beijing, China, 3 July 2008; pp. 1201–1206. [Google Scholar]
  9. Eisenbeiß, H. UAV Photogrammetry. Ph.D. Thesis, ETH Zurich, Zurich, Switzerland, 2009. [Google Scholar]
  10. Remondino, F.; Barazzetti, L.; Nex, F.; Scaioni, M.; Sarazzi, D. UAV photogrammetry for mapping and 3d modeling—Current status and future perspectives. Int. Arch. Photogramm. Remote. Sens. Spat. Inf. Sci. 2011, 38, C22. [Google Scholar] [CrossRef]
  11. Pix4D. Professional Photogrammetry and Drone-Mapping. Available online: https://www.pix4d.com/ (accessed on 5 January 2019).
  12. Lerner, K.L.; Lerner, B.W. Gale Encyclopedia of Science; Gale: Farmington Hills, MI, USA, 2004; Volume 6. [Google Scholar]
  13. Schenk, T. Concepts and algorithms in digital photogrammetry. ISPRS J. Photogramm. Remote Sens. 1994, 49, 2–8. [Google Scholar] [CrossRef]
  14. Grimes, J.G. Global Positioning System Standard Positioning Service Performance Standard; US Department of Defense: Washington, DC, USA, 2008.
  15. Boerner, R.; Hoegner, L.; Stilla, U. Voxel based segmentation of large airborne topobathymetric lidar data. In Proceedings of the International Archives of the Photogrammetry, Remote Sensing & Spatial Information Sciences, Hannover, Germany, 6–9 June 2017; Volume 42. [Google Scholar]
  16. Papon, J.; Abramov, A.; Schoeler, M.; Worgotter, F. Voxel cloud connectivity segmentation-supervoxels for point clouds. In Proceedings of the IEEE Conference on Computer Vision and Pattern Recognition, Portland, OR, USA, 23–28 June 2013; pp. 2027–2034. [Google Scholar]
  17. Xu, Y.; Boerner, R.; Yao, W.; Hoegner, L.; Stilla, U. Automated coarse registration of point clouds in 3d urban scenes using voxel based plane constraint. In Proceedings of the ISPRS Annals of Photogrammetry, Remote Sensing & Spatial Information Sciences, Wuhan, China, 18–22 September 2017; Volume 4. [Google Scholar]
  18. Antunes, R.R.; Blaschke, T.; Tiede, D.; Bias, E.; Costa, G.; Happ, P. Proof of concept of a novel cloud computing approach for object-based remote sensing data analysis and classification. GISci. Remote Sens. 2019, 56, 536–553. [Google Scholar] [CrossRef]
  19. Rowena, L. Using Lidar to Assess Destruction in Puerto Rico. Available online: http://news.mit.edu/2018/mit-lincoln-laboratory-team-uses-lidar-assess-damage-puerto-rico-0830 (accessed on 1 January 2019).
  20. Wathen, M.; Link, N.; Iles, P.; Jinkerson, J.; Mrstik, P.; Kusevic, K.; Kovats, D. Real-time 3d change detection of ieds. In Proceedings of the Laser Radar Technology and Applications XVII, Baltimore, MI, USA, 14 May 2012; p. 837908. [Google Scholar]
  21. Liew, S.; Huang, X.; Lin, E.; Shi, C.; Yee, A.; Tandon, A. Integration of tree database derived from satellite imagery and lidar point cloud data. Int. Arch. Photogramm. Remote Sens. Spat. Inf. Sci. 2018, 42, 105–111. [Google Scholar] [CrossRef]
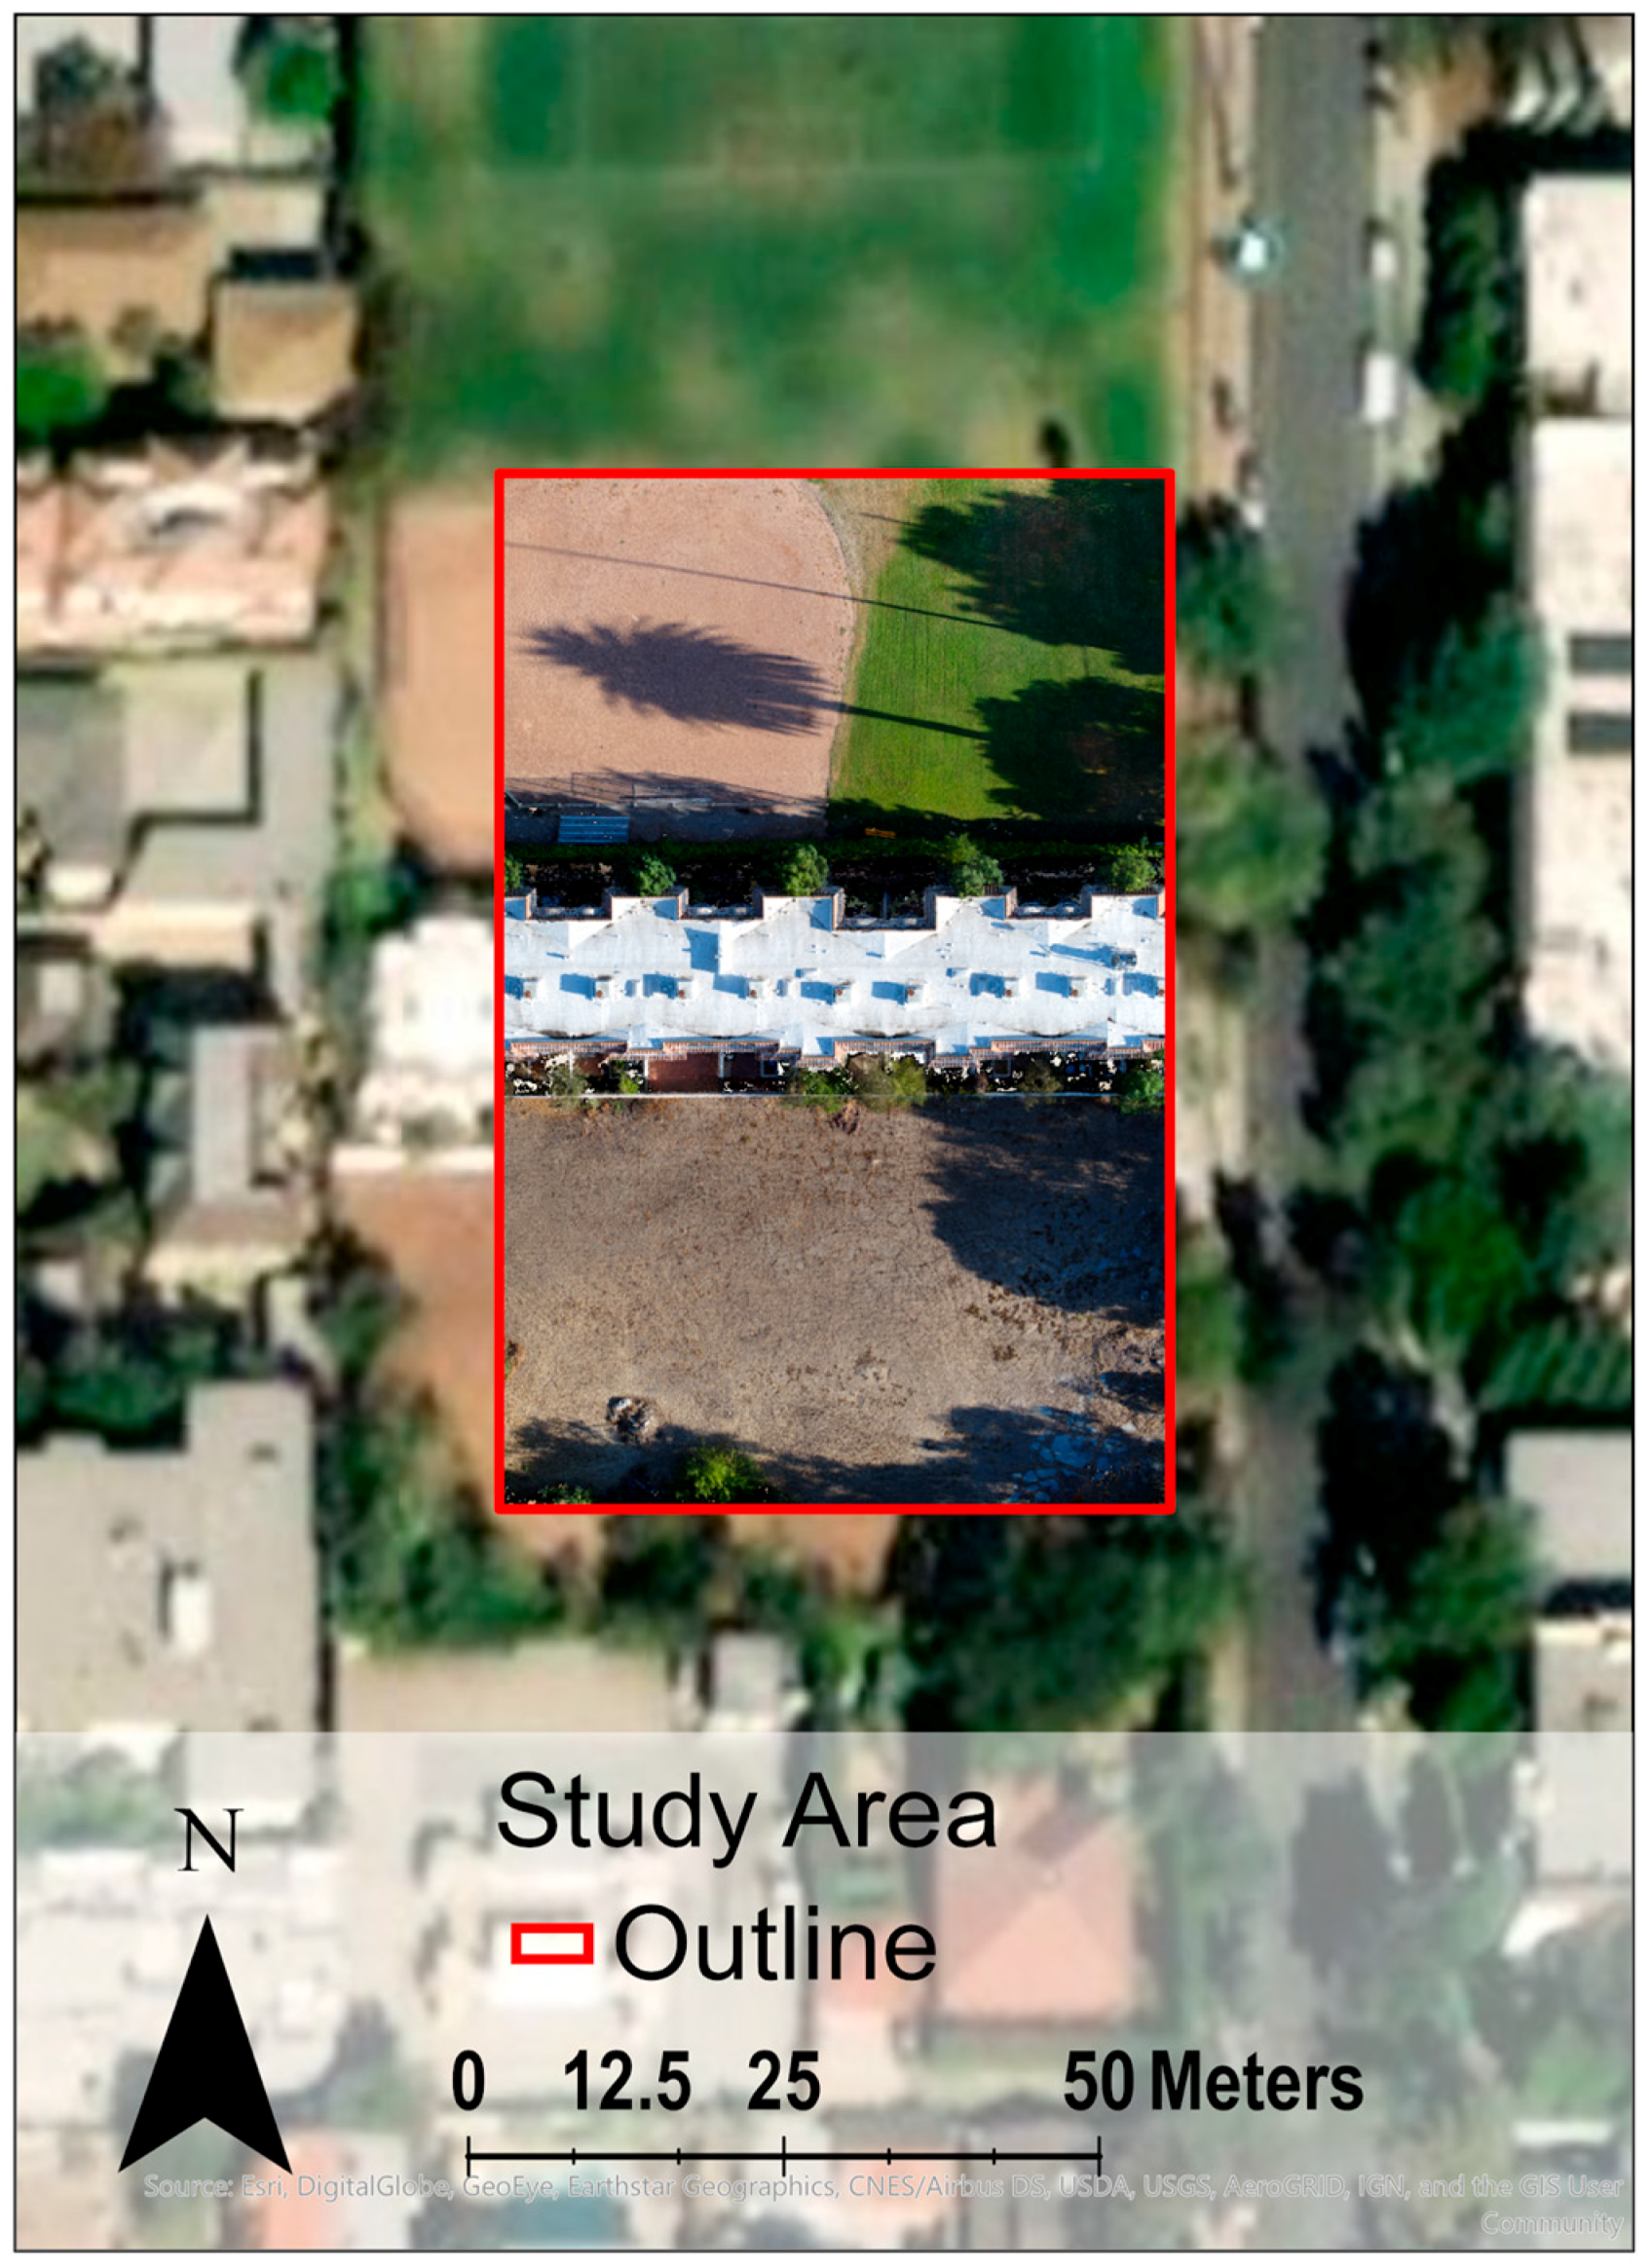
Figure 1. The study area was over a private, residential building in Pasadena, CA. Missions were flown at 45 m above ground level (AGL) with 80% longitudinal and cross overlaps with a 75% off-nadir look, with the camera always facing towards the center of the study area.
Drones 03 00029 g001
Figure 2. When the Unmanned Aerial System (UAS)-derived LAS scenes are brought into the same view, the vertical and horizontal georegistration errors are evident. By applying ground control points (GCPs), all scenes align together in absolute space. The average GCP error is 3.8 cm and the average ground sample distance (GSD) is 1.41 cm.
Drones 03 00029 g002
Figure 3. The workflow of the backend algorithm in Python loads a point cloud into pandas. DataFrame, which preprocesses the LAS file, dumps the ID-tagged point cloud into PostgreSQL, groups nearby points into voxels, and stores resulting voxels in MongoDB.
Drones 03 00029 g003
Figure 4. The server works with databases when a user checks original point clouds within a voxel. In this example, a user clicks a voxel and the system returns all points that were used in the creation of that voxel.
Drones 03 00029 g004
Figure 5. The exploitation system renders 1 sqm voxels for individual scenes in the CesiumJS application. For this pilot, voxels consist of between 50 and 160 point cloud points derived from UAS-based imagery.
Drones 03 00029 g005
Figure 6. The CesiumJS application with a dynamic graph of red, green, and blue values of a voxel location over time. Percent reflectance (y-axis) varies across scenes (x-axis) primarily as a function of time the scene was collected.
Drones 03 00029 g006
Figure 7. Tools included in the exploitation system include a dynamic graph depicting the number of original LAS points contained within a selected voxel (y-axis) by scene (x-axis). Less confidence is given to voxels consisting of fewer points.
Drones 03 00029 g007
Table 1. Pix4D Initial Processing Options.
Processing OptionSelection
Keypoints Image ScaleFull
Matching Image PairsAerial Grid or Corridor
Matching StrategyGeometrically Verified Matching
Targeted Number of KeypointsAutomatic
CalibrationAccurate Geolocation and Orientation
Table 2. Pix4D Point Cloud Densification Processing Options.
Processing OptionSelection
Image Scale(½) Half Image Size
Point DensityOptimal
Minimum Number of Matches3
ExportLAS
Matching Window Size9 × 9 pixels
Processing AreaUse Processing Area
AnnotationsUse Annotations
Limit Camera DepthUse Limit Camera Depth Automatically
Table 3. Structure of fields for voxels that are stored in MongoDB. Although the database has schema flexibility, given a Cesium as front-end, the schema designation follows the CZML (Cesium Markup Language) structure guide. A list of point IDs is saved in order to find original data after clicking a voxel.
DescriptionValue
PositioncartographicDegrees[longitude, latitude, elevation]
Boxdimensions/cartesian[x, y, z]
material/solidColor/color/rgba[r, g, b, a]
Availability Time interval
PointspointIndexesList of point IDs
sizeNumber of points
Table 4. Five tools are available in this pilot exploitation system. These tools enable analysts to look across time and space to detect outliers and conduct change detection and trend analysis.
ToolDescription
3D RGB RenderingRendering of voxels based on R,G,B values
3D Point Count Classification RenderingRendering of voxels based on Point Count classifications
Temporal Voxel Attribute PullAbility to retrieve and graph temporal values for R,G,B (can be customized for other attribute values)
Temporal Voxel Point Count PullAbility to retrieve and graph temporal values of voxel point count
Temporal Clustering Metric PullAbility to retrieve and graph clustering metric of voxels