Article

Changes in Element and NO3–N Concentrations in Grass Due to Nitrogen Fertilisation and Their Consequences for Animal Nutrition


1
Institute for Soil Sciences, Centre for Agricultural Research, HUN-REN, 1116 Budapest, Hungary
2
Institute for Animal Breeding, Nutrition and Laboratory Animal Science, University of Veterinary Medicine, 1077 Budapest, Hungary
*
Authors to whom correspondence should be addressed.
Nitrogen 2026, 7(2), 55; https://doi.org/10.3390/nitrogen7020055
Submission received: 31 March 2026 / Revised: 8 May 2026 / Accepted: 14 May 2026 / Published: 18 May 2026

Abstract

N fertilisation affects the nutrient content of grasslands, and thus animal health. The effect of fertiliser treatments with calcium ammonium nitrate at doses of 0, 100, 200 and 300 kg N ha−1 year−1 was investigated on grassland nutrient content in a long-term field experiment. The dilution effect due to biomass growth was analysed separately from other effects. The biomass of the grass increased 3.4-fold, up to 5.82 t ha−1. N fertilisation significantly reduced the concentrations of P and Mo and increased the concentrations of N, NO3–N, Na, Mn, and Cu in the grass. From a grazing or feeding perspective, N treatment adversely increased the NO3–N concentration, which exceeded the risky level of 1500 mg NO3–N kg in the 200 kg N ha year−1 treatment and decreased the P concentration. The treatments favourably increased the Na, Cu and Zn concentrations, reduced the Mo concentration, and improved the tetany index and the K:Na ratio. The 100 kg ha−1 year−1 N dose can be recommended under conditions similar to those in the experiment. It is important to analyse the element content of grass when using mineral fertiliser in order to minimise animal health risks.

1. Introduction

Nitrogen (N) fertilisation affects the plant uptake of other elements in a complex manner, via processes that range from chemical changes in the rhizosphere to plant metabolic processes [1,2,3]. The direction and extent of the effect depend on the form of the N active ingredient, the fertiliser dose and the properties of elements influenced by the fertilisation [4].
In the ammonium (NH4+) form, N adsorbs to negatively charged colloids in the soil, which reduces the risk of leaching before nitrification takes place. This binding allows the N to remain in the soil until it is taken up by plants or converted to nitrate (NO3) by microbes. The NO3 ion is a water-soluble anion that rarely binds to the mostly negatively charged soil colloids, so NO3 ions move freely in the soil with the flow of the soil solution and by diffusion, allowing them to be easily available but also posing the risk of leaching [5].
N can be taken up by plants in the form of NO3 or NH4+, and most fertilisers contain these forms. However, the two ions have different effects on the pH of the soil in the immediate vicinity of the roots, thus altering the solubility of other elements. Long-term N loading affects not only plant uptake but also the nutrient supply of the soil. During nitrification carried out by microorganisms, protons are released, reducing the pH of the soil, which can increase the solubility of some elements. This may result in higher concentrations of elements such as Fe, Mn, Zn and Cu in plant tissues [6]; however, basic cations, such as Ca2+, Mg2+, and K+, bound to soil colloids may be released and then washed out of the root zone by precipitation, which leads to nutrient deficiency in the soil [3,4,7,8,9].
Plants can absorb and utilise both NH4+ and NO3 ions from ammonium nitrate-based N fertilisers during their development. However, for various physiological and soil biological reasons, plants often primarily utilise N in the form of NO3. The NO3 ion reaches plant roots more easily than NH4+, which is prone to adsorption [10]. Under aerobic conditions, microorganisms in the soil can convert NH4+ into NO3 through nitrification within a few days, and soil microflora tend to use the NH4+ form for their own biomass, leaving NO3 as the more accessible source for plant roots [5,10,11]. Furthermore, experimental data show that when both forms are present in large quantities, plants prefer the NO3 supply and take up this form with greater efficiency [10].
When taking up NO3, it is important for the plant to maintain electrical balance, so this process enhances the incorporation of positively charged cations, such as potassium (K+), calcium (Ca2+), magnesium (Mg2+) and sodium (Na+) [2,3,12,13]. However, the application of N fertilisers with significant NH4+ ion content may inhibit the uptake of cations due to their similar charge and competition for transport systems. The uptake of nutrients as charged ions requires specific transporter proteins to cross the root cell membrane. While some transporters are highly specific, others are less able to discriminate between ions with similar physicochemical properties. This can lead to competitive inhibition and shifts in element concentration [2,14,15]. An excess of N may also inhibit the incorporation of boron (B), copper (Cu) and manganese (Mn) [16].
If N causes the plant biomass to grow faster than the root system can take up other elements from the soil, the concentration of these elements in the plant decreases, which is also known as the dilution effect [16,17,18]. This phenomenon is often observed in the case of phosphorus (P), zinc (Zn), iron (Fe), B and molybdenum (Mo) [19].
Improving the N supply generally increases the uptake of P and sulphur (S), as these are needed for the incorporation of N into proteins and nucleic acids. N fertilisation therefore not only increases the plant N level but also modifies the entire mineral composition of the plant. Unbalanced N fertilisation may cause nutrient disharmony, thus lowering the feed value and disease resistance of the plant [4,14,20,21,22]. Intensive nitrogen applications can also lead to a significant increase in nitrate concentration in the fodder, endangering the health of livestock. Therefore, monitoring nitrate levels in forage is essential for ensuring the safety of animal feed [23].
Farmers use large amounts of fertilisers to achieve maximum yields, due to the relatively high economic value of the additional yields. N fertilisation contributes significantly to increasing the productivity of temperate grasslands. The quantity of total forage production is determined by the amount of rainfall during the growing season, but fertilisation improves water use efficiency [24]. Fertiliser application can significantly increase both the number of animal grazing days and the total livestock production [25].
In pasture ecosystems, mineral nutrient cycling plays a key role in plant nutrition, as nutrients circulate in different media (soil–plant–animal–atmosphere), alternating between periods when they are available or unavailable for plant uptake. The availability of elements for plants is significantly influenced by various soil properties. The most important of these is soil pH, which influences the movement of nutrients and their contact with the root surface. The uptake of cations increases as the pH decreases [26]. Metal oxides and hydroxides (such as Fe, Al and Mn oxides) have a large adsorption surface area and bind strongly to certain cations, such as Zn, Cu and Mn, at a more alkaline pH. However, acidification increases the concentration of these ions in the soil solution [6]. Clay minerals provide cation exchange sites where cations are electrostatically bound due to their negatively charged surfaces [16]. Soil organic matter plays a dual role. The decomposition of fresh organic matter releases trace elements, while the organic acids produced during microbial activity, such as citric and malic acids, form chelates with metal ions, thereby increasing their mobility and uptake. However, stable, mature humic substances can also trap metals, particularly Cu, in insoluble complexes, thereby reducing their availability [27]. The redox potential is particularly critical for Fe and Mn. Under reducing, anoxic conditions, the solubility and uptake of Fe3+ and Mn4+ ions increase significantly when they are reduced to Fe2+ and Mn2+ ions, respectively, which can cause toxic levels in plants [27]. Soil texture can also greatly influence element uptake. Sandy soils generally have low levels of trace elements, but existing reserves are more readily absorbed due to the small number of binding sites. Clay soils have large reserves, but trace elements diffuse more slowly due to smaller pore sizes and stronger adsorption [13]. Proper soil management and nutrient input are essential for the development of sustainable pasture-based livestock systems.
Climate variability fundamentally influences the impact of nitrogen fertilisation on the concentration of elements in plants. Under favourable precipitation conditions, nitrogen induces greater biomass growth. This can result in a greater decrease in the concentration of some elements in tissues due to the dilution effect [6]. High temperatures increase transpiration. Under favourable soil moisture conditions, this promotes the uptake and accumulation of elements supplied by mass flow, such as B, in shoots [28]. Meanwhile, low temperatures inhibit root metabolic activity and water uptake. This indirectly limits nitrogen incorporation and the transport of other nutrients [12].
Changes in grassland management also have an impact on the availability of macro- and micronutrients in the soil environment [13]. For example, macro- and micro-nutrients in the soil and plants may respond asymmetrically to changes in grazing intensity. In a grazing experiment, the macronutrient dynamics showed greater sensitivity in the soil, while micronutrients (Cu, Fe, Mn, Zn) were more sensitive in plants. Short-term, intensive grazing accelerates the nutrient cycling of the soil–plant system in grassland ecosystems, highlighting the multiple nutrient dynamics of soil and plants as a function of grazing intensity [29].
The range of microelements or trace elements essential for animal nutrition is wider than for plants, as the animal body needs elements that are not required for plant development [19]. Furthermore, some elements, such as sodium (Na) and chlorine, are considered micronutrients for plants but macronutrients for animals [13]. It often happens that the element content of the grass (e.g., Cu, Fe, Mn, Zn, Se) is sufficient for optimal plant development, but does not reach the level required for the health of grazing animals, which may require mineral supplementation [30,31].
In addition to adequate nutrient intake, nutrient balance is also important in avoiding mineral deficiencies; thus, the ratios of some elements play a prominent role. The K:(Ca + Mg) ratio is also known as the tetany index, which shows the inhibitory effect of high K content in the feed on the utilisation of Mg and Ca [25]. The K:(Na + Mg) index is particularly useful for diets with low Na concentrations [32]. The Ca:P ratio is important for bone formation, the N:S ratio for protein synthesis and N utilisation [33], and the K:Na ratio for the prevention of bloat [34]. If any of these ratios fall into an unfavourable range, it may have health effects.
The quality of fodder is important for the health of the animals, as well as the people who consume the meat. Potentially toxic elements such as Mo, cadmium (Cd), lead (Pb) and mercury (Hg) may enter plants growing on contaminated soils or due to the use of inappropriate fertilisers [35,36], and these are able to bioaccumulate in animals, mainly in the liver and kidneys, but also in muscles and fat tissue. They can negatively affect both female and male fertility, causing embryotoxicity, disturbances in spermatogenesis and oocyte development [37,38,39]. If animals are fed forage contaminated with heavy metals, the Cu and Pb content in milk may pose a health risk to consumers [40].
The most common effect of N fertilisation is the strong stimulation of plant growth and biomass production [41]. If the plant biomass grows faster than the root system can absorb other elements from the soil, the concentration of these elements decreases in the tissues [4,6,21,27]. Micronutrient deficiency not only causes plant physiological problems, but also affects human and animal nutrition and health [42]. Changes in plant nutrient concentration in response to N fertilisation have been researched for decades [43]. However, no research has yet been reported that uses structural equation modelling to separate the effects of N fertiliser on element content via yield increase or via other causes within a single experiment. Experiments examining a wide range of elements are also rare because research often focuses on just a few prominent elements. However, elements that occur in lower concentrations or are less frequently studied can also play a significant role [44,45].
The present hypothesis was that (i) the N content of the calcium ammonium nitrate N fertiliser applied is primarily taken up by the grass in the form of NO3, thus increasing the concentration of elements taken up by the plant in the form of cations, and (ii) N fertilisation reduces the concentration of elements in general by intensively increasing the biomass. The aim of the experiment was to examine the effect of different N fertiliser doses on the production and element composition of grass biomass under field conditions in order to gain a deeper insight into the effects of the most commonly used macronutrient.

2. Materials and Methods

2.1. Study Site

The study was conducted within the framework of a long-term field experiment started in 1973 at the Nagyhörcsök Research Station of the Institute for Soil Sciences, Centre for Agricultural Research, HUN-REN (46°51′56.84″ N; 18°31′10.17″ E; alt. 140 m a.s.l.). Temperature and precipitation data for the area are provided in Table 1. The 10-year mean annual precipitation of 551 mm was consistent with the 50-year mean annual precipitation of 544 mm from 1961 to 2010.
The site had a calcareous loamy chernozem soil (Calcaric Phaeosem) with 8.24 pH(H2O), 7.39 pH(KCl), 3.04% organic matter, 4.27% CaCO3, 28.3 meq 100 g−1 CEC in the 0–20 cm layer.
In the present study, the effect of N fertiliser doses was examined on the elemental composition of the grass. The experiment involved N, P and K fertiliser treatments. Plots receiving N at rates of 0, 100, 200 and 300 kg ha−1 year−1 N were selected to investigate the effect of N treatments, hereafter referred to as N0, N1, N2 and N3. N was applied in the form of calcium ammonium nitrate, which contained 27% N active ingredient, 7% CaO and 5% MgO. The N treatment doses refer to the amount of N active ingredient. Half of the N dose was applied to the soil in autumn and the other half in spring. The 6 m by 6 m plots were arranged in a completely randomised block design with two replicates. A more detailed explanation of the experiment can be found in previous papers [24,46].
The total N content of the soil in the N0, N1, N2 and N3 treatments was 1908 ± 127 mg kg−1, 1983 ± 113 mg kg−1, 2125 ± 115 mg kg−1 and 2141 ± 184 mg kg−1, respectively. The selected plots received a single application of 500 kg ha−1 P and 500 kg ha−1 K in the form of superphosphate and potassium chloride, respectively, in autumn 1999, resulting in plant-available ammonium lactate-soluble P and K contents of 69.0 ± 18.3 mg kg−1 and 173 ± 51.9 mg kg−1, respectively, in the 0–20 cm soil layer. The soil of the experiment had the following total element contents: Ca: 12,481 ± 3304 mg kg−1, Mg: 398 ± 23.6 mg kg−1, Mn: 383 ± 36.5 mg kg−1, Al: 87.8 ± 12.8 mg kg−1, Fe: 78.3 ± 8.73 mg kg−1, Sr: 25.2 ± 3.88 mg kg−1, Ba: 17.2 ± 2.14 mg kg−1, S: 13.9 ± 2.46 mg kg−1, Na: 12.1 ± 1.67 mg kg−1, Ni: 3.38 ± 0.352 mg kg−1, Zn: 4.06 ± 1.69 mg kg−1, Cu: 3.28 ± 0.445 mg kg−1, B: 2.33 ± 0.119 mg kg−1, Mo: 0.0302 ± 0.0101 mg kg−1.
Previously, various arable crops were grown as test plants in the experiment. Since 2001, the effects of the treatments on grassland have been studied. The grass was established in autumn 2000. The grass on the studied plots consisted of the following species and mean cover ratios: Festuca arundinacea: 27.2%, Bromus inermis: 15.0%, Agropyron cristatum: 13.5%, Dactylis glomerata: 7.6%, Phalaris arundinacea: 1.5%, and other dicot species: 8.6%. The species cover has changed over the years due to fertilisation. From 2001 to 2010, the aboveground vegetation was mowed in late May or early June each year at a height of 4 cm above the ground. The fresh biomass was weighed and then dried for 10 days at 30 °C. The biomass data refer to the harvested dry aboveground biomass of the first harvest each year.

2.2. Analytical Methods

Soil samples were taken in 2000 from the 0–20 cm layer of the soil, and composite samples were formed from 8 core samples per plot. The samples were analysed for the following parameters: soil pH(H2O) in a 1:2.5 soil:water suspension, pH(KCl) [47], organic matter content [48], CaCO3 content [49], cation exchange capacity (CEC) [50], total N content [51], and plant-available P and K contents (AL-P and AL-K) [52]. The total element content of the soil was determined using aqua regia and microwave digestion [53].
Plant samples for element analysis were collected from the first harvest each year from 2001 to 2010 from the first harvest. Plant element contents were determined from dried, finely ground plant samples digested in a mixture of 7 cm3 67% HNO3 and 3 cm3 30% H2O2, after which the ICP technique was used (ICP-AES, Jobin Yvon Ultima2, Horiba Scientific Ltd., Kyoto, Japan) [54]. Plant N element content was determined by the Kjeldahl method and refers to the organic N content [55]. Plant NO3–N was determined photometrically at a wavelength of 540 nm after extraction with distilled water and the addition of N-(naphthyl-1-)-ethylenediamine-dichloride and sulphanilamide. The element concentrations are given in terms of the dry mass (DM) of the plant samples. The K:(Ca + Mg) and K:(Na + Mg) ratios were calculated on a milliequivalent basis; that is, the element concentrations were divided by the atomic weight of the element and then multiplied by its valence [8,25]:
K : Ca + Mg   ratio = K 39.1 Ca 40.1 × 2 + Mg 24.3 × 2
K : Na + Mg   ratio = K 39.1 Na 23 + Mg 24.3 × 2

2.3. Statistical Analysis

Repeated measures linear models were fitted to the available grassland element content data from 2001 to 2010. The residual variance homogeneity and residual normality of the model were checked visually with fitted vs. residual plots and quantile-quantile (QQ) plots, respectively. Plant Na concentration, K:(Ca + Mg) ratio and K: Na ratio did not meet the condition of homogeneity of variance, so these variables were log-transformed. Post hoc tests were performed using Tukey’s HSD method at a significance level of p < 0.05. The direct effect of N fertiliser doses on element content and their indirect effect through increasing biomass were examined using structural equation modelling (SEM) analysis. SEM can handle complex relationships between multiple dependent and independent variables simultaneously by breaking these relationships down into direct and indirect or mediated effects [56]. The main assumptions of SEM are normal residuals, multivariate normal data and a sufficiently large sample size. As multivariate normality was not met, the robust Satorra-Bentler chi-square estimation was used in the models instead. The SEM analyses were intentionally performed in saturated models, including the mediating effect of biomass in all cases, as the aim was to examine the dilution effect rather than to find the most perfect statistical model. Due to fertilisation, plant biomass increases, but the rate at which some elements are taken up cannot keep up with this increase, so their concentration in the plant tissue decreases, or in other words, becomes diluted. Although, using the concepts of structural equation analysis, reference is made in several places to the direct and indirect yield-increasing effects of N fertilisation, the direct effect is not in fact a specific direct effect, but rather different mechanisms characteristic of the individual elements, which differ from the yield-increasing indirect effect. These will be analysed in the discussion.
Analysis was performed using R (Version 4.5.1) [57] and RStudio (Version 2025.09.0) [58]. The nlme package (Version 3.1–168) [59] was used for repeated measure model, the car package (Version 3.1–3) [60] for the analysis of variance, the multcomp package (Version 1.4–29) [61] for pairwise comparisons, the emmeans package (Version 2.0.0) [62] for the extraction of group means, the lavaan package (Version 0.6–19) [63] for SEM and the ggplot2 package (Version 4.0.1) [64] for generating the figures.

3. Results

3.1. Biomass

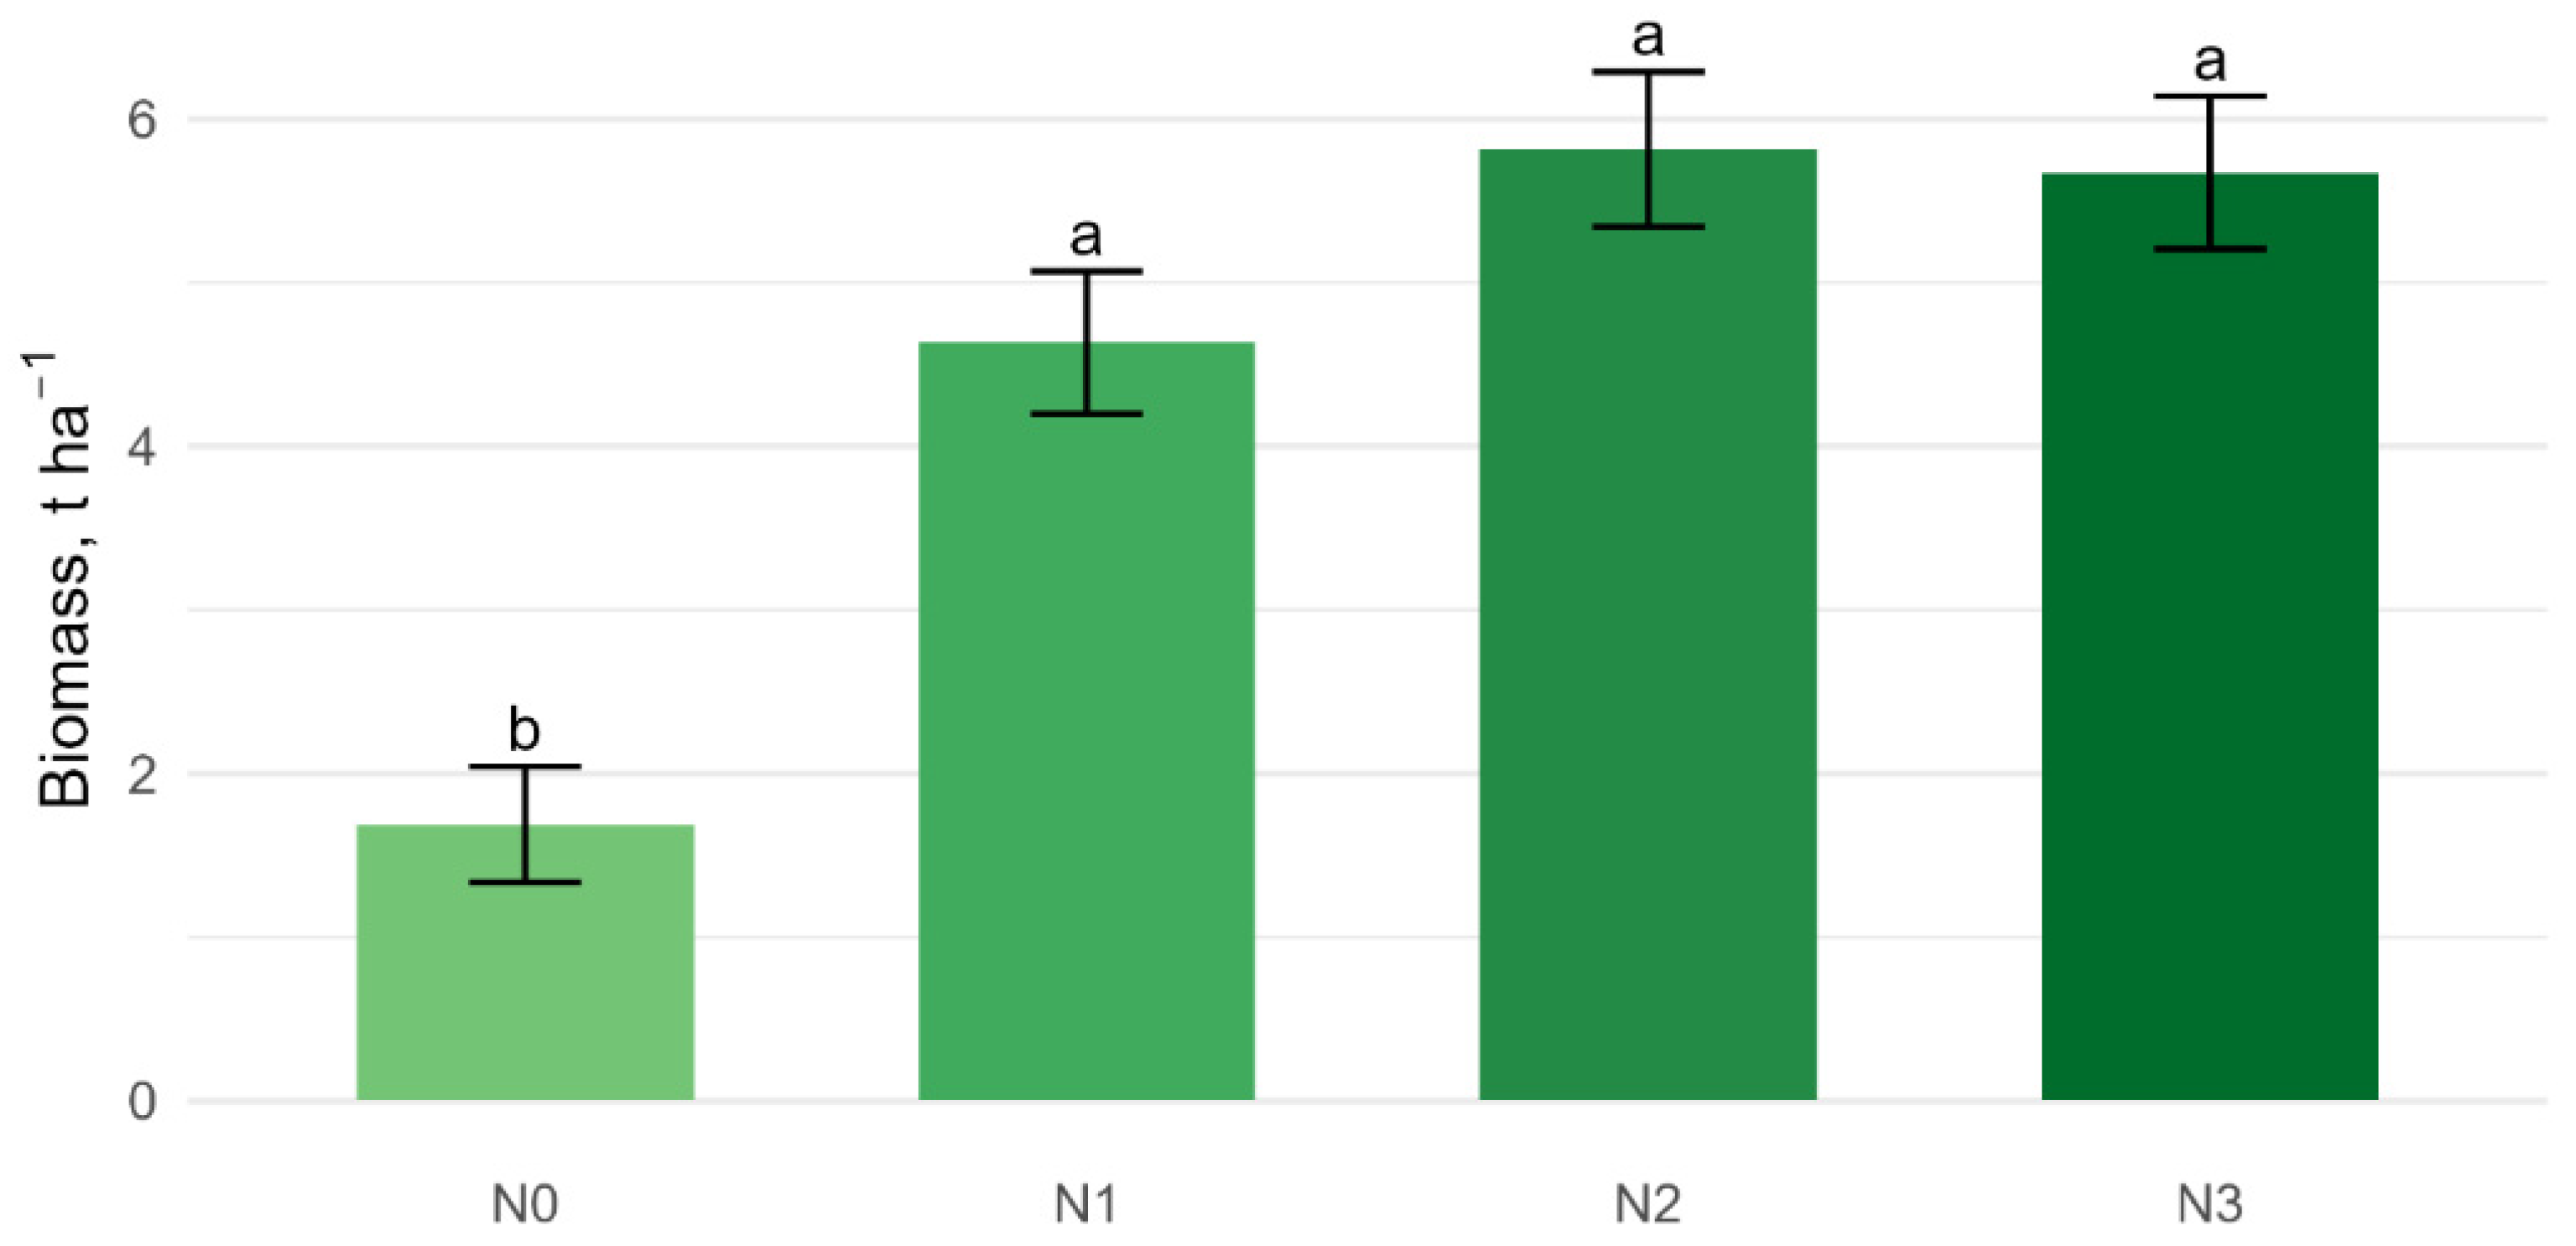
In response to N fertilisation, dry biomass increased from 1.69 t ha−1 in the N0 treatment to 5.82 t ha−1 in the N2 treatment. The largest increase, 2.74-fold, was between the N0 and N1 treatments, while the N3 treatment no longer resulted in an excess of biomass compared to N2 (Figure 1).

3.2. Element and NO3–N Content

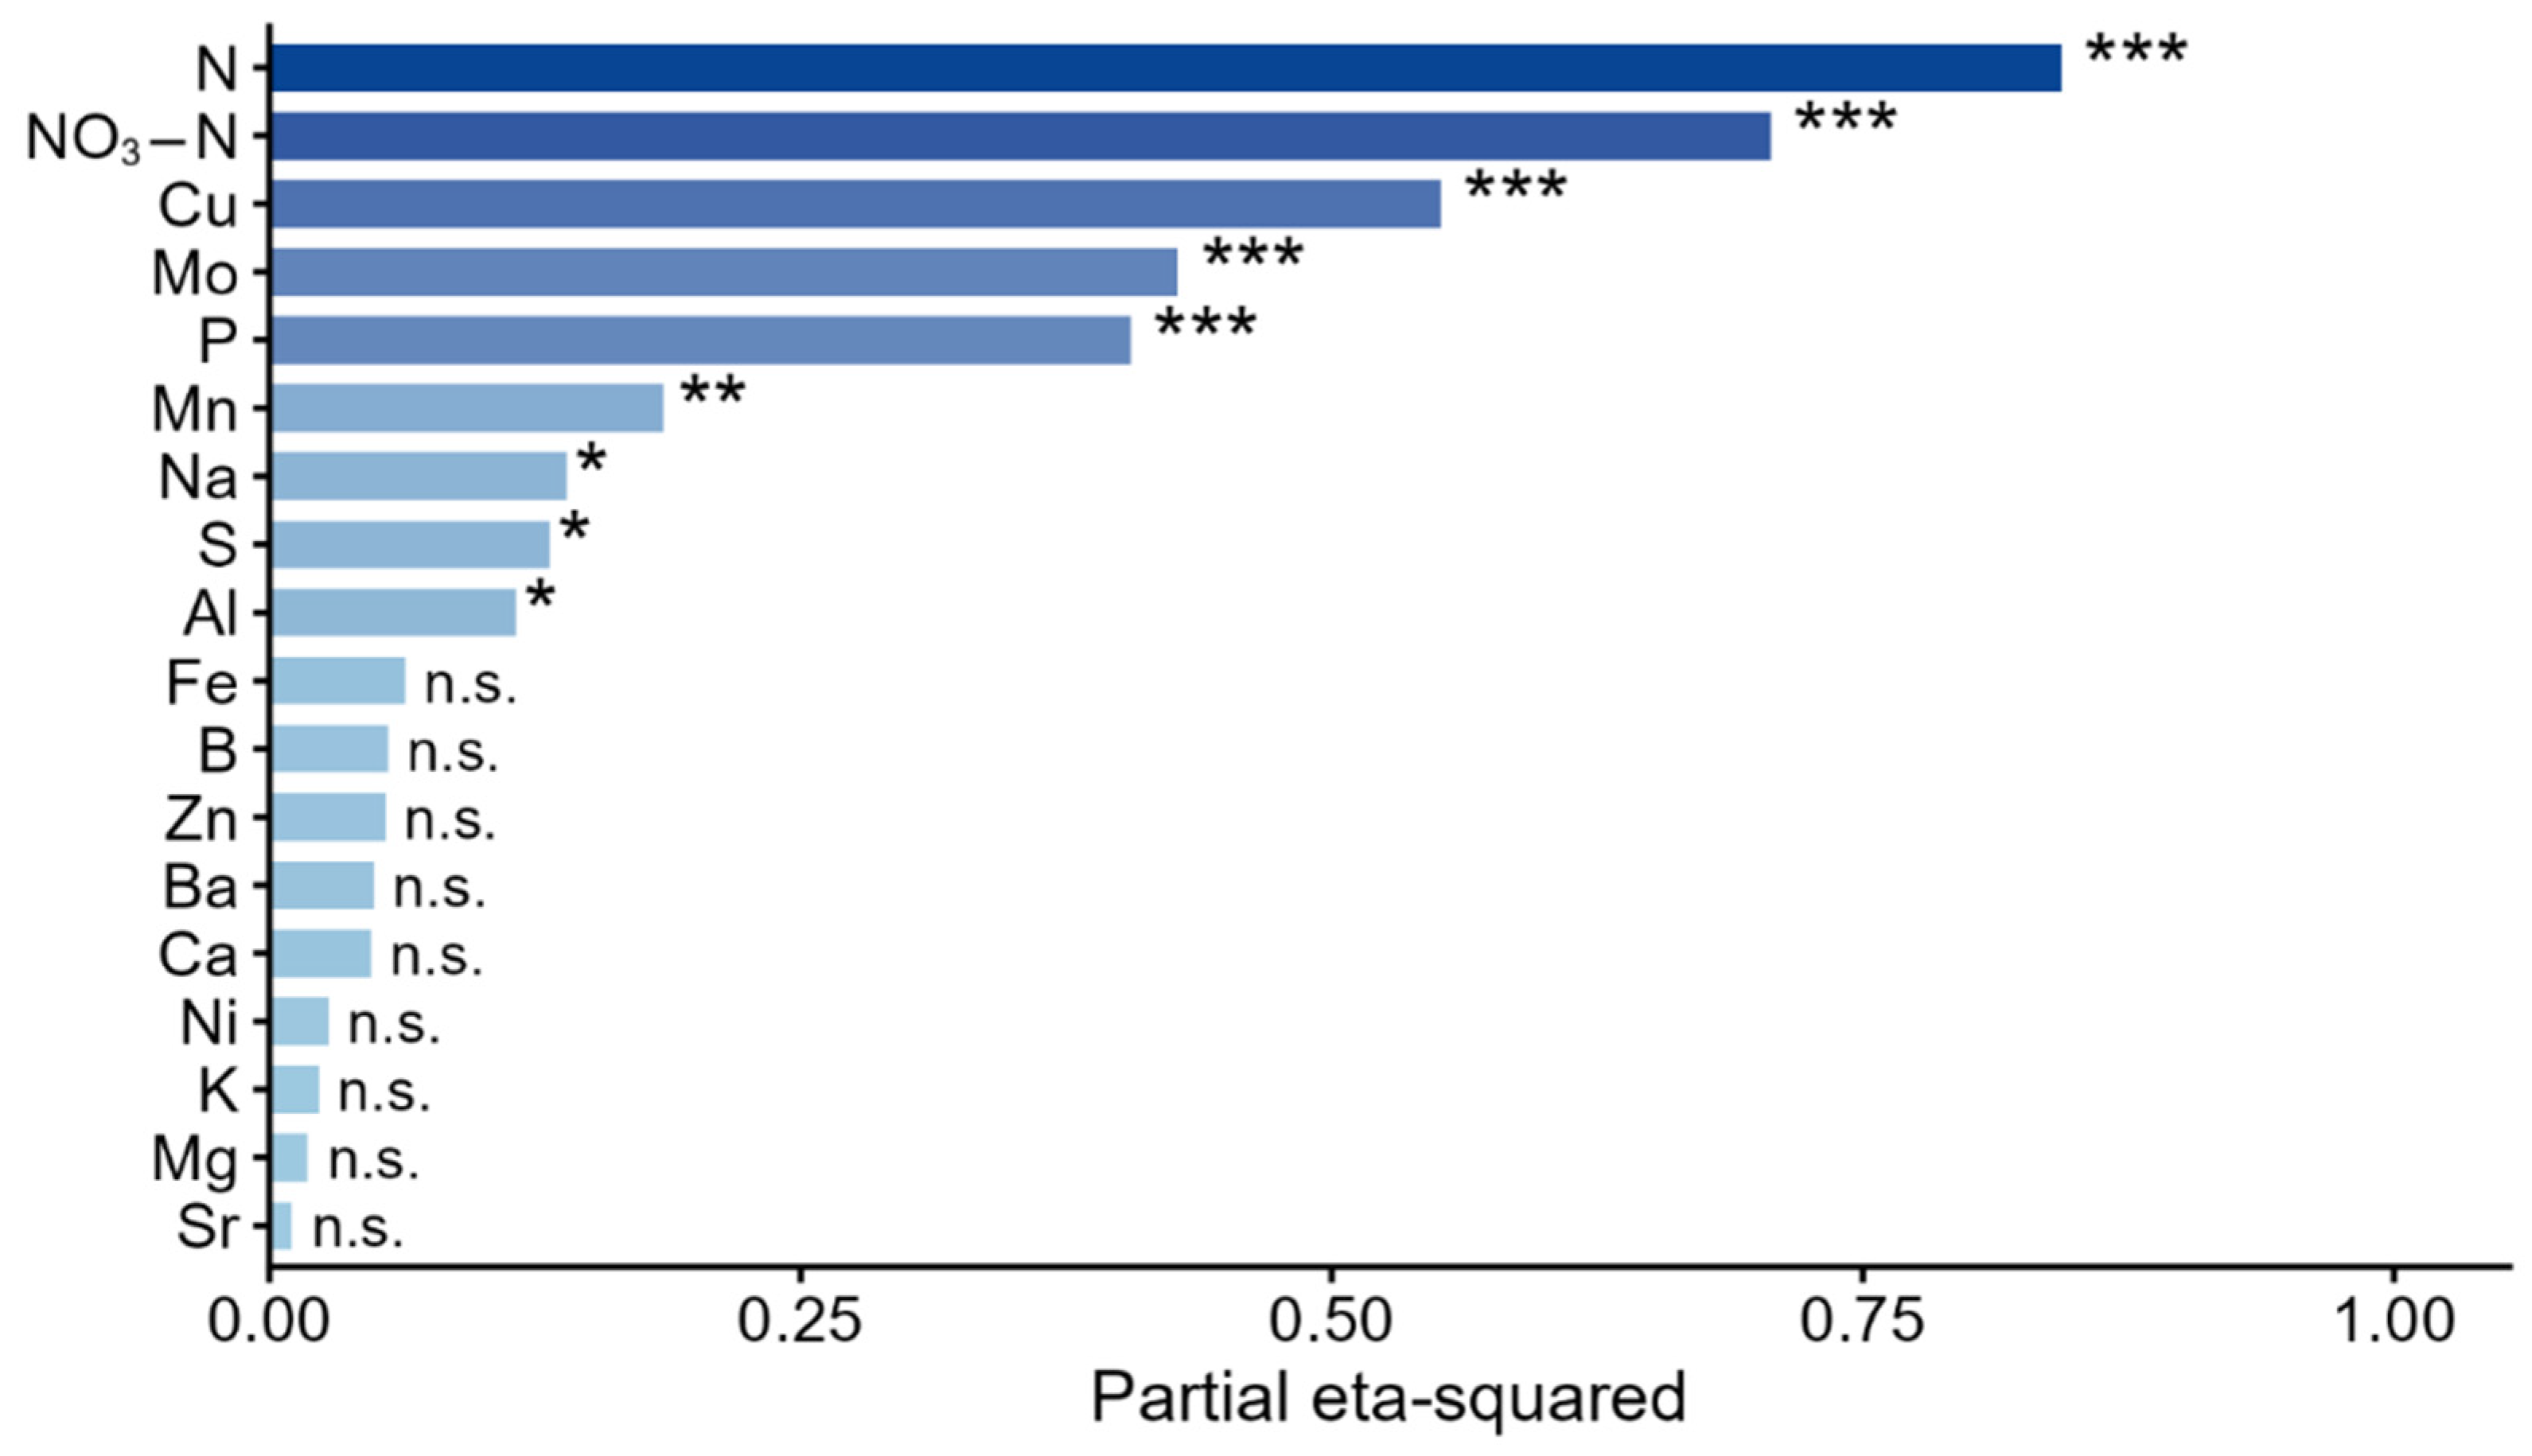
N treatments had the strongest effect on the N, NO3–N, Cu, Mo and P concentrations in the aboveground biomass of the grass sward, while the effect was moderate for Mn, Na, S, Al elements. The treatments had no significant effect on the concentrations of Fe, B, Zn, Ba, Ca, Ni, K, Mg or Sr (Figure 2). The following elements were below the detection limit: As: 0.400, Cd: 0.020, Co: 0.040, Cr: 0.100, Hg: 0.120, Pb: 0.300 and Se: 0.600 mg kg−1.
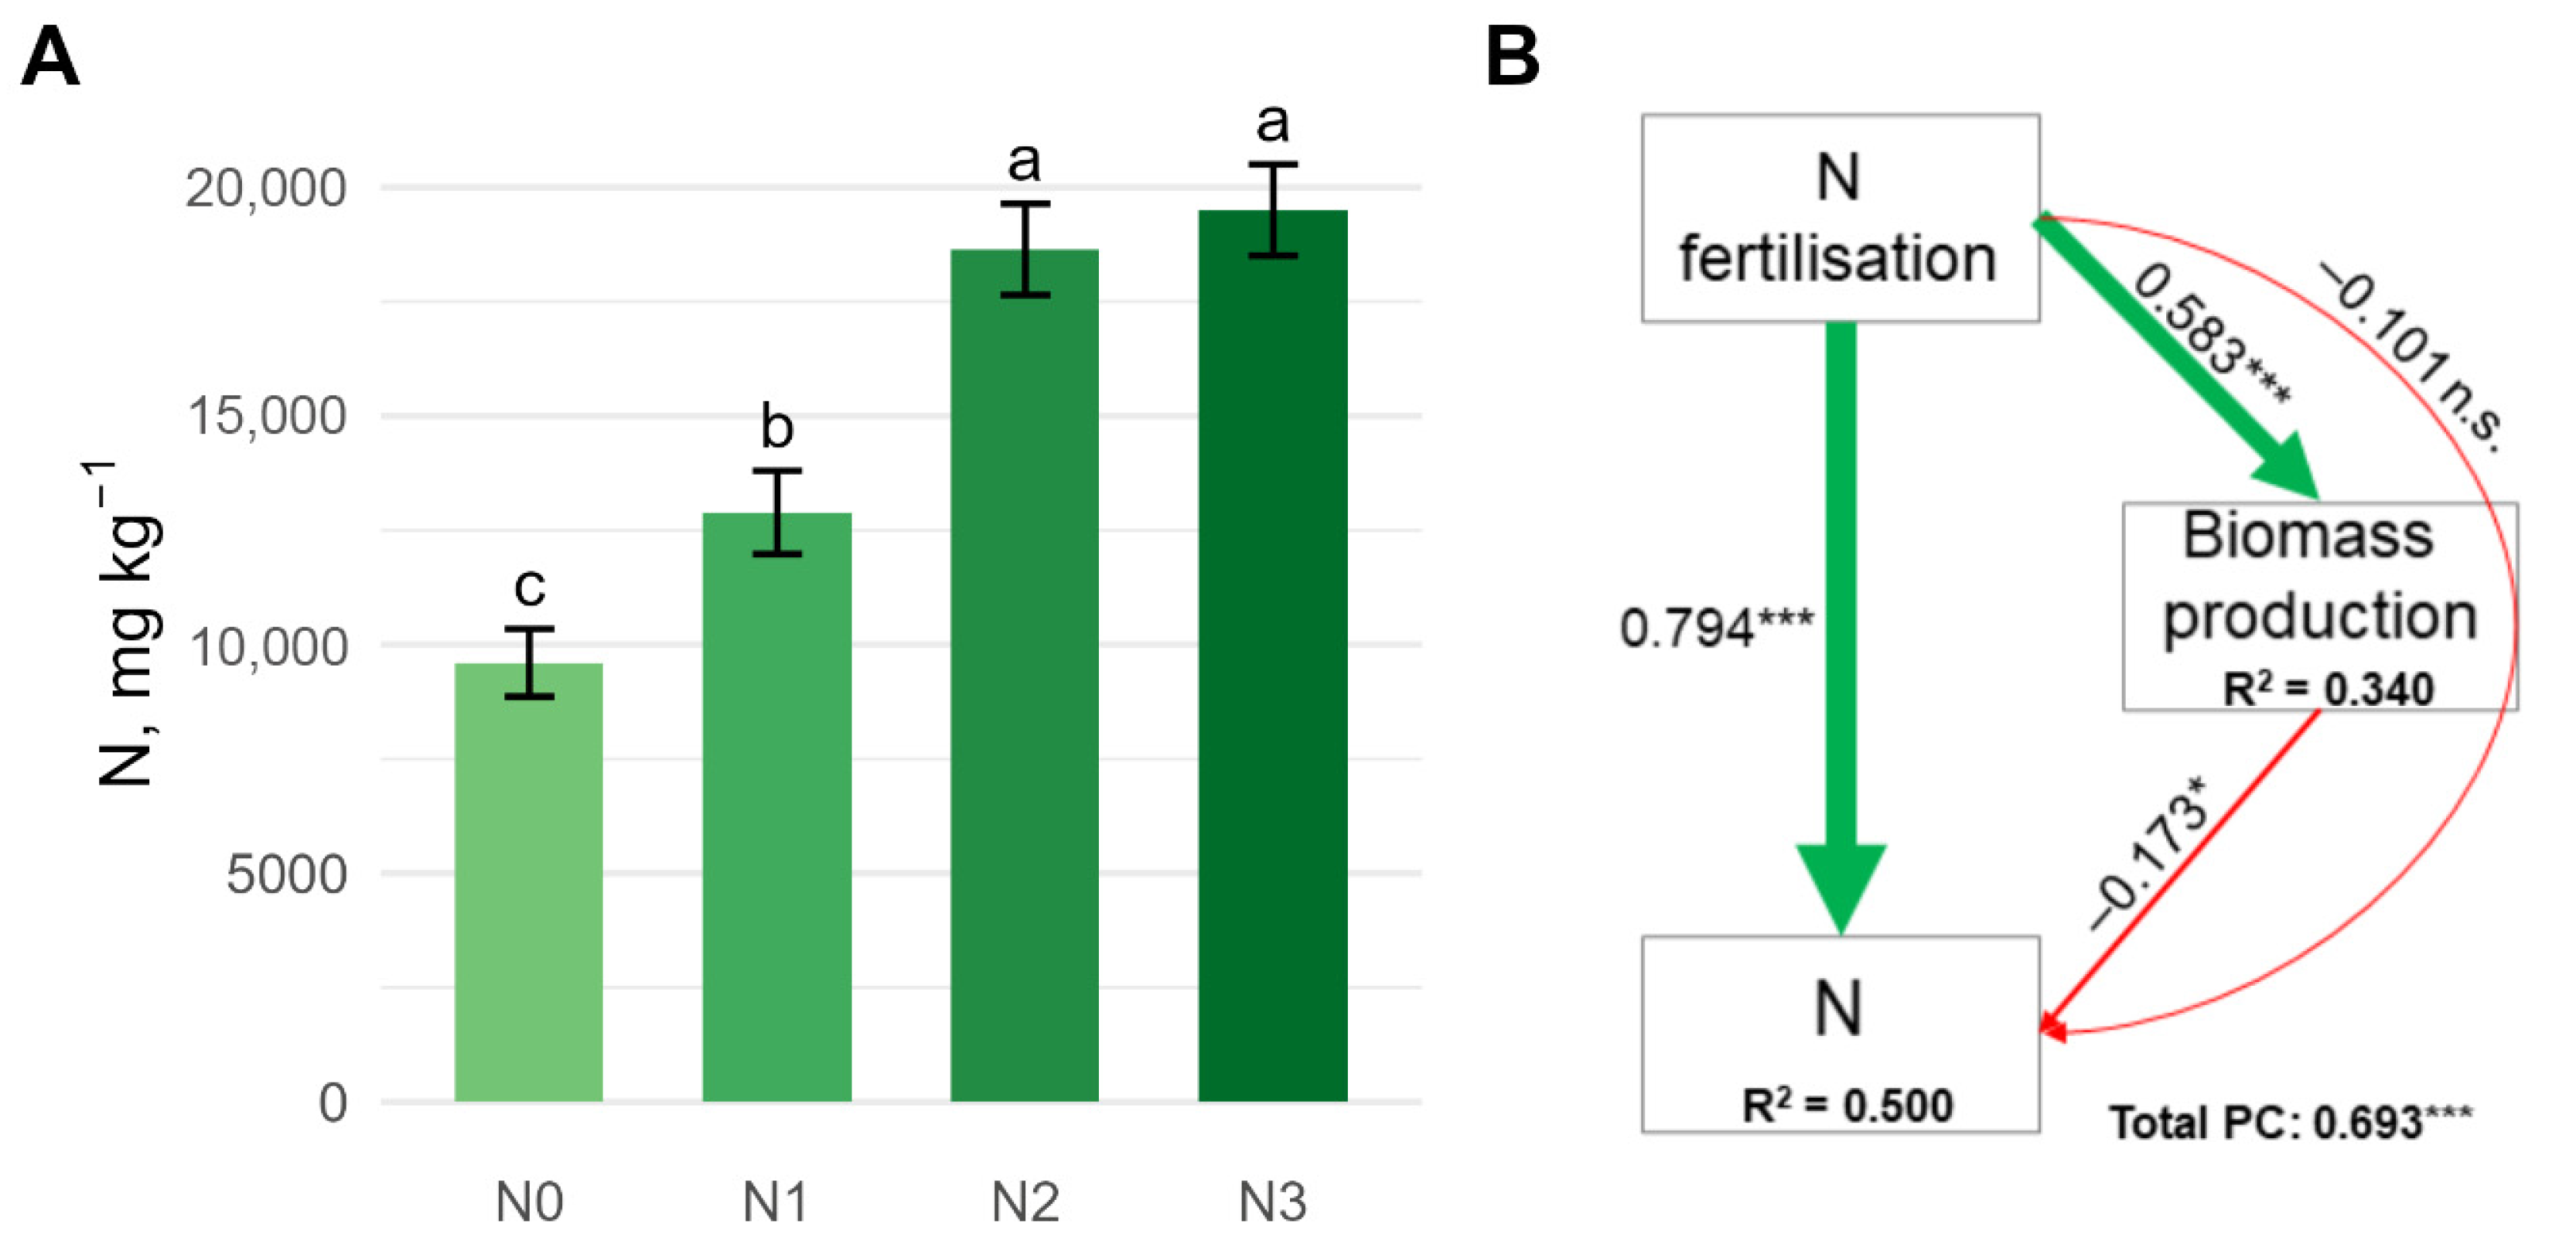
In response to the N treatments, the N concentration of the grass increased from 9604 ± 740 mg N kg−1 (DM) in the N0 treatment to 19,505 ± 999 mg N kg−1 at the N3 treatment level, although the increase between the N2 and N3 treatments was not significant (Figure 3A). The N fertiliser treatments strongly increased the N concentration of the grass, but the SEM analysis indicated that the increase in biomass caused a slight, overall non-significant dilution effect on the N concentration in the plant tissue. The indirect effects that increased biomass and the direct effects, which include all other mechanisms, resulted in a significant (p < 0.000) increase in the N concentration in the grass, with a path coefficient of 0.693 (Figure 3B).
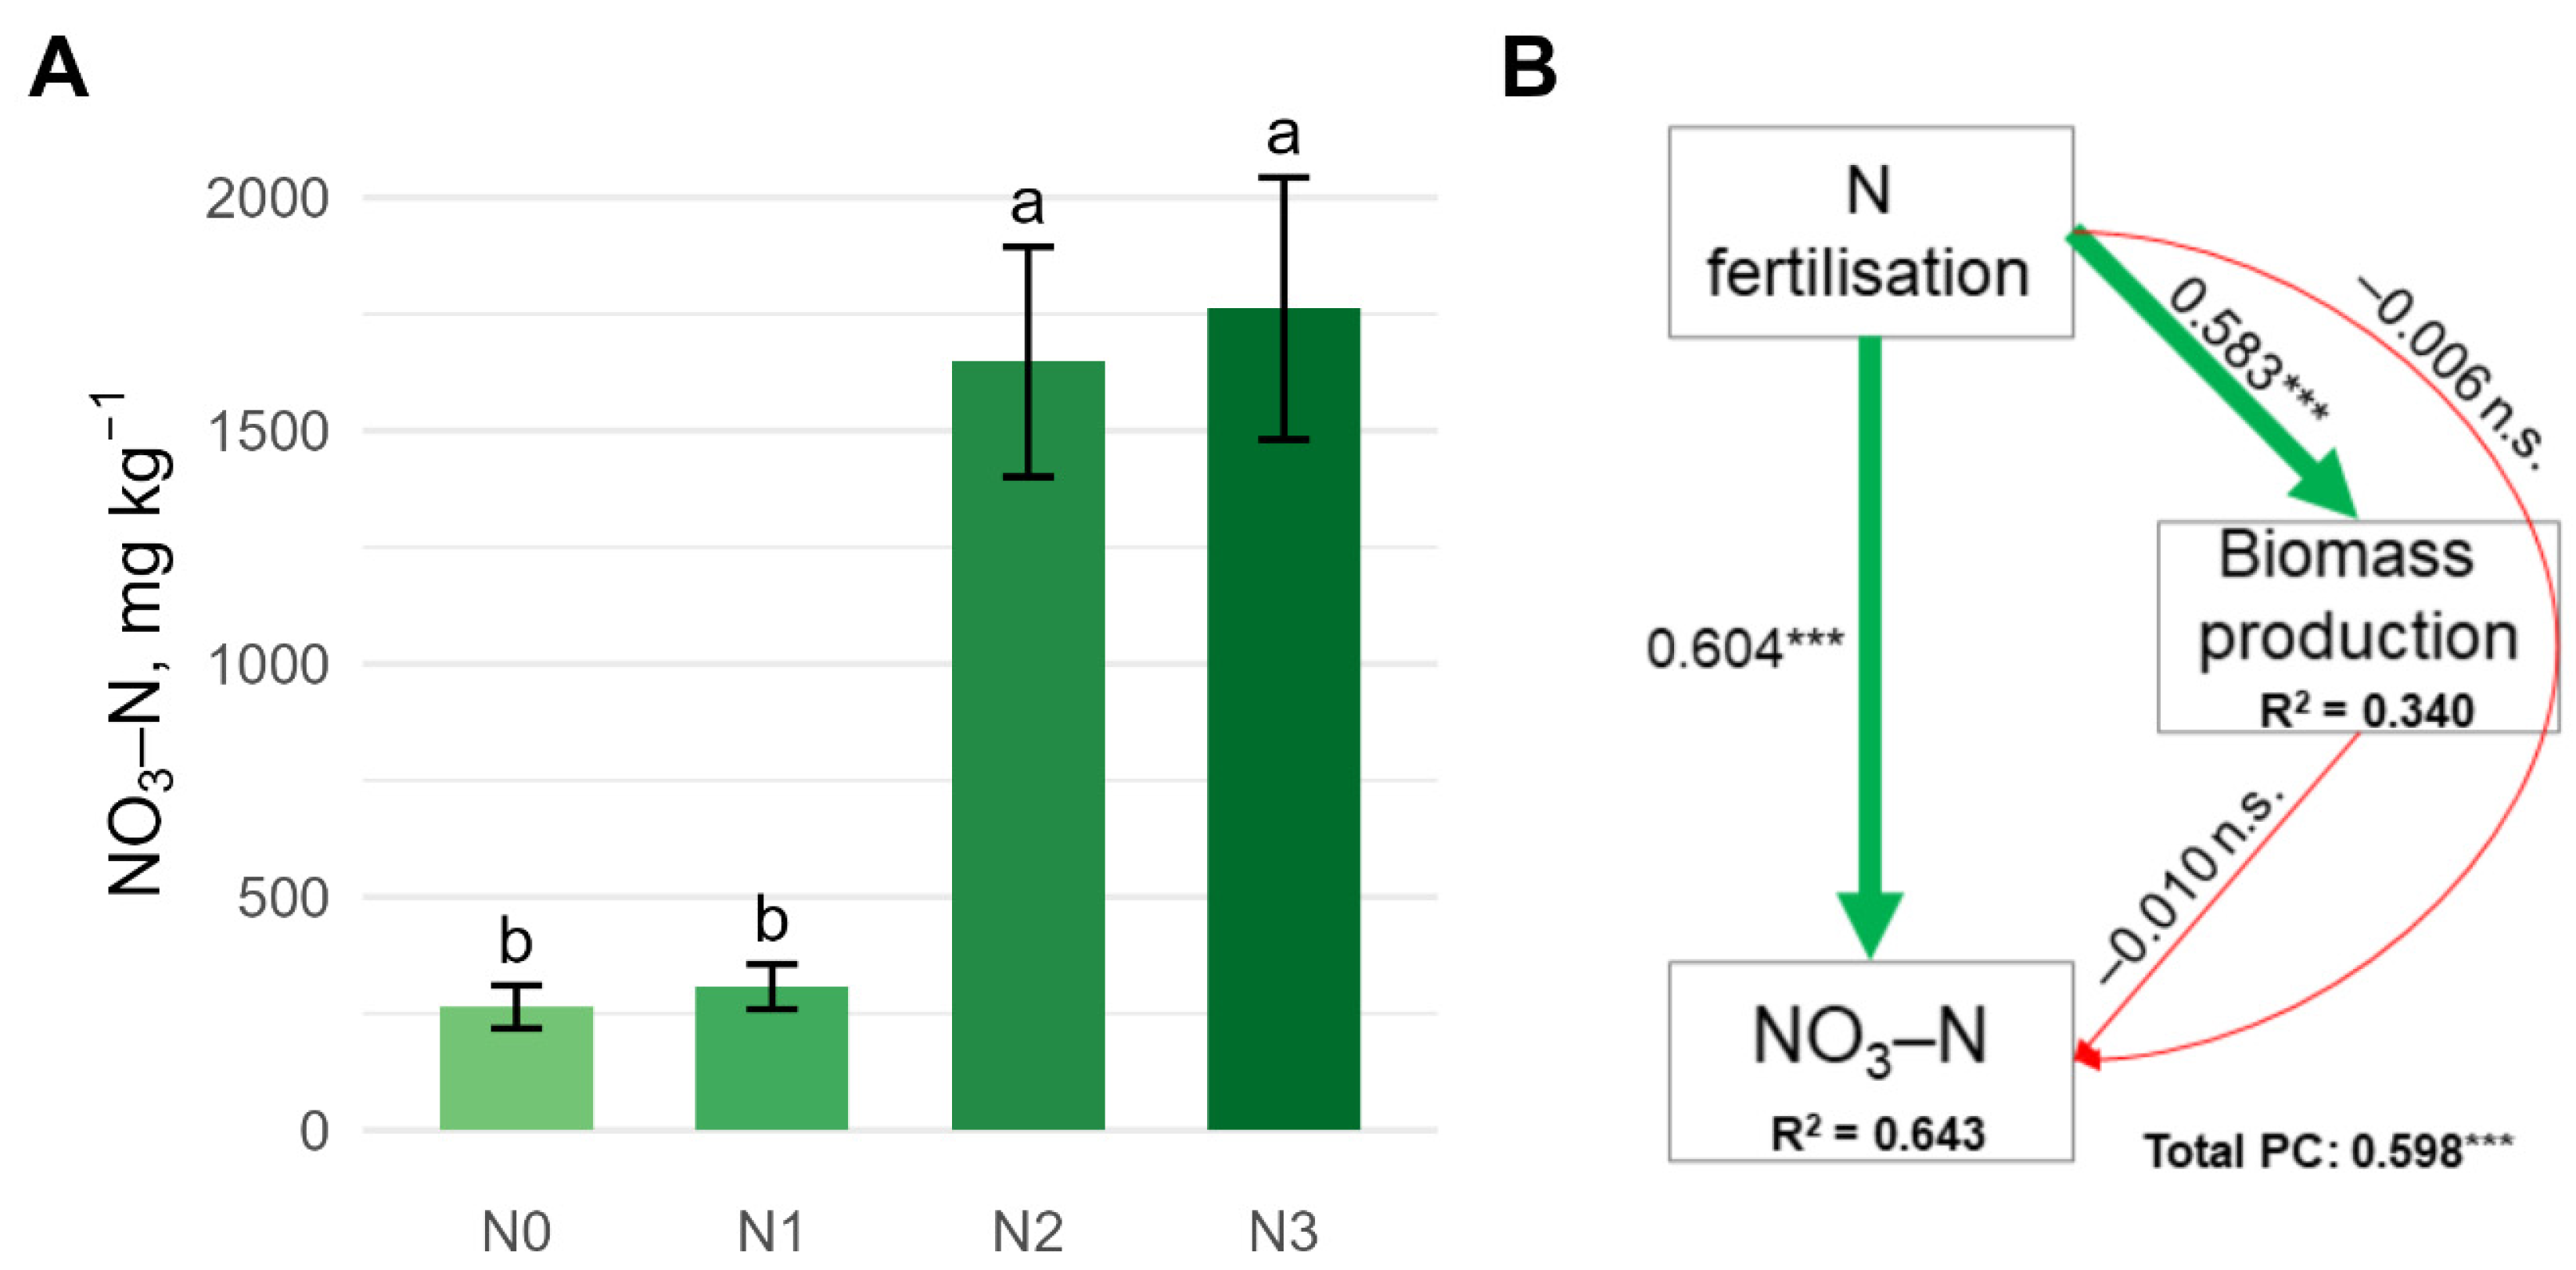
The plant NO3–N concentration increased only negligibly in the N1 treatment, from 264 mg kg−1 (DM) measured in the N0 control to 308 mg kg−1, but significantly increased to 1648 and 1762 mg NO3–N kg−1 in the N2 and N3 treatment levels, respectively (Figure 4A). Plant NO3–N concentration was almost entirely influenced by the direct effect of N fertiliser, meaning that the increased biomass production did not cause any significant dilution (Figure 4B).
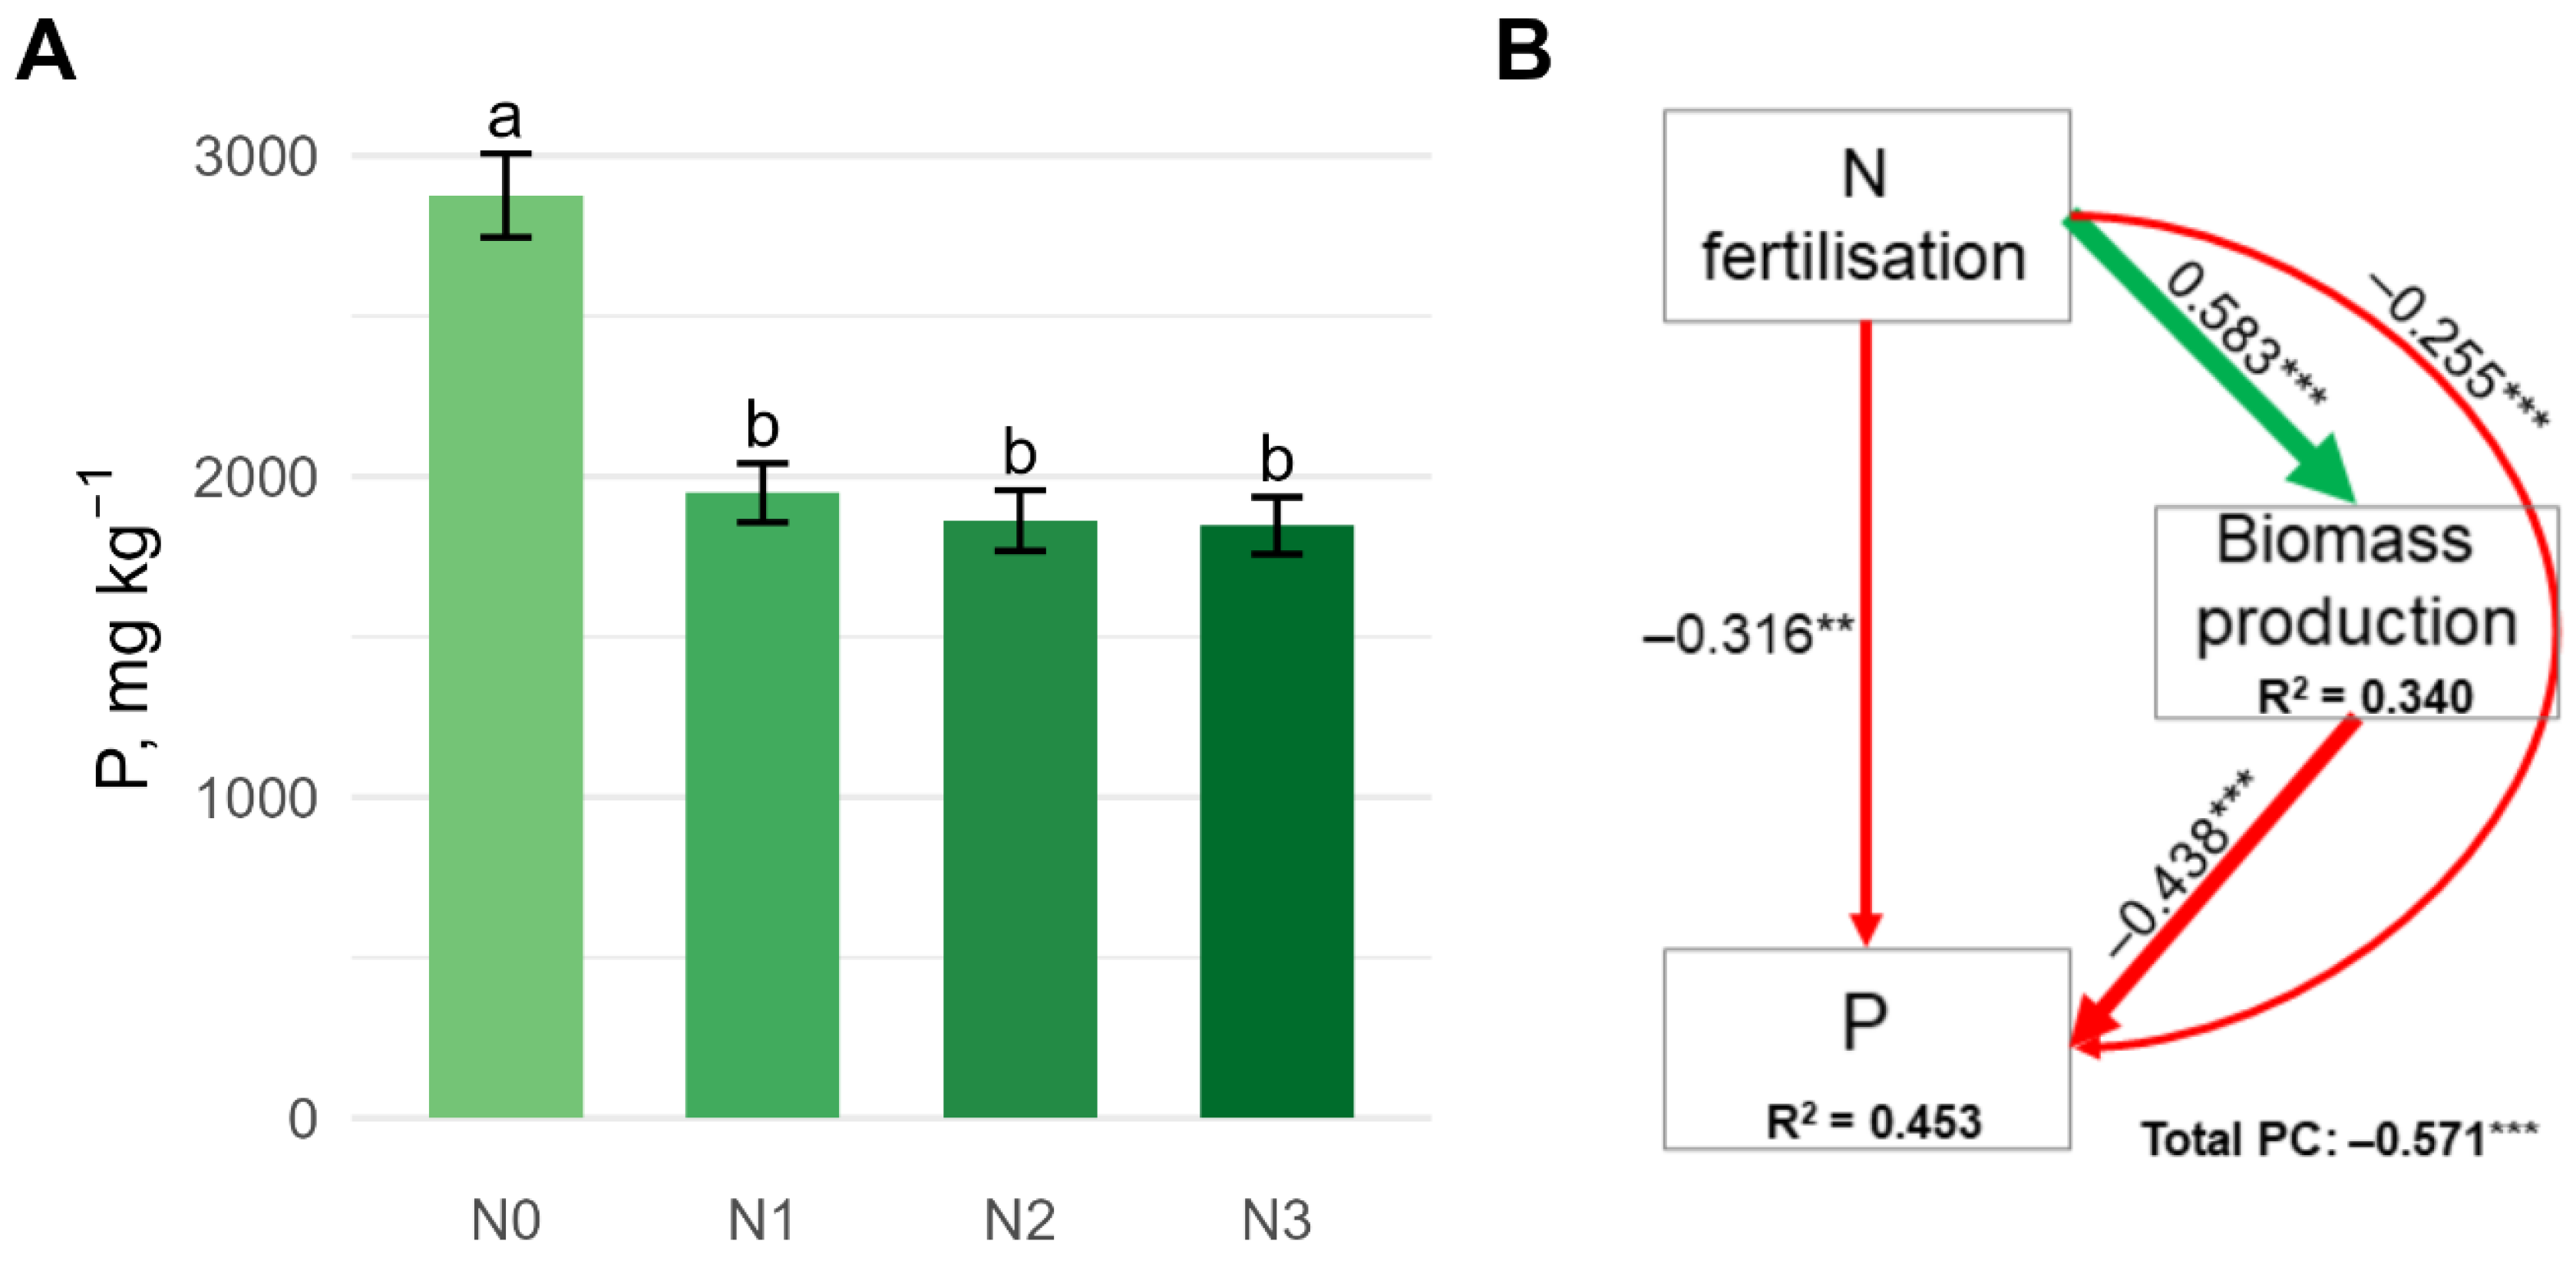
The P concentration of the N-fertilised grass decreased significantly compared to the control value of 2876 ± 131 mg P kg−1 (DM). There were no significant differences in grass P concentration between the individual N treatments (N1–N3), but the lowest value (1847 ± 88.8 mg P kg−1) was measured in the N3 treatment (Figure 5A). The SEM analysis shown in Figure 5B revealed that N fertilisation significantly reduced the P content both directly and indirectly through its biomass-increasing effect, resulting in a significant (p < 0.000) reduction in P concentration with an overall path coefficient of –0.571.
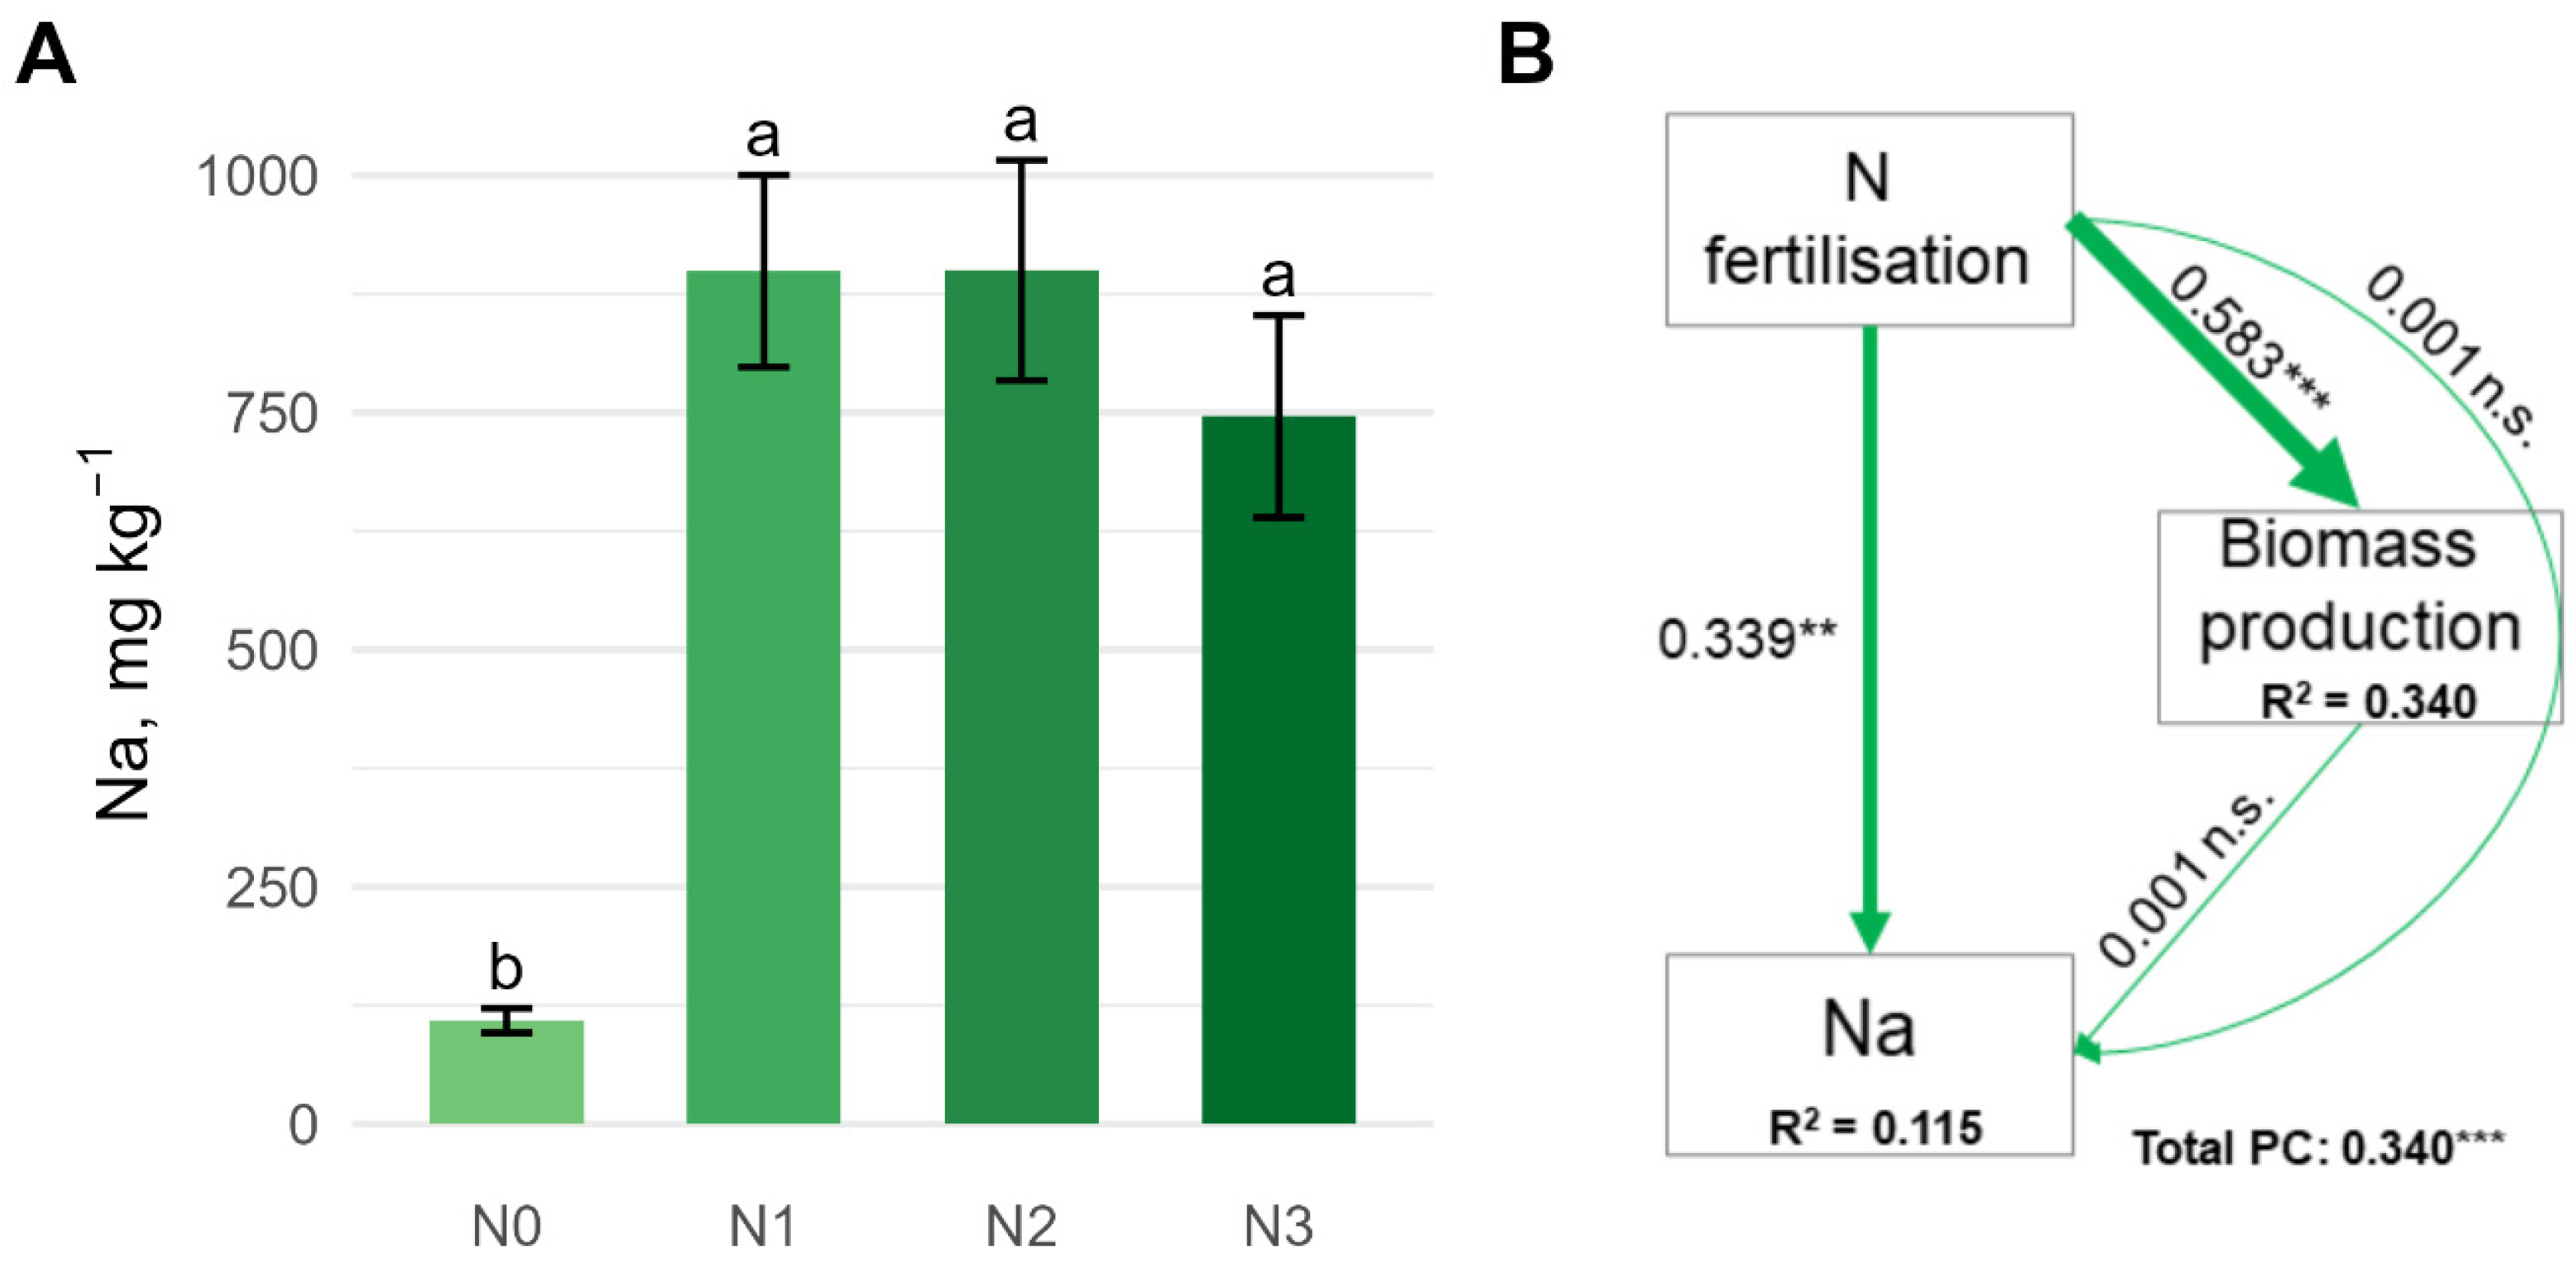
The N treatments resulted in a significant increase in the Na concentration of the grass. At the N0 treatment level, the Na concentration was only 109 ± 12.9 mg Na kg−1 (DM), which increased more than 8-fold in the N1 and N2 treatments, and then decreased to 746 ± 132 mg Na kg−1 at the N3 level (Figure 6A). The change in Na concentration was not notably influenced by the increase in biomass, so no dilution effect occurred. The increase in Na concentration in response to N fertiliser was dominant (Figure 6B), resulting in a positive path coefficient.
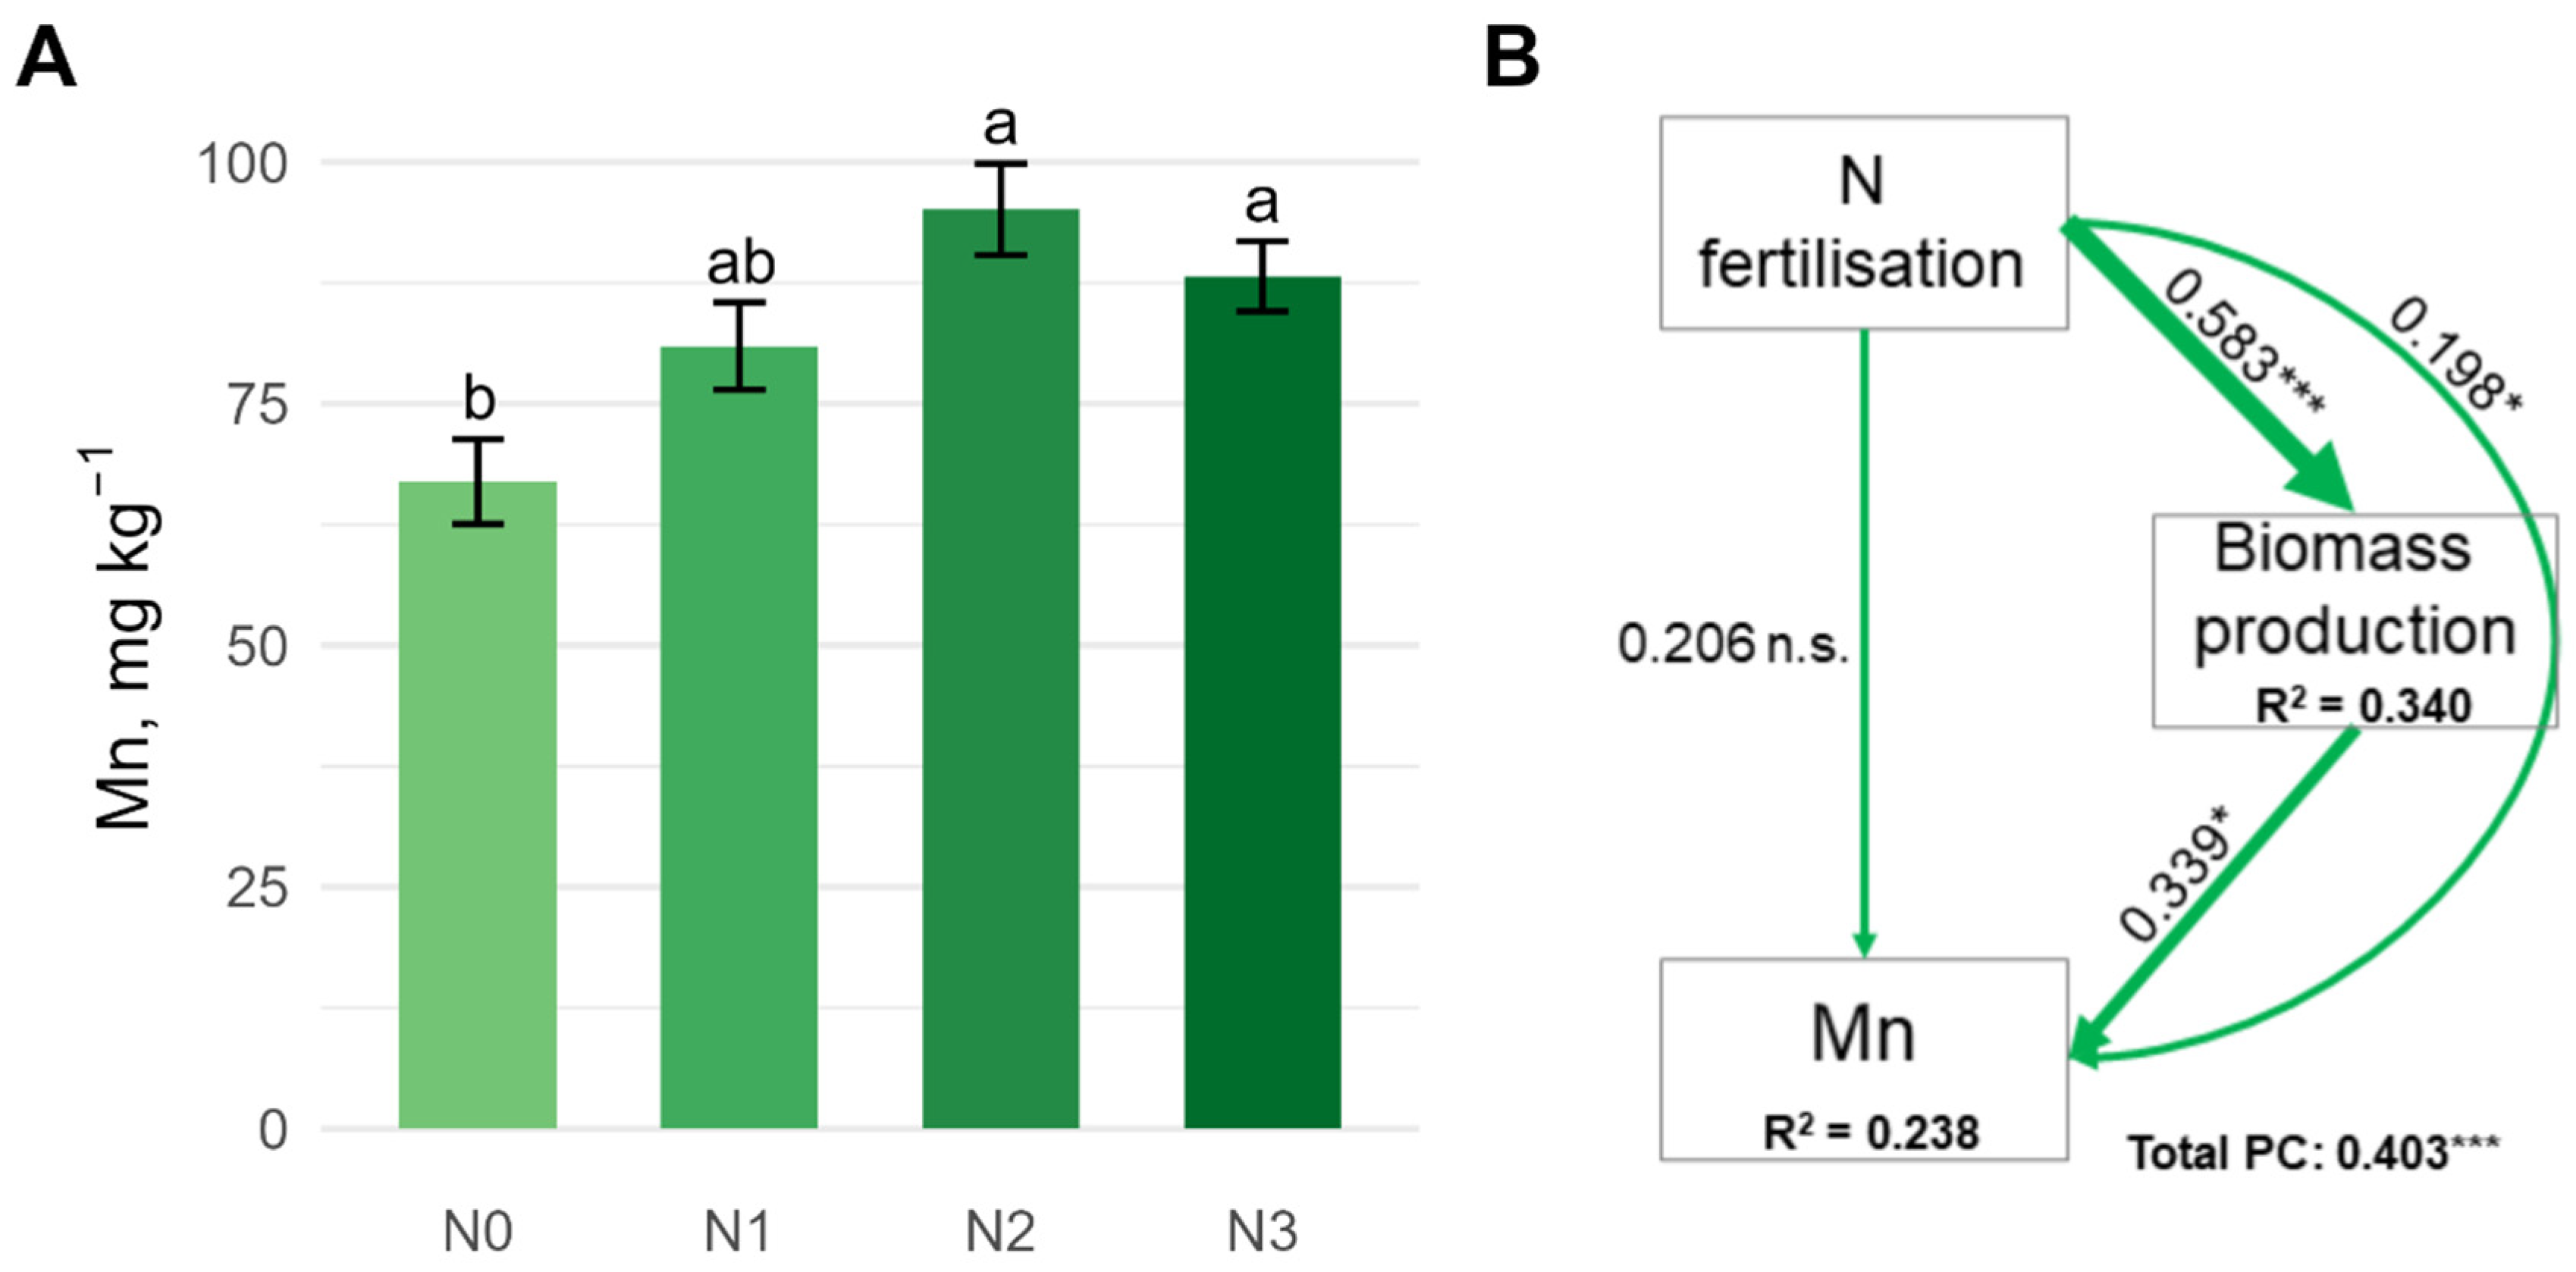
Mn concentration increased in parallel with the N fertiliser doses from 66.9 ± 4.38 mg Mn kg−1 (DM) at treatment level N0 to 95.1 ± 4.73 mg Mn kg−1 at treatment level N2, followed by a slight decrease at N3 (Figure 7A). N fertilisation had a non-significant direct and a significant indirect positive effect, thus contributing to an increase in Mn concentration (Figure 7B).
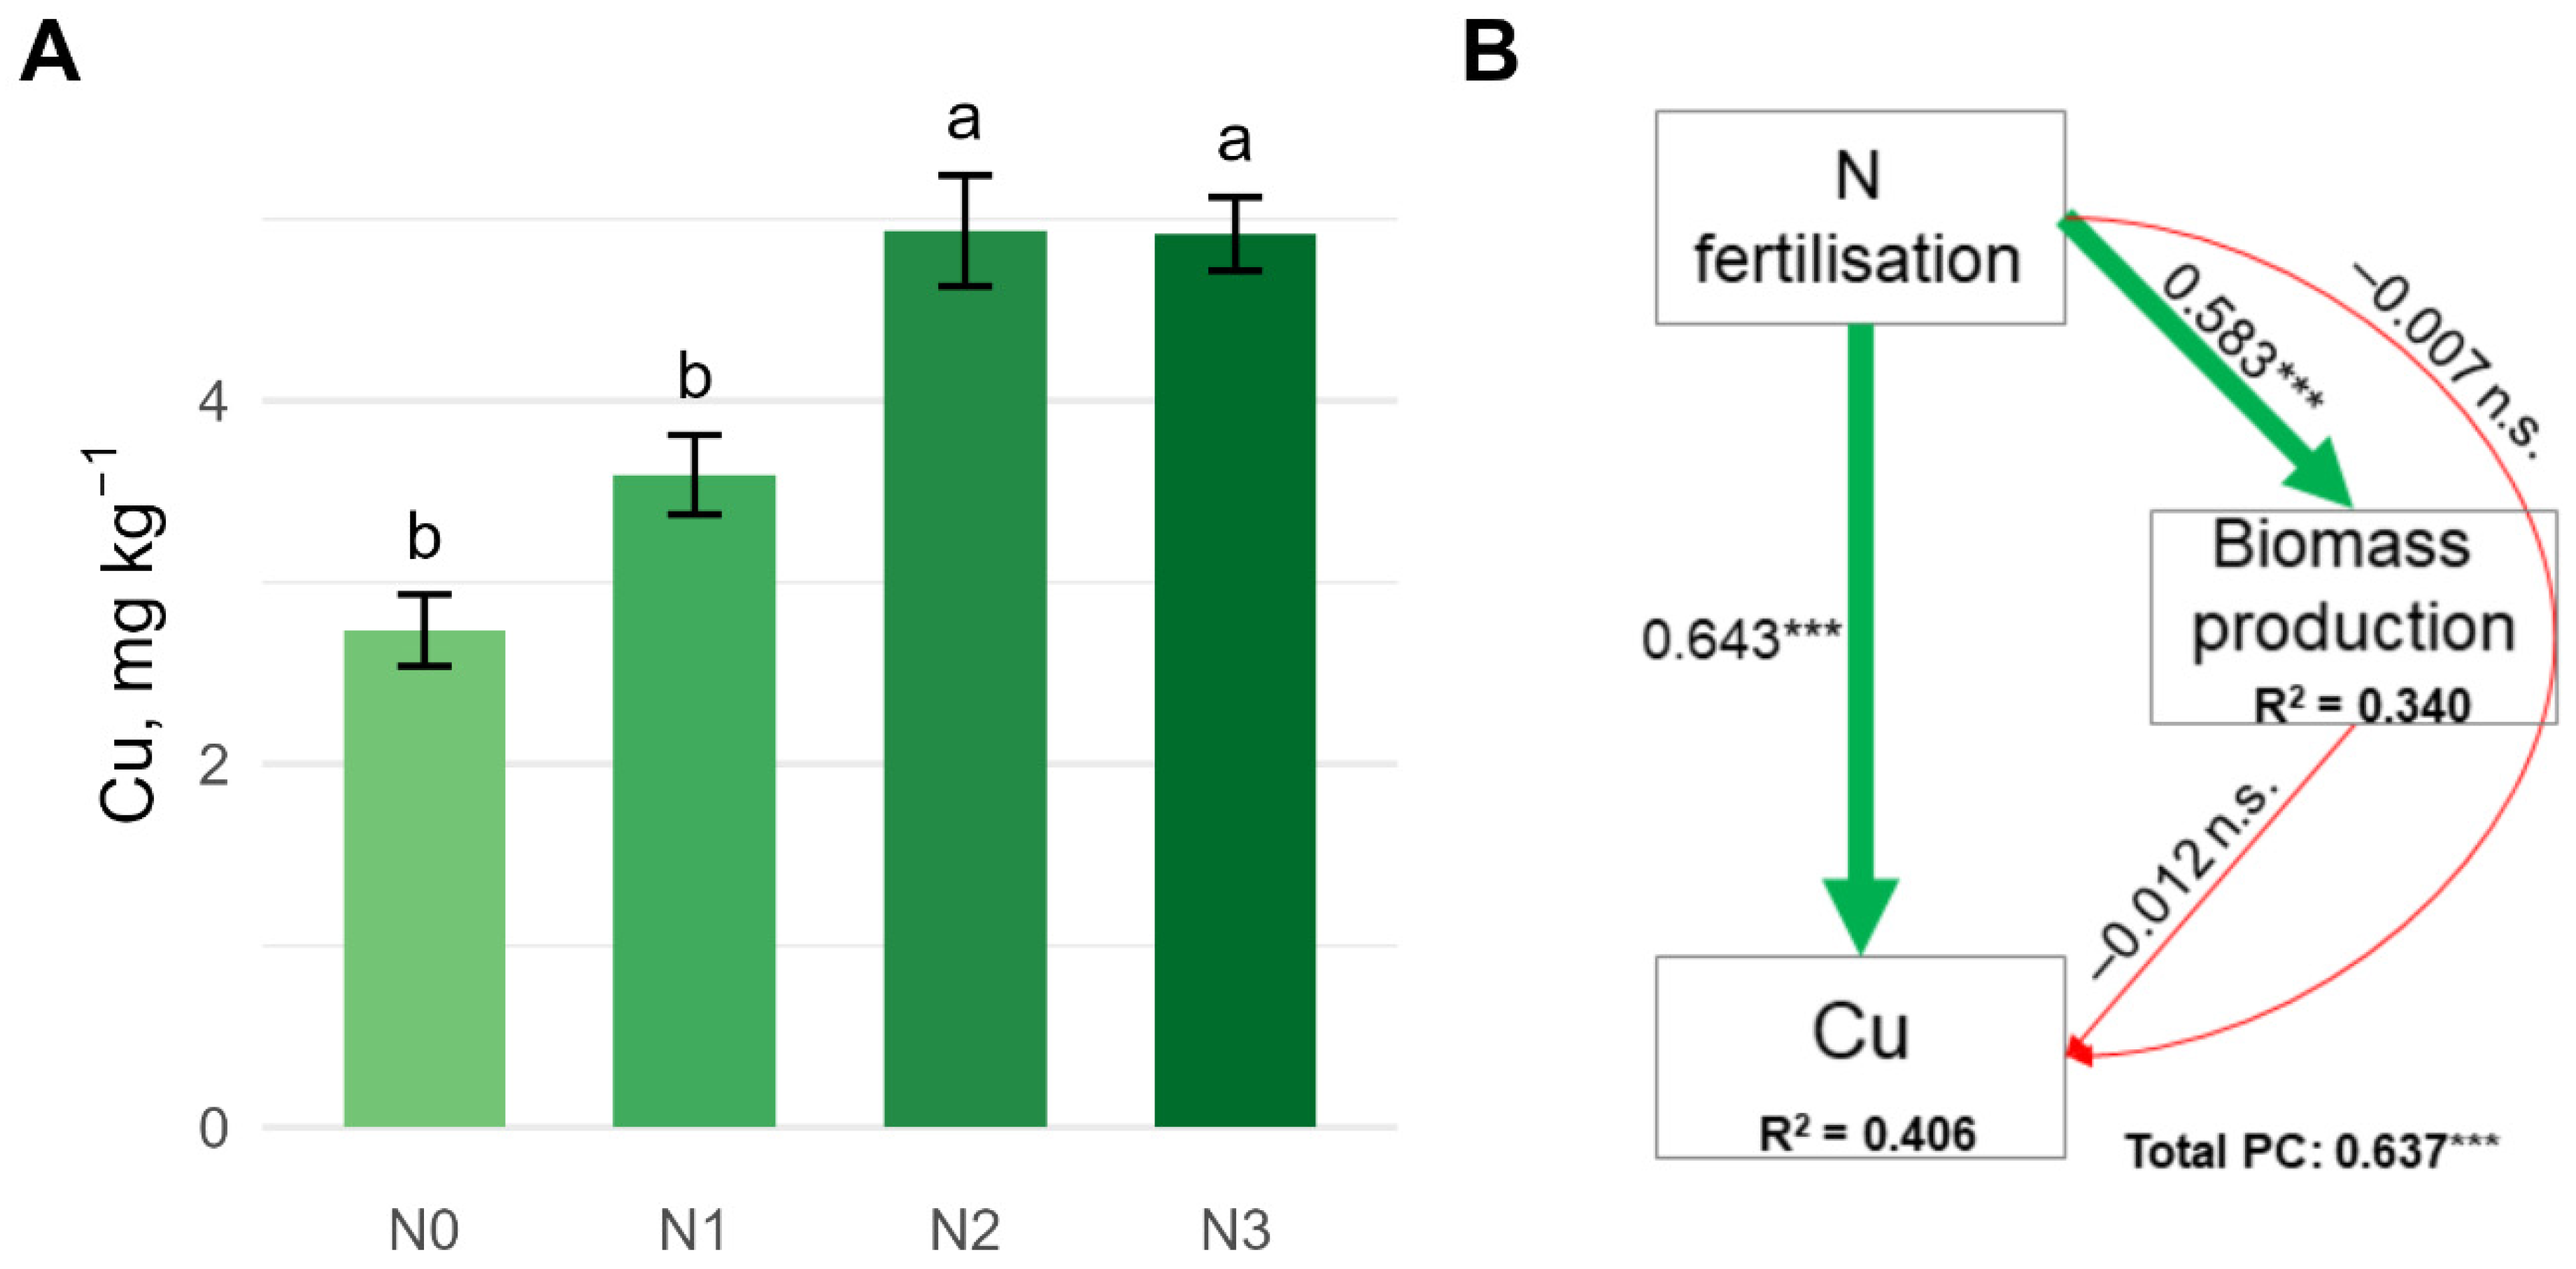
The Cu concentration of the grass gradually and significantly increased from 2.74 ± 0.197 mg Cu kg−1 (DM) at the N0 level to 4.93 ± 0.305 mg Cu kg−1 at the N2 level, while its concentration at the N3 level was practically the same as at the N2 level (Figure 8A). SEM analysis showed that N fertilisation directly increased Cu concentration, while the dilution effect due to biomass increase was negligible, causing a strong positive effect (Figure 8B).
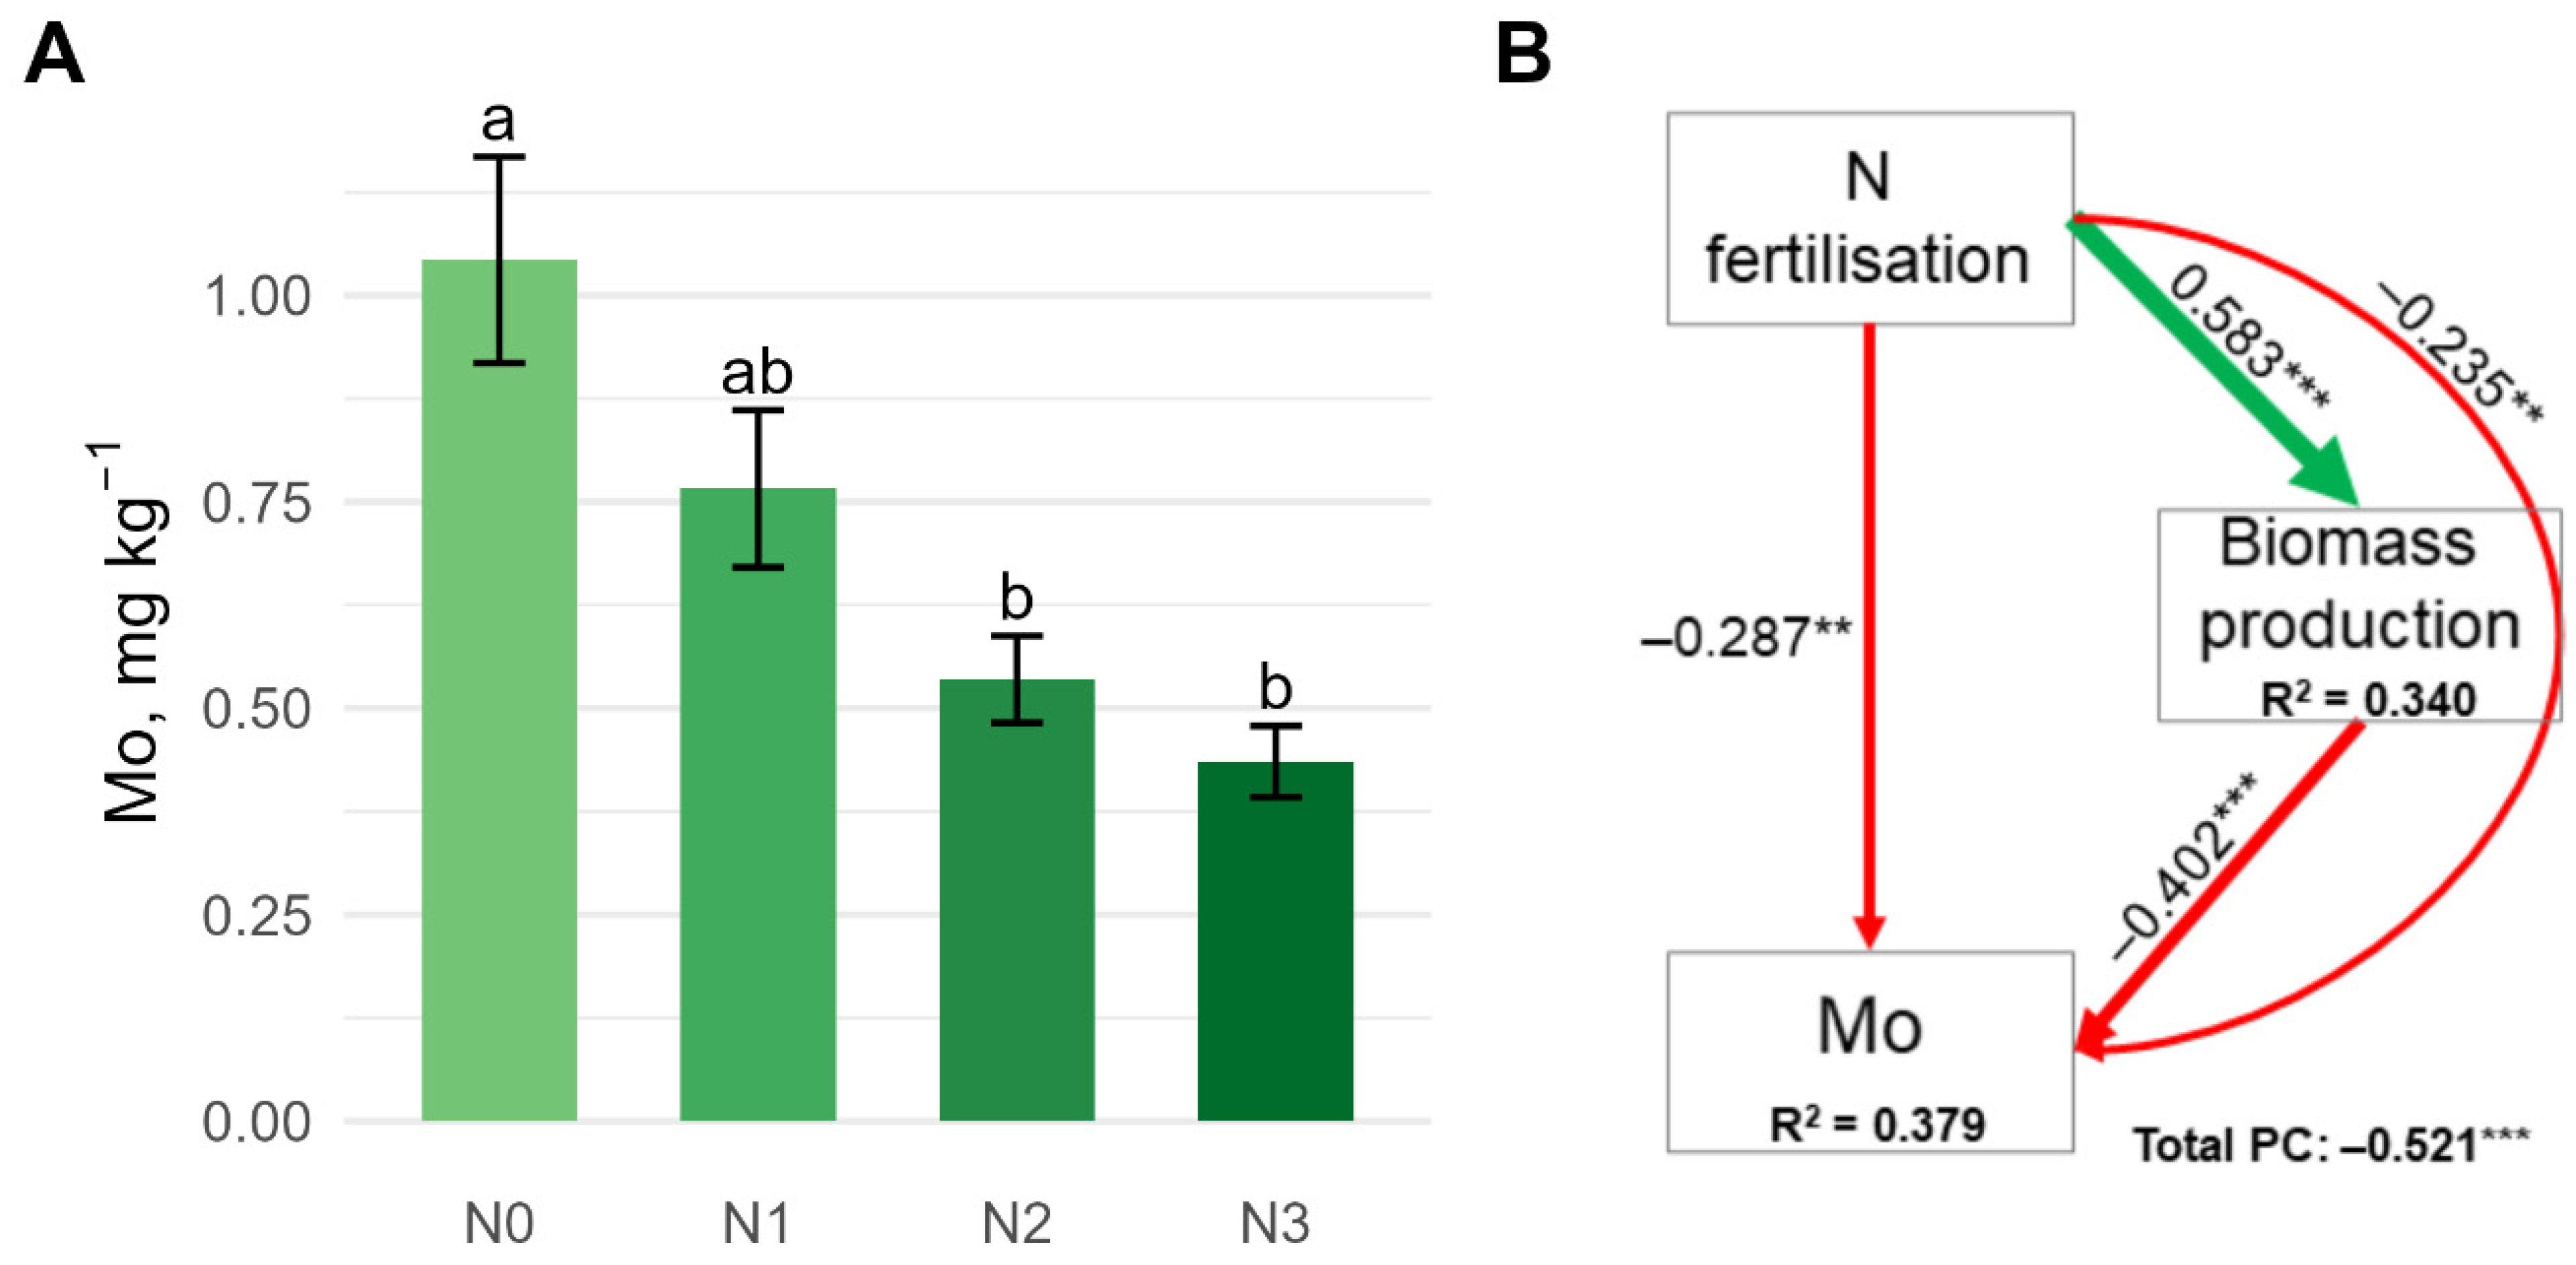
Mo concentration consistently decreased with increasing N treatment levels from 1.043 ± 0.125 mg Mo kg−1 (DM) at N0 to 0.435 ± 0.043 mg Mo kg−1 at N3. However, there was no significant difference between the N2 and N3 levels (Figure 9A). The decrease was caused both directly by the N fertiliser and indirectly by the dilution effect, so the path coefficient of the total effect was strongly negative (Figure 9B).
Although the F-test of ANOVA showed a significant main effect of N treatment on the S and Al concentrations, the Tukey multiple comparison test, which is more stringent [65], did not reveal any specific significant differences between the different N treatment levels, so the S and Al concentrations are presented among the elements not significantly affected by the treatments. The concentrations of many analysed elements did not change significantly under the influence of N fertilisation. For some elements, however, various trends could be observed (Table 2).
The K concentration was very similar in the N0 and N1 treatments but decreased at higher N doses. The concentrations of Ca and Zn increased right up to the N3 level by a total of 20.5 and 16.0%, respectively. Mg and Ba also increased up to the N2 level by 16.0 and 16.7%, respectively, but showed a decrease at the N3 level. The trends in Al, Fe and S concentrations were similar, with the highest concentration in the N0 control, which decreased markedly by 41.3, 27.4 and 17.8%, respectively, at the N1 level, but showed a slight increasing trend in the N2 and N3 treatments. The B and Ni concentrations of the aboveground grass tissue consistently decreased with increasing N doses. Sr showed only a minimal change, but its concentration was slightly higher at the N2 and N3 levels compared to values at the N0 and N1 levels (Table 2).

3.3. Element Ratios

The K:(Ca + Mg) ratio, also known as the Tetany index, and the K:(Na + Mg) ratio gradually but not significantly decreased at the increasing N treatment levels. The Ca:P and N:S ratios, on the other hand, gradually increased, and in both cases were significantly lower at the N0 treatment level than at the higher N treatment levels. The K:Na ratio decreased drastically in the N1 and N2 treatments compared to the N0 treatment but increased slightly at the N3 level (Table 3).

4. Discussion

4.1. Biomass Production

N fertilisation is one of the most direct ways to increase biomass production, as N is a fundamental building block of proteins, necessary for the proper functioning of almost all metabolic functions and a key element of chlorophyll synthesis. N is also the most common limiting factor in crop production [66,67]. Cherney et al. [68] reported a 3.2-fold increase in the biomass yield of Phalaris arundinaceae as a result of treatment with 224 kg N ha−1, while Dindová et al. [69] found that fertiliser treatment doubled the grass forage yield, though the biomass decreased between the 150 and 200 kg N ha−1 treatment levels. Whitehead [13] stated that above a treatment level of 250–400 kg N ha−1, there was generally no increasing effect on grass herbage biomass. Consequently, the 3.44-fold biomass increase achieved in the N2 (200 kg N ha−1 year−1) treatment in the present experiment is sufficiently robust, while the slight decrease in biomass in the N3 treatment level compared to the N2 corresponds to previous experience (Figure 1).

4.2. Plant Physiological and Animal Feeding Significance of Changes in Element Content

4.2.1. Significantly Changing Elements

Nitrogen and Nitrate
N fertilisation is generally expected to increase the plant N concentration. A recent meta-analysis found that plant N content increased by an average of 18.6% following N fertilisation [70]. However, grassland species are extremely sensitive to N, as an increased supply of N directly increases crude protein content [20]. The aboveground N concentration of the grass species Sporobolus kentrophyllus increased by 86% following N fertilisation [71]. However, another study found a stagnation in the N concentration based on crude protein content up to 150 kg N ha−1 treatment level, only increasing after biomass growth ceased, between 150 and 200 kg N ha−1, indicating a substantial dilution effect [69]. The N concentration is also affected by the water supply. In well-watered areas, N causes faster biomass growth, leading to a dilution of the N concentration, while under drier conditions, N application increases the plant N concentration more markedly [41]. In the present experiment, a strong increase was observed as the N concentration increased more than 2-fold in the N3 treatment level compared to the control, and the concentration increase was only slightly inhibited by the increase in biomass.
The increased NO3–N content in the plant tissue clearly proves that a significant part of the N was taken up by the plant in NO3 form, as most of the N taken up as NH4+ is assimilated into amino acids and amides in the root [12]. NO3 stimulates the elongation of lateral roots, helping the plant to explore soil nutrient reserves more efficiently [67], and maintain the charge balance within the cell. It also regulates the osmotic pressure of the plant [72]. When NO3 uptake exceeds the reduction capacity of the plant, unused NO3 accumulates in tissues, serving as a reserve for later assimilation [73]. NO3, unlike NH4+, is rarely toxic to plants, as the plant can store large quantities without suffering physiological damage, although in the case of commercial crops such as sugar beet and potatoes, it may cause quality deterioration [66].
The N content of the hay or grass serves as the basis for determining the crude protein content, which affects growth, weight gain and overall health, as proteins are the main components of muscles, organs, enzymes and hormones [33]. In the rumen of animals, NO3 is converted to nitrite. In the case of elevated NO3 intake, acute poisoning may occur, associated with methaemoglobinaemia, characterised by very limited oxygen-carrying capacity. Clinical symptoms are progressive dyspnea, cyanosis, tachycardia, ataxia, convulsions, and finally the death of grazing animals. Symptoms of prolonged exposure to NO3 and nitrite include reduced feed intake, decreased milk production in dairy animals, weight loss, lowered vitamin A and E levels, impaired fertility and abortion [74,75,76,77,78,79]. The metabolic fate of nitrite includes the direct or indirect generation of a number of reactive compounds, which are responsible for cell oxidative damage (oxidative stress) and cytotoxicity [80]. Signs of toxicity may already appear when green fodder, silage, hay or grazed grass contains more than 700 mg NO3–N kg−1 (DM) [33,81], while concentrations above 1500 mg NO3–N kg−1 significantly increase the risk of chronic or acute NO3 toxicosis, especially in pregnant animals [82]. According to some sources, 2200 mg NO3–N kg−1 is the lethal dose for ruminants [33], while other sources consider this to be 6000–8000 mg NO3–N kg−1 (DM) [83]. In the present experiment, excessive N fertilisation (the N2 and N3 treatments) led to NO3 accumulation in the sward, so that the NO3–N concentration represented an increased risk but remained below the dangerous level (Figure 4).
Phosphorus
As nitrogen application rates increase, the corresponding optimal phosphorus requirements also rise to maintain nutritional balance [84]. So N fertilisation may cause a decrease in plant P concentration [21,68] due to the dilution effect, especially if the soil does not have elevated P reserves [67]. This was supported by the present results, but N fertilisation was also found to have a direct negative effect (Figure 5), which may be caused by the fact that P is primarily taken up by the plant in the form of phosphate anion, and a high concentration of NO3 anion in the soil solution tends to suppress the uptake of other anions, such as phosphate [13]. Another influencing factor may be that dicots generally have higher P concentrations than monocot graminoids [85], and in the present experiment, dicots had a higher cover at the N0 treatment level, while monocots dominated in the N1-N3 treatments [86]. However, other studies report the opposite result, with an increase in plant P concentration due to N treatment. This may have been due to an increase in microbial activity, which resulted in increased phosphatase enzyme activity on the root surface, thereby increasing the availability and plant uptake of organic P in the soil [20,87].
In animal nutrition, P is one of the most important macronutrients, determining the energy transfer between cells, the development of the skeleton and teeth (in combination with Ca), the growth and metabolism of microorganisms in the rumen, the reproductive biology and the milk production [78,88]. P may also be a limiting factor in pasture-based animal husbandry [89]. In the case of plant-based feeds, grasses and hays, the determination of the optimal P concentration depends on the species, age and physiological state of the animal (e.g., pregnancy, lactation), but in general it ranges between 1600 and 3800 mg kg−1 (DM) for sheep and cattle [90]. Thus, in the present study, the decrease from 2876 mg P kg−1 at the N0 level to slightly below 2000 mg P kg−1 (Figure 5) draws attention to the importance of P replenishment in the case of N fertilisation.
Sodium
Several studies have shown that N fertilisation significantly increases Na levels in plants. A study of 16 sites found that the application of 300 kg N ha−1 year−1 resulted on average in a doubling of the Na concentration in sward compared to the control [91]. The primary reason for this is that when absorbing N in the form of NO3, the plant also increases the uptake of positively charged cations, such as Na+, in order to maintain the cation-anion balance, possibly leading to a multiple increase in Na concentration [12]. In species that are more prone to Na accumulation (e.g., Lolium perenne, Dactylis glomerata, Trifolium repens), N fertilisation almost always increases Na concentration [13]. In soils poorly supplied with potassium (K), Na can partially replace K in non-specific functions such as maintaining cell turgor pressure. N fertiliser may accelerate this incorporation process, especially in grass species [92]. The particularly large increase in Na concentration in the present work (Figure 6) may have been due to simultaneous Na-increasing effects, which were sufficient to compensate for the increased uptake of Na due to biomass growth, so that there was no dilution effect.
Na is essential for maintaining osmotic pressure, regulating the acid-base balance, controlling the water balance, and for nerve and muscle function [93]. If the Na concentration in the pasture is inadequate, animals will experience loss of appetite, weight loss, a decrease in milk yield, and fertility problems [33,78]. For most animal species, Na concentrations between 700 and 1200 mg kg−1 (DM) in the feed are satisfactory [94], while other sources consider a concentration of at least 1500 mg kg−1 desirable [95]. The maximum tolerable level is above 10,000 mg kg−1 [88,90]. N fertilisation therefore proved to be particularly beneficial in terms of the Na concentration of the sward, as the 109 mg Na kg−1 measured in the N0 control was far below the optimal level (Figure 6).
Manganese
The Mn-increasing effect of N treatment has been reported in previous studies. According to a meta-analysis, N loading increased the Mn concentration in herbaceous plants by an average of 46% [4]. In another long-term field experiment conducted on a semi-desert steppe, the Mn content of the plants increased by between 122% and 472% after N application, depending on the species [6]. A positive correlation was also observed between the increase in dry matter mass and Mn concentration due to N [96,97,98]. This was supported by the results of the present experiment (Figure 7), indicating that with increasing N supply, the plant not only produces higher biomass, but also incorporates proportionally more Mn into its tissues. This also indicates that there was no dilution effect in the case of Mn. Mn and Fe compete for root transport systems due to their similar chemical properties, which may lead to Fe deficiency [3,6]. In the present study, the Mn concentration remained below 100 mg kg−1 (DM), which is much lower than the concentration of 400–1000 mg Mn kg−1 that is toxic to plants [99].
Mn is an essential microelement for animals, playing a key role in metabolic processes, reproductive biology, the protection of cells against oxidative stress, protein synthesis and the structure of bones and hooves [33,75,100,101]. The optimal Mn content of hay for cattle and sheep is around 40 mg kg−1 (DM) [90], but only an extremely high concentration of 500–1000 mg Mn kg−1 will actually inhibit the utilisation of Mg, Fe or Cu [93,95]. Thus, the 67–95 mg Mn kg−1 concentration measured in the present study (Figure 7A) is fairly high, but not in the harmful or toxic range.
Copper
A comprehensive study found that N addition increased the Cu concentration in terrestrial plants by an average of 5.01% [4]. This may involve several different mechanisms. As a result of plant NO3 uptake, cation uptake also increases to maintain the ion balance. Furthermore, an increased N supply causes plant roots to release more chelating compounds, which help to solubilise the soil Cu content, making it more available to plants [19]. N can also promote the transport of Cu from the root to the shoot, thus improving the root:shoot translocation ratio by 27–38% [102]. Mowing can also increase the Cu concentration of the sward compared to an unmowed sward [3]. However, a decrease in Cu concentration was also observed after N fertilisation, which was explained by the dilution effect, or by the increased mass of the stem, which has lower Cu content, relative to the mass of the leaf, thus further reducing the Cu content of the aboveground biomass of Phalaris arundinacea [68]. In the present study, the dilution effect was negligible, and the mechanisms by which N fertilisation increases Cu concentration prevailed (Figure 8).
In the animal body, Cu is essential for the formation of haemoglobin, as it helps in the absorption and mobilisation of Fe from tissues, and is a component of several vital enzymes that control energy metabolism, cell division, and the neutralisation of free radicals [101]. It is also involved in the formation of cross-links between collagen fibres, which is necessary for the strength of bones and the elasticity of blood vessels [75]. Cu deficiency is quite common in grazing animals worldwide [103]. A concentration of around 10 mg Cu kg−1 (DM) for cattle [103] and 3–5 mg kg−1 for sheep [90] is generally recommended in the feed. Thus, the concentration of approximately 3–5 mg Cu kg−1 measured in the present experiment is relatively low, so the increase in Cu concentration caused by N treatment is favourable (Figure 8).
Molybdenum
Studies have reported significantly reduced Mo concentrations in plants after N fertilisation [91,96]. The strong biomass increase caused by N can itself cause a decrease in Mo concentration if the plant mass grows faster than the root system can extract Mo from the soil [21]. Mo is taken up by the plants in the form of molybdate anion, which could be suppressed by the uptake of NO3. The effect is further enhanced if P uptake also decreases, because there is a synergistic relationship between Mo and P. P can form complex phosphomolybdate anions with Mo, which are more easily taken up by the plant, but lower P concentrations weaken this supporting effect and indirectly reduce Mo uptake [21]. The results of the present experiment also confirmed the strong dilution effect of N fertilisation on Mo concentration (Figure 9).
Mo concentration is of great importance in animal nutrition, primarily due to its strong interaction with other mineral elements, especially Cu and S. Under natural conditions, Mo deficiency is almost never observed in livestock, as the Mo content of grasslands usually covers the minimum requirements [33]. However, in the case of excessive Mo concentration, Mo has the ability to bioaccumulate in the kidneys [104]. The most important nutritional property of Mo is that it drastically inhibits Cu absorption in the presence of sulphur. In the rumen, microbes convert sulphur compounds into sulphide, which reacts with Mo to form thiomolybdate complexes. These complexes bind the Cu content of the feed, forming insoluble Cu thiomolybdate, which is not absorbed but is excreted [100]. For this reason, if the Mo concentration in the feed is above 2.0 mg kg−1 (DM), the Cu requirement increases significantly, while above 20 mg Mo kg−1, the animals may develop severe Cu deficiency symptoms (e.g., diarrhoea, bone problems) even on a sward with a moderate Cu supply [101]. For cattle, the maximum tolerable level is generally between 5 and 10 mg kg−1 (DM) [88]. In the present study, the concentration of 1 mg Mo kg−1 measured at the N0 treatment level is therefore sufficiently low, and this was significantly reduced by the N treatments (Figure 9).

4.2.2. Non-Significantly Changing Elements

Potassium
N fertilisation can have both synergistic and antagonistic effects on the K concentration of grasslands [13,105]. According to a global meta-analysis, N loading significantly increased grassland K concentrations by an average of 8.61% [4]. Thus, if soil K reserves are abundant, N fertilisation may initially increase the K content of the forage (Table 2). Another comprehensive analysis, however, did not find a significant global effect, but emphasised the importance of site-specific factors [70]. When plant biomass increases rapidly, K concentration may tend to decrease in the tissues [69], especially when soil K reserves are limited [8]. Dicots generally have higher K content than monocots, so the effect of N fertilisation on monocots may also lead to a decrease in K content [106].
K regulates the osmotic pressure in body fluids, together with Na and chloride, and maintains the acid-base balance and water balance. It plays a fundamental role in nerve and muscle function, impulse transmission and carbohydrate metabolism, and is the activator of many enzymes [78]. In the case of pasture, excessively high concentrations of K may cause metabolic disorders in ruminants. Young beef cattle and heifers need pasture or hay with a concentration of about 6000 mg kg−1 (DM), and dairy cows 12,000–15,000 mg K kg−1, but this should not exceed 25,000 mg K kg−1 [33]. The N treatment was therefore beneficial, as the relatively high concentration of nearly 19,000 mg K kg−1 was non-significantly reduced (Table 2).
Calcium
Although K and Ca tend to behave similarly in terms of plant uptake, the concentration of Ca increased in contrast to K (Table 2). This was partly because the fertiliser contained Ca. Furthermore, improving the N supply increases the CEC of plant roots, which directly affects the rate of cation uptake, so roots with a higher CEC take up doubly charged cations such as Ca2+ in preference to singly charged cations such as K+ [13].
In the animal body, 98–99% of calcium is found in bones and teeth, and Ca also contributes to the transmission of nerve impulses, muscle contraction, blood clotting, and the activation and stabilisation of many enzymes [88]. Depending on the species, age and production status of the animal, the optimal Ca concentration is between 3000 and 5000 mg kg−1 (DM) [94], so the Ca content of around 4000–5000 mg kg−1 in the grassland tested in the present experiment was satisfactory (Table 2).
Sulphur
N fertilisation fundamentally stimulates the uptake and concentration of sulphur (S) in plants, as the two elements work closely together in the construction of plant proteins [13]. However, in the case of an abundant N supply, the greatly increased biomass generates a strong demand for sulphur, which the plant cannot necessarily meet, so the S concentration may decrease [107,108,109]. The present study supported the presence of both mechanisms, as the N1 treatment greatly increased the biomass (Figure 1) with a parallel decrease in S concentration (Table 2), while at the N2 treatment level, although the biomass continued to increase to a lesser extent, the S concentration also increased.
S is particularly important for ruminants, as it participates in protein synthesis and in the growth and reproduction of rumen microbes, thus influencing the digestibility of grass. S is also essential for the synthesis of vitamins B1 and B7, and for wool production in sheep [78]. For cattle, the minimum requirement is 1500 mg S kg−1 (DM), with a safely tolerated upper limit of about 4000 mg S kg−1 [110], but a high sulphur concentration of 2500 mg kg−1 in the feed may significantly reduce the uptake and utilisation of Cu in the animal body, especially in ruminants [88]. The S concentrations of 1583–1925 mg kg−1 in the present experiment were therefore adequate (Table 2).
Magnesium
In the present study, the Mg concentration showed an increasing trend with N treatment (Table 2), which could be due to the Mg content of the N fertiliser. A meta-analysis also found that N loading increased the Mg concentration in grasslands [4]. However, moderate N application may reduce the Mg concentration in forage grass, because N may increase the proportion of Mg-poor stems compared to leaves [68].
Mg plays a role in nerve and muscle function and bone formation, and serves as an activator of hundreds of enzymes [33]. Low levels of Mg, also known as hypomagnesaemia, in combination with high K content, cause one of the most dangerous metabolic disorders in ruminants, grass tetany [111]. A concentration of at least 2000 mg Mg kg−1 (DM) in the grass is considered a safe level to avoid tetany [112], so the concentration of approximately 1500–1700 mg Mg kg−1 measured in the present experiment (Table 2) is somewhat low, and although it showed an increasing trend in the N1 and N2 treatments, it draws attention to the importance of examining the tetany index.
Iron
Changes in Fe concentration were similar to those in S concentration: in the N1 treatment, it decreased, probably due to the dilution effect, then increased slightly in parallel with higher N doses (Table 2). The dilution of Fe concentration after N treatment has been previously reported [17], but the increase may have been triggered by NO3 uptake, synergistically promoting Fe uptake to maintain ion balance [3].
Fe performs basic physiological functions, such as oxygen transport and storage, and promotes enzyme activity [101]. Beef cattle and cows require about 30–50 mg Fe kg−1, whereas young calves need 120 mg Fe kg−1 (DM) in their fodder [103]. In feeding practice, too much Fe is a more common problem than too little Fe, which, at a concentration of 250–500 mg Fe kg−1, may inhibit the absorption of other important elements, primarily Cu, as well as Zn and Mn [88]. Thus, the 85–117 mg Fe kg−1 concentration measured in the grass in the present experiment is optimal, and N treatment had no negative influence (Table 2).
Aluminium
The aluminium (Al) concentration, like that of S and Fe, decreased in the N1 treatment, presumably due to the dilution effect, and then increased slightly in parallel with the higher N doses (Table 2). Al is primarily important from a nutritional point of view due to its toxic effect and strong negative interaction with other minerals (Mg, P, Ca, Zn, Fe) [113]. The normal level of Al in the feed ration is below 300 mg kg−1 (DM). Chronic poisoning occurs between 300 and 1000 mg kg−1, while acute poisoning may occur above 1000 mg kg−1 [94,113]. In the present experiment, the Al concentration was below 87 mg kg−1, and the N treatments resulted in a decreasing trend in Al compared to the control (Table 2).
Zinc
Previous studies have reported a significant increase in Zn concentration in swards given N treatment [4,91]. However, dilution is also characteristic of the Zn concentration [8,96], which may moderate the increase in Zn, as was observed in the present experiment (Table 2). Zn is a component or activator of more than 300 enzymes and plays a role in protein synthesis, carbohydrate metabolism, immune function, and reproductive biology [39]. The optimal Zn concentration is around 30 mg kg−1 (DM) [88], so the 17–20 mg Zn kg−1 measured in the experiment is considered low, but showed an increasing trend after N treatment (Table 2).
Strontium
Strontium (Sr) is not specifically taken up by plant roots, but mainly by mass flow and diffusion [16]. Its uptake is affected by the cation-anion balance and by ion antagonism in the case of abundant K or Mg supplies [12]. Sr is a potentially essential ultramicroelement in animal nutrition [114], with a maximum tolerable level of 2000 mg kg−1 (DM) [88,93]. An unfavourable Ca:Sr ratio due to the chemical similarity of Sr to Ca may cause problems, especially in pastures on saline soils, if the calcium content is too low compared to Sr [115], but this phenomenon was not typical of the present experiment. The Sr concentration changed only negligibly as a result of N treatment (Table 2).
Boron
The consistent decrease observed in B concentration (Table 2) may have been due to the dilution effect, the antagonistic effect of the Ca content of the N fertiliser [19], and the typically lower B concentration of monocots compared to dicots [12]. The exact role of B in the animal body is still a subject of research [116,117]. According to Fisher [101], the recommended amount for ruminants is approximately 5 mg B kg−1 (DM) in the feed, which is close to the value of 3.6–4.2 mg B kg−1 measured in the present study (Table 2).
Barium
Barium (Ba) can theoretically interact antagonistically with Ca, Mg and S [16]. In the present experiment, an inconsistent increase in Ba content was measured even in parallel with increasing Ca and Mg concentrations (Table 2). Ba is classified as a potentially essential ultramicroelement in animal nutrition [114], but in animal feeds, concentrations above 40 mg Ba kg−1 (DM) pose a health risk [39]. However, this is far higher than the 3.6–4.2 mg Ba kg−1 measured in the present study (Table 2).
Nickel
The slight decrease in Ni content (Table 2) could have been caused by the dilution effect [96] or by the antagonistic relationship of Ni with Cu and Zn [118], which increased the concentration of these elements in the sward (Figure 8, Table 2). From the point of view of animal nutrition, Ni is an essential ultramicroelement that has been shown to play an important role in certain enzyme processes and in the rumen function of ruminants, because it enhances the urease activity of ruminant bacteria, thus promoting the utilisation of N compounds, such as urea [33]. Nickel deficiency has not been observed under natural conditions, as the Ni content of 0.5–3.5 mg kg−1 in sward usually more than covers the needs [33,119]. The upper safe limit for nickel in beef cattle diets is 50 mg kg−1 (DM) [120]. So the Ni concentration of 0.67–0.82 mg kg−1 observed in the present study was completely acceptable (Table 2).

4.3. Significance of Changes in Element Ratios for Grazing or Foraged Animals

In addition to the absolute concentration of mineral elements in the grasslands and hay used as feed, their relative proportions are crucial for the health, development and productivity of the animals. One of the most important of these ratios is the tetany index, also known as the K:(Ca + Mg) ratio. High K concentrations inhibit the absorption of Mg in the gut, which can lead to hypomagnesaemia, also known as grass tetany. Low Ca levels amplify the effects of Mg deficiency [111]. If the ratio (expressed in milliequivalents) exceeds 2.2, the risk of pasture or hay causing tetany increases dramatically [25,95]. Both intensive K fertilisation and the acidifying effect of N fertilisation may increase this ratio [33]. In the present experiment, this index decreased favourably from 1.5 to 1.1 (Table 3), because the K concentration decreased significantly at the N2 and N3 treatment levels, while the Ca concentration increased consistently, and the Mg concentration mostly showed an increasing trend in parallel with the increasing N doses (Table 2), due to the Ca and Mg content of the calcium ammonium nitrate fertiliser used.
The K:(Na + Mg) index takes into account the fact that the presence of Na in the rumen is critical for Mg absorption. Low Na levels inhibit Mg absorption in the presence of high K levels [32]. A value above 4.5, but especially above 6.0, indicates severe Na deficiency and impaired Mg absorption, which, without proper Mg supplementation, can cause tetany [94]. The relatively high, 3.93 K:(Na + Mg) index of the studied sward at the N0 treatment level was reduced by N fertilisation (Table 3), which resulted in increasing Na concentration and decreasing K concentration (Table 2).
Ca and P mutually influence each other’s utilisation. The vast majority of Ca and P is found in fixed ratios in bones and teeth, so the Ca:P ratio is essential for skeletal development [88]. For most livestock, the ideal ratio is between 1:1 and 2:1 [33], while for cattle, a wider optimal range of 1:1 to 7:1 has been identified [88]. This ratio is often higher in grass or hay, and may even reach a value of 14:1 [121]. The Ca:P ratio is generally reduced by N treatment, as it reduces the cover of leguminous plants, which have much higher Ca content than monocots. In addition, N fertilisers generally acidify the soil, resulting in reduced Ca content [112]. In the present experiment, where the N fertiliser contained Ca-, the plant Ca concentration increased with the N treatment level, while the P concentration decreased, especially between the N0 and N1 levels, so that the Ca:P ratio increased from 1.49 in N0 to 2.73 in N3 treatment (Table 3).
An optimal N:S ratio is essential for the production of S-containing amino acids such as cysteine and methionine and for protein synthesis. In ruminants, the ideal ratio is 10:1 for dairy cows, 15:1 for beef cattle, and 5:1–7:1 for sheep, due to the higher demand for S-containing amino acids for wool production [33]. An inadequate S supply limits both the digestibility of the feed, especially cellulose, and the N utilisation [78,110,122]. The N:S ratio was improved by N fertilisation, from only 5.24 in the N0 treatment to over 11 in the N2 and N3 treatments (Table 3), because the plant N concentration increased (Figure 3), while the S concentration showed a decreasing trend (Table 2).
The K:Na ratio, also known as the bloat index, is recommended to indicate the risk of bloat in pastures. Bloat has been associated with low Na and high K content in the rumen fluid. The optimal K:Na ratio in forages for bloat control is 10 or less, while above 20, the risk increases [34,123]. In the present experiment, the 221 K:Na ratio at the N0 level (Table 3) due to the relatively low Na (Figure 6) and high K (Table 2) concentrations was therefore unfavourably high. The ratio was reduced to values between 35.7 and 67.9 by the N treatments, but these are still above the optimal range, so NaCl supplementation is essential to maintain the osmotic balance [78,95].

5. Conclusions

The results showed that the sward absorbed a significant part of the N content of the N fertiliser in the form of NO3, which had a fundamental influence on the other elements as well. The concentration of P and Mo, which are taken up by plants in anion form, decreased significantly, while that of Na, Mn and Cu, taken up in cation form increased also significantly. The dilution effect was also more pronounced in the case of anions, where uptake was limited, while in the case of cations, it did not inhibit uptake or only to a negligible extent.
The N2 level resulted in the highest dry matter yield, while at the N3 level, the yield decreased slightly, making this treatment no longer economical under the experimental conditions. The N2 treatment also had the highest concentrations of Cu and Mn, which improves the mineral value of the feed. However, in terms of the health of the grazed animals and the minimisation of risks, the optimal treatment under the experimental conditions of this study was N1 (100 kg N ha−1 year−1), which caused a favourable 2.74-fold increase in biomass compared to the control. At this level, the NO3–N concentration of 308 mg kg−1 remained far below the critical limit of 700 mg kg−1, while the 1600–1700 mg NO3–N kg−1 recorded at the N2 and N3 levels exceeded the increased risk level of 1500 mg kg−1, which could lead to chronic or acute poisoning. This level also ensured a more than 8-fold increase in Na concentration, which is particularly favourable for animal health. Although the Na content of the grass greatly increased, the K:Na ratio, or bloat index, exceeded the optimal value of below 20 even in the fertilised plots, which is why table salt (NaCl) supplementation is recommended for the animals. The reduced P concentration due to N fertilisation may necessitate P supplementation to avoid skeletal and metabolic disorders in the animals. N favourably increased the Cu concentration, but 3–5 mg Cu kg−1 is still considered low compared to the 10 mg Cu kg−1 recommended for cattle. N treatment significantly reduced Mo levels, which is beneficial because too much Mo inhibits Cu absorption in ruminants. The increase in Ca concentration, contrary to the results of many other experiments, may have been due to the calcium ammonium nitrate fertiliser used, which, on the one hand, favourably reduced the tetany index, but on the other hand draws attention to the importance of the quality and composition of N fertiliser.
The results, based on a 10-year data series from a long-term field experiment, highlight the fact that, in addition to increasing biomass, N fertiliser significantly influences plant element content. Changes in the concentration of elements in grasslands due to nitrogen fertilisation have fundamental implications for sustainability that affect feed security. A potential reduction in element concentrations due to biomass growth could lead to hidden starvation in grazing animals and, indirectly, in humans, if the feed does not provide the necessary trace elements. Changes in sward element ratios can also have significant consequences for animal health. So, when N fertiliser is applied to grasslands, attention should be paid to the concentration and ratio of other elements from the perspective of plant physiology and grazing or animal feeding. Further research is needed into the possibilities, conditions and impacts of enhancing grassland biomass in order to implement it safely and sustainably.

Author Contributions

Conceptualization: P.R. and A.B.; formal analysis: P.R.; investigation: P.C.; writing—original draft preparation: P.R., A.B., M.R., A.S. and N.U.; writing—review and editing: P.R., A.B. and M.R.; visualisation: P.R. All authors have read and agreed to the published version of the manuscript.

Funding

This research received no external funding.

Data Availability Statement

Data supporting the conclusions of this article will be made available by the authors on request.

Acknowledgments

The authors are grateful to the late Imre Kádár, who designed and set up the long-term field experiment that provided data for the study.

Conflicts of Interest

The authors declare no conflicts of interest.

Abbreviations

The following abbreviations are used in this manuscript:
SEMStructural equation modelling
DMDry mass
CECCation exchange capacity

References

  1. Bindraban, P.S.; Dimkpa, C.; Nagarajan, L.; Roy, A.; Rabbinge, R. Revisiting Fertilisers and Fertilisation Strategies for Improved Nutrient Uptake by Plants. Biol. Fertil. Soils 2015, 51, 897–911. [Google Scholar] [CrossRef] [Scilit]
  2. Cao, W.; Sun, H.; Shao, C.; Wang, Y.; Zhu, J.; Long, H.; Geng, X.; Zhang, Y. Progress in the Study of Plant Nitrogen and Potassium Nutrition and Their Interaction Mechanisms. Horticulturae 2025, 11, 930. [Google Scholar] [CrossRef] [Scilit]
  3. Liu, H.; Wang, R.; Lü, X.-T.; Cai, J.; Feng, X.; Yang, G.; Li, H.; Zhang, Y.; Han, X.; Jiang, Y. Effects of Nitrogen Addition on Plant-Soil Micronutrients Vary with Nitrogen Form and Mowing Management in a Meadow Steppe. Environ. Pollut. 2021, 289, 117969. [Google Scholar] [CrossRef] [Scilit]
  4. Su, Y.; Dong, K.; Wang, C.; Liu, X. A Meta-Analysis of the Impacts of Nitrogen Addition on Plant Multiple-Element Contents in Natural Ecosystems. Plant Ecol. 2025, 226, 111–121. [Google Scholar] [CrossRef] [Scilit]
  5. Follett, R.F. Transformation and Transport Processes of Nitrogen in Agricultural Systems. In Nitrogen in the Environment; Elsevier: Amsterdam, The Netherlands, 2008; pp. 19–50. [Google Scholar]
  6. Cai, J.; Weiner, J.; Wang, R.; Luo, W.; Zhang, Y.; Liu, H.; Xu, Z.; Li, H.; Zhang, Y.; Jiang, Y. Effects of Nitrogen and Water Addition on Trace Element Stoichiometry in Five Grassland Species. J. Plant Res. 2017, 130, 659–668. [Google Scholar] [CrossRef] [Scilit]
  7. Kádár, I.; Ragályi, P.; Murányi, A.; Radimszky, L.; Gajdó, A. Effect of Gérce Alginit on the Fertility of an Acid Sandy Soil. Agrokémia Talajt. 2015, 64, 437–452. [Google Scholar] [CrossRef] [Scilit]
  8. Kang, N.-Q.; Hu, Y.-Y.; Zhang, Z.-W.; Lü, X.-T. Changes of Mineral Nutrition (K, Ca, and Mg) in Soil and Plants Following Historical Nitrogen Inputs in a Temperate Steppe: The Implications for Grass Tetany. Plant Soil 2023, 491, 57–68. [Google Scholar] [CrossRef] [Scilit]
  9. Mo, Q.; Wang, W.; Lambers, H.; Chen, Y.; Yu, S.; Wu, C.; Fan, Y.; Zhou, Q.; Li, Z.; Wang, F. Response of Foliar Mineral Nutrients to Long-term Nitrogen and Phosphorus Addition in a Tropical Forest. Funct. Ecol. 2021, 35, 2329–2341. [Google Scholar] [CrossRef] [Scilit]
  10. Recous, S.; Machet, J.M.; Mary, B. The Fate of labelled15N Urea and Ammonium Nitrate Applied to a Winter Wheat Crop: II. Plant Uptake and N Efficiency. Plant Soil 1988, 112, 215–224. [Google Scholar] [CrossRef] [Scilit]
  11. Recous, S.; Machet, J.M.; Mary, B. The Partitioning of Fertilizer-N between Soil and Crop: Comparison of Ammonium and Nitrate Applications. Plant Soil 1992, 144, 101–111. [Google Scholar] [CrossRef] [Scilit]
  12. Mengel, K.; Kirkby, E.A.; Kosegarten, H.; Appel, T. (Eds.) Principles of Plant Nutrition; Springer: Dordrecht, The Netherlands, 2001. [Google Scholar]
  13. Whitehead, D.C. (Ed.) Nutrient Elements in Grassland: Soil-Plant-Animal Relationships, 1st ed.; CABI Publishing: Oxfordshire, UK, 2000. [Google Scholar]
  14. Rietra, R.P.J.J.; Heinen, M.; Dimkpa, C.O.; Bindraban, P.S. Effects of Nutrient Antagonism and Synergism on Yield and Fertilizer Use Efficiency. Commun. Soil Sci. Plant Anal. 2017, 48, 1895–1920. [Google Scholar] [CrossRef] [Scilit]
  15. Xie, K.; Cakmak, I.; Wang, S.; Zhang, F.; Guo, S. Synergistic and Antagonistic Interactions between Potassium and Magnesium in Higher Plants. Crop J. 2021, 9, 249–256. [Google Scholar] [CrossRef] [Scilit]
  16. Kabata-Pendias, A. Trace Elements in Soils and Plants, 4th ed.; CRC Press: Boca Raton, FL, USA, 2010. [Google Scholar]
  17. Jarrell, W.M.; Beverly, R.B. The Dilution Effect in Plant Nutrition Studies. In Advances in Agronomy; Elsevier: Amsterdam, The Netherlands, 1981; Volume 34, pp. 197–224. [Google Scholar]
  18. Kovács, A.B.; Kremper, R.; Jakab, A.; Szabó, A. Organic and Mineral Fertilizer Effects on the Yield and Mineral Contents of Carrot (Daucus Carota). Int. J. Hortic. Sci. 2012, 18, 69–74. [Google Scholar] [CrossRef] [Scilit]
  19. Micronutrient Deficiencies in Global Crop Production; Alloway, B.J., Ed.; Springer: Dordrecht, The Netherlands, 2008. [Google Scholar]
  20. Chen, X.; Jiao, T.; Nie, Z.; Zhang, D.; Wang, J.; Qi, J. Effects of Different Fertilizers on Nutrient Quality and Mineral Elements in Different Economic Forage Groups in Qilian Mountain Alpine Meadows. PeerJ 2022, 10, e14223. [Google Scholar] [CrossRef] [Scilit]
  21. Li, Y.; Wang, R.; Zhang, Y.; Gu, B.; Liu, H.; Yang, L.; Jiang, Y. Plant Molybdenum Uptake as Mediated by Synergism with Phosphorus but Antagonism with Sulfur in a Nitrogen-Fertilized and Mown Meadow. J. Soil Sci. Plant Nutr. 2023, 23, 5438–5453. [Google Scholar] [CrossRef] [Scilit]
  22. Ma, D.; Teng, W.; Mo, Y.-T.; Yi, B.; Chen, W.-L.; Pang, Y.-P.; Wang, L. Effects of Nitrogen, Phosphorus, and Potassium Fertilization on Plant Growth, Element Levels in Plants and Soil, and the Relationships among Nutrient Concentrations, Plant Yield, and Nutrient Status in Erythropalum Scandens (Blume). J. Plant Nutr. 2024, 47, 82–96. [Google Scholar] [CrossRef] [Scilit]
  23. Kremper, R.; Juhász, E.K.; Novák, T.; Kincses, I.; Sándor, Z.; Tállai, M.; Béni, Á.; Szabó, A.; Szarvas, S.; Balla Kovács, A. Assessment of Spring Oat Nitrogen Supply Based on Plant Sap Nitrate Concentration and SPAD Values. Nitrogen 2025, 6, 19. [Google Scholar] [CrossRef] [Scilit]
  24. Ragályi, P.; Szabó, A.; Rékási, M.; Csathó, P.; Csontos, P. Effect of Different Macronutrient Supply Levels on the Drought Tolerance of Rainfed Grass Based on Biomass Production, Water Use Efficiency and Macroelement Content. Horticulturae 2023, 9, 1337. [Google Scholar] [CrossRef] [Scilit]
  25. Kemp, A.; T Hart, M.L. Grass Tetany in Grazing Milking Cows. NJAS 1957, 5, 4–17. [Google Scholar] [CrossRef] [Scilit]
  26. Darch, T.; Blackwell, M.S.A.; Hood, J.; Lee, M.R.F.; Storkey, J.; Beaumont, D.A.; McGrath, S.P. The Effect of Soil Type on Yield and Micronutrient Content of Pasture Species. PLoS ONE 2022, 17, e0277091. [Google Scholar] [CrossRef] [Scilit] [PubMed]
  27. Thomas, C.L.; Darch, T.; Harris, P.; Beaumont, D.A.; Haefele, S.M. The Distribution of Soil Micro-Nutrients and the Effects on Herbage Micro-Nutrient Uptake and Yield in Three Different Pasture Systems. Agronomy 2021, 11, 1731. [Google Scholar] [CrossRef] [Scilit]
  28. Fageria, N.K.; Baligar, V.C.; Clark, R.B. Micronutrients in Crop Production. In Advances in Agronomy; Elsevier: Amsterdam, The Netherlands, 2002; Volume 77, pp. 185–268. [Google Scholar]
  29. Hou, D.; Guo, K.; Liu, C. Asymmetric Effects of Grazing Intensity on Macroelements and Microelements in Grassland Soil and Plants in Inner Mongolia Grazing Alters Nutrient Dynamics of Grasslands. Ecol. Evol. 2020, 10, 8916–8926. [Google Scholar] [CrossRef] [Scilit] [PubMed]
  30. Gupta, U.; Monteiro, F.; Werner, J. Micronutrients in Grassland Production. In Proceedings of the IGC Proceedings (1985–2023), São Paulo, Brazil, 11–21 February 2001. [Google Scholar]
  31. Juknevičius, S.; Sabienė, N. The Content of Mineral Elements in Some Grasses and Legumes. Ekologija 2007, 53, 44–52. [Google Scholar]
  32. Dove, H.; Kelman, W.M. Liveweight Gains of Young Sheep Grazing Dual-Purpose Wheat with Sodium and Magnesium Supplied as Direct Supplement, or with Magnesium Supplied as Fertiliser. Anim. Prod. Sci. 2015, 55, 1217–1229. [Google Scholar] [CrossRef] [Scilit]
  33. Animal Nutrition, 7th ed.; McDonald, P., Ed.; Benjamin Cummings: San Francisco, CA, USA, 2011. [Google Scholar]
  34. Carruthers, V.R.; Norton, D.H.; O’Connor, M.B. The Incidence of Bloat on Pastures Differing in K:Na Ratio. ProNZG 1988, 49, 169–170. [Google Scholar] [CrossRef] [Scilit]
  35. Khatun, J.; Intekhab, A.; Dhak, D. Effect of Uncontrolled Fertilization and Heavy Metal Toxicity Associated with Arsenic(As), Lead(Pb) and Cadmium (Cd), and Possible Remediation. Toxicology 2022, 477, 153274. [Google Scholar] [CrossRef] [Scilit]
  36. Dradrach, A.; Karczewska, A.; Bogacz, A.; Kawałko, D.; Pruchniewicz, D. Accumulation of Potentially Toxic Metals in Ryegrass (Lolium perenne L.) and Other Components of Lawn Vegetation in Variously Contaminated Sites of Urban Areas. Sustainability 2024, 16, 8040. [Google Scholar] [CrossRef] [Scilit]
  37. Bersényi, A.; Fekete, S.G.; Szőcs, Z.; Berta, E. Effect of Ingested Heavy Metals (Cd, Pb and Hg) on Haematology and Serum Biochemistry in Rabbits. Acta Vet. Hung. 2003, 51, 297–304. [Google Scholar] [CrossRef] [Scilit]
  38. Fekete, S.G.; Bersényi, A.; Kádár, I.; Glávits, R.; Koncz, J.; Zöldág, L. Study of Soil-Plant (Potato and Beetroot)-Animal Cycle of Nutritive and Hazardous Minerals in a Rabbit Model. Acta Vet. Hung. 2001, 49, 301–310. [Google Scholar] [CrossRef] [Scilit] [PubMed]
  39. Wrzecińska, M.; Kowalczyk, A.; Cwynar, P.; Czerniawska-Piątkowska, E. Disorders of the Reproductive Health of Cattle as a Response to Exposure to Toxic Metals. Biology 2021, 10, 882. [Google Scholar] [CrossRef] [Scilit] [PubMed]
  40. Ismail, A.; Riaz, M.; Akhtar, S.; Ismail, T.; Ahmad, Z.; Hashmi, M.S. Estimated Daily Intake and Health Risk of Heavy Metals by Consumption of Milk. Food Addit. Contam. Part B 2015, 8, 260–265. [Google Scholar] [CrossRef] [Scilit]
  41. Lü, X.-T.; Kong, D.-L.; Pan, Q.-M.; Simmons, M.E.; Han, X.-G. Nitrogen and Water Availability Interact to Affect Leaf Stoichiometry in a Semi-Arid Grassland. Oecologia 2012, 168, 301–310. [Google Scholar] [CrossRef] [Scilit]
  42. Lončarić, Z.; Ivezić, V.; Kerovec, D.; Rebekić, A. Foliar Zinc-Selenium and Nitrogen Fertilization Affects Content of Zn, Fe, Se, P, and Cd in Wheat Grain. Plants 2021, 10, 1549. [Google Scholar] [CrossRef] [Scilit]
  43. Rodger, J.B.A. The Effect of Fertilizer Nitrogen, Phosphorus and Potassium on the Calcium, Magnesium and Phosphorus Status of Pasture Cut for Silage. J. Agric. Sci. 1982, 99, 199–205. [Google Scholar] [CrossRef] [Scilit]
  44. Kováčik, J.; Dresler, S.; Strzemski, M.; Sowa, I.; Babula, P.; Wójciak-Kosior, M. Nitrogen Modulates Strontium Uptake and Toxicity in Hypericum Perforatum Plants. J. Hazard. Mater. 2022, 425, 127894. [Google Scholar] [CrossRef] [Scilit] [PubMed]
  45. Rabinovich, A.; Di, R.; Lindert, S.; Heckman, J. Nickel and Soil Fertility: Review of Benefits to Environment and Food Security. Environments 2024, 11, 177. [Google Scholar] [CrossRef] [Scilit]
  46. Ragályi, P.; Szabó, A.; Csathó, P.; Rékási, M.; Csontos, P. Interaction of Nitrogen, Phosphorus, and Potassium Fertilisation and Precipitation on the Nitrogen Use Efficiency of Rainfed Grass. Nitrogen 2025, 6, 8. [Google Scholar] [CrossRef] [Scilit]
  47. ISO 10390:2021; Soil, Treated Biowaste and Sludge—Determination of pH. ISO: Geneva, Switzerland, 2021.
  48. FAO. Standard Operating Procedure for Soil Organic Carbon. In Walkley-Black Method: Titration and Colorimetric Method, 1st ed.; FAO: Rome, Italy, 2020. [Google Scholar]
  49. ISO 10693:1995; Soil Quality—Determination of Carbonate Content—Volumetric Method. ISO: Geneva, Switzerland, 1995.
  50. ISO 13536:2024; Soil Quality—Determination of the Potential Cation Exchange Capacity and Exchangeable Cations Using Barium Chloride Solution Buffered at pH = 8.1. ISO: Geneva, Switzerland, 2024.
  51. ISO 11261:1995; Soil Quality—Determination of Total Nitrogen—Modified Kjeldahl Method. ISO: Geneva, Switzerland, 1995.
  52. Egnér, H.; Riehm, H.; Domingo, W. Untersuchungen Über Die Chemische Bodenanalyse Als Grundlage Für Die Beurteilung Des Nährstoffzustandes Der Böden. II. Chem. Extraktionsmethoden Zur Phosphor-Und Kaliumbestimmung. K. Lantbrukshögskolans Ann. 1960, 26, 199–215. [Google Scholar]
  53. ISO 54321:2020; Soil, Treated Biowaste, Sludge and Waste—Digestion of Aqua Regia Soluble Fractions of Elements. ISO: Geneva, Switzerland, 2020.
  54. White, T.R.; Douthit, G.E. Use of Microwave Oven and Nitric Acid-Hydrogen Peroxide Digestion to Prepare Botanical Materials for Elemental Analysis by Inductively Coupled Argon Plasma Emission Spectroscopy. J. AOAC Int. 1985, 68, 766–769. [Google Scholar] [CrossRef] [Scilit]
  55. ISO 1871:2009; Food and Feed Products—General Guidelines for the Determination of Nitrogen by the Kjeldahl Method. ISO: Geneva, Switzerland, 2009.
  56. Thakkar, J.J. Structural Equation Modelling: Application for Research and Practice (with AMOS and R); Studies in Systems, Decision and Control; Springer: Singapore, 2020; Volume 285. [Google Scholar]
  57. R Core Team. R: A Language and Environment for Statistical Computing; R Foundation for Statistical Computing: Vienna, Austria, 2025. [Google Scholar]
  58. Posit Team. RStudio: Integrated Development Environment for R; Posit Team: Boston, MA, USA, 2025. [Google Scholar]
  59. R Core Team. Nlme: Linear and Nonlinear Mixed Effects Models; R Foundation for Statistical Computing: Vienna, Austria, 2025. [Google Scholar]
  60. Fox, J.; Weisberg, S. An R Companion to Applied Regression, 3rd ed.; SAGE: Los Angeles, CA, USA, 2019. [Google Scholar]
  61. Hothorn, T.; Bretz, F.; Westfall, P. Simultaneous Inference in General Parametric Models. Biom. J. 2008, 50, 346–363. [Google Scholar] [CrossRef] [Scilit] [PubMed]
  62. Lenth, R.V.; Piaskowski, J. Emmeans: Estimated Marginal Means, Aka Least-Squares Means; R Foundation for Statistical Computing: Vienna, Austria, 2026. [Google Scholar]
  63. Rosseel, Y. Lavaan: An R Package for Structural Equation Modeling. J. Stat. Soft. 2012, 48, 1–36. [Google Scholar] [CrossRef] [Scilit]
  64. Wickham, H. Ggplot2; Use R! Springer International Publishing: Cham, Germany, 2016. [Google Scholar]
  65. Faraway, J.J. Linear Models with R; Chapman and Hall/CRC: Boca Raton, FL, USA, 2016. [Google Scholar]
  66. Blumenthal, J.M.; Baltensperger, D.D.; Cassman, K.G.; Mason, S.C.; Pavlista, A.D. Importance and Effect of Nitrogen on Crop Quality and Health. In Nitrogen in the Environment; Elsevier: Amsterdam, The Netherlands, 2008; pp. 51–70. [Google Scholar]
  67. Yang, Y.; Jin, M.; Liu, J. Divergent Responses of Plant Multi-Element Coupling to Nitrogen and Phosphorus Addition in a Meadow Steppe. BMC Plant Biol. 2025, 25, 110. [Google Scholar] [CrossRef] [Scilit]
  68. Cherney, J.H.; Ketterings, Q.M.; Orloski, J.L. Plant and Soil Elemental Status as Influenced by Multi-Year Nitrogen and Potassium Fertilization. J. Plant Nutr. 2004, 27, 991–1014. [Google Scholar] [CrossRef] [Scilit]
  69. Dindová, A.; Hakl, J.; Hrevušová, Z.; Nerušil, P. Relationships between Long-Term Fertilization Management and Forage Nutritive Value in Grasslands. Agric. Ecosyst. Environ. 2019, 279, 139–148. [Google Scholar] [CrossRef] [Scilit]
  70. Fang, J.; Chen, B.; Wang, F.; Li, W.; Zhang, H.; Fang, J.; Liu, S.; Zheng, Z.; Guo, M.; Niu, S. Nitrogen, Phosphorus, and Potassium Co-limitation in Terrestrial Ecosystems: A Global Meta-analysis. Plants People Planet 2024, 6, 1329–1340. [Google Scholar] [CrossRef] [Scilit]
  71. Hamilton, E.W.; Giovannini, M.S.; Moses, S.A.; Coleman, J.S.; McNaughton, S.J. Biomass and Mineral Element Responses of a Serengeti Short-Grass Species to Nitrogen Supply and Defoliation: Compensation Requires a Critical [N]. Oecologia 1998, 116, 407. [Google Scholar] [CrossRef] [Scilit] [PubMed]
  72. Chen, J.; Li, J.; Li, W.; Li, P.; Zhu, R.; Zhong, Y.; Zhang, W.; Li, T. The Optimal Ammonium-Nitrate Ratio for Various Crops: A Meta-Analysis. Field Crops Res. 2024, 307, 109240. [Google Scholar] [CrossRef] [Scilit]
  73. Lips, S.H.; Leidi, E.O.; Silberbush, M.; Soares, M.I.M.; Lewis, O.E.M. Physiological Aspects of Ammonium and Nitrate Fertilization. J. Plant Nutr. 1990, 13, 1271–1289. [Google Scholar] [CrossRef] [Scilit]
  74. EFSA Panel; Schrenk, D.; Bignami, M.; Bodin, L.; Chipman, J.K.; del Mazo, J.; Grasl-Kraupp, B.; Hoogenboom, L.; Leblanc, J.; Nebbia, C.S.; et al. Risk Assessment of Nitrate and Nitrite in Feed. EFS2 2020, 18, e06290. [Google Scholar] [CrossRef] [Scilit]
  75. Langova, L.; Novotna, I.; Nemcova, P.; Machacek, M.; Havlicek, Z.; Zemanova, M.; Chrast, V. Impact of Nutrients on the Hoof Health in Cattle. Animals 2020, 10, 1824. [Google Scholar] [CrossRef] [Scilit] [PubMed]
  76. Oruc, H.H.; Akkoc, A.; Uzunoglu, I.; Kennerman, E. Nitrate Poisoning in Horses Associated With Ingestion of Forage and Alfalfa. J. Equine Vet. Sci. 2010, 30, 159–162. [Google Scholar] [CrossRef] [Scilit]
  77. Ozmen, O.; Mor, F.; Sahinduran, S.; Unsal, A. Pathological and Toxicological Investigations of Chronic Nitrate Poisoning in Cattle. Toxicol. Environ. Chem. 2005, 87, 99–106. [Google Scholar] [CrossRef] [Scilit]
  78. Saha, S.K.; Pathak, N.N. Fundamentals of Animal Nutrition; Springer: Singapore, 2021. [Google Scholar]
  79. Godwin, I.; Li, L.; Luijben, K.; Oelbrandt, N.; Velazco, J.; Miller, J.; Hegarty, R. The Effects of Chronic Nitrate Supplementation on Erythrocytic Methaemoglobin Reduction in Cattle. Anim. Prod. Sci. 2015, 55, 611–616. [Google Scholar] [CrossRef] [Scilit]
  80. Christ, R.; Da Silva, A.S.; Grabriel, M.E.; Henker, L.C.; Cechin, R.A.; Piva, M.M.; Bottari, N.B.; Schetinger, M.R.C.; De Cesaro, M.P.; Morsch, V.M.; et al. Cholinesterase Activities and Oxidative Stress in Cattle Experimentally Exposed to Nitrate/Nitrite in Cultivated Pasture with Different Fertilization Schemes. Acta Sci. Vet. 2018, 46, 9. [Google Scholar] [CrossRef] [Scilit]
  81. Holman, J.D.; Obour, A.K.; Mengel, D.B. Nitrogen Application Effects on Forage Sorghum Production and Nitrate Concentration. J. Plant Nutr. 2019, 42, 2794–2804. [Google Scholar] [CrossRef] [Scilit]
  82. Gagnon, B.; Ziadi, N.; Bélanger, G.; Tremblay, G.F.; Parent, G. Urea-Based Fertilizer as an Efficient Nitrogen Source in Perennial Cool-Grass Forage Production. Agron. J. 2019, 111, 867–880. [Google Scholar] [CrossRef] [Scilit]
  83. Simić, A.; Marković, J.; Bojan Stojanović, S.V.; Violeta Mandić, Z.B.; Dželetović, Ž. The Use of Different N Sources for the Treatment of Permanent Grassland and Effect on Forage Quality. Emir. J. Food Agric. 2019, 180, 180–187. [Google Scholar] [CrossRef] [Scilit]
  84. Kremper, R.; Bertán, E.S.; Loch, J. Determination of Optimal Nitrogen, Phosphorus, and Zinc Doses in a Multifactoral Pot Experiment. Commun. Soil Sci. Plant Anal. 2011, 42, 2229–2234. [Google Scholar] [CrossRef] [Scilit]
  85. Pruchniewicz, D.; Łobas, Z.; Dradrach, A.; Żołnierz, L. The Influence of Management on the Content of Macro- and Microelements in Plant Shoots of a Meadow Sward of an Arrhenatheretalia Plant Community. Agronomy 2025, 15, 1020. [Google Scholar] [CrossRef] [Scilit]
  86. Ragályi, P.; Kádár, I.; Szemán, L.; Csathó, P.; Csontos, P. Effect of N, P and K Fertilization on the Species Succession of an Established Grass Sward during a Decade. Bot. Közlemények 2018, 105, 13–26. [Google Scholar] [CrossRef] [Scilit]
  87. Fujita, Y.; Robroek, B.J.M.; De Ruiter, P.C.; Heil, G.W.; Wassen, M.J. Increased N Affects P Uptake of Eight Grassland Species: The Role of Root Surface Phosphatase Activity. Oikos 2010, 119, 1665–1673. [Google Scholar] [CrossRef] [Scilit]
  88. National Research Council. Nutrient Requirements of Beef Cattle: Seventh Revised Edition: Update 2000; The National Academies Press: Washington, DC, USA, 2000; p. 9791. [Google Scholar]
  89. McGrath, J.J.; Savage, D.B.; Godwin, I.R. The Potential for Pharmacological Supply of 25-Hydroxyvitamin D to Increase Phosphorus Utilisation in Cattle. Anim. Prod. Sci. 2013, 53, 1238–1245. [Google Scholar] [CrossRef] [Scilit]
  90. Martínez-Morcillo, S.; Barrales, I.; Pérez-López, M.; Rodríguez, F.S.; Peinado, J.S.; Míguez-Santiyán, M.P. Mineral and Potentially Toxic Element Profiles in the Soil-Feed-Animal Continuum: Implications for Public, Environmental, and Livestock Health in Three Pasture-Based Sheep Farming Systems. Sci. Total Environ. 2024, 919, 170860. [Google Scholar] [CrossRef] [Scilit]
  91. Hopkins, A.; Adamson, A.H.; Bowling, P.J. Response of Permanent and Reseeded Grassland to Fertilizer Nitrogen. 2. Effects on Concentrations of Ca, Mg, K, Na, S, P, Mn, Zn, Cu, Co and Mo in Herbage at a Range of Sites. Grass Forage Sci. 1994, 49, 9–20. [Google Scholar] [CrossRef] [Scilit]
  92. Wakeel, A.; Ishfaq, M. Potash Use and Dynamics in Agriculture; Springer: Singapore, 2022. [Google Scholar]
  93. Bahamonde, H.; Fernández, V.; Mattenet, F.; Peri, P. Mineral Elements in Grasses Growing in Contrasting Environmental Conditions in Southern Patagonia. N. Z. J. Agric. Res. 2016, 59, 235–249. [Google Scholar] [CrossRef] [Scilit]
  94. Dove, H.; Masters, D.G.; Thompson, A.N. New Perspectives on the Mineral Nutrition of Livestock Grazing Cereal and Canola Crops. Anim. Prod. Sci. 2016, 56, 1350–1360. [Google Scholar] [CrossRef] [Scilit]
  95. Grunes, D.L.; Stout, P.R.; Brownell, J.R. Grass Tetany of Ruminants. In Advances in Agronomy; Elsevier: Amsterdam, The Netherlands, 1970; Volume 22, pp. 331–374. [Google Scholar]
  96. Bojtor, C.; Mousavi, S.M.N.; Illés, Á.; Golzardi, F.; Széles, A.; Szabó, A.; Nagy, J.; Marton, C.L. Nutrient Composition Analysis of Maize Hybrids Affected by Different Nitrogen Fertilisation Systems. Plants 2022, 11, 1593. [Google Scholar] [CrossRef] [Scilit]
  97. Bojtor, C.; Illés, Á.; Nasir Mousavi, S.M.; Széles, A.; Tóth, B.; Nagy, J.; Marton, C.L. Evaluation of the Nutrient Composition of Maize in Different NPK Fertilizer Levels Based on Multivariate Method Analysis. Int. J. Agron. 2021, 2021, 5537549. [Google Scholar] [CrossRef] [Scilit]
  98. Riedell, W.E. Mineral-nutrient Synergism and Dilution Responses to Nitrogen Fertilizer in Field-grown Maize. Z. Pflanzenernähr. Bodenkd. 2010, 173, 869–874. [Google Scholar] [CrossRef] [Scilit]
  99. Wyszkowski, M.; Brodowska, M.S. Content of Trace Elements in Soil Fertilized with Potassium and Nitrogen. Agriculture 2020, 10, 398. [Google Scholar] [CrossRef] [Scilit]
  100. Dermauw, V.; Yisehak, K.; Dierenfeld, E.S.; Du Laing, G.; Buyse, J.; Wuyts, B.; Janssens, G.P.J. Effects of Trace Element Supplementation on Apparent Nutrient Digestibility and Utilisation in Grass-Fed Zebu (Bos Indicus) Cattle. Livest. Sci. 2013, 155, 255–261. [Google Scholar] [CrossRef] [Scilit]
  101. Fisher, G. Micronutrients and Animal Nutrition and the Link between the Application of Micronutrients to Crops and Animal Health. Turk. J. Agric. For. 2008, 32, 221–233. [Google Scholar]
  102. Cui, X.; He, H.; Hu, S.; Zhang, B.; Cai, H. Synergistic Interaction between Copper and Nitrogen-Uptake, Translocation, and Distribution in Rice Plant. Plants 2022, 11, 2612. [Google Scholar] [CrossRef] [Scilit] [PubMed]
  103. Wang, B.; Li, X.; Zhou, Z.; Zhu, Y.; Zuo, Z.; Guo, H. The Role of Five Key Minerals (Cu, Se, Zn, Co, Fe) in Reproductive Function of Female Cattle: Current Insights and Future Directions. Vet. Sci. 2026, 13, 208. [Google Scholar] [CrossRef] [Scilit] [PubMed]
  104. Bersényi, A.; Fekete, S.; Hullár, I.; Kádár, I.; Szilágyi, M.; Glávits, R.; Kulcsár, M.; Mézes, M.; Zöldág, L. Study of the Soil—Plant (Carrot)—Animal Cycle of Nutritive and Hazardous Minerals in a Rabbit Model. Acta Vet. Hung. 1999, 47, 181–190. [Google Scholar] [CrossRef] [Scilit] [PubMed]
  105. McKenzie, F.R.; Jacobs, J.L. Effects of Application of Nitrogen Fertilizer on Concentrations of P, K, S, Ca, Mg, Na, Cl, Mn, Fe, Cu and Zn in Perennial Ryegrass/White Clover Pastures in South-western Victoria, Australia. Grass Forage Sci. 2002, 57, 48–53. [Google Scholar] [CrossRef] [Scilit]
  106. Tasi, J. Heavy Metal, Macro- and Microelement Content of Grass Species and Dicotyledons. Acta Agron. Hung. 2005, 53, 349–352. [Google Scholar] [CrossRef] [Scilit]
  107. Zhao, F.; Hawkesford, M.; McGrath, S. Sulphur Assimilation and Effects on Yield and Quality of Wheat. J. Cereal Sci. 1999, 30, 1–17. [Google Scholar] [CrossRef] [Scilit]
  108. Juhász, E.K.; Kremper, R.; Béni, Á.; Balláné Kovács, A. Residual Effect of Superphosphate on the Sulphur Status of Soil and Plants in a Long-Term NPK Fertilisation Experiment on a Chernozem in Hungary. Plant Soil Environ. 2021, 67, 625–632. [Google Scholar] [CrossRef] [Scilit]
  109. Juhász, E.K.; Kremper, R.; Tállai, M.; Béni, Á.; Novák, T.; Balla Kovács, A. Evaluation of the Effects of Drought Stress and Nitrogen-Sulfur Fertilization on Productivity and Yield Parameters of Spring Wheat. Stresses 2024, 4, 850–859. [Google Scholar] [CrossRef] [Scilit]
  110. Zhao, Y.; Xie, B.; Gao, J.; Zhao, G. Dietary Supplementation with Sodium Sulfate Improves Rumen Fermentation, Fiber Digestibility, and the Plasma Metabolome through Modulation of Rumen Bacterial Communities in Steers. Appl. Environ. Microbiol. 2020, 86, e01412-20. [Google Scholar] [CrossRef] [Scilit]
  111. Penrose, B.; Lovatt, J.A.; Palmer, S.; Thomson, R.; Broadley, M.R. Revisiting Variation in Leaf Magnesium Concentrations in Forage Grasses for Improved Animal Health. Plant Soil 2020, 457, 43–55. [Google Scholar] [CrossRef] [Scilit]
  112. Aydin, I.; Uzun, F. Potential Decrease of Grass Tetany Risk in Rangelands Combining N and K Fertilization with MgO Treatments. Eur. J. Agron. 2008, 29, 33–37. [Google Scholar] [CrossRef] [Scilit]
  113. Eppe, J.; Djebala, S.; Rollin, F.; Guyot, H. Herd Health Troubles Potentially Related to Aluminium Grass Silage Content in Dairy Cows. Vet. Sci. 2023, 10, 149. [Google Scholar] [CrossRef] [Scilit] [PubMed]
  114. Wu, G. Principles of Animal Nutrition; CRC Press, Taylor & Francis Group: Boca Raton, FL, USA, 2018. [Google Scholar]
  115. Syso, A.; Sokolov, V.A.; Petukhov, V.L.; Lebedeva, M.; Cherevko, A.S.; Sebezhko, O.I.; Konovalova, T.V.; Korotkevich, O.; Narozhnykh, K.; Kamaldinov, E. Ecological and Biogeochemical Evaluation of Elements Content in Soils and Fodder Grasses of the Agricultural Lands of Siberia. J. Pharm. Sci. Res. 2017, 9, 368–374. [Google Scholar]
  116. Bolan, S.; Wijesekara, H.; Amarasiri, D.; Zhang, T.; Ragályi, P.; Brdar-Jokanović, M.; Rékási, M.; Lin, J.-Y.; Padhye, L.P.; Zhao, H.; et al. Boron Contamination and Its Risk Management in Terrestrial and Aquatic Environmental Settings. Sci. Total Environ. 2023, 894, 164744. [Google Scholar] [CrossRef] [Scilit]
  117. NorFor—The Nordic Feed Evaluation System; Volden, H., Ed.; Brill|Wageningen Academic: Gelderland, The Netherlands, 2011. [Google Scholar]
  118. Cataldo, D.A.; Garland, T.R.; Wildung, R.E. Nickel in Plants: I. Uptake Kinetics Using Intact Soybean Seedlings 1. Plant Physiol. 1978, 62, 563–565. [Google Scholar] [CrossRef] [Scilit] [PubMed]
  119. Silva, F.L.; Martins E Silva, M.H.; Oliveira Júnior, E.S.; Ignácio, Á.R.A.; López-Alonso, M.; Miranda, M.; Piñeiro, V.; Pierangeli, M.A.P. Micronutrients and Toxic Elements in Soil, Grass, and Nutritional Supplements and in Blood and Meat Products from Beef Cattle Raised in the Southern Amazon, Brazil. J. Agric. Food Chem. 2025, 73, 15500–15513. [Google Scholar] [CrossRef] [Scilit] [PubMed]
  120. Suttle, N. Mineral Nutrition of Livestock, 5th ed.; CABI: Oxfordshire, UK, 2022. [Google Scholar]
  121. Sutton, P.; Maskall, J.; Thornton, I. Concentrations of Major and Trace Elements in Soil and Grass at Shimba Hills National Reserve, Kenya. Appl. Geochem. 2002, 17, 1003–1016. [Google Scholar] [CrossRef] [Scilit]
  122. Kandylis, K. The Role of Sulphur in Ruminant Nutrition. A Review. Livest. Prod. Sci. 1984, 11, 611–624. [Google Scholar] [CrossRef] [Scilit]
  123. Turner, M.A. Dietary Potassium-Sodium Imbalance as a Factor in the Aetiology of Primary Ruminal Tympany in Dairy Cows. Vet. Res. Commun. 1981, 5, 159–164. [Google Scholar] [CrossRef] [Scilit] [PubMed]
Figure 1. Effect of N treatments on the dry aboveground biomass of grass averaged over the years 2001–2010. Different letters indicate significant differences. Error bars indicate the standard error of the mean.
Nitrogen 07 00055 g001
Figure 2. Partial eta-squared effect sizes of N treatments on the element and NO3–N concentrations of grass. Significance levels are indicated as: p < 0.001: ***, p < 0.01: **, p < 0.05: *, p > 0.05: n.s. (non-significant).
Nitrogen 07 00055 g002
Figure 3. Effect of N treatments on grass N concentration (DM) in the aboveground biomass. (A) N concentration at each treatment level. Different letters indicate significant differences. Error bars indicate the standard error of the mean. (B) Direct effect of N treatment and its indirect effect through biomass increase. Arrow widths and numbers indicate the strength of standardised path coefficients, whereas “Total PC” indicates the standardised path coefficients of all direct and indirect effects. Green and red arrows indicate positive and negative path coefficients, respectively. Significance levels are indicated as: p < 0.001: ***, p < 0.05: *, p > 0.05: n.s. (non-significant). R2 values indicate the variance explained by the model for each response variable.
Nitrogen 07 00055 g003
Figure 4. Effect of N treatments on grass NO3–N concentration (DM) in the aboveground biomass. (A) NO3–N concentration at each treatment level. Different letters indicate significant differences. Error bars indicate the standard error of the mean. (B) Direct effect of N treatment and its indirect effect through biomass increase. Arrow widths and numbers indicate the strength of standardised path coefficients, whereas “Total PC” indicates the standardised path coefficients of all direct and indirect effects. Green and red arrows indicate positive and negative path coefficients, respectively. Significance levels are indicated as: p < 0.001: ***, p > 0.05: n.s. (non-significant). R2 values indicate the variance explained by the model for each response variable.
Nitrogen 07 00055 g004
Figure 5. Effect of N treatments on grass P concentration (DM) in the aboveground biomass. (A) P concentration at each treatment level. Different letters indicate significant differences. Error bars indicate the standard error of the mean. (B) Direct effect of N treatment and its indirect effect through biomass increase. Arrow widths and numbers indicate the strength of standardised path coefficients, whereas “Total PC” indicates the standardised path coefficients of all direct and indirect effects. Green and red arrows indicate positive and negative path coefficients, respectively. Significance levels are indicated as: p < 0.001: ***, p < 0.01: **. R2 values indicate the variance explained by the model for each response variable.
Nitrogen 07 00055 g005
Figure 6. Effect of N treatments on grass Na concentration (DM) in the aboveground biomass. (A) Na concentration at each treatment level. Different letters indicate significant differences. Error bars indicate the standard error of the mean. (B) Direct effect of N treatment and its indirect effect through biomass increase. Arrow widths and numbers indicate the strength of standardised path coefficients, whereas “Total PC” indicates the standardised path coefficients of all direct and indirect effects. Green arrows indicate positive path coefficients. Significance levels are indicated as: p < 0.001: ***, p < 0.01: **, p > 0.05: n.s. (non-significant). R2 values indicate the variance explained by the model for each response variable.
Nitrogen 07 00055 g006
Figure 7. Effect of N treatments on grass Mn concentration (DM) in the aboveground biomass. (A) Mn concentration at each treatment level. Different letters indicate significant differences. Error bars indicate the standard error of the mean. (B) Direct effect of N treatment and its indirect effect through biomass increase. Arrow widths and numbers indicate the strength of standardised path coefficients, whereas “Total PC” indicates the standardised path coefficients of all direct and indirect effects. Green arrows indicate positive path coefficients. Significance levels are indicated as: p < 0.001: ***, p < 0.05: *, p > 0.05: n.s. (non-significant). R2 values indicate the variance explained by the model for each response variable.
Nitrogen 07 00055 g007
Figure 8. Effect of N treatments on grass Cu concentration (DM) in the aboveground biomass. (A) Cu concentration at each treatment level. Different letters indicate significant differences. Error bars indicate the standard error of the mean. (B) Direct effect of N treatment and its indirect effect through biomass increase. Arrow widths and numbers indicate the strength of standardised path coefficients, whereas “Total PC” indicates the standardised path coefficients of all direct and indirect effects. Green and red arrows indicate positive and negative path coefficients, respectively. Significance levels are indicated as: p < 0.001: ***, p > 0.05: n.s. (non-significant). R2 values indicate the variance explained by the model for each response variable.
Nitrogen 07 00055 g008
Figure 9. Effect of N treatments on grass Mo concentration (DM) in the aboveground biomass. (A) Mo concentration at each treatment level. Different letters indicate significant differences. Error bars indicate the standard error of the mean. (B) Direct effect of N treatment and its indirect effect through biomass increase. Arrow widths and numbers indicate the strength of standardised path coefficients, whereas “Total PC” indicates the standardised path coefficients of all direct and indirect effects. Green and red arrows indicate positive and negative path coefficients, respectively. Significance levels are indicated as: p < 0.001: ***, p < 0.01: **. R2 values indicate the variance explained by the model for each response variable.
Nitrogen 07 00055 g009
Table 1. Temperature and precipitation data of the experimental station, 2001–2010.
JanFebMarAprMayJunJulAugSepOctNovDec
Temperature, Mean−0.31.26.211.716.919.721.720.715.510.86.00.2
°CStd. deviation2.43.51.51.31.41.50.91.51.31.71.82.3
Precipitation, Mean 27.332.131.635.343.670.657.085.153.635.744.734.3
mmStd. deviation12.718.920.427.337.640.332.560.734.828.019.016.2
Table 2. Concentrations of elements not significantly changed by N treatments in the aboveground biomass of the grass. Mean ± standard error, mg kg−1 DM.
ElementsN0N1N2N3p Value
K18,790 ± 70118,864 ± 134917,634 ± 145315,546 ± 13950.663
Ca4078 ± 1454448 ± 2414693 ± 2234913 ± 2390.339
S1925 ± 1151583 ± 99.71742 ± 1171784 ± 114* 0.017
Mg1456 ± 43.01653 ± 61.21689 ± 95.21600 ± 80.80.744
Fe117 ± 13.485.0 ± 6.82105 ± 10.2112 ± 11.60.205
Al86.6 ± 11.350.8 ± 6.7955.2 ± 7.9268.7 ± 10.0* 0.032
Zn16.9 ± 2.9217.7 ± 3.9319.4 ± 3.6219.6 ± 3.350.138
Sr11.8 ± 0.50411.6 ± 0.71112.8 ± 0.62212.7 ± 0.5830.131
B4.19 ± 0.3354.16 ± 0.333.92 ± 0.3083.63 ± 0.2630.267
Ba3.59 ± 0.4333.64 ± 0.4684.19 ± 0.3243.98 ± 0.2820.325
Ni0.819 ± 0.0770.810 ± 0.1040.783 ± 0.1060.669 ± 0.0800.233
* Even though the ANOVA result for S and Al concentrations was significant, the Tukey multiple comparison test did not show any significant differences between the different N treatment levels.
Table 3. Ratios of elements changed by N treatments in the aboveground biomass of the grass. Mean ± standard error, mg kg−1 DM.
RatiosN0N1N2N3
K:(Ca + Mg)1.50 ± 0.054 a1.42 ± 0.124 a1.28 ± 0.133 a1.10 ± 0.114 a
K:(Na + Mg)3.93 ± 0.192 a3.05 ± 0.324 a2.80 ± 0.311 a2.57 ± 0.243 a
Ca:P1.49 ± 0.110 b2.35 ± 0.146 a2.57 ± 0.122 a2.73 ± 0.137 a
N:S5.24 ± 0.407 b8.41 ± 0.545 a11.3 ± 0.735 a11.5 ± 0.684 a
K:Na221 ± 27.9 a39.7 ± 8.23 b35.7 ± 9.23 b67.9 ± 30.79 b
Different letters indicate significant differences between columns (N treatments).
Disclaimer/Publisher’s Note: The statements, opinions and data contained in all publications are solely those of the individual author(s) and contributor(s) and not of MDPI and/or the editor(s). MDPI and/or the editor(s) disclaim responsibility for any injury to people or property resulting from any ideas, methods, instructions or products referred to in the content.