1. Introduction
Wheat (
Triticum aestivum L.) is one of the most widely cultivated crops globally, playing a vital role in human nutrition and food security [
1]. In Pakistan, wheat is a primary source of calories and protein for its growing population [
2]. Despite record wheat production in the 2022–2023 season, reaching 28.1 million tons [
3,
4], Pakistan continues to face challenges in meeting domestic demand and has had to import wheat to stabilize prices [
5,
6]. These challenges underscore the need for effective management strategies to ensure both food security and environmental sustainability [
7]. A fundamental component of these strategies is optimizing wheat yield and nitrogen use efficiency (NUE), which is essential for addressing the growing global demand for food. Projections estimate that wheat production must increase by at least 50% to meet future global needs [
8], emphasizing the importance of adopting advanced agricultural practices and technologies [
9].
Nitrogen (N) is an essential element for the synthesis of amino acids, which are fundamental to protein formation and cellular metabolic processes [
10]. However, excessive N application can result in toxic ion accumulation, impairing enzymatic activity and inhibiting secondary metabolite synthesis [
11,
12]. Optimal N availability enhances pigment composition and key physiological parameters, including stomatal conductance (gs), transpiration rate (E), and photosynthetic activity [
13]. Moreover, precise N management improves wheat productivity by increasing grain and straw N content and enhancing grain weight [
14,
15].
Optimizing nitrogen use efficiency (NUE) is essential for effective wheat management in semi-arid subtropical regions such as Pakistan. N is vital for wheat growth and development, directly influencing grain yield and quality [
16,
17]. However, NUE in Pakistan remains low at 33%, compared to the global average of 42%, reflecting significant N losses and associated environmental risks [
18]. The region’s semi-arid subtropical climate, marked by erratic rainfall and elevated temperatures, further complicates N management and limits wheat productivity [
19]. Thus, evaluating the effects of varying N treatments on wheat yield and NUE under Pakistan’s specific climatic and edaphic conditions is critical for developing sustainable N management strategies [
20,
21].
The wheat variety Faisalabad-2008, known for its disease resistance and climate resilience, was chosen for this study due to its suitability for both irrigated and rainfed environments in Punjab, Pakistan [
22,
23]. In Pakistan, nitrogen application recommendations for wheat (120–150 kg N ha
−1) are provided by agriculture extension services or research institutions as opposed to being mandated by law. This study evaluates the effects of varying N doses (0–270 kg N ha
−1) on growth, yield, physio-biochemical traits, and NUE of the wheat cultivar Faisalabad-2008 across three growing seasons (2015–2018). It identifies optimal N application rates that maximize yield while minimizing environmental impact. The investigation also assesses key physio-biochemical responses to different N levels, focusing on grain yield, yield components, N uptake, and NUE. Statistical approaches—including the Multi-Trait Genotype-Ideotype Distance Index (MGIDI), principal component analysis (PCA), and analysis of variance—are employed to distill complex datasets and provide clearer insights into N management strategies.
Previous studies have highlighted the importance of optimizing N management in wheat cultivation. Strategies such as applying variable N rates at distinct growth stages have been shown to improve yield while reducing environmental risks, including N losses, water contamination, and greenhouse gas emissions [
24,
25]. These studies support a comprehensive, adaptive approach to N management that integrates agronomic, environmental, and genetic considerations to promote sustainability [
26]. The present study offers novel insights into optimizing N management for sustainable wheat production in semi-arid subtropical regions, providing recommendations to enhance both crop productivity and environmental outcomes.
2. Materials and Methods
2.1. Experimental Design
Field experiments were conducted over three consecutive wheat growing seasons (2015–2016, 2016–2017, and 2017–2018) at the Experimental Farm of NIAB, Faisalabad, Pakistan (31°23′ N latitude, 73°2′ E longitude, 184 m above sea level). The region has a semi-arid climate (BWh) according to the Köppen–Geiger classification, with significant seasonal variations in temperature and precipitation. The wheat growing season typically began in November and ended in mid-April. During the tillering stage, the temperature ranged from 22 °C to 25 °C, at anthesis from 25 °C to 28 °C, and during the grain-filling stage from 28 °C to 30 °C. While these temperature ranges were consistent across all three growing seasons, slight variations between seasons were observed, which could potentially influence wheat growth and development (
Figure 1).
A randomized complete block design (RCBD) with three replications was used to assess the effects of seven N levels (0, i.e., soil 22.5 kg N ha
−1, 45, 90, 135, 180, 225, and 270 kg N ha
−1) on wheat yield and productivity across the three seasons (
Table 1). The high-yielding, disease-resistant wheat cultivar Faisalabad-2008 was sown at a rate of 125 kg ha
−1 using a seed drill on 20 November 2015; 18 November 2016; and 15 November 2017. All agronomic practices, including seedbed preparation, weed control, pest management, and irrigation scheduling, were standardized across all plots and seasons, with the exception of N fertilization.
2.2. Wheat Production and Soil Physio-Chemical Analysis
The experimental field comprised Typic Ustocrept (TU) soil, a deep, well-drained loam derived from calcareous, medium-textured alluvium. Prior to the experiment’s initiation in July 2015, wheat was grown without fertilizer to deplete and homogenize soil nutrients, a practice repeated annually to minimize field variability. Wheat was sown at the end of October and harvested at the end of April each year. Certified disease-free seeds of the wheat variety Faisalabad-2008 were used. Land preparation involved deep plowing and precise leveling, followed by sowing with seed drills to ensure uniform planting. Nitrogen, phosphorus, and potassium fertilizers were applied according to the experimental design. Pest and weed management were performed manually as needed using integrated practices. Irrigation was applied at a rate of 75 mm per event throughout the crop season. This standardized approach ensured consistency and reliability in wheat production across all study years.
To assess soil nutrient status in October 2015, samples were collected to a depth of 1 m at 10 m × 10 m grid intervals and analyzed for physico-chemical properties (
Table 2). Soil parameters varied by depth. Clay content decreased from 25% in the topsoil to 20% in the subsoil, while silt content increased to 38% in the second layer and remained stable thereafter. Total organic carbon (TOC) declined sharply from 0.41% in the topsoil to 0.01% in the subsoil. Bulk density increased slightly from 1.48 g cm
−3 in the topsoil to 1.55 g cm
−3 in the subsoil, with a minor decrease in the intermediate layer. Water saturation content remained consistent across all depths, averaging 47%. Electrical conductivity (EC) rose with depth, from 1.73 dS m
−1 in the second layer to 1.94 dS m
−1 in the subsoil. Soil pH was slightly alkaline throughout, ranging from 7.96 to 8.25, with the highest value in the topsoil. Field capacity and permanent wilting point were nearly constant across layers, averaging 0.28 m
3 m
−3 and 0.11 m
3 m
−3, respectively.
2.3. Selection of Treatment for Boosting Wheat Yield
The optimal N dose for enhancing wheat productivity was identified based on key morphological, physio-biochemical traits, nutrient concentrations, and yield components. Morphological traits such as greater grain weight, optimal plant stature, efficient photosynthetic performance, and reduced leaf area significantly contributed to increased yield. Physiological indicators, including higher net photosynthetic rate (Pn), transpiration rate (E), stomatal conductance (gs), and optimal chlorophyll content, reflected effective physiological functioning under field conditions. Biochemical parameters, including elevated levels of total soluble sugars (TSS), total soluble proteins (TSP), total free amino acids (TAA), and enhanced concentrations of N, P, K, Ca, and Mg, together with yield attributes such as biomass yield, grain yield, and nitrogen harvest index (NHI), were critical to improved wheat productivity. These traits served as reliable selection criteria for identifying the most effective N dose to maximize crop productivity. Validation of key parameters was performed using statistical analyses, including principal component analysis (PCA), heatmap clustering, and the Multi-Trait Genotype-Ideotype Distance Index (MGIDI).
2.4. Photosynthetic Efficiency Measurement
Physiological parameters, including gs, E, and Pn, were measured using an infrared gas analyzer (IRGA; CI-340, CID, Inc., Camas, WA, USA). Measurements were taken between 10:00 a.m. and 12:30 p.m. using a fully expanded, sun-exposed upper leaf. Readings for all parameters were recorded from wheat plants grown under different N treatments.
2.5. Leaf Chlorophyll Contents
The chlorophyll (Chl.a, Chl.b, and total) and carotenoid contents from leaf samples were extracted by following Arnon’s method [
27]. The optical density was measured at 645, 663, and 480 nm using a spectrophotometer (Hitachi, U-2800). Chlorophyll and carotenoid contents were determined using the formulas provided by the Davies [
28] protocol and the results were computed as (mg/g FW).
where
2.6. Total Soluble Proteins
TSP was determined by extracting 1.0 g of fresh plant material with 10 mL of 0.2 M phosphate buffer (pH 7). A 1 mL aliquot was mixed with 1 mL of alkaline copper solution and 1 mL of copper sulfate solution, then incubated for 30 min. After adding 0.1 mL of Folin–Ciocalteu reagent and incubating for another 30 min, the optical density was measured at 620 nm using a spectrophotometer. Protein concentrations were calculated using a standard curve based on different concentrations of BSA [
29].
2.7. Total Free Amino Acids
To estimate total free amino acids (TFA), 1 mL of each sample (extracted in 0.2 M phosphate buffer, pH 7.0) was mixed with 1 mL of 10% pyridine and 1 mL of 2% ninhydrin solution. The tubes were heated for 30 min and then diluted to 50 mL with distilled water. The optical density of the colored solutions was measured at 570 nm, and the concentration of free amino acids was determined using a standard curve based on alanine concentrations [
30].
2.8. Total Soluble Sugars
The TSS were quantified following the method described by [
31]. Plant samples were extracted with ethanol, and the extract was evaporated to dryness. The residue was dissolved in distilled water, and the sugar content was estimated using the phenol–sulfuric acid method. Absorbance was measured at 485 nm, and TSS concentration was determined using a glucose standard curve.
2.9. Nutrient Content Estimation
Wheat plants were harvested at physiological maturity, and samples, including leaves, stems, and grains, were collected. A representative leaf sample was obtained from a randomly selected one-square-meter area within each plot to ensure accuracy and consistency. Plant material was washed to remove soil, dust, and other contaminants, then oven-dried at 70 °C for 72 h until a constant weight was reached. The dried leaves were ground into a fine powder using a mechanical grinder, digested, and subsequently analyzed for nutrient content.
2.9.1. Sample Digestion
To determine the nutrient content of Ca, Mg, P, and K, the dried plant samples were digested using the sulfuric acid–hydrogen peroxide method, as described by the Wolf method [
32]. Typically, 0.5–1 g of the ground plant material was placed in a digestion tube, and a 1:10 ratio of concentrated sulfuric acid (H
2SO
4), along with a few drops of hydrogen peroxide (H
2O
2), was added. The sample was then heated in a digestion block or on a hot plate until complete digestion occurred and the solution became clear. This process broke down the plant material, allowing the nutrients to be extracted into the solution.
2.9.2. Nutrient Analysis
The digested samples were diluted with deionized water to a final volume of 100 mL. The concentrations of Ca, Mg, and K that were determined in the digested samples and analyzed using atomic absorption spectrophotometry (AAS), with the samples compared to known standards to calculate their concentrations. The phosphorus content was determined using Barton’s reagent. This method involved the formation of a yellowish complex between phosphate and molybdate under acidic conditions. The complex was quantified by measuring absorbance at 750 nm using a spectrophotometer, and the phosphorus content was estimated using a standard curve developed with varying concentrations of phosphorus in sodium hydrogen phosphate by following the Cavell protocol [
33].
2.10. Nitrogen Determination
The N content in plant material was determined using the Kjeldahl method, as outlined by Bremner [
34]. One gram of finely ground plant material was weighed and placed in a Kjeldahl digestion tube. The sample was then digested with concentrated sulfuric acid (H
2SO
4) in the presence of a catalyst (selenium) until the solution became clear and colorless, converting the N into ammonium sulfate through steam generation. After digestion, the sample was cooled, diluted with distilled water, and neutralized with sodium hydroxide (NaOH). Ammonia (NH
3) was distilled into a known volume of standard hydrochloric acid (HCl). The distillate was then titrated with a standard NaOH solution to determine the ammonia content, from which the N content in the sample was calculated. The results were expressed as the percentage of N in the plant material.
2.11. Nitrogen Application and Irrigation Management
Urea (46% N) was used as the N fertilizer and applied in split doses according to the experimental treatments. Along with the first N dose (22 kg N ha−1), phosphorus (25 kg P ha−1) and potassium (52 kg K ha−1) were applied at sowing for all treatments. Phosphorus was supplied as single superphosphate (18% P2O5), and potassium was applied as sulfate of potash (50% K2O). For the remaining N, it was applied in split doses: for the N9 treatment, 23 kg N ha−1 was applied at the jointing stage and 45 kg N ha−1 at the flowering stage; for the 135 kg N ha−1 treatment, 56 kg N ha−1 and 57 kg N ha−1 were applied at the same stages, respectively. For higher N levels (180, 225, and 270 kg N ha−1), N was applied in three split doses at the jointing, flowering, and grain-filling stages. The N fertilizer was broadcast and incorporated into the soil through light irrigation. Irrigation was provided via a piped system, with the amount of water applied to each treatment plot recorded using a flow meter to ensure uniform distribution. The total irrigation water applied during each season (2015–2018) was 450 mm, 480 mm, and 500 mm, respectively. Rainfall during the growing period was also recorded using a rain gauge at the experimental site, with total seasonal rainfall of 40 mm, 38 mm, and 30 mm for each year, respectively.
The above-ground biomass yield (BY; t ha
−1) and wheat grain yield (GY; t ha
−1) were appraised during the crop harvest period. Wheat plants from a 1 m
2 area in each plot were harvested, air-dried, and then weighed to determine the biomass and grain yields. The harvest index (HI) was calculated as the ratio of GY to biomass yield. N content in wheat grain (kg N ha
−1) and total above-ground N content (kg N ha
−1) was determined using the Kjeldahl method [
35].
NUE was used to evaluate how effectively the applied N fertilizer was converted into GY. This study employed a unique method for calculating NUE, which compares the GY of fertilized plots to that of unfertilized plots. The difference method assumes that the yield from the unfertilized plots serves as a baseline for the N supplied by the soil and atmosphere.
2.12. Grain Yield and Yield-Related Parameters
The standard methods for determining the GY and related parameters were followed in this study, which are briefly described below:
GY was determined by harvesting the grains from a randomly selected one-square-meter area of each plot, drying them to a constant weight, and then weighing the harvested grains. The yield was expressed in kg ha
−1. In addition, BY was evaluated by gathering all plant material (grains, leaves, stems, and roots) from a randomly selected one-square-meter area at physiological maturity, drying the samples to constant weight, and weighing them. The biomass yield was then expressed in kg ha
−1. Moreover, the HI was calculated as the ratio of GY to total biomass yield, using the following formula:
Grain samples from a 1 m
2 area were milled solely for preparation prior to N analysis. The N content in both grain and straw was determined using the Kjeldahl method and expressed in g kg
−1. To calculate N uptake, the N content was multiplied by the corresponding grain or straw yield (t ha
−1), and the results were expressed in kg ha
−1. Moreover, the NHI was calculated as the proportion of total nitrogen accumulated in the grain (TNG) relative to the total nitrogen accumulated in the entire plant (TNG and total nitrogen in the straw (TNS) using the following formula:
2.13. Statistical Analysis
The effects of different N levels on various parameters were analyzed using descriptive statistics, and a two-way factorial analysis of variance (ANOVA) was performed to evaluate the effects of different treatments and growing seasons on the measured traits. The experimental design followed a randomized complete block design (RCBD) with three replications. The ANOVA model included three factors: treatment (seven levels: T0 to T6), year or growing season (three levels), and their interaction (treatment × year). This approach allowed for the assessment of both the main and interactive effects of treatments and seasons on morphological, physio-biochemical, and nutrient-related attributes. Statistical analyses were conducted using R software (version 4.3.1), employing functions from the agricolae package to perform ANOVA and calculating the mean sum of squares for each source of variation. PCA biplot analysis, heat maps, and histograms were created individually for each wheat growing season using R software (version 4.3.1) to determine the most effective treatments across the three consecutive wheat growing seasons for boosting wheat GY. Additionally, the multi-trait genotype ideotype distance index (MGIDI) was employed using R software for each growing season to elucidate the most effective treatment for gaining desired variations in physio-biochemical attributes and yield attributes. These visual statistical analyses, including PCA, heatmap, and MGIDI analysis, played a key role in interpreting the data and identifying the optimal N application rates that maximized wheat productivity and induced desired alterations in nutrients and physio-biochemical activities. The implementation of this statistical analysis, specifically MGIDI, assisted in elucidating the most effective N treatment for improving yield.
3. Results
3.1. Descriptive Statistics for Yield Parameters
To evaluate the effect of varying N doses on wheat growth, physio-biochemical responses, and yield-related traits, a comprehensive statistical analysis was carried out on the wheat variety Faisalabad-2008 over three consecutive growing seasons (2015–2018). The frequency distributions of the studied traits were illustrated through histograms for each season (
Supplementary Figures S1–S3), and ANOVA results confirmed significant effects of N fertilization on key physiological, morphological, biochemical, and yield-related parameters.
Among the treatments, the moderate N application (T
4) consistently resulted in the highest BY, GY, total nitrogen (TN), TNG, TNS, and NHI followed closely by T
3 and T
5. In contrast, the control treatment (T
0) exhibited the lowest values for all these yield attributes, highlighting the critical role of N in enhancing crop productivity (
Table 3a). The HI, which reflects the efficiency of assimilate partitioning, was also improved under moderate N levels, with the highest values recorded in T
3 and T
5. However, excessive N application (T
5 and T
6) led to a decline in both BY and GY, suggesting that over-fertilization may impair physiological processes and ultimately reduce crop performance.
Overall, an increasing trend in yield parameters was observed as N application increased up to a certain threshold (T
4), beyond which additional N had diminishing or negative returns. These findings underscore the importance of optimizing N input levels to achieve maximum wheat productivity without compromising physiological efficiency (
Table 3a).
3.2. Pigment Contents
Photosynthetic pigment concentrations in wheat leaves were significantly influenced by N fertilization. Consistent increases in Chl.a, Chl.b, total chlorophyll, and carotenoids were observed with rising N levels, particularly under moderate N treatments (T3 and T4), indicating enhanced photosynthetic capacity and improved light-harvesting efficiency.
In contrast, the control treatment (T
0), which received no nitrogen, exhibited the lowest pigment levels, highlighting the essential role of N in chlorophyll and carotenoid biosynthesis. Interestingly, at higher N levels (T
5 and T
6), pigment concentrations declined, suggesting that excessive nitrogen may negatively affect pigment accumulation, possibly due to oxidative stress or metabolic imbalances (
Table 3b).
These findings suggest that while moderate N input enhances pigment biosynthesis and supports optimal physiological performance, over-application may disrupt pigment stability and reduce photosynthetic efficiency. Thus, an optimal N range is critical not only for yield but also for maintaining healthy pigment profiles in wheat (
Table 3b).
3.3. Physio-Biochemical Parameters
N application had a pronounced impact on key physio-biochemical traits in wheat. TSP, TFA, and TSS all increased progressively with rising N application, reaching their peak under moderate N levels, particularly in treatment T4. This enhancement indicates improved nitrogen assimilation and carbohydrate metabolism under optimal nutrient conditions.
Similarly, gas exchange parameters, including Pn, E, and gs, followed a comparable trend. These physiological indicators were highest in moderately fertilized plants, reflecting enhanced photosynthetic activity and efficient gas exchange (
Table 3b).
However, treatments with excessive nitrogen (T5 and T6) observed a noticeable decline in biochemical and physiological parameters. This suggests that beyond a certain threshold, additional N no longer benefits plant metabolism and may even disrupt physiological homeostasis, possibly due to nutrient imbalances or stress-related feedback mechanisms.
These findings highlight the critical role of optimized N levels in supporting metabolic efficiency and physiological performance in wheat, while cautioning against the detrimental effects of over-fertilization (
Table 3c).
3.4. Nutrient Contents
N fertilization significantly influenced the accumulation of essential nutrients such as Ca, P, K, and Mg in wheat leaves. A clear upward trend in nutrient concentrations was observed from the control treatment (T
0) to moderate N applications, with the highest levels recorded in T
4. This suggests that adequate nitrogen enhances root activity and nutrient uptake efficiency, likely by stimulating overall plant metabolism (
Table 3d).
Treatments T3 and T4, representing moderate N inputs, consistently supported optimal nutrient accumulation, whereas nutrient levels were markedly lower in the unfertilized control plants. However, further increases in N beyond T4 (i.e., in T5 and T6) did not lead to further improvement. In fact, a decline in nutrient concentrations was observed at these higher levels, indicating that excessive nitrogen may disrupt nutrient balance or compete with other ions for uptake.
Table 3.
(a) Descriptive statistics and analysis of variance for studied yield-related attributes under control T0 (N0 Kg ha−1), T1 (N45 Kg ha−1), T2 (N90 Kg ha−1), T3 (N135 Kg ha−1), T4 (N180 Kg ha−1), T5 (N225 Kg ha−1), and T6 (N270 Kg ha−1) nitrogen dose-based treatments across three consecutive growing season field trials from 2015 to 2018. The following traits were assessed: biomass yield (BY), grain yield (GY), harvest index (HI), nitrogen content in grains (Ng) and straw (Ns), total nitrogen in grains (TNG) and straw (TNS), nitrogen harvest index (NHI), chlorophyll a (Chl.a), chlorophyll b (Chl.b), total chlorophyll (T.chl), carotenoid content (Car), total soluble proteins (TSP), total free amino acids (TFA), total soluble sugars (TSS), photosynthetic rate (Pn), transpiration rate (E), stomatal conductance (gs), and the concentrations of calcium (Ca), phosphorus (P), potassium (K), and magnesium (Mg). The analysis also considered the effects of year (Y) and the year × treatment interaction (Y × T). (b) Descriptive statistics and analysis of variance for studied pigment contents under control T0 (N0 Kg ha−1), T1 (N45 Kg ha−1), T2 (N90 Kg ha−1), T3 (N135 Kg ha−1), T4 (N180 Kg ha−1), T5 (N225 Kg ha−1), and T6 (N270 Kg ha−1) nitrogen dose-based treatments across three consecutive growing season field trials from 2015 to 2018. (c) Descriptive statistics and analysis of variance were performed on the physio-biochemical attributes under seven nitrogen dose-based treatments: control (T0, N0 kg ha−1), T1 (N45 kg ha−1), T2 (N90 kg ha−1), T3 (N135 kg ha−1), T4 (N180 kg ha−1), T5 (N225 kg ha−1), and T6 (N270 kg ha−1). These treatments were applied across three consecutive growing seasons in field trials from 2015 to 2018. (d) Descriptive statistics and analysis of variance were also conducted for the nutrient contents under the same treatments, covering the same field trials.
| (a) |
|---|
| | T0 | T1 | T2 | T3 | T4 | T5 | T6 | | Mean Sum of Squares (MSS) |
|---|
| Traits | Mean ± SE | Range | Mean ± SE | Range | Mean ± SE | Range | Mean ± SE | Range | Mean ± SE | Range | Mean ± SE | Range | Mean ± SE | Range | Block | Y | T | Y × T | Error |
|---|
| | | | | | | | | | | | | | | | (df: 2) | (df: 6) | (df: 2) | (df: 12) | (df: 40) |
| BY (Ton ha−1) | 5.5 ± 0.2 | 4.5–6.6 | 8.7 ± 0.5 | 6.9–11.7 | 9.91 ± 0.42 | 8.5–11.2 | 15.02 ± 0.2 | 13.9–16.0 | 15.34 ± 0.2 | 13.6–16.7 | 14.9 ± 0.37 | 12.7–16.5 | 13.28 ± 0.4 | 11.8–15.1 | 6.3 | 8.61 | 126.52 | 2.2 | 0.4 |
| GY (Ton ha−1) | 1.5 ± 0.1 | 1.1–2.2 | 3.0 ± 0.2 | 2.4–3.8 | 4.2 ± 0.21 | 3.5–4.8 | 6.76 ± 0.10 | 6.3–7.2 | 6.8 ± 0.08 | 6.4–7.1 | 6.6 ± 0.11 | 5.9–6.90 | 5.5 ± 0.14 | 4.8–6.1 | 1.15 | 1.72 | 38.23 | 0.11 | 0.04 |
| HI (%) | 28. ± 2.8 | 21.1–4 | 34.8 ± 0.8 | 30.9–39.01 | 42.1 ± 1.80 | 37.1–47.8 | 45.07 ± 0.9 | 42.1–49.6 | 44.3 ± 0.6 | 41.2–47.1 | 44.5 ± 1.15 | 41.2–52.91 | 42.1 ± 1.1 | 38.4–49.8 | 1.44 | 93.87 | 356.55 | 52.87 | 5.9 |
| NG (Kg ha−1) | 1.5 ± 0.02 | 1.4–1.6 | 1.7 ± 0.02 | 1.6–1.8 | 1.9 ± 0.04 | 1.8–2.0 | 2.28 ± 0.02 | 2.2–2.4 | 2.4 ± 0.04 | 2.2–2.5 | 2.2 ± 0.02 | 2.1–2.31 | 2.02 ± 0.02 | 1.9–2.1 | 0.008 | 0.12 | 0.91 | 0.002 | 0.001 |
| NS (Kg ha−1) | 0.3 ± 0.01 | 0.3–0.3 | 0.4 ± 0.02 | 0.3–0.4 | 0.5 ± 0.02 | 0.4–0.5 | 0.56 ± 0.02 | 0.5–0.6 | 0.5 ± 0.01 | 0.5–0.6 | 0.5 ± 0.01 | 0.5–0.60 | 0.5 ± 0.01 | 0.5–0.6 | 0.004 | 0.008 | 0.07 | 0.002 | 0.001 |
| TNG (Kg ha−1) | 22.6 ± 1.9 | 17.6–32.8 | 52.07 ± 2.7 | 43.5–65.7 | 77.08 ± 2.9 | 67.6–85 | 153.27 ± 2.6 | 138–165.8 | 160.9 ± 2.9 | 142.7–169.2 | 142.9 ± 3.3 | 127.7–154.4 | 112.5 ± 3.06 | 93.6–123.9 | 623.1 | 688 | 25694.4 | 49.1 | 18.2 |
| TNS (Kg ha−1) | 11.8 ± 0.7 | 8.1–14.6 | 20.9 ± 1.8 | 13.4–3 | 27.6 ± 2.62 | 18.5–3 | 44.89 ± 1.46 | 38.5–50.6 | 45.4 ± 1.8 | 38.9–56.9 | 43.6 ± 1.97 | 30.4–50.40 | 39.8 ± 1.7 | 30.9–47.4 | 85.5 | 216.9 | 1573 | 37.1 | 13.5 |
| TN (Kg ha−1) | 34.3 ± 1.5 | 29.3–43.9 | 73.04 ± 4.3 | 56.9–96.4 | 104.7 ± 4.0 | 88.5–116.1 | 198.2 ± 3.1 | 182.7–209.3 | 206.3 ± 4.5 | 181.6–22 | 186.6 ± 4.4 | 171.1–203.4 | 152.4 ± 4.1 | 129.1–168.1 | 1166.3 | 1519.3 | 39774.8 | 116.4 | 28.8 |
| NHI (%) | 65.0 ± 2.9 | 57.7–77.9 | 71.5 ± 1.1 | 66.5–76.4 | 73.8 ± 1.70 | 68.7–8 | 77.3 ± 0.63 | 75.3–79.8 | 78.03 ± 0.5 | 74.8–79.20 | 76.6 ± 0.79 | 74.4–82.31 | 73.9 ± 0.76 | 70.9–79.1 | 2.37 | 57.16 | 182.91 | 53.26 | 5.01 |
| (b) |
| | T0 | T1 | T2 | T3 | T4 | T5 | T6 | | Mean Sum of Squares (MSS) |
| Traits | Mean ± SE | Range | Mean ± SE | Range | Mean ± SE | Range | Mean ± SE | Range | Mean ± SE | Range | Mean ± SE | Range | Mean ± SE | Range | Block | Y | T | Y × T | Error |
| | | | | | | | | | | | | | | | (df: 2) | (df: 6) | (df: 2) | (df: 12) | (df: 40) |
| Chl.a (mg/g FW) | 0.4 ± 0.01 | 0.3–0.4 | 0.4 ± 0.06 | 0.4–0.5 | 0.5 ± 0.01 | 0.4–0.512 | 0.57 ± 0.05 | 0.5–0.6 | 0.6 ± 0.03 | 0.6–0.61 | 0.5 ± 0.54 | 0.5–0.60 | 0.5 ± 0.07 | 0.5–0.5 | 0.0005 | 0.01 | 0.0655 | 0.0006 | 0.0002 |
| Chl.b (mg/g FW) | 0.3 ± 0.06 | 0.2–0.3 | 0.3 ± 0.07 | 0.3–0.3 | 0.3 ± 0.04 | 0.3–0.34 | 0.42 ± 0.03 | 0.4–0.6 | 0.4 ± 0.04 | 0.4–0.40 | 0.4 ± 0.24 | 0.3–0.40 | 0.3 ± 0.03 | 0.3–0.36 | 0.0009 | 0.0007 | 0.0332 | 0.0017 | 0.0015 |
| T.chl (mg/g FW) | 0.6 ± 0.02 | 0.5–0.7 | 0.7 ± 0.01 | 0.7–0.8 | 0.8 ± 0.02 | 0.7–0.854 | 0.99 ± 0.03 | 0.9–1.2 | 1.03 ± 0.02 | 0.9–1.08 | 0.9 ± 0.01 | 0.8–0.91 | 0.9 ± 0.01 | 0.8–0.9 | 0.0002 | 0.01 | 0.1896 | 0.0024 | 0.002 |
| Car (mg/g FW) | 1.5 ± 0.03 | 1.4–1.7 | 1.8 ± 0.03 | 1.7–1.9 | 2.2 ± 0.02 | 2.1–2.25 | 2.59 ± 0.02 | 2.5–2.7 | 2.7 ± 0.03 | 2.6–2.89 | 2.5 ± 0.04 | 2.3–2.65 | 2.4 ± 0.03 | 2.3–2.5 | 0.0044 | 0.12 | 1.6102 | 0.0096 | 0.0027 |
| (c) |
| | T0 | T1 | T2 | T3 | T4 | T5 | T6 | | Mean Sum of Squares (MSS) |
| Traits | Mean ± SE | Range | Mean ± SE | Range | Mean ± SE | Range | Mean ± SE | Range | Mean ± SE | Range | Mean ± SE | Range | Mean ± SE | Range | Block | Y | T | Y × T | Error |
| | | | | | | | | | | | | | | | (df: 2) | (df: 6) | (df: 2) | (df: 12) | (df: 40) |
| TSP (mg/g FW) | 11.7 ± 0.5 | 9.8–13.6 | 14.3 ± 0.1 | 13.8–14.6 | 15.1 ± 0.3 | 14.4–15 | 18.38 ± 0.3 | 17.3–19.8 | 20.03 ± 0.3 | 19–22.2 | 18.03 ± 0.2 | 17.4–18.9 | 17.0 ± 0.3 | 15.6–18.6 | 0.39 | 10.59 | 72.11 | 0.84 | 0.24 |
| TFA (mg/g FW) | 6.7 ± 0.3 | 5.6–7.9 | 7.7 ± 0.12 | 7.2–8.2 | 8.4 ± 0.2 | 8–9.1 | 10.15 ± 0.1 | 9.5–11.1 | 10.8 ± 0.2 | 10.1–11.8 | 9.6 ± 0.2 | 8.9–10.5 | 9.01 ± 0.2 | 8.1–9.6 | 0.15 | 5.25 | 18.10 | 0.40 | 0.05 |
| TSS (mg/g FW) | 2.9 ± 0.1 | 2.6–3.5 | 3.3 ± 0.06 | 3.1–3.6 | 3.5 ± 0.1 | 3.3–3.9 | 4.50 ± 0.06 | 4.2–4.7 | 4.8 ± 0.1 | 4.5–5.3 | 4.3 ± 0.06 | 4–4.52 | 4.1 ± 0.08 | 3.8–4.5 | 0.04 | 0.69 | 4.367 | 0.05 | 0.02 |
| Pn (µmol m−2 s−1) | 16.7 ± 0.4 | 14.8–18.5 | 17.9 ± 0.3 | 17–18.8 | 18.7 ± 0.25 | 17.9–19.5 | 20.52 ± 0.3 | 19–21.6 | 21.3 ± 0.2 | 20.6–22.2 | 19.9 ± 0.2 | 19–21.2 | 19.1 ± 0.2 | 18.1–19.9 | 0.003 | 7.38 | 22.13 | 1.08 | 0.16 |
| E (mmol m−2 s−1) | 4.8 ± 0.13 | 4.3–5.4 | 5.4 ± 0.06 | 5.2–5.8 | 5.6 ± 0.1 | 5.2–5.9 | 6.54 ± 0.09 | 6.2–6.9 | 6.8 ± 0.15 | 6.1–7.5 | 6.4 ± 0.07 | 6.1–6.7 | 6.08 ± 0.1 | 5.5–6.4 | 0.05 | 1.01 | 4.73 | 0.12 | 0.04 |
| Gs (mmol m−2 s−1) | 0.4 ± 0.02 | 0.4–0.6 | 0.5 ± 0.02 | 0.5–0.6 | 0.6 ± 0.01 | 0.5–0.5 | 0.67 ± 0.01 | 0.6–0.7 | 0.7 ± 0.02 | 0.6–0.7 | 0.6 ± 0.3 | 0.6–0.68 | 0.5 ± 0.02 | 0.5–0.6 | 0.006 | 0.01 | 0.05 | 0.003 | 0.001 |
| (d) |
| | T0 | T1 | T2 | T3 | T4 | T5 | T6 | | Mean Sum of Squares (MSS) |
| Traits | Mean ± SE | Range | Mean ± SE | Range | Mean ± SE | Range | Mean ± SE | Range | Mean ± SE | Range | Mean ± SE | Range | Mean ± SE | Range | Block | Y | T | Y × T | Error |
| | | | | | | | | | | | | | | | (df: 2) | (df: 6) | (df: 2) | (df: 12) | (df: 40) |
| Ca (mg/g DW) | 2.2 ± 0.14 | 1.72–2.8 | 2.9 ± 0.14 | 2.3–3.5 | 3.1 ± 0.2 | 2.6–3.6 | 4.45 ± 0.2 | 3.8–5.3 | 4.68 ± 0.2 | 3.9–5.6 | 4.29 ± 0.2 | 3.8–5.2 | 4.00 ± 0.1 | 3.63–4.5 | 0.03 | 4.97 | 7.5 | 0.4 | 0.013 |
| P (mg/g DW) | 1.5 ± 0.06 | 1.2–1.7 | 1.89 ± 0.05 | 1.7–2.1 | 1.9 ± 0.03 | 1.8–1.9 | 2.36 ± 0.05 | 2.1625–2.6 | 2.5 ± 0.07 | 2.1–2.7 | 2.4 ± 0.06 | 2.2–2.7 | 2.26 ± 0.08 | 1.95–2.6 | 0.001 | 0.52 | 1.14 | 0.04 | 0.009 |
| K (mg/g DW) | 8.2 ± 0.3 | 7.2–9.2 | 11.6 ± 0.3 | 10.2–13.1 | 12.5 ± 0.3 | 11.5–13.6 | 15.26 ± 0.3 | 14–16.6 | 15.8 ± 0.4 | 14.2–17.2 | 15.8 ± 0.4 | 14.6–17.8 | 15.3 ± 0.4 | 14–17.5 | 0.62 | 14.04 | 74.3 | 1.4 | 0.29 |
| Mg (mg/g DW) | 0.7 ± 0.04 | 0.65–0.9 | 0.9 ± 0.05 | 0.725–1.2 | 1.04 ± 0.07 | 0.85–1.2 | 1.50 ± 0.07 | 1.25–1.8 | 1.58 ± 0.07 | 1.36–1.8 | 1.45 ± 0.06 | 1.24–1.8 | 1.36 ± 0.04 | 1.22–1.5 | 0.01 | 0.54 | 0.86 | 0.03 | 0.002 |
These results support the conclusion that moderate nitrogen application not only enhances photosynthetic and metabolic functions but also promotes more efficient nutrient absorption and utilization, whereas over-fertilization may negatively impact nutrient dynamics in wheat (
Table 3c).
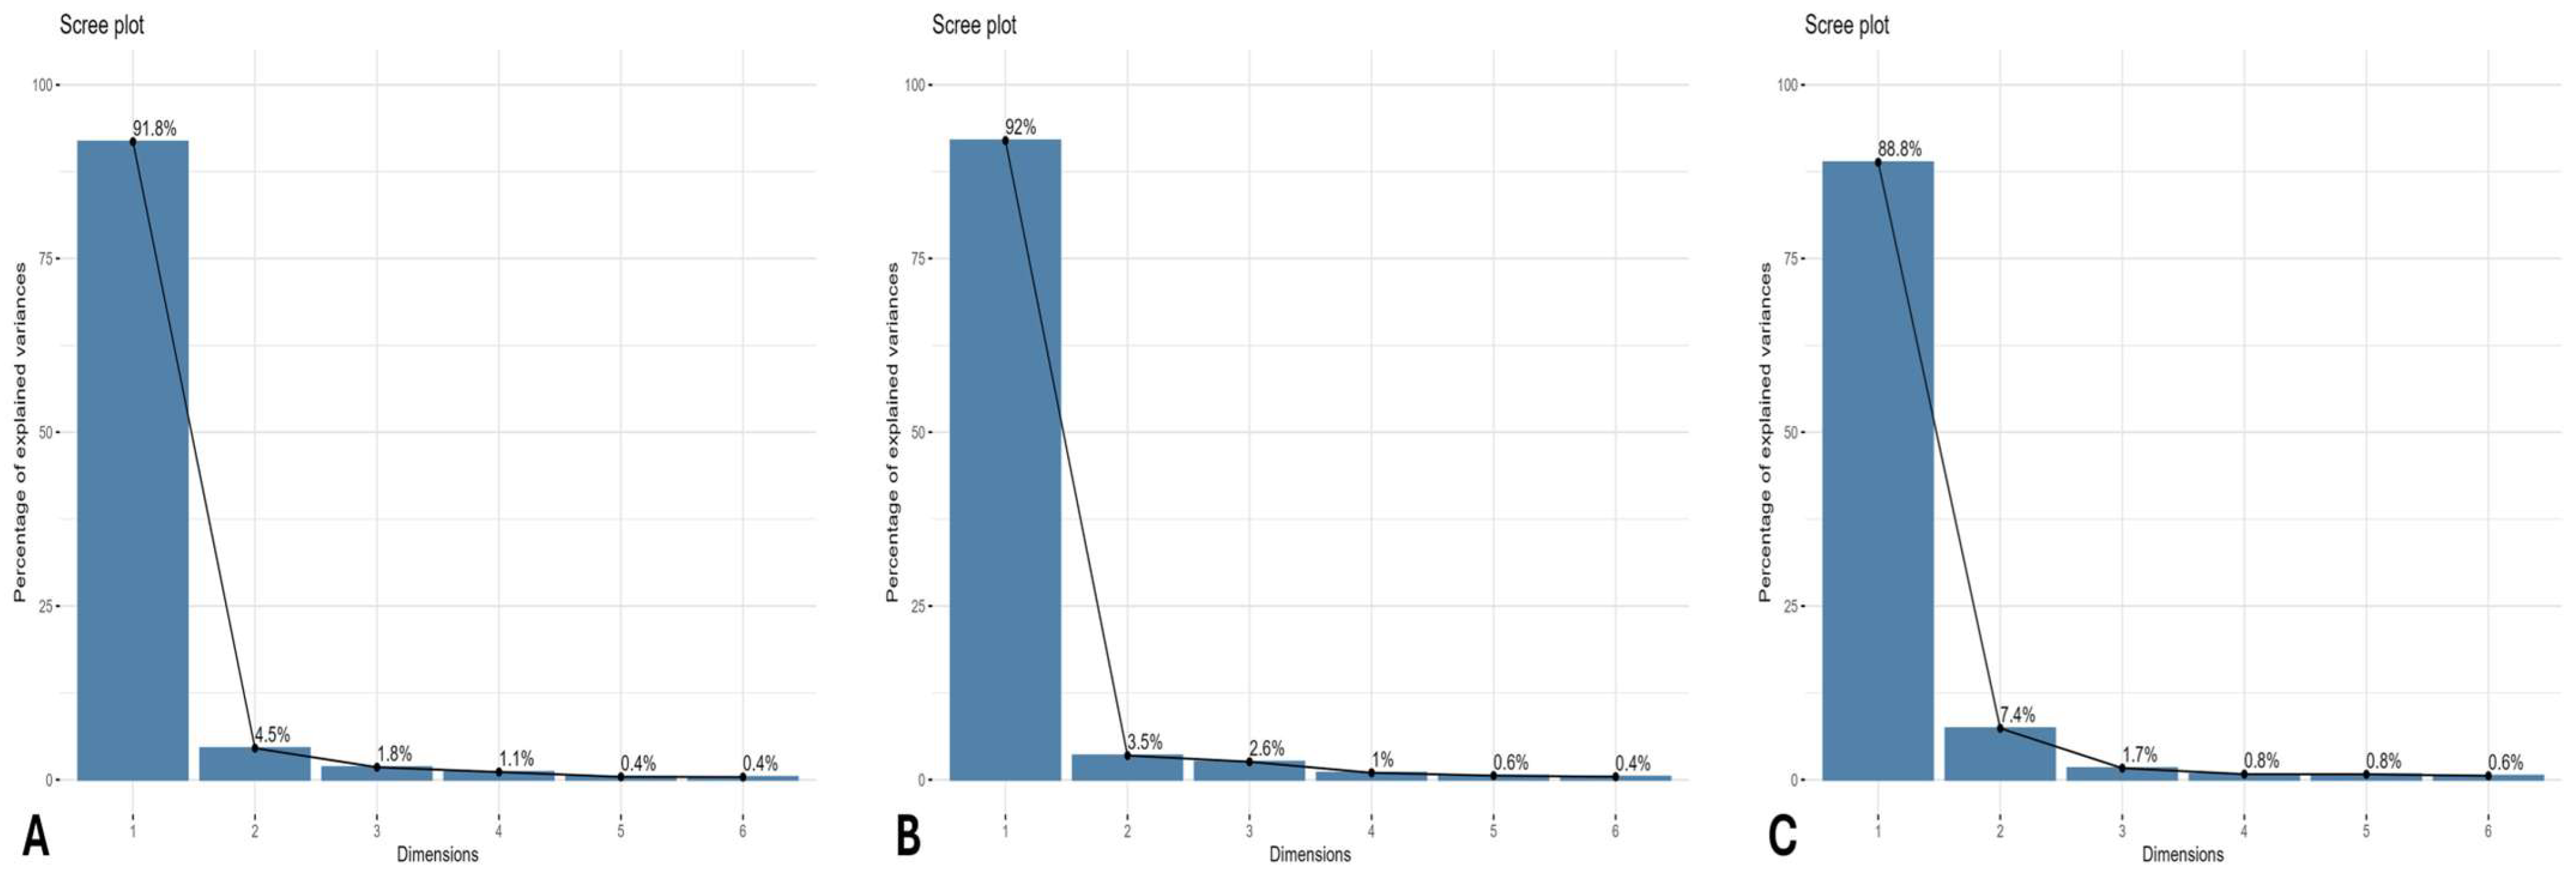
3.5. Principal Component Analysis
PCA was conducted for each wheat growing season (2015–2018) across all the analyzed traits. Additionally, the scree plot was used to evaluate the contribution of individual PCs to the total explained variability (
Figure 2). Biplot analyses were performed using the first two principal components (PCs), as they explained the majority of the cumulative variability. The longer vector lengths from the centroid to the peripheral regions in the PCA biplot indicate stronger coordination among traits and treatments that are positioned closely together. Vectors forming angles less than 90 degrees represent a synergistic, positive association, whereas those diverging at angles greater than 90 degrees and positioned in opposite quadrants reflect antagonistic relationships among the corresponding attributes. The PCA biplot was generated separately for each growing season, based on the first two PCs, which were selected due to their eigenvalues exceeding unity and their substantial contribution to the cumulative variance. This approach facilitates the identification of variability among the studied traits in response to seven different treatments applied across three wheat-growing seasons (
Figure 3).
In the first growing season (2015–2016), PC-1 accounted for 91.8% of the cumulative variability, while PC-2 contributed 4.5%. Among the studied traits, TNG, Pn, TSP, total chlorophyll, TSS, and TFA showed the highest variability with the 180 kg N ha
−1 treatment (T
4) owing to their vectors lying in a similar direction and showcasing a coherent positive relationship with each other. Additionally, treatments T
3 (135 kg N ha
−1) and T
5 (225 kg N ha
−1) exhibited a positive variability interaction with Mg, TNS, and BY (
Figure 2A).
For the second growing season (2016–2017), PC-1 contributed 92% of the cumulative variability, while PC-2 explained 3.5%. N doses T3 and T4 showed a strong positive association with key traits due to a less than 90-degree angle among vectors, such as NG, BY, TNS, TSS, Ca, Mg, and TFA. In contrast, treatments T0 (0 kg ha−1), T1 (45 kg ha−1), and T2 (90 kg ha−1) did not demonstrate substantial interaction with the analyzed traits.
Similarly, in the third growing season (2017–2018), treatments T3 and T4 again emerged as the most effective, showing positive associations with vital traits such as TNG, TSP, TSS, Ca, Mg, Chl.a, and Chl.b. In this season, PC-1 accounted for 88.8% of the cumulative variability, while PC-2 contributed 7.4%.
3.6. Heatmap Analysis
For better understanding the positive and negative interactions of the analyzed traits with the seven different treatments imposed, heatmap analysis was conducted separately for each wheat growing season. For all three growing seasons (2015–2018), the treatments were grouped into two distinct clusters: (T3, T4, T5, T6) and (T0, T1, T2).
In the first growing season (2015–2016), treatments T
3 and T
4 exhibited a strong positive correlation with key attributes such as TSS, TFA, BY, GY, Pn, and NHI. In contrast, T
5 and T
6 showed only a weak positive association with these parameters. Treatments T
0 and T
1, however, were negatively correlated with yield and various physio-biochemical attributes (
Figure 4A).
In the second growing season (2016–2017), T
3 and T
4 again demonstrated a strong positive interaction with all the studied parameters. T
5 and T
6 maintained a weak positive correlation with essential traits. On the other hand, T
0 and T
1 showed a strong negative relationship with all traits, while T
2 surprisingly had a positive association with NHI, HI, and gs (
Figure 4B).
In the third growing season (2017–2018), T
3 and T
4 continued to be the most beneficial treatments for enhancing both yield and physio-biochemical attributes. However, the higher N dose (T
6) exhibited a negative interaction with NHI and Chl.b. In the second cluster, T
0 and T
1 displayed a strong negative correlation with all traits, while T
2 showed a weak negative association with most attributes, except for NS concentration (
Figure 4C).
In summary, treatment T
4 proved to be the most effective in improving crop yield and physio-biochemical activities, closely followed by T
3, while T
0 consistently showed a strong negative interaction with all the traits analyzed (
Figure 4).
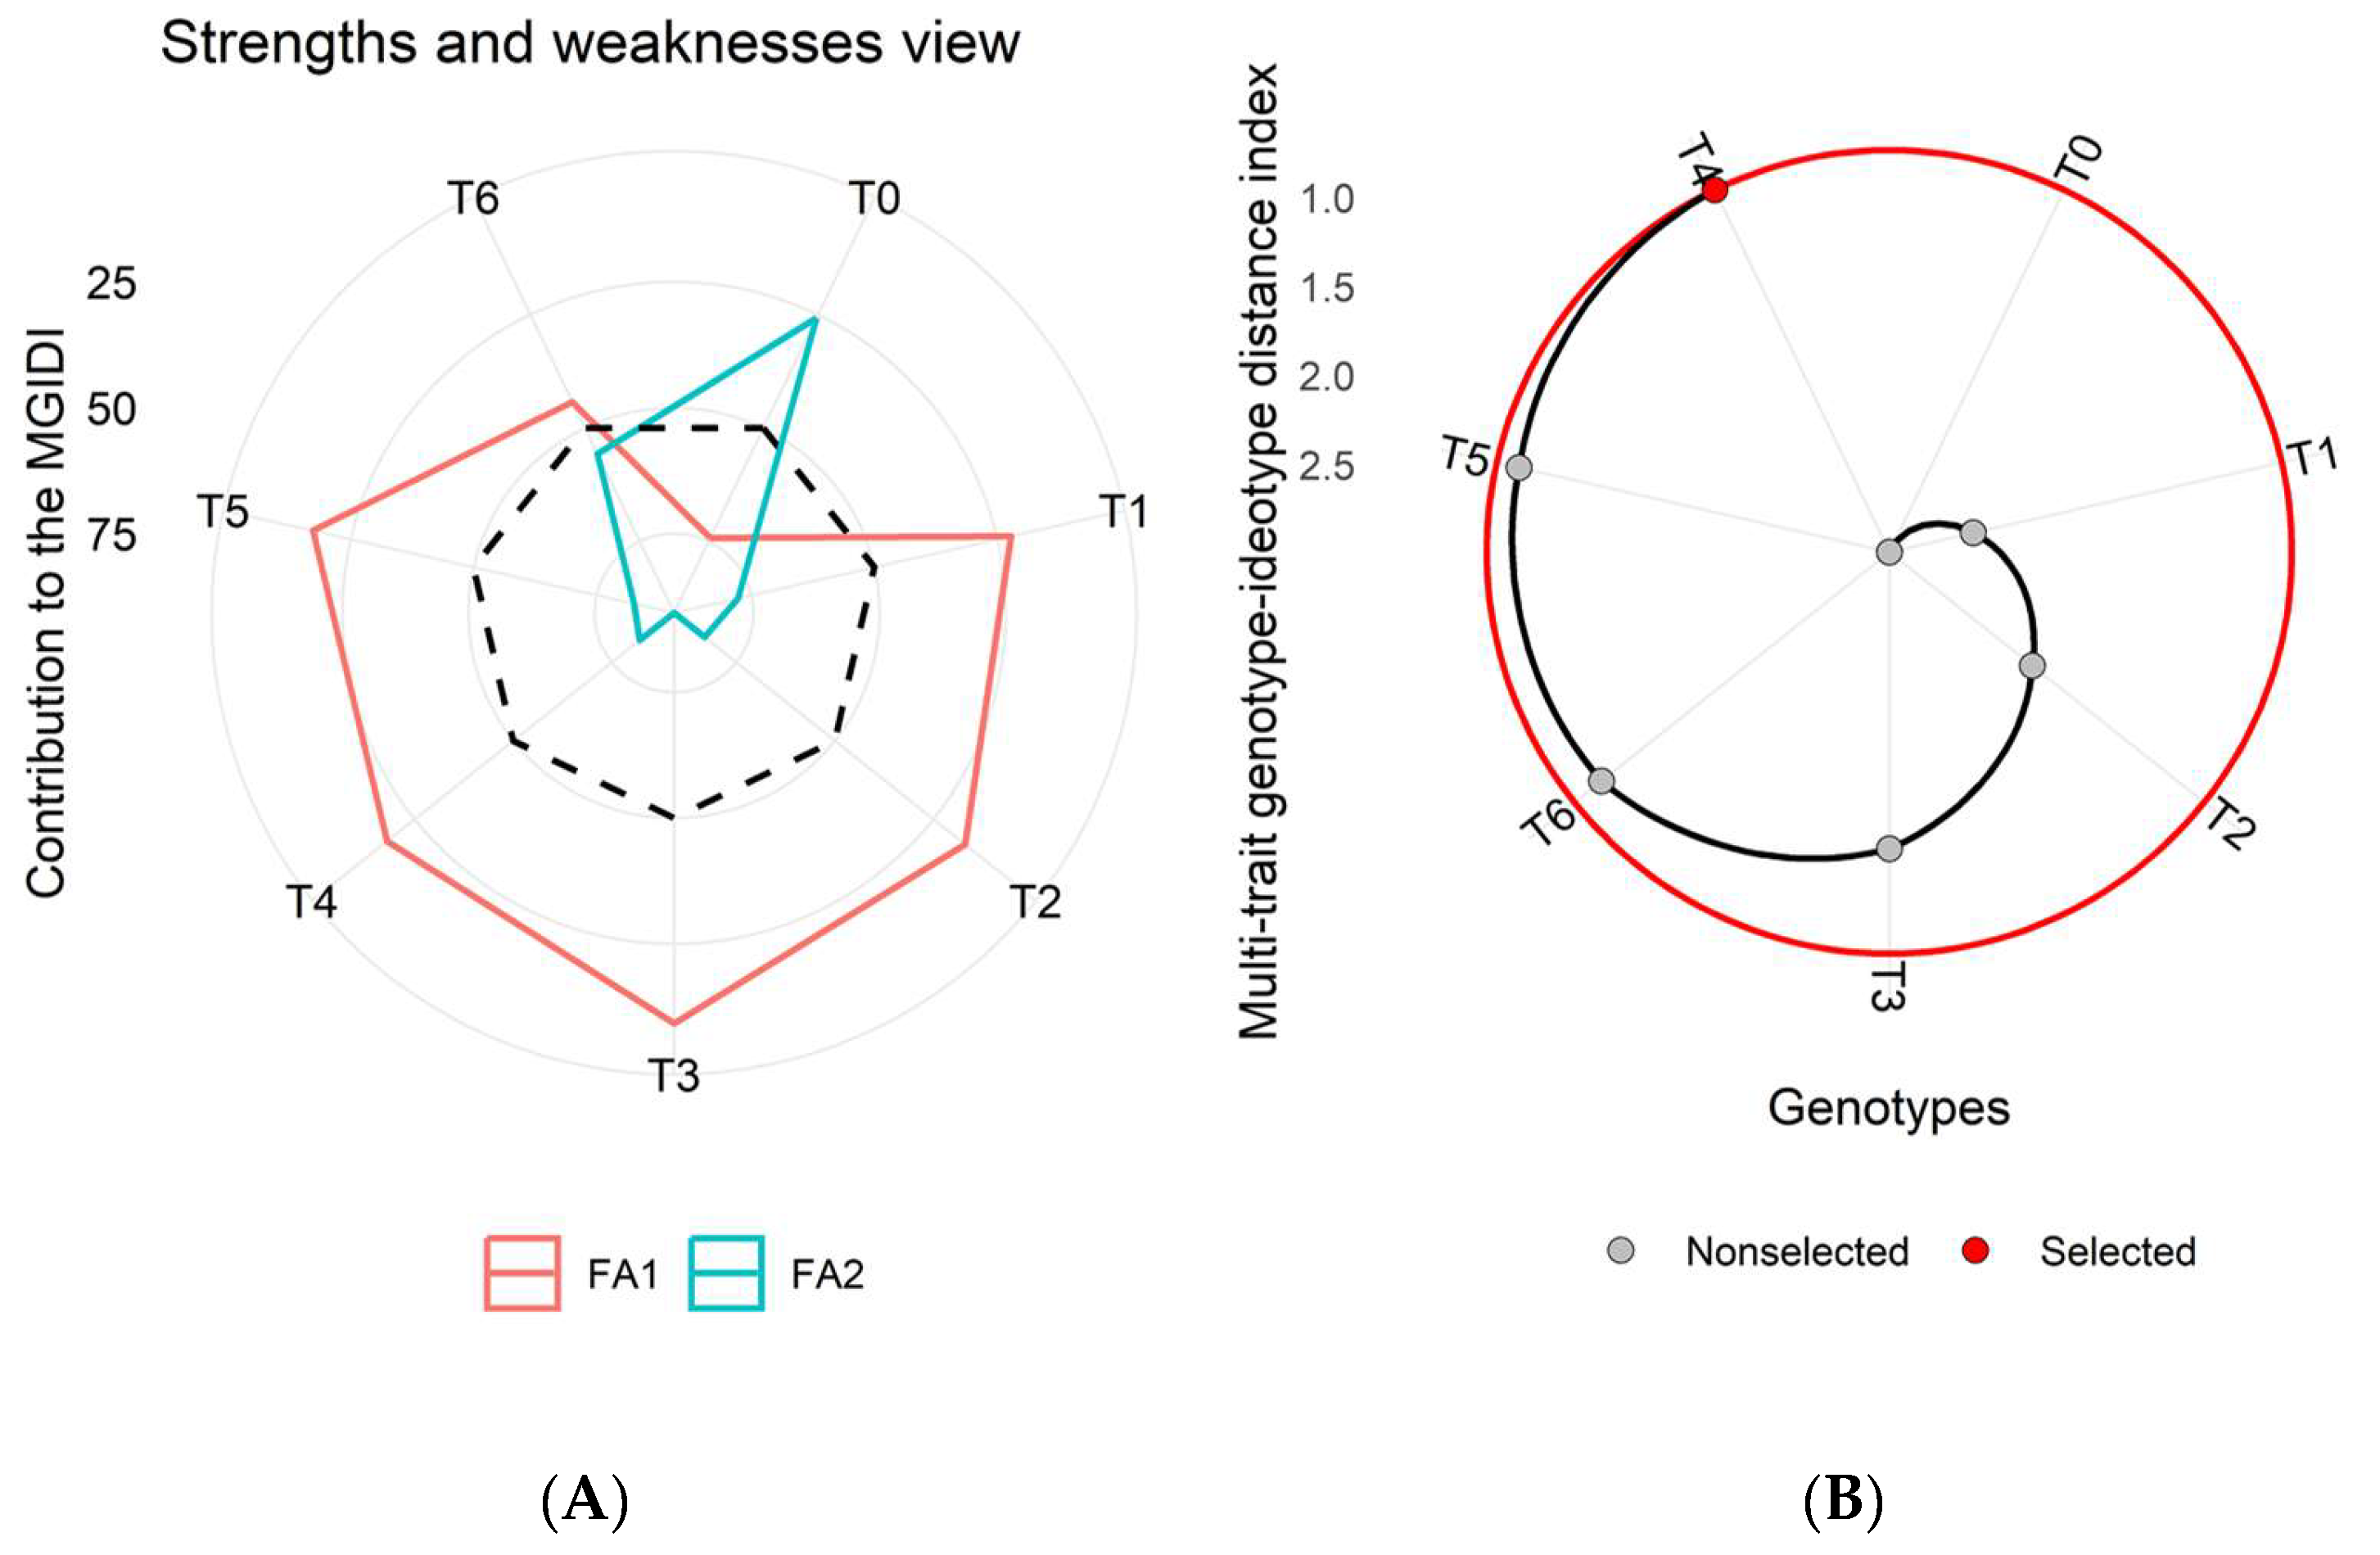
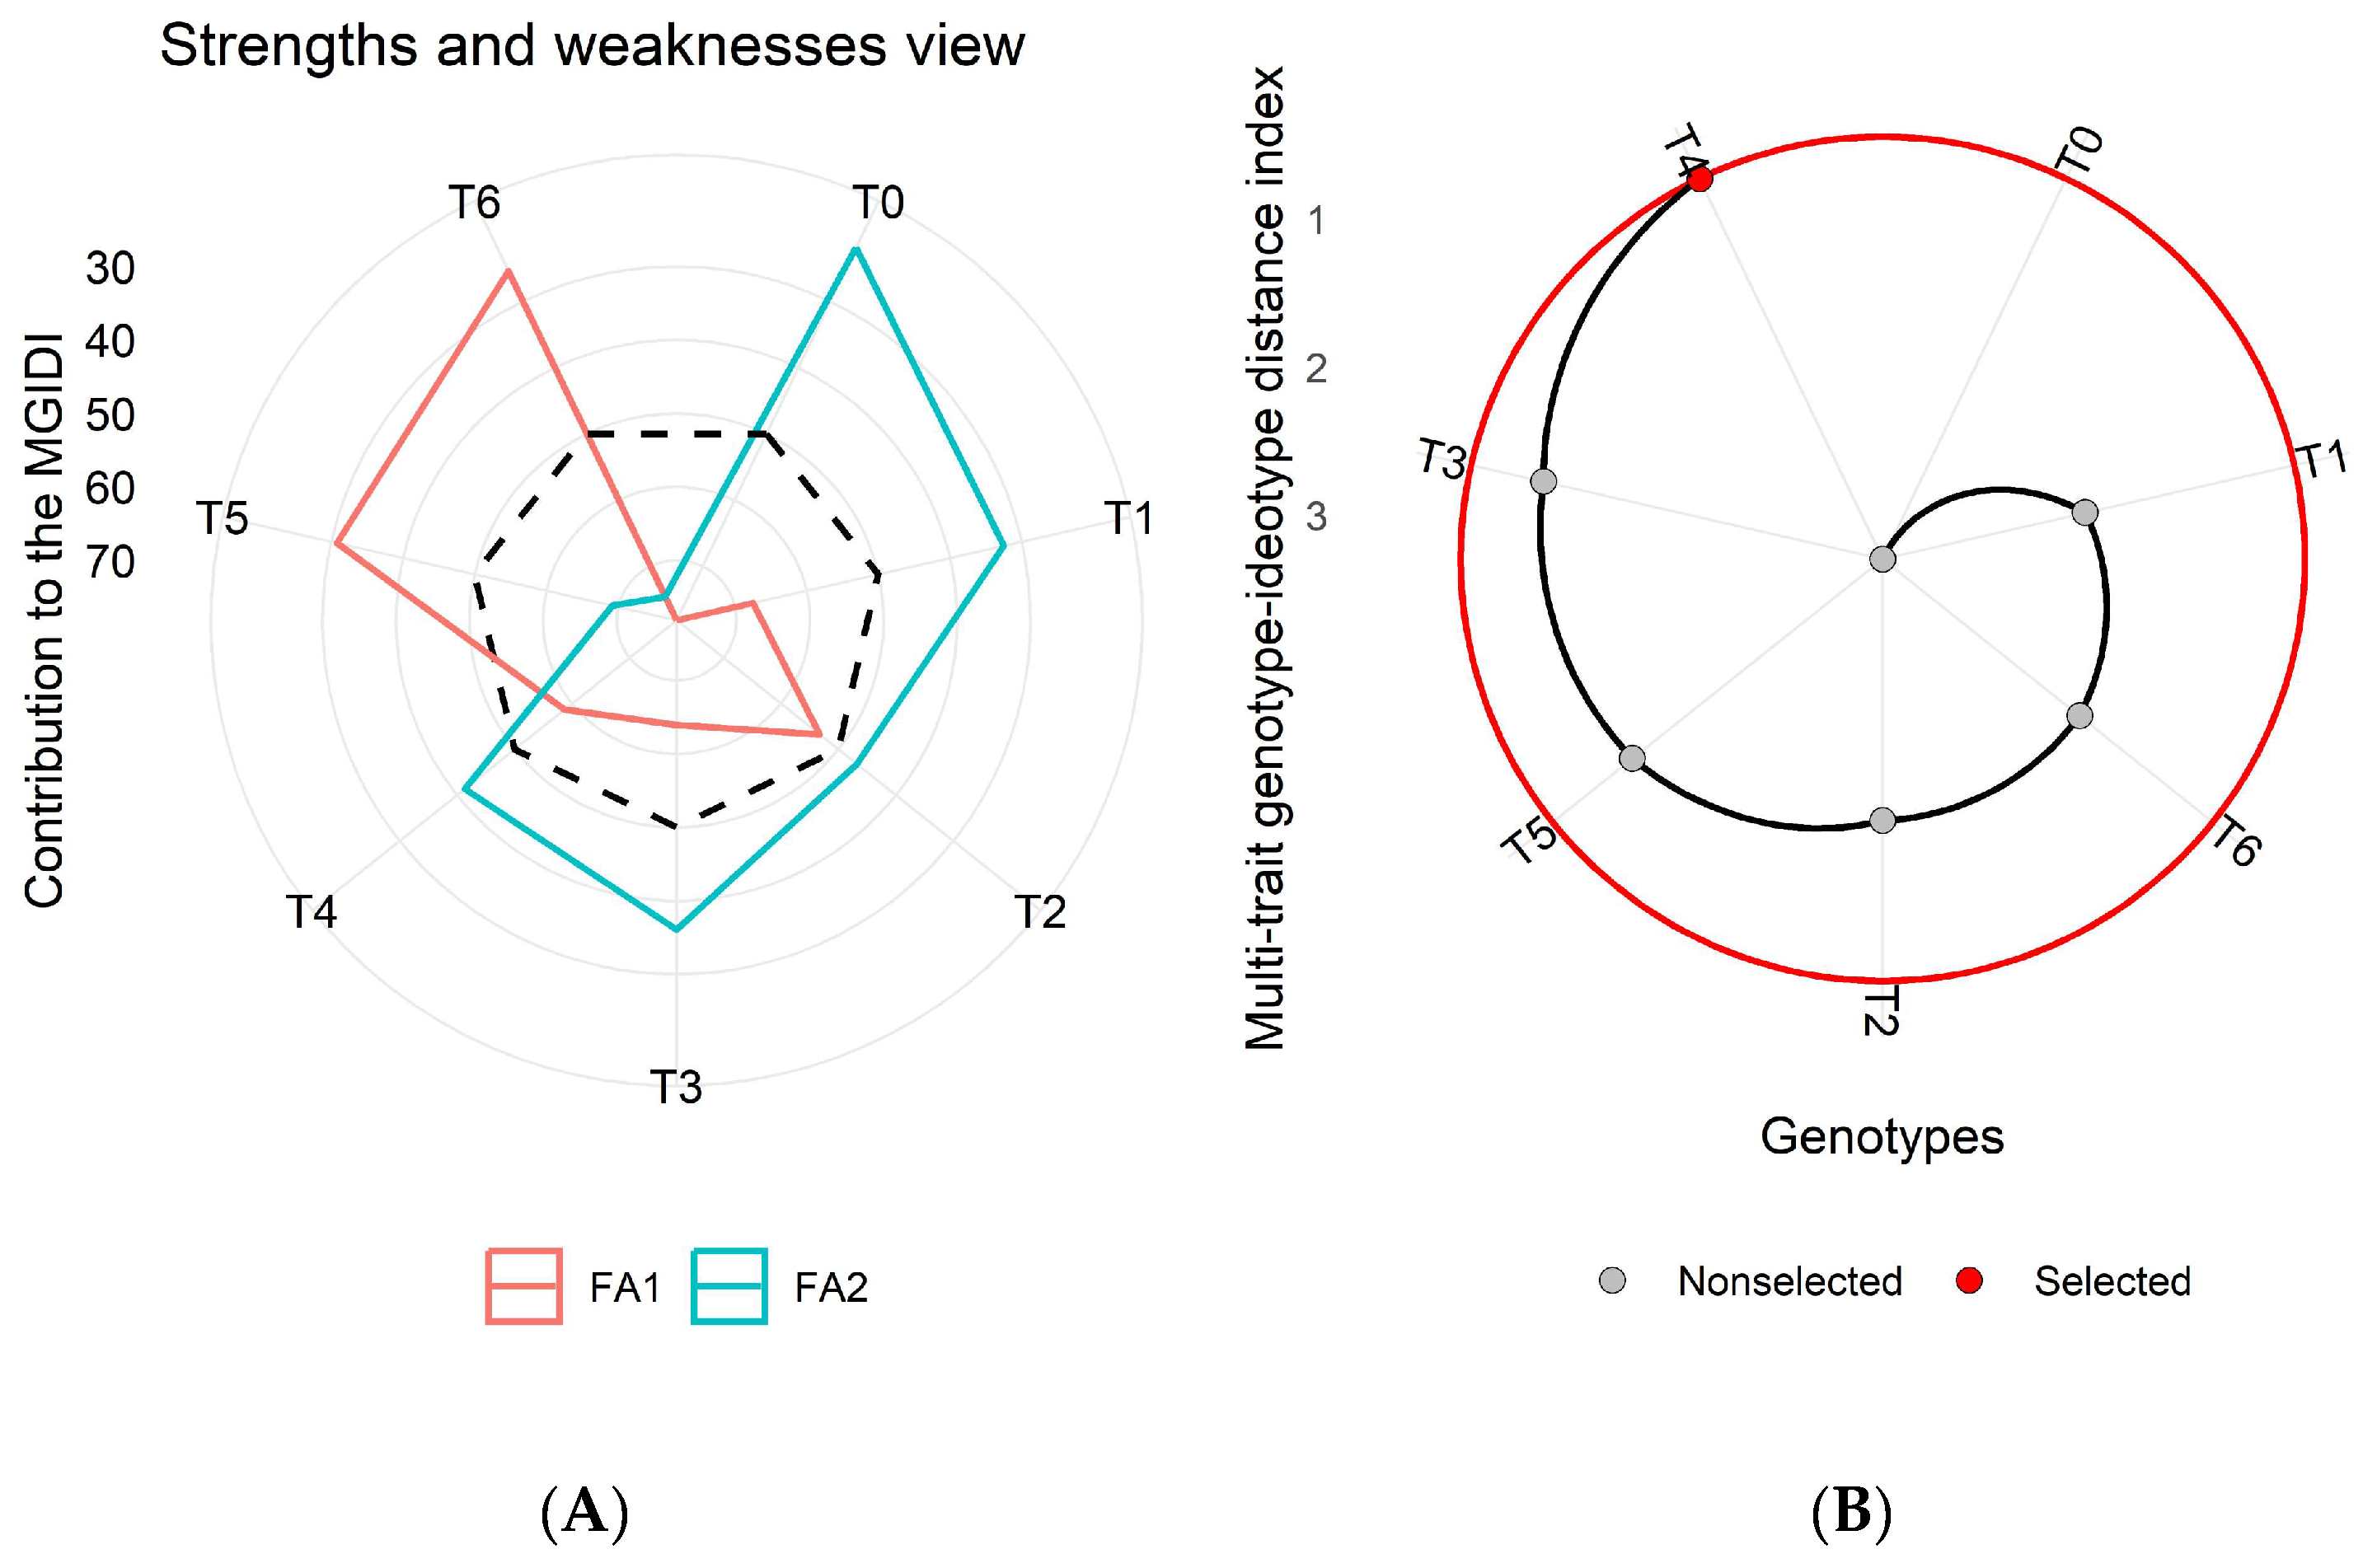
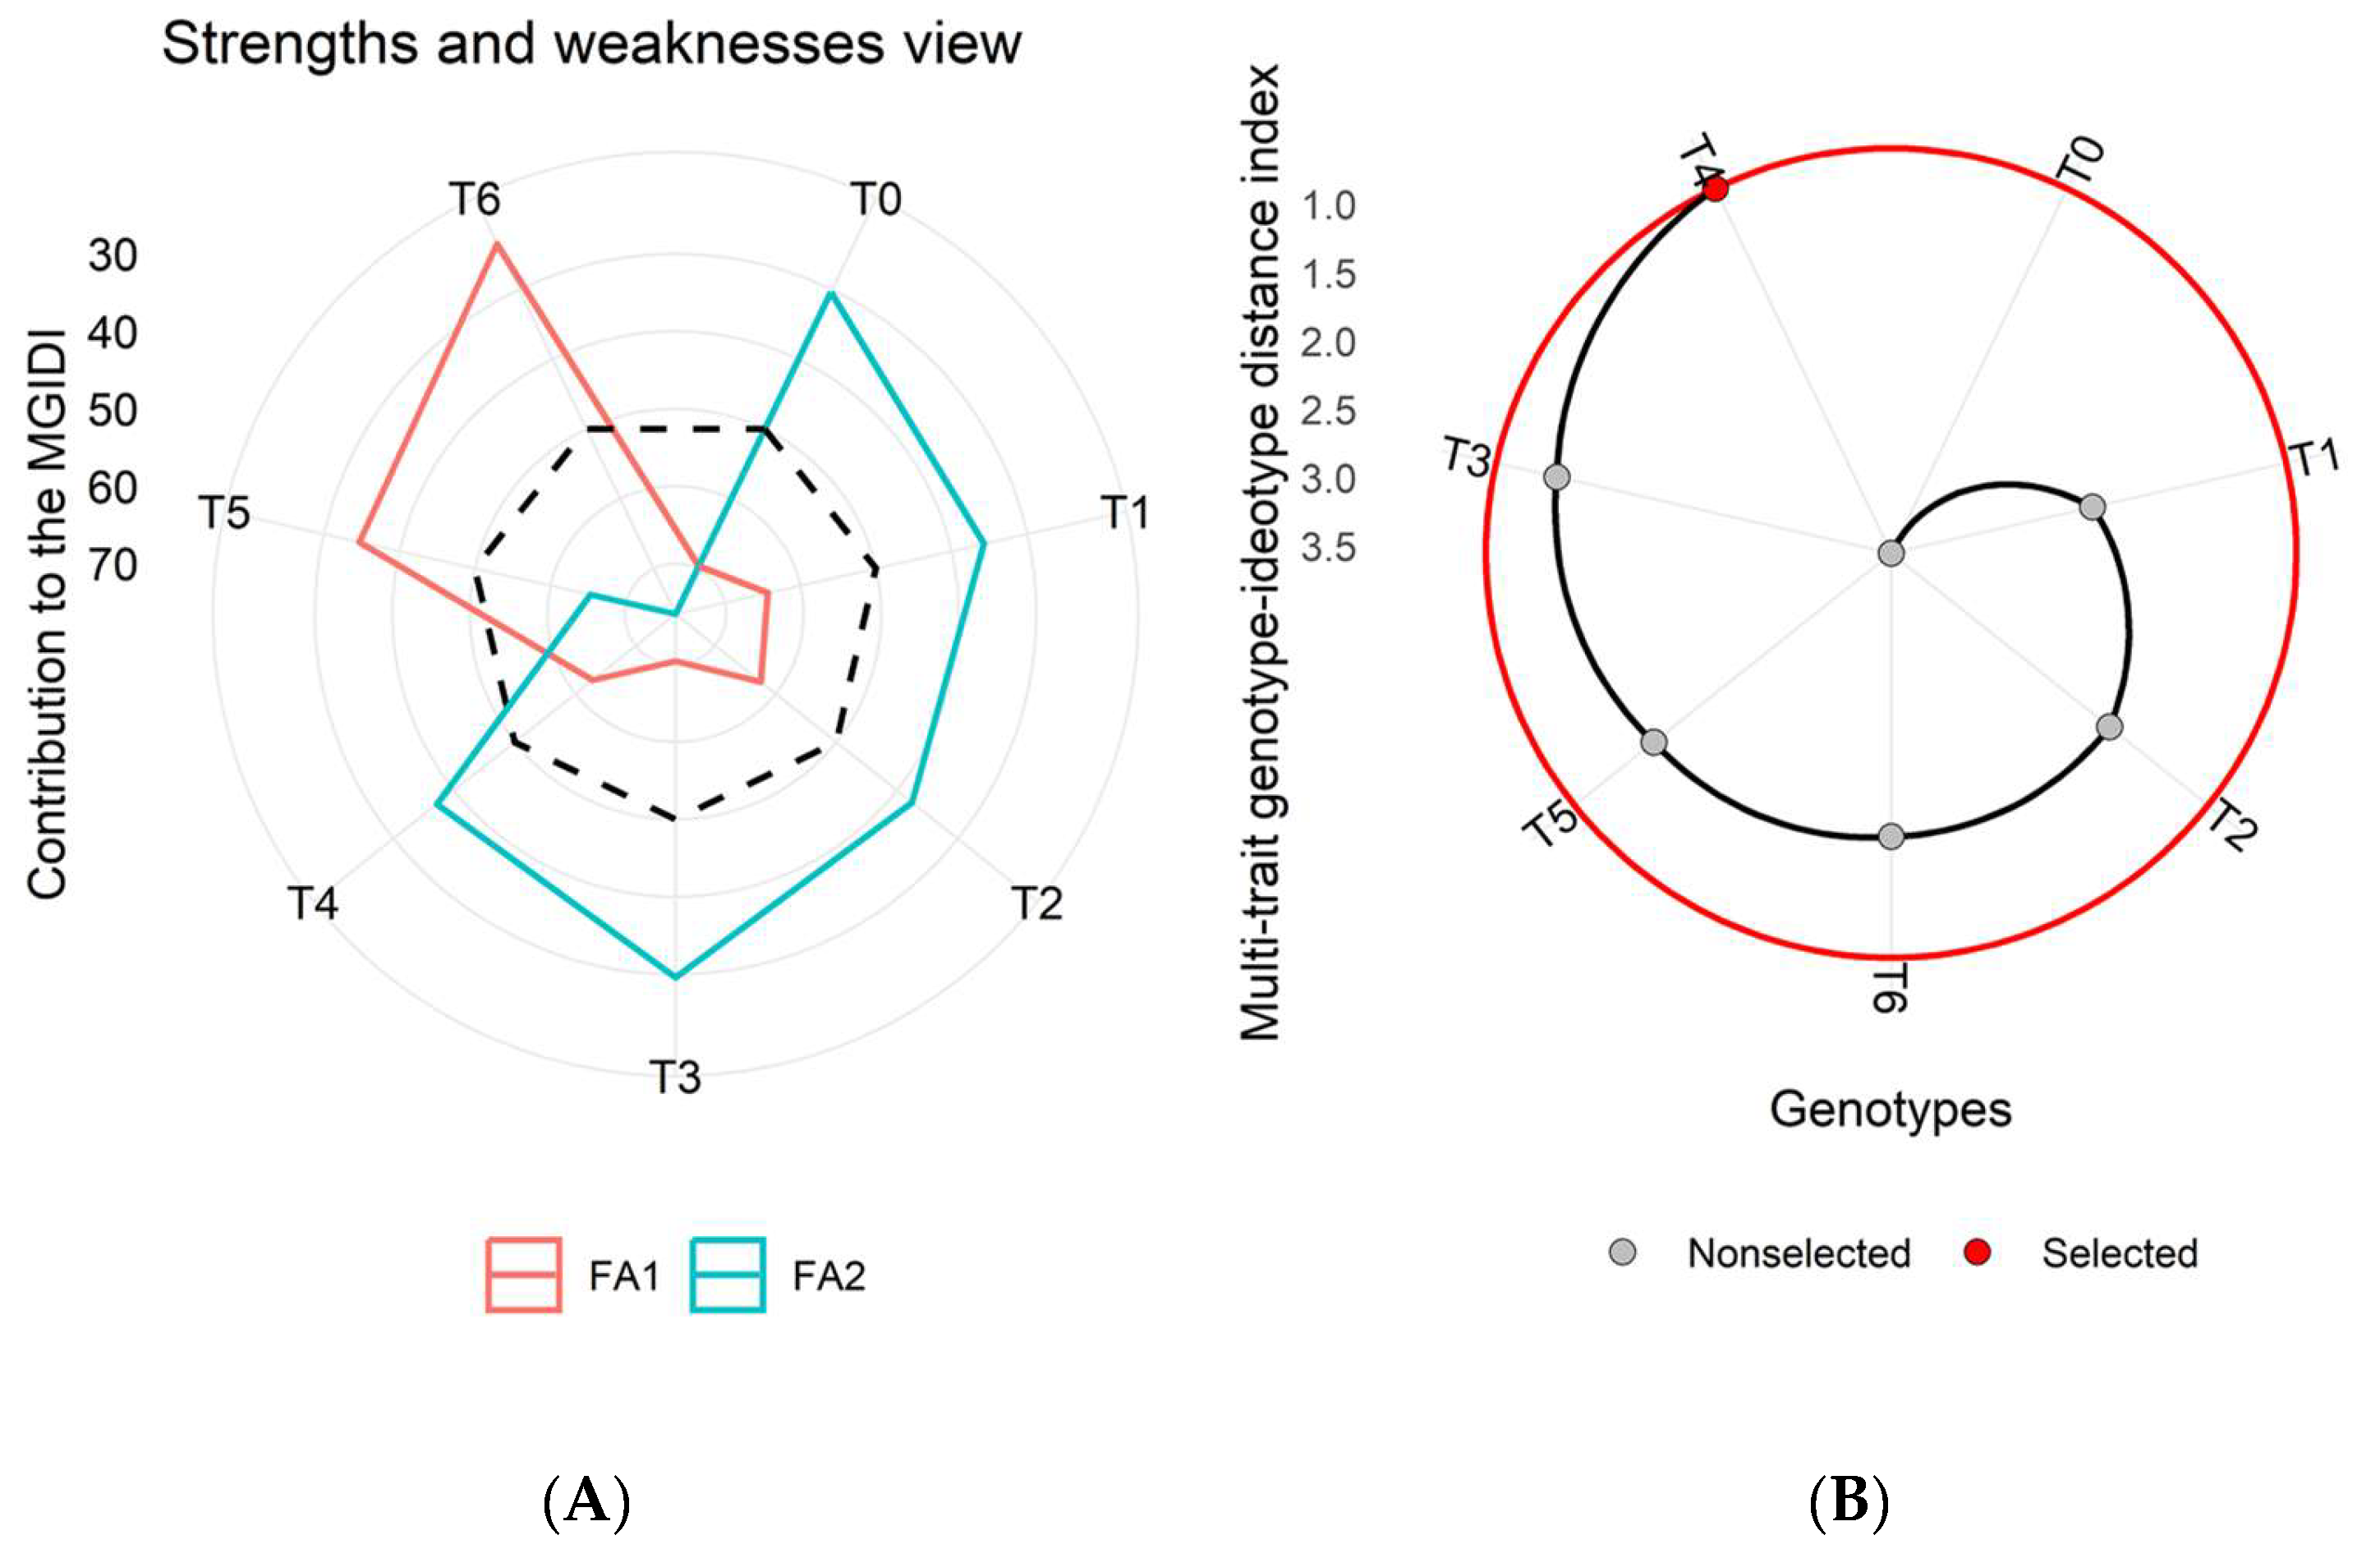
3.7. Multi-Trait Genotype-Ideotype Distance Index
To determine the most suitable treatment for enhancing wheat productivity and optimizing physio-biochemical parameters, a novel MGIDI was employed. This method was used to identify the most effective treatment across three consecutive wheat-growing seasons (2015–2018). The MGIDI analysis was performed individually for each growing season to pinpoint the most effective treatment (
Figure 5,
Figure 6 and
Figure 7).
The MGIDI results revealed the role of latent factors (FA1, FA2, and FA3) in shaping the strengths and weaknesses of each treatment. These factors highlighted sets of traits that significantly influenced treatment performance (
Figure 5A–
Figure 7A). Among these latent factors, FA1 (represented by the red line) was associated with growth and yield-related traits, while FA2 (represented by the green line) was linked to physio-biochemical and nutrient content traits.
Across all three growing seasons (2015–2018), treatment T
4 consistently emerged as the most effective based on analyzed traits for achieving higher wheat yield and enhanced metabolic activities (
Figure 5B–
Figure 7B). In the MGIDI analysis, treatments were ranked based on their contribution to the examined parameters. The treatments with higher MGIDI scores were considered less effective, while those closer to the ideal treatment (represented by the center of the plot) were considered more effective. A lower MGIDI score indicated that treatment was closer to the ideal ideotype, while greater deviation from the center indicated poorer performance for a specific set of parameters (
Figure 5). Treatment T
4 ranked highest based on the MGIDI and may be recommended for field application to enhance wheat productivity (
Figure 5,
Figure 6 and
Figure 7).
The dotted line on the plots represents the theoretical value, showing an equal contribution from each factor (
Figure 5A,B). The traits analyzed in this study included GY, BY, HI, NG, NS, TNG, TNS, NHI, Chl.a, Chl.b, total chlorophyll, carotenoid content, TSP, TFA, TSS, Pn, E, gs, and nutrient contents (Ca, P, K, and Mg), as well as the year (Y) and year × treatment interaction (Y × T) is presented in (
Table S1). In addition, the selection differential value, heritability, and selection gain were also computed for individual traits (
Table S1).
4. Discussion
This study thoroughly examines the impact of various N application rates on the physiological, biochemical, and yield attributes of wheat over three consecutive growing seasons (2015–2018). The results emphasize N’s pivotal role in enhancing wheat productivity, NUE, and physiological resilience to environmental stress. N treatments of 135 and 180 kg N ha−1 consistently yielded superior BY, GY, and NHI, highlighting their importance for improving wheat growth and overall productivity.
Both 135 and 180 kg N ha
−1 treatments significantly increased N uptake and translocation, particularly in the third growing season, leading to higher N content in both grain and straw (
Figure 2,
Figure 3 and
Figure 4). However, the most desired alteration in analyzed traits was noted in wheat plants treated with 180 kg N ha
−1. These findings suggest improved N assimilation, which is critical for boosting crop yield. The higher NHI values observed under these treatments reflect efficient N allocation to the grain, which is essential for enhancing grain quality [
36]. In contrast, control treatments showed lower yield and N content, underlining the necessity of optimized N application for achieving high productivity and NUE [
37,
38].
N treatments also had a substantial effect on biochemical markers, including TSP, TFA, and TSS. The 180 kg N ha
−1 (T
4) and 135 kg N ha
−1 (T
3) treatments exhibited the highest concentrations of TSP and TFA across all seasons (
Figures S1–S3;
Table 3). These elevated levels indicate that N fertilization enhances plant stress tolerance by improving osmotic balance and reducing oxidative stress, both of which are critical under fluctuating climatic conditions [
39]. Consistently higher TSS levels were recorded with 180 kg N ha
−1 (T
4), followed closely by 135 kg N ha
−1, while excessive N doses (225 kg N ha
−1 (T
5) and 270 kg N ha
−1 (T
6) negatively impacted TSS levels. These results suggest that moderate N application enhances wheat’s biochemical adaptability to environmental stress, with TSS serving as an indicator of osmotic stress tolerance [
40].
Photosynthetic efficiency, assessed by Chl.a, Chl.b, total chlorophyll, and carotenoid content, reached its peak under the 180 kg N ha
−1 (T
4) treatment. Increased chlorophyll content boosts the plant’s ability to capture and convert light energy, which is vital for growth and yield (
Figure 5 and
Figure 6) [
41,
42]. Enhanced photosynthetic efficiency under these treatments was also reflected in higher photosynthetic rates, E rates, and gs, demonstrating N’s role in optimizing photosynthetic capacity and overall productivity [
43]. However, excessive N application (225 kg N ha
−1 (T
5) and 270 kg N ha
−1 (T
6) resulted in negative impacts on growth and physiological traits, suggesting that there is an optimal N range beyond which additional N does not provide further benefits [
41].
PCA and heatmap analysis provided valuable insights into the optimal N doses for improving wheat grain yield. The PCA biplot (
Figure 3) highlighted the importance of 180 kg N ha
−1 (T
4) and 135 kg N ha
−1 (T
3) treatments in enhancing grain yield and physiological parameters. These treatments were positively correlated with TSS, TFA, Chl.b, carotenoids, Pn, E, and gs, indicating their potential to boost crop productivity under field conditions. Conversely, lower N doses (T
1, T
2) had limited effects, while control treatments (T
0) adversely affected the measured traits, as seen by their placement on the opposite side of the biplot. Heatmap analysis further clustered treatments, identifying T
3 and T
4 as the most effective for improving grain yield and favorable physio-biochemical traits. In contrast, higher N doses (T
5 and T
6) display antagonistic relationships with yield attributes and photosynthetic efficiency. These findings suggest a direct link between improved photosynthetic efficiency, N utilization, and enhanced grain production [
44]. Positive correlations between TNG and TNS further emphasize the importance of N supplementation in enhancing N uptake and translocation, particularly under treatments T
3 and T
4, which consistently improved yield, N content, and biochemical responses across seasons [
45].
MGIDI was utilized to identify the most optimal treatments for grain yield and physio-biochemical traits. By combining multiple attributes into a single index, MGIDI pinpointed 180 kg N ha
−1 (T
4) as the most effective treatment, demonstrating high heritability and significant improvements in yield and physio-biochemical parameters (
Table S1). T
4 also exhibited the highest selection differential and heritability, followed closely by 135 kg N ha
−1 (T
3), confirming their efficacy for sustainable wheat productivity (
Figure 5,
Figure 6 and
Figure 7). The elevated yield, N content, and photosynthetic pigment levels observed across seasons were likely facilitated by favorable environmental conditions, which amplified the benefits of N application [
46,
47]. Radar plots (strength–weakness analysis) further confirmed the balanced, overall performance of the 180 kg N ha
−1 treatment across multiple traits, underscoring its effectiveness in enhancing productivity and resilience [
48]. The consistent positive results of this treatment over three seasons highlight its long-term benefits for wheat growth and stress tolerance [
49].
These findings emphasize the importance of optimizing N management strategies to maximize wheat productivity while minimizing environmental impacts. The 180 kg N ha−1 treatment represents a balanced N application strategy that enhances yield, N uptake, and biochemical resilience without leading to excessive N losses. Adopting optimized N fertilization practices can significantly improve productivity, reduce N runoff, and mitigate greenhouse gas emissions, thus promoting sustainable agricultural systems. Future research should focus on refining N application strategies across diverse agro-climatic conditions, incorporating precision agriculture technologies, and evaluating the effects of different N application methods on NUE and crop resilience for sustainable wheat production.

 ,
, 