Article

Pore-Type-Dependent Fractal Features of Shales and Implications on Permeability

1
Key Laboratory of Shale Gas and Geoengineering, Institute of Geology and Geophysics, Chinese Academy of Sciences, Beijing 100029, China
2
College of Earth and Planetary Sciences, University of Chinese Academy of Sciences, Beijing 100049, China
3
Innovation Academy for Earth Science, Chinese Academy of Sciences, Beijing 100029, China
*
Author to whom correspondence should be addressed.
Fractal Fract. 2023, 7(11), 803; https://doi.org/10.3390/fractalfract7110803
Submission received: 26 September 2023 / Revised: 20 October 2023 / Accepted: 2 November 2023 / Published: 4 November 2023
(This article belongs to the Special Issue Applications of Fractal Analysis in Underground Engineering)

Abstract

:
Pore structure features govern the capacity of gas storage and migration in shales and are highly dependent on the types of pores, i.e., interparticle (InterP) pores, intraparticle (IntraP) pores and organic matter (OM)-hosted pores. However, fractal features in terms of pore types and their respective contributions to permeability have been rarely addressed. On the basis of high-resolution imaging, fractal dimensions (Ds) have been determined from both pore size distributions and digital rock to quantify the heterogeneity in pore morphology and spatial textures. Overall, OM-hosted pores are smaller in size and more abundant in quantity, corresponding to a relatively high D, while IntraP pores are mainly isolated and scarce, translating into lower D values. Additionally, crack-like InterP pores with a moderate level of porosity and the D can play a pivotal role in shale seepage potential. A comparison of the estimated permeability among different pore types highlights that the contribution of interconnected OM pores to the overall permeability remains constrained unless they can link neighboring pore clusters, as commonly observed in organo-clay composites. Furthermore, the pore morphology and fractal features of shale rocks can exhibit noteworthy variations subjected to sedimentology, mineralogy, diagenesis and OM maturation.

1. Introduction

Shale reservoirs, as self-contained source–reservoir systems, have become a high research priority because of their potential to provide long-term gas and oil resources [1,2,3]. Unlike conventional reservoirs, pores in shale are mainly on the nanoscale, and their properties vary in size, shape and connectivity depending on the mineral composition [4]. Shale gas exists as free gas in relatively large pores and microfractures, as adsorbed gas on the surface of organic matter (OM) and clay grains and as dissolved gas in fluids and kerogens [5,6]. Therefore, an in-depth investigation of pore structure properties is essential to assess the gas storage and migration capacity of shales, as well as the economics of gas production [7].
While the sedimentary and diagenetic history differs for shale reservoirs, pores can be generally classified into intraparticle (IntraP), interparticle (InterP) and OM-hosted ones in terms of their spatial relation with mineral phases and OM [8,9]. Generally, intraparticle pores are mostly located within single mineral grains, i.e., carbonate phases, as well as clay pellets and pyrite framboids [10]. In contrast, interparticle pores occur between clay flakes, detrital grains and authigenic minerals. OM-hosted pores are usually formed through the generation and expulsion of hydrocarbons in primary pores or surfaces of minerals filled by OM [11,12]. In this regard, pore structural features, i.e., their abundance, morphology and spatial distribution, can vary remarkably depending on pore types, leading to a high degree of heterogeneity in shales. Recently, advances in fluid invasion methods and high-resolution imaging techniques have provided solutions for the multiscale characterization of shale pore systems [13,14,15,16,17,18]. Experimental observations also highlight the critical effects of pore-type-dependent features on the bulk properties of shales and thus the potential of gas exploration. However, the challenge remains: how to quantify the complexity of shale pore systems and how to compare the irregularities of different pore types?
Fractal methods, acknowledged for their ability to assess statistical self-similarity, have been widely used to evaluate the quantity of pore networks, which cannot be addressed using Euclidean geometry theory [19,20,21,22]. In particular, the fractal dimension (D), as an important indicator of structural heterogeneity, can be determined based on mercury intrusion tests, gas adsorption analyses, nuclear magnetic resonance or digital rocks [23,24,25]. Generally, a larger value of fractal dimension can translate to a higher degree of complexity in pore systems. Many studies have also confirmed that the pore structure features, mineral composition and total organic carbon (TOC) content of shale samples, along with the methods employed for data acquisition and analysis, can affect the value of fractal dimensions to varying degrees [12,24,26]. In general, a smaller pore size and larger porosity correspond to higher fractal dimensions, while the impacts of mineral or TOC contents remain inconclusive, even with contradictory findings reported across various studies [19,27]. For instance, the relationship between fractal dimensions and the TOC value can be delineated by a U-shaped curve, implying a shift in the correlation pattern at a specific TOC threshold [28]. It should be noted that variations in the composition of individual minerals result in corresponding changes in other mineral constituents, thereby altering their overall pore network and associated properties. Consequently, it becomes imperative to isolate the impact of the aforementioned factors on fractal dimensions, which is also the primary aim of this paper.
Our work focuses on the distinctive fractal features inherent to pore types and their respective contributions to the storage and migration capacity of shales. Variations in pore size, shape and spatial distribution, as well as the corresponding fractal dimension of InterP, IntraP and OM-hosted pores, were identified and compared based on SEM and FIB-SEM data. In particular, the fractal dimensions for three types of pores were determined using both pore size distributions (PSDs) and digital rocks to highlight the heterogeneities in pore morphology and spatial texture. Further estimations of permeability regarding various pore types and the implications for overall gas migration were also performed in this paper. Our work demonstrated that studying the pore storage capacities and heterogeneities of shale pores is of crucial significance for prospects and the intended zone optimization during the exploration and development of shale gas.

2. Materials and Methods

2.1. Sample Preparation and Imaging

Shale rocks buried at depths ranging from 2749 to 2751 m were collected from the Weiyuan area in western Chongqing Province, China [29]. Cylindrical samples (4 mm diameter) were recovered from core plugs and prepared for pore structure characterization. In particular, thin sections and cuboidal samples were then prepared for FE-SEM and FIB-SEM imaging, respectively. All the measurements were performed at Multi-Scale Imaging and Characterization Laboratory, IGGCAS in Beijing, China. The FE-SEM experiment using a ZEISS Merlin scanning microscope (ZEISS, a German manufacturer of optical systems and optoelectronics) at 5 kV was performed on both bedding-parallel and -perpendicular surfaces of thin sections (with a diameter of 4 mm). Three cubic samples (2.5 × 2.5 × 2 mm3) were characterized by a ZEISS Crossbeam 540 instrument and electron-beam-scanned at a vacuum of <5 × 10⁻⁶ mbar for reconstruction. FIB milling and SEM imaging of shale samples layer by layer enable the reconstruction of 2D sections into 3D volumes with a voxel size of 10 nm3. In particular, regions of interest were selected with a size of 11.3 × 10.3 × 8.2 μm3, 11.1 × 10.7 × 5.8 μm3 and 10.1 × 9.7 × 4.3 μm3, respectively, for covering the different pore types concerned in this paper.

2.2. Image Processing and Analysis

While SEM images provide direct observations such as the morphology and distribution of pores, mineral grains and OM, more detailed information on 3D pore structure was characterized using FIB-SEM data. All the image processing and analysis were implemented in the open-source program Fiji 2.14.0 (https://imagej.net/software/fiji/). The FIB-SEM image stacks were first aligned with an affine scale-invariant feature transform algorithm [13], and then the processing steps of cropping, noise reduction and streak removal were performed in sequential order for further segmentation. Overall, grayscale images were segmented via the multi-thresholding approach into low-density components, e.g., different types of pores, OM and high-density components, e.g., clay, calcite, quartz and pyrite.
Different types of pores were then manually distinguished depending on their morphology and spatial distribution. In order to eliminate the effect of the field depth issue for FIB-SEM image stacks, an edge detection algorithm was also used to correct the segmentation of IntraP and InterP pores. Based on the segmented pore space, the porosity, pore size distribution and shape factor can be estimated to highlight the type-dependent properties of pore structure.

2.3. Determination of Fractal Dimension and Permeability

Fractal dimension (D) is a key parameter in fractal geometry to characterize the degree of heterogeneity in pore structure. Generally, the larger the D is, the more complex the pore structure becomes. In this work, the D was determined for different types of pores based on both PSDs and images. According to the relationship between pore size and the D, the number of pores with a radius greater than r ( N r ) can be expressed as [30]:
N r = r r m a x f r d r = c 1 r D ,
where r m a x is the maximum pore radius, c 1 is the fractal factor and f r is the density function of r . The cumulative volume of pores with a radius less than r , v r , is calculated by
v r = r m i n r f r c 2 r 3 d r = D c 1 c 2 3 D ( r 3 D r m i n 3 D ) ,
where r m i n is the minimum pore radius and c 2 is the proportional constant. The cumulative volume fraction of the pore radius is
v r V m a x = D c 1 c 2 3 D ( r 3 D r m i n 3 D ) D c 1 c 2 3 D ( r m a x 3 D r m i n 3 D ) = r 3 D r m i n 3 D r m a x 3 D r m i n 3 D   ,
where V m a x is the total pore volume. If r m i n   r m a x , Equation (3) can be simplified to a logarithmic form:
log ( v r / V m a x ) = ( 3 D ) l o g ( r / r m a x ) ,
where 3 − D is the slope of the straight ( log ( v r / V r ) , l o g ( r / r m a x ) ) line.
For 3D image stacks, D is determined using the box-counting method [31,32]:
D = lim l 0 log ( N l ) log ( 1 l ) ,
where l is the side length of the boxes and N l is the number of boxes required to cover the fractal pore space. The scale of the double-logarithmic plot is fitted for the identification of the D. The BOXCOUNT function in MATLAB was used in this work for D determination based on segmented images. In particular, the D was evaluated using the PSD, which is cited as DF, while DB was obtained from the 3D pore space.
Under the assumption that a porous medium comprises a bundle of tortuous capillaries and follows the fractal scaling law, the effective permeability, k , can be evaluated through the integration of the Hagen–Poiseulle equation and Darcy’s law. The fractal permeability model in 3D was formulated and then refined as [33,34,35]
k = π 128 L 0 1 D τ A f 3 D 3 + D τ D 3 r m a x 3 + D τ 1 ( r m i n / r m a x ) 3 + D τ D 1 ( r m i n / r m a x ) 3 ,
where L 0 and A f are the side length and area of the field of view, respectively. Here, the D is usually determined using the box-counting method, i.e., DB. D τ is the tortuosity fractal dimension, and it can be determined by
D τ = 1 + l n τ a v / l n ( L 0 r a v ) ,
where τ a v is the average tortuosity and r a v is the average pore diameter, which can be evaluated from the FIB-SEM images.

3. Results and Discussion

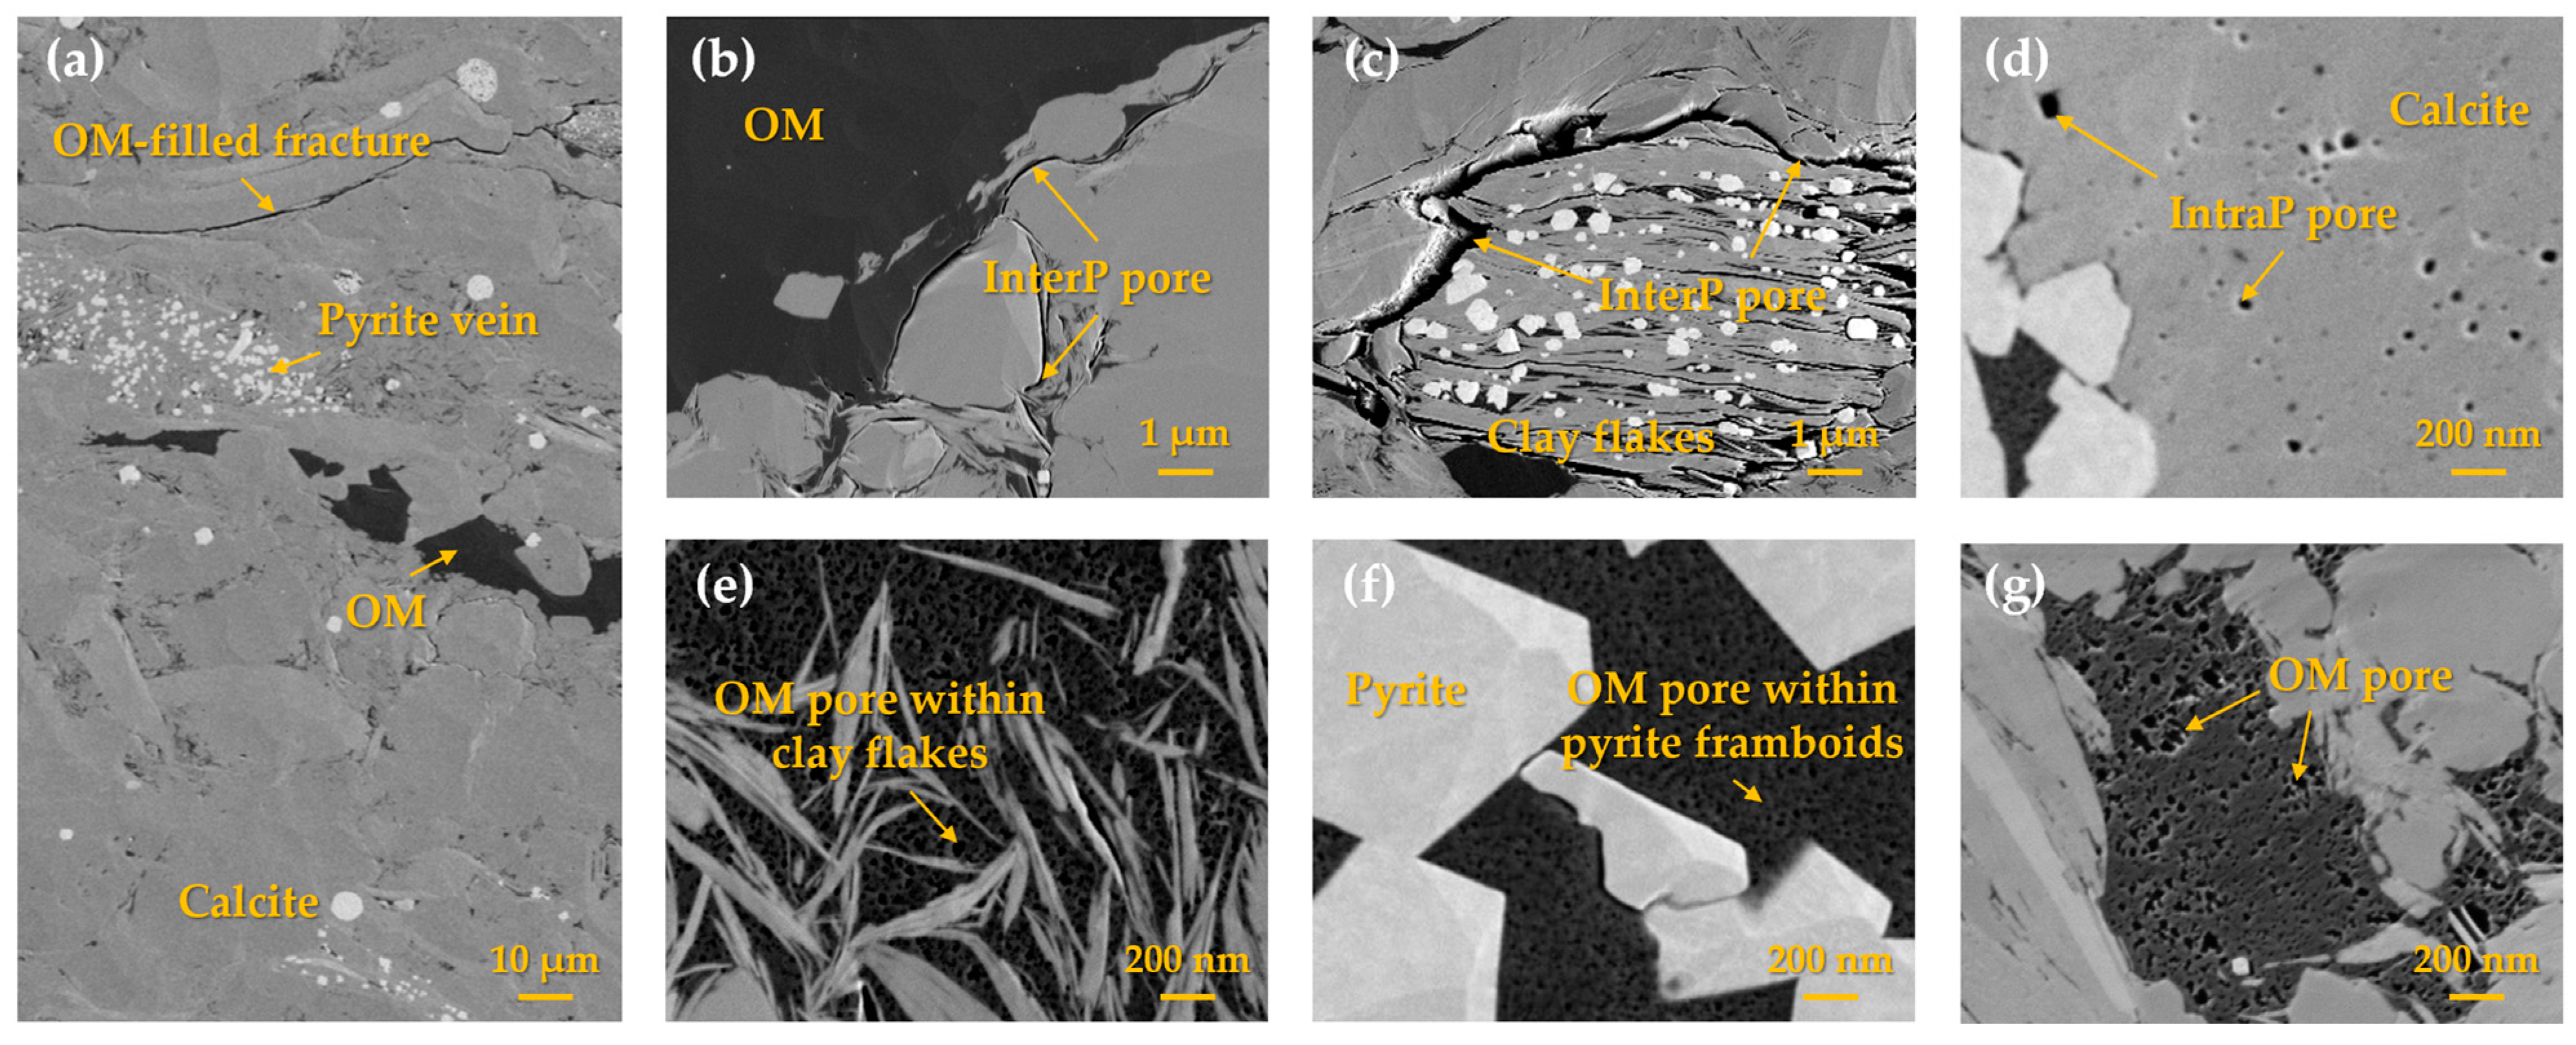
3.1. Visiualization of Shale Pore System

Differences in the morphology and distribution of pore-type-dependent structures can be identified from SEM images (Figure 1). InterP pores are generally observed adjacent to the surfaces of framework mineral grains and between clay flakes (Figure 1b,c). They mirror the shape of the bordering mineral phase and are well connected. To clarify, the clay minerals mentioned in this paper are a general term for a class of hydrous phyllo-silicate minerals, and the specific type of clay minerals is difficult to distinguish based on images. In particular, the presence of InterP pores generated by flocculation results in more interconnected channels along the face of clay flakes. Figure 1d displays the moldic IntraP pores induced by calcite dissolution. They are mostly rounded and too sparse in space to contribute to flow pathways. IntraP pores can also occur between mineral grains, e.g., clay flakes and pyrite framboids [10]. In many instances, they are filled with OM that develops pores due to maturation. As shown in Figure 1e,f, the OM-hosted pores are discrete, round, grouped and in spaces between overlapping clay and pyrite. OM pores in sizes ranging from tens to hundreds of nanometers also form in the original in-place kerogen (Figure 1g). Previous work has demonstrated that larger OM pores result from the trapping of fluids in the bitumen during burial [36]. Compared to InterP and IntraP pores, OM-hosted pores are smaller in size while more abundant in quantity, and thus can provide considerable space for the adsorption and percolation of shale gas.
More detailed characteristics, especially the 3D pore connectivity, for different types of pores are also compared based on the FIB-SEM data. Figure 2 shows the results of the FIB-SEM experiments and reconstructed digital rocks. According to the variations in phase density, the pore, OM and other minerals are displayed in blue, light blue and reddish colors, respectively. A comparison of the spatial texture between minerals and OM and the pore space highlights the important role of OM pores in shale storage and flow capacity. While InterP and IntraP pores are commonly larger in size, their contributions to permeability pathways are limited by the poor connection in 3D space. In contrast, grouped pores within OM significantly facilitate the interconnectivity of the OM-enriched regions. The presence of OM pores may bridge surrounding microfractures and pore networks, resulting in a considerable increase in overall permeability.

3.2. Pore Structure Dependence on Pore Types

In order to compare the pore structure features of different pore types, 12 subdomains were selected from the three FIB-SEM image stacks (shown in Figure 2) for further quantification. For each subdomain, a sole type of pores, that is, InterP, IntraP or OM pores, is included only. In particular, six subtypes of pores, which are highlighted in Figure 3, are identified according to the hosted and adjacent mineral phases. IntraP pores located within clay floccules and pyrite framboids are mostly filled by OM in these shale samples, and the pores observed in them are treated as a kind of OM pores. Two subdomains pertaining to a specific subtype of pores were chosen for the analysis, aiming to quantify their structural properties and conduct comparative assessments with other types of pores.
A comparison of the porosity, pore size and shape between different subdomains is summarized in Table 1. The average pore diameter of InterP and IntraP pores ranges from 26.27 nm to 105.75 nm and is significantly larger than that of OM pores. However, the porosity in the range of 0.115% to 2.02% is relatively low, especially for dissolution-induced IntraP pores. This indicates that InterP and IntraP pores in shale subdomains have a limited abundance in quantity and a dispersed distribution in space. The difference between OM-associated and cement-associated InterP pores can be identified using both pore size and shape. As shown in the 3D Slice and View reconstructions (Figure 3a,b), the InterPOM pores exhibit shapes matching those of the bordering mineral phases and mainly occur at organo-mineral interfaces, while InterPcement pores with angular or elongated shapes are observed between clay minerals and other phases. In this regard, a relatively high value of the average aspect ratio, up to 1.88, is determined from the subdomains with InterPOM pores. In contrast, the IntraPdissolution pores show a rounded shape with the average aspect ratio ranging from 1.07 to 1.11.
Three subtypes of OM pores, depending on the surrounding mineral phases, are compared. The porosity, average pore diameter and aspect ratio are in the range of 1.16~4.82%, 16.93~31.11 nm, and 1.21~1.35, respectively. Occurrences of IntraP OM-hosted pores, i.e., OMclay and OMpyrite pores, are very common in these shale samples. Compared to pores hosted in the original depositional kerogen, these two subtypes of pores exhibit a relatively low porosity, and their spatial distribution is highly controlled by the assemblage of clay floccules and pyrite framboids. A noticeable difference in pore structure properties between the subdomains of OM_1 and OM_2 can be observed, which indicates that pore volume, size and shape can vary as a function of in-place kerogen.
Overall, a complex pore system of shales can be confirmed by both 3D Slice and View images and pore structure properties. Different types of pores lead to obvious variations in porosity, pore size and shape, and complicate pore networks. Meanwhile, well-developed InterP pores and grouped OM pores are expected to enhance shale permeability. Also, what is important to note is that pore structure characterization with limited resolution can result in the omission of nanopores, leading to a significant underestimation of both porosity and permeability.

3.3. Fractal Geometry Dependence on Pore Types

While insights into pore structure properties in shales have been gained, an investigation on fractal geometry was performed here to provide further understanding of heterogeneities in pore sizes and spatial distributions across pore types. Based on fractal dimensions determined using both PSDs and 3D images, the major pore networks of shales and their contributions to permeability are also discussed in this section.

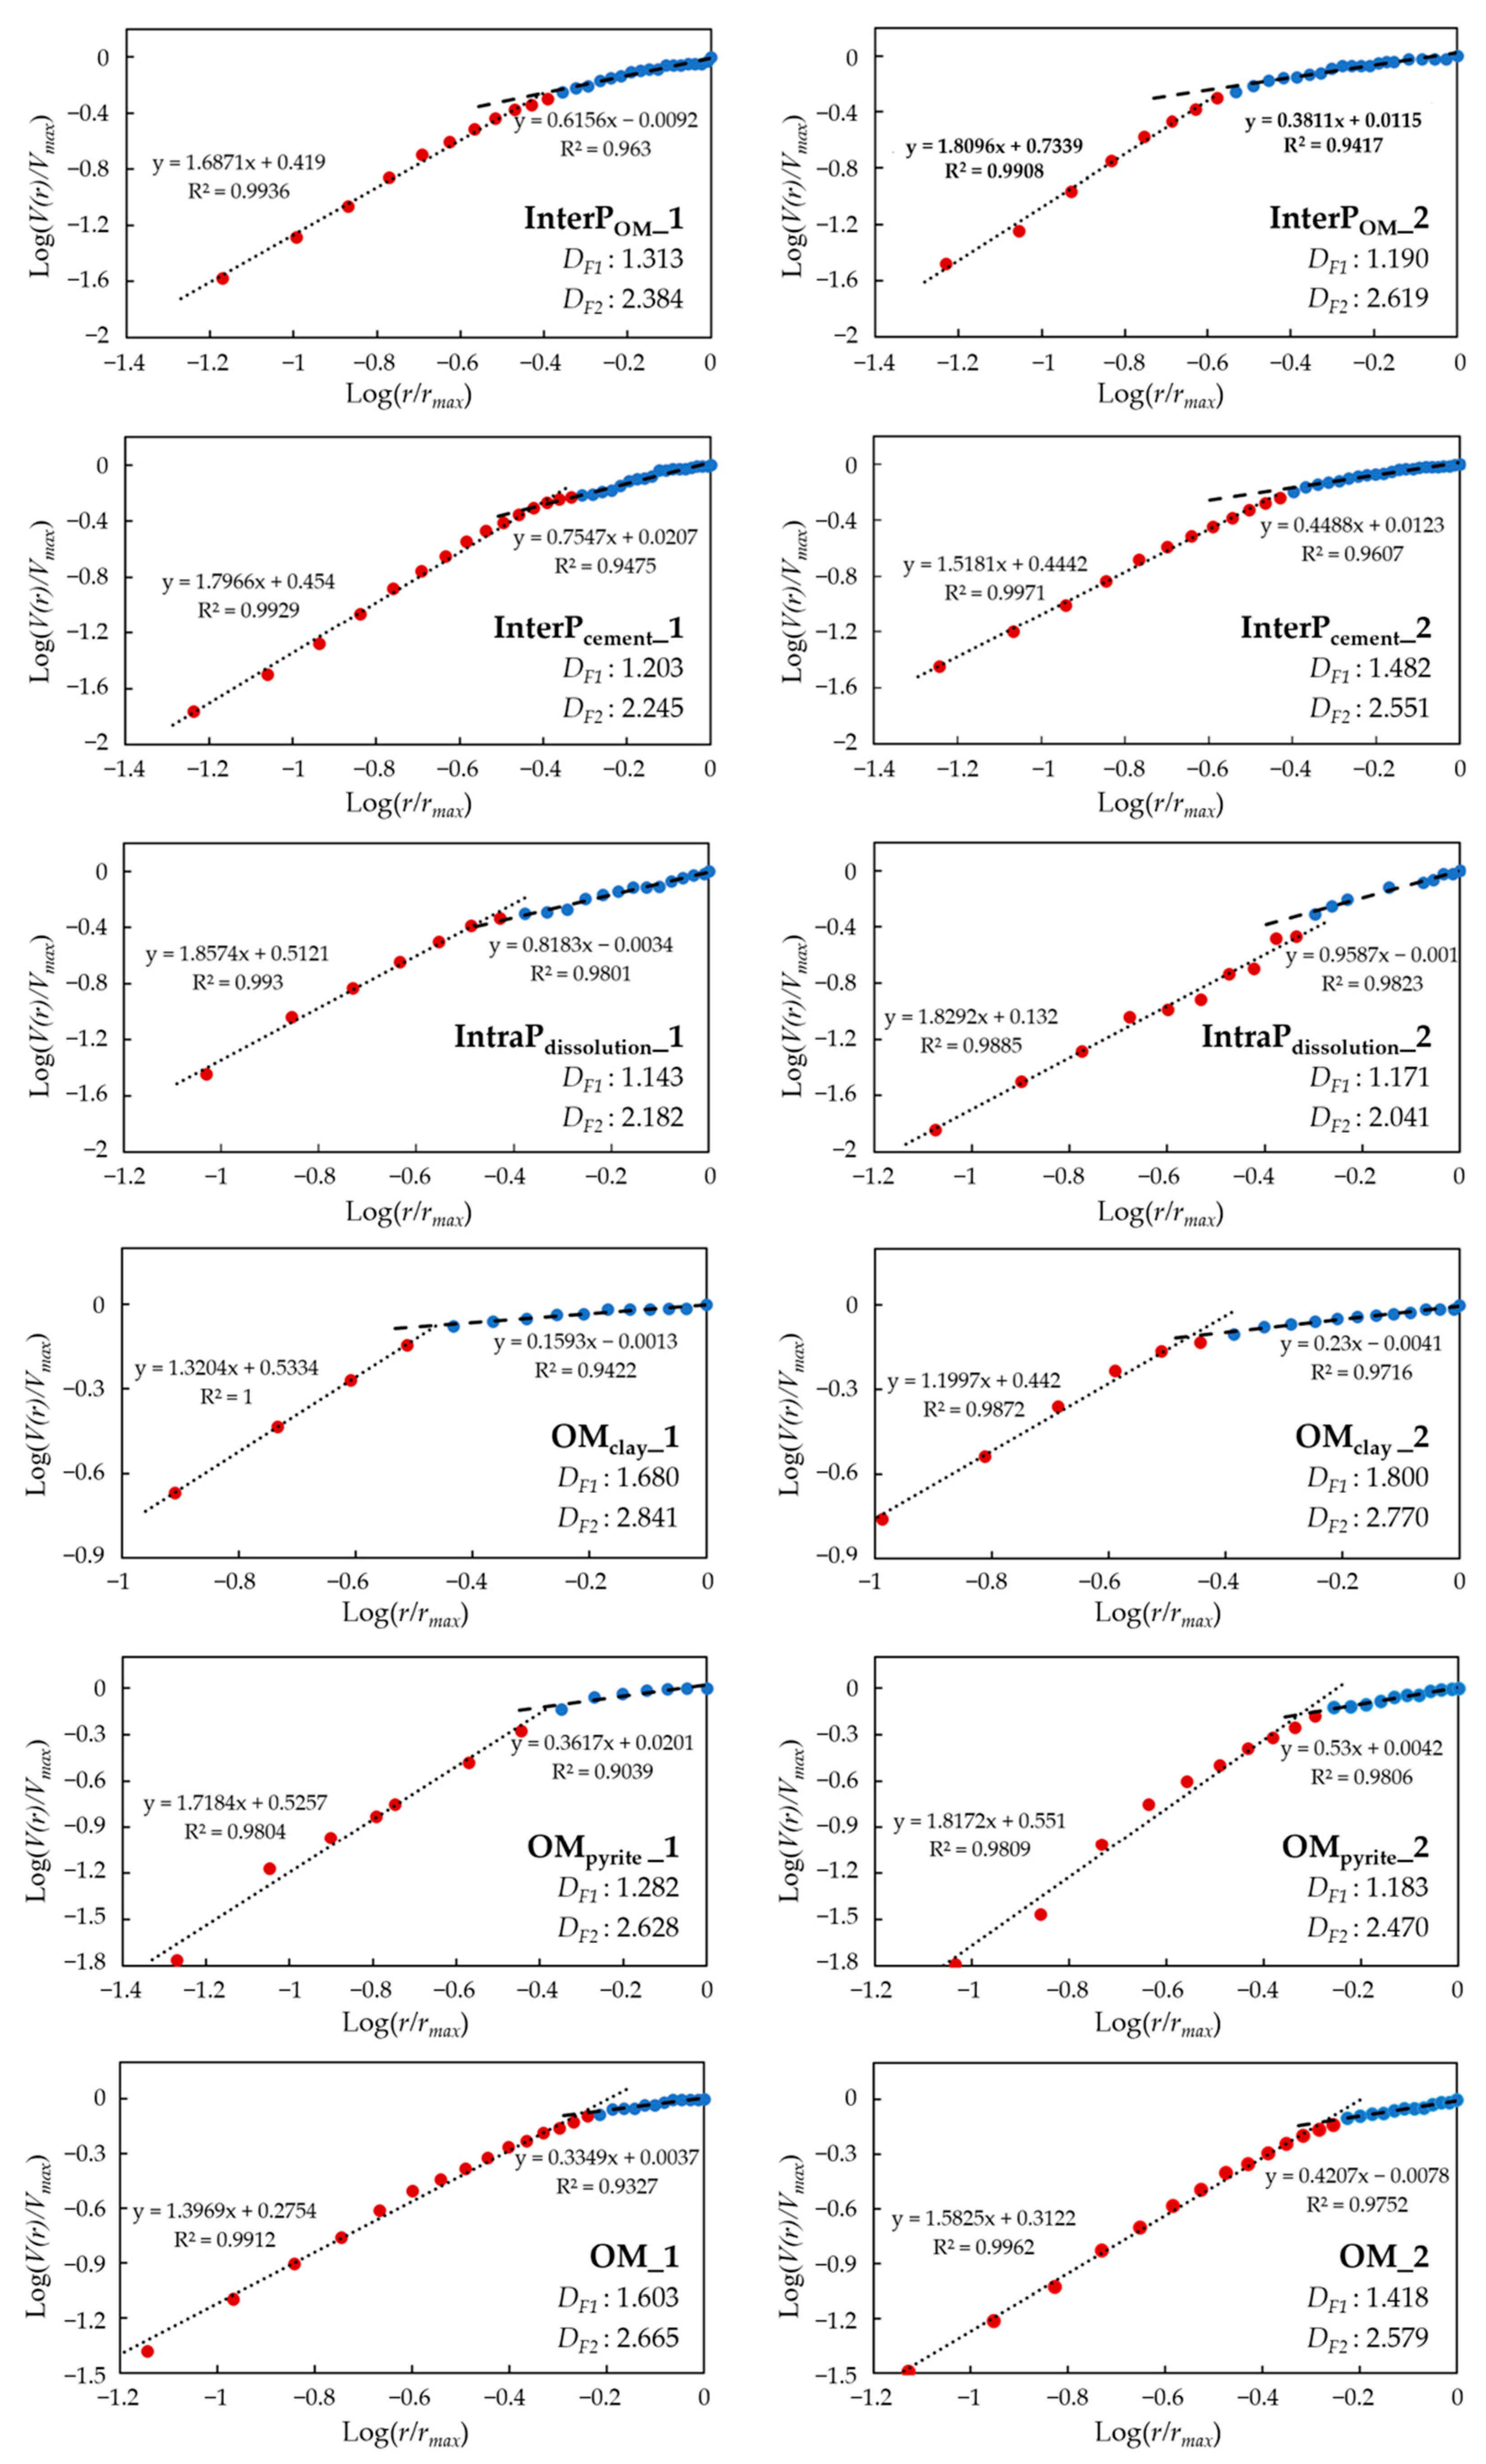
3.3.1. Fractal Dimension Based on PSDs

As shown in Figure 4, the data points on the Log–Log plots of v r / V m a x and r / r m a x fall into two linear segments, highlighted in red and blue, respectively, and the corresponding fractal dimensions, DF1 and DF2, were defined and calculated. For all the types of pores, the values of DF1, varying from 1.143 to 1.800, are lower than those of DF2, varying from 2.041 to 2.841. According to Equation (3), used for D determination, DF1 can be an indicator of fractal geometry for smaller pores, while DF2 is more associated with larger pores. In this regard, the heterogeneity in the pore size of relatively large pores is stronger; that is, they have a more heterogeneous distribution, than that of relatively small pores. Furthermore, higher values of DF can translate to a larger surface area with more complexity in pore geometry [27]. All the correlation coefficients of the linear regression analysis are larger than 0.9, indicating that the pore system of shale is self-similar and has apparent fractal features, especially in small pore distributions.
In the consideration of pore-type-dependent fractal characteristics, OM-hosted pores lead to both larger DF1 and DF2, illustrating the complexity of pore morphology in OM. Meanwhile, there is negative feedback between fractal dimension and pore size. This is highly evident in dissolution IntraP pores, which are the largest with an average pore diameter around 100 nm and with the lowest DF1 and DF2 as well. In contrast, OM pores in clay flakes show a high degree of heterogeneity in the full distribution of pore size identified by the D. This may result from the irregular pore structure of preexisting IntraP pores in clays, which are filled by OM later and treated as OM-hosted pores. Taking the aspect ratio into account, the transition from slit-shaped pores (e.g., InterP pores) and rounded pores (e.g., Intra P pores) to jagged-shaped pores (e.g., OM-hosted pores) tends to increase the DF. Generally, a similar tendency for variations in DF1 and DF2 can be observed in terms of pore types, indicating that a broader PSD and a rougher surface denote a complex pore system. An exception is the subdomain of InterPOM_2, which has a low DF1 and a high DF2. This demonstrates that limited variations in small pore size can result from elongated or crack-like shapes.

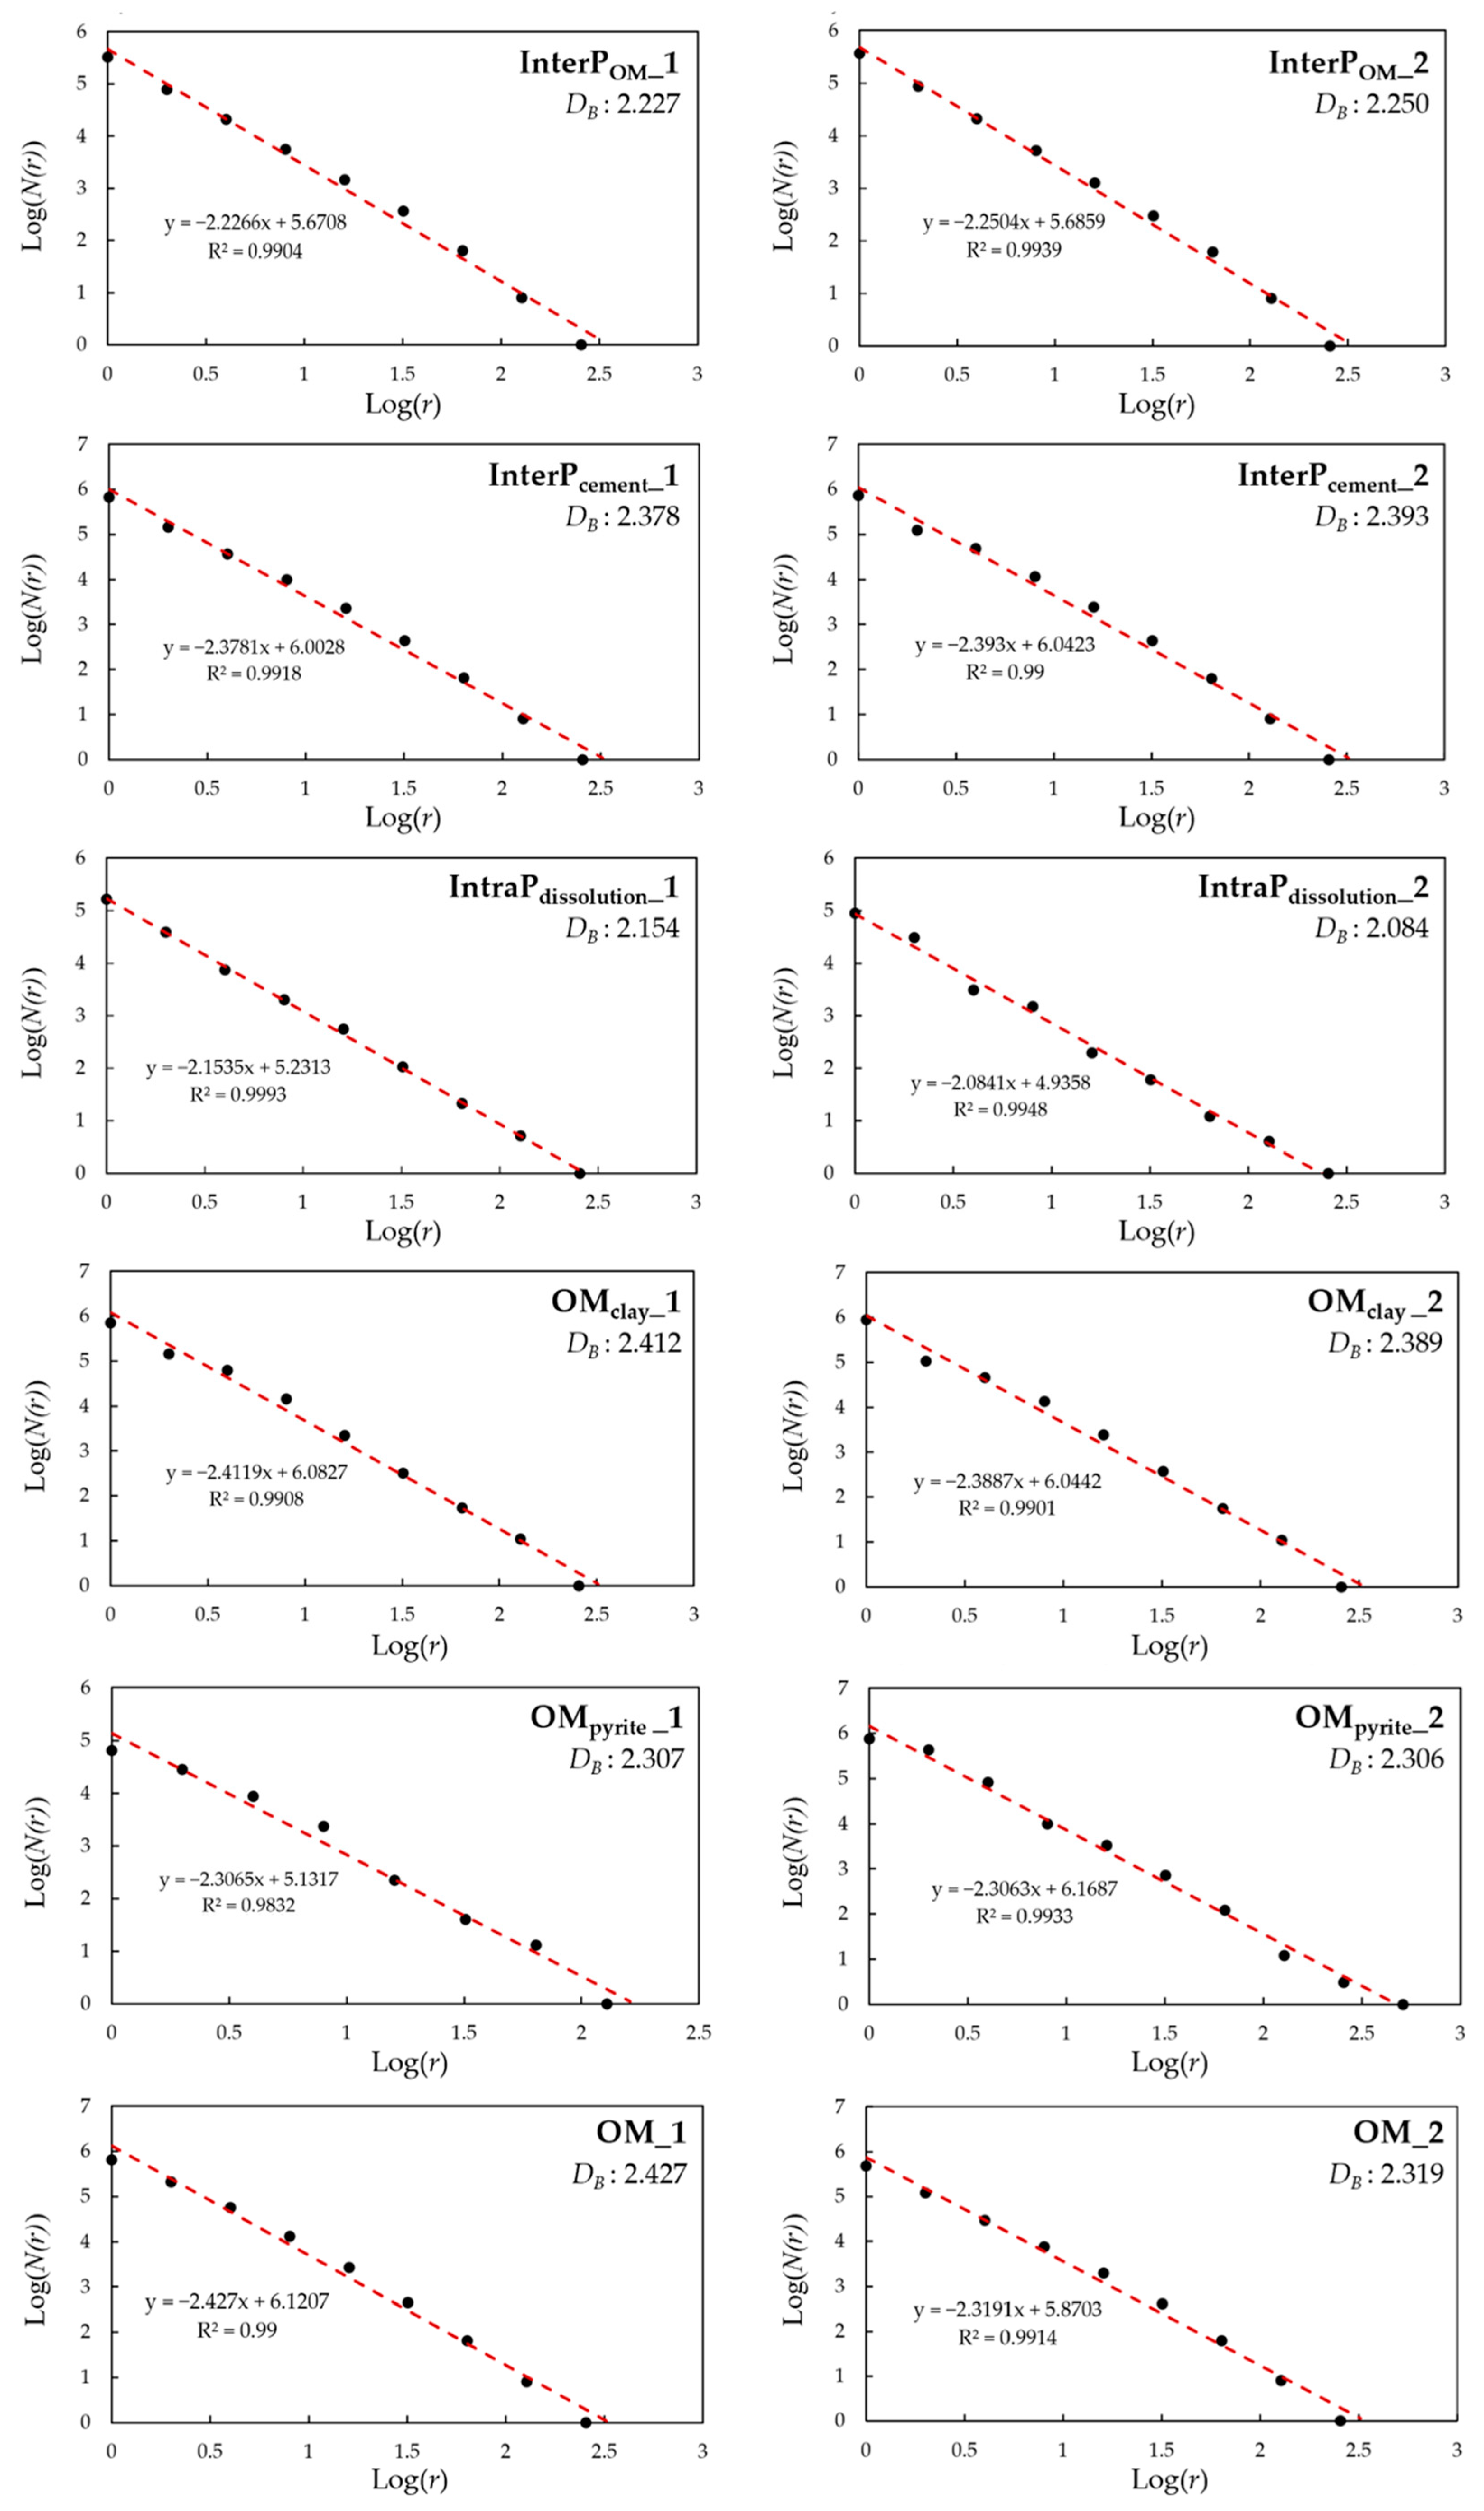
3.3.2. Fractal Dimension Based on Pore Space

The D is also calculated using 3D binary images of subdomains to estimate the spatial complexity of different pore types in shales. Figure 5 summaries the Log–Log plots, and the corresponding DB ranges from 2.084 to 2.427 with an average value of 2.304. The rounded and isolated IntraP pores led to a simple texture in space, while the OM pores differed by the development location and process, which complicated the pore structure. Previous studies have stated that spongy OM pores generally have a smaller size compared bubbled pores, which form along with trapped fluid or in cracked bitumen [10]. The coexistence of these pores results in a more heterogeneous distribution of pores in size and space, as well as a larger DB. Compared to other subtypes of OM pores, the OM-hosted pores located in pyrite framboids have a relatively uniform pattern, controlled by the arrangement of pyrite grains. In addition, a higher DB is determined from InterP pores at clay–mineral interfaces rather than the OM–mineral ones. As mentioned above, the InterPcement pores occurring between framework mineral grains and occluded with clay can contribute to a complex spatial texture due to random crystal orientations and clay floccules. Overall, DB correlates positively with porosity, whereas it has a weak correlation with the average pore diameter, indicating pore tortuosity and connectivity subjected to spatial distribution govern the pore network to a greater extent.
Taking both DF and DB into account can provide further insights into the shale structural characteristics associated with mineral composition and OM content. Many studies demonstrated that the D increases with brittle mineral and TOC contents and exhibits a negative correlation with clay minerals [12,19]; however, other studies have reported inconsistent conclusions [27,28]. In this work, OM-associated pores mostly reflected a higher DF and DB, indicating a more complex pore system in the original kerogen and migrated solid bitumen that fills primary pore spaces. The relationship between clay minerals and fractal features is more complicated. Most of the clay floccules observed in the shale samples in this research were altered by OM trapping or brittleness participation, triggering IntraP and InterP to be lined with organics and jagged shapes. Therefore, the clay-associated pores correspond to a relatively high D compared to brittle pores. It has also been confirmed that pores in an organo-clay matrix or at interfaces exhibit a complex morphology (e.g., elongated and crack-shaped pores) [10,36]. Such insights highlight the joint impacts of sedimentology, mineralogy, diagenesis and organic matter maturation on pore systems and their fractal characteristics.

3.4. Pore Networks and Implications on Permeability

Permeability prediction has critical implications for the gas exploration of shale reservoirs. While the Kozeny–Carman equation has been widely applied in various fields or used as the basis of other permeability models, it becomes less effective when heterogeneities in pore morphology and connectivity complicate rock structural properties [34,37,38,39]. Here, pore-type-dependent permeability was estimated by considering the PSD, tortuosity and fractal features. Our findings suggest that both the D and porosity have weak correlations with permeability (as shown in Figure 6). This highlights that bulk permeability is more dependent on the pore-throat ratio and tortuosity than the value of porosity, especially in semi-similar pore spaces. A relatively high permeability (a mean value of 2 × 10⁻¹⁷ m2) can be estimated for pores in kerogen (i.e., OM pores) or between multiple mineral phases (i.e., InterP pores), as a result of their good interconnectivity. It is worth noting that the morphology and abundance of pores in solid bitumen, which evolves during thermal maturation, can vary as a function of maturity [40]. Resulting from a relatively scattered distribution in space, these secondary OM-hosted pores exhibit a lower permeability (a mean value of 3 × 10⁻¹⁸ m2) compared to the primary ones. Further, IntraP pores are usually isolated and scarce within a single mineral, leading to a low value of permeability (a mean value of 1 × 10⁻¹⁹ m2).
However, the shale pore network is the sum of pore types and how these pore types connect and evolve during thermal maturation and mechanical compaction. When compared to the shale permeability measured by experiments for the samples collected from the same reservoir (displayed in Figure 6b), most single-type pores coincide with a lower value of porosity and permeability [41]. While kerogen-associated pores correspond to a relatively high permeability, kerogen is commonly sparsely disseminated throughout a shale matrix. As a result, such OM pores may not contribute much to an effective pore network. In contrast, OMclay and OMpyrite pores in solid bitumen mainly distribute in the original InterP and IntraP pores, which may play a critical role in pore connectivity and thus permeability enhancement. This phenomenon is more pronounced in the organo-clay composite, which usually forms due to the chemical bonding or adsorption between clay minerals and OM [42]. The OM-hosted pores that occur between clay platelets can connect with IntraP pores in clay minerals and other pore groups, thereby providing more flow pathways. Such pore networks are commonly protected by neighboring brittle minerals, e.g., quartz, during formation compaction; conversely, they are more susceptible to destruction in shale with a higher content of clay minerals.

4. Conclusions

The storage and migration capabilities of shale rocks are predominantly governed by pore morphology (e.g., pore size, shape, internal surface, volume and distribution) and connectivity, which strongly depend on pore types. In this study, the structural properties and fractal signatures of IntraP, InterP and OM-hosted pores in shale were isolated, enabled by the FIB-SEM datasets, to assess their respective contributions to the overall permeability. In order to quantify the heterogeneities in both pore size and spatial texture, the fractal dimensions were determined from PSDs and 3D images, respectively. A further discussion on the relationship among pore morphology, fractal dimension and permeability was also included.
Overall, a pore space with a larger porosity and smaller pore size can coincide with a larger surface area, which in turn results in both higher DF and DB, while pore shape has a weak correlation with the D. In terms of pore types, clustered and well-connected pores hosted by OM correspond to the smallest pore diameter and the highest D, while rounded and scarce IntraP pores translate into the least D. Compared to kerogen-hosted pores, the secondary OM pores within solid bitumen commonly exhibit a sponge-like shape and a relatively low porosity, and their pore size and spatial distribution significantly vary as a function of maturity.
In general, a larger D, indicating a higher surface area and a rougher edge, correlates positively with the adsorption potential, but it does not always coincide with a higher seepage potential. The grouped OM pores are characterized by a relatively high porosity and permeability (a range of 2.4 × 10⁻¹⁸ to 5.4 × 10⁻¹⁷ m2). However, their contribution to an effective pore network is constrained by their scattered distribution, mainly controlled by the assemblage of kerogen, clay floccules and pyrite framboids. A considerable enhancement in overall permeability can be expected when OM-hosted pores interconnect with crack-like pores or other effective pore networks, as observed in the case of the organo-clay composites.
In summary, the fractal dimension, as an effective indicator of heterogeneity in pore sizes and spatial distributions, can provide further insights into tortuosity, connectivity and thus the permeability of shale rocks. Remarkable differences in pore morphology and fractal characteristics in terms of pore types highlight that an assessment of shale reservoirs cannot alone account for the porosity but also how various porous regions connect to an effective pore network. Additionally, the shale reservoir quality, which is a sum of porosity, permeability and lateral continuity, highly depends on pore-type-dependent features and has profound implications for the economic assessment of shale gas production.

Author Contributions

Conceptualization, Q.Z., S.T. and Y.D.; methodology, Q.Z. and S.T.; software, Q.Z. and S.T.; validation, Q.Z., S.T. and Y.D.; formal analysis, Q.Z.; data curation, Q.Z. and S.T.; writing—original draft preparation, Q.Z. and S.T.; writing—review and editing, Q.Z. and Y.D. All authors have read and agreed to the published version of the manuscript.

Funding

This research was funded by the National Natural Science Foundation of China (No. 42202285).

Data Availability Statement

Not applicable.

Conflicts of Interest

The authors declare no conflict of interest.

Correction Statement

This article has been republished with a minor correction to the Funding number. This change does not affect the scientific content of the article.

References

  1. Loucks, R.G.; Ruppel, S.C. Mississippian Barnett Shale: Lithofacies and depositional setting of a deep-water shale-gas succession in the Fort Worth Basin, Texas. AAPG Bull. 2007, 91, 579–601. [Google Scholar] [CrossRef]
  2. Mănescu, C.B.; Nuño, G. Quantitative effects of the shale oil revolution. Energy Policy 2015, 86, 855–866. [Google Scholar] [CrossRef]
  3. Tian, S.; Guo, Y.; Dong, Z.; Li, Z. Pore Microstructure and Multifractal Characterization of Lacustrine Oil-Prone Shale Using High-Resolution SEM: A Case Sample from Natural Qingshankou Shale. Fractal Fract. 2022, 6, 675. [Google Scholar] [CrossRef]
  4. Ross, D.J.; Bustin, R.M. The importance of shale composition and pore structure upon gas storage potential of shale gas reser-voirs. Mar. Pet. Geol. 2009, 26, 916–927. [Google Scholar] [CrossRef]
  5. Ji, L.; Zhang, T.; Milliken, K.L.; Qu, J.; Zhang, X. Experimental investigation of main controls to methane adsorption in clay-rich rocks. Appl. Geochem. 2012, 27, 2533–2545. [Google Scholar] [CrossRef]
  6. Tian, J.; Liu, J.; Elsworth, D.; Leong, Y.K.; Li, W.; Zeng, J. Shale gas production from reservoirs with hierarchical multiscale structur-al heterogeneities. J. Pet. Sci. Eng. 2022, 208, 109380. [Google Scholar] [CrossRef]
  7. Marinina, O.; Nechitailo, A.; Stroykov, G.; Tsvetkova, A.; Reshneva, E.; Turovskaya, L. Technical and Economic Assessment of En-ergy Efficiency of Electrification of Hydrocarbon Production Facilities in Underdeveloped Areas. Sustainability 2023, 15, 9614. [Google Scholar] [CrossRef]
  8. Wang, P.; Jiang, Z.; Ji, W.; Zhang, C.; Yuan, Y.; Chen, L.; Yin, L. Heterogeneity of intergranular, intraparticle and organic pores in Longmaxi shale in Sichuan Basin, South China: Evidence from SEM digital images and fractal and multifractal geometries. Mar. Pet. Geol. 2016, 72, 122–138. [Google Scholar] [CrossRef]
  9. Loucks, R.G.; Reed, R.M.; Ruppel, S.C.; Jarvie, D.M. Morphology, Genesis, and Distribution of Nanometer-Scale Pores in Siliceous Mudstones of the Mississippian Barnett Shale. J. Sediment. Res. 2009, 79, 848–861. [Google Scholar] [CrossRef]
  10. Mathia, E.J.; Bowen, L.; Thomas, K.M.; Aplin, A.C. Evolution of porosity and pore types in organic-rich, calcareous, Lower Toarcian Posidonia Shale. Mar. Pet. Geol. 2016, 75, 117–139. [Google Scholar] [CrossRef]
  11. Curtis, M.E.; Cardott, B.J.; Sondergeld, C.H.; Rai, C.S. The development of organic porosity in the Woodford Shale related to ther-mal maturity. In Proceedings of the SPE Annual Technical Conference and Exhibition, San Antonio, TX, USA, 8–10 October 2012; p. SPE-160158. [Google Scholar]
  12. Chang, J.; Fan, X.; Jiang, Z.; Wang, X.; Chen, L.; Li, J.; Zhu, L.; Wan, C.; Chen, Z. Differential impact of clay minerals and organic mat-ter on pore structure and its fractal characteristics of marine and continental shales in China. Appl. Clay Sci. 2022, 216, 106334. [Google Scholar] [CrossRef]
  13. Kelly, S.; El-Sobky, H.; Torres-Verdín, C.; Balhoff, M.T. Assessing the utility of FIB-SEM images for shale digital rock physics. Adv. Water Resour. 2016, 95, 302–316. [Google Scholar] [CrossRef]
  14. Klaver, J.; Desbois, G.; Littke, R.; Urai, J.L. BIB-SEM characterization of pore space morphology and distribution in postmature to overmature samples from the Haynesville and Bossier Shales. Mar. Pet. Geol. 2015, 59, 451–466. [Google Scholar] [CrossRef]
  15. Ma, L.; Fauchille, A.-L.; Dowey, P.J.; Pilz, F.F.; Courtois, L.; Taylor, K.G.; Lee, P.D. Correlative multi-scale imaging of shales: A review and future perspectives. Geol. Soc. Lond. Spec. Publ. 2017, 454, 175–199. [Google Scholar] [CrossRef]
  16. Schmitt, M.; Fernandes, C.P.; Neto, J.A.d.C.; Wolf, F.G.; dos Santos, V.S. Characterization of pore systems in seal rocks using Nitrogen Gas Adsorption combined with Mercury Injection Capillary Pressure techniques. Mar. Pet. Geol. 2013, 39, 138–149. [Google Scholar] [CrossRef]
  17. Wang, Y.; Wang, L.; Wang, J.; Jiang, Z.; Wang, C.-C.; Fu, Y.; Song, Y.-F.; Wang, Y.; Liu, D.; Jin, C. Multiscale characterization of three-dimensional pore structures in a shale gas reservoir: A case study of the Longmaxi shale in Sichuan basin, China. J. Nat. Gas Sci. Eng. 2019, 66, 207–216. [Google Scholar] [CrossRef]
  18. Zhang, Q.; Dong, Y.; Liu, S.; Elsworth, D.; Zhao, Y. Shale pore characterization using NMR cryoporometry with octamethylcyclo-tetrasiloxane as the probe liquid. Energy Fuels 2017, 31, 6951–6959. [Google Scholar] [CrossRef]
  19. Li, A.; Ding, W.; Jiu, K.; Wang, Z.; Wang, R.; He, J. Investigation of the pore structures and fractal characteristics of marine shale reservoirs using NMR experiments and image analyses: A case study of the Lower Cambrian Niutitang Formation in north-ern Guizhou Province, South China. Mar. Pet. Geol. 2018, 89, 530–540. [Google Scholar] [CrossRef]
  20. Mandelbrot, B.B. Stochastic models for the Earth’s relief, the shape and the fractal dimension of the coastlines, and the number-area rule for islands. Proc. Natl. Acad. Sci. USA 1975, 72, 3825–3828. [Google Scholar] [CrossRef]
  21. Xie, X.; Deng, H.; Li, Y.; Hu, L.; Mao, J.; Li, R. Investigation of the Oriented Structure Characteristics of Shale Using Fractal and Structural Entropy Theory. Fractal Fract. 2022, 6, 734. [Google Scholar] [CrossRef]
  22. Zhan, H.; Li, X.; Hu, Z.; Duan, X.; Wu, W.; Guo, W.; Lin, W. Fractal Characteristics of Deep Shales in Southern China by Small-Angle Neutron Scattering and Low-Pressure Nitrogen Adsorption. Fractal Fract. 2022, 6, 484. [Google Scholar] [CrossRef]
  23. Liu, K.; Ostadhassan, M.; Jang, H.W.; Zakharova, N.V.; Shokouhimehr, M. Comparison of fractal dimensions from nitrogen ad-sorption data in shale via different models. RSC Adv. 2021, 11, 2298–2306. [Google Scholar] [CrossRef] [PubMed]
  24. Xu, L.; Zhang, J.; Ding, J.; Liu, T.; Shi, G.; Li, X.; Dang, W.; Cheng, Y.; Guo, R. Pore Structure and Fractal Characteristics of Different Shale Lithofacies in the Dalong Formation in the Western Area of the Lower Yangtze Platform. Minerals 2020, 10, 72. [Google Scholar] [CrossRef]
  25. Yang, F.; Ning, Z.; Liu, H. Fractal characteristics of shales from a shale gas reservoir in the Sichuan Basin, China. Fuel 2013, 115, 378–384. [Google Scholar] [CrossRef]
  26. Sun, W.; Zuo, Y.; Wu, Z.; Liu, H.; Xi, S.; Shui, Y.; Wang, J.; Liu, R.; Lin, J. Fractal analysis of pores and the pore structure of the Lower Cambrian Niutitang shale in northern Guizhou province: Investigations using NMR, SEM and image analyses. Mar. Pet. Geol. 2018, 99, 416–428. [Google Scholar] [CrossRef]
  27. Tripathy, A.; Kumar, A.; Srinivasan, V.; Singh, K.; Singh, T. Fractal analysis and spatial disposition of porosity in major indian gas shales using low-pressure nitrogen adsorption and advanced image segmentation. J. Nat. Gas Sci. Eng. 2019, 72, 103009. [Google Scholar] [CrossRef]
  28. Wang, M.; Xue, H.; Tian, S.; Wilkins, R.W.; Wang, Z. Fractal characteristics of Upper Cretaceous lacustrine shale from the Songliao Basin, NE China. Mar. Pet. Geol. 2015, 67, 144–153. [Google Scholar] [CrossRef]
  29. Tong, S.; Dong, Y.; Zhang, Q.; Elsworth, D.; Liu, S. Quantitative Analysis of Nanopore Structural Characteristics of Lower Paleozoic Shale, Chongqing (Southwestern China): Combining FIB-SEM and NMR Cryoporometry. Energy Fuels 2017, 31, 13317–13328. [Google Scholar] [CrossRef]
  30. Mandelbrot, B.B.; Passoja, D.E.; Paullay, A.J. Fractal character of fracture surfaces of metals. Nature 1984, 308, 721–722. [Google Scholar] [CrossRef]
  31. Mandelbrot, B.B. Multifractal measures, especially for the geophysicist. In Fractals in Geophysics; Birkhäuser: Basel, Switzerland, 1989; pp. 5–42. [Google Scholar]
  32. Xie, S.; Cheng, Q.; Ling, Q.; Li, B.; Bao, Z.; Fan, P. Fractal and multifractal analysis of carbonate pore-scale digital images of petro-leum reservoirs. Mar. Pet. Geol. 2010, 27, 476–485. [Google Scholar] [CrossRef]
  33. Shen, X.; Li, L.; Cui, W.; Feng, Y. Improvement of fractal model for porosity and permeability in porous materials. Int. J. Heat Mass Transf. 2018, 121, 1307–1315. [Google Scholar] [CrossRef]
  34. Xu, P.; Yu, B. Developing a new form of permeability and Kozeny–Carman constant for homogeneous porous media by means of fractal geometry. Adv. Water Resour. 2008, 31, 74–81. [Google Scholar] [CrossRef]
  35. Yu, B.; Cheng, P. A fractal permeability model for bi-dispersed porous media. Int. J. Heat Mass Transf. 2002, 45, 2983–2993. [Google Scholar] [CrossRef]
  36. Loucks, R.G.; Ruppel, S.C.; Wang, X.; Peng, S.; Zhang, T.; Rowe, H.D.; Smith, P.; Gao, C.; Wan, Y.; Fan, B.; et al. Pore types, pore-network analysis, and pore quantification of the lacustrine shale-hydrocarbon system in the Late Triassic Yanchang Formation in the southeastern Ordos Basin, China. Interpretation 2017, 5, SF63–SF79. [Google Scholar] [CrossRef]
  37. Cai, J.; Zhang, Z.; Wei, W.; Guo, D.; Li, S.; Zhao, P. The critical factors for permeability-formation factor relation in reservoir rocks: Pore-throat ratio, tortuosity and connectivity. Energy 2019, 188, 116051. [Google Scholar] [CrossRef]
  38. Cui, H.; Wang, Y.; Zhang, M.; Wang, W.; Zhao, C. A fractal method to calculate the permeability for compressible gas flow through a porous restrictor in aerostatic bearings. Int. J. Heat Mass Transf. 2018, 121, 437–452. [Google Scholar] [CrossRef]
  39. Zhou, X.P.; Zhao, Z. Digital evaluation of nanoscale-pore shale fractal dimension with microstructural insights into shale per-meability. J. Nat. Gas Sci. Eng. 2020, 75, 103137. [Google Scholar] [CrossRef]
  40. Kuila, U.; McCarty, D.K.; Derkowski, A.; Fischer, T.B.; Topór, T.; Prasad, M. Nano-scale texture and porosity of organic matter and clay minerals in organic-rich mudrocks. Fuel 2014, 135, 359–373. [Google Scholar] [CrossRef]
  41. Li, J. Reservoir Characteristics of Longmaxi Shale in the Southeast of Chongqing: A Case Study from Lujiao Outcrop Section and Well Yuye-1. Ph.D. Thesis, China University of Geosciences (Beijing), Beijing, China, 2013. [Google Scholar]
  42. Berthonneau, J.; Grauby, O.; Abuhaikal, M.; Pellenq, R.J.; Ulm, F.J.; Van Damme, H. Evolution of organo-clay composites with re-spect to thermal maturity in type II organic-rich source rocks. Geochim. Et Cosmochim. Acta 2016, 195, 68–83. [Google Scholar] [CrossRef]
Figure 1. SEM images of different matrix constituents and pores. (a) An overall view of mineral distribution and close-up views of different pore types, i.e., (b,c) InterP pores, (d) IntraP pores and (eg) OM-hosted pores, are shown in this figure.
Fractalfract 07 00803 g001
Figure 2. FIB-SEM image stacks and the reconstructed digital rocks. Results of three shale samples are displayed in (a), (b) and (c), respectively.
Fractalfract 07 00803 g002
Figure 3. Reconstructed subdomains for different subtypes of pores, i.e., (a) OM-associated InterP pores, (b) cement-associated InterP pores, (c) dissolution IntraP pores and OM pores, in the (d) clay flakes, (e) pyrite framboids and (f) in-place kerogen, respectively. Two subdomains for each subtype of pore were analyzed in this paper, while one of them is presented here for illustration.
Fractalfract 07 00803 g003
Figure 4. Fractal dimension determined based on PSDs for different subdomains of shale samples. The slopes of lines represent the value of 3 − DF.
Fractalfract 07 00803 g004
Figure 5. Fractal dimension determined based on 3D images for different subdomains of shale samples. The slopes of lines represent the value of −DB.
Fractalfract 07 00803 g005
Figure 6. Pore-type-dependent (a) fractal dimension and (b) porosity versus permeability. Experimental data of permeability originate from the work of Li (2013) for shale samples collected from the Weiyuan area as well [41].
Fractalfract 07 00803 g006
Table 1. A comparison of porosity, pore size and pore shape across different types of pores.
Type of PoreSubdomainSubdomain Size
(Voxel/10 nm3)
Porosity
(%)
Average Pore Diameter
(nm)
Average Aspect Ratio
InterP poreInterPOM_1400 × 400 × 3501.2127.631.88
InterPOM_2350 × 350 × 3501.2331.271.78
InterPcement_1400 × 400 × 3501.8530.901.71
InterPcement_2350 × 350 × 3502.0228.111.73
IntraP poreIntraPdissolution_1650 × 430 × 3600.13692.461.07
IntraPdissolution_2450 × 420 × 3800.115105.751.11
OM poreOMclay_1256 × 256 × 2562.9216.931.21
OMclay_2256 × 256 × 2562.0117.381.33
OMpyrite_1256 × 256 × 2561.8818.311.24
OMpyrite_2256 × 256 × 2561.1631.111.30
OM_1256 × 256 × 2564.8225.341.35
OM_2256 × 256 × 2563.9426.991.29
Disclaimer/Publisher’s Note: The statements, opinions and data contained in all publications are solely those of the individual author(s) and contributor(s) and not of MDPI and/or the editor(s). MDPI and/or the editor(s) disclaim responsibility for any injury to people or property resulting from any ideas, methods, instructions or products referred to in the content.

