1. Introduction
The cryptocurrency market has attracted significant attention due to its rapid growth, extreme volatility, and complex dynamics. In such an environment, pair trading has emerged as a promising statistical arbitrage strategy as it seeks to exploit temporary deviations between related assets while maintaining market neutrality [
1,
2,
3,
4,
5,
6]. However, implementing effective pair-trading strategies in cryptocurrency markets remains highly challenging. Unlike traditional financial markets, cryptocurrency assets exhibit strong market-wide co-movements, nonlinear dependencies, and time-varying correlations, which hinder the identification of more reliable candidate trading pairs. Empirical studies further reveal heterogeneous return dynamics in cryptocurrency markets, where certain assets exhibit strong momentum while others display mean-reverting patterns in their returns, depending on market conditions [
7]. In addition, practical constraints such as liquidity, transaction costs, and latency can limit the effectiveness of arbitrage strategies, further complicating the identification of reliable trading opportunities [
8]. As a result, these characteristics can obscure cross-correlation structures in that the return variation is unexplained by the selected market model, limiting the ability of conventional pair-trading approaches to consistently identify potential mean-reverting opportunities.
To address the pair-selection problem, a wide range of statistical approaches have been proposed in the literature, including Pearson correlation and cointegration. These methods aim to identify pairs of assets that exhibit strong co-movement or long-term equilibrium relationships, which can be exploited for mean-reversion-based trading strategies. However, these conventional approaches have inherent limitations when applied to cryptocurrency markets. Correlation-based methods primarily capture linear dependencies and may fail to adequately reflect the complex dynamics of financial time series. In addition, cointegration-based approaches rely on stable long-term equilibrium relationships, which are often unstable or short-lived in highly volatile and rapidly evolving cryptocurrency markets. As a result, pair selection based on these approaches can be unreliable, motivating the need for alternative methods that can better capture the underlying characteristics of financial time series. In parallel with these developments, recent studies have explored machine learning and reinforcement learning techniques for cryptocurrency trading, enabling adaptive portfolio allocation and trading decisions in dynamic market environments.
In response to these limitations, recent studies have explored fractal-based approaches as a means to better capture the complex dynamics of financial time series. According to the Fractal Market Hypothesis (FMH), financial markets exhibit long memory, scaling behavior, and self-similarity across multiple time scales, which cannot be adequately described by traditional linear models. In this context, the Hurst exponent has been widely used as a measure of persistence and mean-reverting behavior in financial markets, while also motivating the use of multifractal analysis to capture more complex and heterogeneous scaling dynamics. A growing body of literature supports the presence of fractal and multifractal properties in cryptocurrency markets. Early studies documented long memory and scaling behavior in Bitcoin and other digital assets, indicating deviations from market efficiency and the presence of persistent and anti-persistent dynamics [
9,
10,
11]. Subsequent research confirmed that cryptocurrency returns exhibit multifractal structures that vary across time horizons and market conditions [
12,
13]. In addition, studies incorporating entropy measures, wavelet analysis, and asymmetric multifractal frameworks have shown that market complexity and inefficiency are closely linked to regime changes and crisis periods [
14,
15,
16]. These findings indicate that cryptocurrency markets are inherently complex and characterized by time-varying multifractal dynamics, reinforcing the need for advanced analytical tools in trading applications. Additional studies have shown that multifractal properties can also provide insights into portfolio diversification and trading inefficiencies, further supporting their practical relevance in financial applications [
17]. Building on these findings, Blackledge et al. employed fractal-based indicators derived from FMH to improve cryptocurrency trading performance by identifying trend changes [
18]. In the context of pair trading, Bui and Ślepaczuk incorporated the generalized Hurst exponent into pair selection, demonstrating improved detection of mean-reverting opportunities when combined with conventional methods [
19]. Similarly, Grande et al. showed that anti-persistent behavior, corresponding to a Hurst exponent value less than 0.5, serves as an indicator of mean reversion in cryptocurrency markets [
2]. While these studies suggest that fractal-based measures provide useful information for identifying trading opportunities, most existing approaches rely on single-scale or aggregate measures of dependence, which may not fully capture the scale-dependent cross-correlation structures between assets.
Despite the usefulness of fractal-based measures such as the Hurst exponent, these approaches are typically limited to single-scale or aggregate characteristics of financial time series and, therefore, may not fully capture the complex cross-correlation structures between assets. In particular, pair trading relies on identifying the dependence structures between two assets, which requires a more detailed understanding of their joint dynamics across different time scales. To address this limitation, detrended cross-correlation analysis (DCCA) has been introduced as a method to quantify long-range cross-correlations between non-stationary time series by removing local trends [
20]. Building upon this framework, multifractal detrended cross-correlation analysis (MFDCCA) extends DCCA by incorporating a multifractal perspective, allowing the analysis of cross-correlations across multiple fluctuation magnitudes and time scales [
21]. Recent studies further support the relevance of multifractal approaches in cryptocurrency markets. For example, El Alaoui et al. applied MFDCCA to identify multifractal price–volume relationships in Bitcoin [
22], while Wątorek et al. reported long-range multifractal cross-correlations between major cryptocurrencies [
23]. In addition, Opryshko showed that multifractal properties vary across different market regimes [
24], and Zitis et al. and Lee et al. demonstrated that the complexity of cryptocurrency returns depends on regime-specific dynamics [
25,
26]. These findings indicate that cross-correlations in cryptocurrency markets are inherently scale-dependent and evolve across market conditions. Therefore, MFDCCA provides a more comprehensive characterization of the dependence structure between assets, making it a suitable approach for identifying robust trading pairs in cryptocurrency markets.
Recent research has made much progress in the use of multifractal techniques in the analysis of financial markets. Lee and Choi applied MF-DFA to assess the market efficiency of developed, emerging, and frontier equity markets, showing that high time-varying multifractality and high persistence are found in less efficient markets and directly hint at the application of these frameworks to highly volatile assets such as cryptocurrencies [
27]. On this basis, Lee and Choi examined the market efficiency spillover of Bitcoin and the standard assets (DXY, crude oil, and S&P 500) through MF-DFA and TVP-VAR [
28]. Their results emphasize the point that Bitcoin is a net sending of market inefficiency, and the common market-wide factors may dynamically distort the observed relationships between assets. Moreover, Cho and Kim [
29] added asymmetric fractal uncertainty, which is based on the multifractal properties, into dynamic Black–Litterman portfolio optimization to demonstrate the practical importance of uncertainty modeling using fractals in risk management and portfolio construction in uncertain markets.
However, asset returns are often influenced by common market-wide factors, which can induce co-movements across assets that do not necessarily reflect the cross-correlation structures that remain after removing the selected market component by using the selected market factor. This issue is particularly pronounced in cryptocurrency markets, where strong market-wide dynamics frequently drive synchronous price movements across assets. In this context, Lee et al. highlighted the importance of separating systematic and residual returns in cryptocurrency time-series analysis using a single-index market-model filtering approach, showing that market-wide effects can significantly distort the observed dependence structure between assets [
26]. This issue is especially critical for pair trading, where the objective is to identify market-adjusted cross-correlation structures that may provide candidate trading opportunities, rather than correlations driven by overall market movements. Despite this, most existing studies on fractal and multifractal analysis in cryptocurrency markets focus on raw return series without explicitly removing market-wide influences. Furthermore, although MFDCCA has been widely used to analyze multifractal cross-correlations, its application to pair trading remains limited.
Table 1 situates these methodological strands relative to one another and highlights how rarely they have been combined.
This study proposes a multifractal-based pair-trading framework that integrates single-index market-model filtering with MFDCCA to address the limitations of existing approaches. Specifically, we first apply a single-index market-model regression to decompose cryptocurrency returns and extract residual components by removing the dominant market-related component. We then employ MFDCCA on these filtered residual series to analyze scale-dependent cross-correlation structures and identify candidate trading pairs. A market-neutral trading strategy is subsequently constructed to exploit mean-reverting opportunities in cryptocurrency markets.
The key contributions of this study are threefold. First, we introduce a market-model-based filtering step into the pair-trading framework to characterize return variation unexplained by the selected market model prior to cross-correlation analysis. Second, we apply MFDCCA to the filtered return series to analyze cross-correlations across multiple time scales. Third, we provide comprehensive empirical evidence that the integration of market-model filtering and multifractal analysis improves risk-adjusted performance under the evaluated experimental settings and highlights the trade-offs observed across different market conditions and parameter settings.
Table 1 summarizes prior cryptocurrency studies grouped into four methodological strands: single-asset fractal characterization, cross-asset MFDCCA, Hurst-based pair trading, and market-model-based filtering. As shown in the Table, these strands have largely been investigated independently, with little attention given to integrating market-factor filtering and multifractal dependence analysis within a unified trading framework. This leaves open a clear research gap: whether removing the linear market component through a market-model filter prior to estimating multifractal cross-correlations improves cryptocurrency pair selection and subsequent trading performance.
The remainder of this paper is organized as follows.
Section 2 describes the proposed methodology, including the market-model-based residual extraction and the multifractal detrended cross-correlation analysis (MFDCCA) used for pair selection.
Section 3 presents the data description and experimental design.
Section 4 reports the empirical results and evaluates the performance of the proposed approach against benchmark methods.
Section 5 discusses the findings, highlights practical implications, and concludes the paper. Finally, limitations and directions for future research are addressed in
Section 6.
2. Methods
In this study, we propose a multifractal-based pair-trading framework for the cryptocurrency market. The proposed methodology consists of three main steps: residual extraction, pair identification, and trading strategy construction. First, a single-index market-model regression is used to remove the linear market component from cryptocurrency returns and obtain market-adjusted residual returns. This filtering process removes the dominant market-wide effect represented by the selected market index and facilitates the analysis of return variation unexplained by the selected market factor, thereby enabling a more precise characterization of cross-correlation structures in the market-adjusted residual returns. Second, multifractal detrended cross-correlation analysis (MFDCCA) is applied to the residual series to identify cryptocurrency pairs by quantifying their multifractal cross-correlations. MFDCCA simultaneously characterizes long-range cross-correlations and multifractal structures across different moment orders and time scales.
This approach is particularly suitable for the cryptocurrency market, where nonlinear dependencies, non-stationarity, volatility clustering, and fat-tailed distributions limit the effectiveness of linear methods [
22,
31]. Furthermore, by incorporating detrended variations, MFDCCA mitigates spurious correlations caused by non-stationarity [
20,
21]. More specifically, MFDCCA first partitions the integrated time series into segments and removes the local polynomial trend within each segment before estimating the covariance between the two series. Consequently, the cross-correlation is computed from the detrended fluctuations rather than from the original non-stationary observations. This procedure reduces the influence of common trends, slow-moving components, and other non-stationary effects that may otherwise produce artificially inflated or spurious correlations. As a result, the estimated multifractal cross-correlations more accurately characterize the scale-dependent dependence structure in the market-adjusted residual returns, providing a basis for identifying candidate trading pairs within the proposed framework. These selected pairs are subsequently evaluated using the proposed mean-reversion trading strategy to assess their statistical arbitrage potential. Finally, based on the selected pairs, the proposed statistical arbitrage strategy is implemented to evaluate trading performance in the cryptocurrency market.
2.1. Capital-Asset-Pricing Model
A single-index market model (commonly known as the CAPM regression equation) is employed as the first step in the proposed framework to remove the dominant market-wide component from cryptocurrency returns. This preprocessing step facilitates the characterization of cross-correlation structures in market-adjusted residual returns as the proposed pair-selection framework seeks to identify relationships that are not primarily driven by the common market factor. Based on Markowitz’s portfolio theory [
32], the single-index market-model filter decomposes asset returns into a market-related component and a residual component. This decomposition enables the subsequent MFDCCA analysis to focus on return variation unexplained by the selected market factor. The return
is defined in Equation (
1).
where
denotes the closing price of asset
i at time
t. We use simple returns due to the high volatility of cryptocurrency markets. The CAPM describes the relationship between the expected excess return of an asset and that of the market portfolio, as defined in Equation (
2).
where
,
,
, and
denote the expected return of asset
i, the expected market return, the risk-free rate, and the market sensitivity, respectively. Throughout this study, an annual risk-free rate of
is assumed and converted to its daily equivalent as
To extract the residual return component, the CAPM regression is estimated using the ordinary least squares method, as shown in Equation (
3).
In this formulation, the term
represents the systematic component of the asset return, capturing the portion explained by market-wide movements. The intercept
denotes the abnormal return (alpha), which reflects the average return of the asset not explained by market exposure. Therefore, the non-systematic component consists of
, where
captures time-varying residual-return fluctuations. The residual
represents the remaining variation after removing the linear market effect from
. As defined in Equation (
3), the residual series
represents the return variation of asset
i that is unexplained by the selected market index.
Although Equation (
3) is formally identical to the standard CAPM regression, it is employed in this study solely as a single-index market model for statistical filtering rather than as a test of CAPM equilibrium or asset-pricing validity. A single-factor specification was adopted as a parsimonious and interpretable filter, with the primary goal of removing the dominant market-wide component for pair identification rather than achieving a complete return decomposition. Although multifactor models, principal component analysis (PCA), or dynamic factor models could capture additional systematic sources of variation in cryptocurrency returns, they introduce substantially greater estimation complexity, require more parameters, and risk overfitting in the rolling-window setting of this study. Following [
26], who employed a single-index market-model filter for cryptocurrency return analysis, the selected market-model specification removes the variation explained by the chosen cryptocurrency market index while retaining the market-model residual returns for subsequent MFDCCA analysis. This approach provides a practical balance between interpretability, computational feasibility, and statistical filtering for the purpose of pair selection.
The residual series, , should, therefore, be interpreted as the return variation unexplained by the selected market factor rather than as a purely residual return in the strict economic sense. Cryptocurrency returns are influenced by additional common drivers, including liquidity conditions, momentum effects, investor sentiment, regulatory developments, technological factors, and volatility shocks, which are not explicitly modeled within the single-factor specification.
It is important to distinguish the roles of the filtering and trading stages. Traditional pair-trading strategies rely on mean reversion in the spread between two assets. A market-model filter serves purely as a preprocessing (market-adjustment) step to remove the dominant systematic component from individual asset returns. The actual pair-trading strategy including spread construction, divergence detection, and convergence-based execution is performed exclusively on the filtered residual series. Consequently, the filtering stage does not alter the mean-reversion or convergence principles underlying the trading strategy; instead, it provides market-adjusted inputs by reducing market-wide co-movements, thereby allowing MFDCCA to better capture cross-correlation structures in returns unexplained by the market index.
The primary purpose of the market-model filter is to improve pair selection by removing the dominant market-wide component, thereby allowing MFDCCA to analyze cross-correlation structures in returns that are less contaminated by broad market movements. Any observed improvements in trading profitability, risk-adjusted performance, or portfolio stability are, therefore, interpreted as indirect consequences of improved pair selection rather than as direct objectives of the filtering procedure itself.
2.2. Multifractal Detrended Cross-Correlation Analysis
To identify cryptocurrency pairs exhibiting cross-correlation structures, we employ multifractal detrended cross-correlation analysis. MFDCCA extends detrended cross-correlation analysis (DCCA) within a multifractal framework [
20,
21,
33].
Let
and
denote two non-stationary time series of equal length
N. The profiles are constructed as expressed in Equation (
4).
where
and
denote the sample means of
and
, respectively. Then, the profiles are divided into
segments of length
s, and the same procedure is repeated from the opposite direction, resulting in
segments. The detrended covariance is given in Equation (
5).
where
and
denote the local trends of the profiles in segment
. Then, based on the detrended covariance, the
q-order fluctuation function is defined in Equations (6) and (7).
For
, the fluctuation function cannot be directly evaluated from Equation (
6) due to the singularity in the exponent
, and is, therefore, computed using logarithmic averaging. Where
, for
, the fluctuation function is defined by Equation (
6), whereas for
, it is given by Equation (
7). Subsequently, if long-range cross-correlations exist, the fluctuation function follows a power-law relationship, as shown in Equation (
8).
where
shows the scaling behavior of significant and minor fluctuations of positive and negative
q, respectively. If the value of
differs with
q, the mutual correlation between two time series varies, and it exhibits multifractality; if not, it is categorized as monofractal. Accordingly, the degree of multifractal cross-correlation is measured as formulated in Equation (
9).
where
and
denote the maximum and minimum values of
, respectively. A larger
indicates stronger multifractal cross-correlation between two series. To further assess multifractal cross-correlations, we consider the Rényi exponent as defined in Equation (
10).
where
denotes the Rényi exponent and
is the generalized Hurst exponent. A nonlinear dependence of
on
q indicates multifractal cross-correlation, whereas a linear relationship implies monofractal behavior [
31]. In addition, multifractality can be characterized by the singularity strength width
and the multifractal spectrum
, obtained via the Legendre transform, as shown in Equations (11) and (12).
where
denotes the singularity strength, also known as the Hölder exponent. The multifractal spectrum
is a concave function of
when multifractal cross-correlation is present. Another indicator for measuring the degree of multifractality is shown in Equation (
13).
where
represents the width of the singularity spectrum. These measures are interpreted within their theoretical bounds. A larger value of
indicates a wider and more heterogeneous singularity spectrum, reflecting greater multifractal complexity. Accordingly,
is interpreted as a descriptor of multifractal behavior rather than a direct measure of cross-correlation strength.
In this study, multiple multifractal characteristics, including , the scaling exponent , and the width of the multifractal spectrum , are jointly used as selection criteria. Cryptocurrency pairs are selected according to the predefined thresholds on the MFDCCA measures, favoring pairs with more consistent multifractal cross-correlation characteristics.
2.3. Pairs Trading
Pairs trading is a market-neutral strategy that seeks to profit from temporary price divergences between two related assets [
34,
35,
36]. The strategy takes a long position in the relatively undervalued asset and a short position in the relatively overvalued asset, based on the assumption that the spread between the two assets eventually reverts to its equilibrium level.
The pair-formation stage identifies candidate pairs with favorable statistical properties for mean reversion. In this study, pairs are constructed based on the multifractal cross-correlation structure obtained from MFDCCA. A cryptocurrency pair
is selected if it satisfies the following conditions, as defined in Equation (
14).
where
denotes the bivariate Hurst exponent at
,
represents the range of the generalized Hurst exponent, and
denotes the width of the multifractal spectrum. The condition
ensures anti-persistent cross-correlation, indicating a tendency for reversal in relative price movements. The constraint
limits excessive multifractality, implying more homogeneous scaling behavior across fluctuations and, thus, more scale-dependent cross-correlation structures. Similarly,
restricts the width of the multifractal spectrum, reducing structural complexity and selecting pairs with characteristics associated with potential mean-reverting behavior in residual returns. Together, these conditions select pairs that exhibit consistent and stable cross-correlation patterns, making them more suitable for subsequent mean-reversion-based trading strategies. However, these structural conditions do not provide information on the timing of convergence. To ensure that trades are initiated under meaningful divergence, a divergence filter is applied. The cumulative return of asset
i over a lookback window of
k days is defined in Equation (
15).
where
denotes the price of asset
i at time
t. The spread between assets
i and
j is then defined in Equation (
16).
where
is defined analogously. A trade is executed only if the divergence exceeds a predefined threshold, as expressed in Equation (
17).
where
denotes the divergence threshold.
Once the divergence condition is satisfied, a market-neutral long–short position is constructed. The asset with the lower cumulative return is assigned a long position, while the asset with the higher cumulative return is shorted, anticipating convergence. The daily return of pair
is defined in Equation (
18).
where
and
denote the daily returns of the long and short legs, respectively. And the division by 2 ensures equal capital allocation to the long and short positions. The equal-weighted portfolio return is then defined in Equation (
19).
where
denotes the number of active pairs at time
t. The portfolio is rebalanced weekly with a fixed holding period. The weekly return is calculated in Equation (
20).
where
denotes the number of trading days within the holding period. To account for transaction costs, a proportional cost of
(0.1% per asset per side) is applied at both the opening and closing of each weekly trading cycle. Since each pair trade simultaneously consists of one long position and one short position, transaction costs are incurred on two assets at entry and again on two assets at exit. Specifically, a cost of
is deducted from the portfolio return on the first trading day of each holding period (position entry), and a further
is deducted on the final trading day (position exit), as expressed in Equation (
21).
where the deduction is applied only on day
(position entry) and day
(position exit) of each weekly trading cycle. No additional transaction costs are incurred during the intermediate holding days, since the selected pairs remain unchanged until the next scheduled weekly rebalancing and only daily mark-to-market returns are accumulated. Consequently, the total round-trip transaction cost per completed pair trade is
. This transaction-cost treatment is consistent with prior empirical studies on pairs trading [
34,
37], where transaction costs are incurred when trades are executed (i.e., at position entry and exit), rather than being accumulated on a daily basis during the holding period.
The strategy parameters, including the divergence lookback window
k, divergence threshold
, and the method-specific thresholds
,
, and
, were selected through a grid search over predefined ranges (summarized in
Table 2). For each parameter combination, the full trading strategy was evaluated on the in-sample period using the annualized Sharpe ratio as the objective function, and the configuration yielding the highest Sharpe ratio was chosen as the baseline. To evaluate the sensitivity of the results and mitigate concerns of parameter overfitting, a comprehensive sensitivity analysis was subsequently performed by varying each parameter individually while holding the others as fixed. The results indicate that the proposed framework exhibits competitive performance across a broad range of reasonable parameter values, indicating that the main findings are not driven by a narrowly optimized configuration.
2.4. Alternative Pair-Selection Methods
To evaluate the effectiveness of the proposed MFDCCA-based pair-selection framework, we compare it with several conventional approaches, including DCCA, cointegration, and Pearson correlation. To ensure a fair comparison, all pair-selection methods are applied to the same market-model-filtered residual-return series obtained from the single-index market-model regression described in
Section 2. Consequently, the methods differ only in their pair-selection criteria rather than in the preprocessing applied to the data. Each method is then used to construct candidate pairs, which are evaluated under the same trading strategy described in the previous subsection. This enables a consistent comparison of pair-selection methods and their resulting trading performance.
The detrended cross-correlation analysis (DCCA) is employed to quantify long-range cross-correlations between non-stationary time series [
20]. The fluctuation function follows a scaling relationship, as expressed in Equation (
22).
where
H denotes the bivariate Hurst exponent. A pair is selected if the conditions in Equation (
23) are satisfied.
where
denotes the DCCA correlation coefficient. While DCCA captures long-range cross-correlations, it is limited to a single scaling exponent and does not distinguish between fluctuations of different magnitudes. As a result, it cannot fully characterize the multifractal cross-correlation structures observed in cryptocurrency markets.
The cointegration-based approach identifies pairs whose log-price series share a long-run equilibrium relationship [
38,
39]. The Engle–Granger two-step procedure is applied, and a pair is selected if the residual series is stationary, as defined in Equation (
24).
where
denotes the p-value of the Augmented Dickey–Fuller test.
The Pearson correlation coefficient is used as a linear dependence benchmark [
37,
40]. For each pair, the correlation is computed over a rolling window, and a pair is selected if the condition in Equation (
25) is satisfied.
where
denotes the Pearson correlation coefficient between assets
i and
j.
These benchmark methods primarily capture linear or single-scale cross-correlation structures, whereas the proposed MFDCCA framework incorporates multi-scale and multifractal characteristics. The comparative analysis, therefore, highlights the extent to which multifractal cross-correlation improves pair selection and trading performance.
2.5. Evaluation Metrics
To evaluate the performance of the proposed trading strategy, we consider a set of standard metrics capturing return, risk, and trading efficiency. Let denote the portfolio return on day t, where . The same annual risk-free rate of adopted in the filtering stage is used when computing the risk-adjusted performance measures.
The mean and standard deviation of returns are defined as in Equations (
26) and (
27).
where
and
denote the average return and volatility, respectively. The primary performance metric is the Sharpe ratio [
41], which measures risk-adjusted return, as defined in Equation (
28).
where 252 denotes the number of trading days in a year. A higher Sharpe ratio indicates better performance in terms of return per unit of risk. To complement this, we also consider downside risk and trading efficiency measures. The Sortino ratio is defined in Equation (
29).
where
denotes the downside deviation, which captures only negative deviations below the risk-free rate, as defined in Equation (
30).
To further evaluate trading efficiency, the gross profit and gross loss of the strategy are reported, as shown in Equations (
31) and (
32). Gross profit is defined as the sum of all positive daily portfolio returns, whereas gross loss is defined as the absolute value of the sum of all negative daily portfolio returns.
The profit factor is then computed as the ratio of gross profit to gross loss, as shown in Equation (
33).
To further evaluate downside risk, the maximum drawdown of the strategy is reported, as defined in Equation (
34). Let
denote the cumulative portfolio value at time
t, and let
denote the running maximum portfolio value. The maximum drawdown is computed as
where
A lower maximum drawdown indicates better preservation of portfolio capital by limiting the largest peak-to-trough decline in cumulative portfolio value over the evaluation period.
To evaluate the frequency of positive portfolio outcomes during active periods, the Positive Active Trading Day Percentage (%) is reported as the proportion of active trading days on which the portfolio generated a positive daily return. Active trading days are those with non-zero portfolio returns, and days with zero portfolio returns are excluded from the calculation. This metric summarizes the frequency of positive daily portfolio outcomes rather than the success rate of completed trades. It is defined in Equation (
36).
where
denotes the number of active trading days with positive portfolio returns, and
denotes the total number of active trading days. A higher positive active trading day percentage indicates that positive daily portfolio returns occurred more frequently during active trading periods.
To further characterize trading efficiency, the average gain-to-loss ratio is computed, as shown in Equation (
37). Unlike the profit factor, which compares cumulative gains and losses, the average gain-to-loss ratio compares the average magnitude of positive and negative daily portfolio returns.
where
Here, and denote the average positive and negative daily portfolio returns, respectively. The average gain-to-loss ratio characterizes the relative magnitude of positive and negative daily portfolio outcomes and should not be interpreted as a trade-level payoff measure. A larger value indicates greater asymmetry, where positive daily returns are larger in magnitude relative to negative daily returns.
Finally, pair-selection dynamics are assessed using the Pair Replacement Turnover, which quantifies changes in the selected trading pairs between consecutive weekly rebalancing dates. Specifically, it is computed from the symmetric difference between the pair sets selected in two successive weeks. Consequently, this metric reflects pair replacement frequency rather than conventional portfolio turnover based on changes in portfolio weights, traded capital, or notional exposure. The weekly pair replacement turnover is computed, as shown in Equation (
40).
where
denotes the set of active trading pairs during week
t, and ▵ denotes the symmetric difference between consecutive weekly pair selections. The annualized Pair Replacement Turnover is then computed as
where
M denotes the number of weekly rebalancing transitions. Lower annualized pair replacement turnover indicates more stable pair selection over time. However, this metric reflects changes in selected trading pairs rather than direct transaction volume or realized trading costs.
Together, these metrics provide a comprehensive assessment of return behavior, downside risk, trading efficiency, and pair-selection dynamics, with the Sharpe ratio serving as the primary measure of risk-adjusted performance.
3. Experiments and Data
3.1. Data
Daily price data for cryptocurrencies are obtained from Investing.com, while the S&P Cryptocurrency LargeCap Index is used as a proxy for the overall market and is sourced from S&P Global. The sample period spans from 1 January 2021 to 31 December 2025, covering 1304 trading days. This period includes multiple market regimes, such as the bull market of 2021, the bear market of 2022 (crypto winter), and subsequent phases of consolidation and recovery from 2023 to 2025. To initialize the rolling-window framework, an additional lookback period, starting from 1 January 2020, is included, although observations from 2020 are not used for performance evaluation.
The analysis focuses on 20 major cryptocurrencies selected to represent a broad cross-section of the digital-asset market. These include assets from various categories such as smart contract platforms, payment systems, decentralized finance protocols, and utility tokens. The selected assets are Bitcoin (BTC), Ethereum (ETH), Binance Coin (BNB), Cardano (ADA), Dash (DASH), XRP, Dogecoin (DOGE), Zcash (ZEC), Litecoin (LTC), Chainlink (LINK), Stellar (XLM), Monero (XMR), EOS, TRON (TRX), VeChain (VET), Cosmos (ATOM), Tezos (XTZ), NEO, Ethereum Classic (ETC), and Bitcoin Cash (BCH). This selection ensures sufficient diversity in market behavior while maintaining liquidity and data availability, which is important for evaluating cross-sectional cross-correlation structures.
To better understand the characteristics of the underlying data, we computed descriptive statistics for the daily return series.
Table 3 summarizes the distributional properties of all cryptocurrencies. The mean daily returns are relatively small but vary across assets, while the maximum and minimum values reflect the extreme price movements characteristic of cryptocurrency markets. Notably, Dogecoin (DOGE) shows an exceptionally large maximum return of 4.1418 and minimum return of −4.1559, accompanied by an extremely high kurtosis of 459.3369. These values originate from intense price swings during the May 2021 retail-driven speculative episode and are retained in their raw form to accurately represent the historical dataset used in the rolling-window multifractal analysis. The standard deviations are substantially higher than those observed in traditional financial assets, reflecting the high volatility of digital currencies. The Jarque–Bera (JB) test strongly rejects the null hypothesis of normality at the 1% significance level for all assets, which is further supported by high kurtosis values, indicating fat-tailed distributions and non-zero skewness, reflecting asymmetric return profiles. These characteristics highlight the presence of non-Gaussian and nonlinear dynamics in cryptocurrency returns, which motivates the use of multifractal methods. In addition, the Augmented Dickey–Fuller (ADF) test confirms that all return series are stationary at the 1% significance level, supporting the appropriateness of applying return-based time-series methods, including cross-correlation analysis and MFDCCA, in the proposed framework.
Notably, DASH (−41.68), NEO (−42.91), XMR (−45.46), and ATOM (−43.32) exhibit particularly large negative ADF statistics compared with the remaining cryptocurrencies. While all return series strongly reject the unit-root hypothesis, these assets display especially strong mean-reverting behavior in returns and a lower degree of persistence over time. Such characteristics are consistent with stationary return dynamics and support the suitability of these series for subsequent multifractal cross-correlation analysis.
Before analysis, all daily price series were examined for missing observations and aligned to the trading calendar of the S&P Cryptocurrency LargeCap Index. Any asset with missing values within the 250-trading-day lookback window was excluded for that week and reinstated in subsequent windows once sufficient data became available. No imputation or interpolation was applied at any stage. Simple returns were computed from consecutive closing prices and verified to be finite and free of missing values before CAPM estimation and feature extraction. For the cointegration benchmark, log-transformed price levels were used, while MFDCCA and DCCA computations applied explicit mean removal before cumulative profile construction.
3.2. Experiments
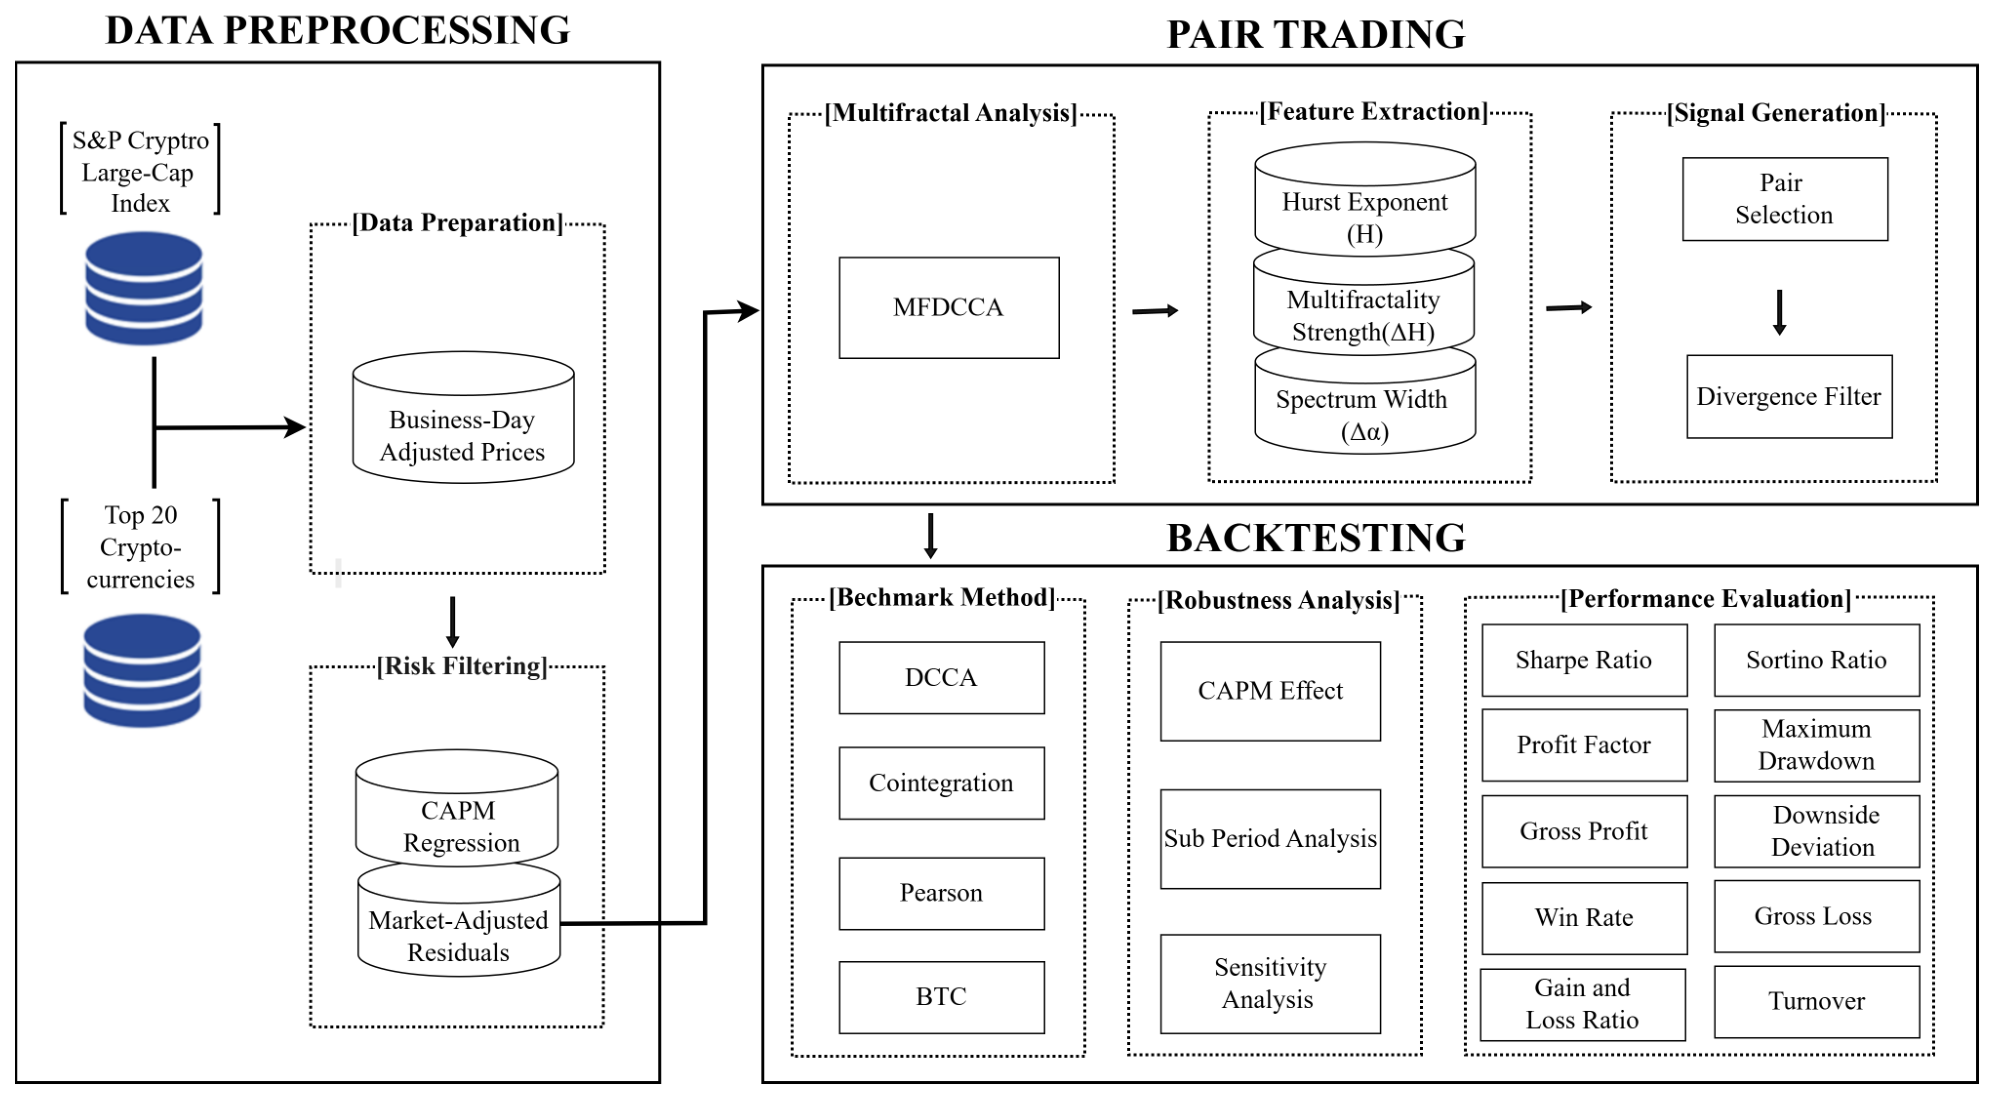
The overall experimental framework is illustrated in
Figure 1. The proposed pipeline consists of data preprocessing, pair trading, and backtesting and is implemented in a rolling-window setting. At the beginning of each trading week, a lookback window of 250 trading days is constructed using all available observations up to the previous trading day.
In the preprocessing stage, daily price data for selected cryptocurrencies and the S&P Cryptocurrency LargeCap Index are aligned to business days. Within each rolling window, the market-model regression (referred to as market-model-based filtering for consistency with the prior literature [
26]) is estimated using the index as a market proxy, and the filtered return series are obtained by removing the linear component explained by the selected market model. These filtered return series, representing return variation unexplained by the selected market model, are then used as inputs to the MFDCCA. From this analysis, three multifractal characteristics, namely the cross-correlation Hurst exponent
, the multifractal degree
, and the multifractal spectrum width
, are obtained and used for pair selection.
Pairs satisfying the multifractal selection criteria are further filtered using the divergence condition based on raw price dynamics. For each selected pair, a market-neutral long–short position is constructed and held for one week. The trading process is repeated on a weekly basis, and the resulting returns are aggregated into a continuous daily return series. The backtesting period spans from 2021 to 2025, where weekly returns are concatenated into a daily series. Weeks with no qualifying pairs are assigned zero returns so that all methods are evaluated over an identical set of observations.
To assess the effectiveness of the proposed approach, the MFDCCA-based strategy is compared with three benchmark pair-selection methods, namely DCCA, cointegration, and Pearson correlation, under identical trading rules. In addition, a passive benchmark, BTC buy-and-hold, is included for reference. The strategy is evaluated separately for each calendar year from 2021 to 2025 using the same optimal parameter set obtained from the grid search procedure.
Two additional analyses are conducted. First, the MFDCCA is applied directly to raw returns instead of market-model residuals, while keeping all other steps unchanged, in order to evaluate the impact of market filtering. Second, a one-at-a-time sensitivity analysis is performed by varying each parameter across its predefined range while fixing all other parameters at their optimal values. Performance is evaluated using a set of standard metrics, including the Sharpe ratio, Sortino ratio, and Profit Factor, all computed from the same daily return series to ensure comparability across methods.
4. Results
This section presents the empirical results of the proposed framework. We first examine the impact of the market-model filtering process on residual returns. Next, we analyze the multifractal characteristics of cryptocurrency pairs based on the filtered residuals. We then evaluate the profitability of the proposed trading strategy, followed by additional analyses through period-wise analysis, sensitivity analysis, and an assessment of the effect of the market-model filter.
4.1. CAPM Filtering Results
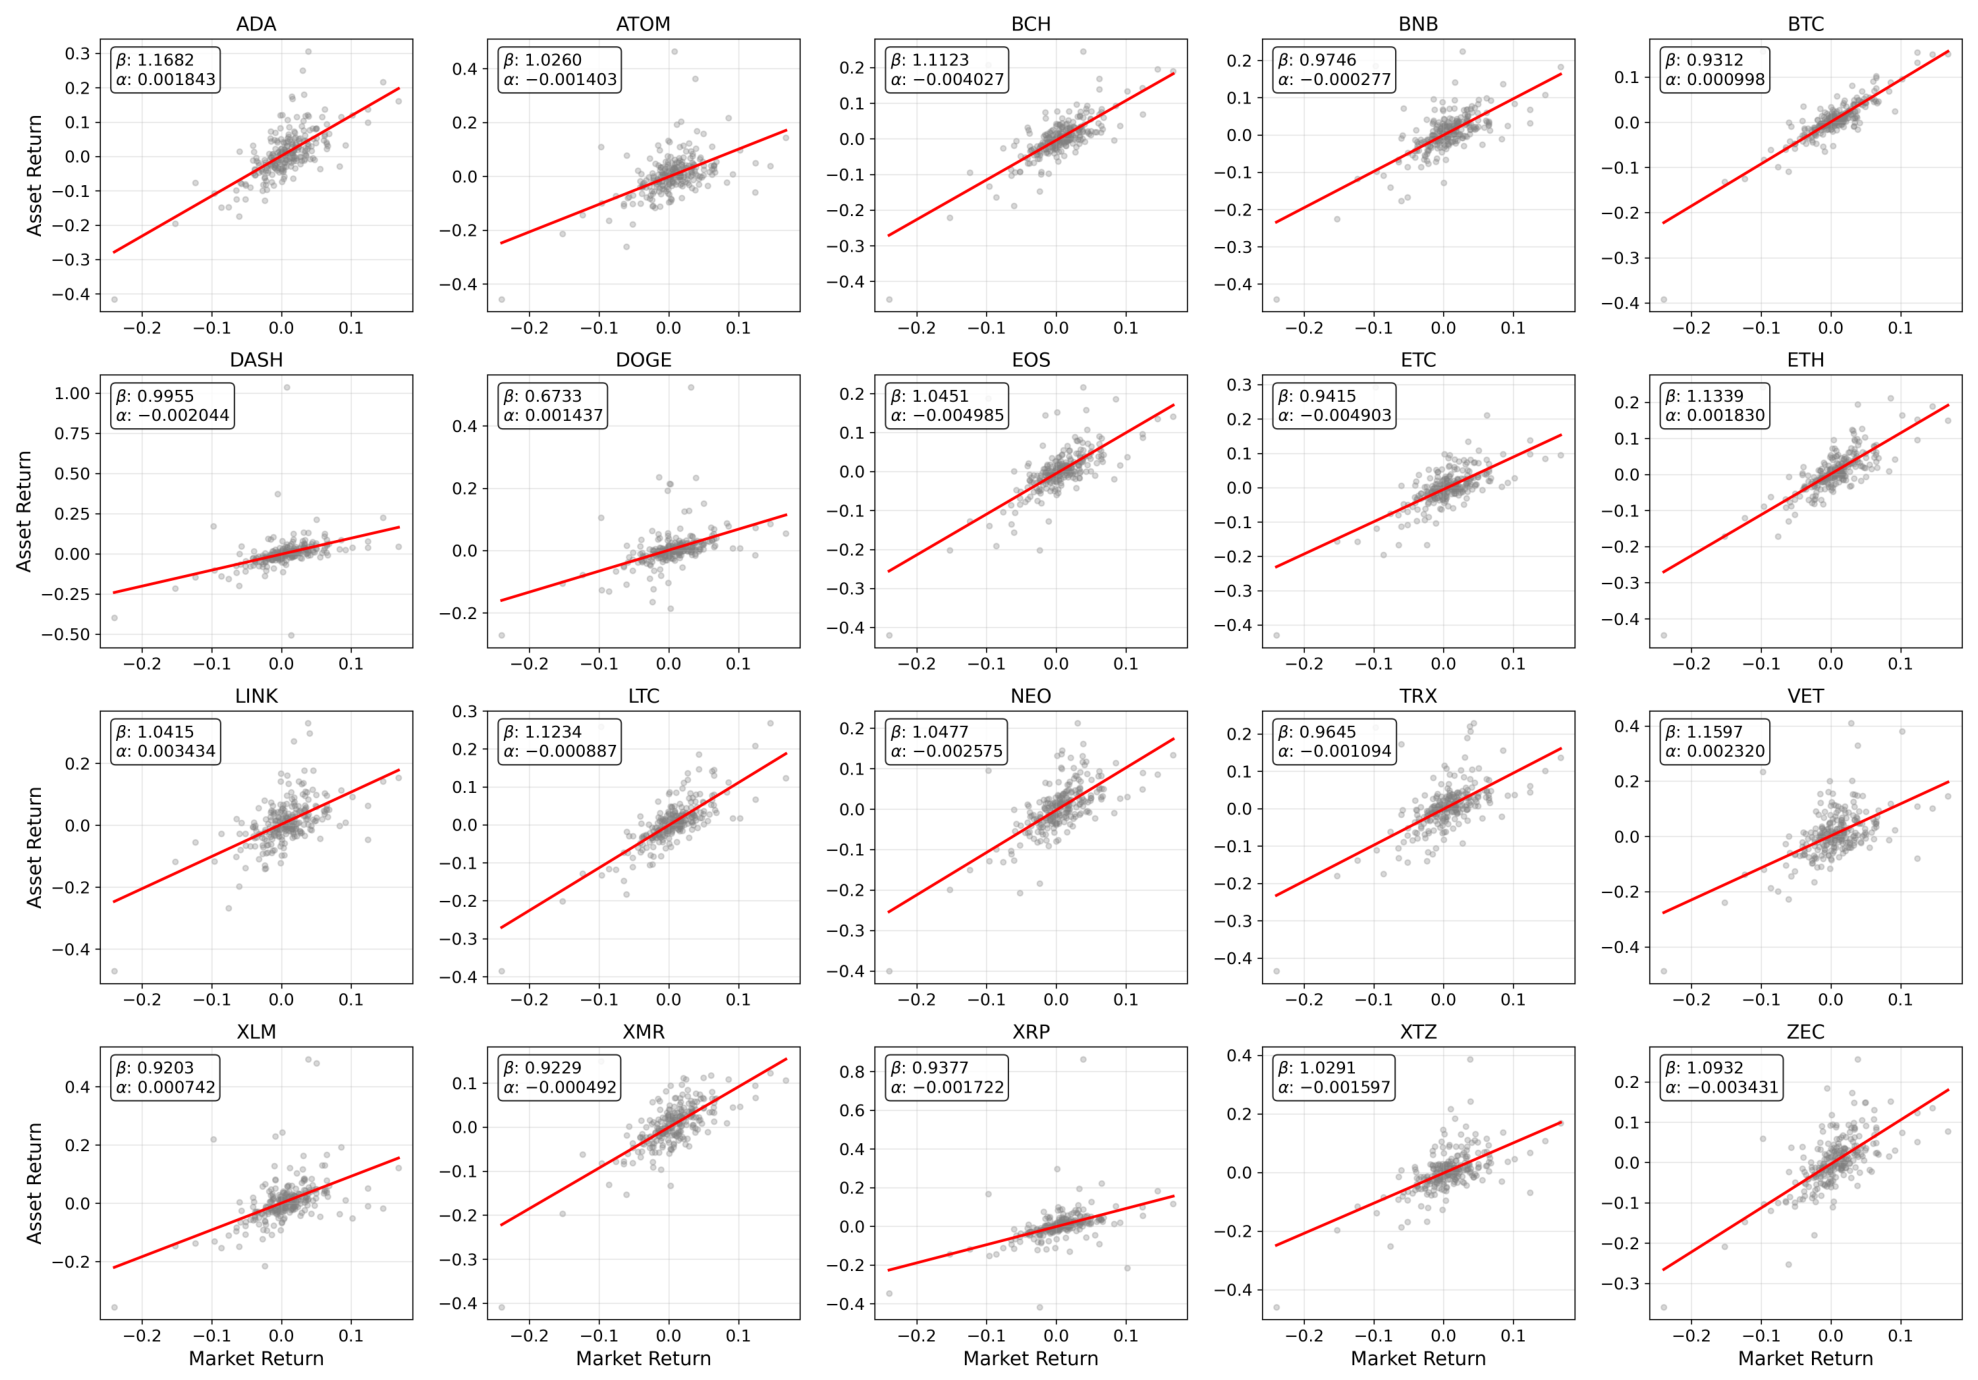
We first present the results of the filtering process, which decomposes cryptocurrency returns into systematic and residual returns. As shown in
Figure 2, the CAPM regression captures a clear linear relationship between individual cryptocurrency returns and the market index. The slope and intercept of the fitted regression line correspond to the estimated systematic risk coefficient
and the abnormal return intercept
, respectively. The overall positive slope across assets indicates strong systematic co-movement in the cryptocurrency market.
The estimated beta coefficients range from 0.67 (DOGE) to 1.17 (ADA). Eleven of the 20 assets exhibit , implying greater sensitivity to overall market movements, including ADA (1.1682), VET (1.1597), ETH (1.1339), LTC (1.1234), BCH (1.1123), and ZEC (1.0932). The remaining nine assets have , with BTC (0.9312), XRP (0.9377), and XLM (0.9203) showing similar but slightly lower market exposure. DOGE (0.6733) appears as a notable outlier with comparatively lower systematic risk. This finding is consistent with the unique trading behavior of DOGE. Unlike many large-cap cryptocurrencies whose returns are strongly linked to overall market movements, DOGE has historically been more influenced by asset-specific events, social media activity, retail investor sentiment, and speculative trading episodes. As a result, a smaller proportion of its return variation is explained by the broad cryptocurrency market factor, leading to a comparatively lower estimated beta coefficient in the present sample.
The estimated alpha coefficients are uniformly small, ranging from (EOS) to (LINK), indicating limited average abnormal returns after controlling for the selected market index. Seven assets, including LINK (0.003429), VET (0.002301), ADA (0.001823), ETH (0.001814), DOGE (0.001475), BTC (0.001006), and XLM (0.000752), exhibit marginal positive intercept estimates after controlling for market exposure. The remaining thirteen assets show negative intercept estimates, with EOS (), ETC (), BCH (), and ZEC () displaying the largest negative deviations. Overall, the intercept estimates are statistically indistinguishable from zero, suggesting no statistically significant average return unexplained by the selected single-index market model.
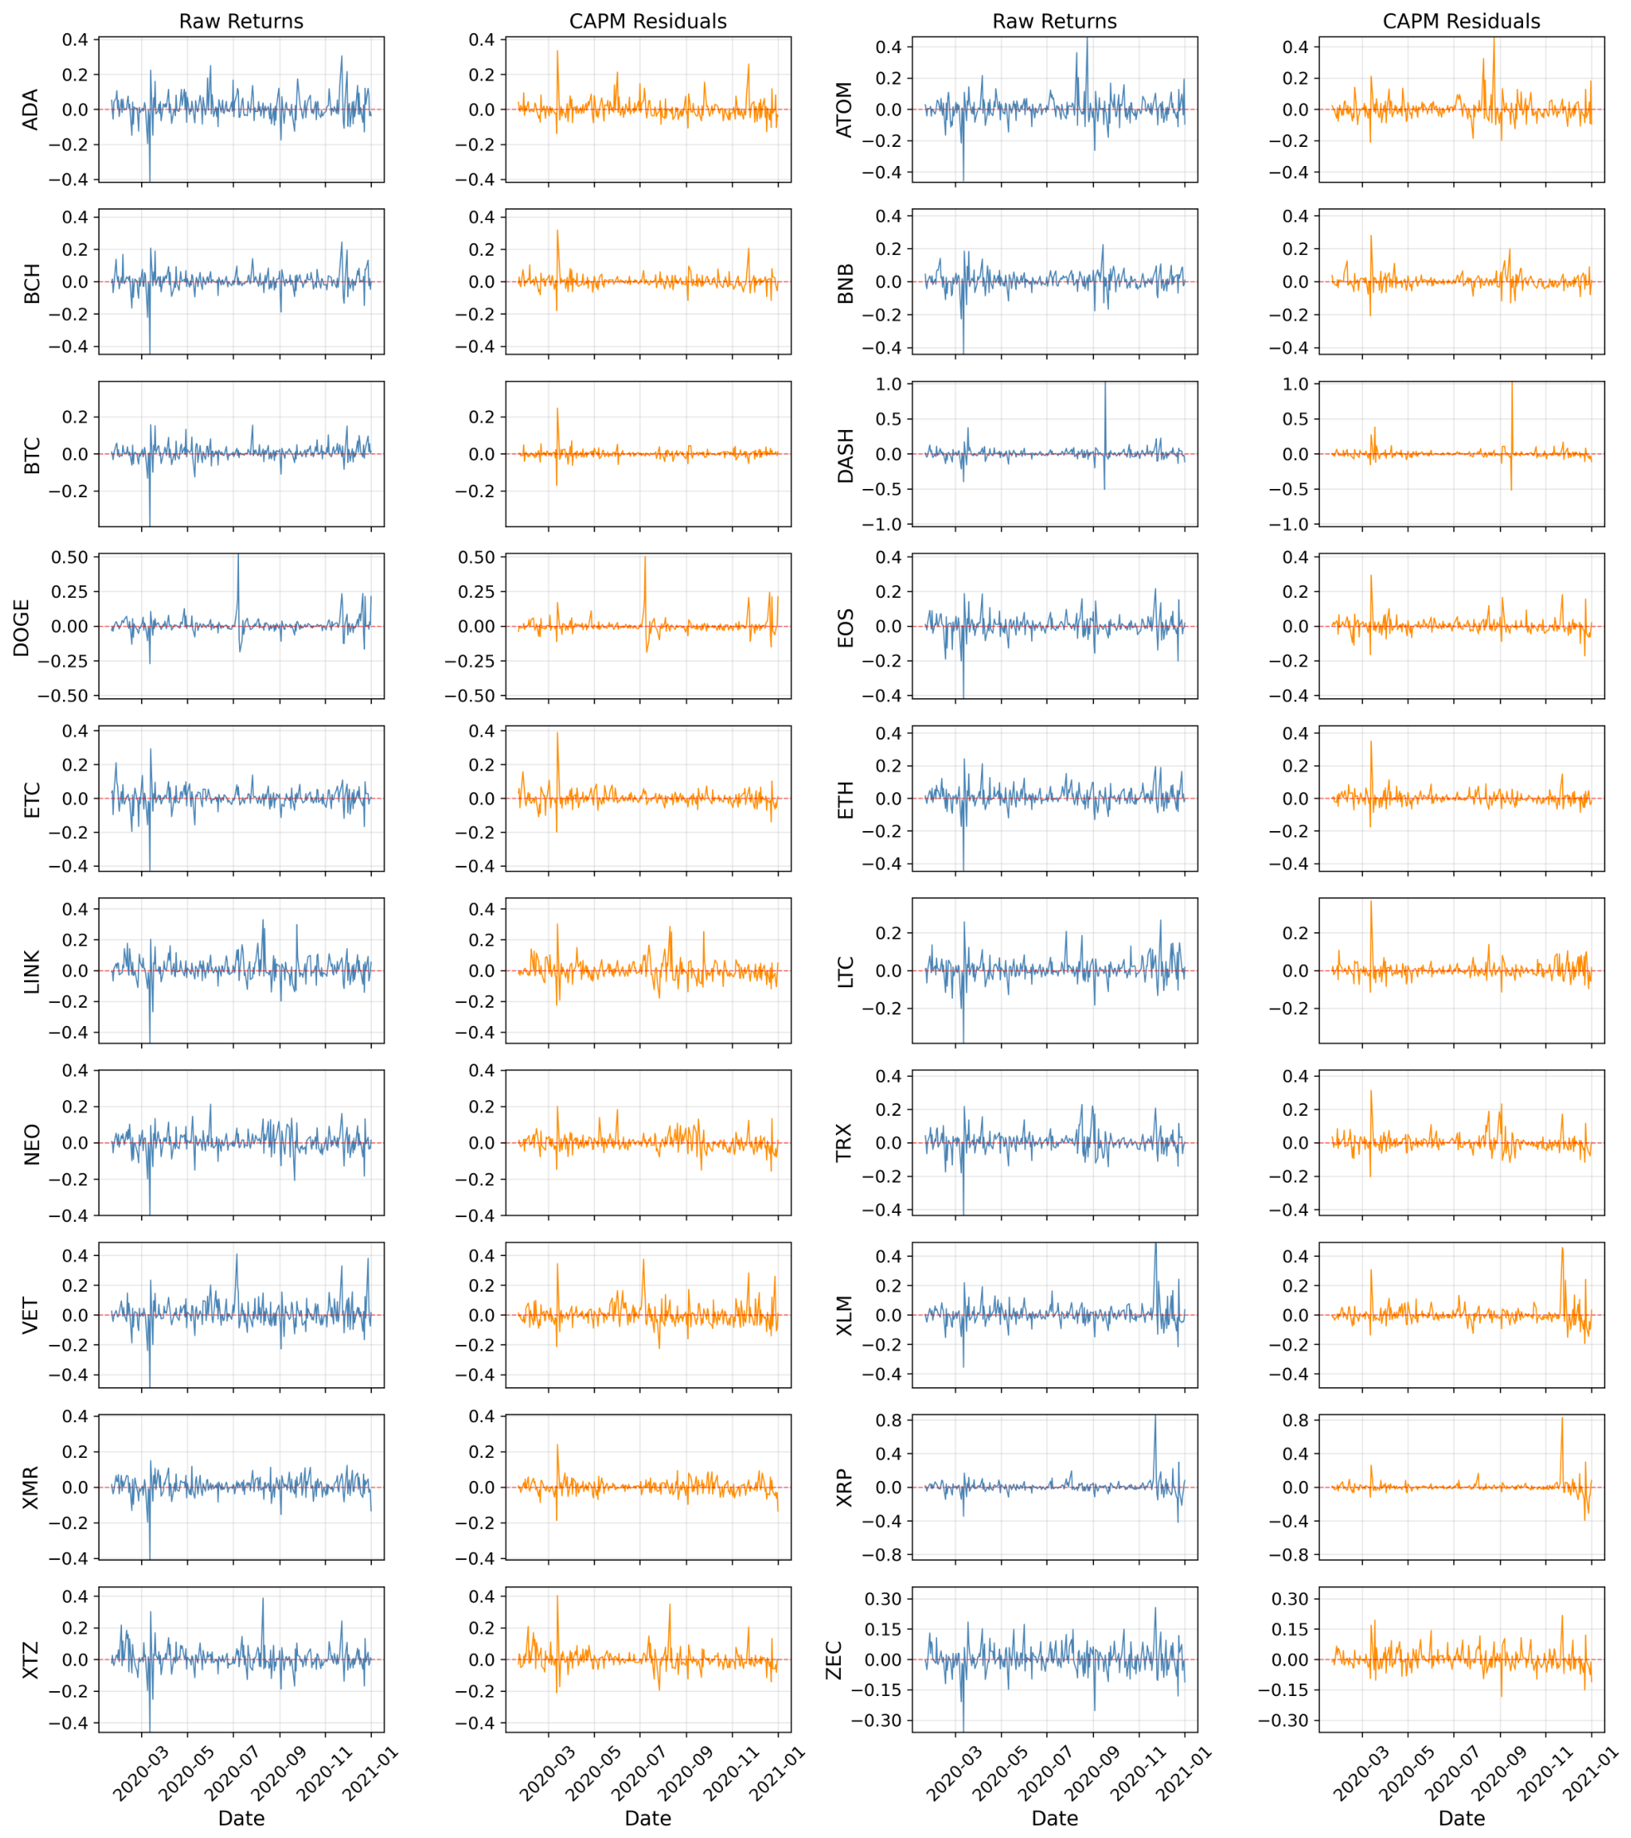
As shown in
Figure 3, the daily simple-return series (left panels) and market-model filter residual returns (right panels) illustrate the effectiveness of the filtering process. Each row corresponds to a different cryptocurrency, with the left panel representing the original return series and the right panel showing the filtered residuals. The residual series are centered around zero for all assets, indicating that the common market component has been effectively removed while preserving asset-specific fluctuations.
The strong systematic co-movement observed for BTC, ETH, LTC, and BNB is likely attributable to their dominant positions within the cryptocurrency market. These assets possess relatively large market capitalizations, high liquidity, and substantial investor participation, causing their returns to respond more strongly to common market-wide information, shifts in investor sentiment, and broader market conditions. Consequently, a larger proportion of their return variation is explained by systematic market factors. Assets with strong systematic co-movement, such as BTC, LTC, ETH, and BNB, exhibit relatively smoother residual dynamics with reduced amplitude compared to the original return series. This indicates that a large portion of their return variation is explained by market-wide factors. XMR also shows a similar pattern with reduced residual volatility. In contrast, assets such as DASH, XRP, DOGE, and VET maintain high residual volatility with pronounced spikes, indicating that their return dynamics are largely driven by residual shocks rather than systematic factors. Other assets, including ADA, BCH, LINK, ETC, EOS, TRX, and NEO, display moderate residual variability, suggesting a combination of systematic and asset-specific influences. Meanwhile, assets such as XTZ, ATOM, XLM, and ZEC exhibit favorable residual dynamics within a narrow range, implying a higher degree of systematic explainability.
These findings confirm that filtering removes the dominant market component and highlights asset-specific return dynamics while preserving heterogeneous volatility structures across assets. Importantly, the persistence of volatility clustering and heterogeneous fluctuations in the residual series indicates that nonlinear and scale-dependent dependencies remain after removing the common market component. This suggests that conventional linear dependence measures may be insufficient to fully capture the underlying cross-asset relationships, motivating the use of MFDCCA to characterize multifractal cross-correlation structures.
4.2. Multifractal Characteristics of Cryptocurrency Pairs
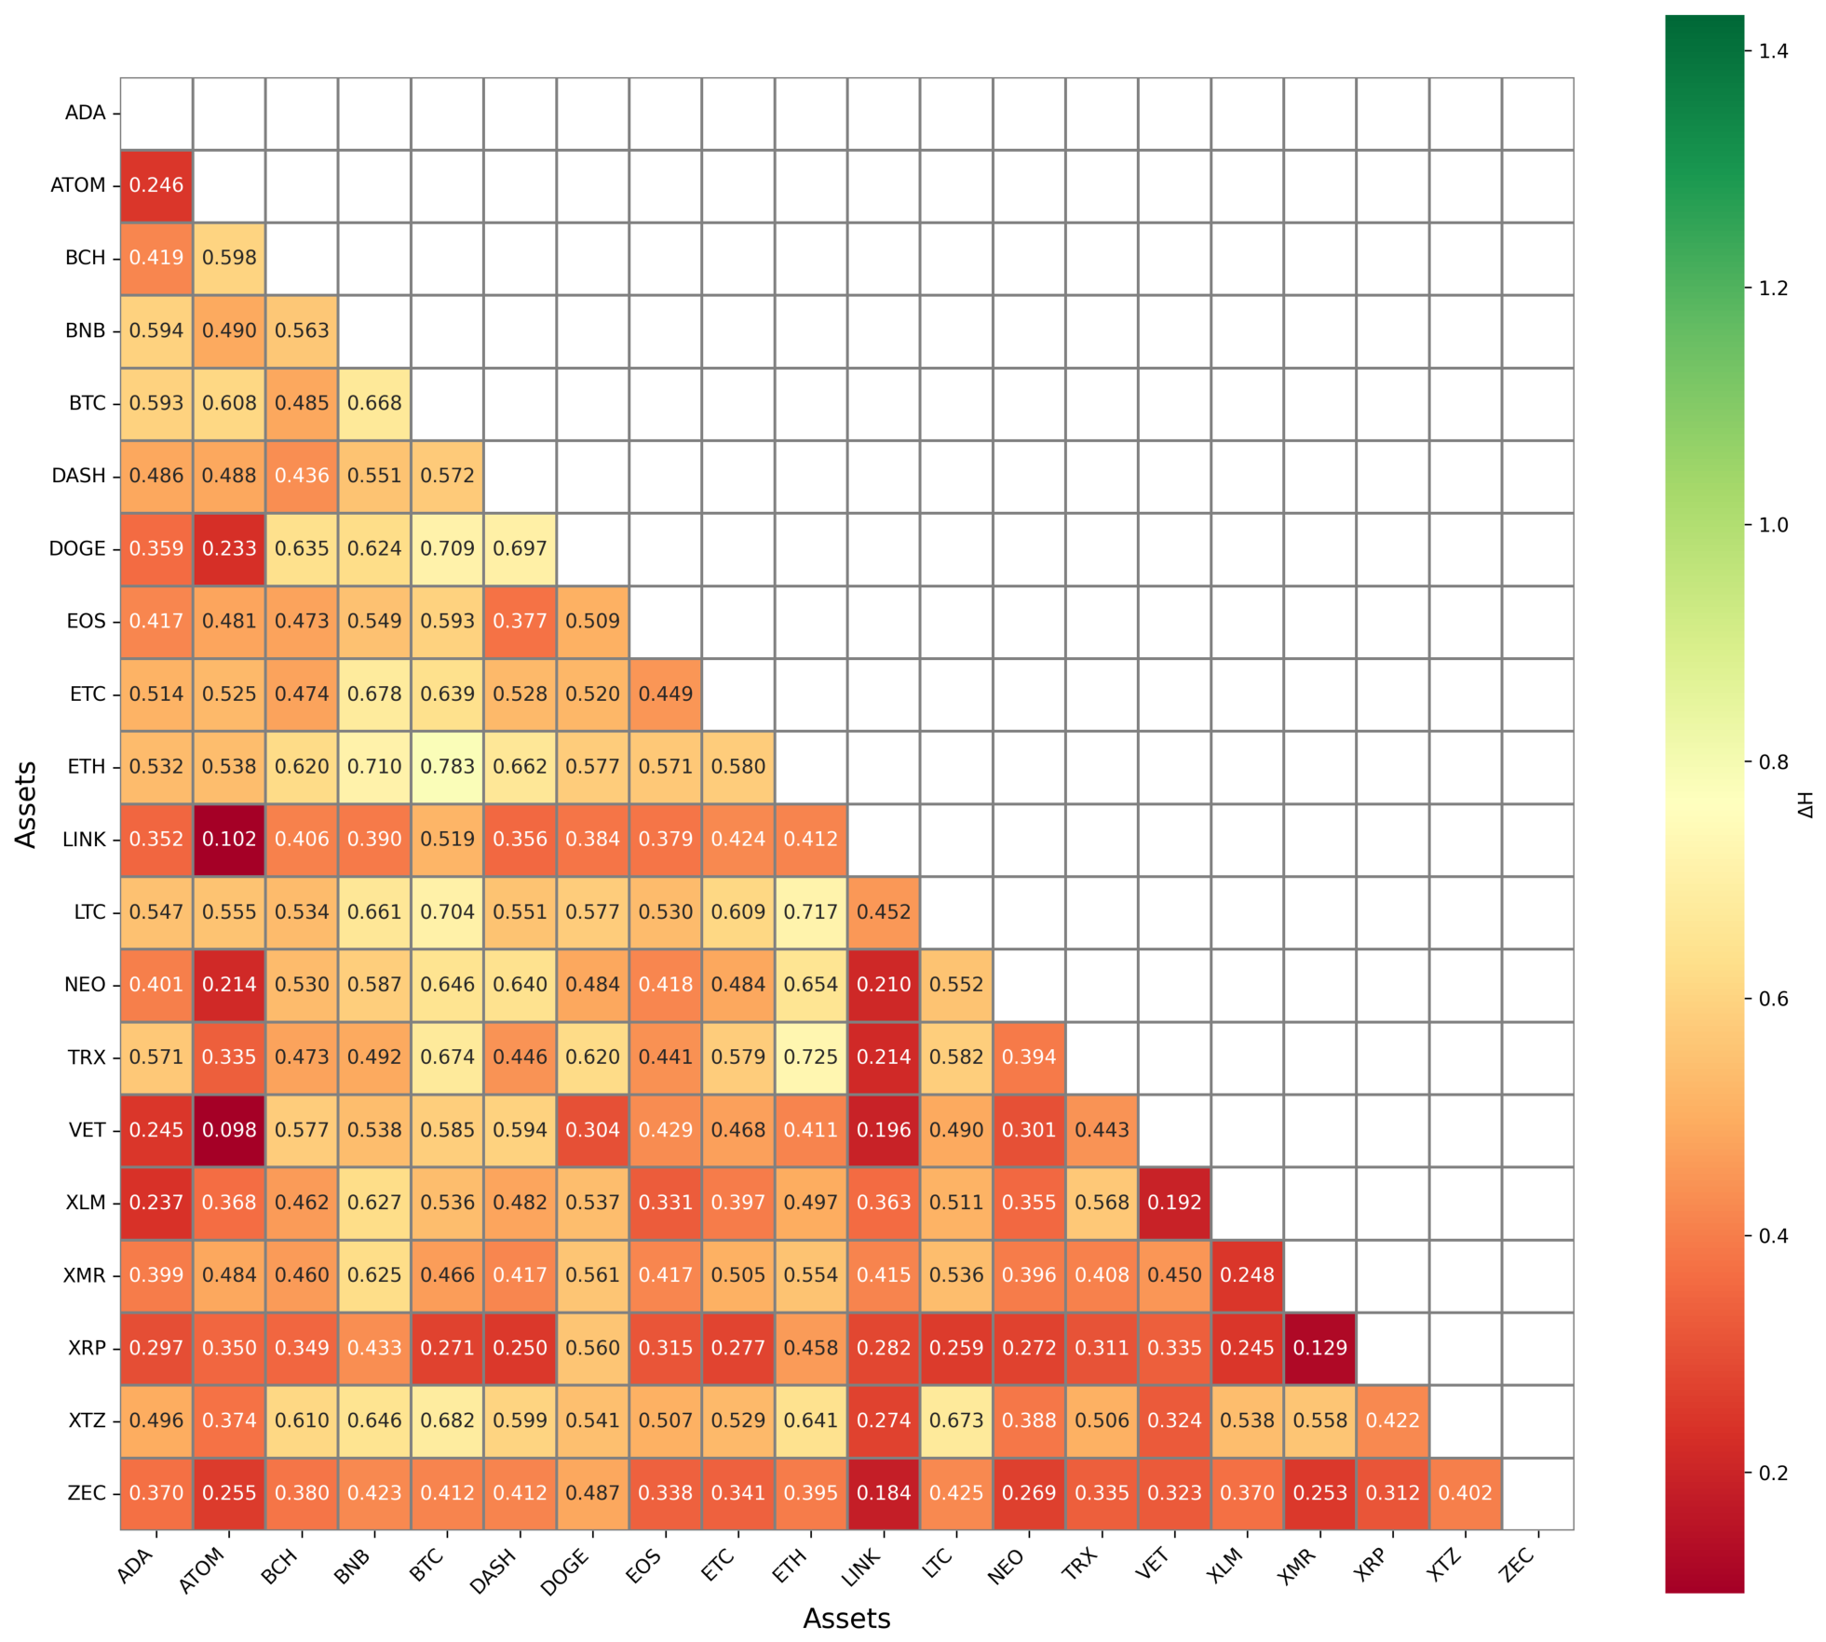
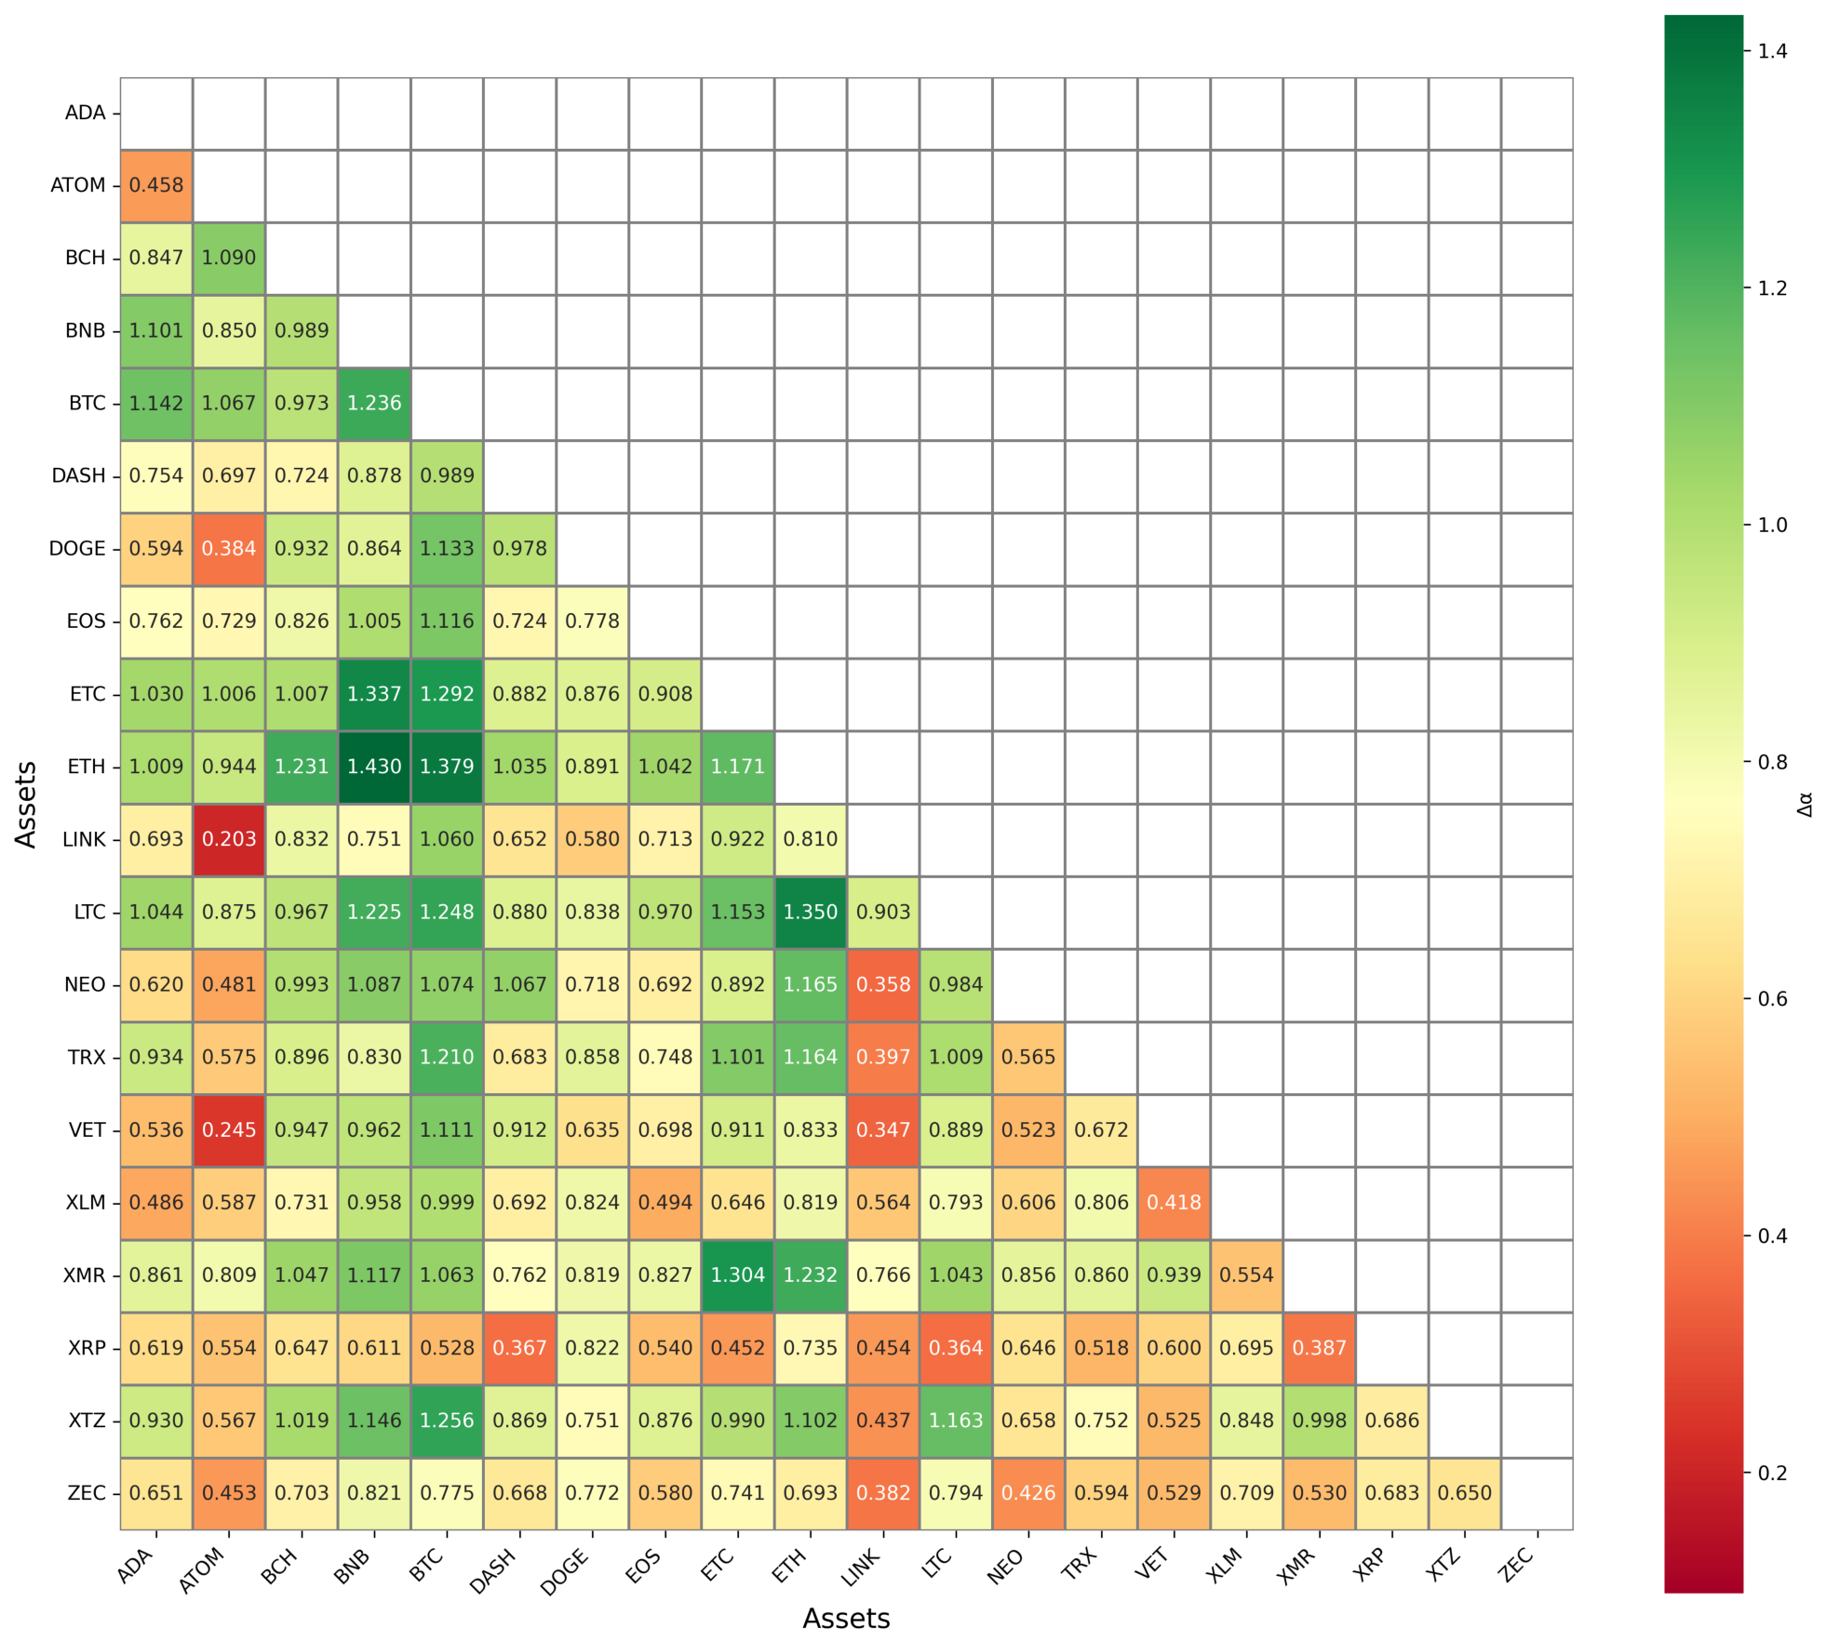
Figure 4 and
Figure 5 present the pairwise generalized Hurst exponent range (
) and the singularity spectrum width (
), respectively, computed using the MFDCCA method. These matrices are constructed using a representative estimation window within the sample period, as the multifractal characteristics are recalculated dynamically at each rebalancing step in the rolling framework. Both measures quantify the degree of multifractality embedded in the cross-correlation structure of each cryptocurrency pair. Higher values indicate stronger multifractal behavior with more heterogeneous scaling properties across fluctuations, whereas lower values correspond to more homogeneous and near-monofractal dynamics.
The matrix shows that stronger multifractal behavior is primarily concentrated among pairs involving major cryptocurrencies such as BTC, ETH, LTC, and BNB. In particular, ETH–BTC (0.783), TRX–ETH (0.725), LTC–ETH (0.717), ETH–BNB (0.710), and DOGE–BTC (0.709) exhibit the highest levels of multifractality. This suggests that pairs composed of large market-cap assets tend to exhibit stronger scale-dependent cross-correlations, reflecting richer and more complex interaction dynamics across time scales. In contrast, relatively low values are observed for pairs involving assets like ATOM, VET, and LINK. Notably, ATOM–VET (0.098), ATOM–LINK (0.102), XRP–XMR (0.129), ZEC–LINK (0.184), and XLM–VET (0.192) display near-monofractal behavior, indicating favorable and homogeneous cross-correlation structures.
The matrix reinforces these findings and further reveals that the dispersion of singularity strengths across pairs is more pronounced, reflecting greater heterogeneity in scaling behavior rather than directly indicating stronger cross-correlation. The highest values are again concentrated in pairs involving BTC, ETH, LTC, and BNB, including ETH–BNB (1.430), ETH–BTC (1.379), LTC–ETH (1.350), and ETC–BNB (1.337). This pattern is consistent with the dominant market role of these large-cap cryptocurrencies, as discussed in the filtering results. Their stronger integration with the broader cryptocurrency market likely contributes to the more complex and scale-dependent cross-correlation structures observed here. These results indicate that such pairs possess a broader range of scaling exponents, implying more heterogeneous fluctuation dynamics. Consistent with the results, pairs involving ATOM and LINK generally exhibit lower values. For example, ATOM–LINK (0.203), ATOM–VET (0.245), LINK–LTC (0.358), and DASH–XRP (0.367) show relatively narrow multifractal spectra, indicating more uniform scaling behavior.
Overall, most cryptocurrency pairs exhibit moderate multifractal complexity, with values typically ranging from 0.3 to 0.6 and values from 0.5 to 0.9. This indicates that heterogeneous scaling behavior is a pervasive feature of cryptocurrency cross-correlations rather than being limited to a small subset of assets. Furthermore, the strong consistency between and across pairs indicates that the observed multifractal characteristics are consistently reflected by both measures.
Importantly, these findings indicate that cross-asset relationships in the cryptocurrency market are inherently nonlinear and scale-dependent. Such characteristics cannot be adequately captured by conventional linear dependence measures, highlighting the necessity of multifractal-based approaches for identifying meaningful pairwise interactions. Building on these multifractal characteristics, cryptocurrency pairs can be systematically selected based on their cross-correlation structure, providing a foundation for evaluating their profitability and risk-adjusted performance in a trading framework.
4.3. Trading Performance Across Models
The trading performance of the proposed MFDCCA-based pair-trading strategy is compared with alternative dependence measures and the BTC buy-and-hold benchmark using annualized performance metrics, as shown in
Table 4. The comparison evaluates both absolute profitability and risk-adjusted performance using standard financial metrics, including mean return, volatility, and key risk-adjusted ratios, along with additional measures capturing downside risk, trade efficiency, and overall payoff structure.
Among all evaluated strategies, the empirical results reveal a clear multi-dimensional trade-off between profitability, risk control, and trading efficiency across different dependence modeling frameworks. The DCCA-based strategy achieves the highest mean return (47.19), outperforming MFDCCA (18.38), cointegration (9.98), and Pearson correlation (4.94), suggesting that DCCA is more effective at identifying profitable trading opportunities under the evaluated cryptocurrency market conditions. In contrast, the proposed MFDCCA strategy demonstrates superior risk-adjusted performance, indicating that multifractal cross-correlation analysis is more effective in balancing return generation with risk control.
From a risk-adjusted performance perspective, the MFDCCA strategy delivers the highest Sharpe ratio (0.7668), reflecting the most efficient balance between return and overall risk exposure among the evaluated strategies. This performance is primarily associated with relatively low volatility (20.1097) and reduced downside deviation (11.0752), suggesting that multifractal filtering extracts trading signals with lower overall risk than the linear and equilibrium-based benchmark methods.
In terms of extreme risk exposure, the MFDCCA-based strategy also achieves the lowest maximum drawdown (23.33%), indicating a smaller peak-to-trough decline in cumulative portfolio value during the evaluated period than DCCA (39.75%), Pearson correlation (52.54%), and cointegration (56.06%). These results indicate that the multifractal framework is associated with lower drawdown under the evaluated experimental settings. In contrast, the BTC benchmark exhibits the highest drawdown (76.64%), indicating substantially greater vulnerability to severe market downturns.
However, a different performance dimension emerges when analyzing trade efficiency and tail behavior. The DCCA-based strategy achieves the highest Sortino ratio (2.7677), suggesting superior performance during favorable return regimes despite higher downside sensitivity. Furthermore, DCCA records the highest profit factor (1.6937) and gain/loss ratio (1.7840), indicating more efficient daily portfolio returns payoff structures and stronger asymmetry between winning and losing trades. This suggests that DCCA generates higher-return trading opportunities, albeit with substantially higher volatility (97.50), which reduces its overall Sharpe performance (0.4537).
The Pearson correlation-based strategy consistently performs the weakest across all evaluation dimensions, with the lowest mean return (4.9368), Sharpe ratio (0.0760), and Sortino ratio (0.1140). Although its volatility (26.0559) is not extreme, the low profitability and weak trade signals indicate that linear dependence fails to capture nonlinear and scale-dependent relationships in cryptocurrency markets, resulting in ineffective pair selection. Similarly, the cointegration-based strategy provides only marginal improvements over Pearson correlation, achieving a mean return (9.9768) and Sharpe ratio (0.2058). While it captures long-run equilibrium relationships, its inability to model nonlinear, time-varying, and multifractal dependencies limits its effectiveness in highly dynamic cryptocurrency environments. From a trading activity perspective, the strategies also exhibit distinct structural differences. The MFDCCA-based strategy shows relatively lower pair replacement turnover (1849.62%) compared to DCCA (2379.60%), Pearson (2551.70%), and cointegration (2482.26%), indicating lower trading activity. This reduction in trading frequency contributes to lower transaction pressure and controlled risk exposure of returns. In contrast, higher pair replacement turnover strategies tend to reflect more frequent but less stable rebalancing behavior.
Compared with the BTC buy-and-hold benchmark, all pair-trading strategies exhibit significantly higher pair replacement turnover due to continuous rebalancing triggered by divergence signals. Although BTC records the highest gross profit (1765.43), it also incurs substantial gross losses (1568.58), resulting in higher volatility (58.16) and the largest maximum drawdown (76.64%). Consequently, its overall risk-adjusted performance remains inferior to the proposed MFDCCA strategy.
Overall, the results highlight a clear multi-dimensional trade-off in the performance characteristics of the evaluated methods. The proposed MFDCCA strategy excels in risk-adjusted metrics, offering lower return volatility, lower maximum drawdown, and capital preservation. In contrast, the DCCA-based approach delivers higher raw profitability, as reflected in its superior mean return, Sortino ratio, profit factor, and gain-to-loss ratio, albeit at the expense of substantially higher volatility. Meanwhile, Pearson correlation and cointegration show comparatively weaker performance due to their limited ability to capture nonlinear and scale-dependent dependencies in cryptocurrency markets.
4.4. Trading Performance Across Market Conditions
To examine the temporal variation in strategy performance, a year-wise performance analysis was conducted over the period 2021–2025. As reported in
Table 5, the MFDCCA-based strategy exhibits heterogeneous performance across different market regimes.
In terms of risk-adjusted returns, the strategy achieves strong performance in most years, with positive Sharpe ratios in 2021 (1.2094), 2024 (1.7692), and 2025 (1.2400), indicating effective return generation during both stable and bullish market conditions. The strongest performance is observed in 2024, where both Sharpe (1.7692) and Sortino ratio (5.5641) reach their peak values, reflecting highly favorable risk-adjusted returns during this period. In contrast, 2022 exhibits negative performance (Sharpe: −0.3345), consistent with the broad cryptocurrency market downturn, highlighting sensitivity to extreme systemic shocks.
From a downside risk perspective, the strategy maintains controlled maximum drawdown across most years. The lowest drawdown is observed in 2023 (1.42%), indicating strong capital preservation during a low-volatility recovery phase, while higher drawdowns in 2021 (13.61%) and 2022 (17.96%) reflect increased market turbulence. Importantly, losses remain bounded relative to typical cryptocurrency crash magnitudes, indicating controlled risk exposure under the evaluated conditions.
In terms of positive daily return frequency, the positive active trading day percentage (%) varies across regimes, with higher values observed in 2023 (75.0%) and 2024 (62.5%), suggesting that positive portfolio returns occurred more frequently during recovery and trending markets. Lower values in 2021 (50.0%) and 2022 (48.33%) reflect more uncertain and noisy market conditions. From a profitability perspective, the strategy remains consistently effective in most years, as reflected in profit factor values. Strong performance in 2023 (2.2208) and 2024 (3.7036) indicates favorable payoff asymmetry, whereas 2022 (0.9564) reflects temporary trading inefficiency during the bearish regime.
The 2022–2023 period highlights a regime-dependent divergence between daily portfolio returns and risk-adjusted performance. In 2022, weak Sharpe and Sortino ratios, together with a sub-unity profit factor, reflect severe market stress and deteriorating mean-reversion strategy performance. In 2023, despite a high positive active trading day percentage (75.0%) and strong profit factor (2.2208), near-zero Sharpe performance indicates that positive daily returns were relatively small in magnitude, resulting in limited risk-adjusted returns.
Overall, the results demonstrate that the MFDCCA-based strategy adapts effectively across diverse market conditions, including bullish (2021 and 2024), recovery (2023 and 2025), and bearish (2022) regimes. The framework shows strong resilience through controlled drawdowns, a higher frequency of positive portfolio returns in favorable regimes, and consistent profitability outside stress periods. These findings confirm that multifractal-based pair selection provides a favorable mechanism for capturing mean-reverting opportunities in highly non-stationary cryptocurrency markets.
4.5. Sensitivity Analysis
To evaluate the sensitivity of the proposed framework to parameter selection, a sensitivity analysis is conducted on five key parameters: the divergence threshold, the pair-selection threshold based on the cross-correlation Hurst exponent (H), the multifractal spectrum threshold (), the generalized Hurst exponent threshold (), and the divergence lookback period. In each case, one parameter is varied over a reasonable range while the others are fixed at their baseline values. The parameter ranges are selected based on commonly used values in the literature and preliminary experiments, ensuring that they cover both conservative and aggressive configurations relevant for cryptocurrency markets. Performance is assessed using standard risk-adjusted and daily portfolio returns metrics, including the Sharpe ratio, Sortino ratio, maximum drawdown, win rate, and profit factor.
The results reveal well-defined optimal regions for most parameters, indicating that the MFDCCA-based framework operates effectively within specific but identifiable ranges. As shown in
Table 6, the generalized Hurst exponent threshold (
) exhibits a clear performance peak, where intermediate values provide the best balance across both risk-adjusted and daily portfolio return metrics. In this region, improvements are observed not only in Sharpe and Sortino ratios but also in maximum drawdown reduction, positive active trading day percentage, and profit factor values. This indicates that appropriate tuning of persistence-related constraints helps identify the parameter settings associated with improved profitability and more frequent positive portfolio returns during active trading periods.
Table 7 shows that the multifractal spectrum threshold (
) achieves its best performance within a moderate range, where multiple metrics including profitability, risk-adjusted returns, and trade efficiency are jointly optimized. Lower thresholds tend to overly restrict pair selection, reducing trading opportunities, while higher thresholds introduce less stable pair structures, negatively affecting both drawdown control and profit consistency.
Similarly,
Table 8 demonstrates that the cross-correlation Hurst exponent threshold (
H) has a well-defined optimal point, where all performance dimensions—including return stability, downside control, positive active trading day percentage, and profit factor—are simultaneously maximized. This suggests that both overly strict and overly relaxed dependence criteria can reduce overall strategy effectiveness by either limiting diversification or weakening signal quality. The divergence threshold, reported in
Table 9, exhibits a broad but structured optimal region. Very low thresholds lead to excessive noise and unstable trade outcomes, while excessively high thresholds reduce trading frequency and limit profit opportunities. The optimal region offers a favorable combination of signal quality, execution efficiency, and portfolio stability across the evaluated metrics.
Among all parameters, the divergence lookback period shows the highest overall sensitivity. As presented in
Table 10, short lookback windows generally deliver stronger and more consistent performance across most metrics, including Sharpe ratio, Sortino ratio, maximum drawdown, win rate, and profit factor. However, performance degrades progressively as the lookback window increases, indicating reduced responsiveness to recent market dynamics. This suggests that recent divergence information is more informative for capturing mean-reversion behavior in highly non-stationary cryptocurrency markets, while older signals tend to lose predictive relevance.
Overall, the sensitivity analysis demonstrates that the proposed framework is favorable within moderate parameter ranges, while also highlighting the importance of careful parameter selection. The presence of well-defined optimal regions across all parameters indicates that the MFDCCA-based approach shows limited parameter sensitivity within the evaluated range, meaning that extreme parameter choices can significantly degrade both profitability and risk control. These findings reinforce the practical applicability of the framework and emphasize the need for disciplined calibration in real-world implementations of multifractal-based pair-trading systems.
4.6. Impact of CAPM Filtering
To further examine the impact and practical applicability of the MFDCCA-based pair-trading strategy, the effect of applying a market-model filter is analyzed. The filter removes pairs whose returns exhibit significant systematic risk exposure, thereby focusing the strategy on residual-return relationships that are less driven by broad market movements.
Table 11 shows that applying the market-model filter improves the Sharpe ratio, Sortino ratio, and profit factor, while it also increases maximum drawdown and slightly reduces the positive active trading day percentage. Thus, the filter enhances risk-adjusted performance at the modest cost of higher drawdown exposure.
To assess whether market-model filtering improves the characteristics of selected pairs beyond trading performance metrics, we observe that pairs selected under the filtered framework more consistently satisfy the anti-persistence condition
across rolling estimation windows relative to unfiltered pairs. This structural consistency indicates that market filtering stabilizes the cross-correlation properties used for pair selection, reducing the influence of transient market-wide co-movements on the pair identification process. The structural improvement is consistent with the performance improvements reported in
Table 11.
These results suggest that filtering out pairs with strong systematic exposure changes the characteristics of the selected pairs and the resulting trading performance. By analyzing return variations that are unexplained by the selected single-index market model, the market-model filter enables the strategy to identify dependence structures that are less influenced by common market movements. Consequently, the filtered MFDCCA framework provides an alternative basis for statistical arbitrage by reducing the influence of the selected market factor before pair selection.
Market-model filtering constitutes a central component of the proposed framework. By removing the dominant market-related component, filtering aims to produce market-adjusted residual returns that are more suitable for identifying candidate pairs within the proposed mean-reversion trading strategy. Empirical evidence from
Table 11 shows that applying the market-model filter improves the Sharpe ratio, Sortino ratio, and Profit Factor, while increasing maximum drawdown and reducing the percentage of positive active trading days, compared with the corresponding strategy based on unfiltered returns. Thus, the filtering stage reduces the influence of common market fluctuations and changes the overall risk–return profile of the proposed MFDCCA-based pair-trading strategy rather than uniformly improving all performance measures. A direct comparison of the filtering effect when combined with conventional approaches such as cointegration or Pearson correlation is left for future research. These results indicate that the filtering stage contributes not only as a statistical preprocessing step but also as a pair-selection component of the proposed framework.
The filtering stage improved the Sharpe ratio, Sortino ratio, and Profit Factor, but increased maximum drawdown and reduced the percentage of positive active trading days. These results indicate that the filtering stage changes the risk–return profile rather than uniformly improving all performance measures.
5. Discussion and Conclusions
This study proposes a multifractal detrended cross-correlation analysis (MFDCCA)-based framework for cryptocurrency pair trading, integrated with a market-model-based step to isolate market-adjusted residual returns. From an econophysics perspective, the results confirm that cryptocurrency markets exhibit strong nonlinear, scale-dependent, and heterogeneous dependency structures that cannot be adequately captured using traditional linear or equilibrium-based models.
Empirical evidence demonstrates that the proposed market-model-filtered MFDCCA framework achieves strong risk-adjusted performance across different evaluation dimensions. In particular, the multifractal-based strategy delivers superior return stability and lower maximum drawdown while maintaining competitive profitability. In contrast, alternative dependence measures exhibit a clear trade-off: the DCCA-based approach tends to generate higher raw profitability in favorable market conditions, but at the cost of substantially higher volatility and risk exposure, while Pearson correlation and cointegration show weaker overall effectiveness due to their limited ability to capture nonlinear and scale-dependent market structures.
These improvements indicate that the combination of market-model filtering and MFDCCA enhances not only trading performance but also the underlying pair characteristics of the extracted signals. By removing systematic market-wide effects and focusing on residual dynamics, the framework yields more consistent and cross-correlation structures after removing the dominant market component that may support identification of candidate pairs with favorable multifractal cross-correlation structures in market-adjusted residuals.
Linear dependence-based methods perform consistently poorly across all evaluation aspects, confirming that simple correlation structures are insufficient for modeling the complex dynamics of cryptocurrency cross-assets. Similarly, equilibrium-based approaches provide only limited improvement, suggesting that long-run linear relationships alone are not sufficient to explain short-horizon trading opportunities in highly non-stationary environments. An important finding is that the proposed multifractal framework not only improves risk-adjusted performance but also enhances trading efficiency by generating more selective trading signals. This results in a more consistent trading process with reduced unnecessary exposure compared to alternative methods that rely on more frequent but less favorable signals.
Overall, the results highlight a clear multi-dimensional trade-off between return generation, risk control, and signal efficiency across different modeling approaches. The proposed hybrid market-model-filtered MFDCCA framework achieves a favorable position within this trade-off space by effectively integrating market-risk filtering with scale-dependent dependency modeling. These findings reinforce the importance of combining market-adjusted residual dynamics with multifractal analysis for identifying potential mean-reverting opportunities for residual returns in highly complex and non-stationary cryptocurrency markets.
6. Limitations and Future Work
Despite these promising results, several limitations should be acknowledged. The framework relies on a rolling-window estimation procedure, and the multifractal structure may vary over time, potentially affecting the stability of pair selection in rapidly changing market conditions. Furthermore, the filtering assumes a linear market structure and may not fully eliminate nonlinear common factors in cryptocurrency markets.
In addition, although a rolling-window estimation procedure is employed, market exposure () is assumed constant within each 250-trading-day window. This approach captures gradual variation in systematic risk across successive windows but does not accommodate continuous time-varying parameters within a given window. Given the structural changes and regime shifts commonly observed in cryptocurrency markets, time-varying-parameter specifications, such as state-space or Kalman-filter-based beta estimation, could provide a more flexible characterization of market exposure and represent a promising direction for future research.
The filtering procedure relies on a single-factor market model, adopted here for parsimony as a preprocessing step to remove the dominant market-wide component. However, cryptocurrency markets are influenced by multiple systematic factors beyond the broad market index, including liquidity conditions, investor sentiment, momentum effects, regulatory developments, and volatility shocks, which may remain in the residual series after single-factor filtering. The application of multifactor models, such as Fama–French-style extensions adapted for cryptocurrency markets, principal component analysis (PCA), or dynamic factor models, represents a promising direction for future research to more comprehensively remove systematic variation and further improve pair-selection quality.
In addition, removing market-related variation does not necessarily improve the identification of pair-selection characteristics relationships between assets. Common exposure to market-wide conditions may itself constitute a relevant source of co-movement and may underlie stable, pair characteristics relationships between cryptocurrencies. By construction, the filter removes this shared component prior to MFDCCA, and it is, therefore, possible that some relevant dependence information is discarded along with the systematic market effect. This trade-off should be considered when interpreting the multifractal cross-correlation results, as the filtered residuals capture asset-specific co-movement but may not fully represent the total dependence structure between assets.
The proposed MFDCCA-based strategy also tends to generate fewer trading opportunities compared to alternative methods such as DCCA, which may limit total profit generation despite improved risk-adjusted performance. In addition, although proportional transaction costs are incorporated into the backtesting framework, slippage and market liquidity effects are not explicitly modeled. In practice, slippage arising from bid–ask spreads, order book depth, and execution latency may further reduce realized profitability beyond the transaction costs considered here. Explicitly modeling slippage and liquidity constraints in the backtesting framework remains an important avenue for future research. Moreover, although the results demonstrate favorable backtesting performance, the current framework does not include a formally designated out-of-sample validation period. Dedicated out-of-sample testing, walk-forward validation, and real-time implementation remain important directions for future research to reduce potential data-snooping bias and further evaluate the practical applicability of the proposed framework. In particular, spread half-life estimation and direct out-of-sample mean-reversion analysis could help evaluate the behavior of the selected relationships under out-of-sample conditions and, therefore, represent promising directions for future research.
Overall, the findings suggest that multifractal cross-correlation analysis provides a favorable and effective approach for cryptocurrency pair trading, offering controlled risk exposure, enhanced risk-adjusted performance, and greater resilience to market instability, and providing a meaningful foundation for future research incorporating more realistic trading constraints and broader asset universes.