1. Introduction
Understanding complex systems requires analytical frameworks capable of capturing nonlinear dynamics, structural complexity, and informational uncertainty simultaneously. Traditional linear models often fall short in explaining the irregular behavior observed in many socio-economic problems. In this context, chaos theory, fractal analysis, and entropy-based measures have emerged as powerful methods for analyzing complex dynamics. Rather than representing separate analytical traditions, these methods provide complementary perspectives that together form an integrated framework for examining complexity in dynamic environments.
Chaos theory focuses on the temporal evolution of nonlinear deterministic systems that generate irregular and seemingly unpredictable behavior. In this study, chaos refers to deterministic nonlinear dynamics characterized by sensitivity to initial conditions, divergence of nearby trajectories, and limited long-run predictability. Such systems may produce trajectories that diverge rapidly due to their sensitivity to initial conditions. These dynamics often converge toward complex geometric structures, known as strange attractors, that frequently exhibit fractal properties. Chaotic dynamics tend to generate geometric patterns that cannot be adequately described using conventional Euclidean geometry. On the other hand, fractal geometry provides a complementary perspective by offering a mathematical framework for describing irregular yet scale-invariant structures observed across multiple levels of observation. A defining characteristic of fractal systems is self-similarity, whereby patterns observed at one scale resemble those appearing at another scales. This property is typically captured through the concept of a fractal dimension that reflects the degree of geometric complexity within a system. Unlike classical Euclidean dimensions, fractal dimensions may take non-integer values, highlighting the fragmented and irregular structure of complex systems. Entropy-based measures further enrich this analytical framework by quantifying the degree of uncertainty and informational disorder embedded within system dynamics. In this context, entropy measures cover the level of unpredictability associated with probability distributions governing system behavior. Higher entropy values indicate greater randomness or disorder, while lower values suggest more structured dynamics. Taken together, chaos, fractal, and entropy methods offer a multidimensional lens through which complexity can be examined. Chaos theory covers the dynamic evolution of nonlinear systems over time; fractal analysis reveals the geometric structures produced by these dynamics; and entropy measures quantify the informational uncertainty embedded in the observed behavior. In many complex systems, these dimensions are deeply intertwined: chaotic dynamics frequently generate fractal attractors, while entropy indicators help quantify the degree of unpredictability associated with such structures.
Financial markets increasingly show dynamics that depart from the assumptions of conventional linear and equilibrium-based frameworks. Market fluctuations often reflect persistent memory, scale dependence, and heightened sensitivity to structural shocks rather than purely random movements. Chaos, randomness, and fractality have been widely employed alongside nonlinear statistical approaches to investigate the efficiency and stylized facts of financial time series. Previous papers have applied chaos-based techniques to monetary systems, exchange rates, crude oil prices, and major global equity and commodity markets. Randomness has been investigated across stock, currency, sovereign bond, and commodity markets, while fractal properties have been known in a range of financial assets, including stocks, gold, electricity prices, crude oil, and shipping markets. Despite the growing interest in nonlinear dynamics within financial markets, the presence of fractal and chaotic structures in the interaction between geopolitical risk, global uncertainty, and major strategic assets has not yet been systematically examined. In particular, the nonlinear transmission mechanisms linking geopolitical risk to key markets, such as oil, gold, and Bitcoin, remain insufficiently explored within a complexity-based framework. More importantly, the implications of such nonlinear and fractal dynamics for volatility transmission across different regimes, such as especially transitions between low- and high-volatility environments often associated with shifts in geopolitical or economic policy conditions, remain largely unexplored in the existing literature.
Recent geopolitical developments show the relevance of this gap. The escalation of tensions involving Iran, the United States, and Israel has significantly intensified uncertainty across global energy and financial systems. One of the most immediate responses has been observed in crude oil markets. As geopolitical tensions have increased and concerns over potential disruptions in the Strait of Hormuz—a critical corridor for global energy supply—have grown stronger, oil prices have surged above $100 per barrel, reflecting the heightened fears of supply constraints and prolonged instability in global energy markets.
Recent market developments during the escalation of the U.S.–Israel–Iran conflict have provided additional empirical motivation for this study, highlighting the non-uniform response of major asset classes to geopolitical shocks. Within the first days of the conflict, Bitcoin recorded a sharp increase of approximately 12.1%, outperforming several traditional asset classes, and rising from $65,492 to $73,419. Over the same period, crude oil prices increased by about 10.4%, reflecting the heightened concerns over potential supply disruptions and energy security risks. By contrast, gold, traditionally considered to be a safe-haven asset during periods of geopolitical turmoil, declined by approximately 3% despite an initial short-lived increase. These divergent dynamics suggest that conventional safe-haven and hedging relationships may weaken or shift under extreme geopolitical stress, particularly in environments characterized by heightened uncertainty, liquidity reallocation, and changing macro-financial conditions. The observed behavior further underscores the central role of crude oil as the primary transmission channel through which geopolitical shocks propagate across financial markets. This response underscores the unique position of oil markets as the primary channel through which geopolitical shocks are transmitted to the global economy.
Unlike other financial assets, crude oil is directly embedded in production processes, transportation systems, and international trade flows. As a result, fluctuations in oil prices have immediate implications for inflation, monetary policy, and economic growth [
1]. The recent Iran-related tensions have once again demonstrated that oil is not merely a commodity but a strategic asset that both reflects and amplifies geopolitical risk. Rising energy prices have already translated into broader economic pressures, including inflationary concerns and tightening financial conditions across economies.
While oil serves as the core transmission mechanism of geopolitical shocks, other assets, such as gold and Bitcoin, represent alternative channels of market response. Traditionally, gold has functioned as a safe-haven asset during periods of uncertainty. However, recent evidence from the Iran conflict suggests a deviation from this historical pattern. Despite escalating geopolitical tensions, gold prices have declined significantly, challenging its conventional role as a reliable hedge [
2]. This unexpected behavior indicates that safe-haven dynamics may be evolving under changing macro-financial conditions, including higher interest rates and liquidity constraints.
The literature addressing the relation between financial markets and uncertainty has expanded rapidly in the last decade. However, current papers appear to focus primarily on economic policy uncertainty. On the other hand, other dimensions of uncertainty, such as geopolitical risk and macro-financial instability, are often discussed indirectly or considered secondary factors. This creates an incomplete picture of how uncertainty actually operates in real-world financial systems, where shocks rarely emerge from a single source.
Geopolitical risk (GPR) covers the probability of financial, economic, or political instability arising from conflicts or tensions among countries or regions, and has been widely documented as detrimental to the global economy. Given the strategic importance of energy in global economic and political systems, GPR exerts a particularly strong impact on non-renewable energy markets, especially oil and gas [
3,
4,
5]. Geopolitical shocks have played a central role in shaping economic recessions, depressions, and commodity market dynamics over the past years. Events such as the Paris terrorist attacks in 2015, the escalating U.S.–Iran tensions in 2020, the Russia–Ukraine war in 2022, the U.S.–Iran tensions in 2025 and 2026, and the U.S.–China tensions in 2025 have substantially increased uncertainty and disrupted global markets.
Among the most responsive assets to geopolitical shocks are WTI crude oil, Bitcoin, and gold, representing distinct facets of market reaction as energy security, digital hedging, and traditional safe-haven demand, respectively. Some papers have showed that geopolitical tensions affect oil prices directly and indirectly [
4,
5,
6]. Despite strong evidence of GPR’s effects on oil, Bitcoin, and gold markets, economic policy uncertainty (EPU), GPR, and precious metals have been empirically explored, but not together; only a few papers have tested their interrelated behavior during geopolitical shocks. Refs. [
7,
8,
9] implied that GPR can impact gold and oil market volatility by indicating systemic dangers.
On the other hand, gold remains critical not only as a hedge asset but as a re-serve currency and a tool for monetary policy implementation [
10]. Gold and other precious metals have also drawn scholarly interest for their dual function as industrial commodities and financial assets. Refs. [
6,
11,
12,
13] accented the value of these metals as diversification tools, particularly during periods of market stress. While gold has historically showed a negative correlation with equities during crises [
14], Bitcoin’s reactions are more erratic, impacted by regulatory news and speculative trading [
15]. The increasing volatility in global financial markets, driven by geopolitical tensions and economic uncertainty has brought renewed attention to the link between risk factors and main commodity markets. EPU shocks favor precious metals by making them safe havens [
16]. Ref. [
17] determined that EPU shocks on gold prices and gold’s safe haven effectiveness rely on economic conditions and time. Refs. [
18,
19] documented how the pandemic destabilized commodity prices, financial systems, and investor sentiment. Especially during COVID19, in the context of a black swan event, researchers are re-examining traditional asset safe-haven attributes. According to [
20], gold was a safe-haven asset from December 2019 to March 2020, but not from March 2020 to April 2020. Some papers have examined asset class and commodity connectedness during COVID19 [
10,
13,
21,
22,
23,
24,
25] without fully incorporating news-based uncertainty indicators.
A few papers have determined that, during periods of heightened uncertainty, capital tends to flow into perceived safe havens such as gold and, increasingly, Bitcoin [
10,
26,
27]. Despite extensive research on the individual effects of geopolitical risks on financial markets, the interdependence between WTI crude oil, Bitcoin, gold, and composite uncertainty indices remains underexplored in the context of recent global crises, such as the COVID19 pandemic, the Russia–Ukraine conflict, the 2023 Israel–Hamas war, escalating U.S.–China tensions, and the Iran and U.S.–Israel war.
Despite the many papers on uncertainty and the financial markets, much of the existing literature has remained narrowly focused on economic policy uncertainty, with comparatively limited attention paid to other important sources of uncertainty, such as geopolitical and macro-financial factors. In addition, empirical papers have largely concentrated on WTI crude oil and developed economies, leaving broader market interactions under multiple uncertainty dimensions relatively underexplored. These divergent and time-sensitive responses across Bitcoin, crude oil, and gold highlight the limitations of linear methods in capturing the true dynamics of geopolitical shock transmission. The heterogeneous and rapidly changing behavior of asset prices during the recent escalation of the U.S.–Israel–Iran conflict suggests that the relation between geopolitical risk, global uncertainty, and financial markets is inherently state-dependent rather than stable over time. In particular, the alternating dominance of risk-on and risk-off behavior across assets implies that market reactions vary significantly across different volatility and uncertainty regimes. This provides strong motivation for adopting a regime-switching method that can explicitly account for nonlinear adjustments and structural shifts in market behavior. Motivated by these gaps, this paper will investigate the interactions among the volatilities of oil, gold, Bitcoin, and a comprehensive set of uncertainty indicators, including geopolitical risk (GPR), the World Uncertainty Index (WUI), and nonlinear regime-switching methodologies, specifically the Markov-switching VECM method proposed by [
28] and the MS-VARDL model suggested by [
29]. These models will be applied to monthly data from October 2010 to February 2026 and allow for structural changes across regimes associated with market stress, geopolitical events, and relatively tranquil periods. As mentioned above, this paper seeks to address this shortcoming by examining the joint dynamics among GPR, WUI, and the volatilities of Bitcoin, gold, and crude oil, offering a more integrated perspective on how systemic geopolitical shocks transmit across global commodity and financial markets. In particular, the comparative analysis focuses on the presence of cointegration, regime-dependent adjustment dynamics, and responses to policy shocks.
Economic and financial variables exhibit complex nonlinear dynamics that cannot be adequately captured by conventional linear models. Advances in nonlinear time series analyses emphasize the importance of identifying chaotic and entropy-based structures before specifying the empirical model. If this paper shows that the variables display chaotic dynamics and entropy characteristics at their levels, suggesting sensitivity to initial conditions and nonlinear interactions among the series, and unit root tests disclose that the variables are non-stationary in levels but convert to stationary after first differencing, these states motivate the use of nonlinear regime-dependent models. This paper employs the Markov-switching vector autoregressive model and the Markov-switching autoregressive distributed lag model frameworks, which are capable of capturing regime shifts and nonlinear adjustments in the relationships among the variables. The joint use of MS-VECM and MS-VARDL frameworks in this paper is motivated by the need to ensure the robustness of the empirical results under regime-dependent dynamics, and thereby seeks to contribute to the methodological debate in the literature and to provide practical guidance for applied researchers. The MS-VARDL model, both the short- and long-run relation within a unified method, allows these relationships to vary across different regimes (such as crises and growth stages). When compared to conventional ARDL models, MS-VARDL provides greater flexibility and a more realistic representation of regime-dependent economic dynamics. The MSVECM model preserves the long-run equilibrium relation among cointegrated variables and enables the analysis of how short-run deviations from equilibrium are corrected under different regimes. MS-VECM serves as a powerful tool for examining both the long-run equilibrium mechanism and regime-dependent adjustment speeds. From a policy perspective, this dual-model strategy strengthens the credibility of the results, ensuring that the identified transmission mechanisms are not artifacts of a single specification but are consistent across regime-switching methods. In environments characterized by heightened geopolitical tensions, such as the recent Iran–U.S.–Israel escalation, policy decisions rely heavily on the reliability of empirical evidence. Therefore, confirming the results across two complementary nonlinear models enhances confidence in the robustness of the results and provides a more solid basis for policy recommendations. Moreover, since both MS-VECM and MS-VARDL explicitly account for regime changes, their combined use reinforces the conclusion that financial market responses to uncertainty are inherently state-dependent, further supporting the need for regime-aware policy design and risk management strategies.
The originality and contribution of this paper can be summarized in four main points. First, this study does not merely reproduce or summarize the empirical findings reported in previous references. Although the data are collected from publicly available financial and uncertainty databases, all entropy, chaos, fractality, long-memory, cointegration, regime-switching, diagnostic, and forecasting analyses are conducted by the authors using a monthly dataset covering October 2010–February 2026.
Second, this paper jointly examines geopolitical risk, global uncertainty, crude oil, gold, and Bitcoin within a single empirical framework. This allows the study to analyze the transmission of uncertainty shocks across energy markets, traditional safe-haven assets, and digital assets simultaneously.
Third, this study combines chaos theory, fractal analysis, entropy measures, fractional integration tests, and regime-switching econometric models. In this respect, this paper links the preliminary evidence of complexity, persistence, and nonlinear dependence to the later use of MS-VECM and MS-ARDL/MS-VARDL models.
Fourth, this paper compares nonlinear regime-switching models with a linear VECM benchmark. The results show that regime-switching models better capture the state-dependent structure of the relationships among geopolitical risk, global uncertainty, oil, gold, and Bitcoin, and they provide a superior forecasting performance. This paper was prepared in five subsections: Part 2 gives a review of the literature; Part 3 presents the data and methodology; Part 4 discusses the econometric results; Part 5 concludes by summarizing the main results and outlining their economic and policy implications.
2. Literature
Some papers have documented a strong relation between oil price volatility and geopolitical risk [
4,
5,
29]. This relationship became particularly evident during the Russia–Ukraine conflict, when disruptions in global supply chains led to sharp increases in energy prices, pushing crude oil prices to levels not observed for nearly a decade. The COVID-19 pandemic had already highlighted the vulnerability of energy markets as widespread lockdowns and the sudden collapse in economic activity generated an unprecedented supply surplus and severe price declines [
18,
30,
31,
32]. During this period, WTI crude oil prices briefly fell below USD 20 per barrel, reaching levels last observed almost eighteen years earlier [
10].
More recent geopolitical developments have continued to exert pressure on commodity markets. In particular, the continuing conflict between Ukraine and Russia has reinforced Russia’s strategic role in global energy and commodity supply chains, amplifying volatility and increasing the sensitivity of oil prices to geopolitical shocks [
10,
30].
Beyond energy markets, geopolitical risk also plays an important role in shaping investor behavior across financial and commodity markets. Early studies by [
31,
32] showed that gold tends to offer protection during periods of market turbulence and heightened EPU. Similarly, Ref. [
33] found that gold acts as a hedge during episodes of excessive stock market volatility. These characteristics have positioned gold as a benchmark safe-haven asset in the literature [
18,
34,
35].
However, the evidence is not uniform. Ref. [
34] suggested that the hedging capacity of gold and silver may weaken under extreme geopolitical stress. As a result, several studies have emphasized the benefits of diversification across precious metals, particularly during periods of elevated uncertainty [
10,
11,
12,
18]. Other contributions have shown that geopolitical risk can anticipate volatility across commodity markets more broadly. Refs. [
8,
9,
36] provided evidence that geopolitical threats and financial instability significantly affect both gold and oil volatility. Ref. [
37] further showed that fluctuations in geopolitical risk explain a substantial share of crude oil futures volatility, which subsequently transmits to gold prices through yield-related channels.
Extreme GPR events predict the volatility of oil return [
1]. Ref. [
27] showed that GPR affects oil more than stocks. Refs. [
1,
38] found that gold hedges GPR as well as economic shocks. Ref. [
39] discovered that investors sought a safe haven by sending gold prices higher after the COVID-19 pandemic damaged the economy.
In parallel, cryptocurrencies—particularly Bitcoin—have increasingly been considered potential substitutions to traditional safe-haven assets during periods of geopolitical turmoil. The existing papers have examined the impact of GPR on Bitcoin price dynamics [
19]. Ref. [
32] analyzed the safe haven status of gold and Bitcoin during the COVID19 pandemic. The Ukraine–Russia war further underscored gold’s function as a safe-haven asset, as heightened geopolitical tensions led to increased investment demand for gold during the conflict. Bitcoin, gold, and oil connections with stocks were augmented during COVID19, according to [
18]. Using DCC-GARCH, Ref. [
21] examined gold’s safe-haven properties, while Ref. [
40] used the TVP-VAR method to determine that the COVID19 outbreaks affected network topologies and improved connection.
Following [
41], some papers have examined the impacts of uncertainty on economic activity and financial markets. Uncertainty impacts investor behavior through multiple channels, including expectations, interest rate fluctuations, money supply, and asset price volatility. Economic policy uncertainty (EPU) has been shown to impact both macroeconomic and microeconomic decisions, shaping the investment behavior of households, firms, and governments [
42]. The empirical evidence has suggested that policy uncertainty and GPR significantly impact commodity markets, particularly in China [
26].
Other studies in the literature have extensively covered the impacts of EPU on stock markets, exchange rates, gold, oil, and other commodities [
43,
44,
45,
46]. Economic uncertainty prompts investors to seek macroeconomic shock hedges. When the economy is weak, safe-haven investments are uncorrelated or negative [
47]. Economic uncertainty prompts investors to seek hedges against macroeconomic shock.
Some studies have emphasized that various forms of uncertainty exert pronounced effects on energy and financial markets. EPU and MPU impact stock returns and market volatility [
38,
48], with evidence of a non-positive relation between uncertainty indicators and Chinese stock returns [
38,
49]. Uncertainty shocks have also extended to commodity markets: EPU negatively impacted natural gas and gold prices [
50], while CPU introduced transition risks that impact crude oil [
51]. Rising external risks and geopolitical tensions further amplify oil price volatility by altering expectations about future demand and supply. In futures markets, Ref. [
52] found that GPR has been shown to intensify volatility in crude oil, iron ore, and coal contracts. According to [
53], EPU impacted oil prices positively and negatively.
According to [
16,
53], EPU raised gold prices. Economic uncertainty prompts the investors to seek macroeconomic shock hedges. Refs. [
42,
44] analyzed EPU’s effects on stock markets, exchange rates, gold, oil, and other commodities. Within this context, gold has attracted particular attention due to its traditional role as a hedge against uncertainty. One prior paper tested strong spillovers and causality among geopolitical risk, economic policy uncertainty, volatility, and gold returns [
54]. On the other hand, Ref. [
45] found that EPU lowers stock prices over time. Ref. [
55] found that Bitcoin is a strong hedge against GPR, but a safe haven and weak hedge against EPU during bull markets. Ref. [
54] analyzed GPR–EPU exchange rates. Using the NARDL model, they found a long- and short-term asymmetric link between uncertainty indicators and exchange rates. Ref. [
46] examined the nexus among EPU, oil prices, and GPR by using the PLSTVAR method. Methodologically, advanced econometric methods, including copula models, chaos, fractals, wavelet analysis, quantile regression and time-varying parameter VAR frameworks, have been widely employed to cover the nonlinear and time-varying nature of these relationships [
29,
54,
56].
4. Data and Stage of Econometric Results
The data cover multiple uncertainties (i.e., geopolitical risk, World Uncertainty Index), the volatilities of Bitcoin, crude oil prices, and gold from October 2010 to February 2026.
The empirical design of this study is based on the integration of publicly available market and uncertainty indicators within a unified nonlinear time-series framework. Rather than treating these variables separately, the analysis combines entropy, fractality, long-memory, chaos diagnostics, cointegration analysis, and regime-switching models to examine the state-dependent transmission mechanisms among geopolitical risk, global uncertainty, crude oil, gold, and Bitcoin. This integrated empirical structure enables this study to assess whether the complexity-based characteristics observed in the data are reflected in nonlinear adjustment dynamics and forecasting performance. The data are discussed in
Table 1.
All econometric estimations, diagnostic tests, nonlinear analyses, and regime-switching model estimations were conducted using EViews 13, OxMetrics 3.1, and Python 3.14.6. Graphs and tables were prepared using Microsoft Excel.
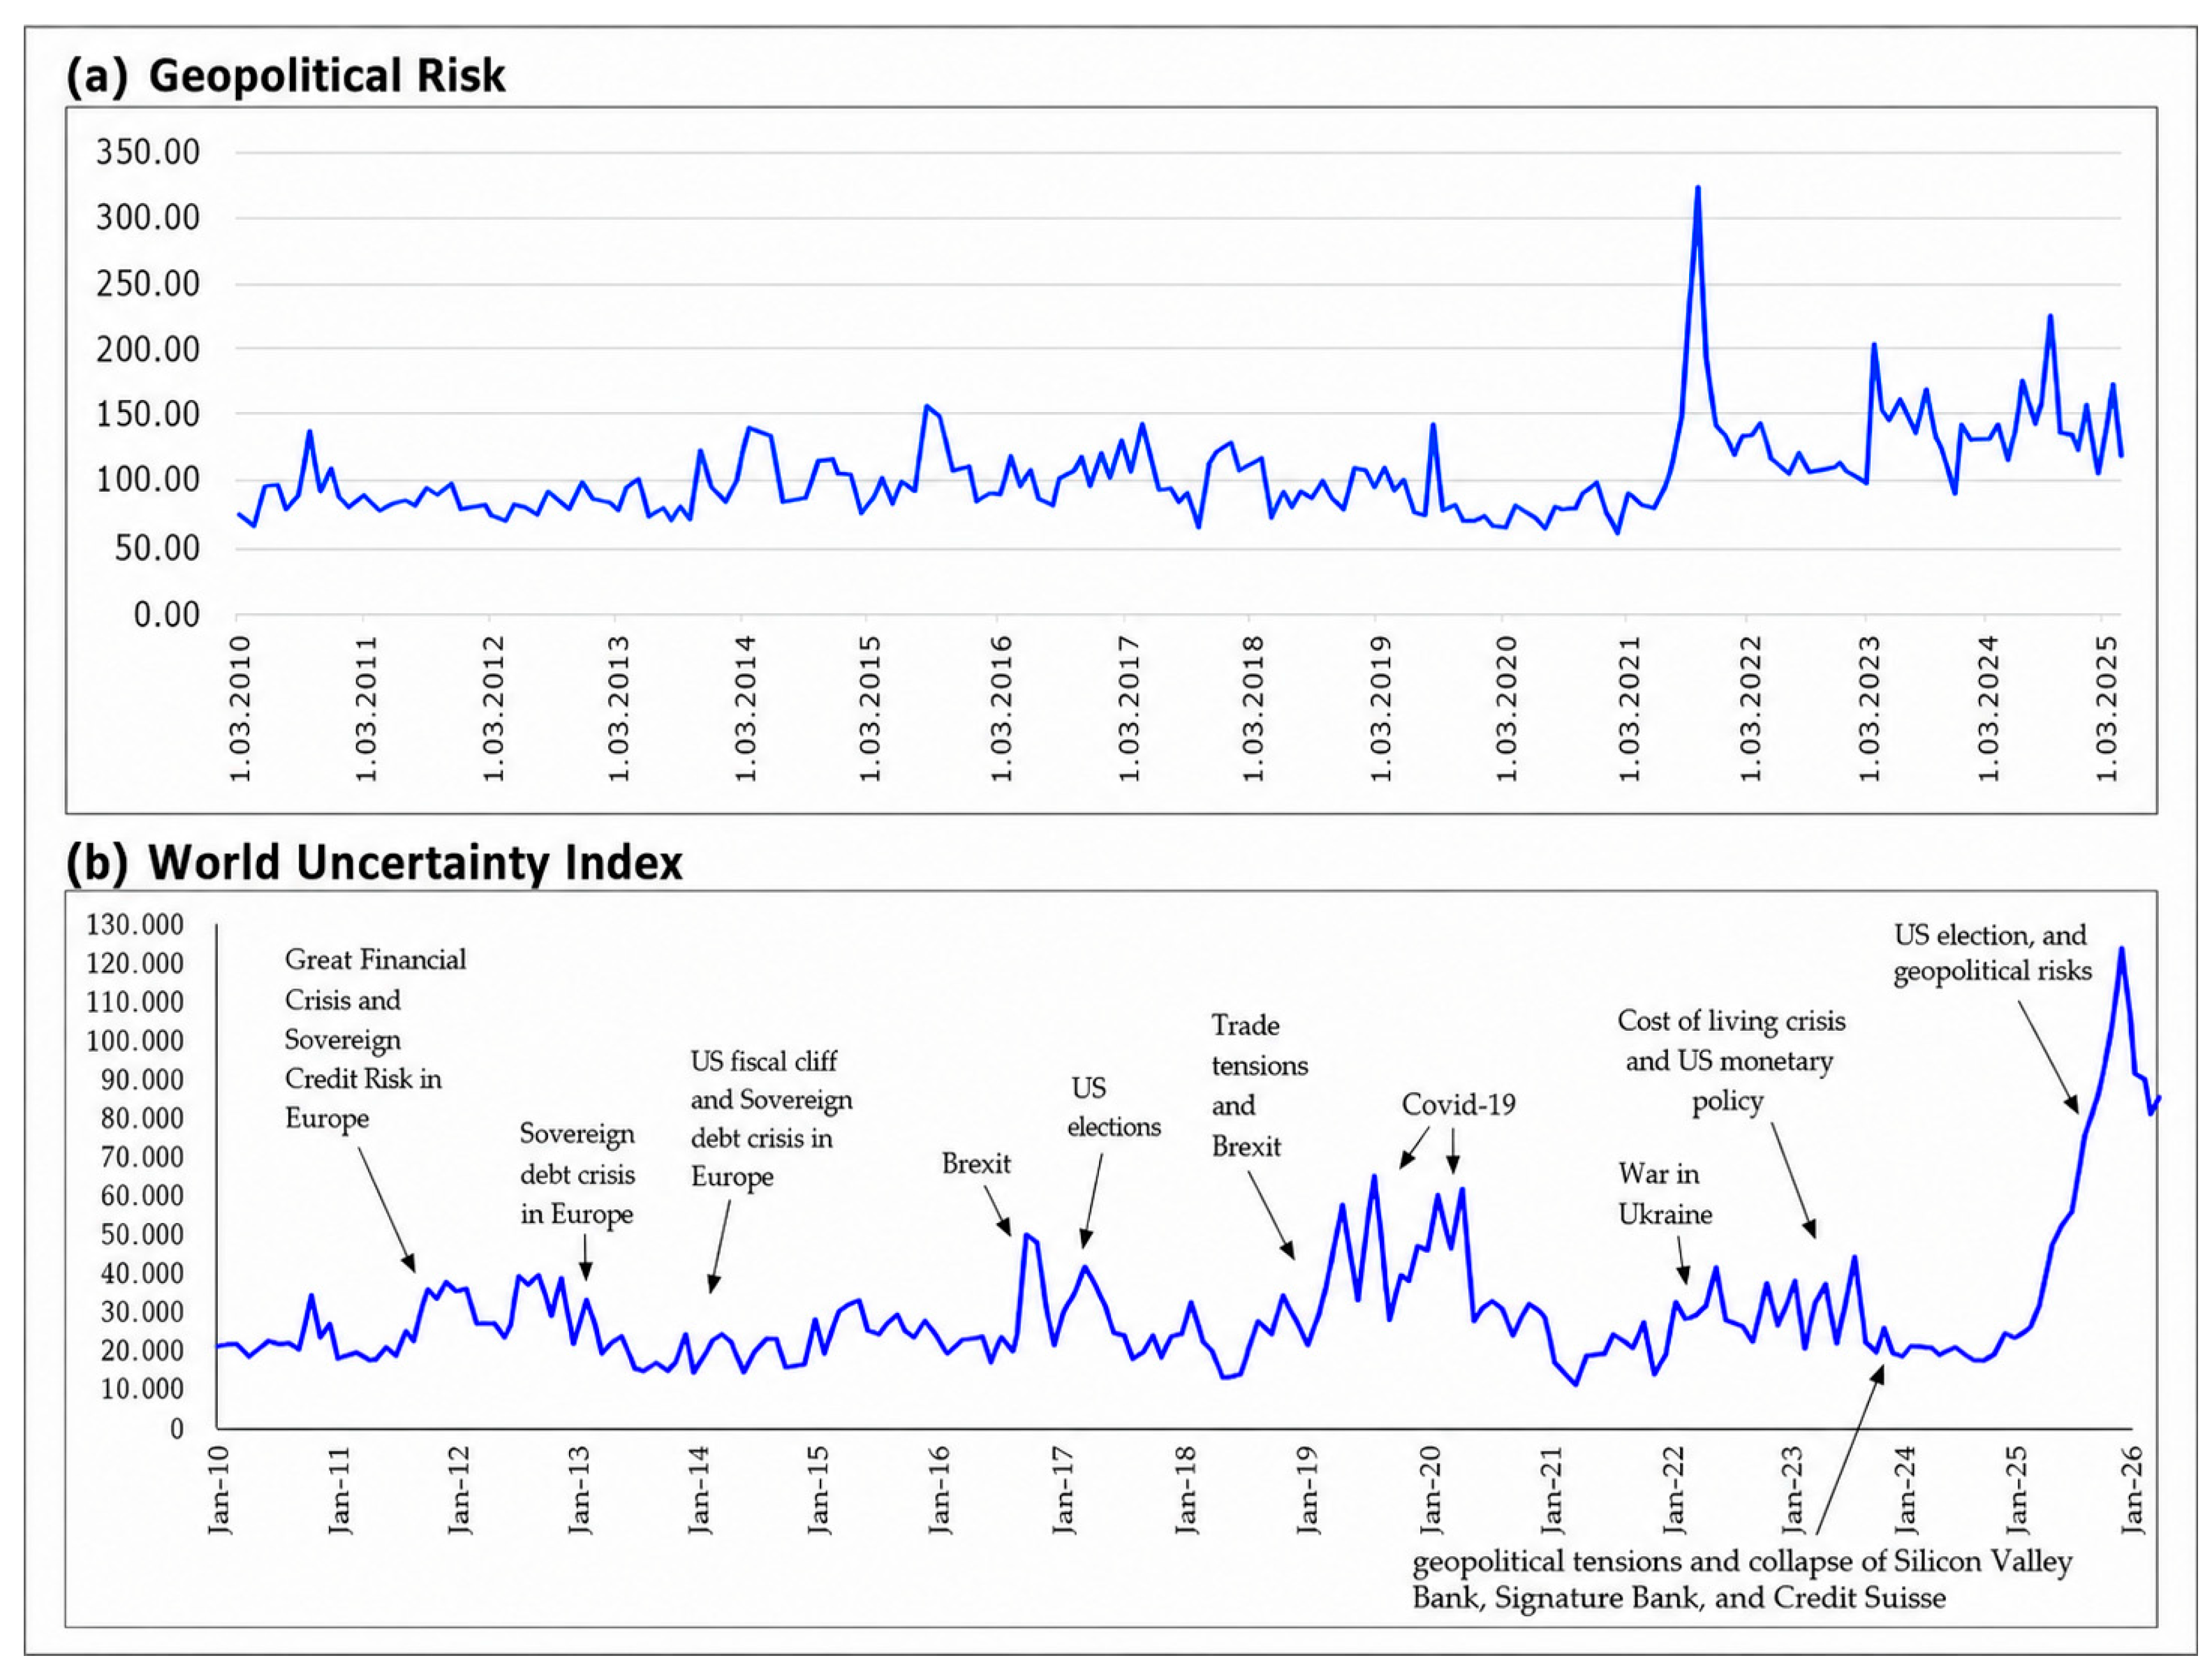
Figure 1 shows the geopolitical risk and World Uncertainty Index.
Before obtaining the econometric results, the statistical properties and nonlinear nature of the variables were investigated. The results of the unit root test, BDS test, Johansen cointegration, and nonlinear structure are given in this section. The Johansen test is important in the context of the ARDL method. The presence of a single cointegrated vector is a condition of the ARDL method. It is applied to determine this primarily with the Johansen method and to control the MS-VARDL method in the selection of a single vector. The presence of an independent structure was investigated using the BDS test.
Table 2 shows the statistics results. WUI (0.47), WTUI (0.23), GOLD (0.51), and GPR (0.85) exhibited positive skewness. These variables have right-skewed distributions, meaning their tails are longer on the right side. Extreme values are more likely to occur above the mean.
BTC (−0.75) and OP (−0.71) exhibit negative skewness. These distributions are left-skewed, with longer tails on the left. BTC and OP’s negative skewness may reflect sustained high prices with occasional sharp declines (e.g., market crashes). WUI (3.86), OP (4.61), GPR (4.92) have high kurtosis. These are fat-tailed distributions (kurtosis > 3), meaning extreme values (outliers) are more frequent than in a normal distribution. High kurtosis in OP suggests frequent “black swan” events (e.g., oil price shocks). Accordingly, for the JB test results for WUI (7.41), normality is rejected at 95% confidence. BTC (19.34), GOLD (11.25), OP (31.72), and GPR (28.66) have low p-values and provide a strong rejection of normality. We then tested the fractionality, chaotic structure, and long-term dependence.
4.1. Fractionality and Long-Term Dependence
Fractionally, chaotic structure and entropy tests were applied at level. Lo’s and Hurst–Mandelbrot R/S tests results are summarized in
Table 3.
For all variables in all levels, both the H-M R/S test and Lo’s M.R/S test provided strong evidence of long-range dependence at the 1% level of statistical significance. To further investigate the persistence structure of the series, the fractional differencing parameter d is estimated using the GPH and Phillips semi-parametric methods. The results indicate that the estimated fractional differencing parameters are statistically significant for all level series and lie within a narrow range between approximately 0.98 and 1.05. More specifically, for Bitcoin (BTC), the estimated d parameter is 0.978 using the GPH method and 0.994 using the Phillips estimator. For crude oil prices (OP), the corresponding estimates are 0.998 and 0.921, respectively. In the case of gold, the fractional differencing parameter is estimated as 0.986 and 0.924 with the two estimators. Similarly, for the Geopolitical Risk Index (GPR), the estimated values of d are 0.989 and 0.917, respectively.
Overall, these results point to strong persistence and pronounced long-memory characteristics across all variables, indicating that shocks have highly persistent effects on the system’s dynamics. Importantly, the estimated fractional integration parameters lie close to unity, suggesting that the series are located at the boundary between non-stationary and fractionally integrated processes. This implies the coexistence of persistent potentially mean-reverting dynamics, a feature that is consistent with underlying fractal market structures. Such behavior further indicates that standard short-memory or purely linear models may be inadequate to fully capture the data-generating process. Consequently, these results provide strong empirical support for the use of nonlinear, fractal-based, and regime-dependent modeling frameworks in analyzing the interaction between geopolitical risk, global uncertainty, and strategic asset markets.
As can be seen from
Table 1, the descriptive tests show that the variables displayed signs of heteroscedasticity, as evidenced by the excess kurtosis.
4.2. LE Results
Two methods were used for estimating the Rosenstein and Wolf λ. The results are given in
Table 4. In this study, the largest Lyapunov exponent was estimated using the Rosenstein method based on phase–space reconstruction. The Wolf method was also applied as a robustness check. The Rosenstein method evaluates the average exponential divergence of nearby trajectories, while the Wolf method follows the separation of neighboring trajectories in the reconstructed state space. Since both methods produced positive Lyapunov exponent values, the results provide evidence consistent with sensitivity to initial conditions and chaotic dynamics.
The Rosenstein and Wolf results are widely recognized as an effective indicator for identifying chaotic dynamics in the presence of noise. A positive λ value shows sensitivity to initial conditions and thus the existence of chaotic behavior, implying limited predictability in the trajectory of the series. When λ is close to zero, the evidence of chaos becomes weak, suggesting fragile chaotic dynamics. By contrast, a negative λ value indicates the convergence of trajectories and therefore the absence of chaos in the long run. The empirical results provide strong evidence of chaotic dynamics for all variables considered in the analysis. Overall, these results confirm that the variables exhibit nonlinear and chaotic behavior.
4.3. KE Results
Kolmogorov entropy (KE) is accepted as a measure of the rate of information production or loss within a dynamic system. It reflects the degree to which information about the system’s future states becomes uncertain over time due to chaotic dynamics. The LE and the correlation integral are the two estimation methods of KE. All positive Lyapunov exponents are estimated in first method, and those entropy values give the market information, which also helps to understand the market dynamics. A low KE finding indicates a more predictable structure in the data. Higher values show greater complexity. The results are reported in
Table 5, with the KE values estimated as 0.31 and 0.59. The results indicate that the E-R condition is satisfied for all variables, suggesting the existence of chaotic dynamics in the data. Moreover, the findings disclosed a moderate level of complexity across all variables, implying that the series exhibited random behavior and inherent chaotic characteristics.
4.4. Hurst Exponent, Kolmogorov–Sinai Complexity, and Shannon Entropy Results
Statistical techniques provide important tools for identifying complexity in nonlinear systems through entropy-based measures. Shannon Entropy (SE) is widely employed to quantify the rate of information generation and the degree of uncertainty within a system. To examine the presence of complex and potentially chaotic dynamics, SE results are reported in the first column of
Table 6. The entropy estimates obtained from HCT are given in the second column for robustness. The last two columns report the estimates of the KSC and the HE to provide complementary evidence regarding the complexity and persistence characteristics of the series.
The SE results show a considerable degree of uncertainty, as all entropy values are clearly different from zero. Entropy reflects the amount of information generated by a system and captures the degree of disorder and unpredictability in its dynamics. The positive entropy values observed for all variables suggest the presence of rich informational structures and complex dynamics in the data. These findings are further supported by the KSC and Hurst exponent (HE) estimates, which collectively point to nonlinear and persistent behavior in the series. Taken together, the entropy and complexity measures provide strong evidence that the variables exhibit complex and potentially chaotic dynamics. This complexity motivates the use of nonlinear modeling methods capable of capturing regime shifts and nonlinear adjustments in the relationships among the variables.
Furthermore, the variables were analyzed in terms of chaos, unpredictability, complexity, and sensitivity to initial conditions using the KS complexity metric. This measure provides insight not only into the presence of chaotic dynamics but into the level of complexity and unpredictability within a time series. Higher KS complexity values indicate that the series exhibits greater complexity and lower predictability.
Unlike Shannon entropy and HCT-based entropy measures, the KS complexity metric focuses on specific dynamical properties of the series.
The ADF and KSS results are exhibited in
Table 7.
The BDS test results are exhibited in
Table 8. The rejection of the i.i.d. null hypothesis by the BDS test provided evidence of complex dependence structures in the data. This result supports the use of nonlinear and higher-order analytical frameworks, as linear models alone may be insufficient to fully capture the underlying dynamics.
Since the variables exhibit chaotic and entropy-based dynamics at their levels, nonlinear modeling approaches are more appropriate for capturing their complex behavior. The ADF and KSS results show that the variables are non-stationary in levels but become stationary after first differencing. Therefore, the logarithmic transformations of the variables were employed in the analysis to stabilize the variance and to facilitate interpretation. Given the presence of nonlinear and potentially regime-dependent dynamics, the MS-VAR and MS-ARDL models were selected as the empirical methods. These models are particularly suitable for capturing regime shifts and nonlinear adjustments in economic and financial relationships.
As a robustness check, the residuals obtained from the estimated models were further examined for chaotic behavior using Lyapunov-based diagnostics. The results confirm that the chaotic structure does not remain in the residuals, indicating that the MS-VECM and MS-ARDL specifications successfully capture the nonlinear and chaotic dynamics present in the data.
Before using the MS-VECM and MS-ARDL methods, the number of cointegrated vectors will be determined by applying the Johansen test, which is a standard method. Because the ARDL method requires the existence of a single cointegrated vector, in the second stage, Johansen test results were obtained.
Table 9 provides evidence that one cointegration vector was determined by Johansen test.
4.4.1. Stage of Econometric Results
The empirical results will be given in four steps.
The MS-VECM and MS-ARDL methods will be applied.
Regime durations and regime switching probabilities will be determined.
It will be realized by model evaluation with the diagnostics tests.
Finally, a robustness check was realized. The linear VEC method was applied, and the results were compared to those of the MS-VECM and MS-VARDL. Then, for the residuals, Lyapunov, KE, and correlation tests were provided. Lastly, the forecast accuracy was evaluated for in-sample and out-of-sample results.
4.4.2. MS-VECM and MS-VARDL Models
The results of the MS-VECM and MS-VARDL methods were estimated. The error correction mechanism (ECM) within the model illustrated how the variables were adjusted toward equilibrium. The results determined the changes in the ECM with autoregressive coefficients shifting between regimes. The MS-VECM framework was utilized to explore any relationships among the variables. To identify the appropriate number of regimes, AIC and HQ tests were conducted. Specifically, a two-regime MSIH-VECM model with two lags and a two-regime MS-ARDL model with one lag were estimated by incorporating shifts in intercepts and error variances.
The filtered probability represents the conditional probability of being in a particular regime at a given time, while the smoothed probability reflects the conditional probability relied on in the full sample information up to a future date, T. Regime 1 is characterized by high volatility conditions and Regime 2 is associated with low volatility. These regimes provide insights into the behavior of the variables under different economic conditions.
Table 10 presents and compares the empirical results obtained from the MS(2)-VECM(2) and MS(2)-ARDL(1.0.1) models.
The empirical results reveal that the relationships among Bitcoin, gold, oil, and uncertainty measures are strongly regime-dependent. The MS(2)-VECM(2) results suggest that Bitcoin may act as a hedge or safe haven during certain periods of heightened geopolitical risk, although this role is neither stable nor uniform across regimes. In the long run, Bitcoin exhibits strong persistence, while oil prices emerge as a key determinant of both Bitcoin and gold. The relationship between gold and Bitcoin alternates between substitution and complementarity, depending on the prevailing market conditions. Short-run dynamics show that Bitcoin and gold are largely driven by their own past values, reflecting strong market persistence and high volatility. Oil prices exert significant short-term effects, whereas geopolitical risk and global uncertainty indices play a more prominent role in shaping long-run dynamics. Deviations from long-run equilibrium are corrected over time, as determined by the negative and statistically significant ECM in the nonlinear models.
Both models exhibit a statistically significant ECM. The transition probability matrices determined high persistence in Regime 2 for both models, with the probabilities of remaining in Regime 2 with 0.94 in MS(2)-VECM(2) and 0.9786 in MS-VARDL. The MS-VARDL model portrays more stable regime structures, reflecting more persistent market states.
Residual diagnostics show no evidence of heteroskedasticity and autocorrelation, supporting the robustness of the estimates. The results emphasize the regime-dependent nature of the linkages, the prominent role of oil prices, and the long-run impact of uncertainty and geopolitical risks.
These results underline the importance of the regime-dependent method. While MSV-ARDL finds more stable and interpretable relationships, MS(2)-VECM(2) covers important asymmetries between high volatility and low volatility periods. The divergence in the role of geopolitical risk between the two models accents the contextual determinants of BTC’s safe-haven properties.
4.4.3. Robustness Check
To benchmark the effectiveness of the Markov-switching models (MS-VECM and MSV-ARDL), a linear VECM was used as an estimate for baseline values. The results determined that the linear method fails to adequately cover the complex dynamics of Bitcoin (BTC), gold, and crude oil prices.
Table 11 reports the linear VECM benchmark results, which are used to compare the explanatory performance of linear and regime-switching specifications.
In the BTC equation, the error correction coefficient is negative (−0.016), as expected, but it is statistically insignificant (t = −1.29). The ECM coefficients are also quite low in the gold and WTI crude oil equations. These estimates imply that deviations from the long-run equilibrium dissipate only gradually. The explanatory power also remains weak across the three equations (R2: BTC = 0.18; Gold = 0.24; WTI = 0.18). Taken together, the results suggest that a linear VECM offers a limited description of cryptocurrency and commodity markets, where structural breaks, regime shifts, and nonlinear propagation are common. Responses to geopolitical risk and commodity-market disturbances vary across periods, so a single, time-invariant adjustment mechanism is unlikely to be adequate. A more flexible method is therefore warranted. In this setting, regime-aware specifications, such as MS-VECM and MS-VARDL, can accommodate state-dependent adjustment and spillover dynamics, and they tend to deliver a better fit. The model comparisons reported in this paper align with that interpretation.
These results provide compelling evidence that linear models are inadequate for analyzing the long- and short-run dynamics of BTC, gold, and oil in the presence of global uncertainty risks and regime-dependent behaviors.
In
Table 12, to evaluate the adequacy of the estimated model, additional diagnostic tests were performed on the residuals. The presence of chaotic dynamics in the residual series was examined using the LE and KS entropy measures, while residual independence was assessed by autocorrelation tests. The results indicate that the residuals do not exhibit significant autocorrelation, suggesting that the model successfully captures the dynamic dependence structure of the variables. The estimated KS entropy values are close to zero, and the Lyapunov diagnostics do not provide evidence of chaotic dynamics in the residual series. These results show that the nonlinear and chaotic components present in the original variables have been effectively absorbed by the model specification. Consequently, the absence of residual chaos and serial correlation provides additional support for the adequacy and robustness of the estimated model.
Table 13 reports the MAPE in-sample and out-of-sample results in the second stage of the robustness check. The MS-VECM and MS-ARDL methods provided lower MAPE values. The forecast results also present the achievement of the selected models.
As shown in
Table 13, the MS-ARDL/MS-VARDL model produces lower MAPE values than the linear VECM benchmark for both in-sample and out-of-sample forecasts. This finding provides empirical support for the claim that regime-switching models capture the nonlinear and state-dependent structure of the data more effectively than the linear specification.
The MS-VARDL model shows the lowest MAPE value, indicating the most accurate forecasts. The MS-VECM also performs well with a slightly higher MAPE than MS-ARDL. The linear VECM shows a significantly higher MAPE, suggesting poor forecast accuracy. Similar to the MAPE in-sample results, the MAPE out-of-sample values determine the superior forecasting performance of the MS-ARDL model. The MS-VECM model again follows closely, while the linear VECM model displays a substantially higher error, further supporting its relative weakness in out-of-sample forecasting.
Both the MS-ARDL and MSIH-VECM models exhibited better performance than the traditional linear VECM model in terms of forecast accuracy. The results show the advantage of incorporating regime-switching mechanisms into time series modeling. The MS-VARDL and MS-VECM methods emerged as the most effective forecasting tool, while the linear VECM model failed to provide reliable forecasts in this context.
5. Discussion
The empirical results indicate that the joint dynamics among Bitcoin, gold, crude oil, geopolitical risk, and global uncertainty are characterized by nonlinear dependence, fractal persistence, and regime-contingent behaviors. These properties are consistent with earlier diagnostic evidence derived from long-memory estimations, entropy-based complexity measures, and the Lyapunov exponent analysis, which collectively suggest that the underlying system does not conform to a linear stochastic process. Instead, the results support the interpretation of financial markets as a complex adaptive system in which feedback mechanisms, scale effects, and dynamic interdependencies jointly determine market evolution.
Given this structural evidence, the results imply that traditional linear econometric frameworks are insufficient to capture the observed adjustment dynamics. In particular, the linear VECM specification fails to reflect abrupt changes, asymmetric responses, and structural breaks that arise under conditions of heightened geopolitical tension. This limitation stems from its assumption of time-invariant parameters, which is inconsistent with the empirically observed regime-dependent evolution of financial relationships. By contrast, the MS-VARDL and MS-VECM methods provided a more flexible representation, allowing for both short-run and long-run dynamics to vary across latent regimes.
The empirical evidence further demonstrated that regime shifts play a critical role in shaping the transmission of geopolitical shocks. During episodes of intensified geopolitical risk, such as the Iran–Israel–United States escalation, financial markets exhibit heterogeneous and asymmetric responses across asset classes. Crude oil reacts immediately and strongly to supply-side concerns and energy security risks, while Bitcoin shows a positive and risk-sensitive revaluation behavior, and gold exhibits a weakening pattern despite its traditional role as a safe-haven asset. These divergent responses indicated that cross-asset relationships are not stable under extreme uncertainty and instead are adjusted according to prevailing market regimes.
The results confirm that crude oil functions as the primary transmission channel of geopolitical shock within the global financial system. This result reflects oil’s central role in production networks, international trade, and inflation expectations. Geopolitical disruptions affecting strategic supply routes, such as the Strait of Hormuz, are first reflected in energy markets and subsequently transmitted to broader financial assets through inflationary and risk-sentiment channels. This transmission mechanism highlights the structural importance of energy markets in the propagation of global uncertainty.
The relationship between Bitcoin and gold is found to be highly state-dependent rather than structurally stable. In some regimes, Bitcoin behaves as a partial substitute for gold, attracting demand as an alternative hedging instrument; whereas, in other regimes, it reflects speculative positioning and risk-on behavior. The observed divergence during the recent geopolitical escalation, where Bitcoin strengthened while gold weakened, illustrates that Bitcoin’s safe-haven properties are conditional on liquidity conditions, investor sentiment, and macro-financial constraints rather than being invariant across time.
From a methodological perspective, the results demonstrate that linear models systematically smooth out heterogeneous adjustment processes by imposing constant parameters across all market states. This leads to an underestimation of shock intensity and misrepresentation of crisis-period dynamics. Markov-switching models address this limitation by allowing volatility, adjustment speeds, and transmission mechanisms to differ across regimes. The improved out-of-sample forecasting performance of nonlinear specifications, reflected in lower MAPE values relative to the linear VECM, confirm their empirical superiority. These results reinforce the view that financial markets, particularly cryptocurrency markets, evolve through nonlinear and regime-dependent structures driven by investor behavior, speculative dynamics, and global uncertainty shocks.
The results carry important implications for investors and policymakers. The instability of safe-haven relationships suggested that traditional portfolios may become unreliable during periods of geopolitical stress. In addition, the increasing responsiveness of Bitcoin to macro-financial shocks indicated that digital assets are progressively integrated into global risk transmission mechanisms rather than remaining isolated speculative instruments. At the same time, oil price fluctuations continue to amplify inflation expectations and monetary policy uncertainty, reinforcing its role as the central macro-financial transmission channel of geopolitical risk.
Overall, the evidence suggests that linear time-series models are inadequate for capturing the joint dynamics of Bitcoin, gold, and crude oil under conditions of geopolitical uncertainty. Market behavior is fundamentally state-dependent and linear VAR-type models obscure important regime-specific adjustments. Incorporating nonlinear regime-switching structures, such as the MS-VECM and MS-VARDL methods, provide a more realistic representation of financial market dynamics. The recent geopolitical escalation further validates these results, demonstrating that asset responses are heterogeneous and structurally contingent on prevailing market conditions.
6. Conclusions
This paper investigated the dynamic interdependence among geopolitical risk (GPR), global uncertainty (WUI), WTI crude oil, Bitcoin, and gold over the period October 2010–February 2026. The empirical framework was built upon a comprehensive set of nonlinear, chaotic, and fractal diagnostics, including Hurst–Mandelbrot and Lo’s modified R/S tests for long-range dependence, fractional integration estimators (Geweke–Porter–Hudak and Phillips), entropy-based measures (Shannon, Rényi, and Tsallis), Kolmogorov–Sinai complexity, and Lyapunov exponent analysis. The combined evidence consistently indicated that the underlying system is characterized by persistence, heavy tails, scale invariance, and sensitivity to initial conditions, confirming that financial and geopolitical interactions evolve within a nonlinear and structurally unstable environment.
Given this structural evidence, the results demonstrate that financial markets cannot be adequately modeled using linear stochastic methods. The presence of fractal persistence and chaotic dynamics implied that dependence structures are not fixed over time but evolve endogenously with market conditions. Accordingly, the results justify a regime-dependent modeling strategy in which both short-run and long-run dynamics are allowed to vary across latent states.
To capture these features, this paper employed MS(2)-VECM(2) and MS-VARDL models, which explicitly incorporate a regime-switching behavior in both adjustment mechanisms and transmission channels. The empirical results show that these nonlinear specifications outperform the linear VECM in both in-sample and out-of-sample forecasts, as evidenced by substantially lower MAPE values. This improvement confirmed that ignoring regime heterogeneity leads to systematic misrepresentation of shock transmission during periods of heightened geopolitical stress. The superior performance of MS-VARDL further indicated that adjustment dynamics in financial markets are not only nonlinear but are highly sensitive to regime duration and transition probabilities.
From an economic perspective, the results reveal that spillover dynamics among assets are fundamentally state-dependent. Crude oil emerges as the dominant transmission channel of geopolitical shocks due to its central role in global production networks, trade flows, and inflation expectations. In particular, disruptions associated with strategic supply routes, such as the Strait of Hormuz, amplify energy price volatility, which subsequently propagates to other financial assets through inflation and risk sentiment channels. This mechanism positions oil as the primary conduit through which geopolitical uncertainty is transmitted to global financial markets.
The analysis also shows that the Bitcoin–gold relationship is not structurally stable but varies across regimes. In certain states, Bitcoin partially substitutes for gold as an alternative hedging instrument, while in other states it behaves more like a risk-sensitive asset driven by speculative positioning. The empirical evidence from recent geopolitical escalation further confirms this instability as Bitcoin strengthened while gold weakened, despite elevated global uncertainty. These results suggest that safe-haven properties are not intrinsic asset characteristics but emerge endogenously under specific liquidity, sentiment, and macro-financial conditions.
Crucially, the results demonstrate that linear models systematically understate the magnitude and speed of crisis-period adjustments. By imposing constant parameters across heterogeneous regimes, linear VECM specifications smooth out abrupt transitions and fail to capture structural breaks in spillover transmission. By contrast, regime-switching models accommodate time-varying adjustment speeds and volatility regimes, providing a more accurate representation of financial dynamics under stress. This confirms that equilibrium relationships in financial markets are not fixed but are themselves regime-contingent.
From a broader policy perspective, the results indicate that traditional financial stability methods based on linear dependence assumptions are increasingly inadequate. The observed instability in cross-asset correlations, together with the emergence of regime-dependent hedging behavior, suggests that risk is nonlinear and time-varying. Accordingly, stress-testing frameworks should explicitly incorporate regime shifts and nonlinear transmission channels in relation to cryptocurrency markets, which exhibit increasing integration into global financial networks.
At the same time, oil price dynamics continue to play a central role in macro-financial stability. Geopolitical shocks that affect energy supply routes generate rapid and nonlinear adjustments in global inflation expectations and monetary policy outlooks. This reinforces the need for energy security-oriented macroprudential strategies.
Finally, the results show the importance of international policy coordination in managing systemic financial risk. In an environment characterized by fractal dependence structures, chaotic adjustment dynamics, and increasing informational uncertainty, geopolitical shocks propagate simultaneously across energy, commodity, and digital asset markets. These interconnected transmission channels transcend national boundaries by making coordinated monitoring of global financial vulnerabilities essential for mitigating the risk of synchronized instability.
Overall, this paper contributes to the literature on financial complexity by integrating chaos theory, fractal dynamics, entropy-based measures, and regime-switching econometrics within a unified geopolitical risk method. The results indicate that financial markets should be interpreted as complex adaptive systems in which nonlinear dependence, structural heterogeneity, and informational disorder jointly shape asset price dynamics. In such systems, geopolitical shocks do not merely induce temporary deviations but can alter the underlying structure of financial interactions through regime transitions, volatility clustering, and evolving cross-asset linkages. The evidence presented here underscores the limitations of linear equilibrium-based methods and highlights the necessity of complexity-oriented modeling frameworks for understanding modern financial systems.
Theoretical implications and future research directions: Future papers can enlarge upon this analysis by integrating additional sources of global risk into nonlinear econometric frameworks.