Article

Multifractal Characterization of Pore Structure in Different Members Tight Sandstones of the Triassic Yanchang Formation, Ordos Basin, China

1
Exploration and Development Research Institute, Henan Oilfield Branch Company, China Petroleum and Chemical Corporation Limited, Nanyang 473132, China
2
School of Geoscience, Yangtze University, Wuhan 430100, China
3
Key Laboratory of Exploration Technologies for Oil and Gas Resources, Yangtze University, Wuhan 430100, China
4
Key Laboratory of Petroleum Resources Exploration and Evaluation, Northwest Institute of Eco-Environment and Resources, Chinese Academy of Sciences, Lanzhou 730000, China
*
Authors to whom correspondence should be addressed.
Fractal Fract. 2026, 10(7), 425; https://doi.org/10.3390/fractalfract10070425
Submission received: 7 April 2026 / Revised: 22 May 2026 / Accepted: 17 June 2026 / Published: 23 June 2026

Abstract

Tight oil reservoir quality and development effectiveness are highly dependent on microscopic pore structure characteristics and spatial heterogeneity. In this study, tight sandstones from the Chang 3, Chang 6, Chang 7, and Chang 8 members of the Triassic Yanchang Formation in the Xunyi exploration area, southern Ordos Basin, were selected as research objects. By integrating X-ray diffraction (XRD), cast thin sections, scanning electron microscopy (SEM), high-pressure mercury injection (HPMI) experiments, and multifractal theory, the multi-scale heterogeneity characteristics of pore structures in different layers were quantitatively characterized. The response relationships between multifractal parameters, macroscopic physical properties, and pore size distributions were discussed, and the geological control mechanisms of sedimentation and diagenesis on heterogeneity were revealed. The results indicate that the sedimentary environment plays a fundamental role in controlling reservoir physical properties. The Chang 3 and Chang 8 members, deposited in underwater distributary channels, are dominated by primary and dissolution pores, with physical properties significantly superior to the gravity flow-deposited Chang 6 and Chang 7 members. Multifractal analysis shows that the Chang 3 member has the largest singularity spectrum width (Δα =1.943 ± 0.56) and heterogeneity index (Rd = 1.782 ± 0.99), reflecting its broadest pore size distribution, strongest heterogeneity, and significant intra-layer differences; while the pore structures from Chang 6 to Chang 8 are relatively stable, with the Chang 8 member exhibiting high spatial connectivity. This study demonstrates that the quantitative evaluation method based on multifractal theory can effectively identify microscopic structural differences in tight sandstones, providing a critical supporting basis for reservoir classification characterization and favorable layer selection in the Yanchang Formation of the Ordos Basin.

1. Introduction

Tight oil has become an essential part of global unconventional oil and gas resources with the greatest development potential. Its large resource scale and wide distribution are of great significance for ensuring energy security and promoting the transformation of oil and gas exploration and development [1]. Compared with conventional sandstone reservoirs, tight oil reservoirs generally exhibit low porosity and permeability, complex pore structures, and strong heterogeneity [2]. Reservoir quality and development effectiveness are highly dependent on microscopic pore structure characteristics and spatial distribution patterns [3].
The Ordos Basin is one of the most tight-oil-rich basins in China, where the Yanchang Formation, as the most important tight oil-bearing sequence, is the core target for current exploration and development [4]. During the deposition of the Yanchang Formation, the lake basin underwent frequent evolution, and the sediment supply and hydrodynamic conditions changed significantly, resulting in the vertical stacking of multiple sandstone reservoirs. Different members exhibit obvious differences in sedimentary environments, lithological combinations, and diagenetic evolution paths [5,6]. These characteristics make the differentiation and heterogeneity of tight sandstone reservoirs increasingly important, placing higher demands on refined reservoir evaluation and the identification of advantageous layers [6]. Tight sandstone reservoirs generally have low porosity and permeability, small pore-throat scales, and complex pore structures, and their quality is largely controlled by microscopic pore structure and heterogeneity characteristics [7].
Currently, experimental methods such as NMR, mercury injection, and gas adsorption have been widely used in pore structure studies [8]. However, these methods usually focus on statistical characterization and find it difficult to quantitatively describe the fluctuation and unevenness of pore distribution across different scale ranges. Traditional single fractal dimensions cannot effectively describe multi-level heterogeneity across different scales. Multifractal theory, as an important extension, can characterize the distribution features and fluctuation patterns of pore structures within different scale ranges by introducing probability measures and multi-order statistical moments [9]. Multifractal analysis based on NMR T2 distribution or pore size distribution data can not only characterize the overall heterogeneity of pore structures but also distinguish different pore-scale features corresponding to high-probability and low-probability measure regions, thereby revealing the differential contributions of dominant and extreme pores to reservoir physical properties [10,11]. However, its limitation lies in its dependence on the resolution of the testing apparatus (e.g., the maximum pressure of HPMI), which may mask nanoscale features [12,13]. Although conventional experimental methods can adequately characterize basic pore-throat geometry, the quantitative evolutionary mechanisms governing pore space heterogeneity within genetically distinct sand bodies (e.g., gravity flow and distributary channel deposits) remain poorly constrained. In particular, the multifractal parameters of pore systems within the tight sandstones of the Yanchang Formation have yet to be fully elucidated [14]. Understanding the differences in tight sandstone pore structures and their formation mechanisms is a key issue that needs to be addressed for the efficient development of tight oil [15,16].
Therefore, taking the tight sandstones from different members of the Yanchang Formation as research objects, this paper introduces multifractal theory based on a large amount of HPMI experimental data. We comparatively analyze the multi-scale heterogeneity characteristics of sandstone pore structures, explore the response relationships between multifractal parameters and reservoir physical properties, and further reveal the control mechanisms of sedimentary and diagenetic factors.

2. Geological Setting

The study area is located in the Xunyi area of the southern Ordos Basin, situated in the transition zone between the Yishaan Slope and the Weibei Uplift (Figure 1a). The structure is dominated by slopes and locally affected by faults, including the Xunyi-Huangling fault-slope zone, the Yijun fault-slope zone, and the Yintai fault-fold zone (Figure 1b). The Mesozoic in the study area is dominated by the Triassic Yanchang Formation, with well-developed strata and multiple sets of sandstone-mudstone combinations developed vertically (Figure 1c). The Chang 6, Chang 7, and Chang 8 members are stably distributed within the area; among them, the Chang 7 member was deposited during the maximum flooding period of the lake basin, developing thick layers of dark mudstone and shale, and serving as the most significant source rock interval of the Yanchang Formation. The sedimentary facies are mainly lacustrine and braided river delta facies, where delta-front underwater distributary channel sand bodies and gravity-flow sand bodies are extensively developed. Significant differences exist in the sedimentary environments and sand body distributions across different members, which laid the geological foundation for the formation of reservoir heterogeneity [17].

3. Samples and Methods

3.1. Samples

Samples were collected from the tight sandstone reservoirs of the Yanchang Formation, covering major oil and gas-bearing members such as Chang 3, Chang 6, Chang 7, and Chang 8. A total of 49 core samples were selected. Various petrophysical and petrological experiments were conducted, including XRD analysis for mineral composition, cast thin section observation for grain structure and diagenetic features, and HPMI experiments for the quantitative characterization of pore-throat structure and heterogeneity.

3.2. Experiment Methods

3.2.1. XRD

X-ray diffraction (XRD) analysis was conducted to determine the mineral composition of the sandstone samples. Bulk-rock samples were crushed to 200 mesh and analyzed using an X-ray diffractometer under Cu-Kα radiation. The scanning range was 5–70° (2θ) with a step size of 0.02°. Semi-quantitative mineral contents were calculated using the standard peak-area method [18].

3.2.2. Thin Observation

To characterize the pore system, core samples were vacuum-impregnated with blue resin and prepared as cast thin sections after being cut and dried. Following the GB/T 17412.2-1998 standard [19], a Leica polarizing microscope (Leica Microsystems, Wetzlar, Germany) was employed to examine detrital compositions (quartz, feldspar, and rock fragments) and textural features such as sorting, roundness, and grain contacts. Mineralogy and optical porosity were quantified via the point-counting method, ensuring at least 300 counts per thin section for statistical reliability [20].

3.2.3. Porosity and Permeability

Porosity and permeability were measured on cylindrical core plugs using a routine core analysis system following the Chinese Oil and Gas Industry Standard (GB/T 29172-2012: Practices for core analysis) [21]. Porosity was determined by the gas expansion method, while permeability was measured using nitrogen as the flowing medium under steady-state conditions. All measurements were conducted at room temperature [22].

3.2.4. SEM Observation

Scanning electron microscopy (SEM) was applied to observe pore morphology and mineral occurrence at the micro- to nanoscale. Freshly broken surfaces of selected samples were gold-coated prior to observation. SEM imaging was performed under an accelerating voltage of 5–20 kV to identify pore types, pore connectivity, and diagenetic features [23].

3.2.5. Mercury Injection Capillary Pressure

Mercury injection capillary pressure (MICP) testing—also frequently referred to as mercury intrusion porosimetry (MIP) in the literature, with its high-pressure testing mode known as high-pressure mercury intrusion (HPMI)—is conducted using a high-pressure mercury porosimeter and is commonly employed to characterize the pore-throat structures of rocks and porous media [24,25]. The experiments were conducted using an AutoPore IV 9520 high-pressure mercury porosimeter (Micromeritics Instrument Corporation, Norcross, GA, USA), with the maximum injection pressure reaching approximately 100 MPa. The scientific basis for this high pressure lies in the severe densification of the Yanchang Formation tight sandstones, which are dominated by nano-scale pore-throats [26]. Pore-throat radius distribution was calculated based on the Washburn equation, assuming a mercury surface tension of 0.48 N/m and a contact angle of 140°. Key MICP parameters, including displacement pressure and median pore-throat radius, were obtained from the intrusion curves [27].

3.3. Multifractal Analysis Theory

Multifractal theory is an effective tool for quantitatively characterizing the heterogeneity of complex pore systems. Unlike fractal analysis, which describes pore structures using a single fractal dimension, multifractal analysis represents pore systems by a continuous set of fractal dimensions, allowing for a more comprehensive description of pore-size distribution and heterogeneity [28,29]:
N ε = L ε
In multifractal analysis, the pore structure data (e.g., pore-throat size distribution obtained from mercury injection capillary pressure experiments) are first normalized and treated as a probability measure [30]. The data series is divided into N(ε) subsets with scale ε, which can be expressed as:
P i ε = v i ε i = 1 N ( ε ) v i ε
where L is the total length of the data series. The probability measure of the i-th subset is defined as: where vi(ε) represents the pore volume or incremental mercury intrusion volume within the i-th subset [31]. To characterize the scaling behavior of the probability distribution, the partition function χ(q,ε) is defined as:
x q , ε = i = 1 N ε P i q ( ε )
where q is the moment order, which can take both positive and negative values to emphasize different probability measure regions. In this study, the moment order q was set in the range of −5 to +5 with a step interval of 1 [32,33]. This specific range is sufficiently wide and widely adopted in the field of petroleum geology to capture the complete scaling behavior of the probability measure: negative q values amplify the influence of low-probability regions (corresponding to rare, large macropores), while positive q values emphasize high-probability regions (corresponding to abundant, fine nano-pores), without causing severe computational divergence [34,35]. This continuous spectrum ensures a comprehensive and stable characterization of multi-scale pore heterogeneity. The mass exponent τ(q) is obtained from the slope of the linear relationship between ln χ(q,ε) and ln ε:
τ q = lim ε 0 ln X q , ε ln ε
Based on τ(q), the generalized fractal dimension Dq is defined as:
D q = τ q / q 1 ( q 1 ) lim ε 0 i = 1 N ε P i q ε ln P i ε ln ε ( q = 1 )
where D0, D1, and D2 represent the capacity dimension, information dimension, and correlation dimension, respectively. The singularity exponent α(q) and multifractal spectrum f(α) are derived through Legendre transformation:
α q = d τ q d q
f α = q α q τ q
The multifractal spectrum f(α) − α describes the distribution of singularity strengths within the pore system, while the generalized dimension spectrum Dqq reflects the scaling behavior of probability measures at different moments [36].
Several characteristic parameters are extracted from the multifractal spectra to quantitatively describe pore structure heterogeneity. The width of the singularity spectrum is defined as:
Δ α = α m a x α m i n
which reflects the degree of pore structure heterogeneity. The asymmetry of the multifractal spectrum is expressed as:
A = α m a x α 0 α 0 α m i n
where α0 corresponds to the singularity exponent at the maximum value of f(α). In this study, multifractal parameters including D0, D1, D2, αmin, αmax, Δα, and A are mainly used to characterize pore structure [37]. Among them, D0 reflects the concentration degree of pore-size distribution, D1 describes the uniformity of pore volume distribution, and D2 represents the spatial correlation of pores. Parameters αmin and αmax correspond to high- and low-probability measure regions, respectively, indicating the dominant and extreme pore structures. The parameters Δα and A are used to quantify the overall heterogeneity and asymmetry of the pore system, which are closely related to reservoir quality and pore structure complexity [38].

4. Results

4.1. Reservoir Quality and Pores Morphology from Different Formation

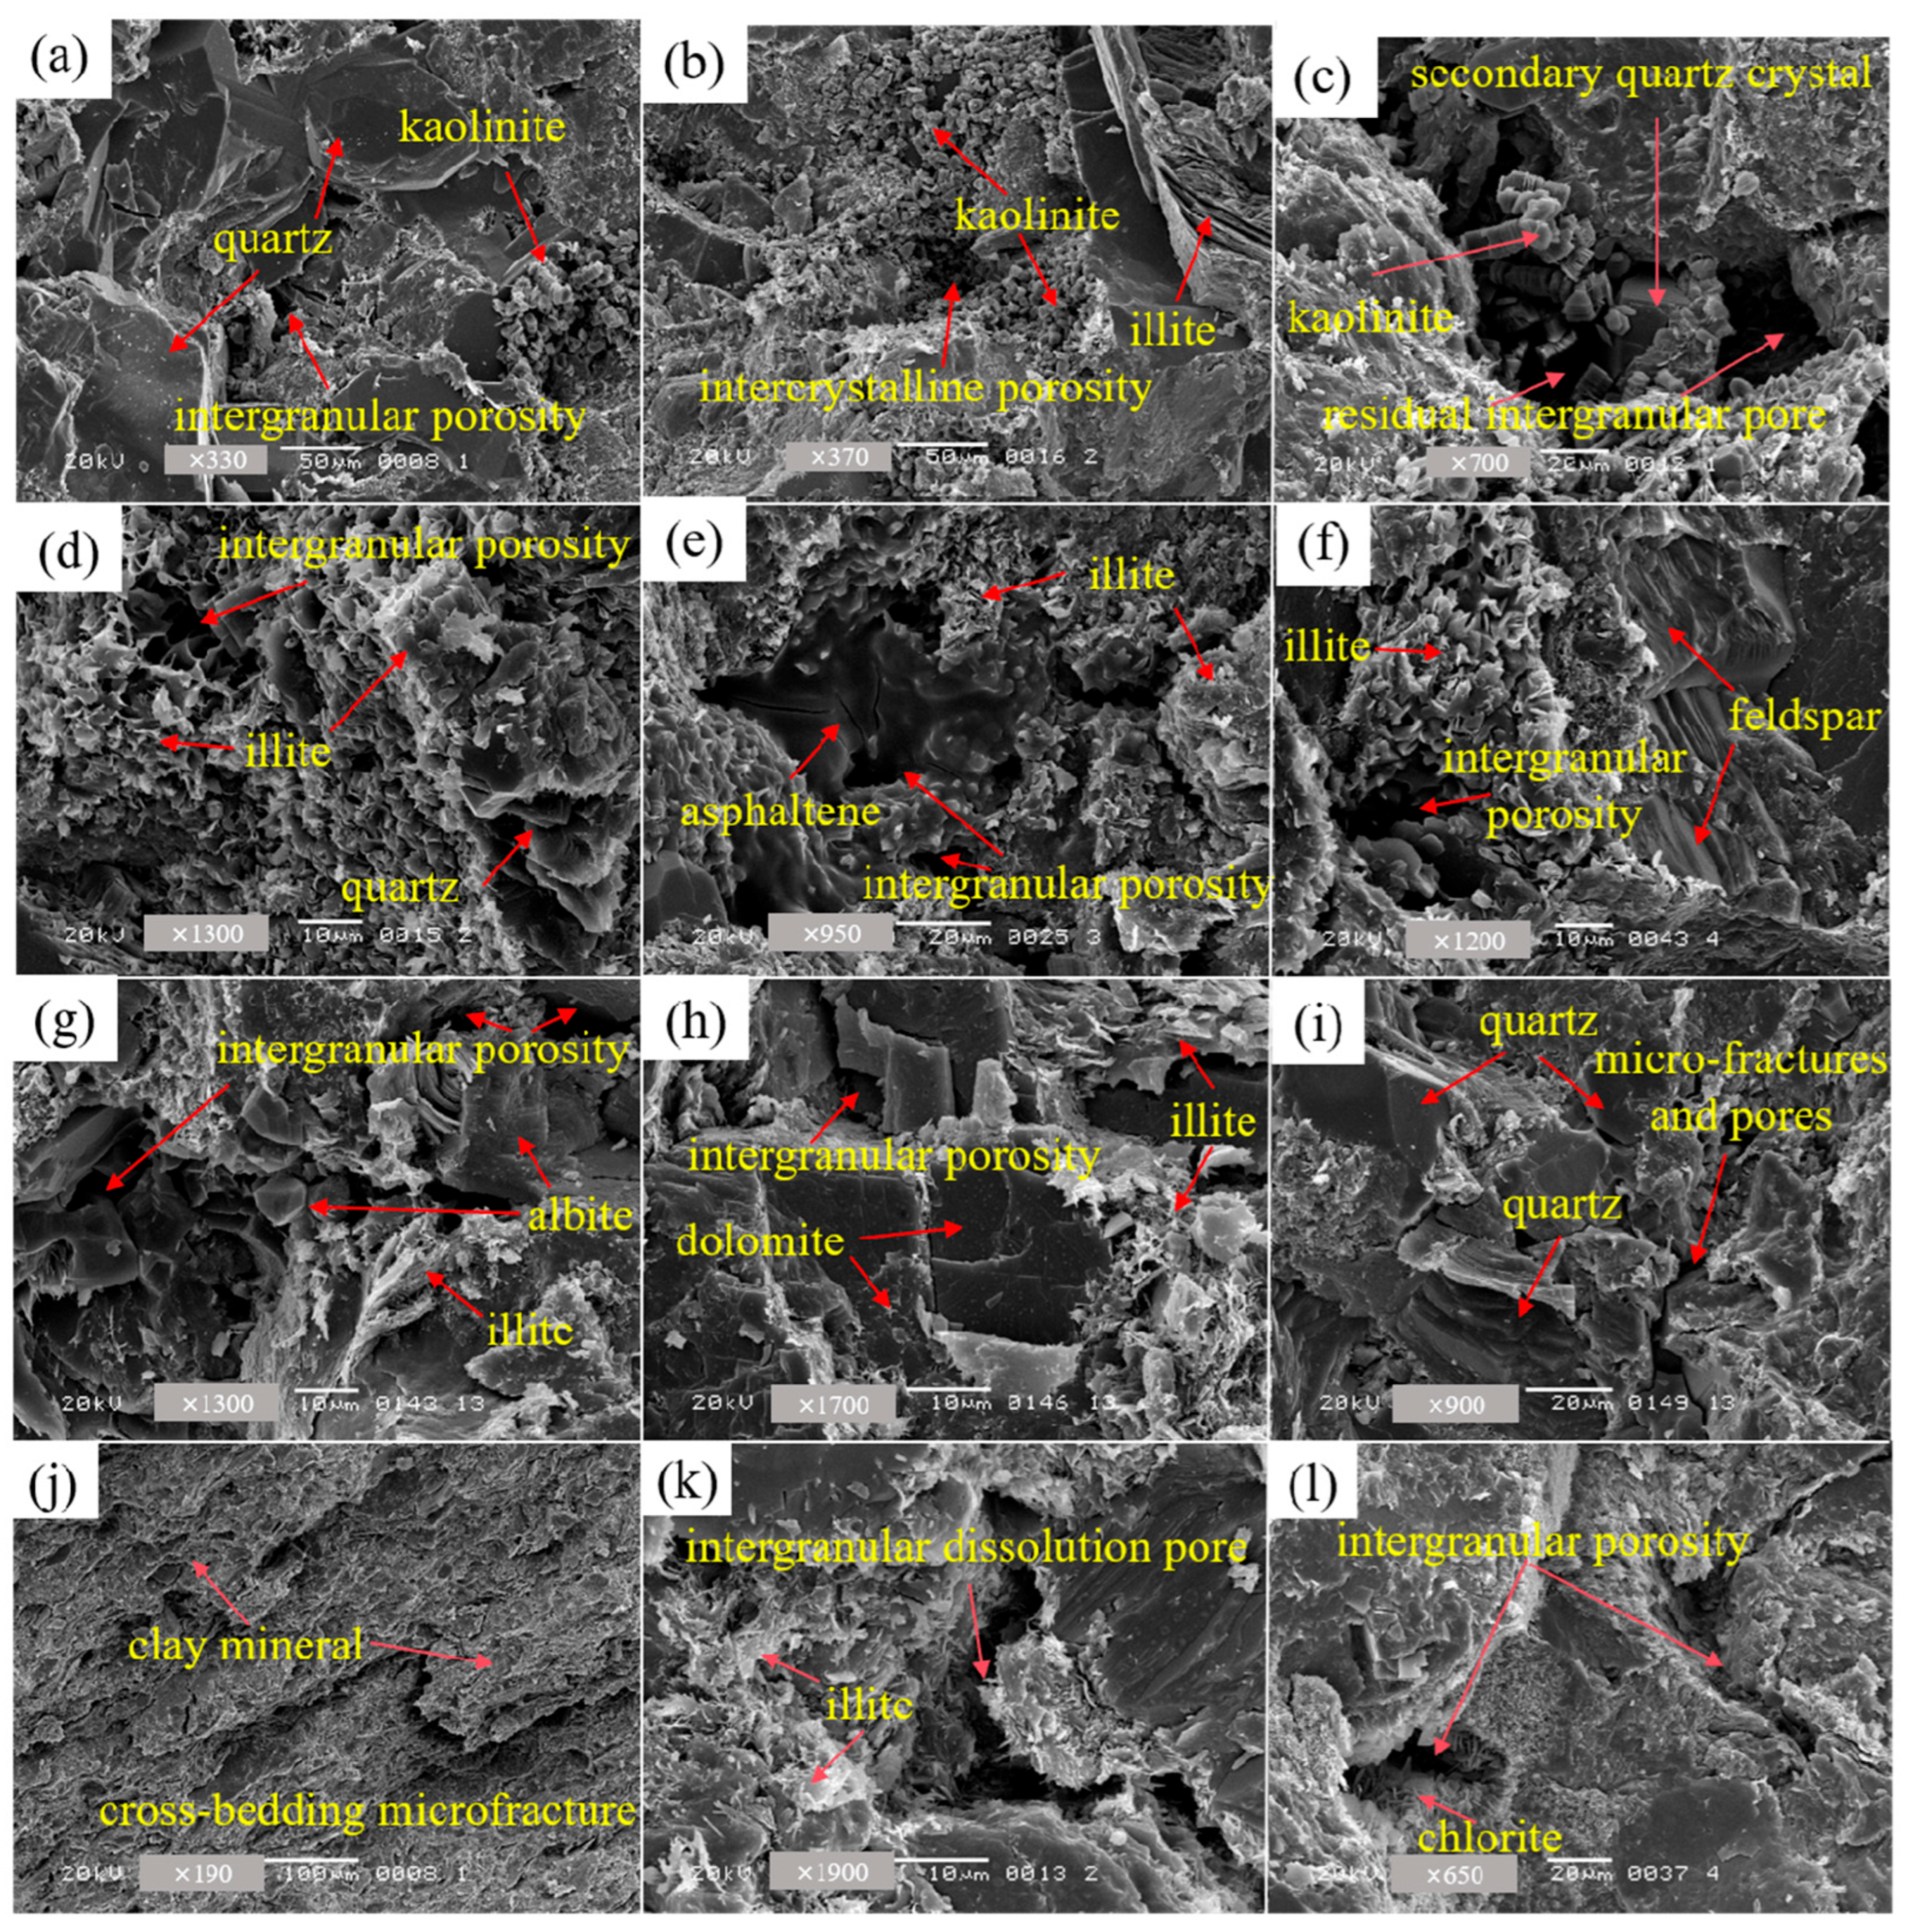
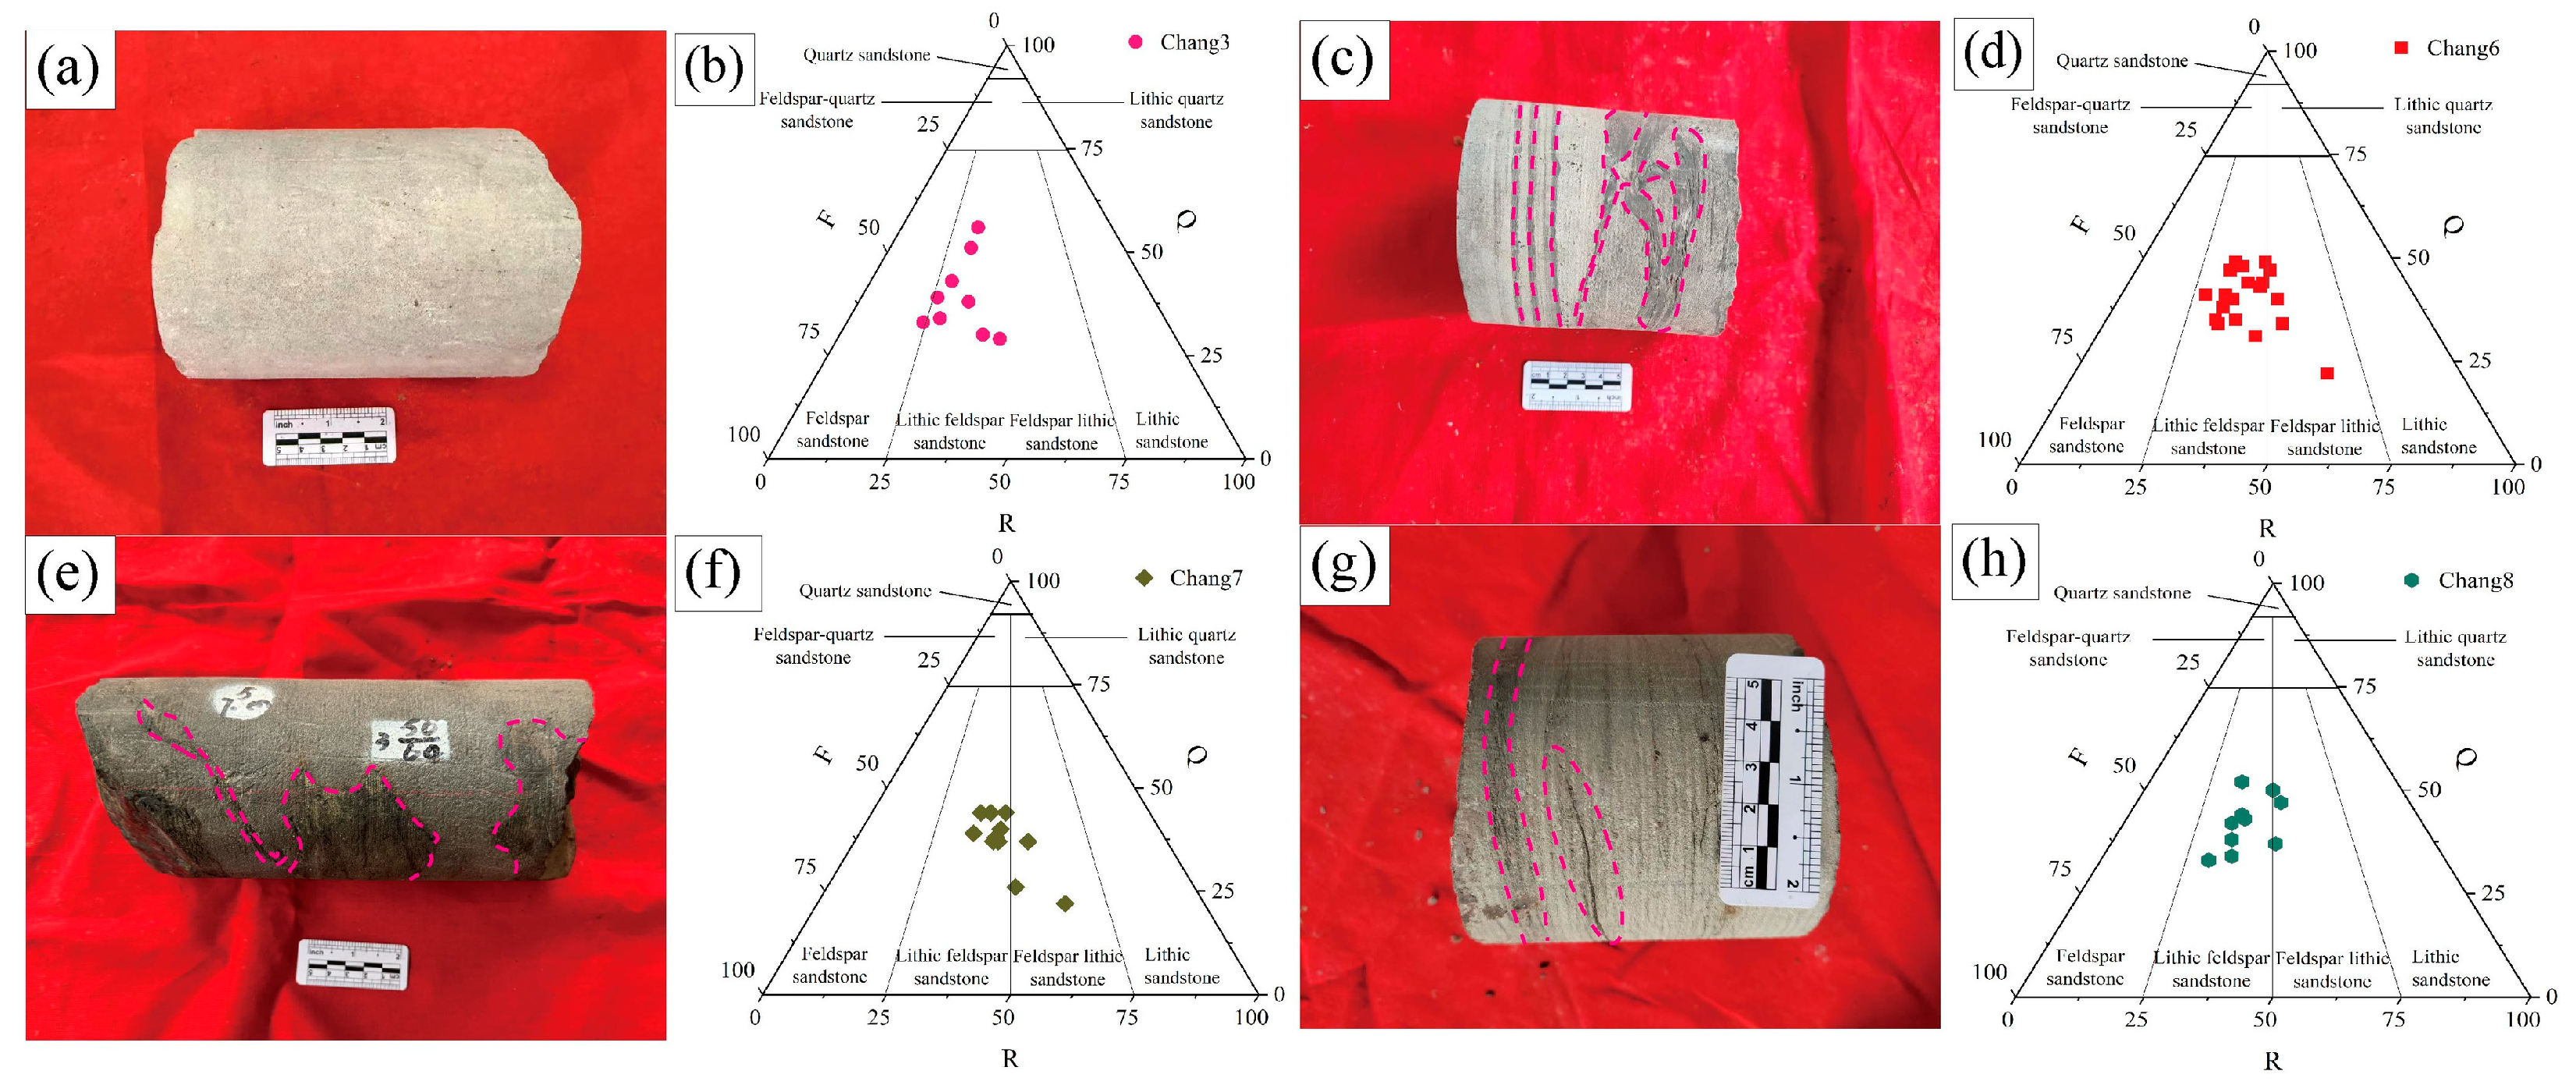
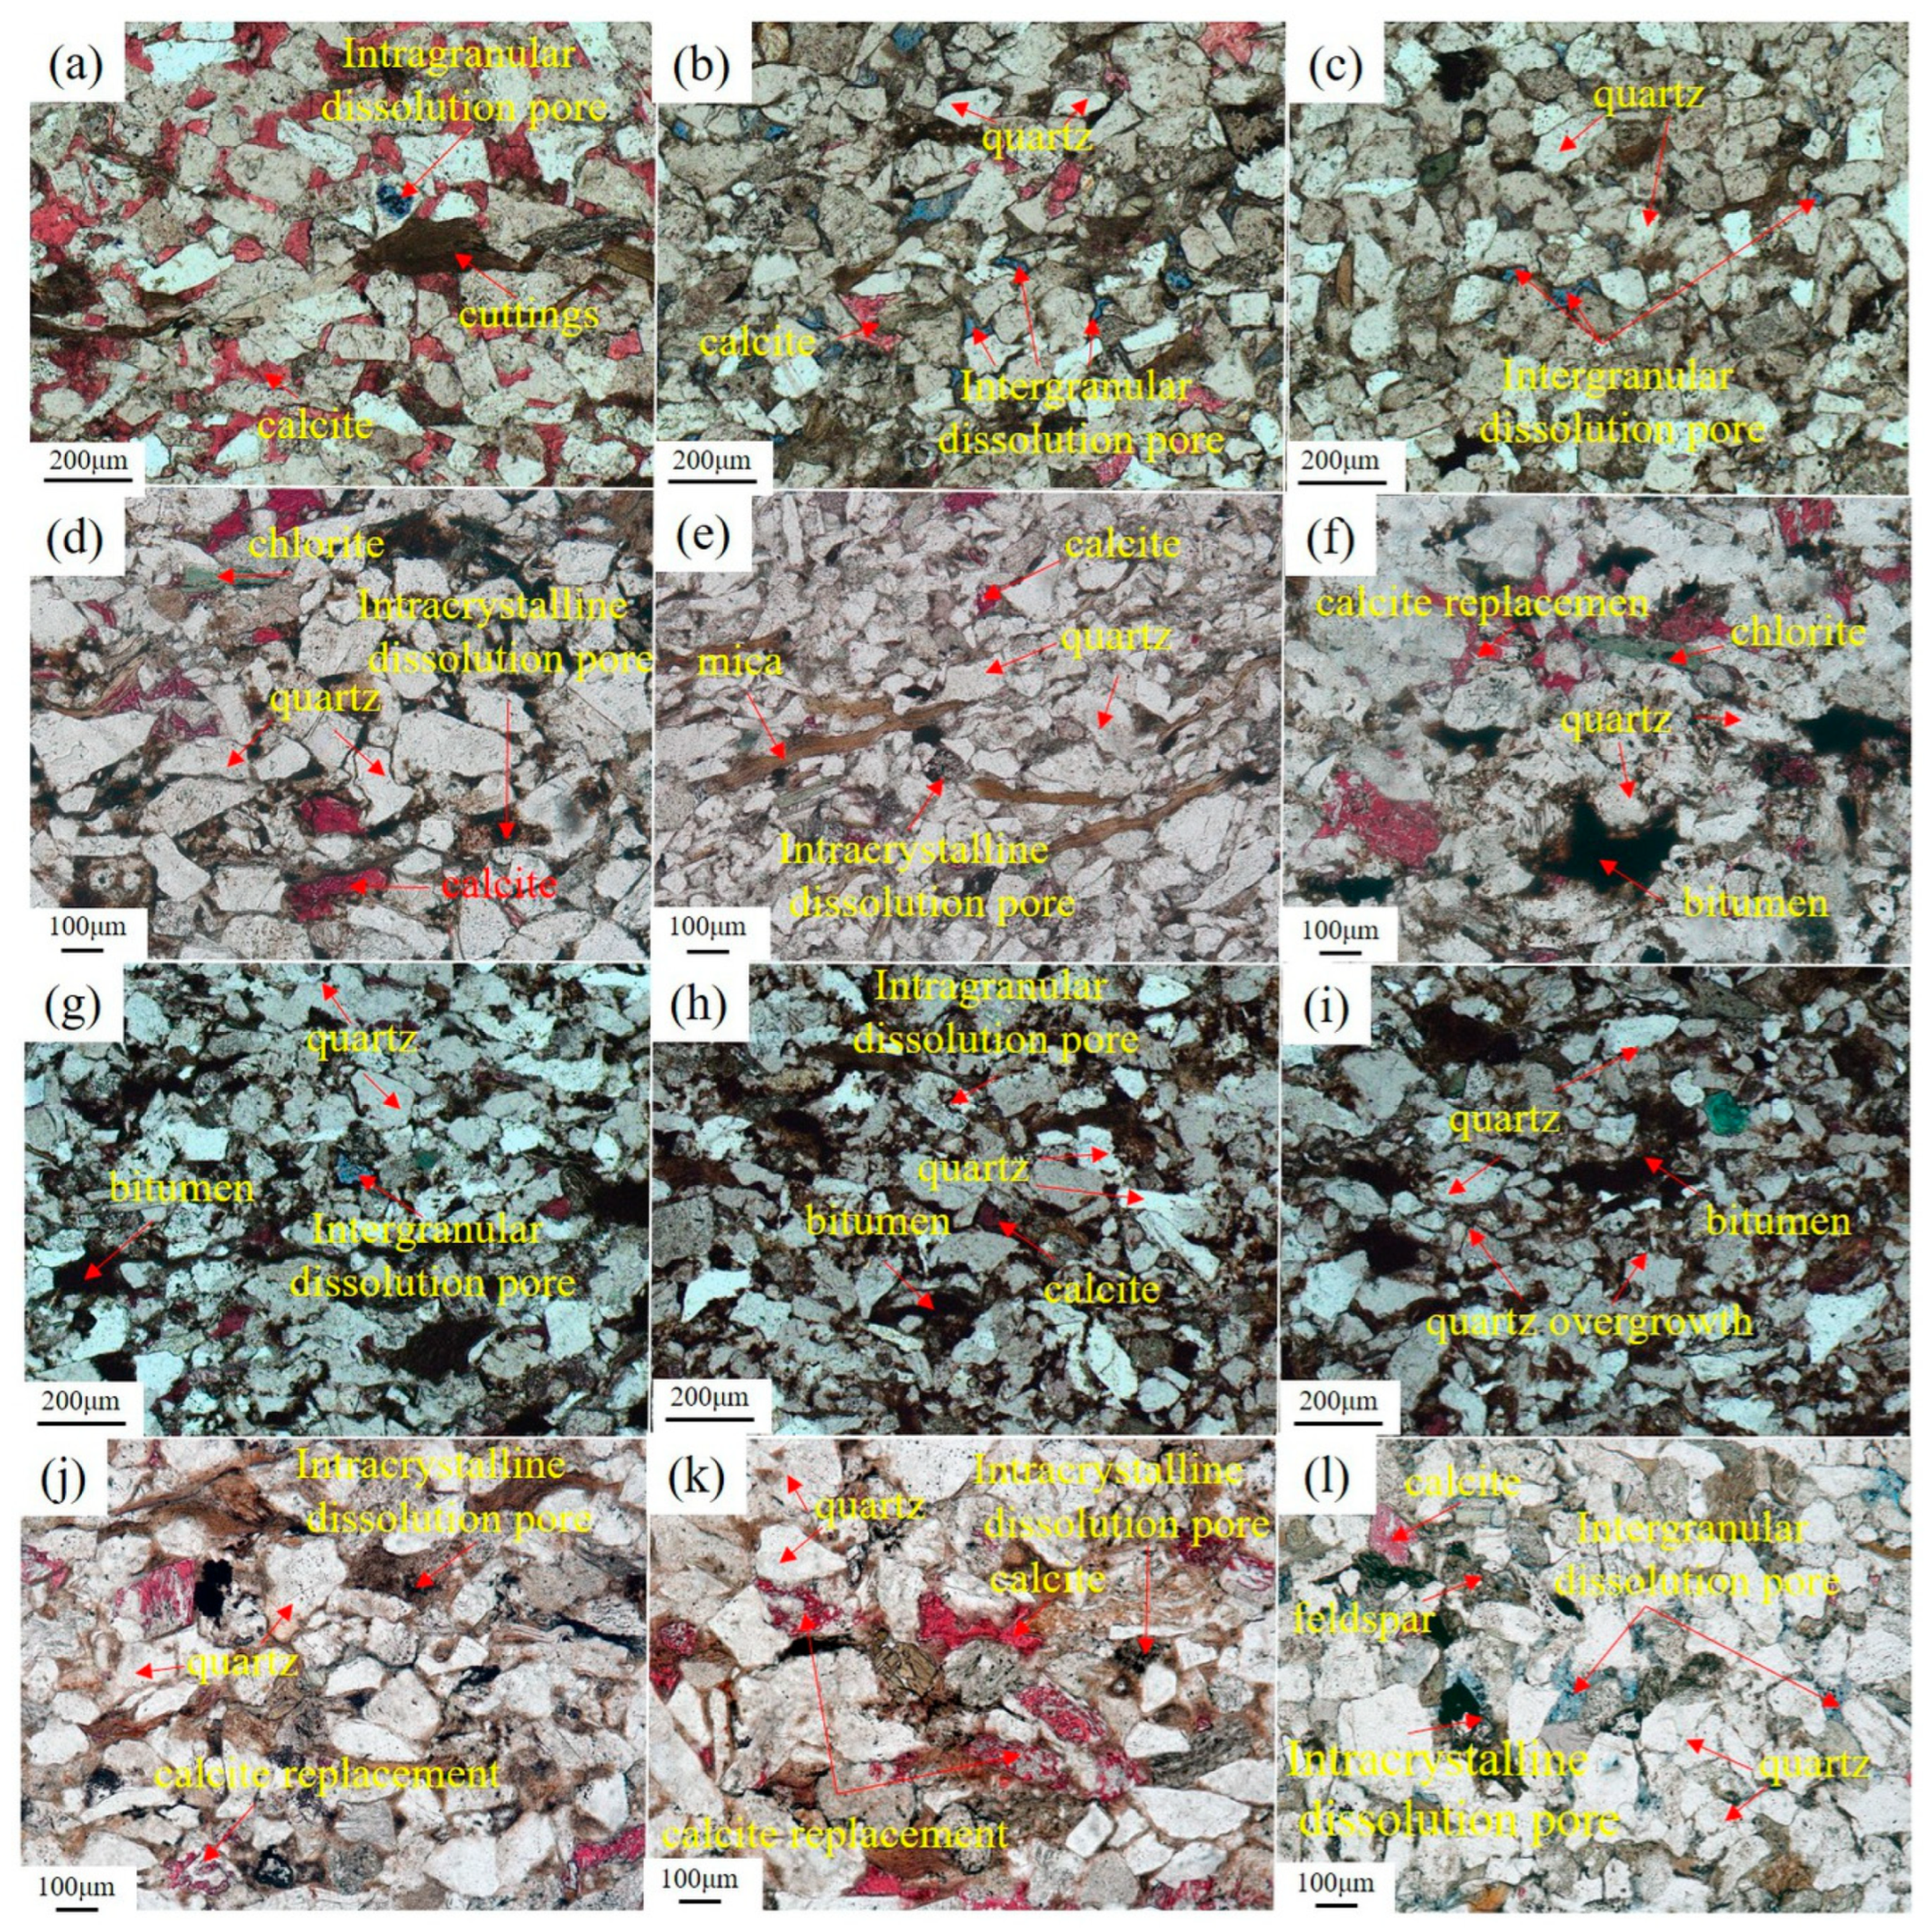
Four major reservoir intervals, including Chang 3, Chang 6, Chang 7, and Chang 8, are primarily developed in the Triassic Yanchang Formation of the Xunyi exploration area, with distinct reservoir characteristics observed among the different members (Figure 2). The sandstones of Chang 3 and Chang 8 are predominantly composed of underwater distributary channel deposits from the braided river delta front (Figure 2a,b,g,h), whereas the sandstones of Chang 6 and Chang 7 mainly consist of deep-lake to semi-deep-lake gravity flow deposits, including sandy debris flows and turbidity currents (Figure 2c–f). The Chang 3 and Chang 8 sandstones are dominated by residual primary intergranular pores and partial secondary dissolution pores (Figure 3a–c,j–l), characterized by a relatively wide pore size distribution, good pore-throat connectivity, and low heterogeneity in microscopic pore structure (Figure 4a–c,j–l). In contrast, the gravity flow sandstones of Chang 6 and Chang 7 were controlled by an instantaneous accumulation mechanism, resulting in generally high matrix contents, extremely fine grain sizes, and poor sorting (Figure 3d–i); this led to intense compaction during the early diagenetic stage and a severe loss of primary porosity (Figure 4d–i). Overall, the stable water winnowing effect of the channel sandstones established an excellent initial pore framework, whereas the chaotic accumulation of gravity flows prefigured the extreme complication of the subsequent microscopic pore structure from the initial stage; consequently, the reservoir physical properties of the Chang 3 and Chang 8 sandstones are superior to those of Chang 6 and Chang 7.
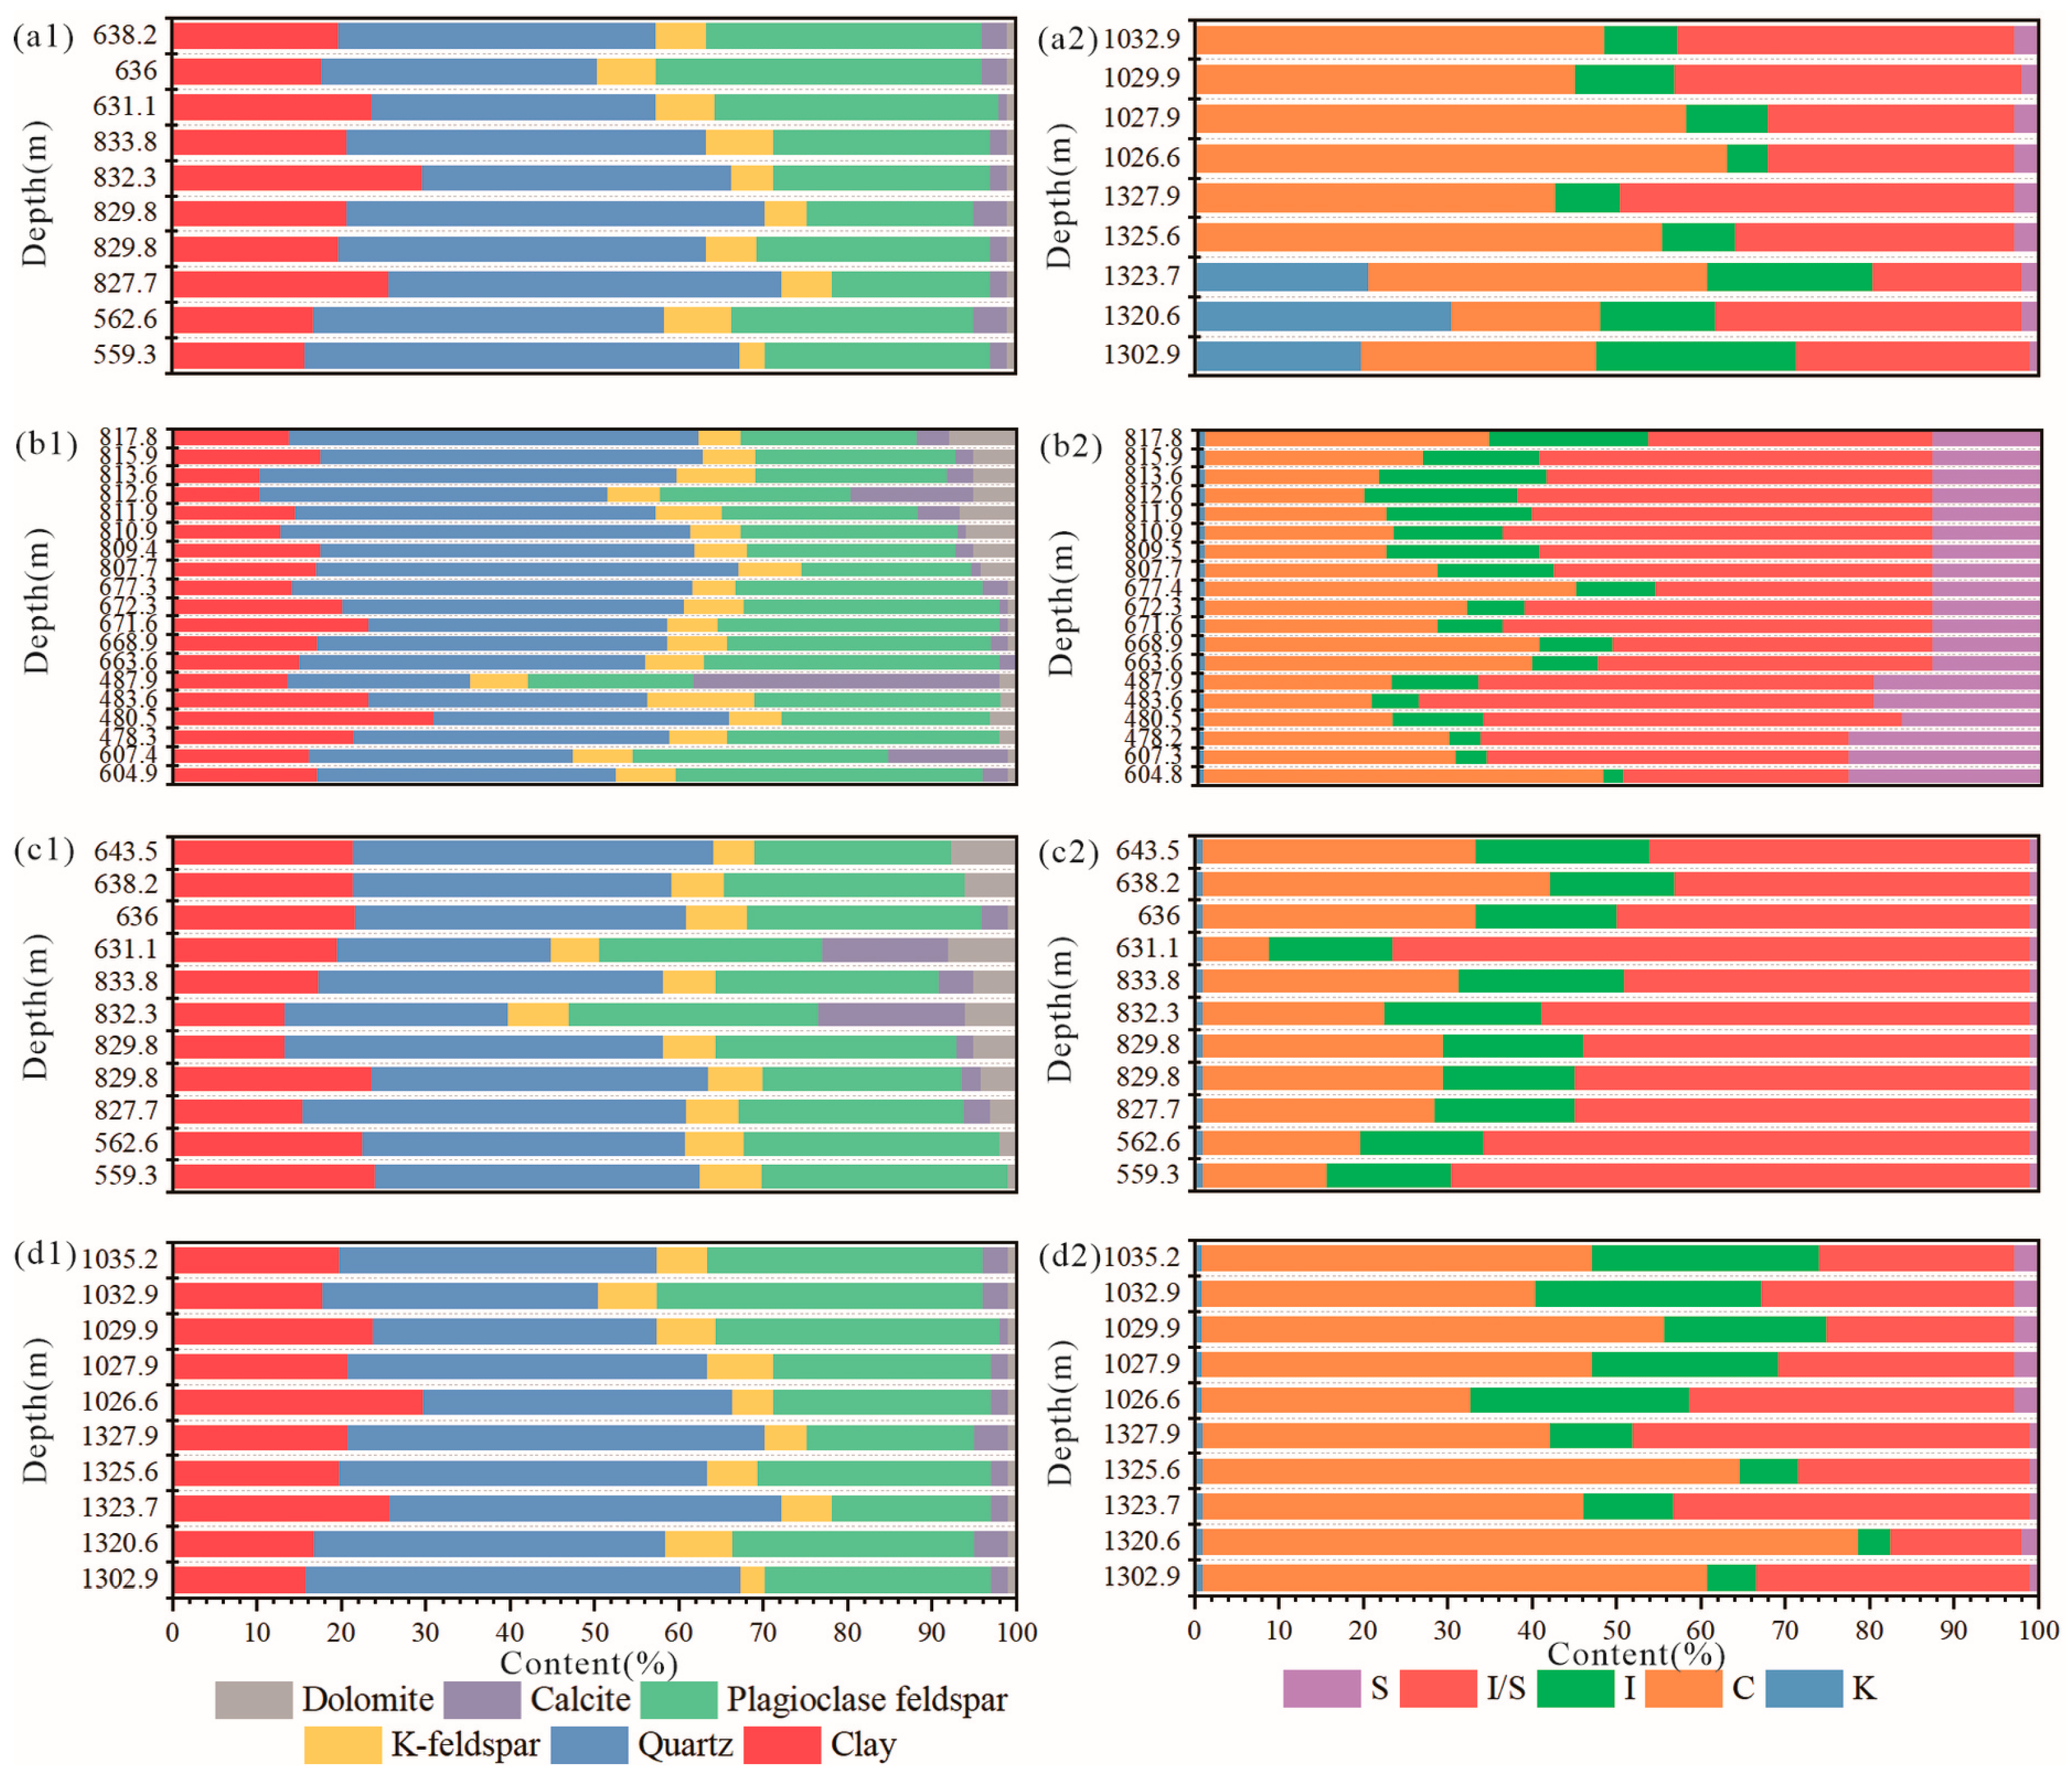
Based on XRD analysis, the mineral compositions of tight sandstones from different members of the Yanchang Formation were compared. Results indicate that quartz is the predominant mineral, with average contents generally exceeding 40%. Feldspar is the second most abundant component, with plagioclase reaching 20–30%, while K-feldspar content is typically below 10%. Excluding a few samples with carbonate levels exceeding 40%, carbonate minerals such as calcite and dolomite are generally below 10% in most samples (Figure 5). The total clay mineral content is consistently less than 15%. Among the clay minerals, chlorite is dominant, generally exceeding 30%. Notably, chlorite contents in Chang 3 and Chang 8 reach 45% and 52%, respectively (Figure 5a2,d2). In contrast, the illite/smectite (I/S) mixed-layer content is highest in Chang 6 and Chang 7, exceeding 50% (Figure 5b2,c2).

4.2. Pore Size Distribution Obtained by HPMI

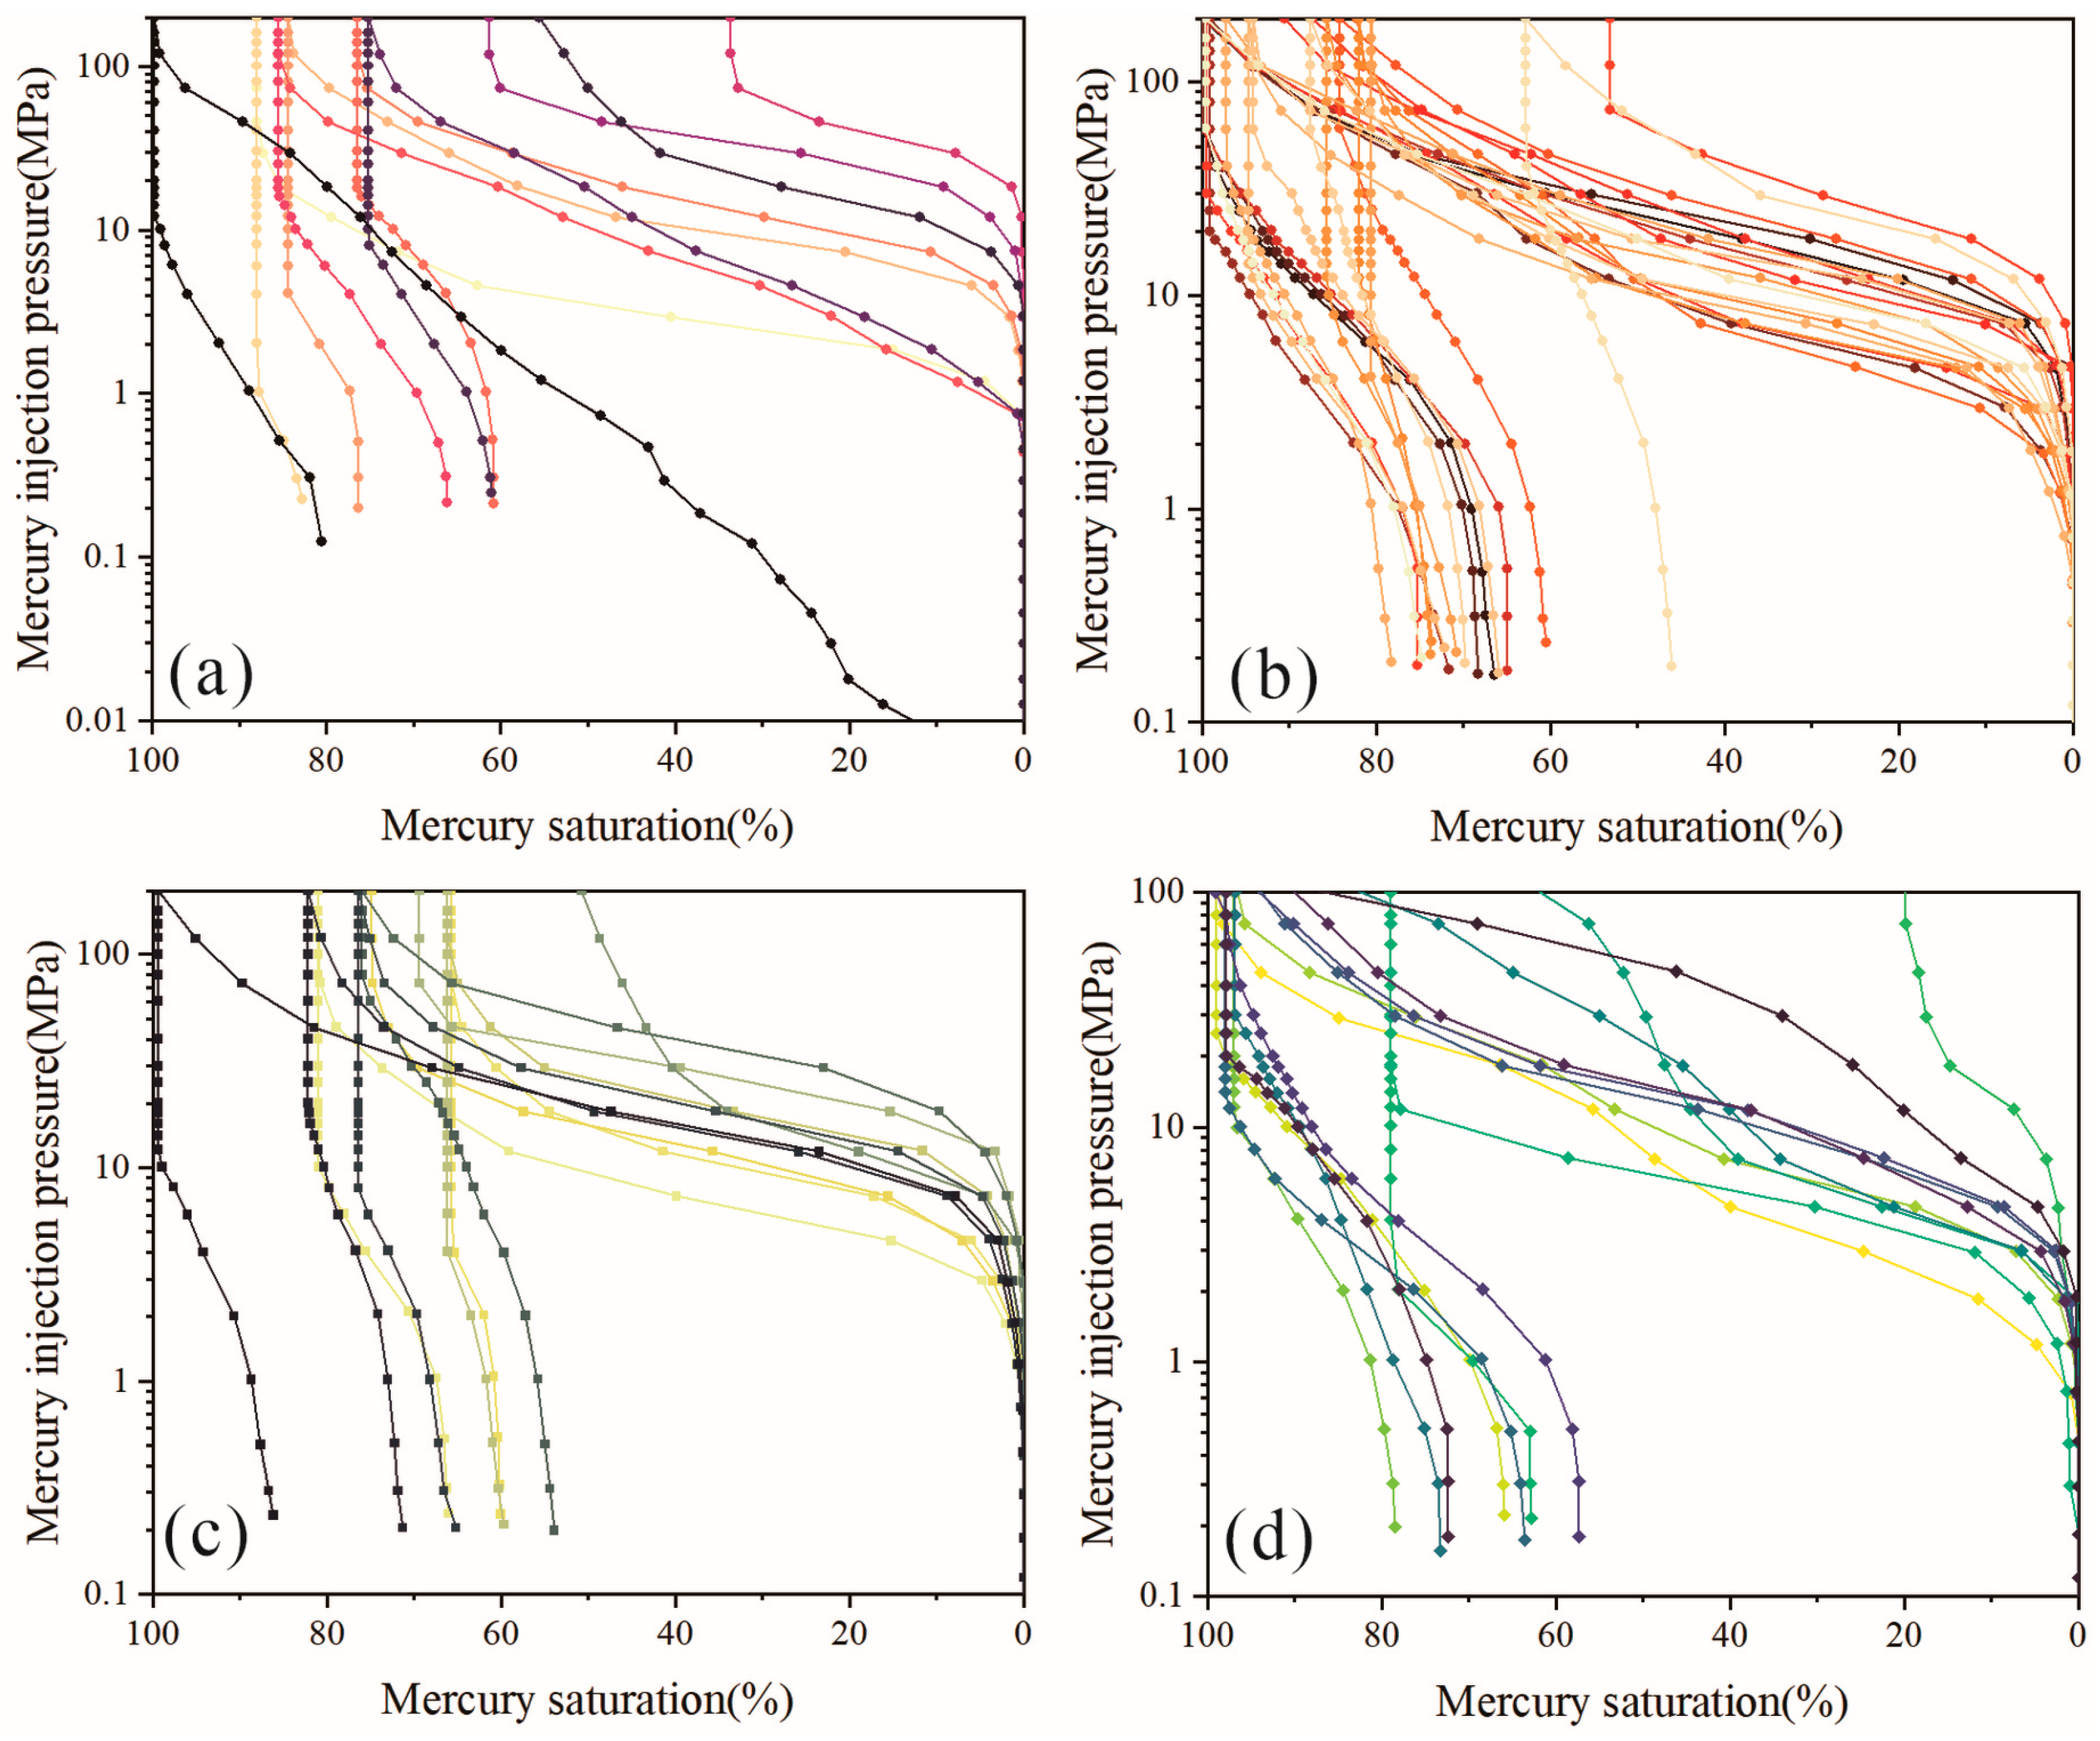
The theoretical foundation for deriving the pore size distribution (PSD) from High-Pressure Mercury Intrusion (HPMI) relies on the capillary bundle model and the non-wetting nature of mercury [39,40]. During the HPMI experiment, pressure increased incrementally. According to the Washburn equation, at lower pressures, mercury preferentially intrudes into larger macro-pores; as the pressure increases, it is forced into progressively finer micro- and nano-pores. The cumulative volume of injected mercury at any given pressure corresponds to the total pore volume connected by throats larger than or equal to the calculated radius r. Consequently, the PSD (expressed as pore volume frequency) is mathematically derived by calculating the incremental mercury intrusion volume (ΔV) between successive pressure steps (ΔP). Guided by this theoretical framework, the microscopic pore-throat characteristics of the tight sandstones from different members were quantitatively evaluated [41,42]. Figure 6 shows that the mercury injection and extrusion curves of tight sandstones from different members are relatively similar. When the pressure reaches the range of 1–10 MPa, mercury saturation begins to rise rapidly; within the injection pressure range of 10–100 MPa, mercury saturation increases gradually, indicating a wide pore-throat size distribution and strong heterogeneity. Most samples reach their maximum mercury saturation when the injection pressure reaches 100 MPa. In the extrusion curves, most samples exhibit significant mercury withdrawal only when the pressure drops below 20 MPa. Smax represents the maximum accessible pore volume during mercury intrusion. This study shows that Chang 6 reaches the highest Smax, with an average exceeding 88.98%, indicating a high proportion of effective pores (Figure 6b). Pc50 corresponds to the capillary pressure at 50% mercury saturation and characterizes the dominant pore-throat size; the results show that Chang 7 has the highest average Pc50 at 28.05 MPa (Figure 6c), indicating that micro-to-nano-scale pore throats are dominant, while Chang 8 has the lowest Pc50 at 17.20 MPa (Figure 6d). Regarding the threshold pressure (Pc10), the values for Chang 3 and Chang 8 are higher, reaching over 5 MPa. In contrast, the Pc10 values for Chang 6 and Chang 7 are lower, which may be attributed to the presence of a few relatively large pores or micro-fractures.
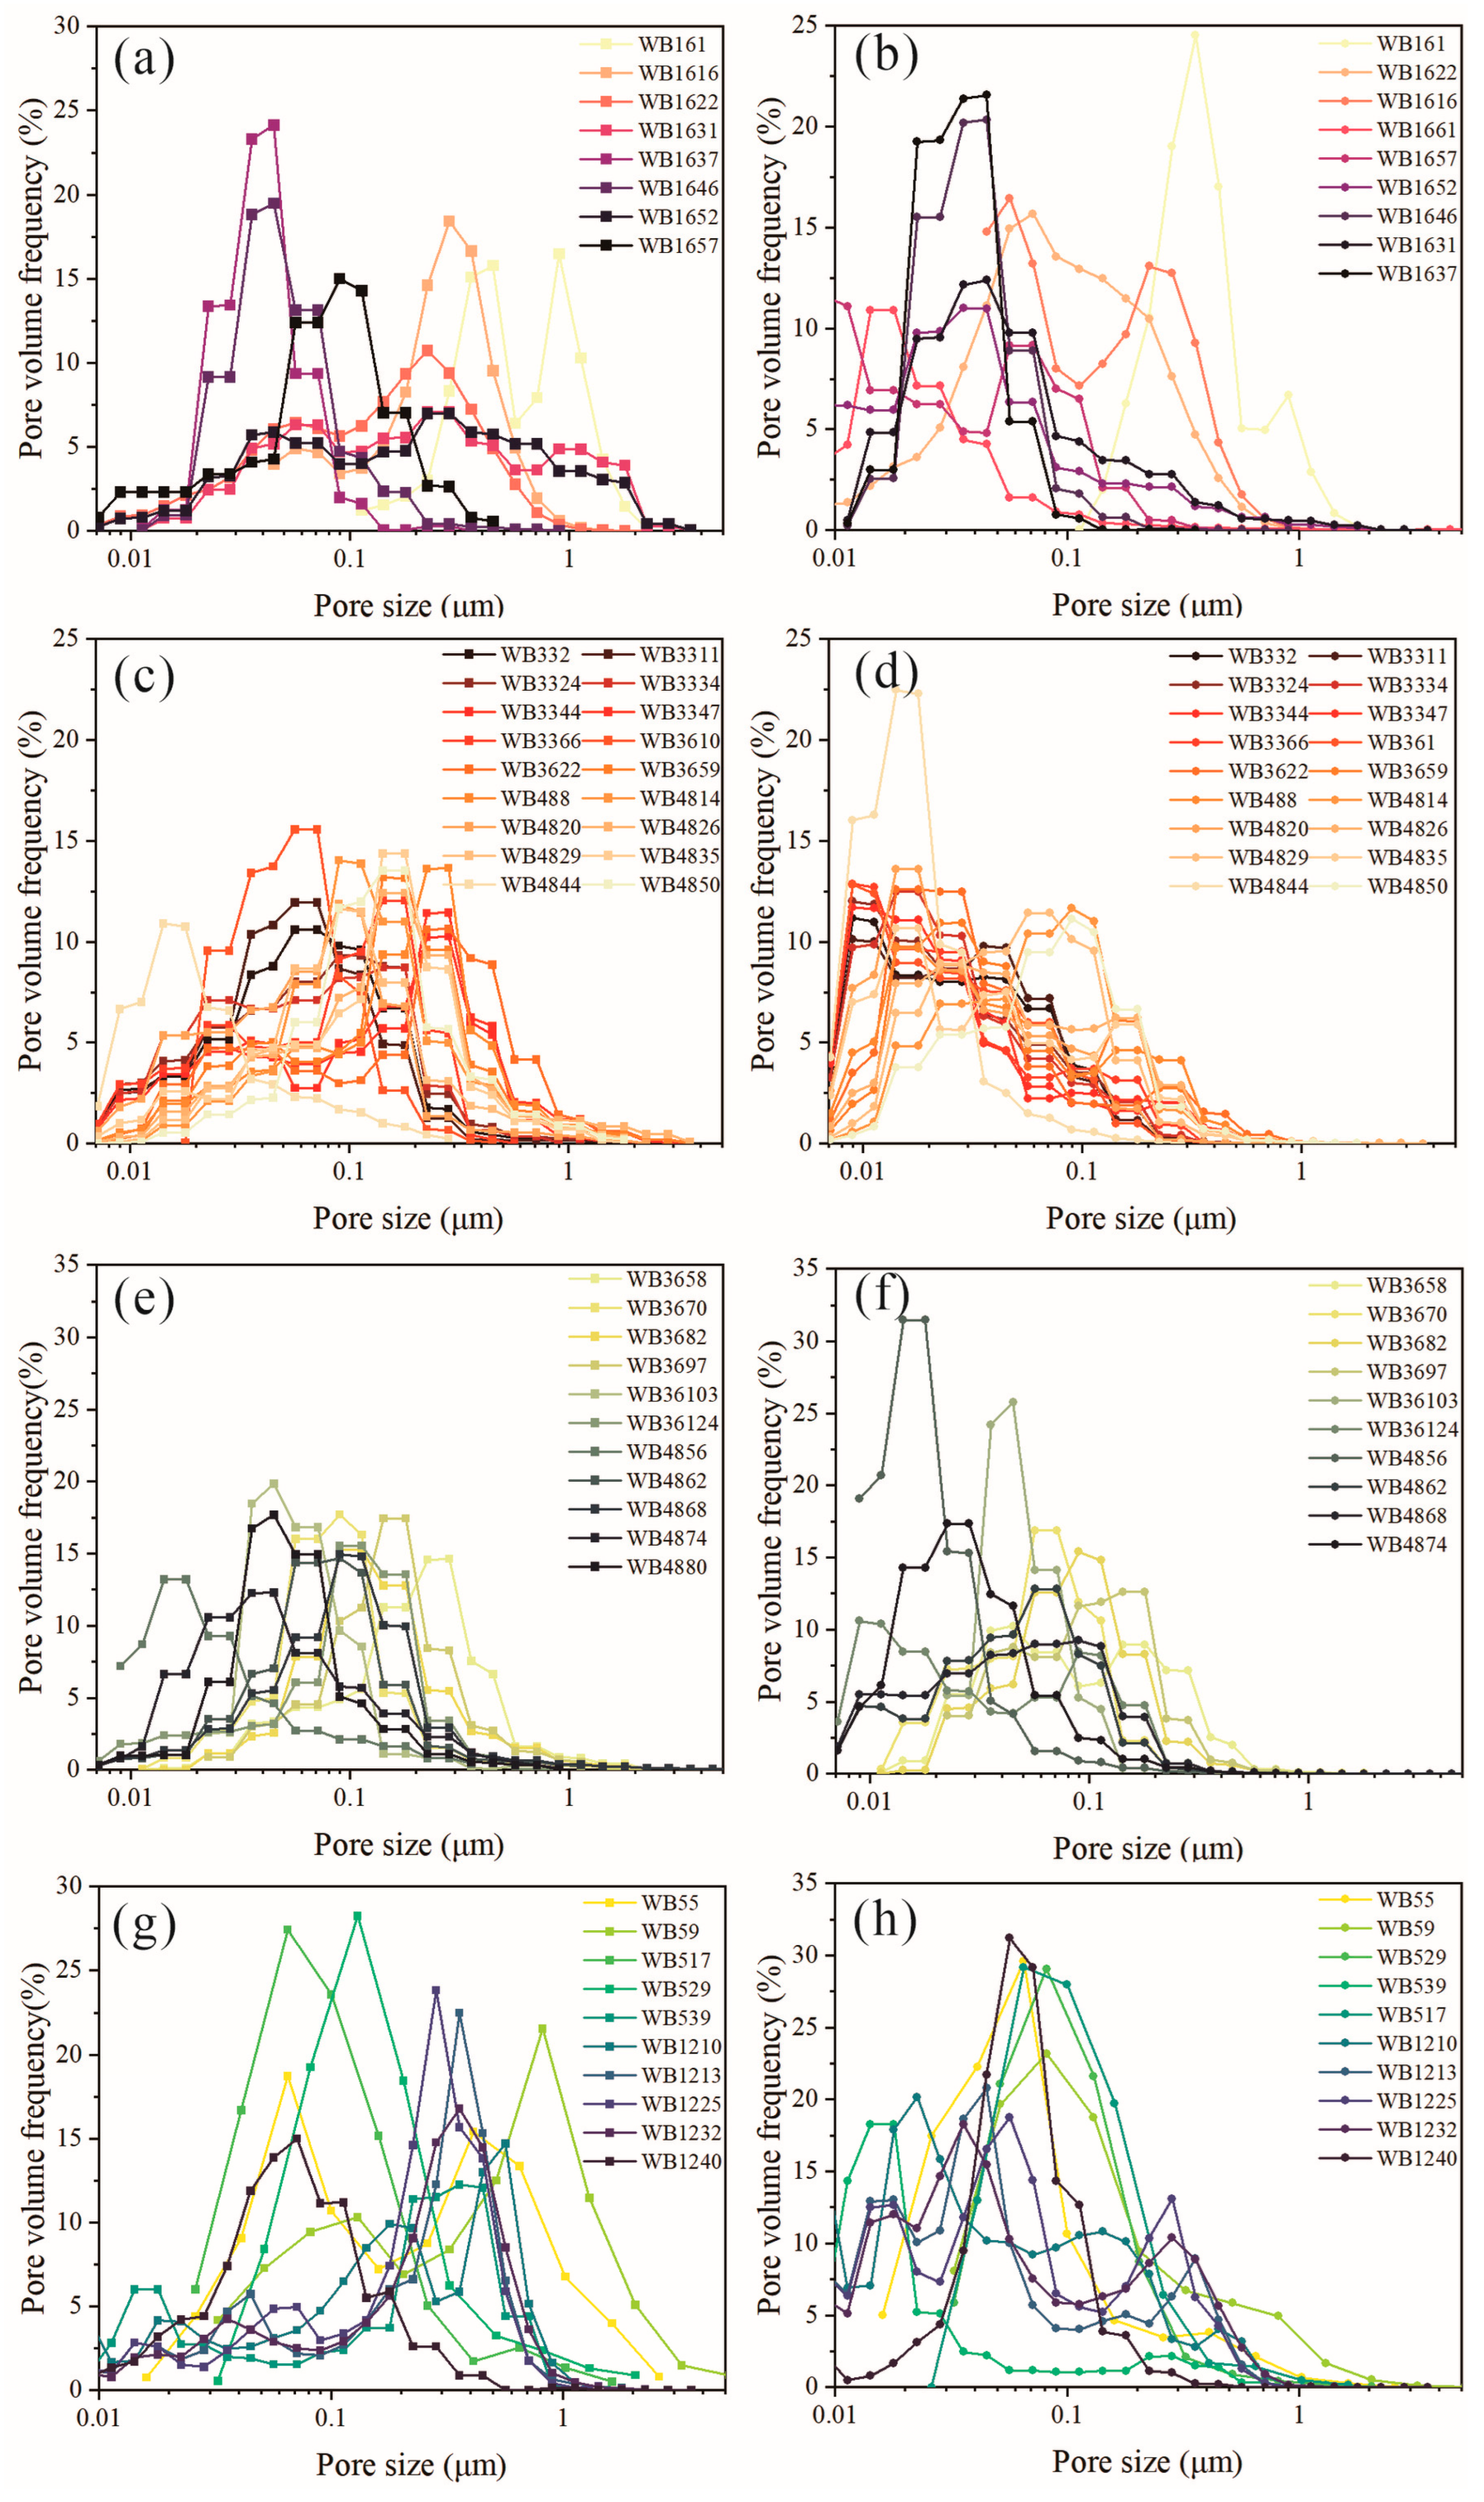
Based on the distribution patterns of pore-throat radii, they can be classified into two categories: unimodal and bimodal (Figure 7). In the Chang 3 member, the distributions of pore volume and pore surface area exhibit a composite unimodal-bimodal pattern, reflecting strong heterogeneity in the pore size distribution among different samples within the same layer (Figure 7a,b). The Chang 6 formation is primarily characterized by a unimodal distribution, with frequency peaks generally below 15%. Pore volume is mainly concentrated in the range of 0.03–0.3 μm, while pore surface area is primarily distributed between 0.01 and 0.04 μm (Figure 7c,d). The pore volume and surface area distributions of the Chang 7 formation are similar to those of Chang 6, mostly following a unimodal pattern. However, the frequency peak in Chang 7 can reach 30%, indicating a higher degree of concentration in the pore size distribution (Figure 7e,f). For the Chang 8 samples, except for a few bimodal samples (WB55), most are unimodal; the pore volume of most samples is primarily distributed in the 0.2–1 μm range and accounts for more than 20% of the total, demonstrating high pore volume distribution characteristics (Figure 7g,h). The distinct PSD patterns are intrinsically controlled by depositional and diagenetic genesis [39]. The bimodal PSD observed in Chang 3 is attributed to its distributary channel origin and subsequent dissolution, which generated a dual pore system of residual primary intergranular pores (forming the larger pore peak) and intragranular dissolution pores (forming the smaller pore peak) (Figure 7a,b). In contrast, the unimodal PSD in the gravity-flow deposits of Chang 6 and Chang 7 members results from their high initial matrix content and intense mechanical compaction, which almost obliterated primary macropores, leaving a highly uniform but tight matrix of micro-to-nano pores (Figure 7c–f). Although both the Chang 8 and Chang 3 members consist of subaqueous distributary channel deposits, the Chang 8 member underwent intense mechanical compaction, resulting in the significant reduction and homogenization of primary pores. Consequently, its pore size distribution is predominantly characterized by a broad unimodal pattern. Bimodal characteristics, driven by the development of secondary macropores, occur only locally under the overprint of strong secondary dissolution (Figure 7g,h).

4.3. Pore Structure Parameters of Sandstone in Different Members

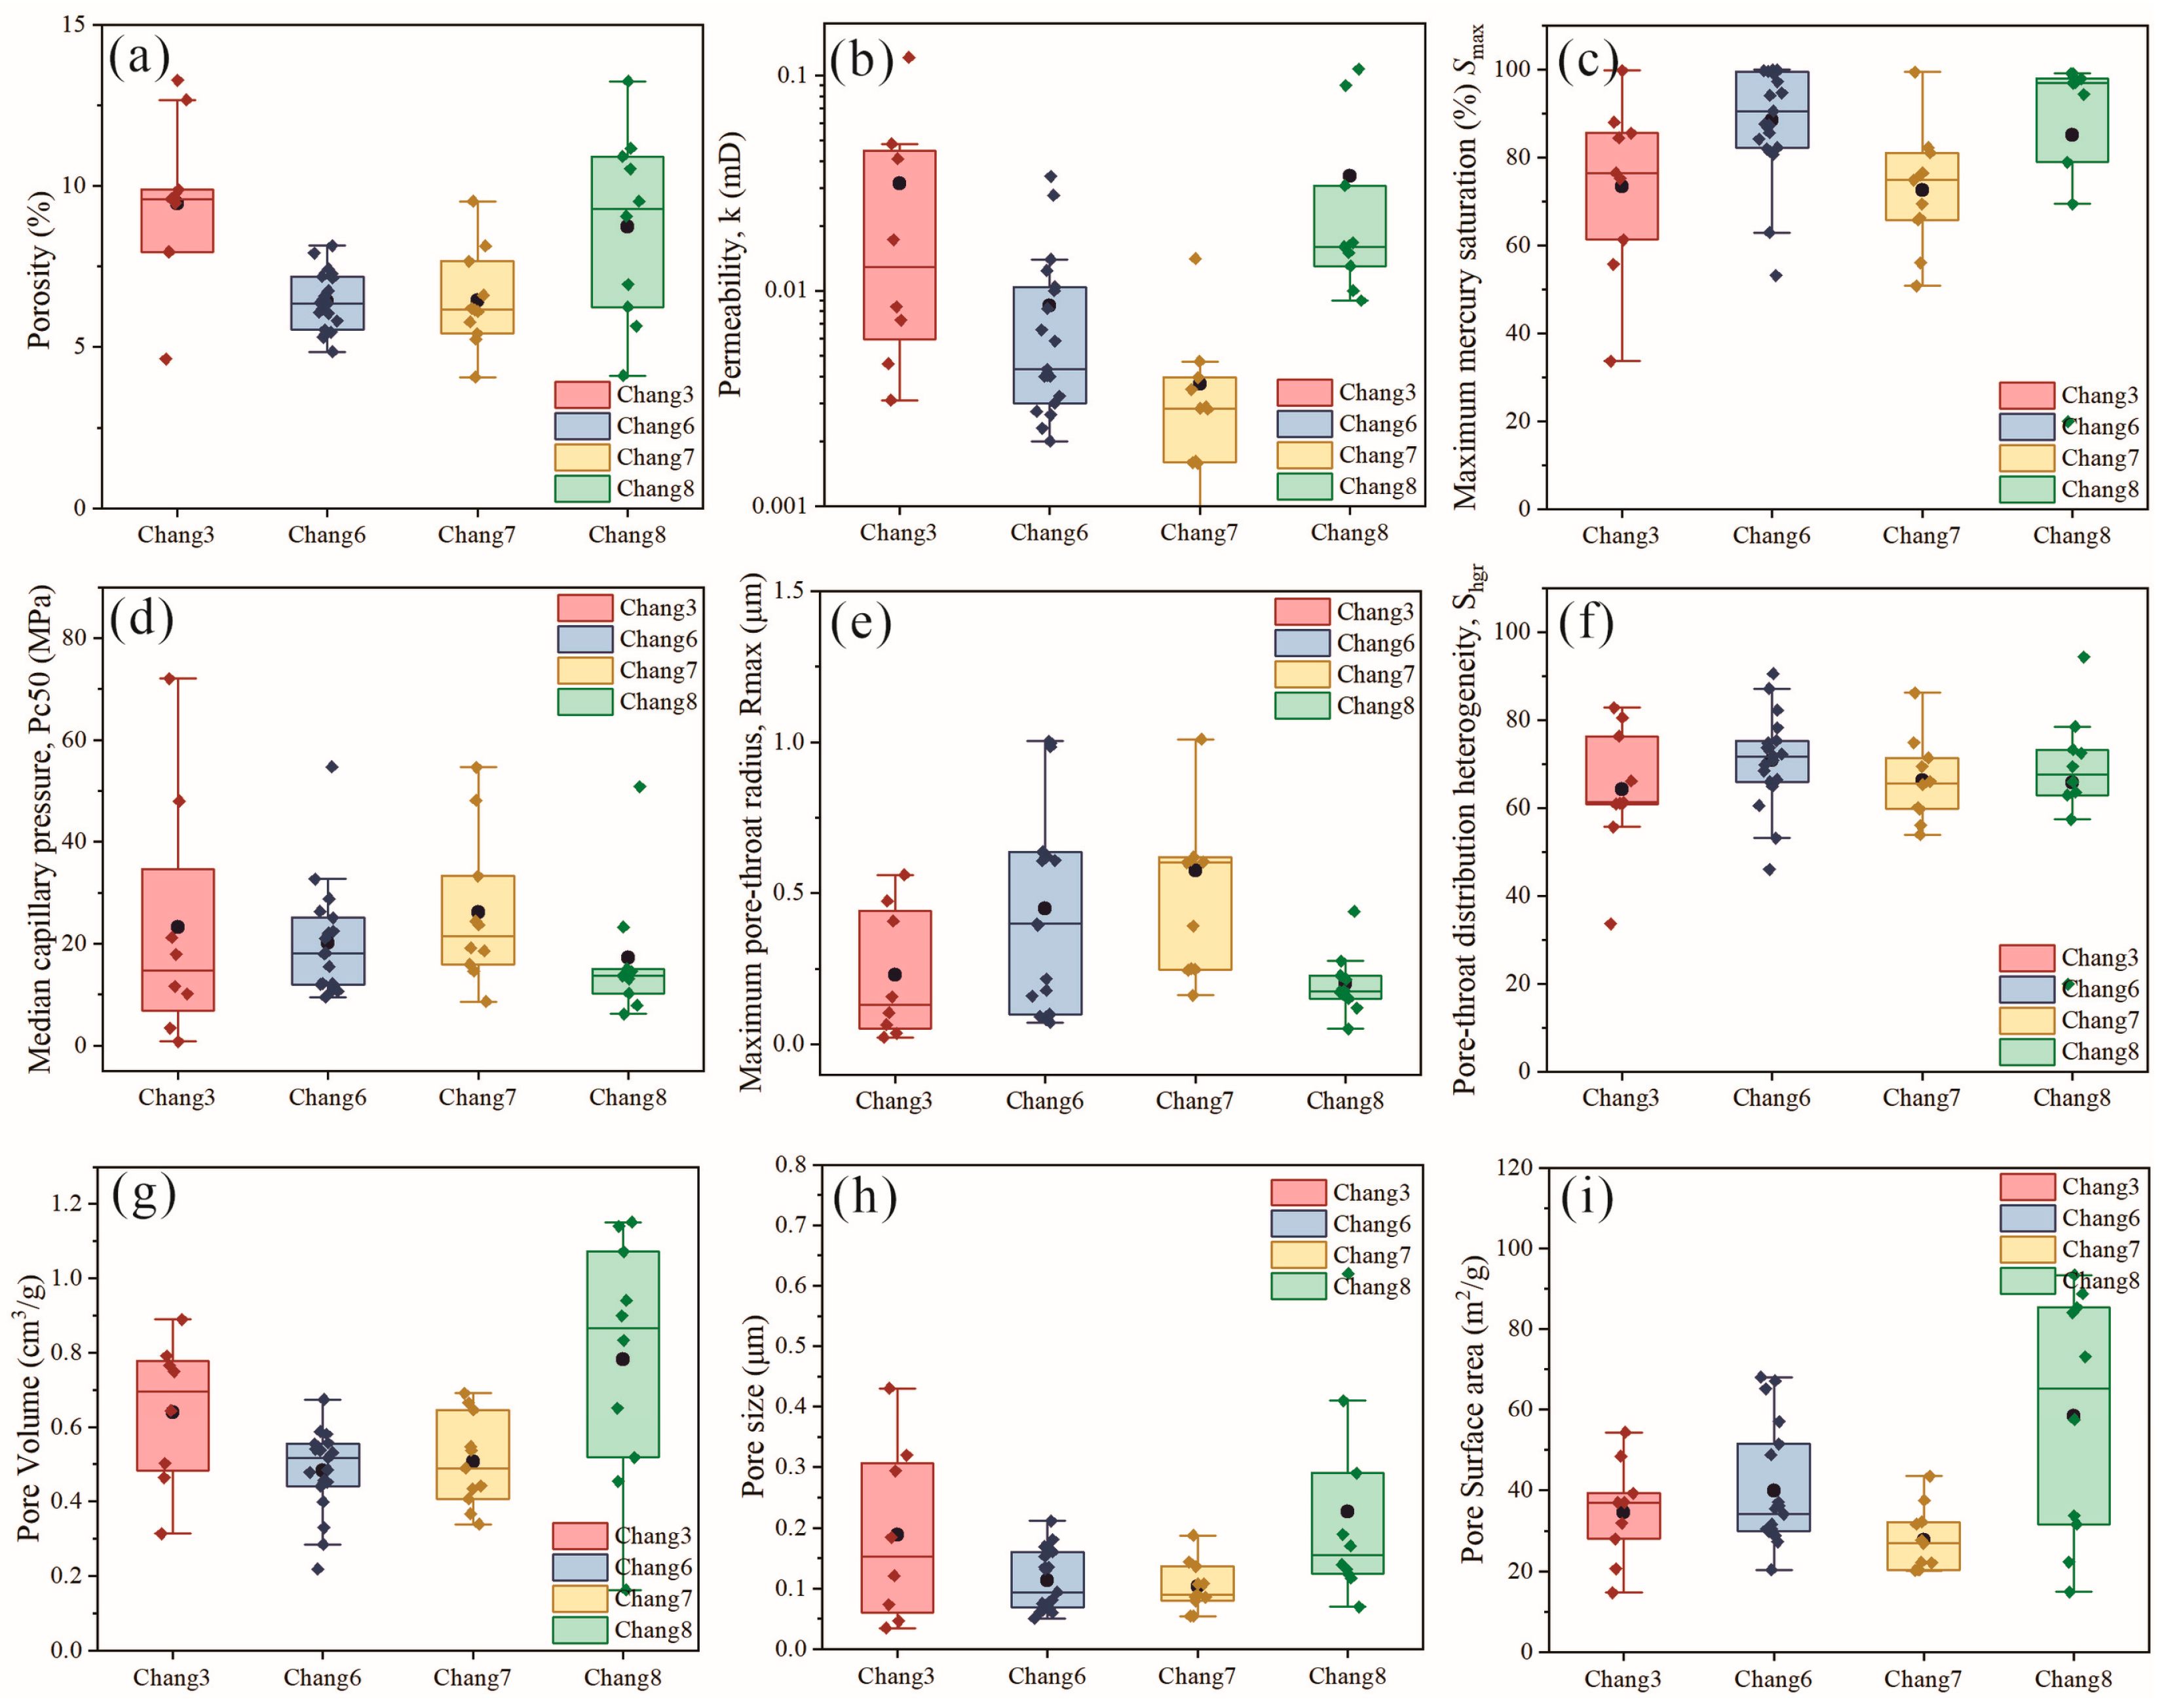
In this study, statistics from high-pressure mercury injection and porosity-permeability experiments show that the porosity of Chang 6 and Chang 7 is slightly lower than that of Chang 3 and Chang 8. Although the porosities of Chang 6 and Chang 7 are similar, the average permeability of Chang 7 is the lowest, reaching 0.0026 mD, which indicates that permeability is primarily controlled by pore-throat scale and connectivity rather than porosity itself (Figure 8a,b). The maximum mercury saturation (Smax) shows that the connected pore volumes of Chang 6 and Chang 8 are significantly higher, while that of Chang 7 is the worst, suggesting that a large number of pores are isolated by fine throats (Figure 8c). The median capillary pressure (Pc50) indicates that the differences among all members are not obvious, with Chang 7 being the highest, indicating poor effective connectivity of the pores (Figure 8d).
Chang 6 and Chang 7 exhibit the largest Rmax and the lowest Pc10, indicating the presence of coarse pore throats; however, their permeability is the lowest, suggesting that these large pore throats have not formed effective connected channels. Meanwhile, the dominant pore throats of Chang 7 are the finest, resulting in its extremely low permeability. Residual mercury saturation shows no significant differences across the various members, concentrating within the range of 60–80%, which indicates a strong ink-bottle effect in the tight sandstones of the Yanchang Formation (Figure 8e,f). Comparisons of various pore volumes and surface areas reveal that Chang 8 simultaneously possesses the maximum pore volume and the maximum pore surface area, indicating a high abundance of pores and a fully developed pore-throat network (Figure 8g–i).

4.4. Multifractal Dimensions from MIP Measurements

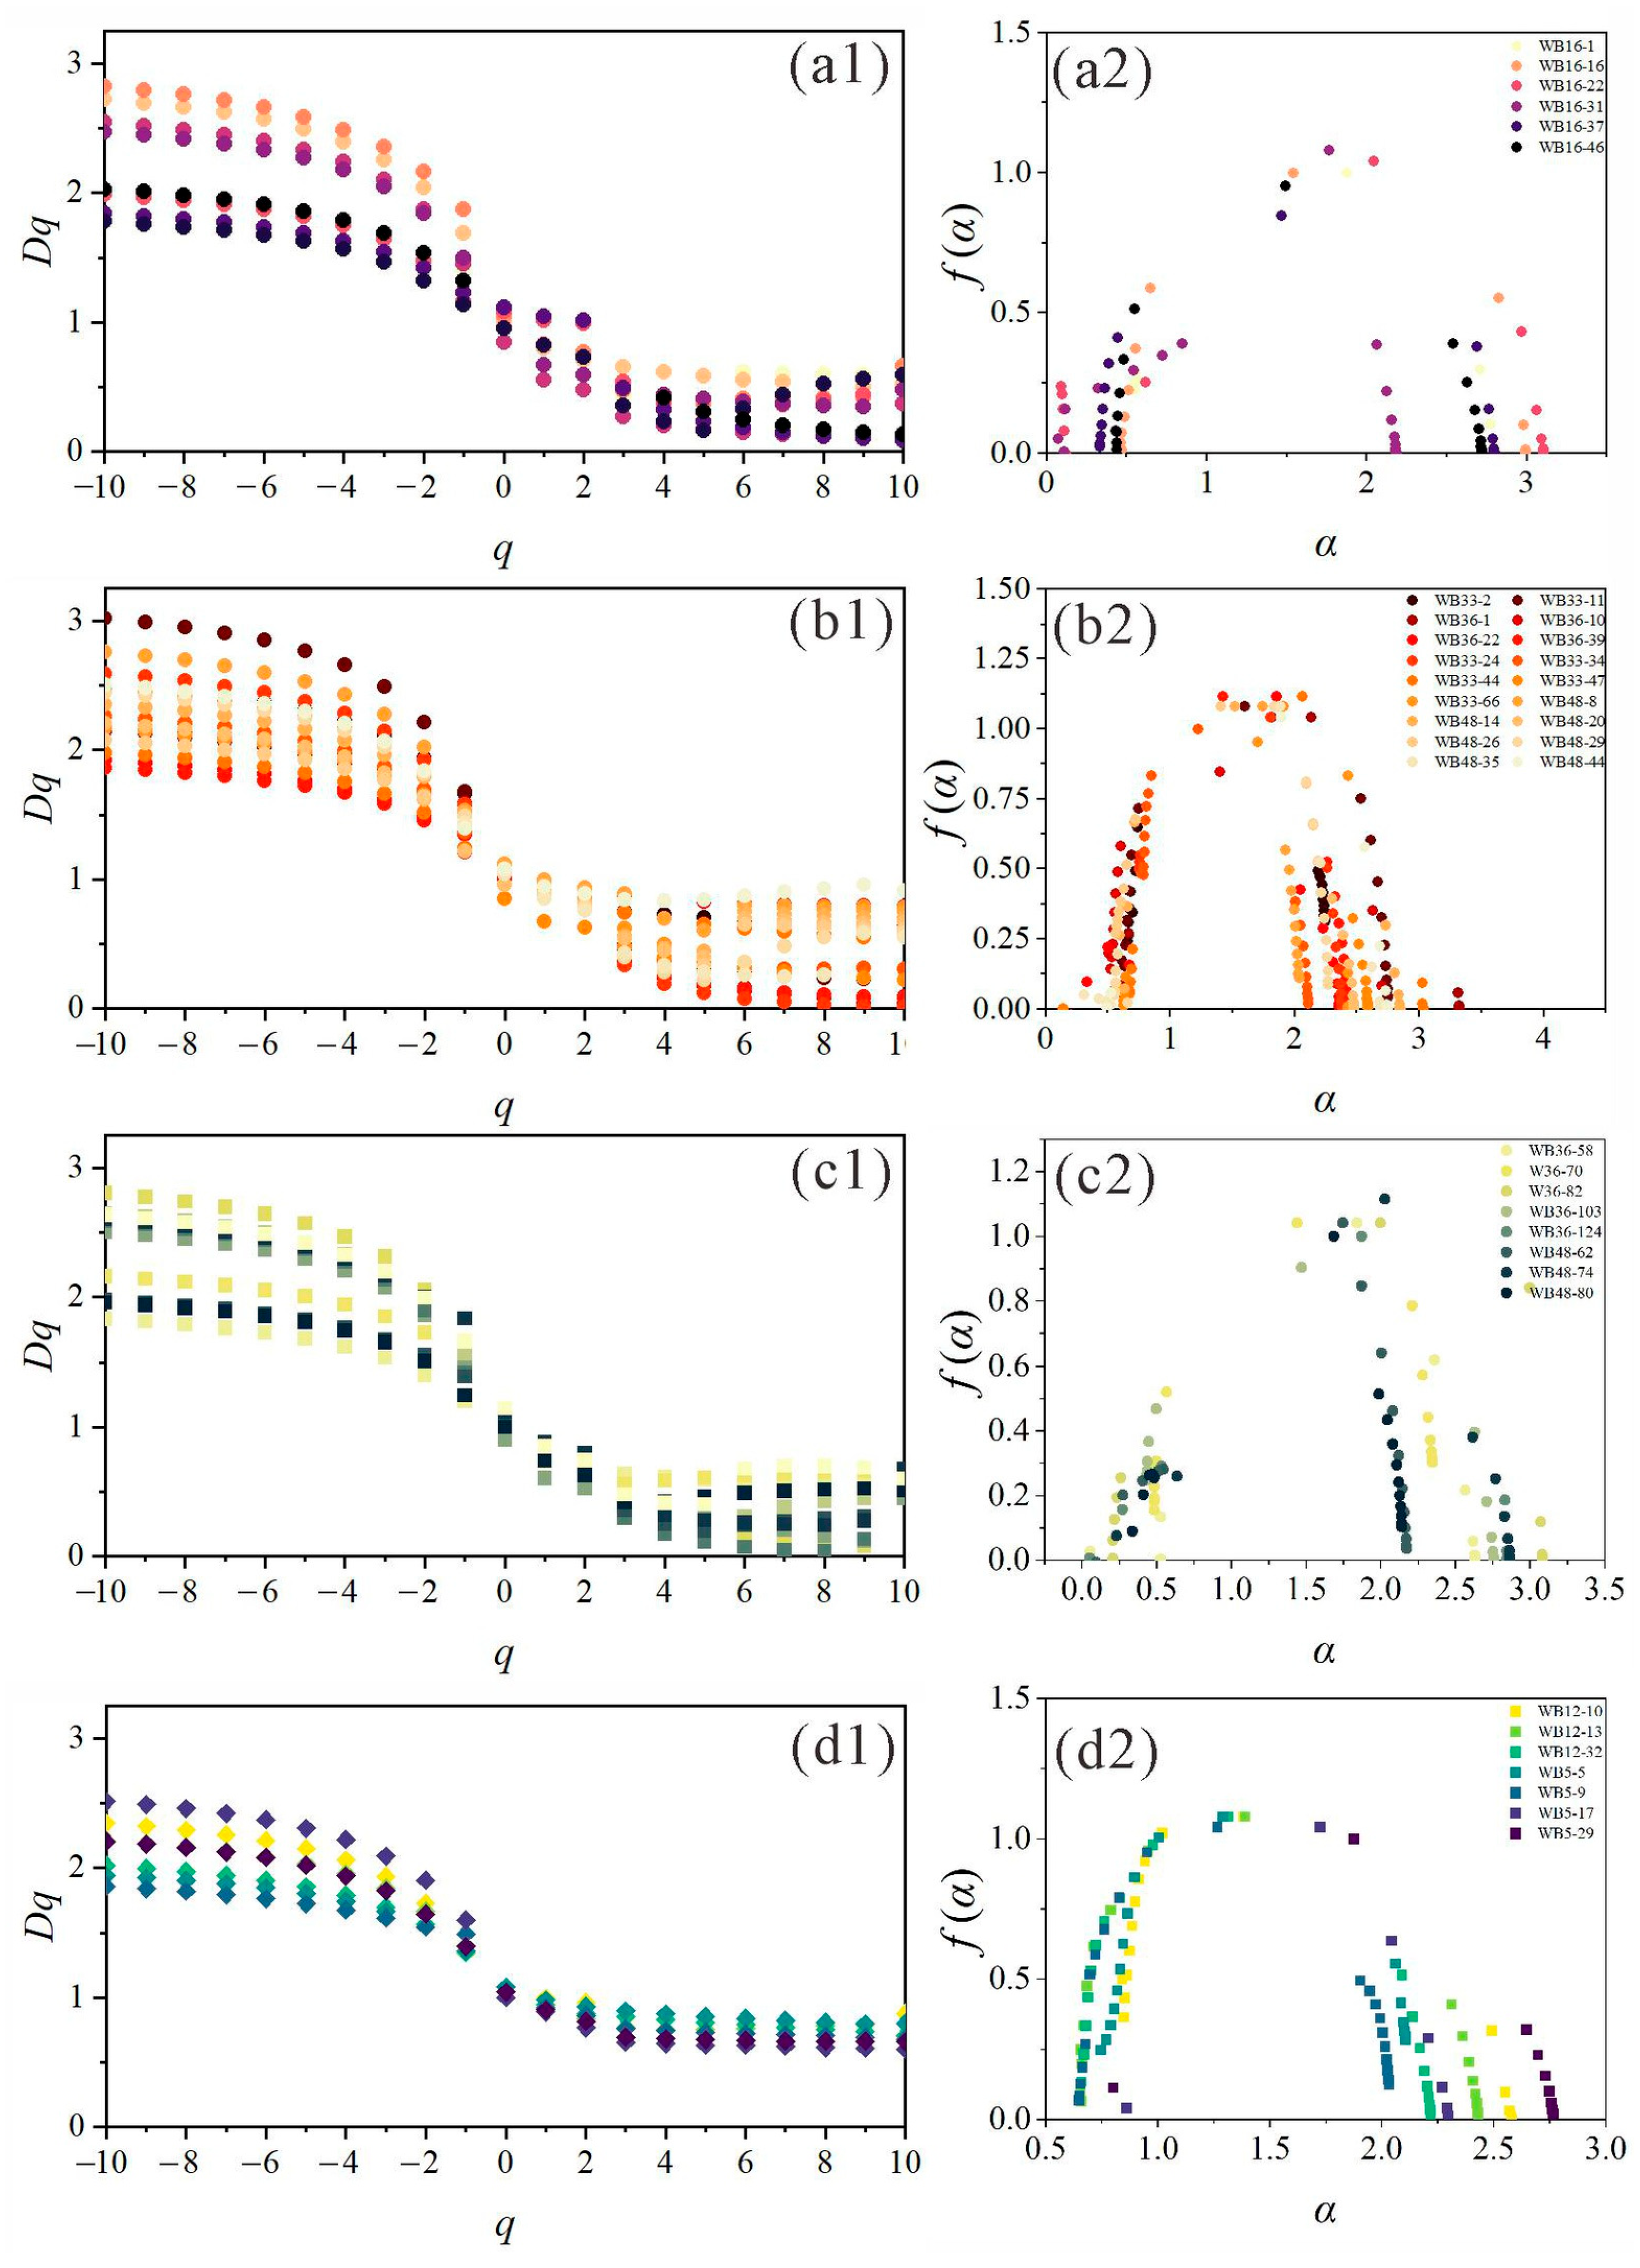
Figure 9 illustrates the distributions of the multifractal spectrum (f(α)−α) and the generalized dimension (Dq) as a function of the variable q. The multifractal spectra of tight sandstone reservoirs in different members vary, indicating that the pore size distributions (PSD) of different samples possess distinct multifractal characteristics. As shown in Figure 9a1–c1, the variation in Dq is closely related to the variable q, exhibiting a monotonically decreasing trend as q increases. When q < 0 (corresponding to low-probability regions), the decrease in Dq with increasing q is more pronounced; however, in high-probability regions (q > 0), only a slight decline in Dq is observed. Although the shapes of the Dq spectra for different samples are generally similar, exhibiting an inverse S-shape, the Dq curves of samples from different members intersect at the point (0, 1) and satisfy the condition D0 > D1 > D2. This indicates that the capacity dimension (D0) of all types of samples is 1, meaning that the pore space completely covers the entire scale range. However, the condition D0 > D1 > D2 indicates that although pores exist across all scales, the distribution of pore volume is highly uneven (measured by D1) and the spatial distribution is highly clustered or dense in certain ranges (measured by D2) [43]. This multi-level clustering behavior cannot be captured by a single fractal dimension. At a given q value, the Dq values of different samples vary significantly, demonstrating that different samples possess unique multifractal characteristics. A wider Dq spectrum indicates a higher degree of heterogeneity in the pore size distribution within the pore size range. The multifractal spectrum function f(α) displays a distinct asymmetric convex curve as a function of α, indicating that the pore-throat structures of the sandstone reservoirs have significant multifractal characteristics. As illustrated in Figure 9a2–c2, f(α) increases sharply with increasing α in the left branch (corresponding to high-probability regions), whereas the opposite trend is observed in the right branch (corresponding to low-probability regions).
A comparative analysis of the multifractal parameters reveals that the pore structures across the Chang 3 to Chang 8 members universally exhibit significant multifractal characteristics. While their overall pore-scale distribution ranges are broadly comparable, these members demonstrate pronounced stratigraphic variations in their specific degrees of internal heterogeneity and spatial pore-network connectivity (Figure 9). The total singularity spectrum width Δα of the Chang 3 member is 1.943 ± 0.56, which is slightly higher than those of the Chang 6 to Chang 8 members (all being 1.926 ± 0.35). Meanwhile, its Rd value reaches 1.782 ± 0.99, significantly higher than other members, indicating that Chang 3 possesses a wider pore scale distribution, stronger heterogeneity, and significant intra-layer differences. Furthermore, the heterogeneity index D0D1 of Chang 3 is 0.181 ± 0.08, which is higher than the 0.163 ± 0.04 of Chang 6 to Chang 8, while f0f1 also shows a larger value (0.722), further indicating poor uniformity in pore distribution and more pronounced information entropy loss. In contrast, the D1 and D2 values of the Chang 6, Chang 7, and Chang 8 members are overall higher, whereas the D1 and D2 of Chang 3 are only 0.822 and 0.753, respectively, suggesting that the pore connectivity and clustering characteristics of the latter are relatively weak. From the perspective of spatial correlation, the Hurst indices for Chang 6 to Chang 8 are all approximately 0.91, higher than the 0.876 of Chang 3, indicating that the pore structures of these members exhibit stronger spatial continuity and scale correlation. Overall, Chang 3 displays stronger pore heterogeneity and structural complexity, whereas the pore structures of the Chang 6 to Chang 8 members are relatively stable. Among them, Chang 8 exhibits more favorable reservoir quality in terms of multifractality when combined with its higher connectivity characteristics.

5. Discussion

5.1. Intrinsic Relationship Between Multifractal Parameters and the Petrophysical Properties

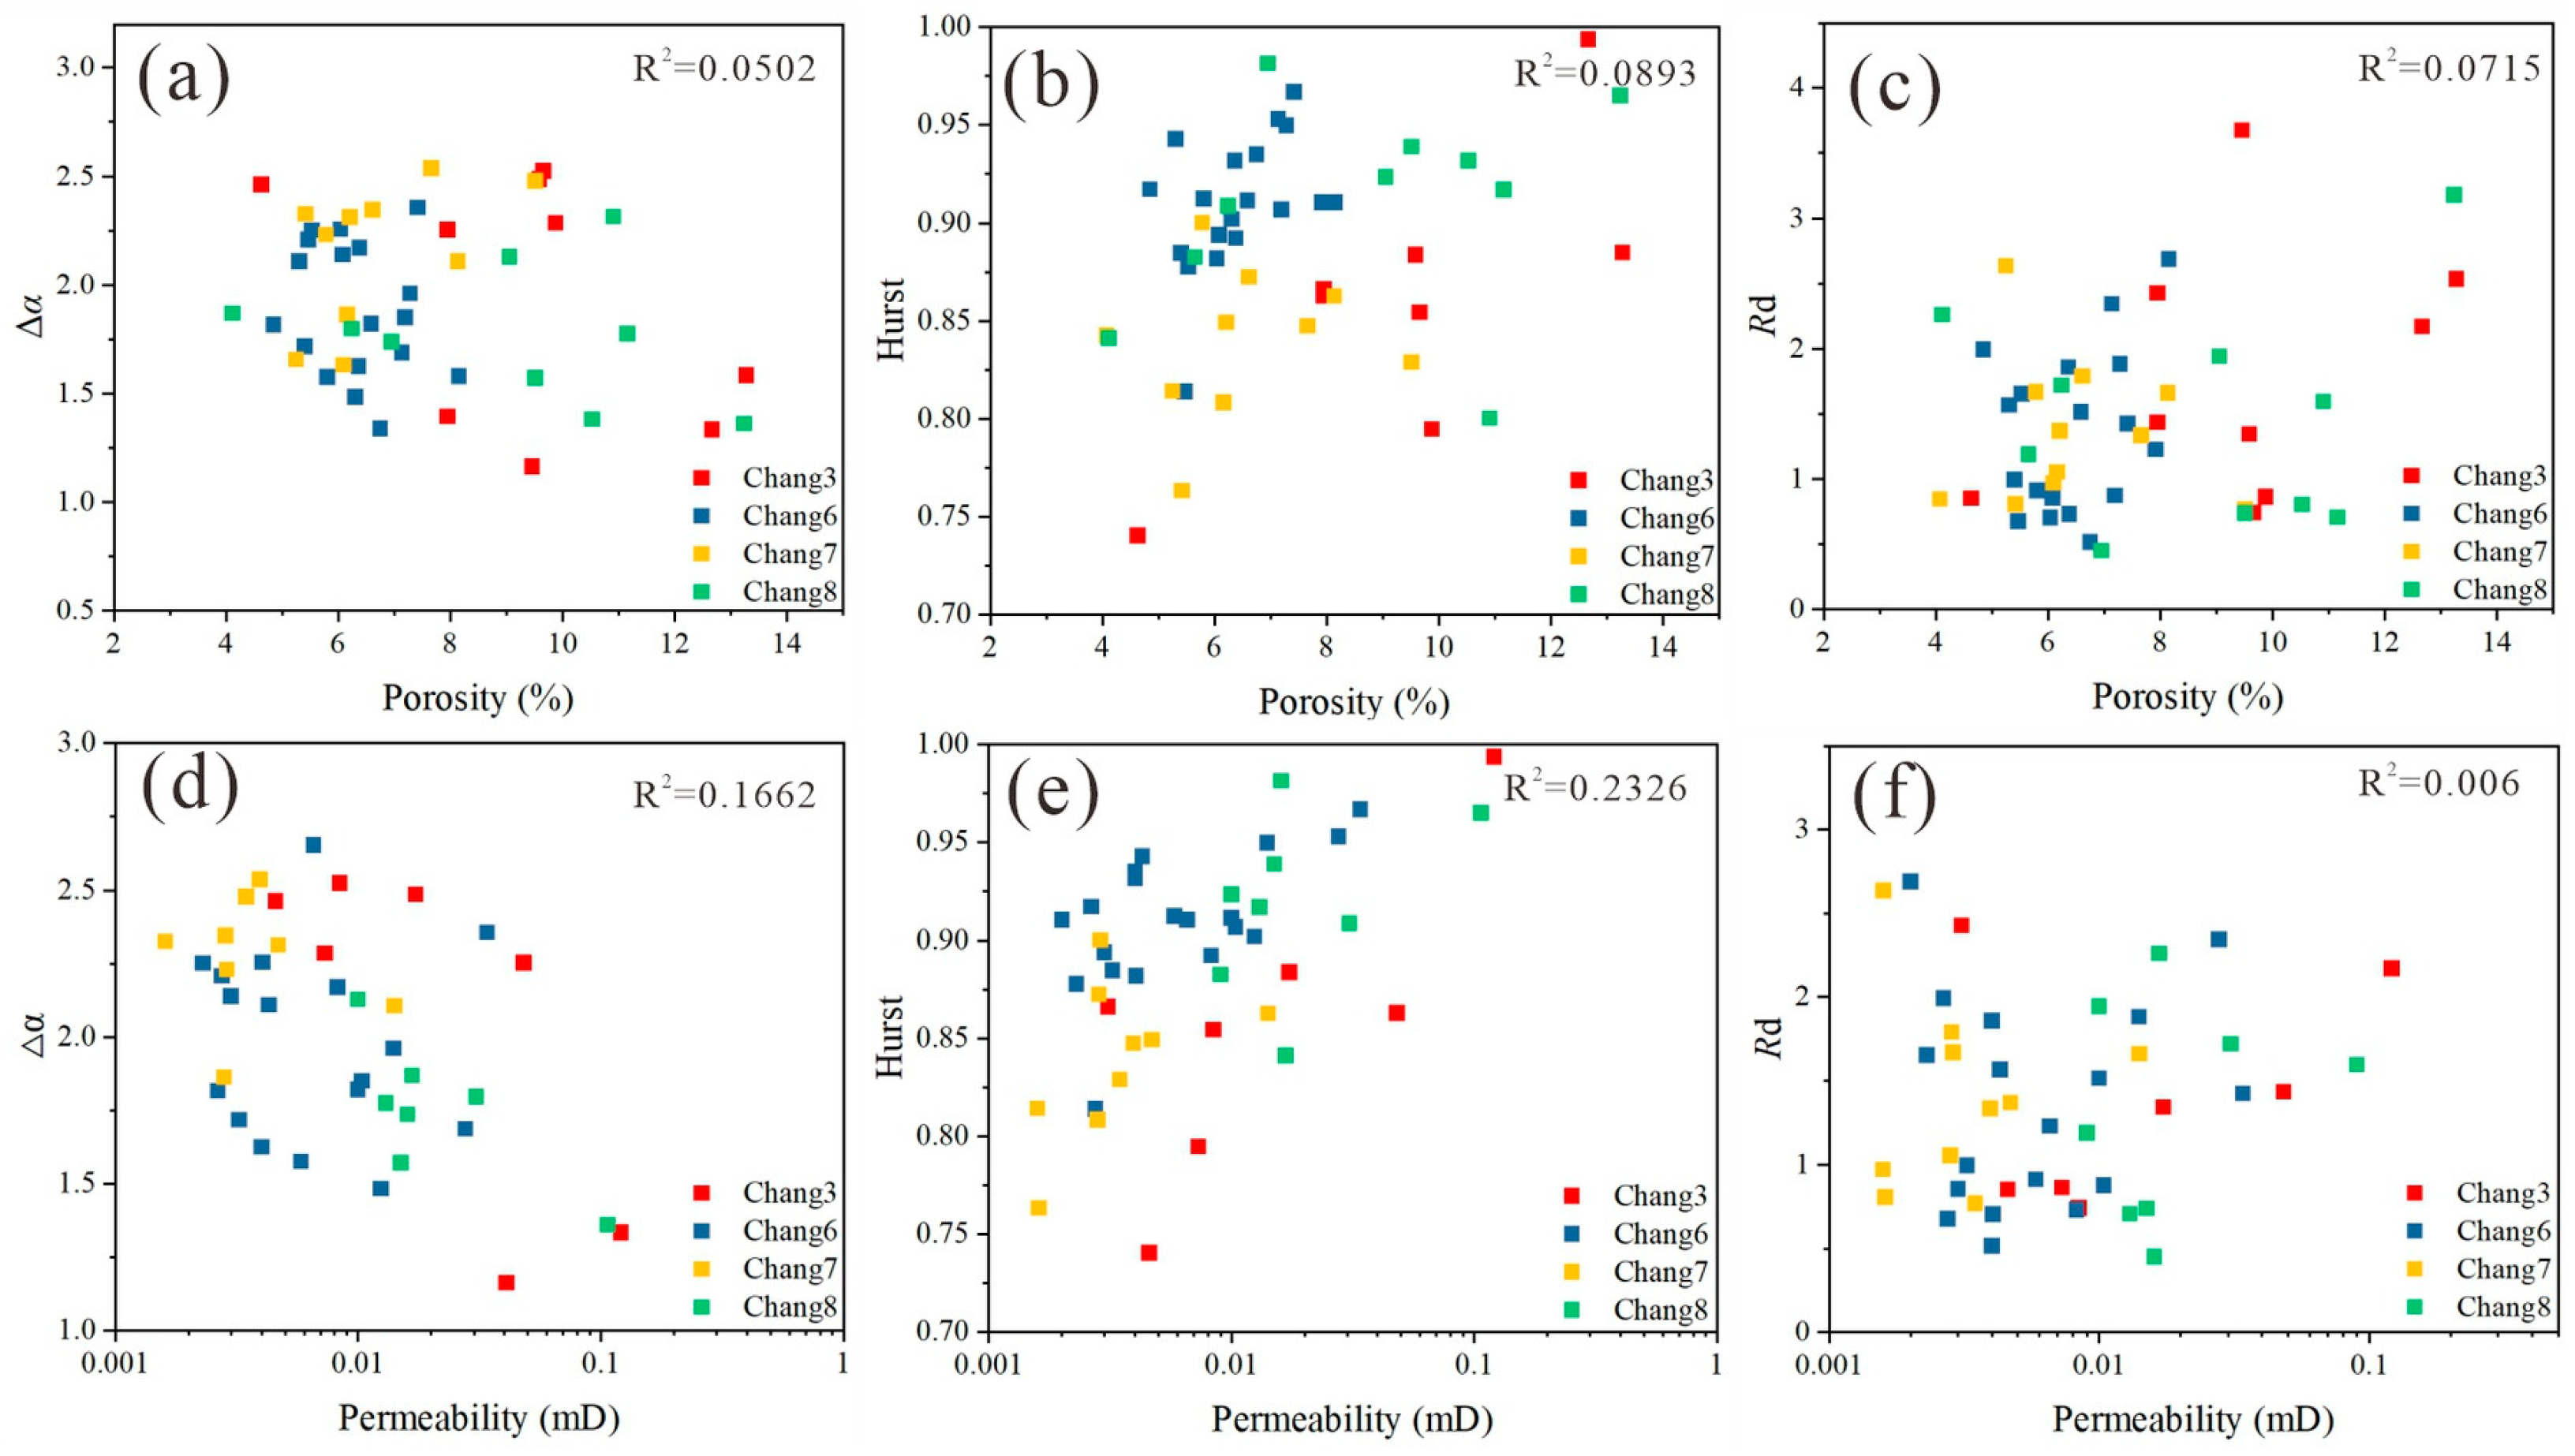
The total multifractal spectrum width Δα of samples from different shows obvious differences, reflecting the horizon-dependent characteristics of pore structure heterogeneity [39,40]. Overall, no substantial correlation is observed between Δα and porosity (R2 = 0.0502). In Chang 3, samples with similar porosity (approximately 8% to 10%) exhibit Δα values increasing from 1.16 to 2.52, while the corresponding permeability decreases from 0.121 mD to 0.004 mD, indicating that pore volume cannot effectively characterize the complexity of pore-throat structures. In contrast, a relatively weak negative correlation exists between Δα and permeability (R2 = 0.1662): with smaller Δα often possess relatively higher permeability, whereas with larger Δα generally exhibit low to ultra-low permeability characteristics. Further analysis at the member scale shows that the average Δα of Chang 6 and Chang 7 is higher than that of Chang 3, with overall lower permeability, indicating a wider pore-throat scale distribution, stronger heterogeneity, and a limited proportion of effectively connected pore throats. Relatively, Chang 8 can still achieve higher permeability under a moderate Δα background, indicating that under certain heterogeneous conditions, the dominance of effective pore throats can still significantly improve seepage capacity (Figure 10a,d).
The pore structures of tight sandstones in the study area generally exhibit a weak positive correlation, but their spatial continuity and connectivity show distinct stratigraphic differences. Overall, no significant correlation is observed between the Hurst exponent and porosity (R2 = 0.089). For instance, in Chang 3 and Chang 8, while porosity increases from approximately 7% to 11%, the H value only varies slightly within the range of 0.85–0.92, indicating that increasing pore volume does not significantly improve the spatial continuity of the pore structure. In contrast, a weak positive correlation is observed between the Hurst index and permeability (R2 = 0.2326). Consistent with previous studies [25,44], high-permeability samples typically correspond to higher Hurst values, whereas low-permeability samples mostly have lower Hurst values, indicating poor spatial connectivity of the pore system (Figure 10b,e). Regarding different members, Chang 7 generally has lower Hurst values and the lowest permeability, reflecting poor continuity of its pore-throat network and restricted effective flow paths; conversely, Chang 8 exhibits higher Hurst values and significantly higher permeability against a background of medium-to-high porosity, suggesting that the spatial correlation and connectivity of the pore structure exert a dominant control on the seepage capacity of tight sandstones (Figure 10b,e).
Unlike the Hurst exponent, Rd exhibits no significant correlation with either porosity (R2 = 0.0715) or permeability (R2 = 0.006). In the Chang 3 of Figure 10c, samples with similar porosity (approximately 8–10%) exhibit Rd values increasing from 0.74 to 3.67, indicating that an increase in pore quantity does not necessarily correspond to an improvement in structural uniformity. Also as shown in Figure 10f, samples with both high and low permeability display a wide and random distribution of Rd values. This statistical evidence indicates that the macroscopic flow capacity of the Yanchang Formation tight sandstones is independent of the overall uniformity or broadness of the pore size distribution. Even if the pore-throat sizes are highly discrete and heterogeneous (high Rd), the reservoir can still maintain favorable permeability provided that the dominant effective macropores are well-connected [45]. Conversely, a highly uniform matrix of isolated micro-pores (low Rd) fails to provide effective flow channels. Therefore, it is the spatial connectivity of the pore network (characterized by the Hurst exponent), rather than the concentration degree of pore distribution (Rd), that dominantly controls the petrophysical properties in these ultra-tight reservoirs [46].

5.2. Geological Factors Influencing Pore Structure Heterogeneity

5.2.1. Effect of the Pore Structure

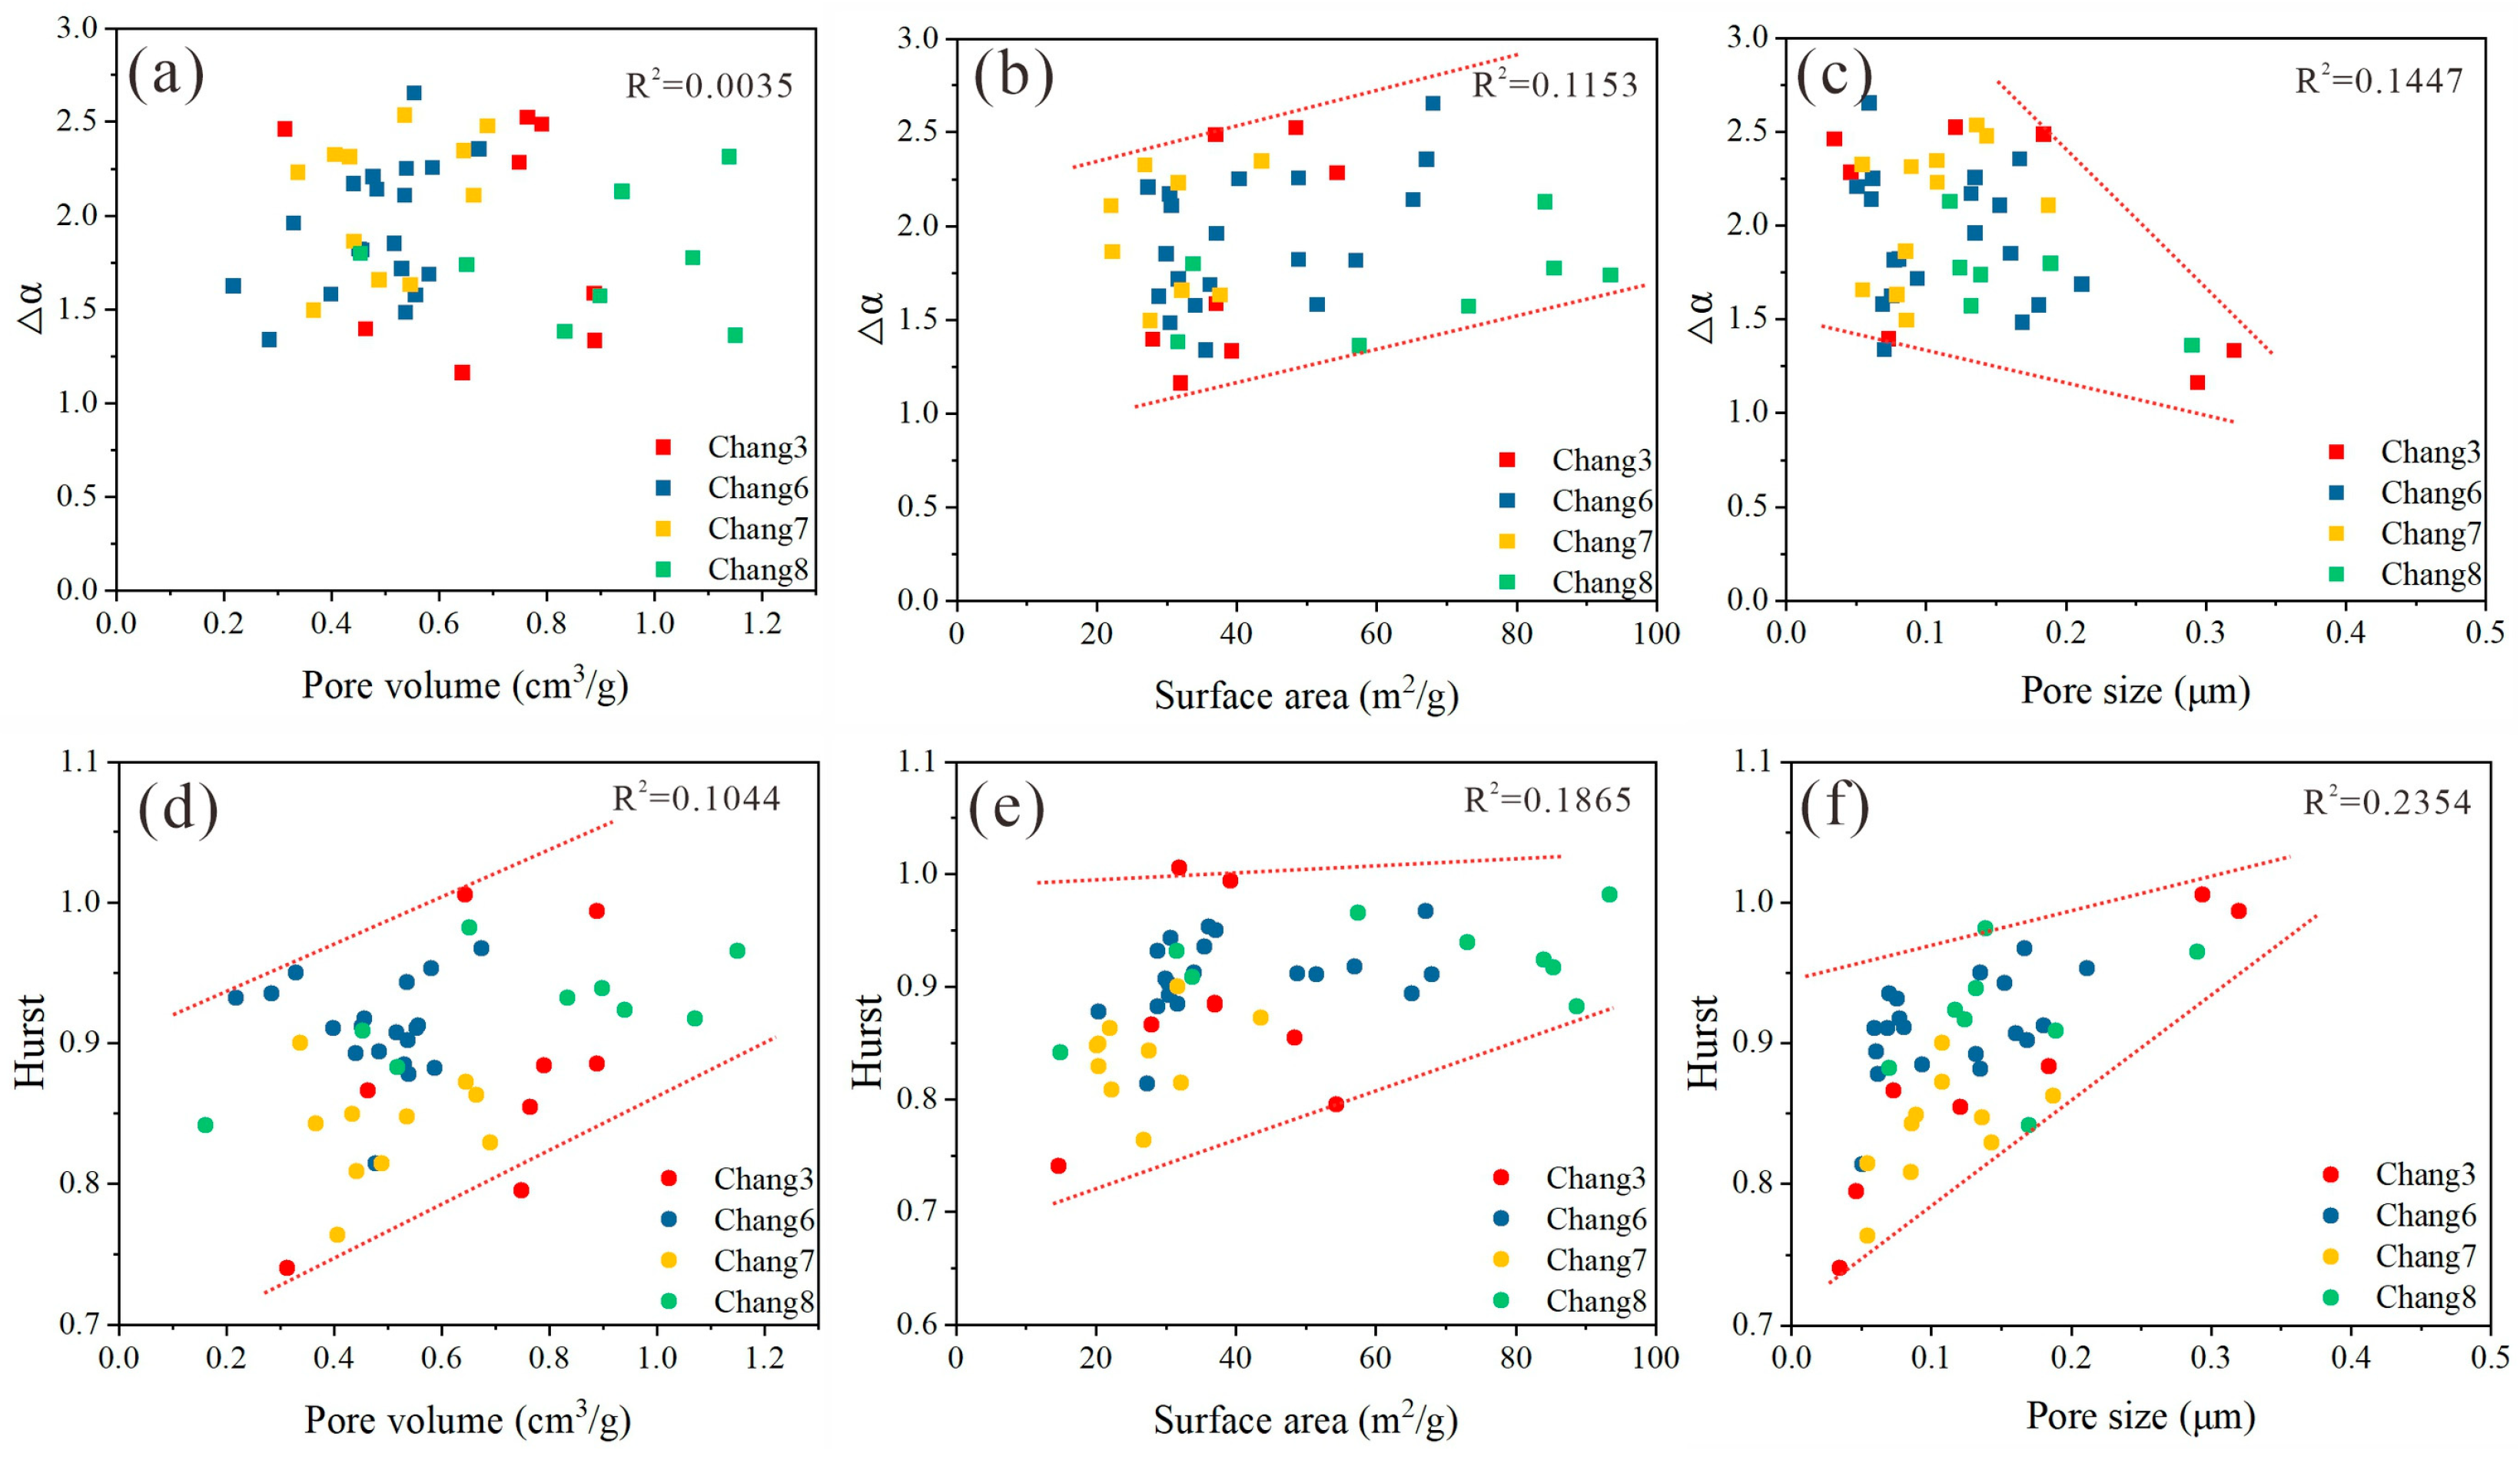
There is no significant correlation observed between Δα and total pore volume among samples from different (R2 = 0.0035) (Figure 11a). Within the same member, pore volume varies widely while the magnitude of Δα differs significantly, indicating that pore structure heterogeneity is primarily controlled by the pore-throat scale distribution rather than the pore volume itself. A very weak linear correlation exists between Δα and total pore surface area (R2 = 0.1153) (Figure 11b). In Chang 3, the total pore surface area varies over a wide range, and Δα increases accordingly, suggesting that an increase in pore surface area leads to enhanced pore structure heterogeneity. It is inferred that due to a relatively shallow burial depth and weak compaction, the Chang 3 member has preserved some primary intergranular pores. Concurrently, the superimposition of later-stage differential dissolution led to the development of secondary dissolution pores. This mixed state of primary and secondary pores directly resulted in a sharp increase in Δα. Consequently, the Chang 3 member exhibits a unique phenomenon of strong heterogeneity coupled with excellent reservoir quality. Similar features are also present in the Chang 6 and Chang 7 members, where some samples still exhibit high Δα values under conditions of large pore surface areas. However, severely affected by compaction, the Chang 6 and Chang 7 members lack the favorable pore preservation conditions found in the Chang 3 member. Therefore, unlike the Chang 3 member, the strong overall heterogeneity of the Chang 6 and Chang 7 members leads to poor reservoir quality. In contrast, the Chang 8 sub-layer has a high overall pore surface area, but the discreteness of Δα is significant, reflecting its complex pore-throat scale distribution and substantial structural differences.
A weak negative correlation exists between the pore structure heterogeneity of sandstones from different members and their average pore diameters (R2 = 0.1447) (Figure 11c). As the average pore diameter increases, Δα exhibits a decreasing trend, indicating that smaller pore sizes are associated with higher complexity and stronger heterogeneity in the pore structure. Vertically, the average pore diameters of Chang 3 and Chang 8 are generally larger, with Δα values mostly distributed between 1.16 and 2.52, reflecting relatively weak heterogeneity. In contrast, the average pore diameters of Chang 6 and Chang 7 are smaller, and Δα reveals extremely strong micro-scale heterogeneity. Integrating relevant previous research [47] with our analysis, we conclude that this difference is primarily controlled by the depositional processes and compaction levels of the different formations: Chang 6 and Chang 7 were subjected to strong compaction, leading to a massive transformation of macropores into micropores, which resulted in a more dispersed and uneven distribution of the pore network.
As the total pore volume increases, the Hurst exponent, which reflects the connectivity of the pore structure, exhibits a weak and slow upward trend (R2 = 0.1044) (Figure 11d). In the vertical stratigraphic comparison, Chang 3 and Chang 8 possess high total pore volumes (mean values mostly between 0.65 and 0.90), and their Hurst indices are relatively stable and tend toward high values, showing strong structural self-similarity and high internal pore connectivity, which is consistent with the porosity and permeability results. Conversely, the pore development in Chang 6 and Chang 7 is lower, and the Hurst index distribution is more discrete, indicating poorer micro-pore connectivity.
The Hurst index of sandstones from different members shows a weak positive correlation with the total pore surface area (SA) (R2 = 0.1865) (Figure 11e). As the total pore surface area increases, the Hurst index exhibits a slow upward trend. The total pore surface areas of Chang 6 and Chang 8 are generally higher, and their Hurst indices are mostly concentrated in the high-value range, indicating strong pore connectivity. In contrast, the development of pore surface area in Chang 3 and Chang 7 fluctuates significantly, and the distribution of the Hurst index is relatively discrete. These stratigraphic differences reflect that the Chang 6 and Chang 8 reservoirs possess more complex microscopic pore network spaces, and the evolution of their pore structures is controlled by more intense sedimentary and diagenetic processes, which is consistent with the findings of previous studies [48,49].
As the average pore diameter increases, the Hurst exponent, which reflects the long-range correlation of the pore structure, exhibits a weak upward trend (R2 = 0.2354) (Figure 11f). In the member comparison, Chang 3 and Chang 8 exhibit extremely strong structural self-similarity in their Hurst indices due to the development of larger pore diameters, whereas Chang 6 and Chang 7 show a discrete pore size distribution and lower Hurst indices. The development of larger pores enhances pore connectivity.

5.2.2. Effect of the Rock Components

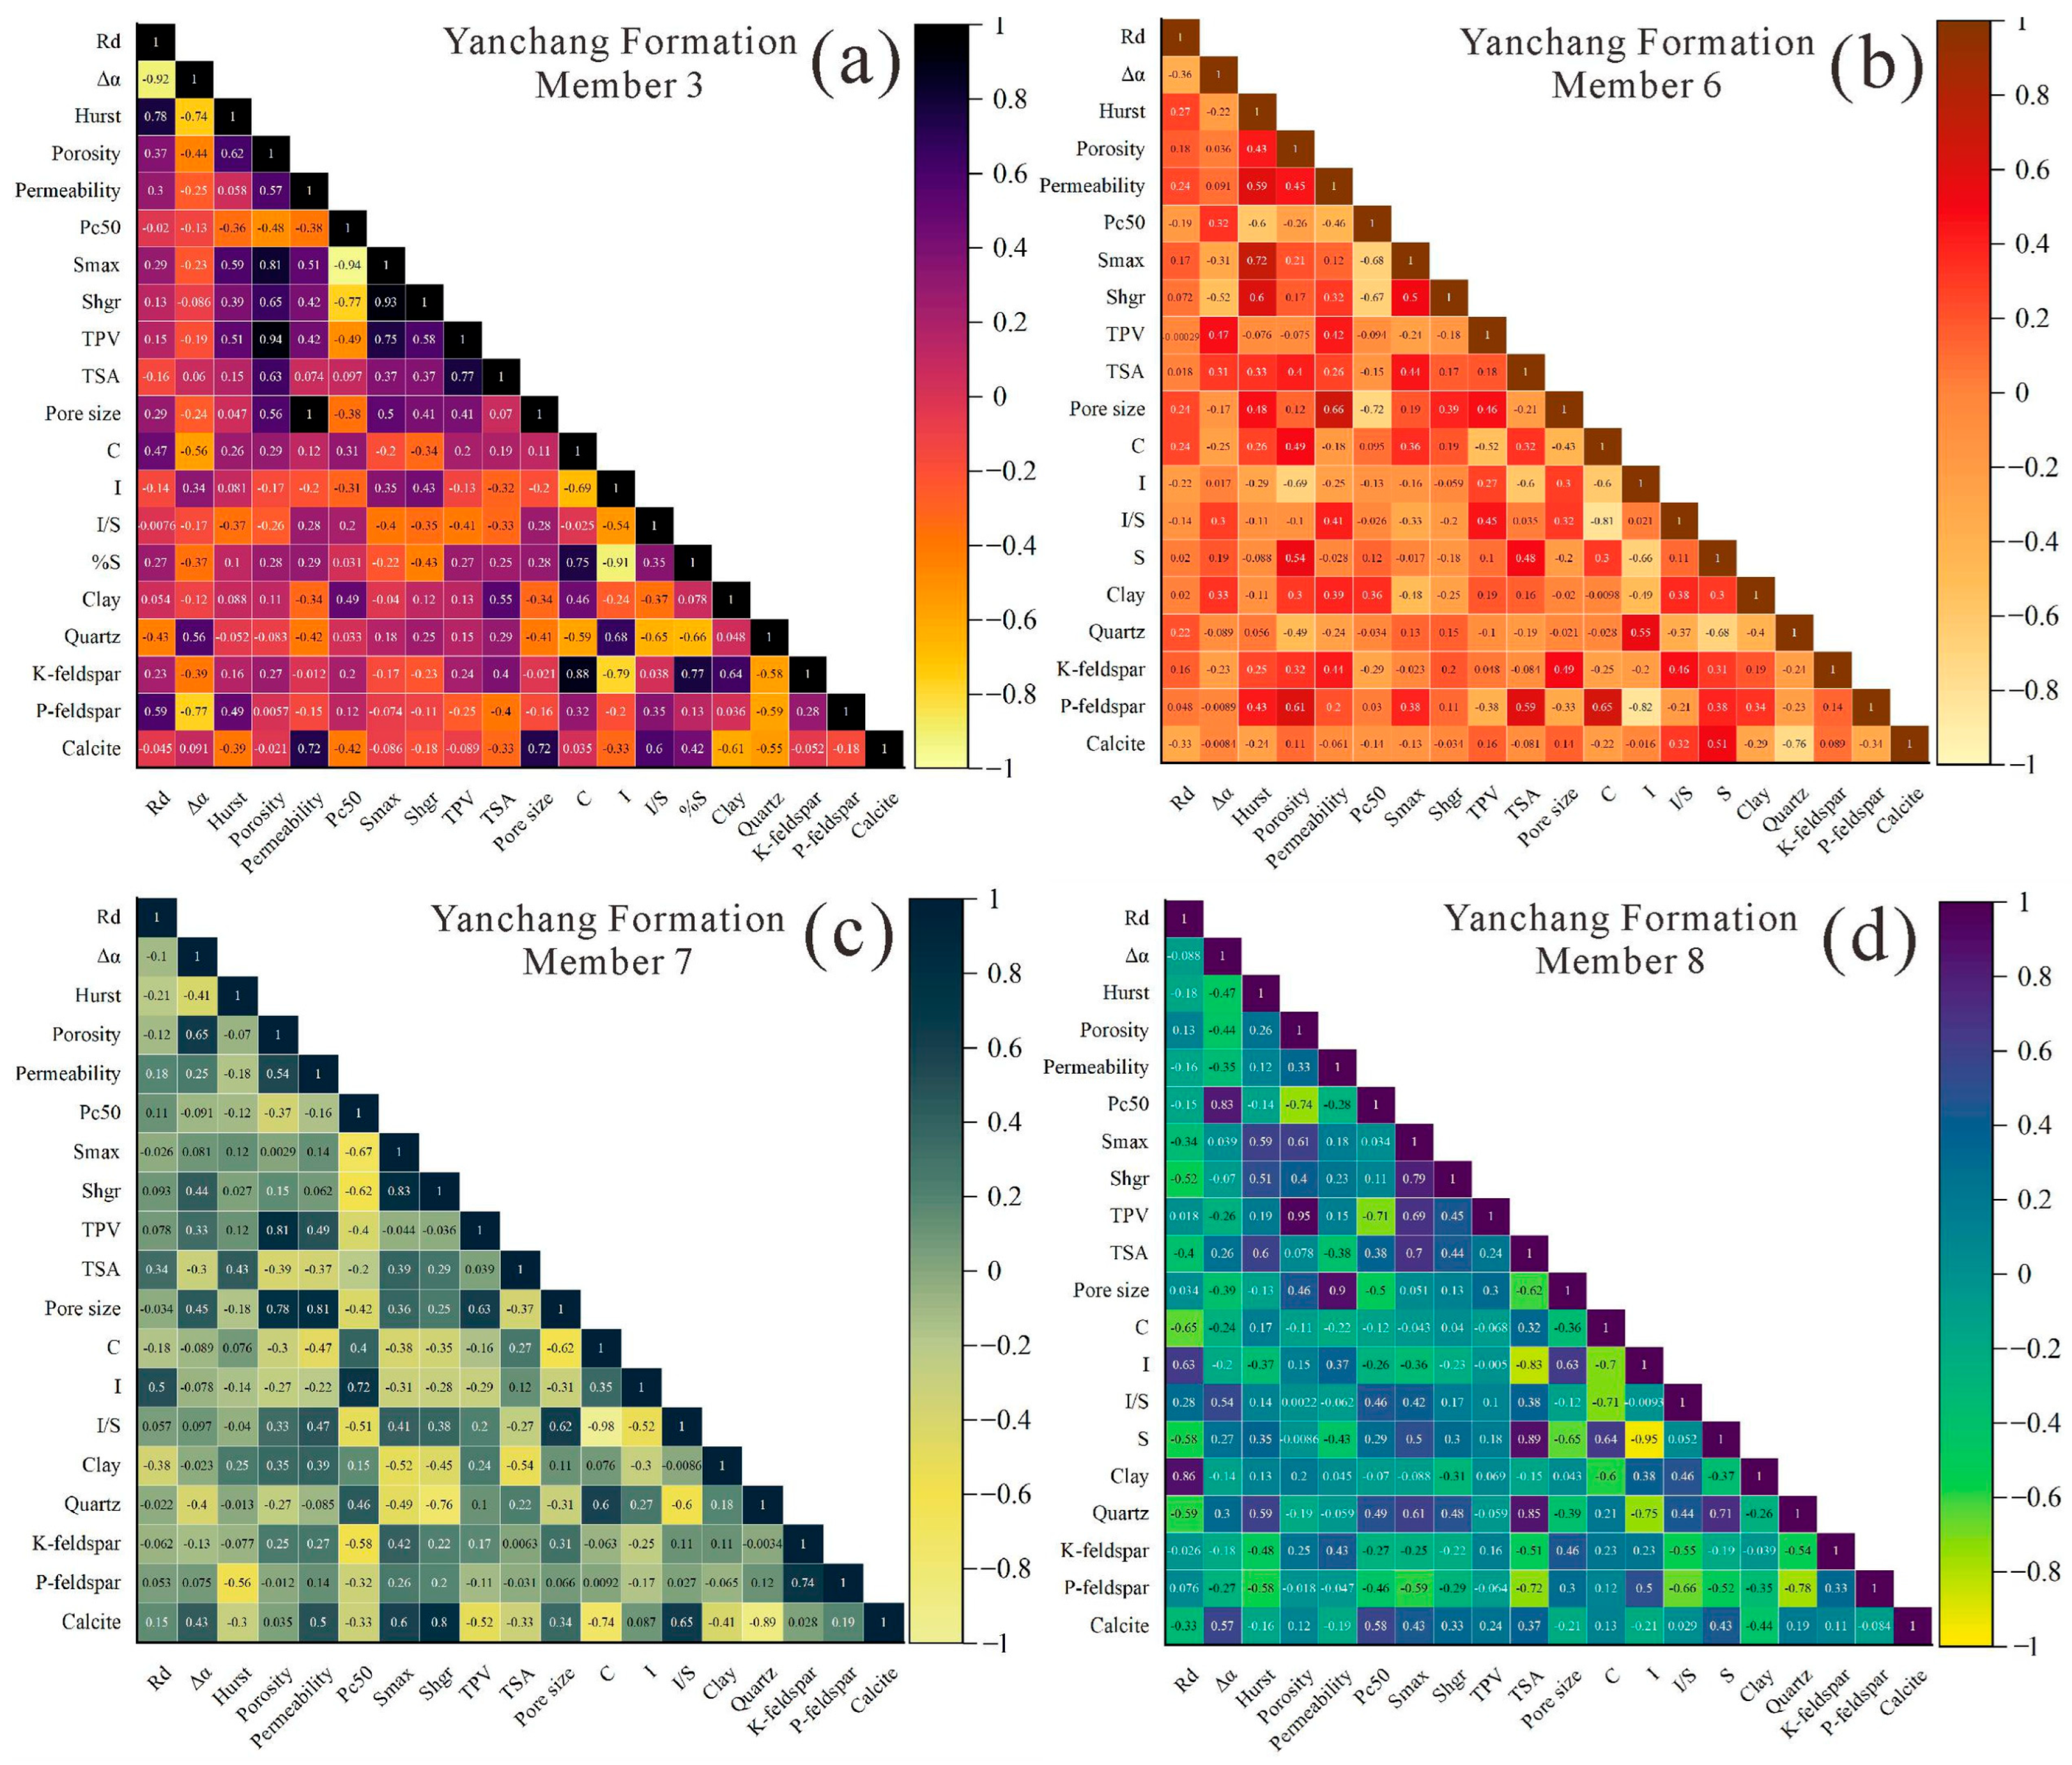
Based on the correlation analysis between the Δα and mineral composition, the dominant minerals controlling heterogeneity across different intervals show significant differences, reflecting the phased evolutionary characteristics of the depositional environment and diagenetic processes [50]. In the Chang 3 member, Δα shows a moderate positive correlation with quartz (0.56) and a significant negative correlation with plagioclase (−0.77), indicating that the heterogeneity in this interval is primarily controlled by detrital components and their degree of diagenetic modification. An increase in quartz content typically corresponds to a stronger grain-supported framework and the preservation of intergranular pores, which is conducive to the formation of multi-scale pore structures, thereby enhancing the multifractal characteristics of the pore structure; conversely, plagioclase is prone to dissolution or alteration into clay minerals during diagenesis, and the uneven development of its secondary pores may, to some extent, reduce the fractal complexity of the pore system. The underlying mechanism is that while initial, partial dissolution creates irregular secondary pores that increase heterogeneity, extensive and pervasive dissolution of plagioclase can effectively interconnect previously isolated micro-pores. This intense dissolution reconstructs the pore network, homogenizing the pore-throat size distribution and creating relatively uniform fluid flow pathways, which thereby reduces the overall multifractal complexity (Δα) of the pore system [51,52] (Figure 12a). In the Chang 6 member, Δα exhibits a certain positive correlation (approximately 0.3) with illite/smectite (I/S) mixed-layer minerals and total clay content, indicating that the heterogeneity in this interval is controlled by clay minerals. I/S mixed-layer minerals possess distinct interlayer structures, and the non-uniformity of their pore size distribution easily leads to strong microscopic pore heterogeneity, thereby expanding the multifractal spectrum width (Figure 12b).
In the Chang 7 member, Δα is positively correlated with calcite (0.43) and negatively correlated with quartz (−0.4), reflecting the dominant role of carbonate cementation in the pore structure heterogeneity of this interval. Calcite typically exists in the form of cement, and its uneven filling in pores leads to a highly discrete pore size distribution, transforming the pore space from relatively uniform to extremely complex, thereby significantly increasing the heterogeneity spectrum width. In contrast, the relatively stable framework structure of quartz tends to reduce heterogeneity (Figure 12c). In the Chang 8 member, Δα shows strong positive correlations with both calcite (0.57) and the illite/smectite mixed-layer (0.54), while quartz shows only a weak positive correlation (0.3), indicating that the heterogeneity in this member is synergistically controlled by carbonate cementation-dissolution and clay minerals. Overall, the response of the multifractal spectrum width to mineral composition exhibits distinct stratigraphic variations, essentially reflecting differences in pore structure formation mechanisms and evolutionary processes across different depositional-diagenetic stages [53] (Figure 12d).

5.3. Diagenetic Sequence and Evolution of the Different Members Sandstones

The multi-scale heterogeneity of pore structures in tight sandstone reservoirs is essentially the result of differential diagenetic remodeling governed by sedimentary facies controls. Rather than directly dictating the final pore morphology, the depositional environment configures the rock’s compaction-resistant framework and the material foundation for fluid-rock interactions by controlling the grain size, sorting, and matrix content of the initial sediments. These inherent material differences strictly constrain the evolutionary trajectories of subsequent diagenesis (compaction, cementation, and dissolution), ultimately yielding distinctly different responses in multifractal parameters.
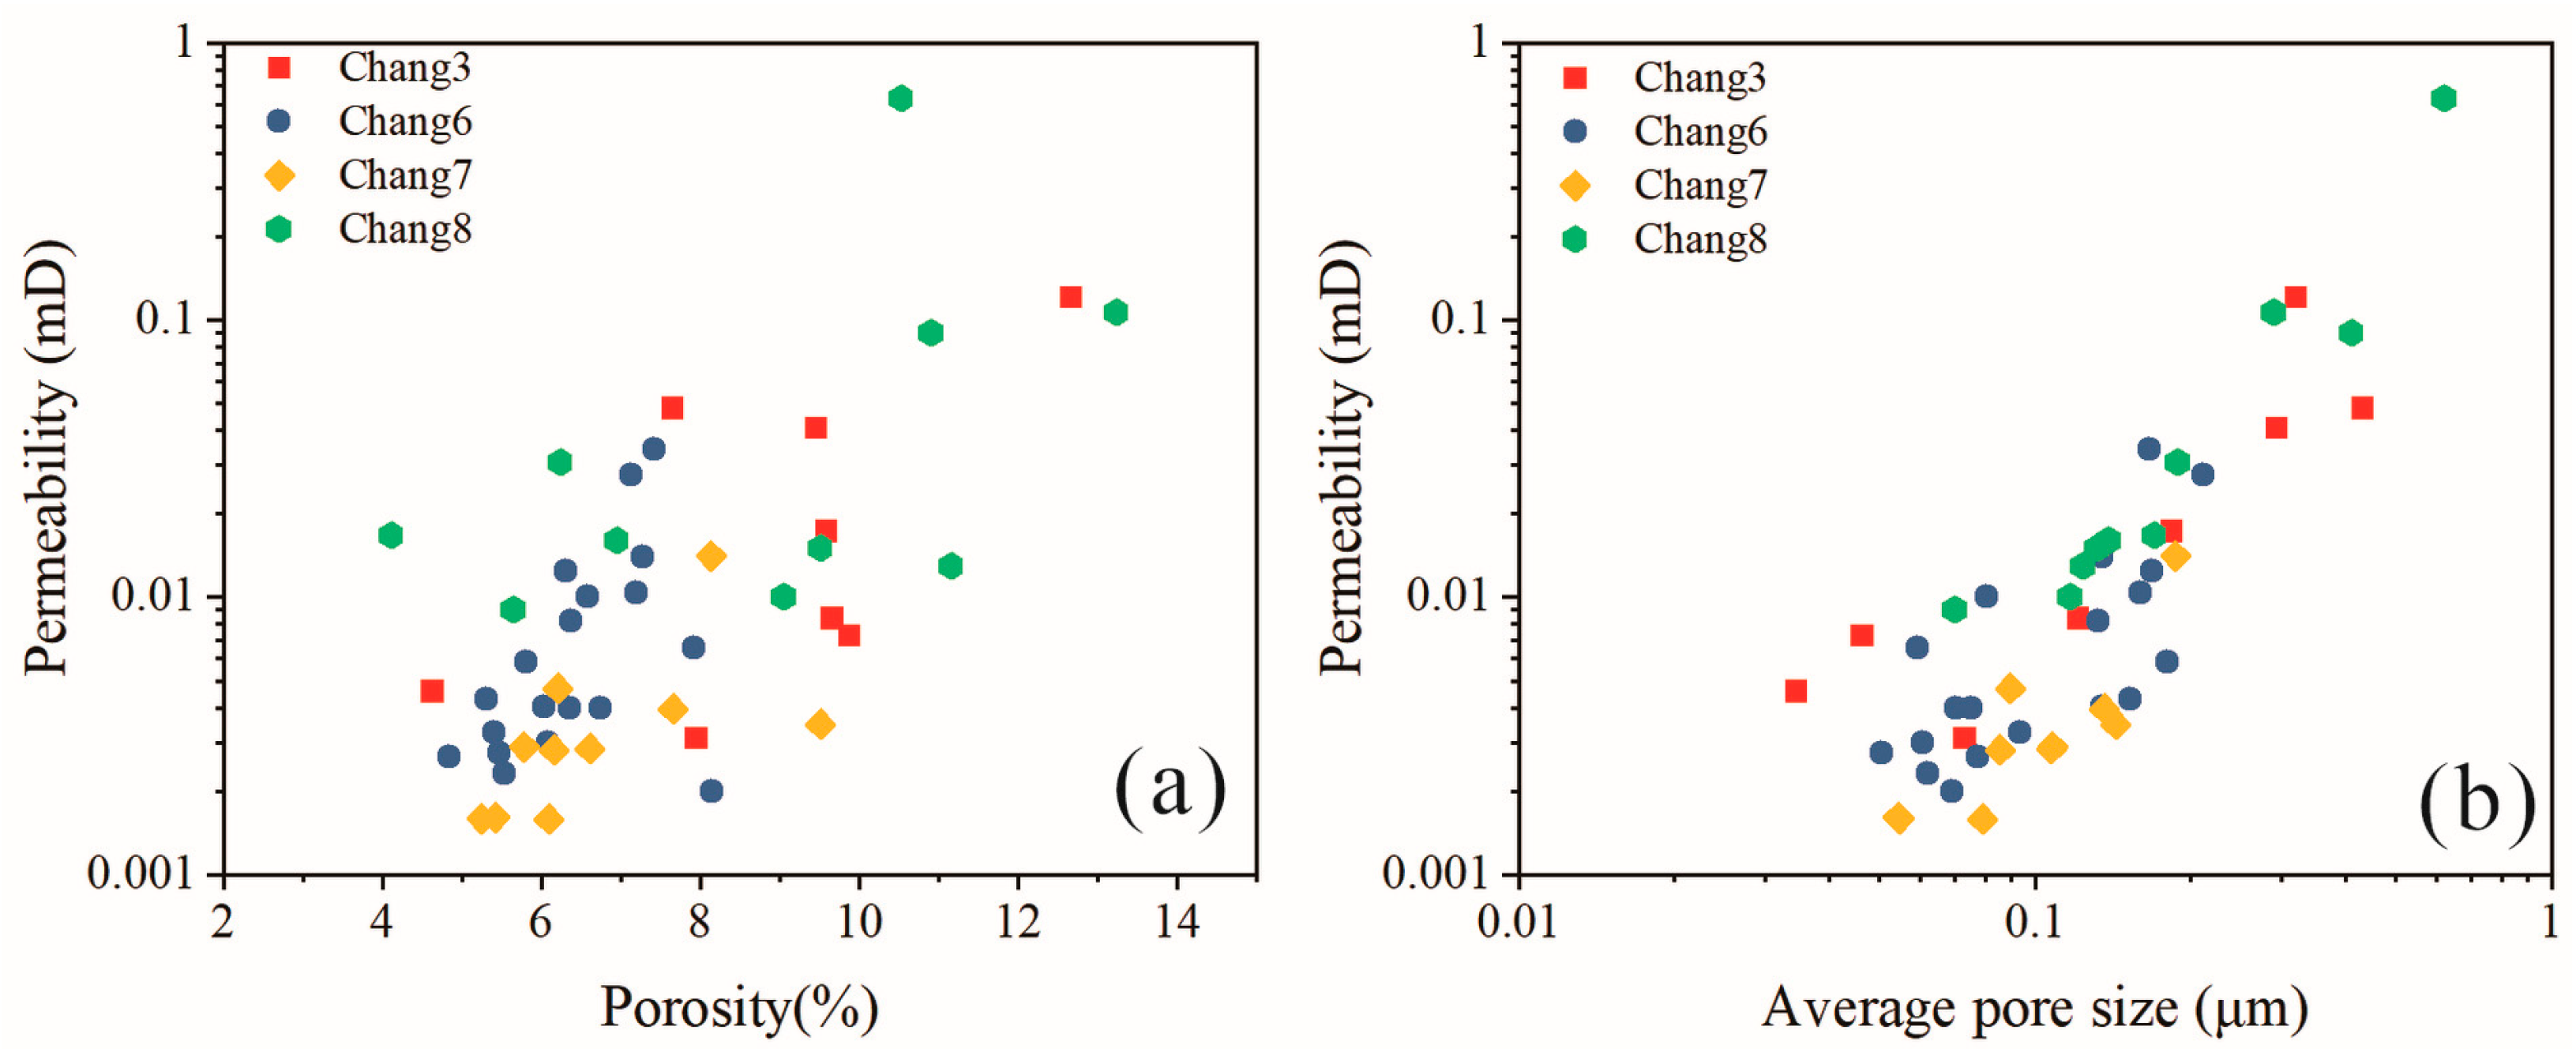
Comparing the porosity and permeability across different members, the results show that the porosity of Chang 6 is concentrated between 5% and 8%, while the permeability of Chang 7 is generally below 0.005 mD. In contrast, the porosity and permeability of Chang 3 and Chang 8 are typically higher, reaching over 9% and 0.01 mD, respectively. Comparatively, the average pore diameter is more closely related to permeability, and the correlation between the average pore diameter and permeability is more pronounced in the Chang 3 and Chang 8 samples (Figure 13).
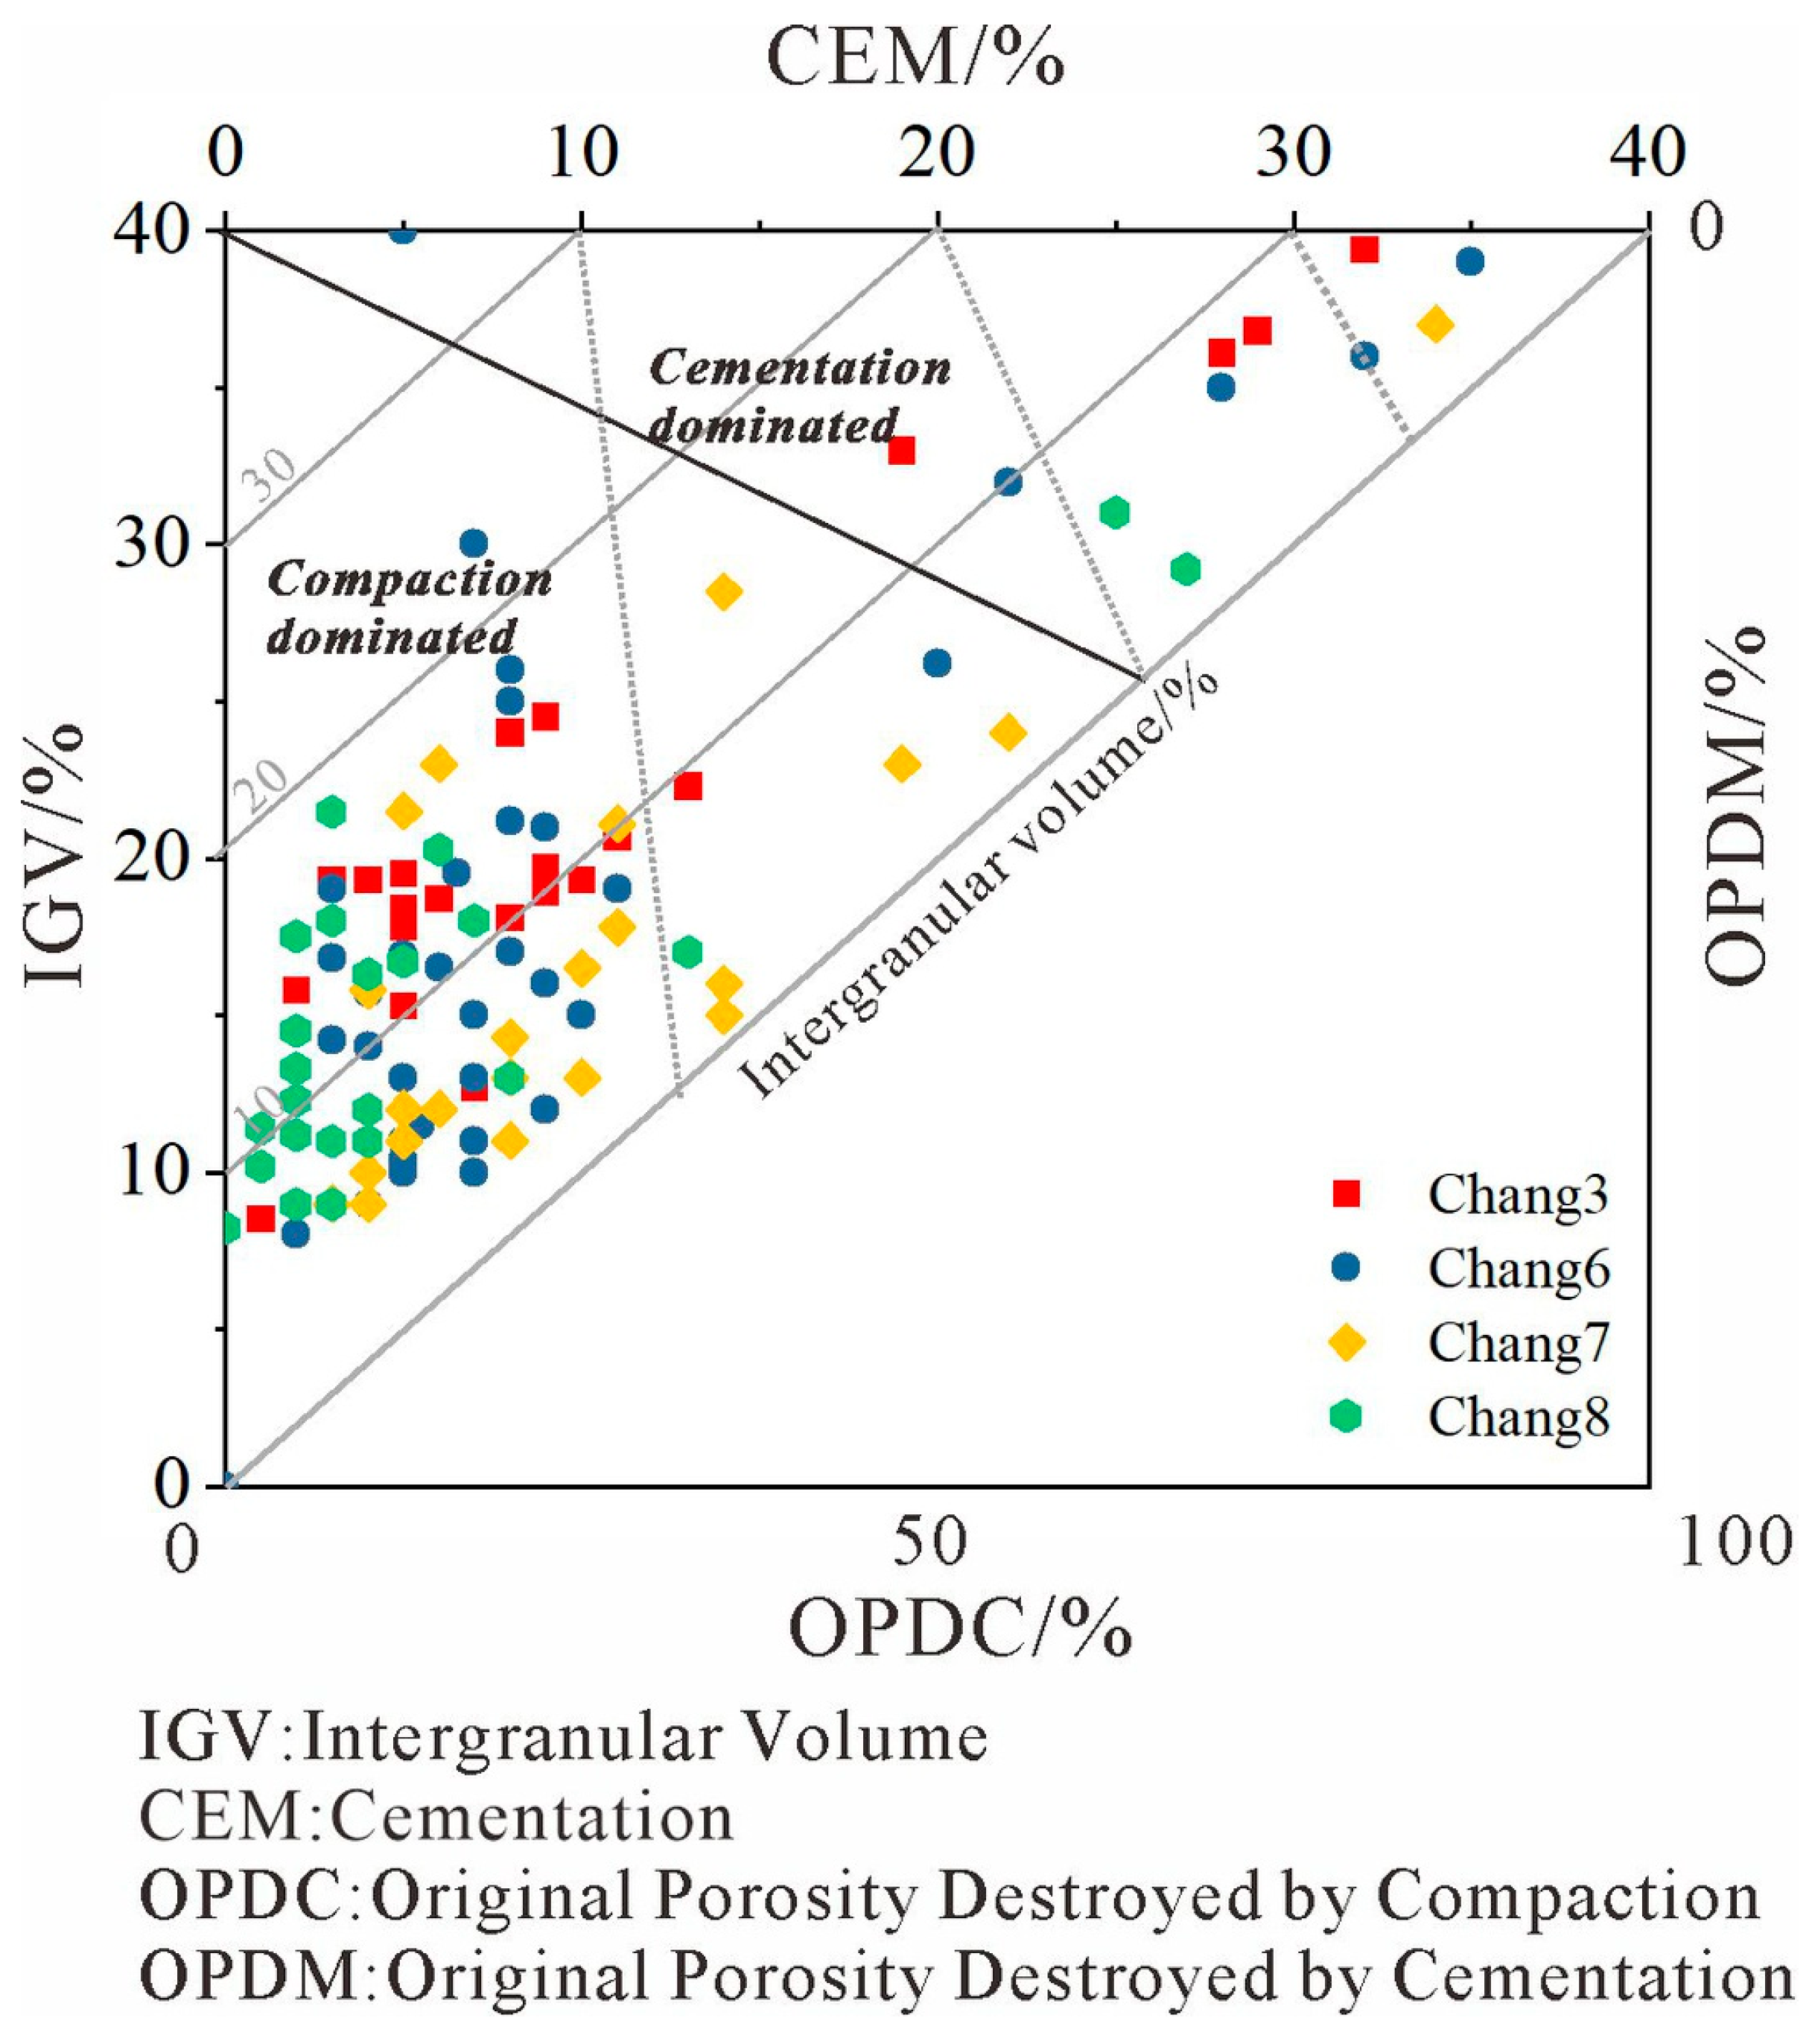
According to the cross-plot of intergranular volume (IGV) versus cement content modified from S. N. Ehrenberg [54] (Figure 14), the IGV of sand bodies in the Yanchang Formation is primarily concentrated between 10% and 20%, with few samples exceeding 20%. The average IGV of Chang 3 samples reaches 21.4%, which is generally higher than that of other samples from other members (approximately 16%). This analysis indicates that the reservoir sand bodies in the Yanchang Formation were subjected to intense compaction during diagenesis, a finding that aligns with previous research [48,55]. However, the degree of compaction varies across different sand bodies; the Chang 8 sand bodies underwent the strongest compaction, while the compaction in Chang 3 was relatively weaker. In Chang 3, the relatively higher content of quartz and feldspar grains likely provided a more rigid framework that enhanced compaction resistance, allowing for better preservation of primary intergranular pores. Conversely, the relatively higher matrix content in the Chang 7 and Chang 8 formations significantly reduced the compaction resistance of the sand bodies. Furthermore, due to finer grain sizes and the poorest sorting, the primary intergranular pores in these units could not be effectively preserved, resulting in the most intense degree of compaction.
Simultaneously, Figure 14 reveals that the porosity loss due to cementation in the Chang 3 and Chang 7 members of the study area is approximately 10%, while the average porosity loss in Chang 6 and Chang 8 is 8.32% and 5.07%, respectively. Analysis indicates that during the diagenetic process, the reservoir sand bodies of Chang 3 and Chang 7 were significantly influenced by cements, followed by Chang 6, whereas the impact on Chang 8 was relatively minor. The compaction intensity in Chang 7 of the study area is lower than that in Chang 8, possibly because early-stage chlorite films and siliceous cements occupied a small amount of pore space, thereby preserving more primary intergranular pores [56]. However, the higher content of late-stage siliceous cements in the Chang 7 member led to the deterioration of reservoir physical properties, resulting in a higher degree of influence from cementation. After intense compaction, the Chang 6 reservoir became tighter, leading to a weaker degree of cementation during subsequent diagenetic processes.
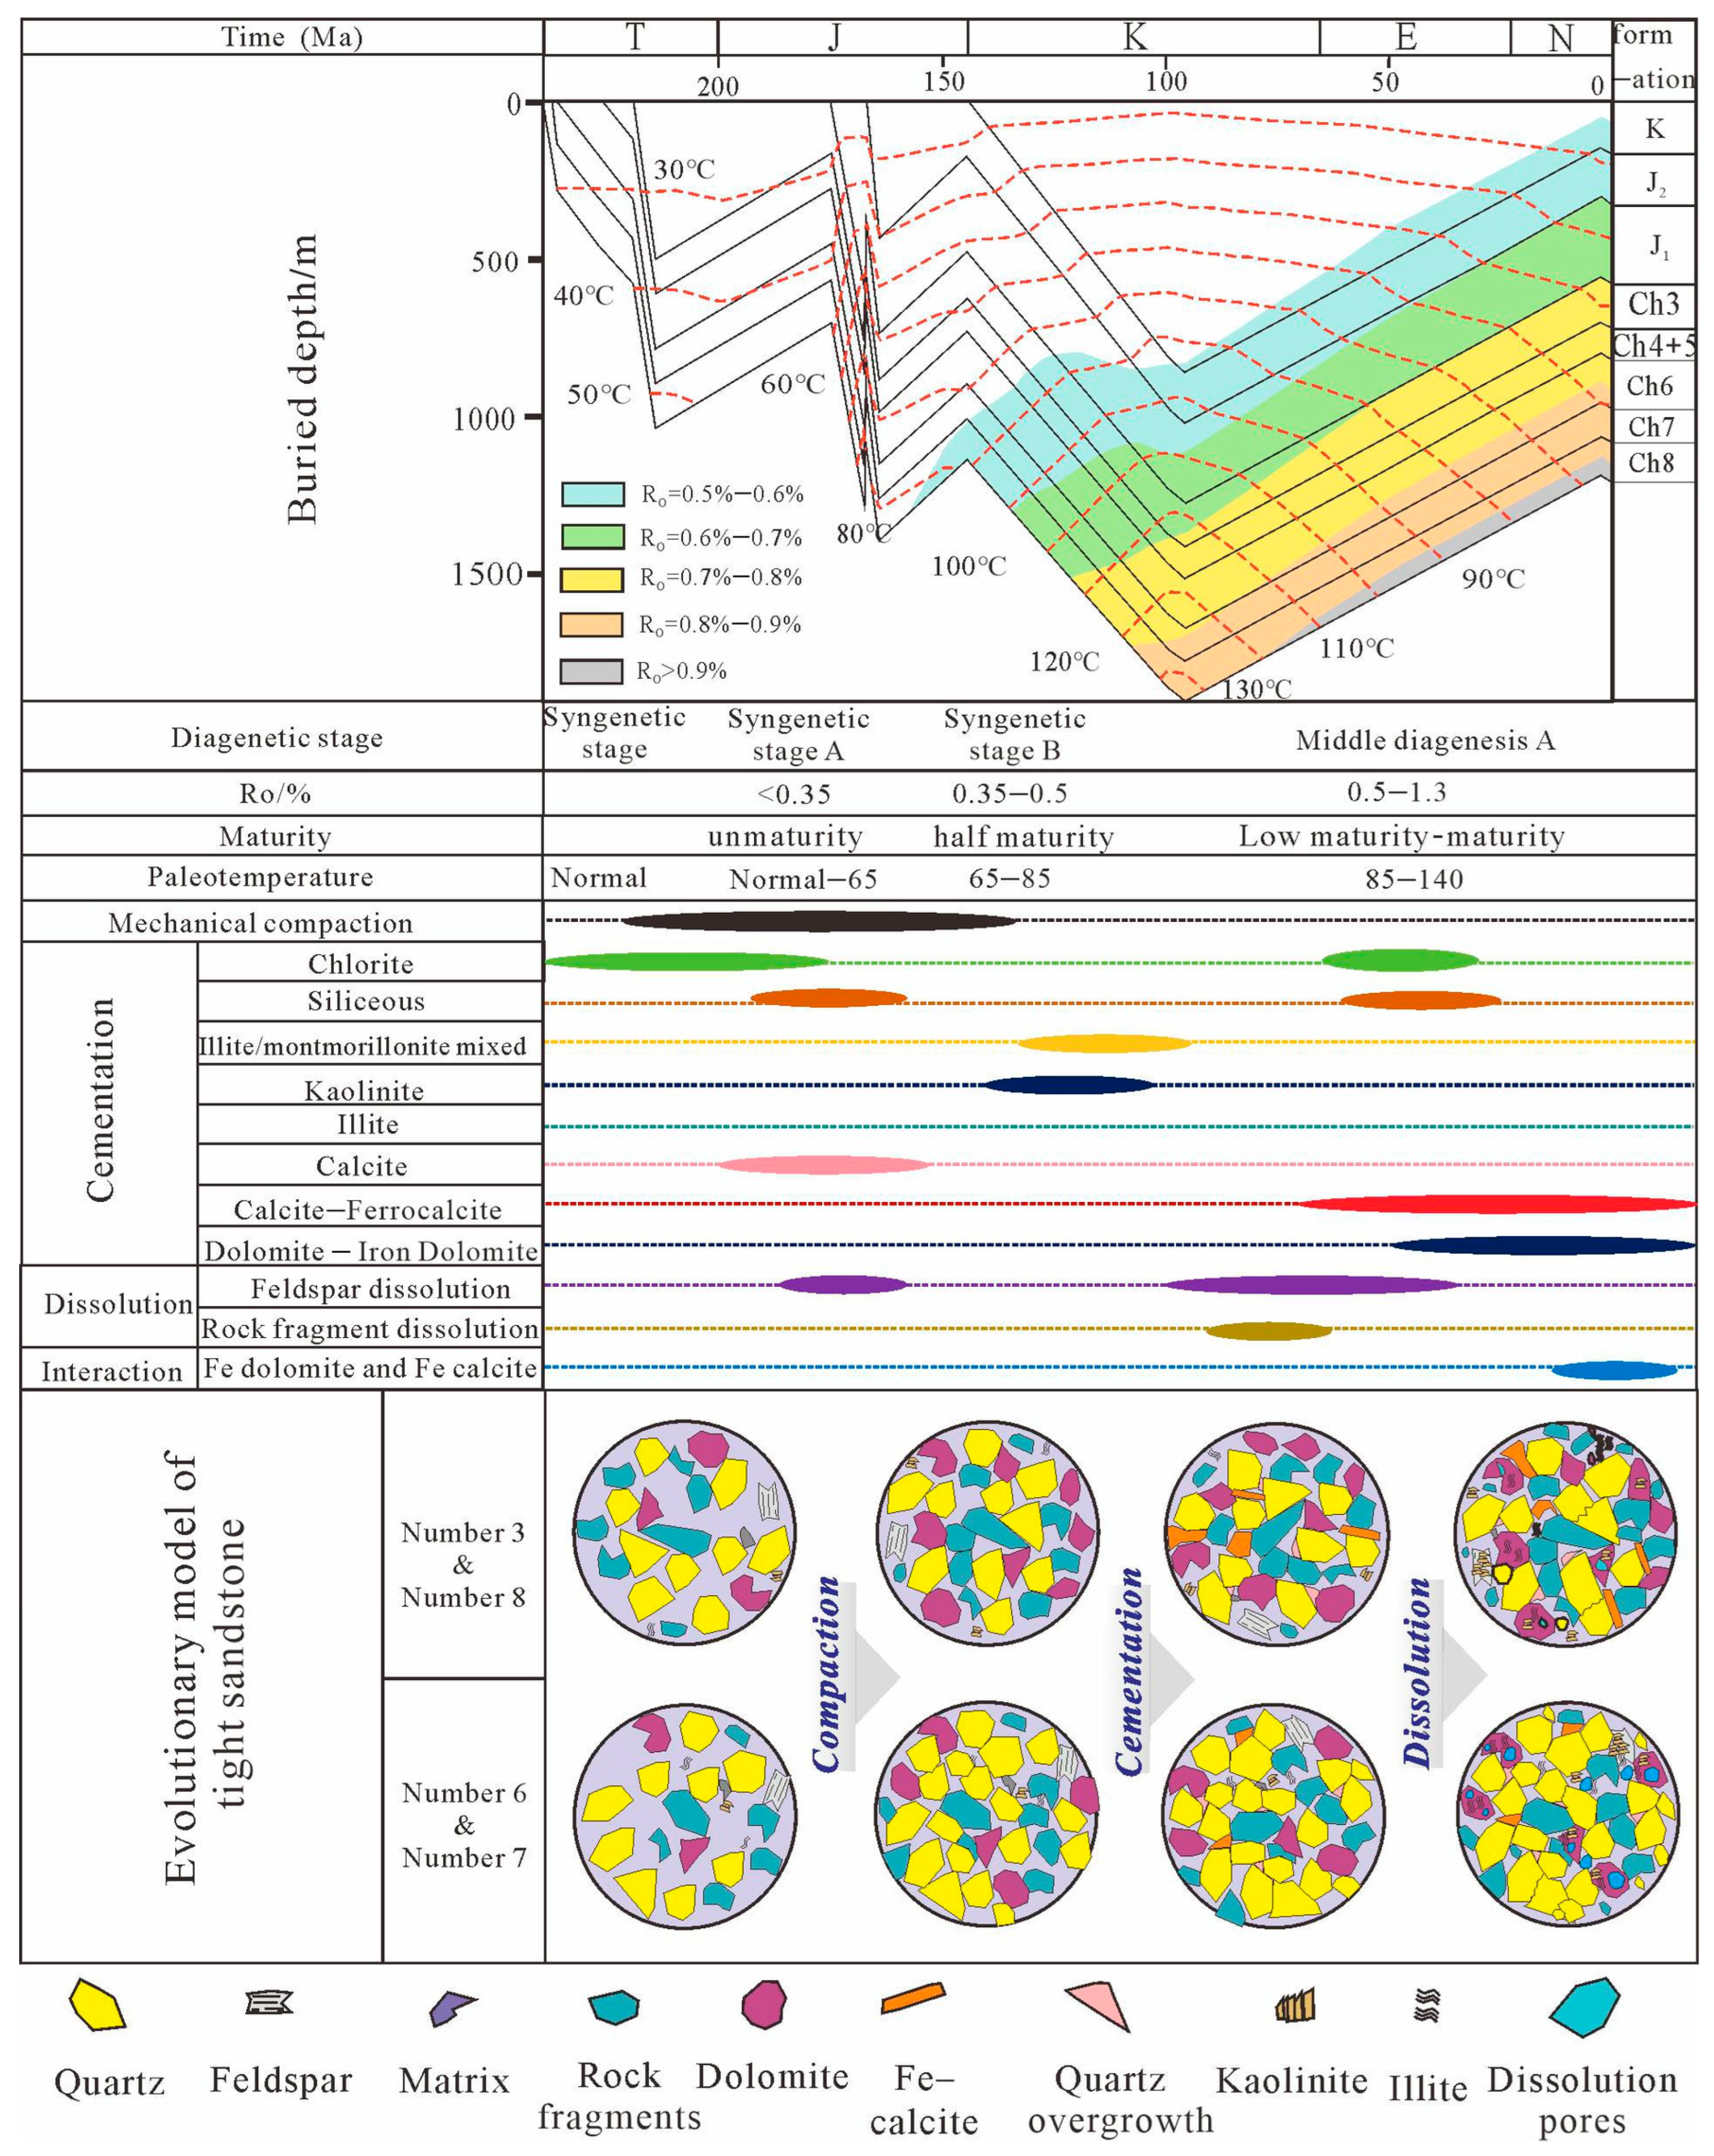
The restoration of pore evolution history was conducted by integrating the burial evolution history of typical wells in the study area. The tight sandstone reservoirs in the study area primarily underwent four burial evolution stages: the Late Triassic, Middle Jurassic, Late Jurassic, and Late Cretaceous. Based on the thermal evolution history curves of the study area (Figure 15), hydrocarbon generation in Chang 7 of the Xunyi area began in the Late Triassic (approximately 210 Ma) and entered the peak oil generation stage by the Middle Jurassic (approximately 170 Ma). Due to factors such as sedimentation during the Late Jurassic and Early Cretaceous, tectono-thermal events, and the increase in burial depth, hydrocarbon generation reached its maximum peak at the end of the Early Cretaceous (approximately 100 Ma) [15]. Subsequently, with the occurrence of the Yanshan and Himalayan movements, the strata underwent continuous uplift, and hydrocarbon generation ceased during the Neogene.
The samples from Chang 3 and Chang 8 of the Yanchang Formation in the Xunyi area primarily consist of underwater distributary channel sand bodies, dominated by fine-grained sandstones with good sorting. During early diagenetic stage A, compaction led to a significant decrease in porosity; early diagenetic stage B witnessed the most intense cementation, with authigenic quartz and clay minerals filling the pores. Subsequently, two episodes of intense dissolution occurred, producing a large number of intergranular and intragranular dissolution pores (Figure 15). In contrast, samples from Chang 6 and Chang 7 belong to sandy debris flow sand bodies, primarily composed of silty-fine sandstones with high matrix content and moderate sorting. The intensity of compaction in these units is higher than that in channel sand bodies; however, the porosity reduction caused by cementation during the middle diagenetic stage (involving kaolinite, illite, etc.) is weaker than that observed in channel sand bodies [57,58].

6. Conclusions

(1) Reservoir quality is fundamentally dictated by depositional facies. The Chang 3 and Chang 8 members, originating from subaqueous distributary channels, possess superior physical properties (porosity > 9%, permeability > 0.01 mD) dominated by primary intergranular and dissolution pores. In contrast, the gravity-flow deposits of Chang 6 and Chang 7 are severely densified, with permeability largely below 0.005 mD and dominated by isolated micro-pores.
(2) High-pressure mercury intrusion (HPMI) coupled with multifractal analysis successfully decodes the complex, non-linear pore architectures of tight sandstones that conventional single-fractal models fail to capture. While the Chang 3 member exhibits the broadest pore-size distribution and highest overall heterogeneity (Δα = 1.943 ± 0.56), the Chang 8 member demonstrates the most optimal spatial connectivity, characterized by the highest Hurst exponent (~0.91), revealing strong long-range spatial positive persistence in its pore network.
(3) The spatial connectivity of the micro-pore network dictates the fluid flow capacity in ultra-tight reservoirs. Although the singularity spectrum width (Δα) correlates negatively with permeability, the heterogeneity index (Rd) shows no significant impact. Instead, the Hurst exponent exhibits a positive correlation with permeability. This proves theoretically that the spatial connectivity of the micro-pore network—rather than the mere concentration or uniformity of pore sizes—is the absolute microscopic determinant for fluid mobility in ultra-tight reservoirs.
(4) The diverse densification pathways unraveled here provide a critical basis for “sweet spot” targeting. While strong mechanical compaction (IGV 10–20%) drives regional densification, the localized preservation mechanisms vary: Chang 3 is protected by rigid quartz/feldspar frameworks; Chang 6 is impaired by I/S mixed-layer clays; Chang 7 by uneven carbonate cementation; and Chang 8 by synergistic clay-carbonate occlusion. Ultimately, this quantitative multifractal evaluation provides a systematic comparative analysis of the reservoir conditions from the Chang 3 to Chang 8 members in the Xunyi area, offering a solid theoretical foundation for high-quality reservoir sweet-spot identification and the optimization of hydraulic fracturing strategies in the southern Ordos Basin.

Author Contributions

Conceptualization, Y.Z. and F.L.; Methodology, H.L. and Z.L.; Software, Y.W., H.L. and H.C.; Validation, Y.Z. and H.L.; Formal analysis, H.L.; Investigation, Y.W. and F.L.; Resources, F.L. and Z.L.; Data curation, Y.Z. and H.C.; Writing—original draft, Y.W. and Z.L.; Writing—review and editing, X.W.; Visualization, Y.W. and H.C.; Supervision, Z.L.; Project administration, X.W. All authors have read and agreed to the published version of the manuscript.

Funding

This study was financially supported by the Sinopec Key Scientific and Technological Research Project (No. P23203). This research was funded by Open Fund of Key Laboratory of Exploration Technologies for Oil and Gas Resources (Yangtze University), Ministry of Education grant number K2024–05 and Open Fund of Key Laboratory of Petroleum Resources Exploration and Evaluation (Chinese Academy of Sciences) grant number KLPREEGS–2025–07. And The APC was funded by Open Fund of Key Laboratory of Exploration Technologies for Oil and Gas Resources (Yangtze University), Ministry of Education and Open Fund of Key Laboratory of Petroleum Resources Exploration and Evaluation (Chinese Academy of Sciences).

Data Availability Statement

The original contributions presented in this study are included in the article. Further inquiries can be directed to the corresponding authors.

Acknowledgments

This study was financially supported by the Sinopec Key Scientific and Technological Research Project (No. P23203). We would like to extend our gratitude to all the experts and editors for their guidance and contributions to this manuscript.

Conflicts of Interest

The authors declare the following financial interests/personal relationships which may be considered as potential competing interests: Yong Wang, Yan Zhu, and Hengquan Li are currently employed by China Petroleum and Chemical Corporation Limited.

References

  1. Song, Y.; Luo, Q.; Jiang, Z.; Yang, W.; Liu, D. Enrichment of Tight Oil and Its Controlling Factors in Central and Western China. Pet. Explor. Dev. 2021, 48, 492–506. [Google Scholar] [CrossRef]
  2. Zhao, W.; Hu, S.; Hou, L.; Yang, T.; Li, X.; Guo, B.; Yang, Z. Types and Resource Potential of Continental Shale Oil in China and Its Boundary with Tight Oil. Pet. Explor. Dev. 2020, 47, 1–11. [Google Scholar] [CrossRef]
  3. Liu, S. Review of the Development Status and Technology of Tight Oil: Advances and Outlook. Energy Fuels 2023, 37, 14645–14665. [Google Scholar] [CrossRef]
  4. Zou, C.; Guo, Q.; Yang, Z.; Wu, S.; Chen, N.; Lin, S.; Pan, S. Resource Potential and Core Area Prediction of Lacustrine Tight Oil: The Triassic Yanchang Formation in Ordos Basin, China. AAPG Bull. 2019, 103, 1493–1523. [Google Scholar] [CrossRef]
  5. Yang, H.; Deng, X. Deposition of Yanchang Formation Deep-Water Sandstone under the Control of Tectonic Events in the Ordos Basin. Pet. Explor. Dev. 2013, 40, 549–557. [Google Scholar] [CrossRef]
  6. Xi, K.; Cao, Y.; Liu, K.; Wu, S.; Yuan, G.; Zhu, R.; Kashif, M.; Zhao, Y. Diagenesis of Tight Sandstone Reservoirs in the Upper Triassic Yanchang Formation, Southwestern Ordos Basin, China. Mar. Pet. Geol. 2019, 99, 548–562. [Google Scholar] [CrossRef]
  7. Lu, Z.; He, Z.; Zhu, G.; Zhu, J.; Gluyas, J.; Liu, G.; Lan, W. Diagenetic Facies, Volcanic Tuffaceous Sediment, and Its Diagenetic Features in Deeply Buried Tight Sandstone, Shan 2 and He 1 Members, Ordos Basin, China. Nat. Gas Ind. B 2025, 12, 527–542. [Google Scholar] [CrossRef]
  8. Qin, Y.; Yao, S.; Xiao, H.; Cao, J.; Hu, W.; Sun, L.; Tao, K.; Liu, X. Pore Structure and Connectivity of Tight Sandstone Reservoirs in Petroleum Basins: A Review and Application of New Methodologies to the Late Triassic Ordos Basin, China. Mar. Pet. Geol. 2021, 129, 105084. [Google Scholar] [CrossRef]
  9. Zhang, M.; Wang, J.; Fu, X.; Lu, H.; Dong, Z.; Li, L.; Wang, H. Multifractal Characteristics and Genetic Mechanisms of Pore Throat Structures in Coal Measure Tight Sandstone. Nat. Resour. Res. 2022, 31, 2885–2900. [Google Scholar] [CrossRef]
  10. Liu, M.; Xie, R.; Guo, J.; Jin, G. Characterization of Pore Structures of Tight Sandstone Reservoirs by Multifractal Analysis of the NMR T2 Distribution. Energy Fuels 2018, 32, 12218–12230. [Google Scholar] [CrossRef]
  11. Zhao, P.; Lv, Q.; Xin, Y.; Wu, N. Heterogeneity of Deep Tight Sandstone Reservoirs Using Fractal and Multifractal Analysis Based on Well Logs and Its Correlation with Gas Production. Fractal Fract. 2025, 9, 431. [Google Scholar] [CrossRef]
  12. Yao, P.; Zhang, J.; Lv, D.; Vandeginste, V.; Chang, X.; Zhang, X.; Wang, D.; Han, S.; Liu, Y. Effect of Water Occurrence in Coal Reservoirs on the Production Capacity of Coalbed Methane by Using NMR Simulation Technology and Production Capacity Simulation. Geoenergy Sci. Eng. 2024, 243, 213353. [Google Scholar] [CrossRef]
  13. Miao, H.; Vandeginste, V.; Zhang, J.; Chen, S.; Chang, X.; Du, Y.; Wang, Y.; Wei, C.; Luo, J.; Quan, F.; et al. Control Mechanism of Pressure Drop Rate on Coalbed Methane Productivity by Using Production Data and Physical Simulation Technology. Fuel 2026, 406, 137060. [Google Scholar] [CrossRef]
  14. Dou, W.; Liu, L.; Wu, K.; Xu, Z.; Feng, X. Origin and Significance of Secondary Porosity: A Case Study of Upper Triassic Tight Sandstones of Yanchang Formation in Ordos Basin, China. J. Pet. Sci. Eng. 2017, 149, 485–496. [Google Scholar] [CrossRef]
  15. Chen, H.; Zhu, X.; Chen, C.; Yin, W.; Zhang, Q.; Shi, R. Diagenesis and Hydrocarbon Emplacement in the Upper Triassic Yanchang Formation Tight Sandstones in the Southern Ordos Basin, China. Aust. J. Earth Sci. 2017, 64, 957–980. [Google Scholar] [CrossRef]
  16. Guo, X.; Huang, Z.; Zhao, L.; Han, W.; Ding, C.; Sun, X.; Yan, R.; Zhang, T.; Yang, X.; Wang, R. Pore Structure and Multi-Fractal Analysis of Tight Sandstone Using MIP, NMR and NMRC Methods: A Case Study from the Kuqa Depression, China. J. Pet. Sci. Eng. 2019, 178, 544–558. [Google Scholar] [CrossRef]
  17. Liu, F.; Zhu, X.; Li, Y.; Xue, M.; Sun, J. Sedimentary Facies Analysis and Depositional Model of Gravity-Flow Deposits of the Yanchang Formation, Southwestern Ordos Basin, NW China. Aust. J. Earth Sci. 2016, 63, 885–902. [Google Scholar] [CrossRef]
  18. Loubser, M.; Verryn, S. Combining XRF and XRD Analyses and Sample Preparation to Solve Mineralogical Problems. S. Afr. J. Geol. 2008, 111, 229–238. [Google Scholar] [CrossRef]
  19. GB/T 17412.2-1998; Classification and Nomenclature Schemes of the Rocks—Classification and Nomenclature Schemes of Sedimentary Rock. Standards Press of China: Beijing, China, 1998.
  20. Iscan, A.G.; Kok, M.V. Porosity and Permeability Determinations in Sandstone and Limestone Rocks Using Thin Section Analysis Approach. Energy Sources Part A 2009, 31, 568–575. [Google Scholar] [CrossRef]
  21. GB/T 29172-2012; Practices for Core Analysis. Standards Press of China: Beijing, China, 2012.
  22. Peng, R.; Yang, X. Recent Advances in the Application of Porosity and Permeability in Porous Media. Phys. Fluids 2025, 37, 76643. [Google Scholar] [CrossRef]
  23. Ural, N. The Significance of Scanning Electron Microscopy (SEM) Analysis on the Microstructure of Improved Clay: An Overview. Open Geosci. 2021, 13, 197–218. [Google Scholar] [CrossRef]
  24. Zhou, Y.; Han, G.; Liu, Y.; Mou, L.; Wang, K.; Yang, P.; Yan, K. Fractal Characteristics and Controlling Factors of Pore-Throat Structure in Tight Sandstone Reservoirs: A Case Study of the 2nd Member of the Kongdian Formation in the Nanpi Slope, Cangdong Sag, Bohai Bay Basin. Fractal Fract. 2025, 9, 608. [Google Scholar] [CrossRef]
  25. Wu, Y.; Liu, C.; Ouyang, S.; Luo, B.; Zhao, D.; Sun, W.; Awan, R.S.; Lu, Z.; Li, G.; Zang, Q. Investigation of Pore-Throat Structure and Fractal Characteristics of Tight Sandstones Using HPMI, CRMI, and NMR Methods: A Case Study of the Lower Shihezi Formation in the Sulige Area, Ordos Basin. J. Pet. Sci. Eng. 2022, 210, 110053. [Google Scholar] [CrossRef]
  26. Zhao, X.; Yang, Z.; Lin, W.; Xiong, S.; Luo, Y.; Wang, Z.; Chen, T.; Xia, D.; Wu, Z. Study on Pore Structures of Tight Sandstone Reservoirs Based on Nitrogen Adsorption, High-Pressure Mercury Intrusion, and Rate-Controlled Mercury Intrusion. J. Energy Res. Technol. 2019, 141, 112903. [Google Scholar] [CrossRef]
  27. Zhou, Y.; Xu, J.; Lan, Y.; Zi, H.; Cui, Y.; Chen, Q.; You, L.; Fan, X.; Wang, G. New Insights into Pore Fractal Dimension from Mercury Injection Capillary Pressure in Tight Sandstone. Geoenergy Sci. Eng. 2023, 228, 212059. [Google Scholar] [CrossRef]
  28. Han, C.; Li, G.; Dan, S.; Yang, Y.; He, X.; Qi, M.; Liu, G. Study of Fractal and Multifractal Features of Pore Structure in Tight Sandstone Reservoirs of the Permian Lucaogou Formation, Jimsar Sag, Junggar Basin, Northwest China. ACS Omega 2022, 7, 31352–31366. [Google Scholar] [CrossRef] [PubMed]
  29. Li, T.; Fu, M.; Wang, R.; Deng, Y.; Xu, J.; Guo, R. Fractal and Fluid Mobility Analysis of Pore-Throat Systems in Sandstone Reservoirs Based on HPMI and NMR: A Case Study from the Nahr Umr Formation, Iraq. Fractal Fract. 2026, 10, 15. [Google Scholar] [CrossRef]
  30. Hou, X.; Zhu, Y.; Chen, S.; Wang, Y.; Liu, Y. Investigation on Pore Structure and Multifractal of Tight Sandstone Reservoirs in Coal Bearing Strata Using LF-NMR Measurements. J. Pet. Sci. Eng. 2020, 187, 106757. [Google Scholar] [CrossRef]
  31. Wang, F.-Y.; Yang, K.; Zai, Y. Multifractal Characteristics of Shale and Tight Sandstone Pore Structures with Nitrogen Adsorption and Nuclear Magnetic Resonance. Pet. Sci. 2020, 17, 1209–1220. [Google Scholar] [CrossRef]
  32. Wang, W.; Lin, C.; Zhang, X. Fractal Characteristics of Pore Throat and Throat of Tight Sandstone Sweet Spot: A Case Study in the East China Sea Basin. Fractal Fract. 2024, 8, 684. [Google Scholar] [CrossRef]
  33. Zhang, Y.; Qu, X.; Miao, C.; Wang, W.; Wen, J.; Lu, H. A Full-Scale Pore Fractal Modeling Approach for Tight Sandstone Reservoirs Integrating HPMI and LTNA Data. Fractal Fract. 2026, 10, 96. [Google Scholar] [CrossRef]
  34. Liu, B.; Zhang, X.; Zou, C.; Zhao, L.; He, H. Advances in the Application of Fractal Theory to Oil and Gas Resource Assessment. Fractal Fract. 2025, 9, 676. [Google Scholar] [CrossRef]
  35. Song, X.; Feng, C.; Li, T.; Zhang, Q.; Zhou, J.; Sun, M. Pore Structure Quantitative Characterization of Tight Sandstones Based on Deep Learning and Fractal Analysis. Fractal Fract. 2025, 9, 372. [Google Scholar] [CrossRef]
  36. Xu, Z.; Xin, H.; Wang, Z.; Feng, S.; Ma, W.; Zhu, L.; Tao, H.; Hao, L.; Ma, X. Pore Structure and the Multifractal Characteristics of Shale before and after Extraction: A Case Study of the Triassic Yanchang Formation in the Ordos Basin. Minerals 2025, 15, 1324. [Google Scholar] [CrossRef]
  37. Qu, K.; Guo, S. Investigation of the Pore Structure of Tight Sandstone Based on Multifractal Analysis from NMR Measurement: A Case from the Lower Permian Taiyuan Formation in the Southern North China Basin. Energies 2020, 13, 4067. [Google Scholar] [CrossRef]
  38. Zhang, J.; Hu, Y. Comparative Evaluation of Pore Structure Heterogeneity in Low-Permeability Tight Sandstones Using Different Fractal Models Based on NMR Technology: A Case Study of Benxi Formation in the Central Ordos Basin. Energy Fuels 2020, 34, 13924–13942. [Google Scholar] [CrossRef]
  39. Li, P. Fractal Analysis of Pore–Throat Structures in Triassic Yanchang Formation Tight Sandstones, Ordos Basin, China: Implications for Reservoir Permeability and Fluid Mobility. Fractal Fract. 2025, 9, 415. [Google Scholar] [CrossRef]
  40. Liu, P.; Liu, Y.; Hou, J.; Bao, L.; Chen, Q. Multifractal Characteristics of Tight Sandstone Pore Structure Based on Nuclear Magnetic Resonance in Benxi Formation, Ordos Basin, China. Fractal Fract. 2026, 10, 153. [Google Scholar] [CrossRef]
  41. Zhang, H.; Wang, C.; Sui, J.; Lv, Y.; Guo, L.; Wu, Z. Pore-Throat Structure, Fractal Characteristics, and Main Controlling Factors in Extremely Low-Permeability Sandstone Reservoirs: The Case of Chang 3 Section in Huachi Area, Ordos Basin. Fractal Fract. 2025, 9, 439. [Google Scholar] [CrossRef]
  42. Huang, J.; Liu, Z.; Hao, B.; Dong, Z. Pore Structure and Multifractal Characteristics of Tight Sandstone: A Case Study of the Jurassic Sangonghe Formation in Northern Turpan-Hami Basin, NW China. Fractal Fract. 2026, 10, 259. [Google Scholar] [CrossRef]
  43. Zhang, H.; Zhang, Z.; Wang, Z.; Wang, Y.; Yang, R.; Zhu, T.; Luo, F.; Liu, K. Using Fractal Theory to Study the Influence of Movable Oil on the Pore Structure of Different Types of Shale: A Case Study of the Fengcheng Formation Shale in Well X of Mahu Sag, Junggar Basin, China. Fractal Fract. 2024, 8, 242. [Google Scholar] [CrossRef]
  44. Jiang, Z.; Mao, Z.; Shi, Y.; Wang, D. Multifractal Characteristics and Classification of Tight Sandstone Reservoirs: A Case Study from the Triassic Yanchang Formation, Ordos Basin, China. Energies 2018, 11, 2242. [Google Scholar] [CrossRef]
  45. Wang, W.; Wang, R.; Wang, L.; Qu, Z.; Ding, X.; Gao, C.; Meng, W. Pore Structure and Fractal Characteristics of Tight Sandstones Based on Nuclear Magnetic Resonance: A Case Study in the Triassic Yanchang Formation of the Ordos Basin, China. ACS Omega 2023, 8, 16284–16297. [Google Scholar] [CrossRef] [PubMed]
  46. Hu, Y.; Guo, Y.; Shangguan, J.; Zhang, J.; Song, Y. Fractal Characteristics and Model Applicability for Pores in Tight Gas Sandstone Reservoirs: A Case Study of the Upper Paleozoic in Ordos Basin. Energy Fuels 2020, 34, 16059–16072. [Google Scholar] [CrossRef]
  47. He, T.; Zhou, Y.; Li, Y.; Xie, H.; Shang, Y.; Chen, T.; Zhang, Z. Research on the Microscopic Pore-Throat Structure and Reservoir Quality of Tight Sandstone Using Fractal Dimensions. Sci. Rep. 2024, 14, 22825. [Google Scholar] [CrossRef] [PubMed]
  48. Zhang, H.; Guo, L.; Wu, Z.; Ma, J. Pore-Throat Structure, Fractal Characteristics and Permeability Prediction of Tight Sandstone: The Yanchang Formation, Southeast Ordos Basin. Sci. Rep. 2024, 14, 27913. [Google Scholar] [CrossRef] [PubMed]
  49. Liu, S.; Wang, M.; Cheng, Y.; Yu, X.; Duan, X.; Kang, Z.; Xiong, Y. Fractal Insights into Permeability Control by Pore Structure in Tight Sandstone Reservoirs, Heshui Area, Ordos Basin. Open Geosci. 2025, 17, 20250791. [Google Scholar] [CrossRef]
  50. Zhang, P.; Lee, Y.I.; Zhang, J. Diagenetic Controls on the Reservoir Quality of Tight Oil-Bearing Sandstones in the Upper Triassic Yanchang Formation, Ordos Basin, North-Central China. J. Pet. Geol. 2020, 43, 225–244. [Google Scholar] [CrossRef]
  51. Brasher, J.E.; Pike, J.D.; Tieh, T.T.; Berg, R.R. Effects of Arkosic Sandstone Diagenesis on Reservoir Rock Properties: ABSTRACT. AAPG Bull. 1982, 66, 552–553. [Google Scholar] [CrossRef]
  52. Zhu, H.; Zhang, Q.; Dong, G.; Shang, F.; Zhang, F.; Zhao, X.; Zhang, X. Characteristics and Control Factors of Feldspar Dissolution in Gravity Flow Sandstone of Chang 7 Member, Triassic Yanchang Formation, Ordos Basin, NW China. Pet. Explor. Dev. 2024, 51, 114–126. [Google Scholar] [CrossRef]
  53. Hao, R.; Huang, W.; Bo, J.; Yuan, L. Fractal Characteristics and Main Controlling Factors of High-Quality Tight Sandstone Reservoirs in the Southeastern Ordos Basin. J. Earth Sci. 2024, 35, 631–641. [Google Scholar] [CrossRef]
  54. Ehrenberg, S.N. Assessing the Relative Importance of Compaction Processes and Cementation to Reduction of Porosity in Sandstones: Discussion; Compaction and Porosity Evolution of Pliocene Sandstones, Ventura Basin, California: DISCUSSION. AAPG Bull. 1989, 73, 1274–1276. [Google Scholar] [CrossRef]
  55. Wang, M.; Yang, Z.; Shui, C.; Yu, Z.; Wang, Z.; Cheng, Y. Diagenesis and Its Influence on Reservoir Quality and Oil-Water Relative Permeability: A Case Study in the Yanchang Formation Chang 8 Tight Sandstone Oil Reservoir, Ordos Basin, China. Open Geosci. 2019, 11, 37–47. [Google Scholar] [CrossRef]
  56. Lai, J.; Wang, G.; Ran, Y.; Zhou, Z.; Cui, Y. Impact of Diagenesis on the Reservoir Quality of Tight Oil Sandstones: The Case of Upper Triassic Yanchang Formation Chang 7 Oil Layers in Ordos Basin, China. J. Pet. Sci. Eng. 2016, 145, 54–65. [Google Scholar] [CrossRef]
  57. Wang, Z.; Luo, X.; Lei, Y.; Zhang, L.; Shi, H.; Lu, J.; Cheng, M.; Liu, N.; Wang, X.; He, Y.; et al. Impact of Detrital Composition and Diagenesis on the Heterogeneity and Quality of Low-Permeability to Tight Sandstone Reservoirs: An Example of the Upper Triassic Yanchang Formation in Southeastern Ordos Basin. J. Pet. Sci. Eng. 2020, 195, 107596. [Google Scholar] [CrossRef]
  58. Liu, M.; Xiong, C. Diagenesis and Reservoir Quality of Deep-Lacustrine Sandy-Debris-Flow Tight Sandstones in Upper Triassic Yanchang Formation, Ordos Basin, China: Implications for Reservoir Heterogeneity and Hydrocarbon Accumulation. J. Pet. Sci. Eng. 2021, 202, 108548. [Google Scholar] [CrossRef]
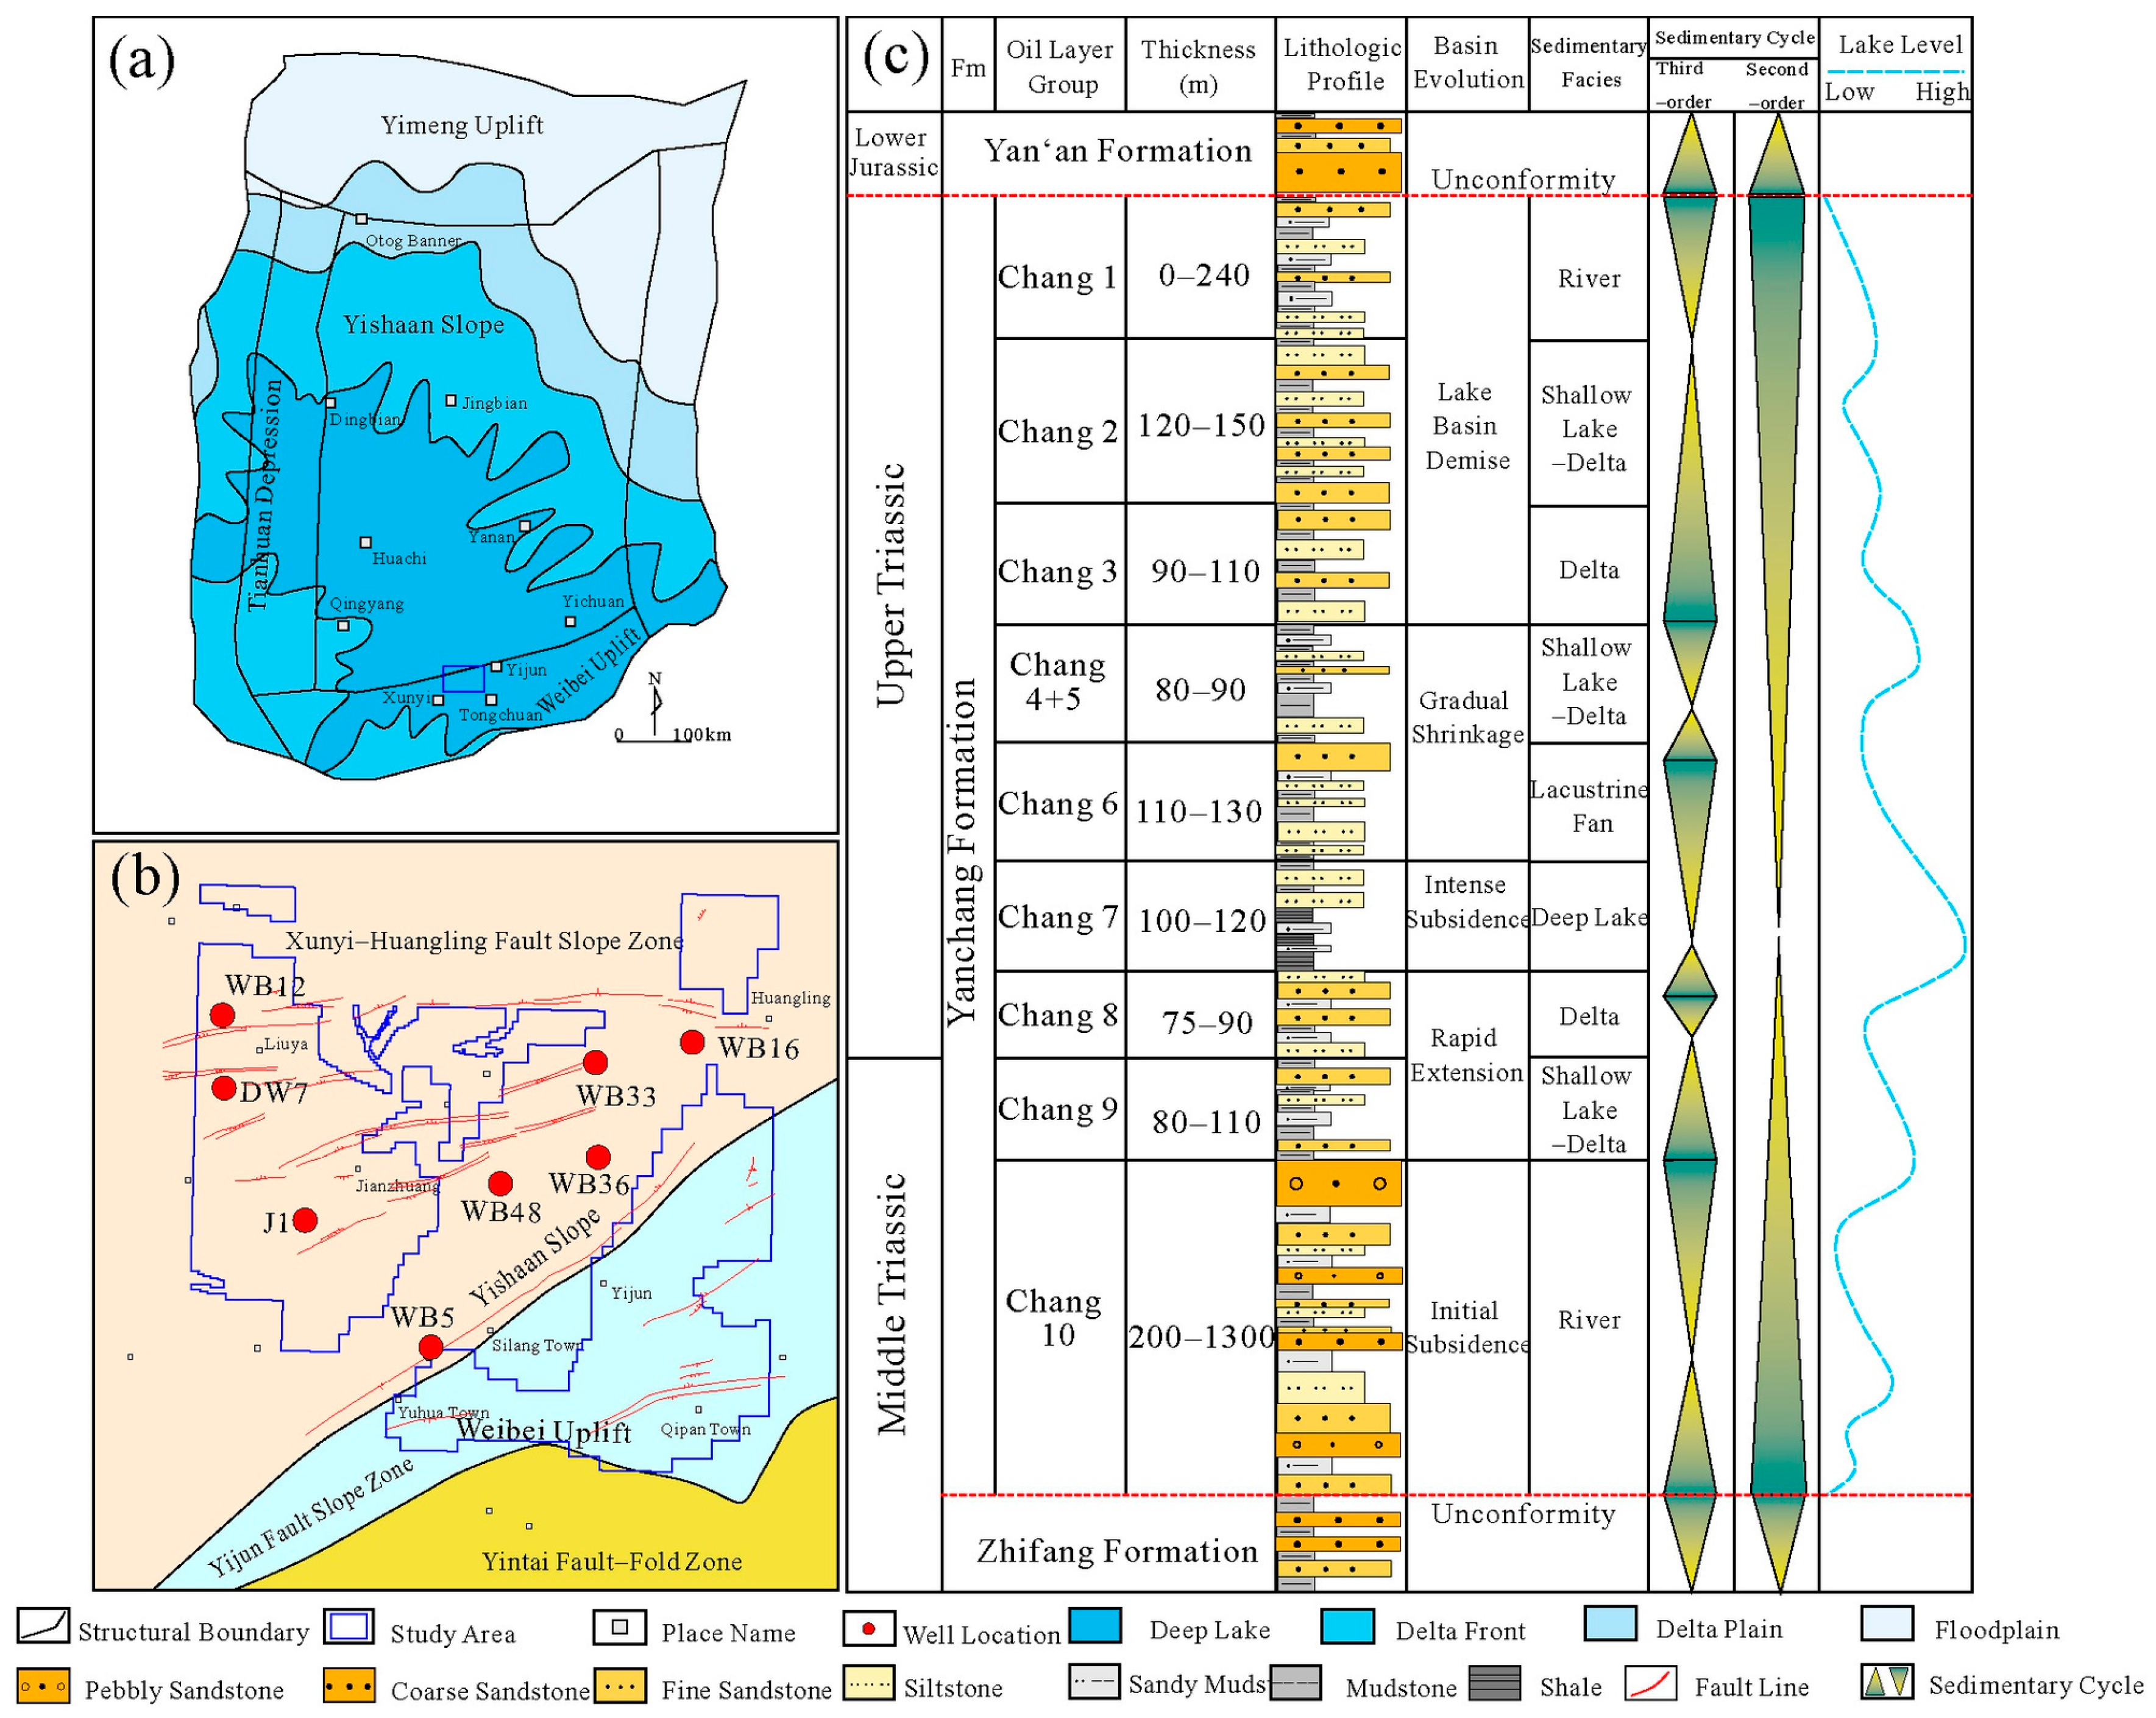
Figure 1. Structural stratigraphic characteristics of the study area. (a) Tectonic location of the Xunyi exploration area; (b) sampling well locations; (c) comprehensive stratigraphic characteristics of the Triassic Yanchang Formation.
Fractalfract 10 00425 g001
Figure 2. Core characteristics and ternary diagrams of the Yanchang Formation in the Xunyi exploration area, Ordos Basin. (a) Light gray fine sandstone, Chang 3, WB16, 203.71 m; (b) lithological ternary diagram of Chang 3; (c) light gray fine sandstone with flow disturbance phenomena, Chang 6, J1, 920.97 m; (d) lithological ternary diagram of Chang 6; (e) gray argillaceous siltstone with flow disturbance phenomena, Chang 7, DW7, 1288.09 m; (f) lithological ternary diagram of Chang 7; (g) light gray fine sandstone with muddy bands and fractures, Chang 8, DW7, 1319.18 m; (h) Lithological ternary diagram of Chang 8.
Fractalfract 10 00425 g002
Figure 3. Pore characteristics of samples from the Yanchang Formation in the Xunyi exploration area from cast thin sections. (a) Development of intragranular dissolution pores, Chang 3, WB16, 305.54 m; (b) development of abundant intergranular pores, Chang 3, WB16, 306.28 m; (c) intergranular pores observed with calcite cement and clay matrix infilling, Chang 3, WB16, 303.43 m; (d) development of intragranular dissolution pores, Chang 6, WB33, 609.03 m; (e) development of intragranular dissolution pores, Chang 6, WB33, 606.20 m; (f) intergranular pores filled with bitumen and feldspar replaced by calcite, Chang 6, WB33, 610.75 m; (g) development of intergranular dissolution pores, Chang 7, WB48, 829.70 m; (h) intergranular pores filled with bitumen and presence of quartz overgrowth, Chang 7, WB48, 636.30 m; (i) development of intragranular dissolution pores, Chang 7, WB48, 638.85 m; (j) development of intragranular dissolution pores and feldspar replaced by calcite, Chang 8, WB33, 1320.68 m; (k) development of intragranular dissolution pores and feldspar replaced by calcite, Chang 8, WB33, 1321.85 m; (l) development of minor primary pores and intragranular dissolution pores with high feldspar content, Chang 8, WB12, 1299.19 m.
Fractalfract 10 00425 g003
Figure 4. Scanning electron micrographs (SEM) showing pore structure and mineral characteristics of Yanchang Formation samples in the Xunyi exploration area. (a): Intergranular pores with kaolinite fill and quartz overgrowth, Chang 3, WB16, 248.70 m; (b) intercrystalline pores; book-like kaolinite and filamentous illite, Chang 3, WB16, 251.70 m; (c) residual intergranular pores with secondary quartz and kaolinite aggregates, Chang 3, WB16, 248.70 m; (d) intergranular pores filled with illite and microcrystalline/secondary quartz, Chang 6, WB36, 482.19 m; (e) intergranular pores containing bitumen and secondary quartz crystals, Chang 6, WB36, 485.14 m; (f) filamentous illite with bitumen staining and stepped feldspar overgrowth, Chang 6, WB36, 484.61 m; (g) intergranular and dissolution pores filled with secondary albite and illite; Chang 7, WB48, 833.03 m; (h) intergranular pores filled with dolomite crystals and illite aggregates, Chang 7, WB48, 833.03 m; (i) secondary quartz and calcite fill; intercrystalline micro-fractures present, Chang 7, WB48, 833.03 m; (j) bedding-parallel micro-fractures with oriented, scaly platy clay minerals, Chang 8, WB12, 1299.46 m; (k) intergranular dissolution pores with filamentous illite coating grains, Chang 8, WB12, 1302.50 m; (l) intergranular pores filled with flaky chlorite aggregates, Chang 8, WB12, 1322.80 m.
Fractalfract 10 00425 g004
Figure 5. Rock composition and clay mineral composition at different depths in the Yanchang Formation, Xunyi exploration area, Ordos Basin. (a1d1) Rock composition of Chang 3 and Chang 6–Chang 8; (a2d2) clay mineral composition of Chang 3 and Chang 6–Chang 8.
Fractalfract 10 00425 g005
Figure 6. Comparison of HPMI characteristic curves of sandstone pore structures in the Yanchang Formation, Xunyi exploration area, Ordos Basin. (a) Chang 3; (b) Chang 6; (c) Chang 7; (d) Chang 8.
Fractalfract 10 00425 g006
Figure 7. Comparison of pore size distribution (PSD) characteristics of sandstones in the Yanchang Formation, Xunyi exploration area, Ordos Basin. (a,b) Chang 3; (c,d) Chang 6; (e,f) Chang 7; (g,h) Chang 8.
Fractalfract 10 00425 g007
Figure 8. Comparative analysis of reservoir physical properties and pore-throat structure characteristics in the Yanchang Formation, Xunyi exploration area, Ordos Basin. (a) Porosity; (b) permeability; (c) maximum mercury saturation; (d) median capillary pressure; (e) maximum pore-throat radius; (f) pore-throat distribution heterogeneity; (g) total pore volume; (h) average pore size; (i) total pore surface area.
Fractalfract 10 00425 g008
Figure 9. Multifractal characteristic spectra of the Yanchang Formation in the Xunyi exploration area, Ordos Basin. (a1d1) Response curves of generalized fractal dimension Dq versus moment order q for Chang 3 and Chang 6–Chang 8; (a2d2) relationship between multifractal spectrum f(α) and singularity exponent α for Chang 3 and Chang 6–Chang 8.
Fractalfract 10 00425 g009
Figure 10. Patterns of multifractal singularity spectrum width Δα, Hurst index, and Rd versus macroscopic petrophysical properties of sandstones in the Yanchang Formation, Xunyi exploration area, Ordos Basin. (ac) Porosity; (df) permeability.
Fractalfract 10 00425 g010
Figure 11. Relationship between pore structure characteristics and multifractal singularity spectrum width Δα and Hurst index for sandstones in the Yanchang Formation, Xunyi exploration area, Ordos Basin. (a) Δα vs. pore volume; (b) Δα vs. surface area; (c) Δα vs. pore size; (d) Hurst vs. pore volume; (e) Hurst vs. surface area; (f) Hurst vs. pore size.
Fractalfract 10 00425 g011
Figure 12. Correlation analysis between multifractal singularity spectrum width Δα and mineral composition in the Yanchang Formation, Xunyi exploration area, Ordos Basin. (a) Chang 3; (b) Chang 6; (c) Chang 7; (d) Chang 8.
Fractalfract 10 00425 g012
Figure 13. Relationships between permeability and porosity, as well as average pore diameter, for the Yanchang Formation in the Xunyi exploration area, Ordos Basin. (a) Porosity; (b) Average pore size.
Fractalfract 10 00425 g013
Figure 14. Cross-plot of intergranular volume and cement content for sandstones in the Yanchang Formation, Xunyi exploration area, Ordos Basin.
Fractalfract 10 00425 g014
Figure 15. Burial and pore evolution history of the Xunyi exploration area, Ordos Basin.
Fractalfract 10 00425 g015
Disclaimer/Publisher’s Note: The statements, opinions and data contained in all publications are solely those of the individual author(s) and contributor(s) and not of MDPI and/or the editor(s). MDPI and/or the editor(s) disclaim responsibility for any injury to people or property resulting from any ideas, methods, instructions or products referred to in the content.