Article

Calibrated Multi-Method Fractal Characterization of Full-Scale Pore Structure and Geological Controls in Deep Anthracite: Case Study from Daning–Jixian Block, Ordos Basin
1
School of Energy Resources, China University of Geosciences (Beijing), Beijing 100083, China
2
Beijing Key Laboratory of Geology Evaluation and Development of Unconventional Natural Gas, China University of Geosciences (Beijing), Beijing 100083, China
3
Oil Production Plant 10 of PetroChina Changqing Oilfield Company, Qingyang 745100, China
*
Author to whom correspondence should be addressed.
Fractal Fract. 2026, 10(7), 443; https://doi.org/10.3390/fractalfract10070443
Submission received: 5 June 2026 / Revised: 26 June 2026 / Accepted: 26 June 2026 / Published: 29 June 2026

Abstract

Deep coal reservoirs commonly exhibit strong multiscale heterogeneity, which directly affects coalbed methane (CBM) storage, diffusion, and flow. In this study, deep No. 8 coal samples from the Daning–Jixian block, Ordos Basin, were comprehensively and quantitatively characterized using low-pressure CO2 adsorption, low-temperature N2 adsorption, mercury intrusion porosimetry (MIP), and nuclear magnetic resonance (NMR). A method-constrained calibration framework was developed to assign reliable fractal dimensions to different pore-size intervals and to calculate a volume-weighted comprehensive fractal index. The scale-dependent pore structure was evaluated, and its relationships with coal quality, maceral composition, and maximum vitrinite reflectance (Ro,max) were analyzed. The results show that deep anthracite has a trimodal pore-size distribution, with micropores dominating both specific surface area and pore volume. Fractal behavior is strongly scale-dependent, and calibrated full-pore-size fractal dimensions provide a more reliable measure of reservoir heterogeneity than single-method interpretations. Pore development and heterogeneity are closely associated with coalification degree, coal quality, and maceral composition. Ash tends to inhibit pore development, whereas fixed carbon and vitrinite promote micropore development; inertinite mainly contributes to macropores and fractures. These findings provide a quantitative basis for evaluating pore-structure heterogeneity and optimizing deep CBM reservoir development.

1. Introduction

Against the global transition toward clean and low-carbon energy, unconventional natural gas resources have attracted increasing attention [1,2]. In this context, CBM stands out as a key unconventional resource, contributing to greenhouse gas mitigation and playing an important role in energy security [3,4]. While China is endowed with abundant CBM resources, the efficient development of deep CBM reservoirs (depths > 1500 m) remains challenging because of their complex structures and low-porosity, low-permeability properties [5]. The adsorption, diffusion, and flow behaviors of CBM are governed by the complexity of the coal reservoir’s pore and fracture system, making pore structure a key geological factor controlling both resource occurrence and reservoir productivity [6,7].
In recent years, advanced characterization techniques such as scanning electron microscopy (SEM), atomic force microscopy (AFM), gas adsorption, MIP, NMR, small-angle neutron scattering (SANS), and micro/nano CT have been widely applied in reservoir pore-structure research [8,9,10,11,12]. Integrated multi-method characterization has become the mainstream approach for describing the multiscale features of pore systems [13,14,15]. According to the International Union of Pure and Applied Chemistry (IUPAC) standards, the pore structure of coal can be classified into micropores (<2 nm), mesopores (2–50 nm), and macropores (>50 nm) [16,17,18]. Previous studies have shown that, with increasing coal maturity, mesopore development shows no significant pattern. In contrast, micropore-specific surface area and pore volume first decrease and then increase with coal maturity [19,20,21], whereas pore-structure evolution is also influenced by reservoir properties, coal macrolithotype, and coal composition [22,23]. Previous studies have provided important insights into pore structures of coal reservoirs, but most full-scale fractal interpretations remain method-dependent because each experimental technique is governed by a different physical principle and applicable pore-size range.
The combined effects of deep high-temperature and high-pressure conditions and continued coalification often lead to a coal reservoir pore structure dominated by micropores and macropores, with poorly developed mesopores [24,25]. Such pore structures may form barriers to gas migration, thereby constraining CBM desorption efficiency and production capacity [26]. Traditional Euclidean geometry cannot adequately describe or quantify such complex pore systems exhibiting self-similarity, nonlinearity, and scale invariance [27,28]. Fractal theory provides an effective approach for quantifying pore surface roughness, structural complexity, and spatial filling heterogeneity [29]. Currently, fractal theory has been extensively applied to coal pore-structure research, yielding various characterization models and methods. These include the Frenkel–Halsey–Hill (FHH) model based on gas adsorption isotherms, the Menger sponge model based on volume filling assumptions, and the box counting method based on digital image processing [30,31,32]. However, most studies have focused on fractal dimensions derived from individual methods, making it difficult to characterize the complexity of full-scale pore structure distribution in coal. Research indicates that fractal dimension is closely related to key physical properties of coal, such as adsorption performance and permeability. These findings provide new insights and technical support for revealing the multiscale pore-structure characteristics of coal from a nonlinear perspective and achieving precise reservoir evaluation [33,34].
Previous multifractal studies have substantially advanced the quantitative characterization of coal pore heterogeneity. Quan et al. established a full-scale multifractal framework for middle- to high-rank coal reservoirs and linked pore heterogeneity to permeability modeling [35]. Li et al. applied multiple fluid-intrusion methods and multifractal theory to evaluate multiscale pore-structure heterogeneity in high-rank coal reservoirs [36]. Zhang et al. compared multifractal parameters derived from MIP and low-pressure N2 adsorption and found that the parameters obtained from different methods were not directly correlated [37]. However, these studies generally focused on multifractal parameters derived from individual or directly combined datasets, whereas the differences in measurement principles, pore-size accessibility, fitting stability, and physical applicability among different methods were not explicitly constrained before cross-scale integration. In addition, the geological controls of coal quality, maceral composition, mineral content, and thermal maturity on calibrated full-pore-size heterogeneity remain insufficiently clarified.
Therefore, this study integrates low-pressure CO2 adsorption, low-temperature N2 adsorption, MIP, and NMR to establish a method-constrained calibration framework for full-pore-size fractal characterization of deep anthracite. Unlike previous multifractal studies that mainly focused on multifractal parameters derived from individual or directly combined datasets, this study first constrains the applicable pore-size interval of each method using fitting quality, physical plausibility, and pore-size applicability, and then calculates a volume-weighted comprehensive fractal index, DM. This study aims to establish a calibrated full-pore-size fractal framework for deep anthracite. Specifically, we characterize pore-size distribution, calibrate interval-specific fractal dimensions, compare the index with single-method metrics, evaluate the sensitivity of DM to fractal dimension parameters and pore-volume fractions, and clarify the geological controls of coal quality, maceral composition, porosity, and thermal maturity on full-scale heterogeneity. The results are expected to improve the comparability and physical interpretability of fractal characterization in deep coal reservoirs and provide a reference for deep anthracite reservoir assessment.

2. Experimental Samples and Methods

2.1. Experimental Samples

The samples used in this study were collected from the Daning–Jixian block on the southeastern margin of the Ordos Basin, all of which are anthracite. The region is characterized by a large monocline dipping from east to west, with complex surface outcrops and prominent fold structures. The study area possesses well developed Paleozoic, Mesozoic, and Cenozoic stratigraphic sequences. The deep No. 8 coal seam in the study area exhibits a gently dipping monocline structure trending northwest with poorly developed faults. It is the main target interval for current CBM exploration and development in the block. Eight representative samples were selected, and their basic properties are listed in Table 1.

2.2. Experimental Methods

2.2.1. Pore-Structure Characterization Methods

Adsorption experiments: For low-pressure CO2 and low-temperature N2 adsorption experiments, coal samples underwent vacuum degassing at 105 °C for 12 h to remove moisture. CO2 adsorption measurements were conducted at 273 K in accordance with GB/T 21650.3–2011 [38]. The N2 adsorption–desorption measurements were conducted at 77 K in accordance with GB/T 21650.2–2008 [39].
MIP experiment: MIP measurements were performed using an AUTOPORE 9505 mercury porosimeter (Quantachrome Instruments, Boynton Beach, FL, USA) in accordance with GB/T 21650.1–2008 [40], after drying at 105 °C for 8 h. The instrument chamber was maintained under vacuum throughout the test. In this study, all samples were inspected after drying, and damaged samples were excluded or retested to minimize potential drying-induced errors.
NMR experiment: Low-field NMR measurements were performed on saturated, piston-shaped coal samples using a Niumag NMR scanning system (Suzhou Niumag Analytical Instrument Co., Ltd., Suzhou, China). By processing and analyzing NMR relaxation signals, the T2 distribution and signal intensity were obtained [41]. Subsequently, the pore-size distribution curves were derived.

2.2.2. Fractal Models and Calculation Methods

(1)
MIP
In this study, pore radius was related to mercury intrusion pressure using the Washburn equation, whereas the fractal relationship between mercury saturation and intrusion pressure was interpreted using a Menger sponge fractal model [42]. Accordingly, the MIP-derived fractal dimension can be expressed as:
lg 1 − S = D Z − 3 lg P − D Z − 3 lg P m
where S is mercury saturation expressed as a fraction. P is mercury intrusion pressure, MPa. Pm is pressure corresponding to the maximum pore size, MPa. DZ is the MIP-derived pore fractal dimension.
(2)
N2 adsorption
Methods for calculating fractal dimensions based on low-temperature N2 adsorption data include thermodynamic methods, fractal Langmuir models, fractal BET models, and fractal FHH models. The fractal dimension of N2 adsorption calculated using the FHH model satisfies the following equation:
ln V / V 0 = D Y − 3 ln ln P 0 / P + C
where V/V0 is the relative adsorption amount at equilibrium pressure P. C is a constant. P0 is the saturated vapor pressure of gas adsorption, MPa. DY is the fractal dimension of the pore structure for N2 adsorption data.
(3)
CO2 adsorption
Previous studies indicate that adsorbate molecules in micropores typically fill the pores. The Sierpinski fractal model was employed in this study to calculate the fractal dimension of CO2 adsorption, which satisfies the following equation:
ln V = ( 3 − D X ) ln P − P t + C
where P is the experimental pressure, MPa. Pt is the threshold pressure, MPa. V is the adsorption volume, cm3/g. C is a constant. DX is the fractal dimension derived from the CO2 adsorption data.
(4)
NMR
Within the NMR theoretical framework, the T2 spectrum data of coal samples can be used to calculate the fractal characteristics of pore distribution. The relationship between the cumulative pore-volume fraction and relaxation time can be expressed as:
log V ( c ) = ( 3 − D N ) log T 2 + ( D N − 3 ) log T 2 , max
where V(c) represents the percentage of cumulative pore volume relative to total pore volume when the cumulative transverse relaxation time is less than T2. DN represents the pore fractal dimension. T2,max represents the maximum transverse relaxation time, ms.
To make the calibration procedure reproducible, an explicit acceptance screening criterion was applied prior to the selection of the fractal dimension for each pore-size interval. Fitted results were considered reliable when the coefficient of determination was not lower than 0.90 and the derived fractal dimension fell within the physically meaningful range of 2–3 for a three-dimensional pore system. When several methods covered the same pore-size interval, the method with the highest fitting quality and a physically plausible fractal dimension was selected for the final calibrated framework. Results with a coefficient of determination lower than 0.90 or with fractal dimensions outside the physically meaningful range were retained only for methodological comparison and were not used in the final calculation of DM.

3. Results and Discussion

3.1. Multiscale Pore Network Characteristics and Heterogeneity in Coal

3.1.1. Pore Development and Fractal Characteristics Based on CO2 Adsorption Experiments

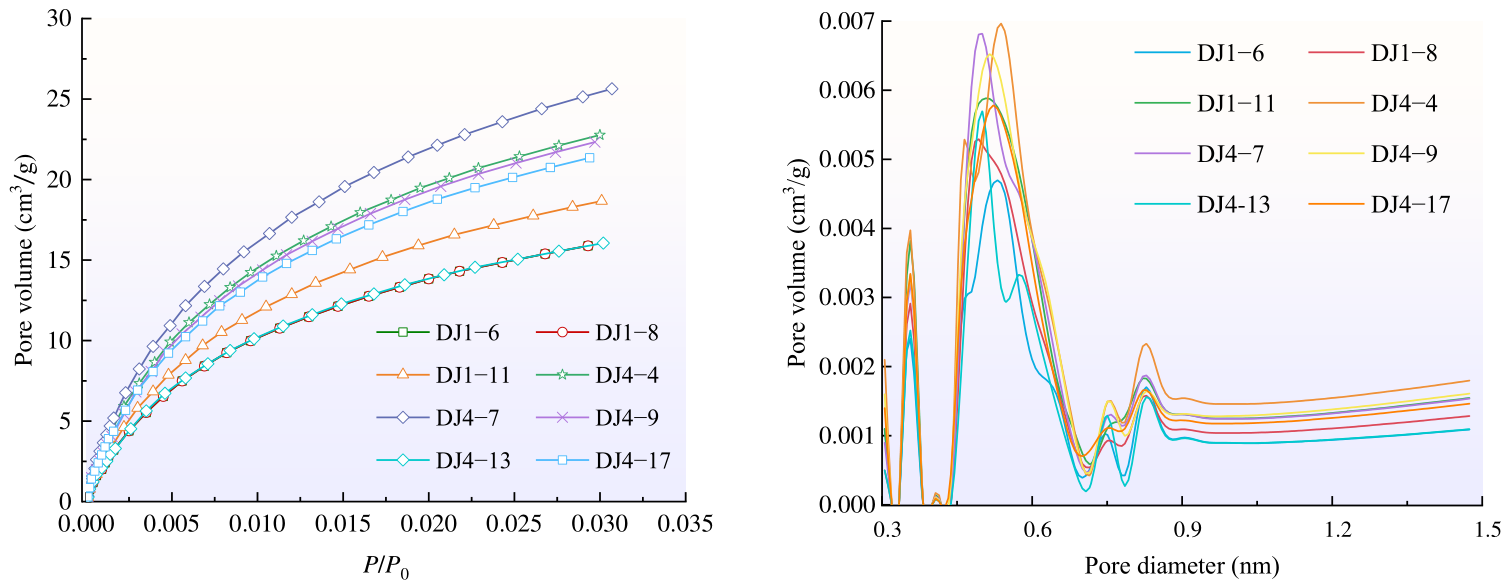
Figure 1 shows the low-pressure CO2 adsorption curves of the samples. CO2 adsorption capacity gradually increases with rising relative pressure. The low-pressure region (P/P0 < 0.01) exhibits an adsorption-dominant zone with relatively high adsorption rates. At higher relative pressure (P/P0 > 0.01), the upward trend in the adsorption rate decelerates, whereas the total adsorption capacity exhibits a slight increase. This behavior is consistent with micropore filling by CO2 molecules. The adsorption curves of all eight samples show a logarithmic trend. Maximum CO2 adsorption capacities ranged from 14.906 to 26.821 cm3/g. Pore-size analysis revealed that when the tested pore-size intervals were roughly equivalent, the stage adsorption volume curves and differential curves of the coal samples largely overlapped. All samples exhibited similar pore-size distribution patterns, with pore-volume contribution generally decreasing as pore size increased. Pore volume in this range was predominantly concentrated between 0.32 and 0.86 nm. This range accounted for 59.48% to 74.65% of the total pore volume, averaging 68.50%.
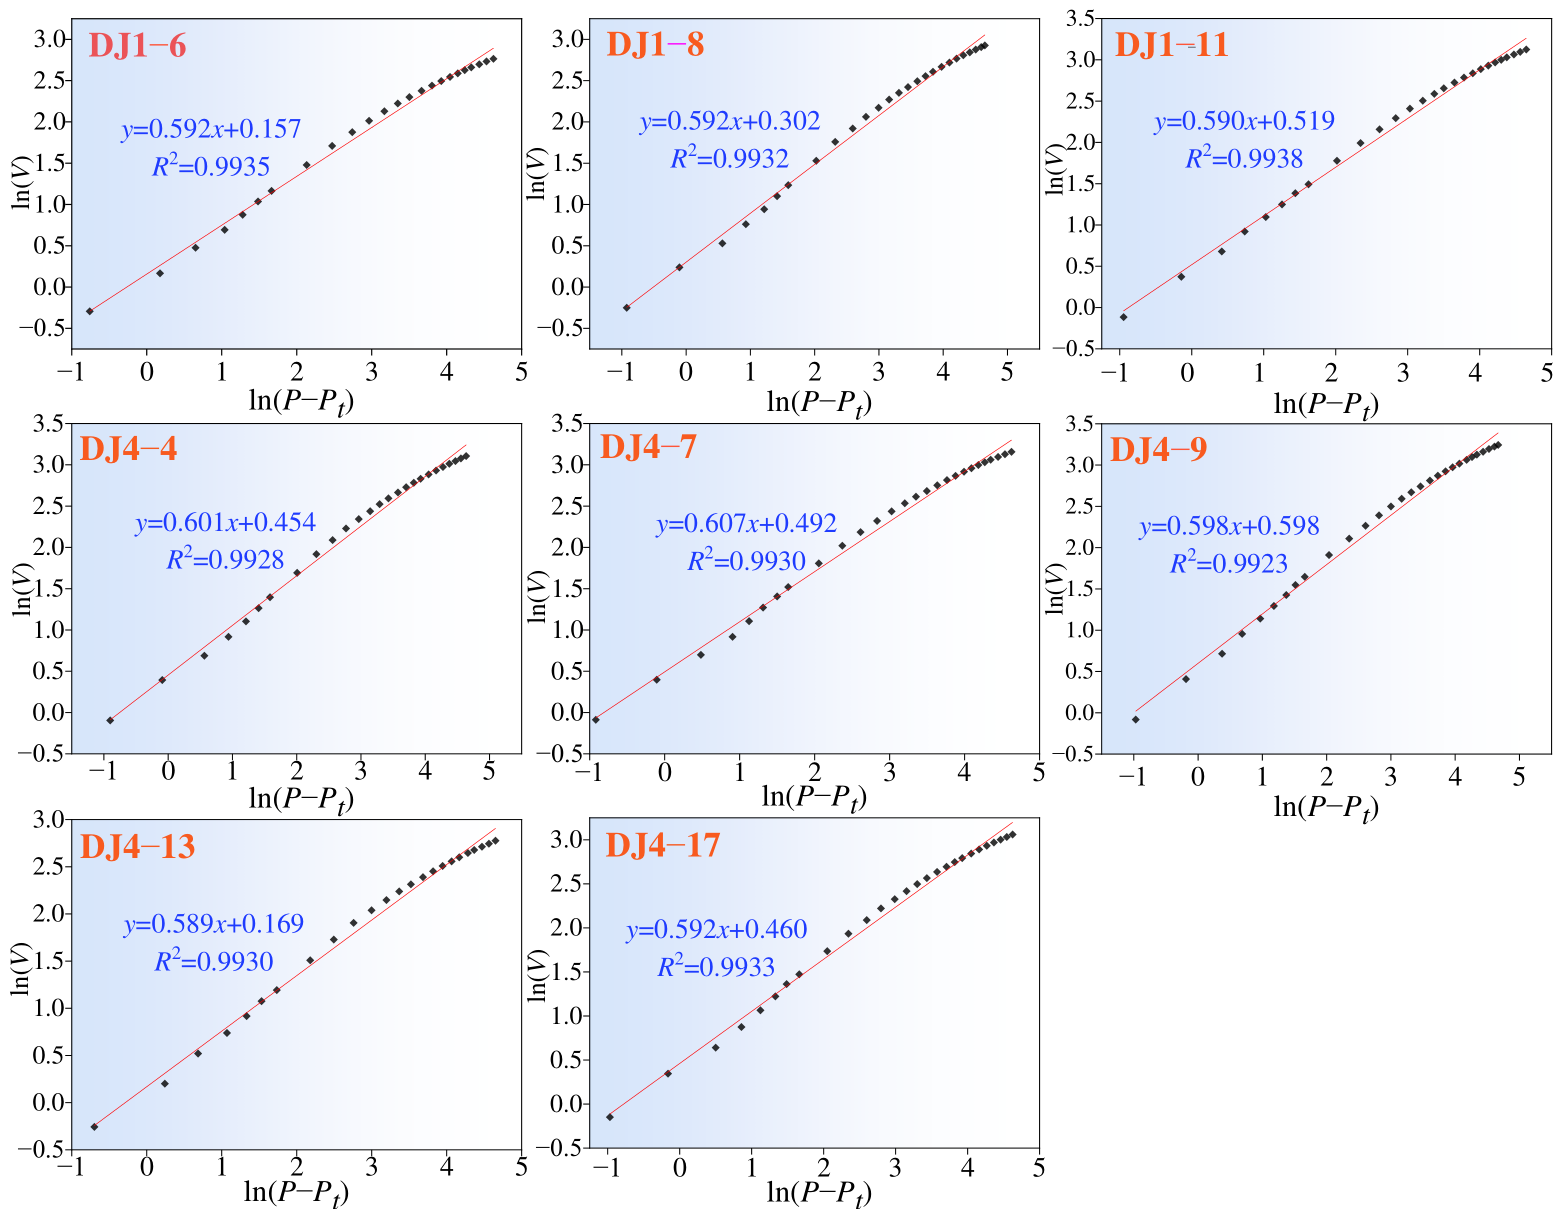
The micropore fractal fitting curves are shown in Figure 2. During CO2 adsorption at 273 K, CO2 molecules are mainly accommodated in micropores by a pore-filling mechanism. To ensure reliable fractal analysis, subsequent analysis was conducted using CO2 adsorption data with a relative pressure P/P0 < 0.02. The pore fractal dimensions calculated based on adsorption experiments are shown in Table 2. The fractal dimension ranged from 2.393 to 2.411, with an average value of 2.400. The coefficient of determination R2 ranged from 0.9923 to 0.9938. Among the samples, DJ4-13 exhibited the highest fractal dimension, while DJ4-7 showed the lowest. However, the overall variation in fractal dimension was minimal. This indicates that the micropore systems of different samples have comparable heterogeneity and broadly similar fractal characteristics.

3.1.2. Pore Development and Fractal Characteristics Based on N2 Adsorption Experiments

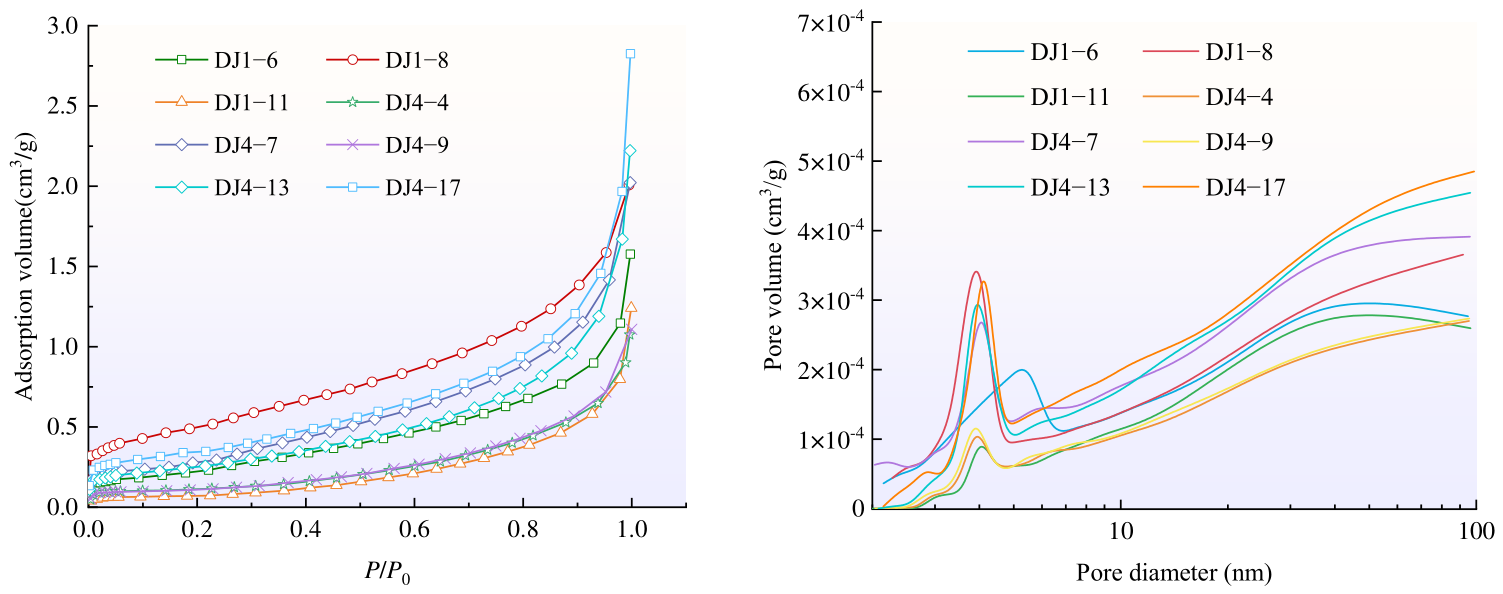
Analysis of the low-temperature N2 adsorption/desorption isotherms (Figure 3) reveals that the N2 adsorption capacity of coal samples ranges from 1.07 to 2.82 cm3/g. The adsorption curves generally exhibit an inverse S-shaped trend. According to IUPAC classification, these coal samples exhibit Type II isotherms [43]. Due to strong interactions between the adsorbate and surface, the N2 adsorption capacity increases rapidly with relative pressure when P/P0 < 0.1, resulting in a convex isotherm. This stage mainly reflects monolayer adsorption and partial micropore filling. As relative pressure increased from 0.1 to 0.9, N2 adsorption increased more slowly, indicating a transition from monolayer to multilayer adsorption. When relative pressure approached 1.0, adsorption increased rapidly again without reaching saturation. As the relative pressure decreased from 1.0 to 0.45, all coal samples exhibited distinct adsorption and desorption branches. This indicates the presence of nanoscale slit-like pores. Below a relative pressure of 0.45, the desorption branch nearly overlapped with the adsorption branch. Based on low-temperature N2 adsorption experiments, the pore-volume range of coal from the study area was determined to be 0.006–0.029 cm3/g, with an average of 0.013 cm3/g.
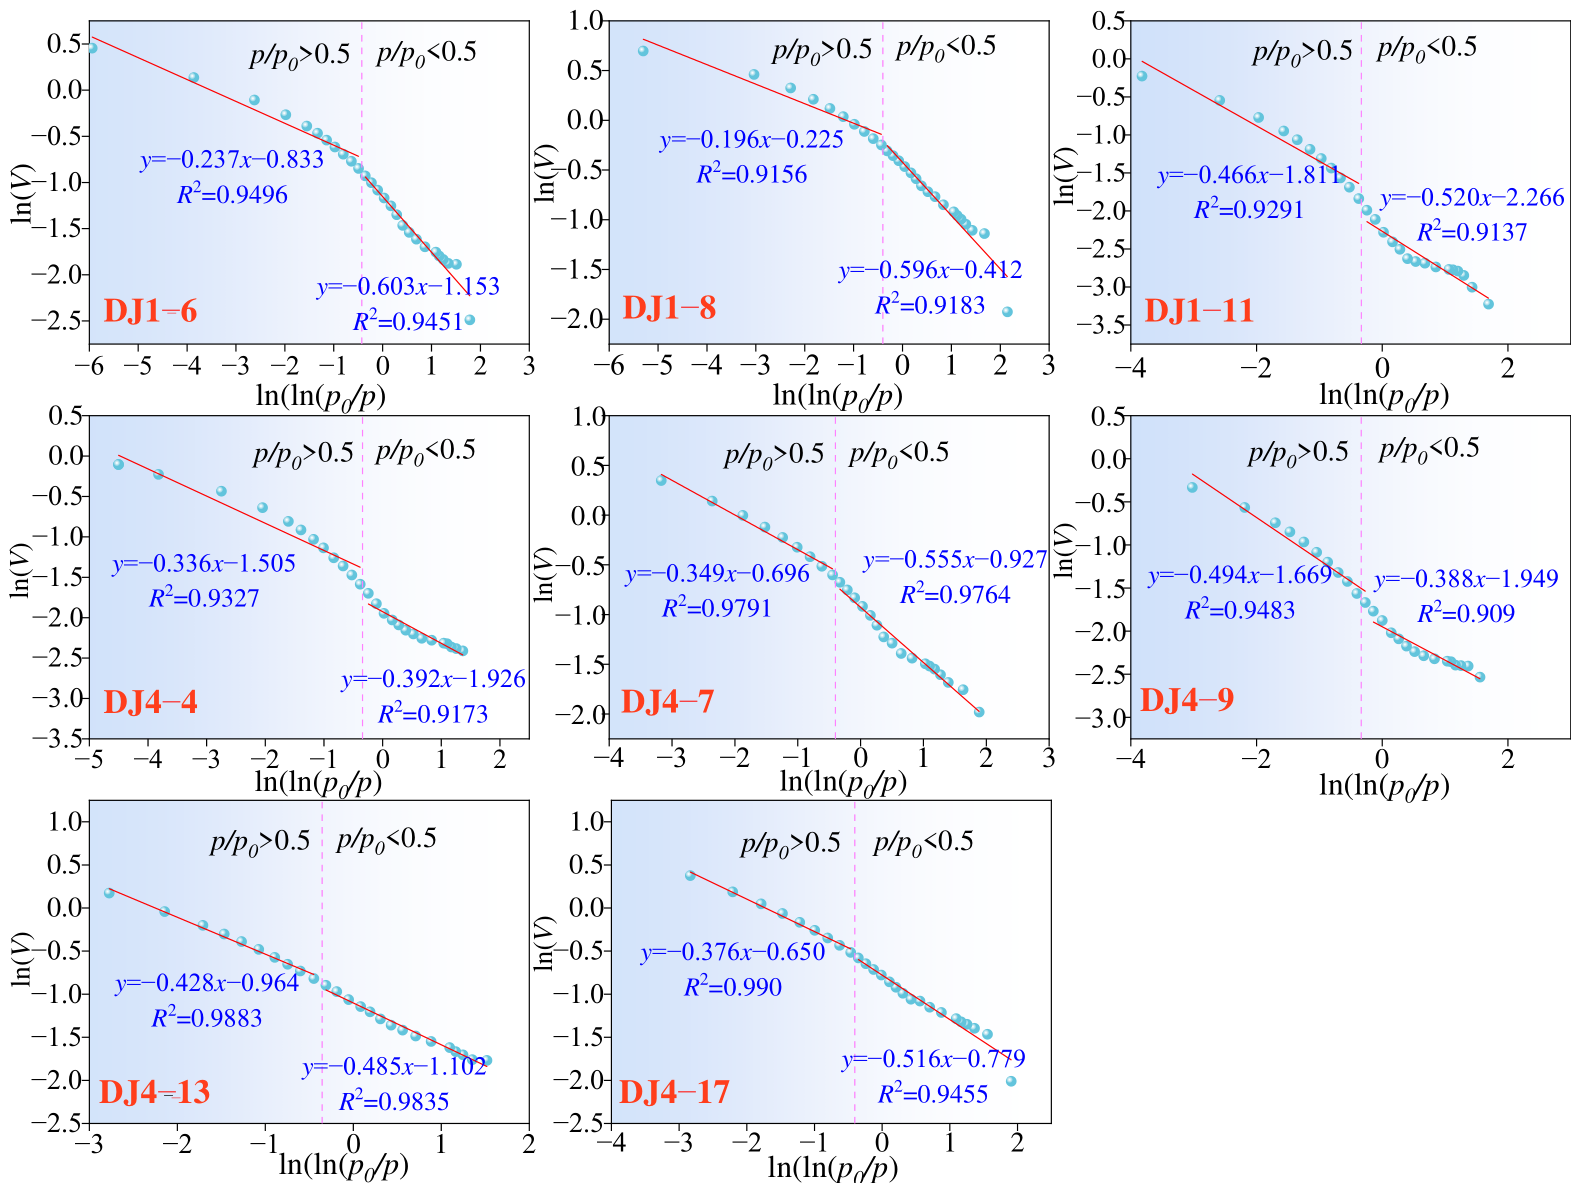
The fractal fitting curves derived from the N2 adsorption data are shown in Figure 4. At low relative pressures, nitrogen molecules predominantly adsorb as monolayers on pore surfaces, primarily governed by van der Waals forces [44]. As relative pressure increases, adsorption transitions to multilayer and pore-filling adsorption. With increasing relative pressure, multilayer adsorption and capillary condensation become increasingly important. Accordingly, the fractal dimensions DY1 and DY2 of the pore structure in the coal reservoir were calculated at P/P0 < 0.5 and P/P0 > 0.5, respectively. DY1 characterizes the fractal dimension of the coal surface, reflecting the roughness of the pore surface. DY2 characterizes the fractal dimension of the pore structure, reflecting the irregularity of the pore structure [29]. The fitted curves show good fitting performance under both high and low relative pressure conditions, indicating clear fractal behavior over the selected pressure intervals. The fractal dimension DY1 ranged from 2.506 to 2.804, wherein sample DJ1-8 exhibited the highest surface roughness of pores. In contrast, the fractal dimension DY2 ranged from 2.397 to 2.612, and sample DJ4-9 showed the strongest heterogeneity of pore structures.

3.1.3. Pore Development and Fractal Characteristics Based on MIP Experiments

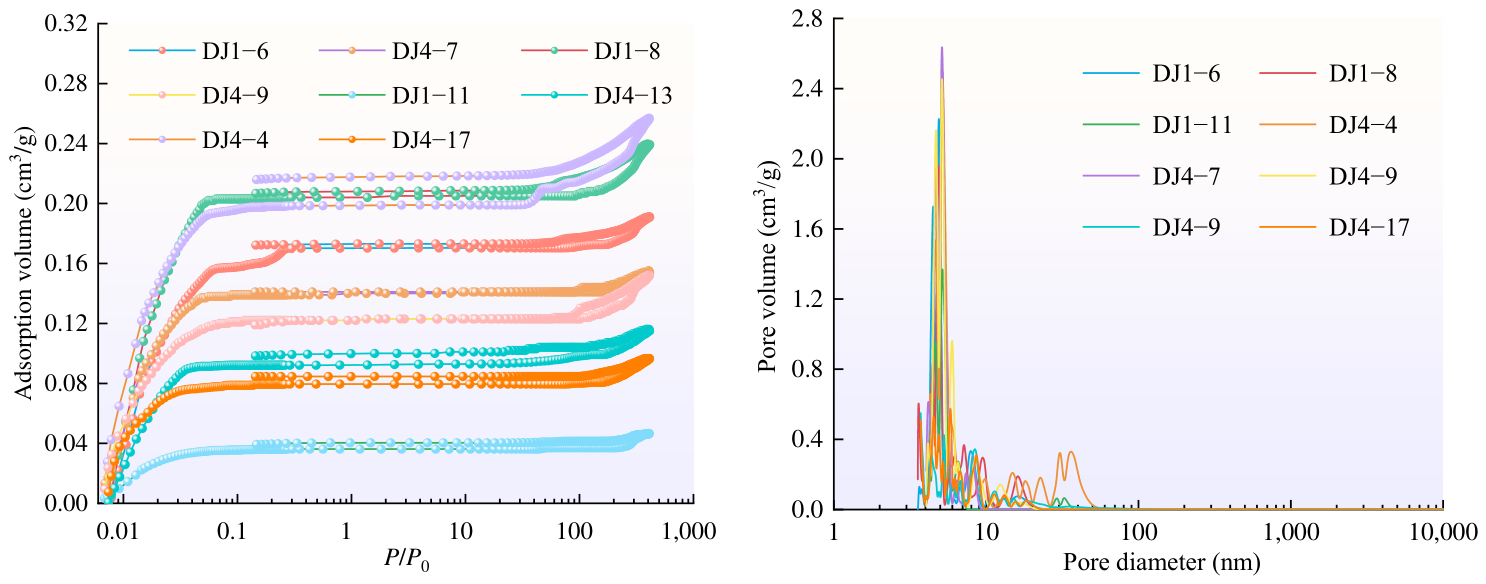
Mercury intrusion–extrusion volumes and pore-size distribution curves of the samples are shown in Figure 5. The mercury intrusion–extrusion data indicate that the samples generally exhibit a characteristic pattern of significant decline followed by gradual stabilization during mercury extrusion. However, the mercury intrusion curves exhibited three pressure-dependent stages: a rapid mercury volume increase at low pressures (<0.05 MPa), a deceleration in mercury volume growth within the medium pressure range (0.05–38 MPa), and a renewed increase in mercury volume beyond 38 MPa. The pore volume of samples ranged from 0.008 to 0.059 cm3/g, with a mean value of 0.031 cm3/g. The variation trends of coal pore volume across different pore-size ranges showed significant differences. Within the pore-size range exceeding 30 nm, the increments in coal pore volume and specific surface area exhibited gradual changes. These patterns indicate that macropores are relatively less developed, whereas nanopores constitute the dominant pore type in the samples.
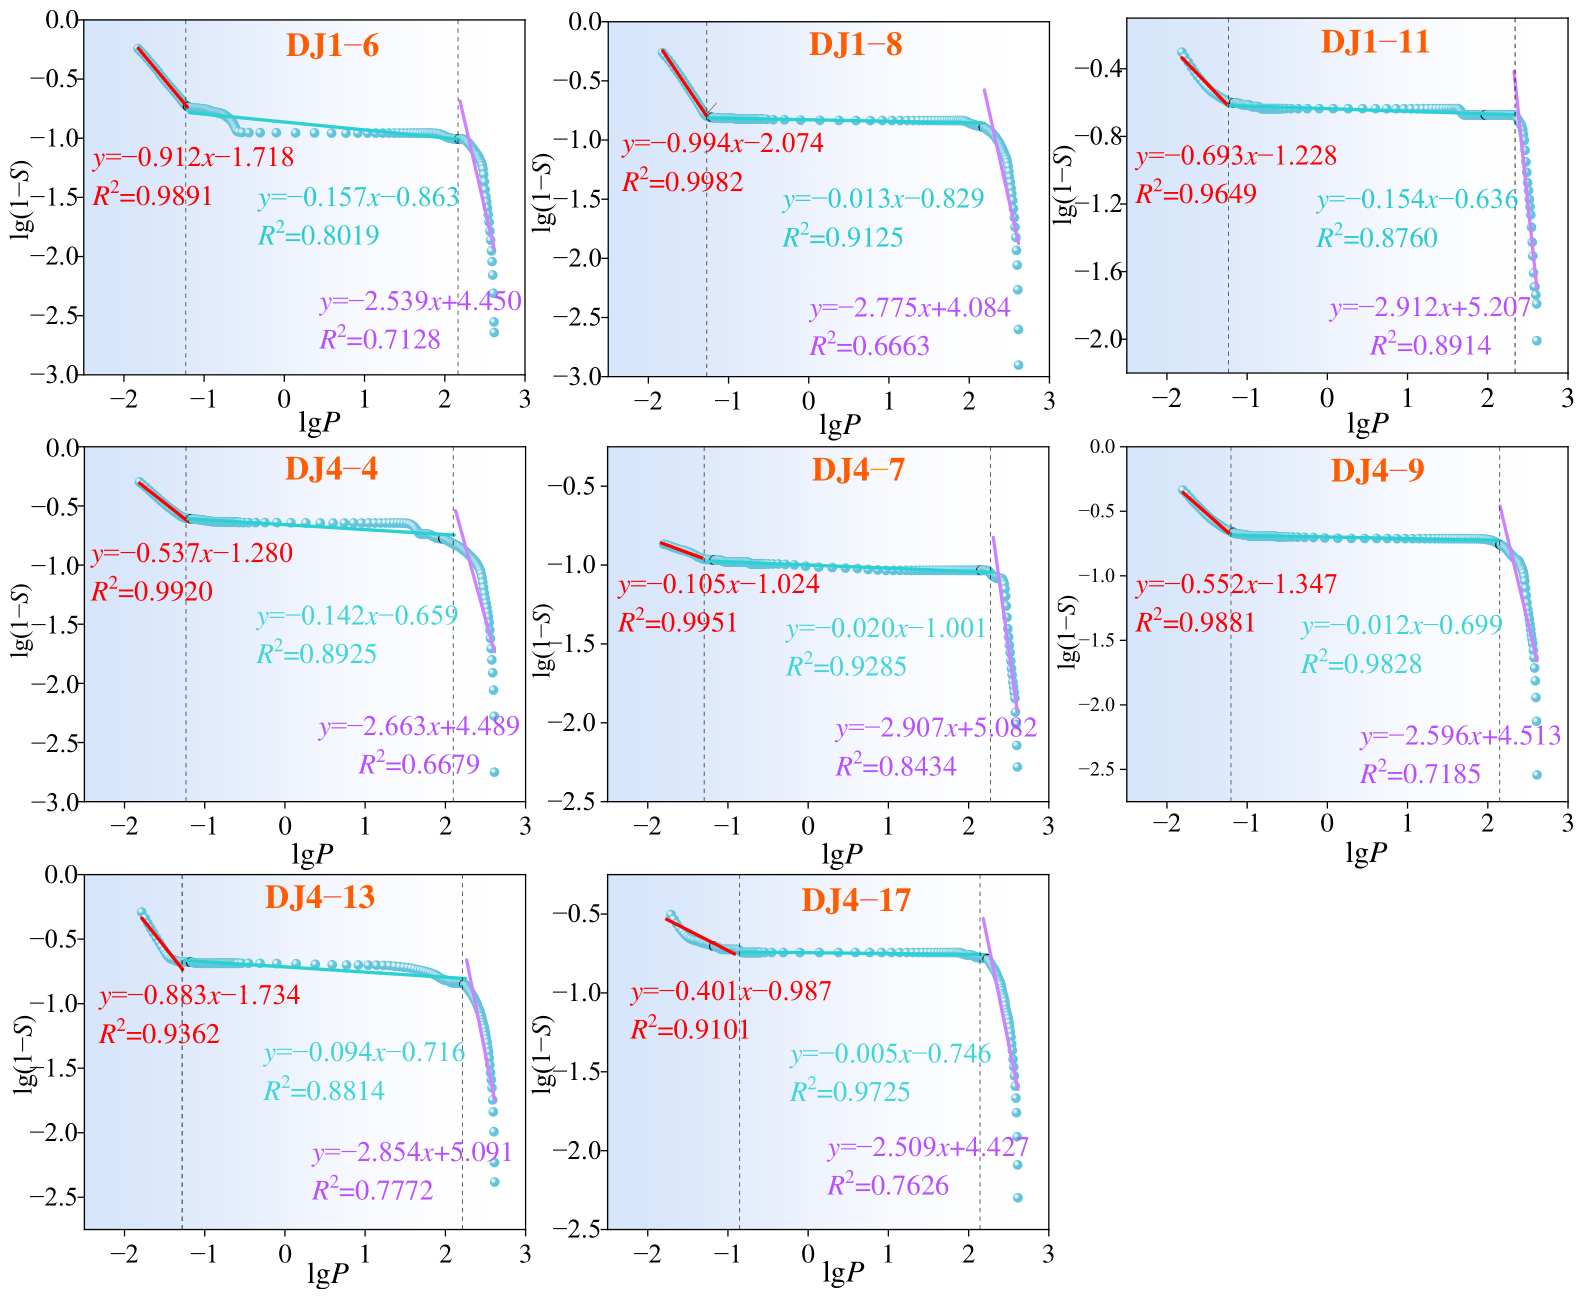
The fractal results and fitting curves of coal samples based on MIP experiments are shown in Table 3 and Figure 6, respectively. The MIP fractal results suggest that the fractal dimensions of pore structures across the eight coal samples were relatively similar. Using critical values at different pore-size scales and inflection points of fractal trends as fractal boundaries, together with established pore-size classification criteria, pores characterized by MIP were categorized into micropores (r < 10 nm), mesopores (10 < r < 100 nm), and macropores (r > 100 nm). Thus, based on MIP experiments, the fractal dimension DZ1 for micropores varied from 0.088 to 0.491, DZ2 for mesopores varied from 2.843 to 2.995, and DZ3 for macropores varied from 2.006 to 2.895. The DZ1 values obtained for r < 10 nm were far below the conventional physically meaningful range of 2–3 for pore systems. These abnormal values should not be interpreted as true fractal characteristics of micropores. Instead, they indicate that the Menger sponge model combined with MIP data is not applicable to this pore-size interval, probably because mercury cannot effectively access nanoscale micropores and because high intrusion pressure may cause pore compression, ink-bottle effects, or structural disturbance. Therefore, DZ1 was excluded from the final calibrated fractal framework. The mesopore fractal dimension obtained from the MIP experiment is the highest. This indicates that mesopores exhibit both greater structural complexity and more pronounced heterogeneity.

3.1.4. Pore Development and Fractal Characteristics Based on NMR Experiments

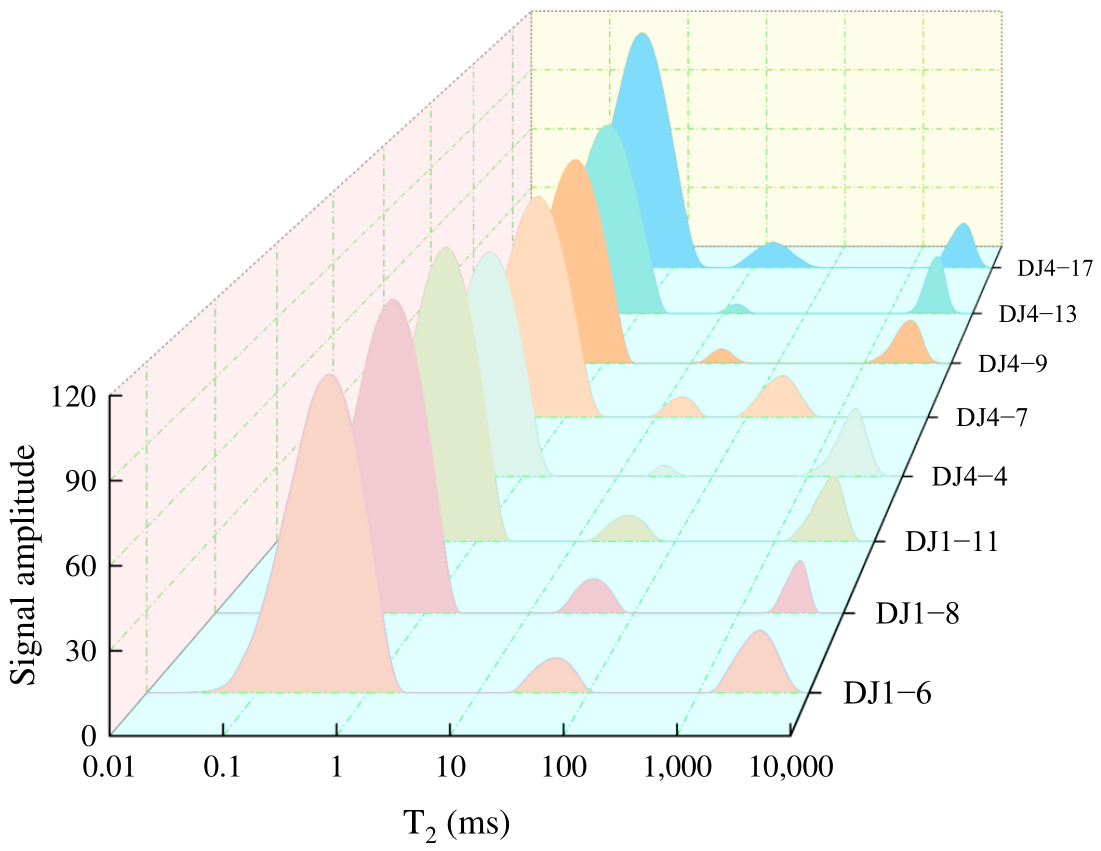
Based on NMR experimental data, the pore spaces were classified into corresponding size intervals: the <10 nm interval represents micropores, the 10 nm–0.1 μm interval corresponds to small pores, the 0.1–1 μm interval to mesopores, and the >1 μm interval to macropores. Additionally, pores smaller than 100 nm are defined as adsorption pores with a critical pore-size of 100 nm [41]. Their development level positively correlates with CBM adsorption/desorption and diffusion capacity. Pores larger than 100 nm are defined as flow pores, whose development directly influences the flow efficiency of CBM. NMR scanning results of study area samples are shown in Figure 7. The T2 spectra reveal trimodal relaxation patterns in the coal samples, indicating a broad pore-size distribution. The peak area for micropores (adsorption pores) is significantly larger than those corresponding to flow pores and fractures. This suggests that adsorption pores dominate the pore structure of the study area samples.
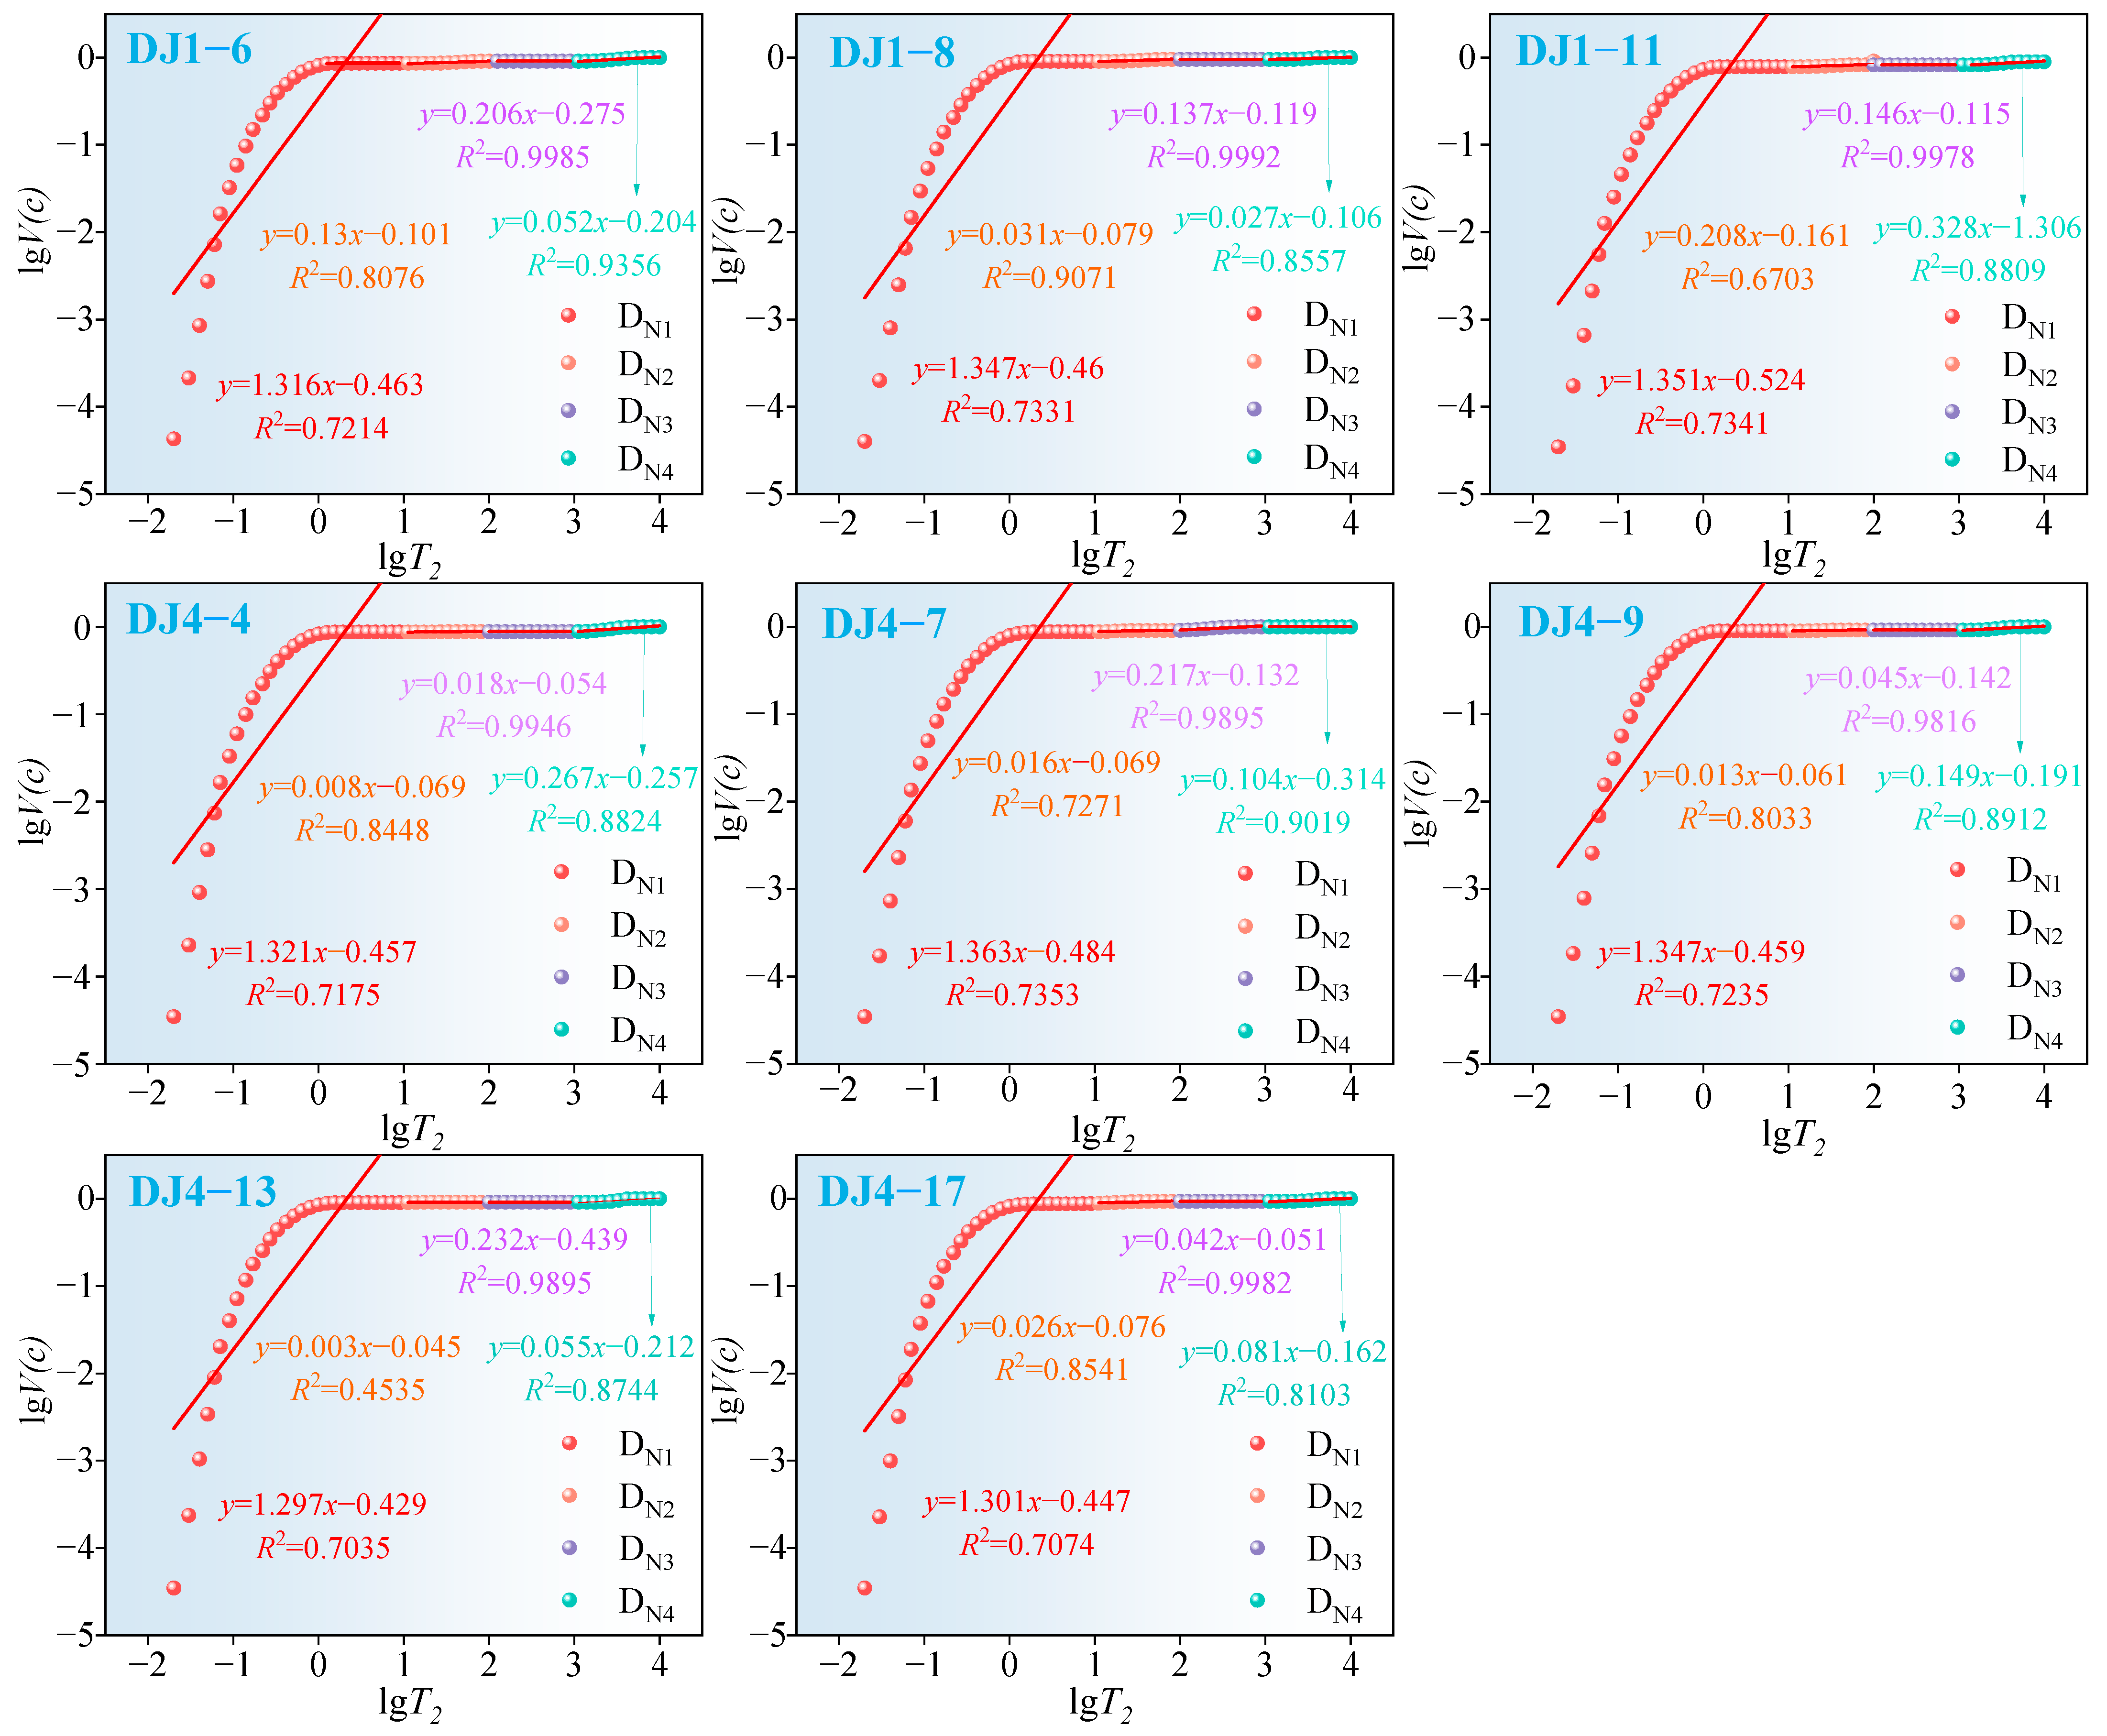
Because a single pore-size parameter cannot fully characterize the pore and fracture system, piecewise fractal analysis based on NMR data was employed in this study to reveal the heterogeneity of pores at different scales in coal samples. Figure 8 shows that the fractal curve exhibits non-linear behavior with distinct inflection points rather than a linear form. All samples exhibited high fitting accuracy for the fractal dimensions of small pores, mesopores, and macropores, demonstrating typical fractal characteristics. The fractal dimension values for micropores deviated from the theoretical range and showed poor fitting, lacking clear fractal features. This is mainly because adsorption forces dominate within micropores, which constrain free fluid flow and molecular diffusion. Consequently, the influence of diffusion relaxation on NMR relaxation times becomes non-negligible, disrupting the sole control of pore geometry over relaxation signals [45]. Therefore, these values should not be interpreted as true fractal dimensions of micropores. Instead, they indicate that the NMR fractal model is not suitable for reliably characterizing micropore-scale heterogeneity in this interval. Based on NMR experiments, the average fractal dimensions of micropores, small pores, mesopores, and macropores were 1.671, 2.945, 2.869, and 2.867, respectively. Within the same sample, the fractal dimension of small pores was the highest, followed by mesopores. This indicates that small pores have the greatest distributional dispersion, rougher pore-throat surfaces, and the strongest heterogeneity. Mesopores show the next level of heterogeneity. Macropores fall between micropores and mesopores in terms of heterogeneity.

3.2. Full-Pore-Size Fractal Dimension Calibration and Evaluation Methodology

3.2.1. Calibration of Full-Pore-Size Fractal Dimensions

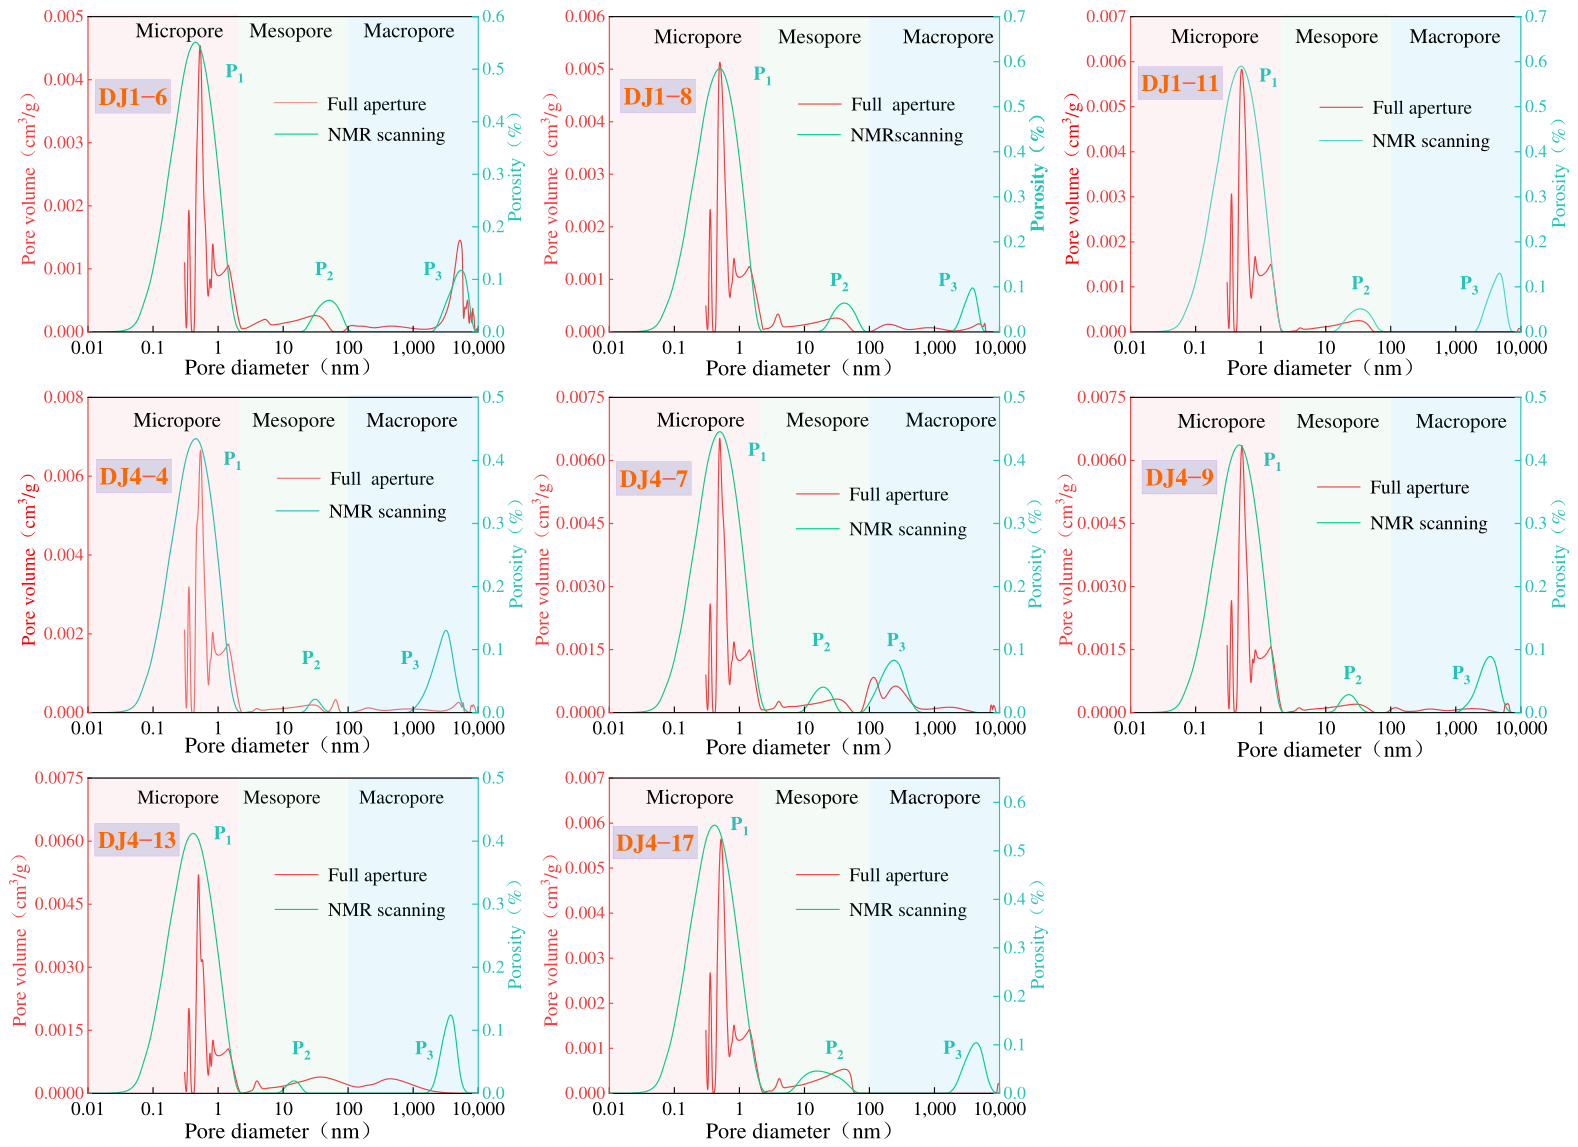
Deep coal reservoirs exhibit pronounced multiscale development of pore and fracture systems. Based on the pore-size distribution characteristics of the study area, the following pore-size classifications were defined: <2 nm as micropores, 2–100 nm as mesopores, and >100 nm as macropores. By converting the T2 distribution of coal samples into equivalent pore-size distribution curves, the integrated full-pore-size distribution curve was compared with the NMR-derived pore-size distribution curve (Figure 9). The two curves showed highly consistent morphology, both exhibiting typical triple-peak distribution characteristics. The characteristic peaks from left to right were labeled as P1, P2, and P3, respectively, with significant differences in peak intensity. Taking sample DJ1-6 as an example: The pore-size distribution range for peak P1 is 0.01–3.53 nm, with a pore-size corresponding to the peak of 0.59 nm. The pore-size distribution range for peak P2 is 17.94–124 nm, with a pore diameter corresponding to the peak of 77.32 nm. The pore-size distribution range for peak P3 is 2156.5–9033.7 nm, with a pore diameter corresponding to the peak of 7690.52 nm. Overall, micropores dominate in all coal samples from the study area. However, differences in pore-structure characteristics exist among different coal samples. These differences may reflect variations in tectonic modification and in situ stress conditions experienced by coal bodies at different stratigraphic levels [46].
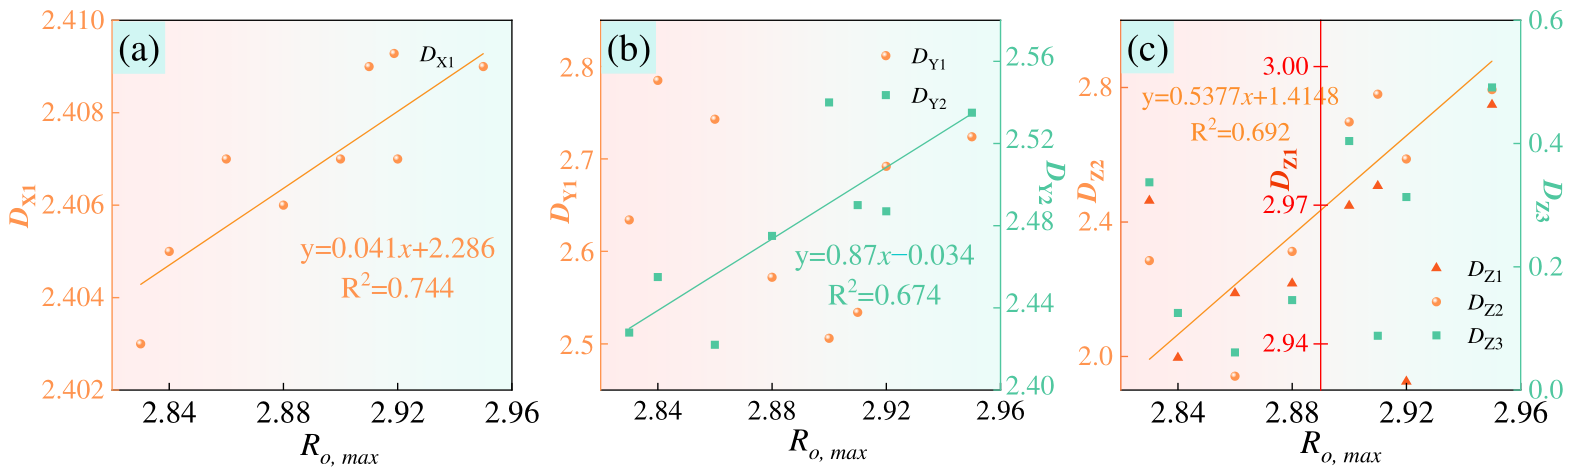
Fractal dimension analysis of pores via MIP revealed high fitting accuracy for pore sizes r > 100 nm, but significantly decreased fitting accuracy for r < 100 nm. Furthermore, mercury penetration pressure exceeding 30 MPa (corresponding to approximately 100 nm pore-size) may cause irreversible damage to coal rock pore structures, leading to distorted characterization results. Therefore, the MIP fractal dimension was effectively limited to the r > 100 nm pore-size range. Simultaneously, low-temperature N2 adsorption and low-pressure CO2 adsorption methods were employed to characterize fractal dimensions in the 2 < r < 100 nm and r < 2 nm ranges, respectively. A preliminary multi-method fractal dimension characterization system covering the entire pore-size spectrum was thus established. To reveal the intrinsic relationship between the fractal dimension of different pore types and coalification, a quantitative relationship between fractal dimension and coalification degree was further established in this study (Figure 10). The results indicate that the micropore fractal dimension exhibits the highest goodness of fit with coalification degree. This suggests that as thermal evolution progresses, the number of micropores in coal samples continuously increases, accompanied by simultaneous enhancements in pore surface complexity and roughness.
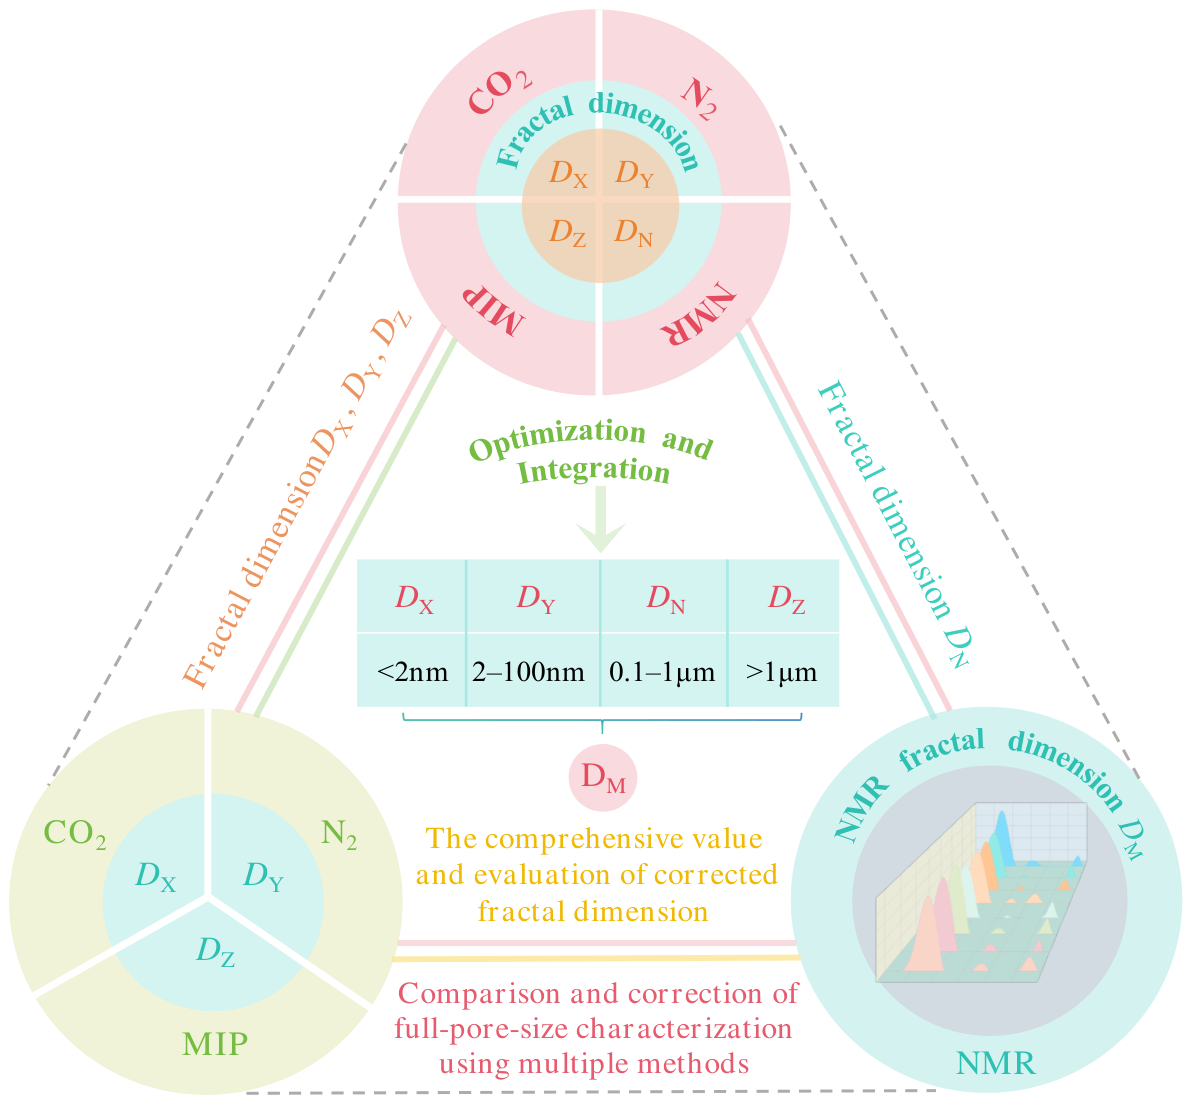
To achieve reliable characterization of the full-scale pore-structure fractal dimension of coal samples, a combined calibration method was proposed in this study, centered on defining dominant pore-size intervals and quantifying fitting accuracy. A schematic of the multi-method calibrated full-pore-size fractal dimension model is shown in Figure 11. This method selects and integrates fractal dimensions across pore-size intervals based on fitting quality and numerical plausibility. By comparing results from NMR with those from adsorption and mercury porosimetry, it prioritizes fractal dimensions with superior fitting accuracy and more reasonable values within the same pore-size range. The results (Table 4) reveal that NMR exhibits a higher goodness of fit within the 0.1–1 μm pore-size range. Its fractal dimension values are consistently stable within the reasonable range of 2–3. Therefore, NMR is adopted to characterize the fractal dimension for this pore-size range. Finally, the multi-method calibrated full-scale pore-structure fractal dimension results are presented in Table 5. After calibration, the fractal dimension fitting quality exceeded 0.9 across all pore-size ranges for all samples. This supports the reliability and internal consistency of the calibrated characterization results. The proposed calibration framework is applicable to coal samples for which the pore-size intervals can be independently constrained by complementary methods and for which the fitted fractal dimensions fall within physically meaningful ranges. Its reliability decreases when one method produces poor fitting quality, mechanically induced pore alteration, or fractal dimensions outside the conventional range. The first step of the calibration was to define the dominant pore-size interval of each method according to both theoretical applicability and fitting quality. The second step was to exclude fractal dimensions that were outside the physically meaningful range or were obtained from pore-size intervals vulnerable to experimental artifacts. The third step was to construct a calibrated full-scale fractal profile by selecting CO2 adsorption for r < 2 nm, N2 adsorption for 2 nm < r < 0.1 μm, NMR for 0.1 < r < 1 μm, and MIP for r > 1 μm. This selection does not imply that the other methods are invalid over their entire measurement ranges but indicates that they were not used for final fractal calibration where their fitting quality or physical plausibility was weaker.
To compare the overall heterogeneity of the laboratory-measured pore system among samples, the comprehensive fractal dimension DM was defined in this study as a characterization index. DM was calculated by weighting the calibrated fractal dimension of each pore-size interval by its corresponding pore-volume fraction, because pore intervals contributing more storage space should exert a larger influence on the bulk heterogeneity index. The weights correspond to the pore-volume fraction of each pore-size interval, calculated as follows:
D M = ∑ D i T i
where DM represents a volume-weighted comprehensive fractal index for comparing bulk pore heterogeneity among samples; Di represents the fractal dimension corresponding to the i-th pore-size segment; and Ti represents the pore-volume fraction corresponding to the i-th pore-size segment. Here, Ti was derived from the integrated full-pore-size distribution after cross-calibration of CO2 adsorption, N2 adsorption, NMR, and MIP data.
Final calibrated fractal dimensions for different pore-size intervals are shown in Table 5. The average fractal dimensions for the study area samples within the pore-size ranges r < 2 nm, 2 nm < r < 0.1 μm, 0.1 < r < 1 μm, and r > 1 μm were 2.404, 2.500, 2.869, and 2.365, respectively. The fractal dimension was highest in the 0.1 < r < 1 μm pore-size range, indicating the most complex pore structure and strongest heterogeneity. The lowest fractal dimension was observed in the r > 1 μm pore-size range, indicating improved connectivity and simpler pore structure. This scale-dependent pattern may occur because larger pores are more readily interconnected, reducing the apparent complexity of the pore network. Furthermore, reservoir compaction induces deformation of large pores under tectonic squeezing. Numerous irregularly shaped and unevenly distributed mesopores and micropores are generated [47]. The development of such pores significantly increases the complexity of mesopore and micropore structures, leading to an upward trend in micropore fractal dimension.

3.2.2. Evaluation of the Comprehensive Fractal Index and Sensitivity Analysis

A one-at-a-time sensitivity analysis was conducted for the input parameters used in the calculation of DM. For each sensitivity test, one input parameter X was independently perturbed by ±10%, while the other parameters were kept unchanged:
X ′ = X ( 1 ± 0.1 )
When Ti was perturbed, all pore-volume fractions were renormalized to ensure that ∑Ti = 1. The sensitivity coefficient was calculated as:
S X = ( D M ′ − D M ) / 0.1 D M
where SX is the sensitivity coefficient of input parameter X; D′M is the recalculated comprehensive fractal dimension after perturbation; and DM is the original value.
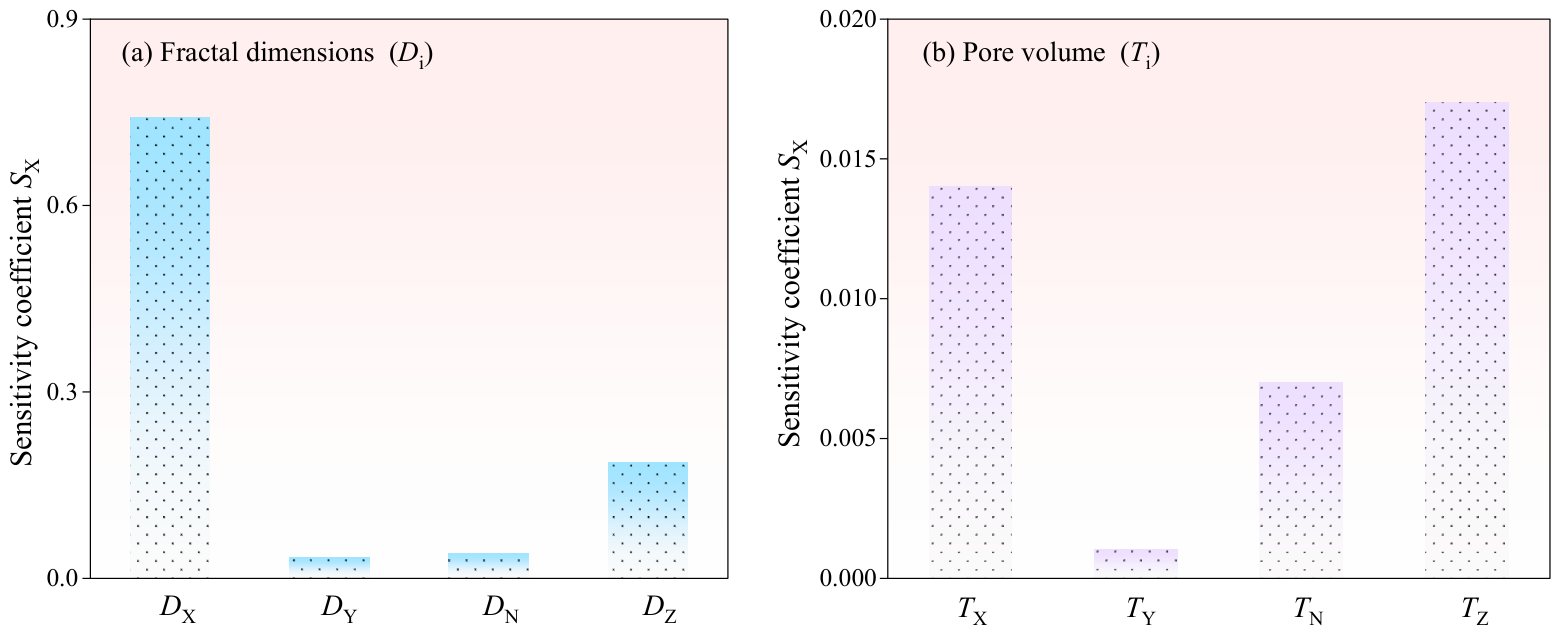
The sensitivity coefficient of the input parameters to the comprehensive fractal dimension DM is shown in Figure 12. The sensitivity results indicate that DM is more sensitive to fractal dimension parameters than to pore-volume fractions. DX exhibits the highest sensitivity and DZ shows the second-highest sensitivity, indicating that the macropore/fracture-related interval also contributes substantially to the comprehensive heterogeneity index. In contrast, the sensitivities of TY and TN are relatively low, suggesting that variations in these pore-volume fractions have limited effects on DM. Overall, the sensitivity analysis confirms that DM is jointly controlled by scale-dependent fractal complexity and pore-volume allocation.
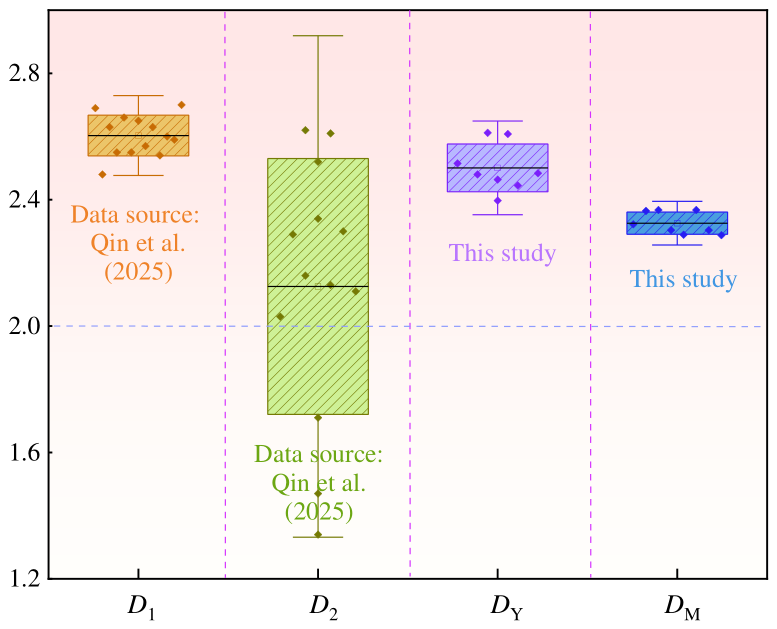
The calibrated DM was further compared with conventional single-method fractal dimensions (Figure 13). Qin et al. (2025) [44] reported single-method fractal dimensions based on N2 adsorption for deep coal samples from the eastern Ordos Basin. For all samples, the average D1 value was 2.603, and the average D2 value was 2.125. In comparison, the calibrated mesopore fractal dimension DY in this study has an average value of 2.500, which is close to the D1 value, indicating that the N2-derived mesopore fractal results in this study are regionally comparable [44]. However, some D2 values reported by Qin et al. (2025) [44] are lower than 2, suggesting that single-method fractal analysis may have limited physical interpretability and relatively weak fitting stability in certain pore-size intervals. In this study, a calibrated fractal dimension framework was established through three screening criteria: fitting quality, physical plausibility, and pore-size applicability. The comprehensive fractal dimension DM was then calculated based on this calibrated framework. This approach avoids the simple combination of fractal dimensions derived from different experimental methods and different pore-size intervals. Therefore, DM is not only comparable with traditional single-method fractal dimensions, but also integrates information from multiple pore-size intervals through pore-volume weighting, thereby characterizing full-pore-size heterogeneity that cannot be fully captured by N2 adsorption or MIP-derived fractal dimensions alone.
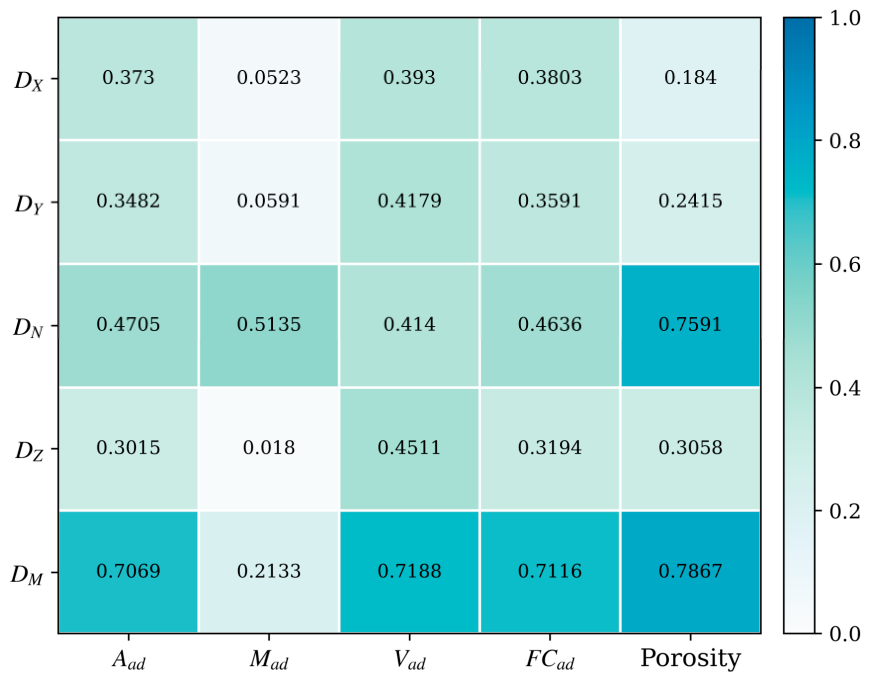
To quantitatively evaluate the difference between DM and single-method fractal dimensions, the correlations between different fractal indices and coal-quality/physical-property parameters were further compared (Figure 14). The coefficients of determination (R2) between DM and ash yield, volatile matter, fixed carbon content, and porosity are 0.7069, 0.7188, 0.7116, and 0.7867, respectively. These values are generally higher than those of the single-method fractal dimensions DX, DY, DN, and DZ. Meanwhile, single-method fractal dimensions still have clear scale-specific significance. For example, the relatively high correlation between DN and porosity indicates that the pore-size interval characterized by NMR is more sensitive to porosity variation. DX, DY, and DZ mainly reflect the scale-dependent characteristics of micropores, mesopores, and macropores/microfractures, respectively. These results indicate that single-method fractal dimensions are more suitable for revealing local pore-scale structural responses, whereas DM has a stronger integrated response to coal-quality evolution and pore-property variation and can more effectively characterize the overall heterogeneity of the full-pore-size system in coal reservoirs.

3.3. Influences on Pore-Structure Evolution in Deep Anthracite

3.3.1. Relationship Between Pore-Structure Parameters and Coal Quality

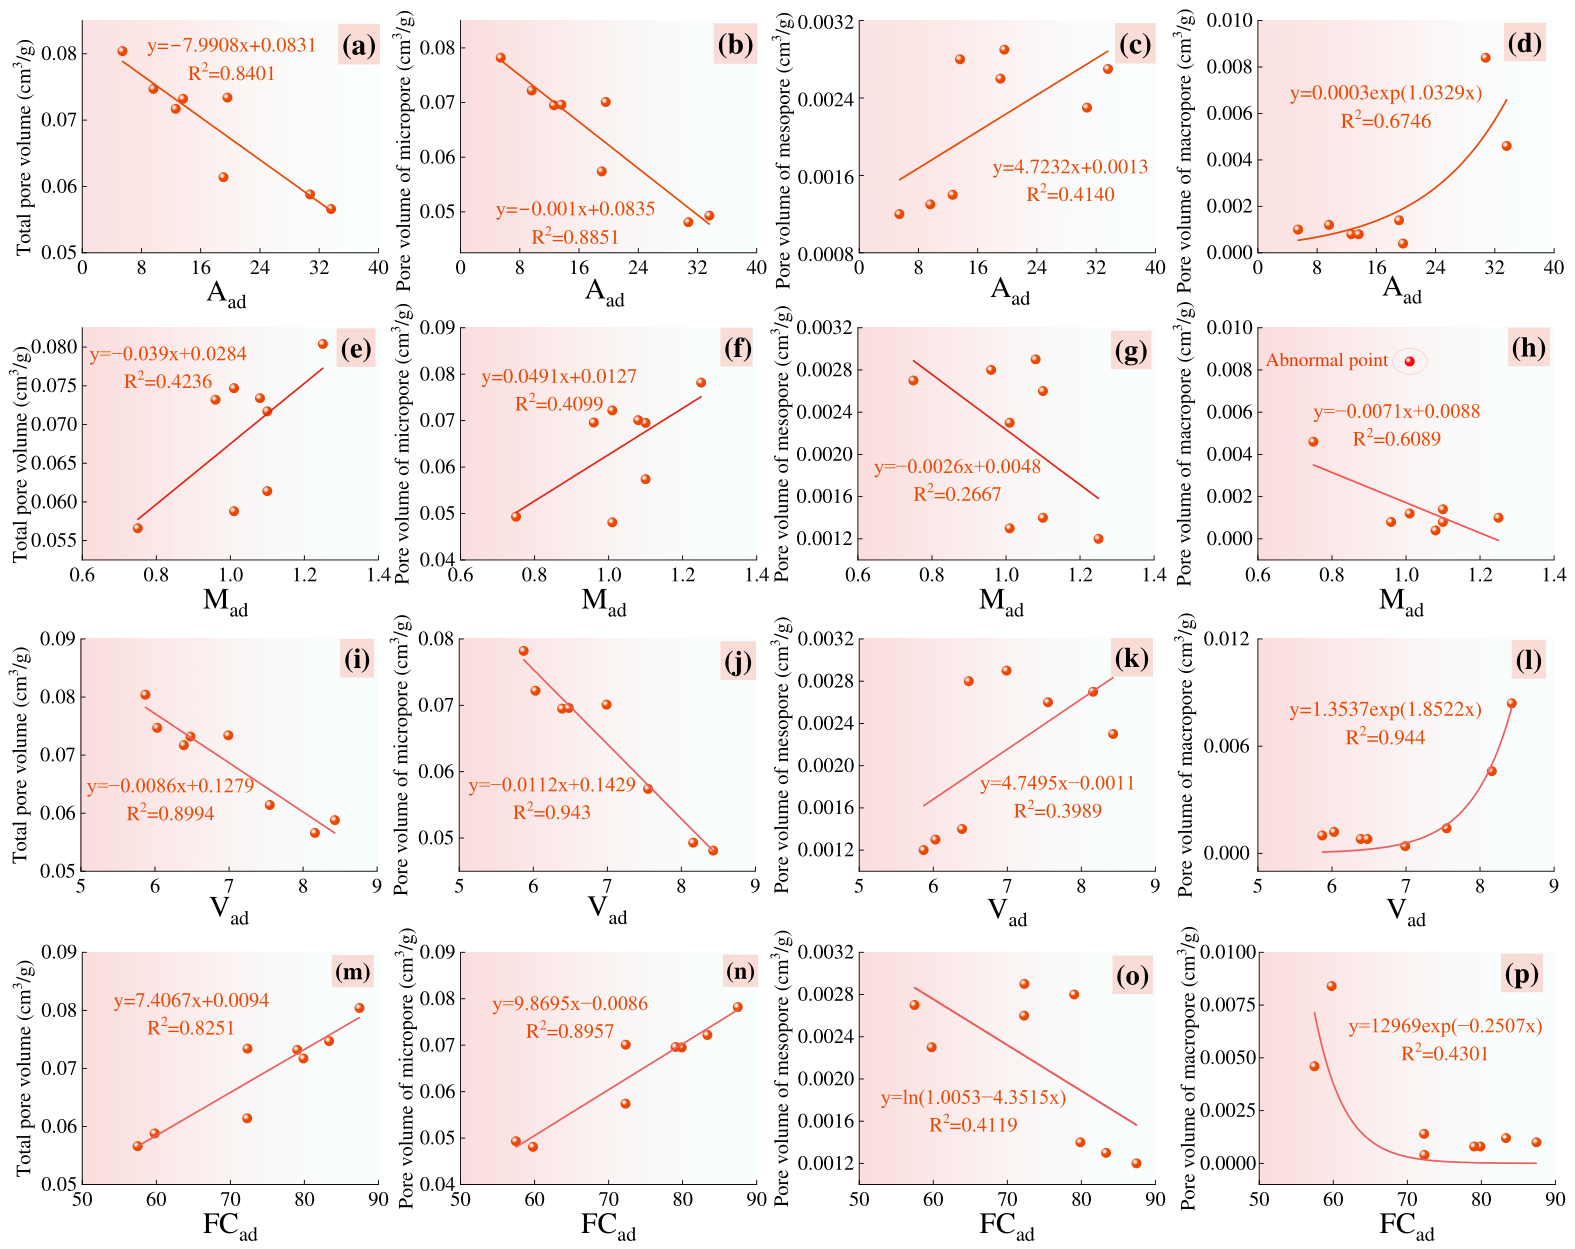
Coal-quality parameters may influence pore-structure development through physical filling and chemical modification. The relationship between pore structure and coal quality in the study area is shown in Figure 15. Ash yield mainly reflects the abundance of inorganic minerals, such as clay minerals, quartz, and pyrite. In high-ash samples (e.g., DJ1-6, Aad = 30.77%), mineral particles readily fill coal matrix pores and block fracture pathways, reducing effective pore volume and connectivity [44]. Conversely, low-ash samples (e.g., DJ4-4, Aad = 5.43%) are dominated by organic components, offering ample space for pore development and higher total porosity. Correlation analysis indicates a negative relationship between ash and total pore volume. Volatile content ranged from 5.87% to 8.43%, decreasing with increasing Ro,max. While volatile release during pyrolysis aids microporous formation, excessive release can trigger pore wall collapse, ultimately reducing total pore volume [48]. In this study, volatile content showed a strong negative correlation with micropore volume (R2 = 0.943) and a highly negative correlation with total pore volume. This suggests that lower volatile matter content is associated with more stable micropore development. As the core product of coalification, fixed carbon content correlates positively with microporous development. Higher fixed carbon content promotes more regular aromatic ring arrangements and denser molecular structures within coal, thereby creating favorable conditions for microporous formation [49]. Moisture content in deep coal samples ranged between 0.75% and 1.25%, exhibiting overall low levels with minimal variation. This low moisture content is closely related to the burial depth of the coal seam and the high-temperature, high-pressure reservoir environment. Moisture primarily exists in an adsorbed state on micropore surfaces, thereby suppressing CBM adsorption capacity. Therefore, moisture has a weaker regulatory effect on pore structure than other coal-quality parameters.
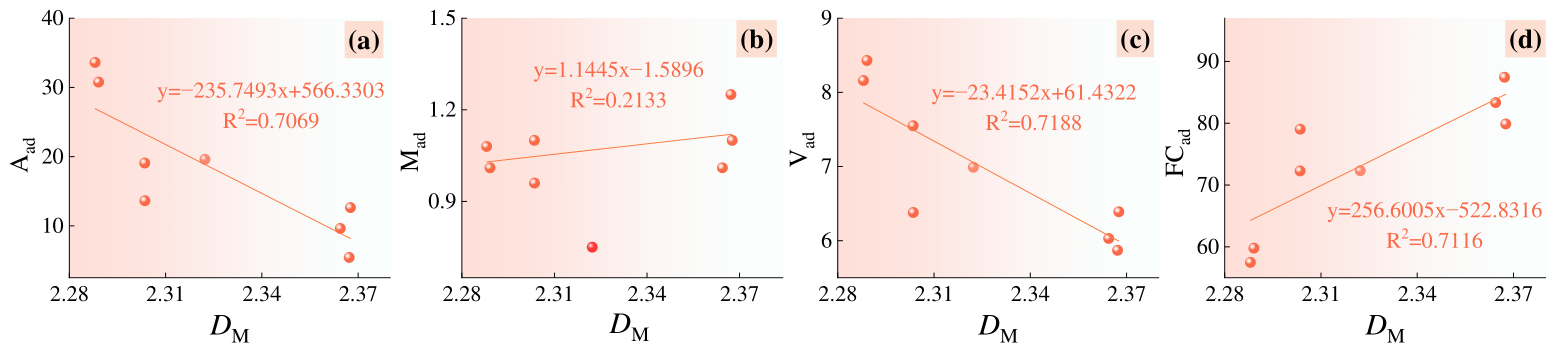
The relationship between DM and proximate-analysis parameters is shown in Figure 16. The ash content of the samples exhibits a negative correlation with the comprehensive fractal dimension DM, consistent with the correlation characteristics of micropores and total pore volume in pore structure. These results suggest that ash affects the heterogeneity of multiscale pores. In high-ash samples, the hydrophilicity and chemical inertness of mineral surfaces decrease pore surface roughness. This results in a lower macropore fractal dimension (DZ) compared to low-ash samples. This phenomenon aligns with the findings of Qin et al. (2025) [44], indicating that ash content exerts a more pronounced inhibitory effect on macropore fractal dimension. Volatile content negatively correlates with DM. At high coalification stages where Ro,max exceeds 2.8%, volatile release enters its terminal phase. The pyrolytic behavior of residual volatiles primarily occurs at the micropore scale. Higher volatile content facilitates the collapse of micropore walls due to small-molecule gas generation during pyrolysis, simplifying the micropore structure and reducing fractal dimension. Conversely, at low volatile matter content, coal molecules undergo complete condensation, resulting in stable nanoscale pores that enhance surface roughness and structural complexity. Fixed carbon, as the core product of coalification, exhibits an apparent positive correlation with DM. A higher fixed carbon content correlates with more regular arrangements of aromatic condensed rings in coal molecules and greater densification of the organic matrix. This process generates a greater number of micropores with more complex structures during molecular rearrangement. This increases the fractal dimension of micropores and enhances their specific surface area. This pattern corroborates the findings of Sun et al. (2025) [48], who observed that fixed carbon enhances pore fractal dimension by promoting micropore proliferation and structural complexity. The correlation between moisture content and DM is weakest in the investigated samples. This characteristic contrasts sharply with shallow coal: the presence of free water in shallow coal fills mesopores and macropores, leading to a decrease in fractal dimension. The limited variation in moisture content suggests that its influence on fractal characteristics is weaker than that of ash yield, volatile matter, and fixed carbon.

3.3.2. Relationship Between Pore-Structure Parameters and Macerals

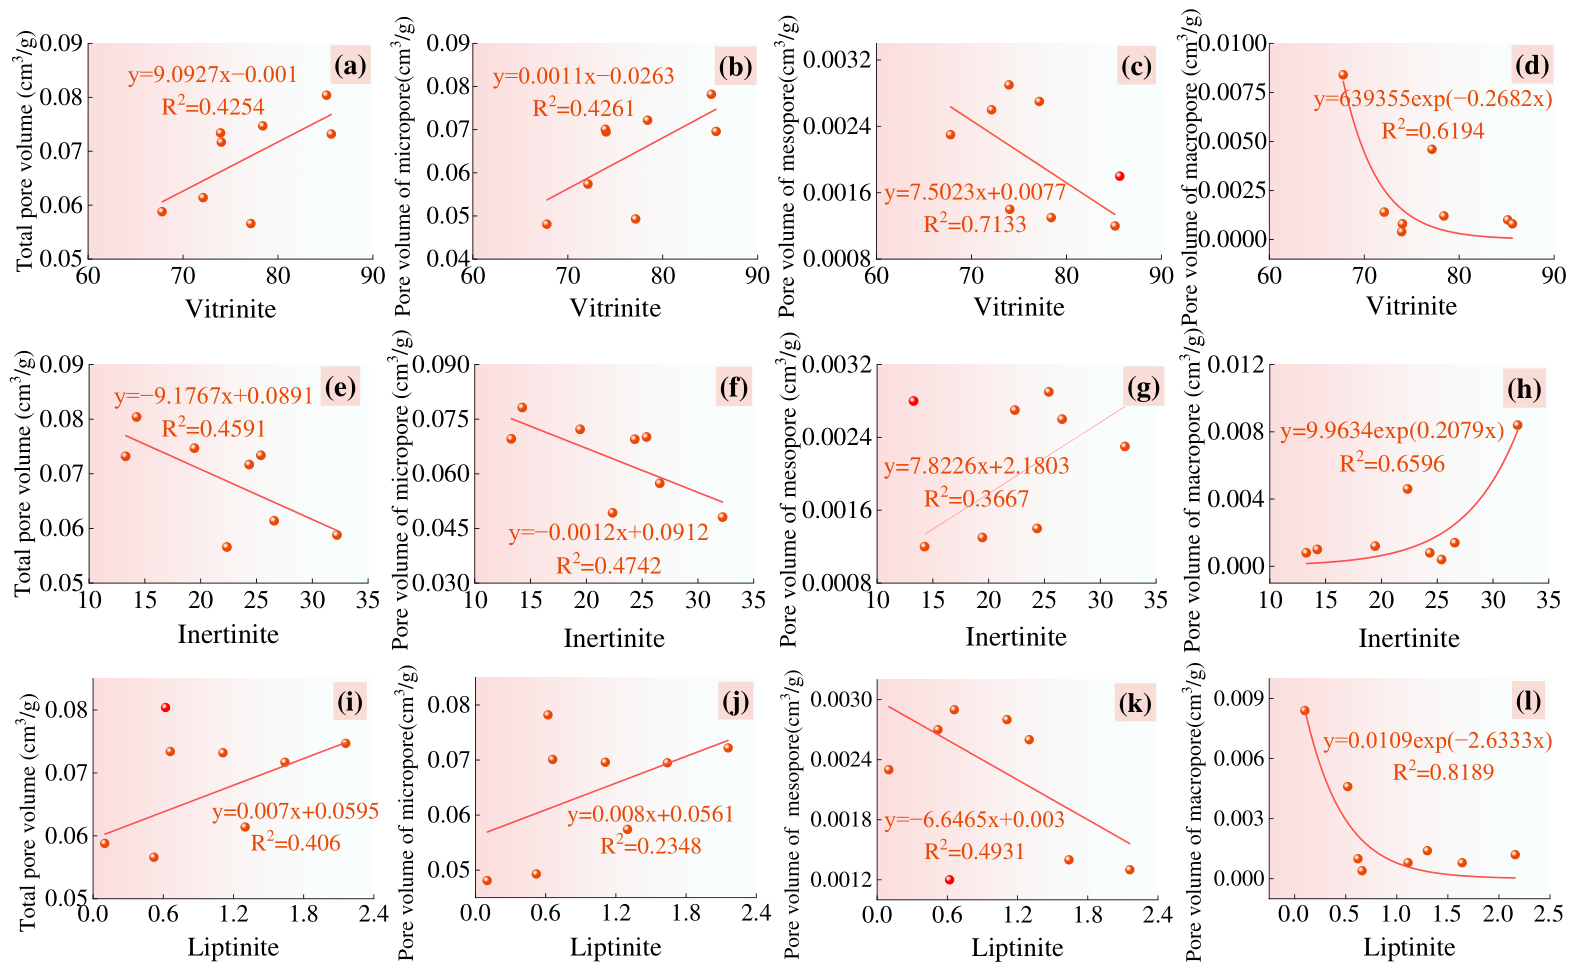
As the major constituents of the coal organic matrix, variations in maceral composition regulate the evolution of coal structure, thereby influencing the development characteristics and spatial distribution of pores [41]. The relationship between pore-structure parameters and macerals in coal is shown in Figure 17. The vitrinite fraction is the dominant maceral component in deep coal reservoirs. During coalification, the loss of oxygen-containing functional groups and molecular condensation reactions can generate numerous nanoscale micropores. Correlation analysis reveals a clear positive correlation between vitrinite content and micropore volume (R2 = 0.85). Sample DJ4-4 exhibits the highest vitrinite content, with a higher micropore volume. Inertinite originates from plant remains subjected to fibrous carbonization, retaining relatively intact primary structures and readily developing micrometer-scale macropores and fissures [44]. However, this fraction exhibits dense structures with relatively weak micropore development capacity. Taking sample DJ1-6 as an example, its inertinite content is 32.21%, and its macropore volume is significantly higher than that of the other samples. Correlation analysis indicates that inertinite content positively correlates with macroporous volume and negatively correlates with micropore volume. Liptinite, which is relatively rich in aliphatic structures, can contribute to pore generation during early coalification stages. However, during high-rank coalification, it predominantly transforms into vitrinite or inertinite. Consequently, liptinite content in coal samples from the study area is extremely low, limiting its influence on pore-structure regulation. Nevertheless, the analysis revealed a certain correlation between liptinite and pore structure.
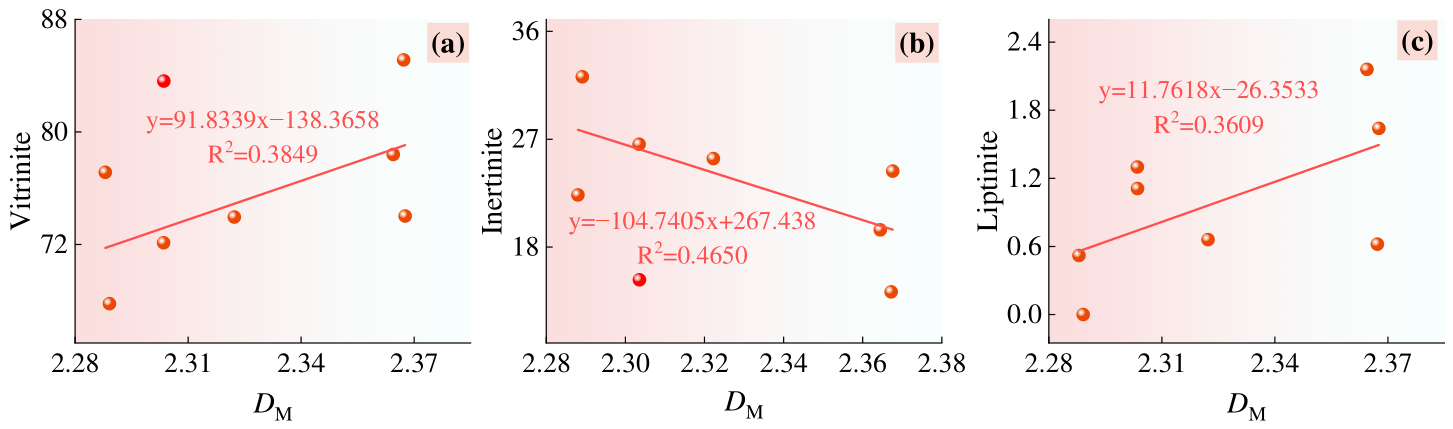
The relationship between DM and maceral composition in the study area coal samples is illustrated in Figure 18. As the dominant component in deep coal reservoirs, vitrinite exhibits an apparent positive correlation with the comprehensive fractal dimension DM. It serves as the primary carrier of micropore development and an important factor affecting fractal characteristics. The relatively homogeneous organic matrix of vitrinite may help preserve nanoscale pore networks, thereby enhancing the self-similar characteristics of micropores. Inertinite, formed from plant remains via fibrous carbonization, shows a negative correlation with DM. The dense structural characteristics of inertinite inhibit micropore development. The highly polymerized aromatic condensed rings within its organic matrix reduce micropore formation space, leading to decreased DM. Although the liptinite content in coal samples from the study area is extremely low, it still shows a weak positive correlation with DM. Overall, the regulatory effect of liptinite on fractal dimension is limited. Its contribution is significantly lower than that of vitrinite and inertinite.

3.3.3. Relationship Between Pore-Structure Parameters and Ro,max

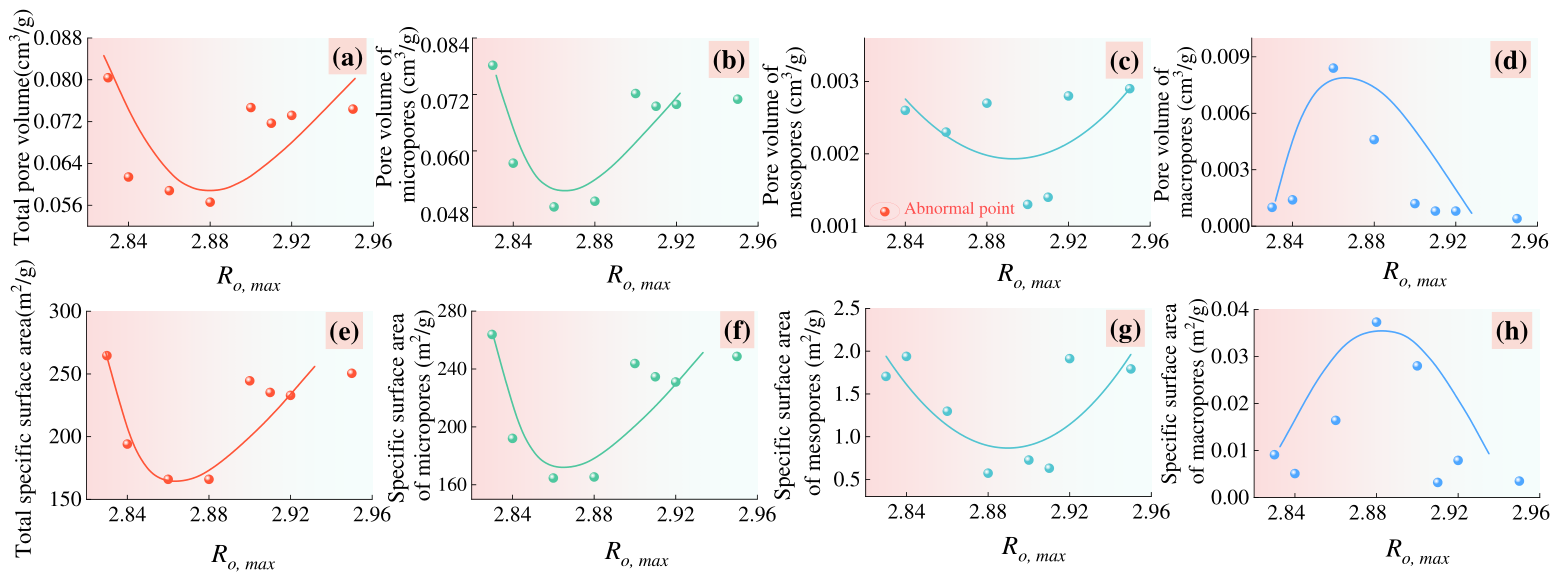
Previous studies have shown that Ro,max is an important maturity indicator for coal physicochemical evolution [50]. As shown in Figure 19, the micropore, mesopore, and total pore-structure parameters of the samples exhibit U-shaped correlations with Ro,max (Figure 19a–c). In contrast, both the specific surface area and pore volume of macropores exhibit inverted U-shaped relationships with Ro,max (Figure 19d). Furthermore, the correlations between the specific surface areas of micropores, mesopores, and total pores with Ro,max generally align with the evolution patterns of their respective pore volumes as Ro,max increases. Notably, except for one outlier, the specific surface areas and pore volumes of macropores in all coal samples exhibit an inverted U-shaped relationship with Ro,max. This pattern contrasts with the evolution of micropore and total pore-volume parameters. This discrepancy arises because the total pore volume of coal samples is primarily contributed by micropores and mesopores, while the total specific surface area is predominantly controlled by micropores. Consequently, as Ro,max increases, the evolution trend of micropore-specific surface area reflects the variation characteristics of total pore-specific surface area. This phenomenon further highlights the core controlling role of micropores in the evolution process of pore-specific surface area within deep coal reservoirs.
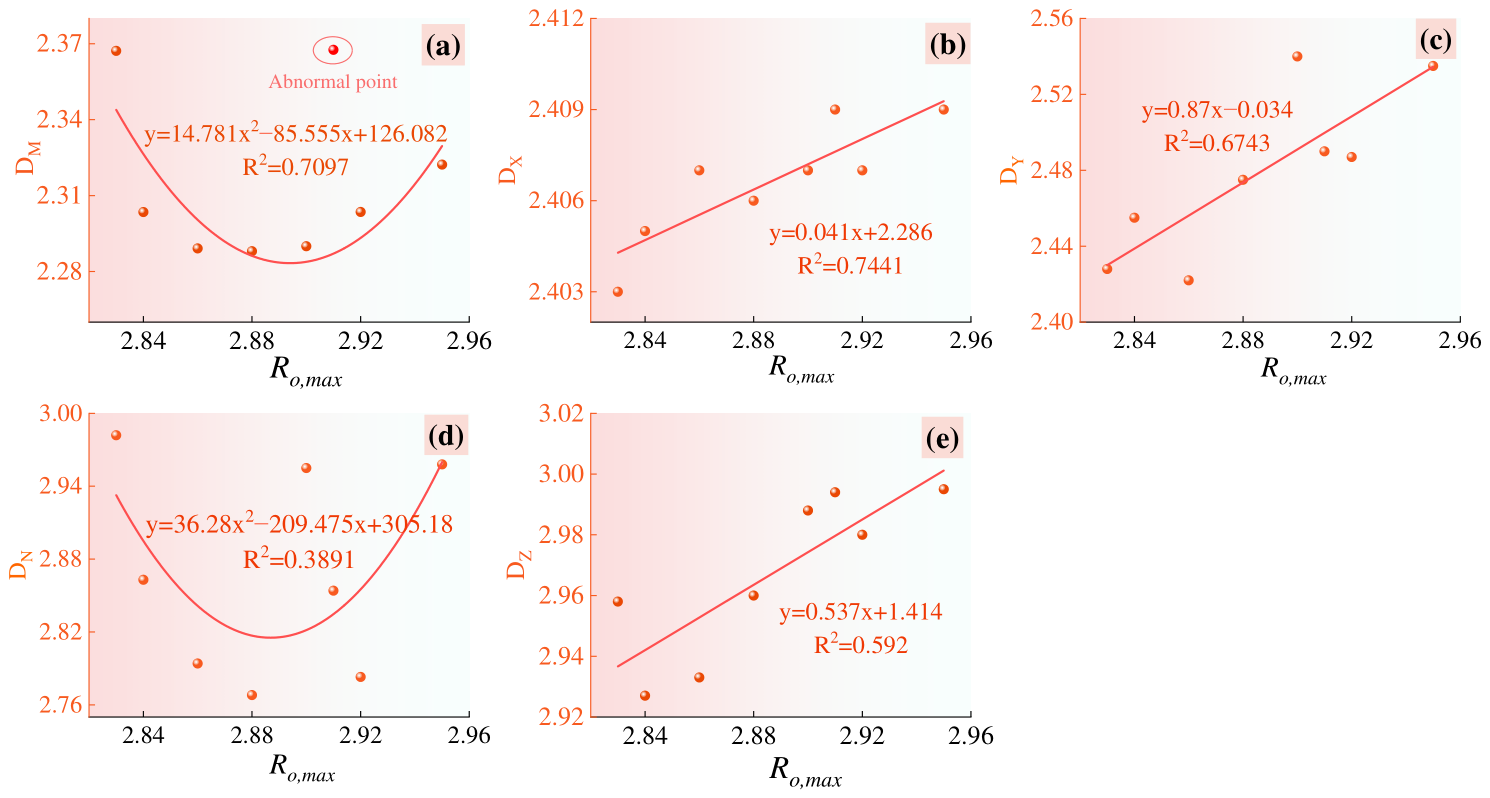
The correlation between the comprehensive fractal dimension of coal samples from the study area and the degree of thermal evolution is shown in Figure 20a. Sample DJ4-13 was identified as an outlier in the DM and Ro,max relationship. This sample has the highest ash yield, a relatively low fixed carbon content, and the lowest porosity among the studied samples, suggesting stronger mineral filling and greater local petrographic heterogeneity. These features may weaken the maturity-controlled pore-evolution trend and cause DJ4-13 to deviate from the overall relationship. Therefore, this sample was marked as an anomalous point in the trend analysis but was retained in the dataset and in the overall discussion. The comprehensive fractal dimension tends to exhibit a U-shaped relationship with Ro,max. This trend closely aligns with the evolution patterns of micropores and the total pore structure. These results suggest that the comprehensive fractal dimension effectively characterizes the evolution trend of pore structure with increasing thermal evolution, and further indicate that micropores are likely the dominant contributors to pore-structure variations in the investigated samples.
To further examine the contribution of different pore-size intervals to coal reservoir heterogeneity, this study calculated the calibrated fractal dimensions DX, DY, DN, and DZ. A calibrated fractal dimension system covering the entire pore-size range was established. Correlation diagrams between the fractal dimensions of different pore-size intervals and Ro,max were plotted (Figure 20). DX, DY, and DZ all exhibit positive correlations with Ro,max. In contrast, DN shows a U-shaped relationship with Ro,max (Figure 20d). This trend aligns with the evolution patterns of DM and is primarily attributed to differences in the formation mechanisms and evolutionary processes of pores across various pore-size ranges. From a molecular structural evolution perspective, coal macromolecules undergo profound reorganization: residual aliphatic side chains continue to cleave, while aromatic rings form highly ordered graphite-like layered structures through polycondensation, driving fundamental restructuring of the pore network system [51]. The formation and evolution of mesopores and macropores are controlled by multiple factors, including tectonic setting, depositional environment, reservoir pressure, and hydrocarbon generation, resulting in more complex formation mechanisms. This leads to relatively weaker correlations between their fractal dimensions and Ro,max. Microporosity formation and evolution are strongly associated with the thermal evolution of coal macromolecular structures, although mineral matter, maceral composition, and local structural heterogeneity may also contribute. Aromatization and polycondensation can induce secondary microporosity formation, thereby enhancing microporosity heterogeneity.

4. Conclusions

(1)
The deep No. 8 anthracite samples from the Daning–Jixian block exhibited a trimodal full-pore-size distribution, with CO2-derived micropore volume mainly concentrated at 0.32–0.86 nm, accounting for 59.48–74.65% of the measured micropore volume. A comprehensive calibration and evaluation system for fractal dimensions across the full-scale pore-structure range was established, based on dominant pore-size intervals and goodness of fit. After calibration, all samples exhibited a goodness of fit exceeding 0.9 for fractal dimensions across the pore-size ranges. Sensitivity analysis showed that DM is more sensitive to calibrated fractal dimensions than to pore-volume fractions, with DX and DZ exerting the strongest effects.
(2)
Pore-structure parameters and fractal dimensions vary systematically with Ro,max. The specific surface area and pore volume of micropores and mesopores, together with the comprehensive fractal dimension DM, show a U-shaped trend with increasing Ro,max. By contrast, the specific surface area and pore volume of macropores show an inverted U-shaped trend. This difference indicates that micropores and mesopores are more closely related to maturity-controlled organic-matter evolution, whereas macropores are more strongly affected by mineral filling, compaction, and local structural heterogeneity.
(3)
The potential factors influencing pore development in the investigated deep anthracite samples were discussed, including ash yield, fixed carbon content, vitrinite content, inertinite content, and thermal maturity. Ash content inhibits overall pore development, whereas fixed carbon and vitrinite dominate micropore formation. Inertinite promotes macropore and fracture development. The thermal evolution of coal macromolecular structures is a vital factor controlling pore heterogeneity in deep reservoirs and variations in coal quality. These findings provide a quantitative basis for deep coal reservoir evaluation and CBM development optimization.

Author Contributions

Conceptualization: B.Z. and Y.M.; validation: B.Z.; investigation: S.Y.; resources: Y.M.; data curation: B.Z., Y.M., X.W., D.Z. and K.Z.; writing—original draft preparation: B.Z.; writing—review and editing: B.Z.; supervision: Y.M., S.Y., X.W., D.Z. and K.Z.; funding acquisition: Y.M. All authors have read and agreed to the published version of the manuscript.

Funding

This work was supported by the National Natural Science Foundation of China (42372192).

Data Availability Statement

Data are contained within the article.

Conflicts of Interest

Author Song Yang is employed by the company Oil Production Plant 10 of PetroChina Changqing Oilfield Company, Qingyang, China. The remaining authors declare that the research was conducted in the absence of any commercial or financial relationships that could be construed as a potential conflict of interest.

References

  1. Wang, K.; Guo, L.; Xu, C.; Wang, W.; Yang, T.; Yuan, Y.; Shi, Y. Analysis of the current development status and application prospects of coal reservoir microstructure characterisation technology. Renew. Sustain. Energy Rev. 2025, 221, 115939. [Google Scholar] [CrossRef] [Scilit]
  2. Xie, H.; Sang, S.; Li, X.; Yan, Z.; Zhou, X.; Liu, S.; Han, S.; Cai, J. Competitive adsorption-penetration characteristics of multi-component gases in micro-nano pore of coal. Chem. Eng. J. 2025, 506, 159965. [Google Scholar] [CrossRef] [Scilit]
  3. Wang, H.; Wang, L.; Zheng, S.; Sun, Y.; Shen, S.; Zhang, X. Research on coal matrix pore structure evolution and adsorption behavior characteristics under different thermal stimulation. Energy 2024, 287, 129677. [Google Scholar] [CrossRef] [Scilit]
  4. Yang, L.; Zhang, J.; Li, X.; Zhu, N.; Liu, Y. The moderating effect of emission reduction policies on CCS mitigation efficiency. Appl. Energy 2024, 376, 124303. [Google Scholar] [CrossRef] [Scilit]
  5. Liang, G.; Hou, H.; Qin, Q.; Shao, L.; Yan, Z. Quantitative physical characterization of medium-high rank coals in northern China: Implications for pore structure evolution around the second coalification jump. Fuel 2026, 410, 137801. [Google Scholar] [CrossRef] [Scilit]
  6. Li, Z.; Ren, T.; Li, X.; Qiao, M.; Yang, X.; Tan, L.; Nie, B. Multi-scale pore fractal characteristics of differently ranked coal and its impact on gas adsorption. Int. J. Min. Sci. Technol. 2023, 33, 389–401. [Google Scholar] [CrossRef] [Scilit]
  7. Huang, Z.; Sednek, C.; Urynowicz, M.A.; Guo, H.; Wang, Q.; Fallgren, P.; Jin, S.; Jin, Y.; Igwe, U.; Li, S. Low carbon renewable natural gas production from coalbeds and implications for carbon capture and storage. Nat. Commun. 2017, 8, 164626. [Google Scholar] [CrossRef] [Scilit] [PubMed]
  8. Ding, Y.N.; Li, B.B.; Li, J.H.; Tang, C.L.; Song, H.S.; Yang, J.S. Characteristics of CO2 adsorption influenced by coal pore structure-temperature interaction, including its implications for geological storage. Chem. Eng. J. 2025, 518, 164626. [Google Scholar] [CrossRef] [Scilit]
  9. Zhang, K.; Meng, Z.; Jin, Y.; Wang, B. Fractal characteristics of pore structures on different coal structures and its research significance. Coal Sci. Technol. 2023, 51, 198–206. [Google Scholar] [CrossRef]
  10. Sun, L.L.; Wan, F.Q.; Wang, G.; Duan, S.L.; Huang, Q.M.; Li, W.L. Pore-fracture structures and seepage flow characteristics during spontaneous coal combustion based on CT 3D reconstruction. Energy 2024, 305, 132398. [Google Scholar] [CrossRef] [Scilit]
  11. Zhang, K.; Zhang, S.H.; Tang, S.H.; Xi, Z.D.; Zhang, Q.; Chen, Y.; Zhai, J.Y.; Tian, W.G. Pore development and evolution mechanism during hydrocarbon generation: Insights from hydrous pyrolysis simulation experiment. Energy Explor. Exploit. 2026, 44, 418–440. [Google Scholar] [CrossRef] [Scilit]
  12. Zou, C.E.; Lin, M.J.; Ma, F.; Liu, H.L.; Yang, Z.; Zhang, G.S.; Yang, Y.C.; Guan, C.X.; Liang, Y.B.; Wang, Y.; et al. Development, challenges and strategies of natural gas industry under carbon neutral target in China. Pet. Explor. Dev. 2024, 51, 476–497. [Google Scholar] [CrossRef] [Scilit]
  13. Ren, P.; Xu, H.; Tang, D.; Li, Y.; Chen, Z.; Sun, C.; Zhang, F.; Chen, S.; Xin, F.; Cao, L. Pore structure and fractal characterization of main coal-bearing synclines in western Guizhou, China. J. Nat. Gas Sci. Eng. 2019, 63, 58–69. [Google Scholar] [CrossRef] [Scilit]
  14. Qu, Y.; Sun, W.; Tao, R.; Luo, B.; Chen, L.; Ren, D. Pore-throat structure and fractal characteristics of tight sandstones in Yanchang Formation, Ordos Basin. Mar. Pet. Geol. 2020, 120, 104573. [Google Scholar] [CrossRef] [Scilit]
  15. Wang, J.; Zhou, H.; Lu, M.; Zhang, L.; Wang, Z.; Li, H.; Mao, T.; Shi, F.; Xue, D. Accurate characterization and fractal analysis of pore-fracture evolution in deep coal under temperature effect. Fuel 2026, 408, 137534. [Google Scholar] [CrossRef] [Scilit]
  16. Fan, N.; Qiao, Y.; Fan, C.; Wang, A.; Deng, C.; Chen, X. Two-dimensional image-based nondestructive probing of micro- and nano-scale heterogeneous pore structures and their geological control. Chem. Eng. Sci. 2026, 320, 122648. [Google Scholar] [CrossRef] [Scilit]
  17. Liu, S.; Sun, H.; Zhang, D.; Yang, K.; Li, X.; Wang, D.; Li, Y. Experimental study of effect of liquid nitrogen cold soaking on coal pore structure and fractal characteristics. Energy 2023, 275, 127470. [Google Scholar] [CrossRef] [Scilit]
  18. Feng, C.; Li, X.; Xu, E.; Sui, H.; Xue, F.; Xie, H. Microstructure Characteristics of Tectonic Coal and Primary Coal: A Case Study of Guizhou, China. Nat. Resour. Res. 2023, 32, 2901–2926. [Google Scholar] [CrossRef] [Scilit]
  19. Zhou, G.; Zhao, M.; Liu, Z.; Liu, Y.; Chen, J.; Ma, H.; Yan, G.; Luan, G. Experimental investigation on the pore structure and gas permeation modification of multi-stage coal treated by different extraction agents. Powder Technol. 2025, 466, 121467. [Google Scholar] [CrossRef] [Scilit]
  20. Ma, R.; Zhang, J.; Feng, Q.; Zhang, X.; Yang, Y. Effect of cyclic hydraulic stimulation on pore structure and methane sorption characteristics of anthracite coal: A case study in the Qinshui Basin, China. Pet. Sci. 2024, 21, 3271–3287. [Google Scholar] [CrossRef] [Scilit]
  21. Sun, Y.; Zhao, Y.; Wang, X.; Peng, L.; Sun, Q. Synchrotron radiation facility-based quantitative evaluation of pore structure heterogeneity and anisotropy in coal. Pet. Explor. Dev. 2019, 46, 1195–1205. [Google Scholar] [CrossRef] [Scilit]
  22. Liu, H.; Liu, G.; Zhang, Z.; Si, N.; Wang, X.; Chang, P.; Barakos, G. Improved characterization of the pore size distribution in full and across scale by a fractal strategy. Phys. Fluids 2025, 37, 046602. [Google Scholar] [CrossRef] [Scilit]
  23. Liu, Y.; Zou, G.; Che, Y.; She, J.; Li, B.; Wang, X.; Ren, K. Evolution of the Pore-Fracture System of Coal: A Case Study of Zhaozhuang Colliery, Qinshui Basin. ACS Omega 2025, 10, 8448–8461. [Google Scholar] [CrossRef] [Scilit] [PubMed]
  24. Li, S.; Qin, Y.; Tang, D.; Shen, J.; Wang, J.; Chen, S. A comprehensive review of deep coalbed methane and recent developments in China. Int. J. Coal Geol. 2023, 279, 104369. [Google Scholar] [CrossRef] [Scilit]
  25. Zhu, Y.; Liu, H.; Wang, T.; Wang, Y.; Liu, H. Evolution of pore structures and fractal characteristics of coal-based activated carbon in steam activation based on nitrogen adsorption method. Powder Technol. 2023, 424, 118522. [Google Scholar] [CrossRef] [Scilit]
  26. Zhao, L.; Jiang, E.; Wang, S.; Luo, Q.; Li, B.; Zhu, D.; Bai, H. Effect of Carbon Dioxide Injection on Mineral and Pore Structure of Low Permeability Reservoirs. Oilfield Chem. 2021, 38, 659–664. [Google Scholar]
  27. Chen, S.; Tian, F.; Lei, Y.; Zou, Y.; Xu, Y.; Kang, J.; Zhang, Y. Microfractal characteristics of acidified coal under different temperature and adsorption pressure conditions. Phys. Fluids 2025, 37, 046602. [Google Scholar] [CrossRef] [Scilit]
  28. Feng, K.; Liu, G.; Zhang, Z.; Liu, H.; Lv, R.; Wang, X.; Chang, P.; Lin, J.; Barakos, G. Multifractal Characterization of Methane Adsorption in Coal Pores. Langmuir 2025, 41, 14548–14559. [Google Scholar] [CrossRef] [Scilit] [PubMed]
  29. Wang, L.; Wu, S.; Han, S.; Hu, B.; Wang, Q.; Zhang, K.; Song, T. Fractal Analysis of Coal Pore Structure Based on Low-Pressure Gas Adsorption and Its Influence on Methane Adsorption Capacity: A Perspective from Micropore Filling Model. Energy Fuels 2024, 38, 4031–4046. [Google Scholar] [CrossRef] [Scilit]
  30. Mishra, D.K.; Samad, S.K.; Varma, A.K.; Mendhe, V.A. Pore geometrical complexity and fractal facets of Permian shales and coals from Auranga Basin, Jharkhand, India. J. Nat. Gas Sci. Eng. 2018, 52, 25–43. [Google Scholar] [CrossRef] [Scilit]
  31. Xia, Y.; Cai, J.; Perfect, E.; Wei, W.; Zhang, Q.; Meng, Q. Fractal dimension, lacunarity and succolarity analyses on CT images of reservoir rocks for permeability prediction. J. Hydrol. 2019, 579, 124198. [Google Scholar] [CrossRef] [Scilit]
  32. Chang, Z.; Zhao, P.; Ma, X.; Lei, W.; Liu, Y.; Wang, L.; Guo, X.; Liu, Y. Characteristics of fractal evolution of sectional fractures in tectonic coal assemblages with different loads based on CT scans. Fuel 2025, 401, 135928. [Google Scholar] [CrossRef] [Scilit]
  33. Zhang, Z.; Liu, G.; Wang, X.; Lv, R.; Liu, H.; Lin, J.; Barakos, G.; Chang, P. A fractal Langmuir adsorption equation on coal: Principle, methodology and implication. Chem. Eng. J. 2024, 488, 150869. [Google Scholar] [CrossRef] [Scilit]
  34. Wang, Z.; Liu, J.; Yu, S.; Sun, Z.; Wang, L.; Wu, S.; Ni, G.; Hao, C.; Zhang, R. Kinetic properties of coal gas desorption based on fractional order fractal diffusion equation in time. Energy 2025, 316, 134608. [Google Scholar] [CrossRef] [Scilit]
  35. Quan, F.; Zhang, Y.; Lu, W.; Wei, C.; Dai, X.; Qin, Z. Multifractal Characterization of Full-Scale Pore Structure in Middle-High-Rank Coal Reservoirs: Implications for Permeability Modeling in Western Guizhou–Eastern Yunnan Basin. Processes 2025, 13, 1927. [Google Scholar] [CrossRef] [Scilit]
  36. Li, R.; Hou, X.; Chen, L.; Fang, H.; Zheng, C. Multifractal Investigation on Multi-scale Pore Structure Heterogeneity of High Rank Coal Reservoirs. Nat. Resour. Res. 2022, 31, 1665–1685. [Google Scholar] [CrossRef] [Scilit]
  37. Zhang, S.; Liu, H.; Jin, Z.; Wu, C. Multifractal Analysis of Pore Structure in Middle- and High-Rank Coal by Mercury Intrusion Porosimetry and Low-Pressure N2 Adsorption. Nat. Resour. Res. 2021, 30, 4565–4584. [Google Scholar] [CrossRef] [Scilit]
  38. GB/T 21650.3-2011; Pore Size Distribution and Porosity of Solid Materials by Mercury Porosimetry and Gas Adsorption—Part 3: Analysis of Micropores by Gas Adsorption. Standards Press of China: Beijing, China, 2011.
  39. GB/T 21650.2-2008; Pore Size Distribution and Porosity of Solid Materials by Mercury Porosimetry and Gas Adsorption—Part 2: Analysis of Mesopores and Macropores by Gas Adsorption. Standards Press of China: Beijing, China, 2008.
  40. GB/T 21650.1-2008; Pore Size Distribution and Porosity of Solid Materials by Mercury Porosimetry and Gas Adsorption—Part 1: Mercury Porosimetry. Standards Press of China: Beijing, China, 2008.
  41. Wang, R.; Shi, B.; Wang, T.; Lin, J.; Li, B.; Fan, S.; Liu, J. Multiscale Qualitative-Quantitative Characterization of the Pore Structure in Coal-Bearing Reservoirs of the Yan'an Formation in the Longdong Area, Ordos Basin. Processes 2024, 12, 2787. [Google Scholar] [CrossRef] [Scilit]
  42. Chen, Y.; Lei, Q.; Ma, D.; Wang, X.; Wang, X.; Huang, D.; Rong, G. Combined multi-scale characterization of pores in ultra-thick coal seams of Jurassic Xishanyao Formation, Tiaohu-Malang sags, Santanghu Basin. Exp. Pet. Geol. 2025, 47, 104–116. [Google Scholar] [CrossRef]
  43. Wang, T.; Zhou, G.; Fan, L.; Zhang, D.; Shao, M.; Ding, R.; Li, Y.; Hu, H.; Deng, Z. Full-Scale Pore and Microfracture Characterization of Deep Coal Reservoirs: A Case Study of the Benxi Formation Coal in the Daning-Jixian Block, China. Int. J. Energy Res. 2024, 2024, 5772264. [Google Scholar] [CrossRef] [Scilit]
  44. Qin, Z.; Chen, L.; Li, Z.; Xu, G.; Du, L.; Jia, J.; Yang, J.; Agarwal, V.; Grebby, S. Multiscale Pore Structure and Heterogeneity of Deep Medium-Rank Coals in the Eastern Ordos Basin. Processes 2025, 13, 3912. [Google Scholar] [CrossRef] [Scilit]
  45. Yuan, A.; Wang, R.; Yang, X.; Wang, P. Integrated pore structure analysis and methane adsorption and desorption investigation in deep multi seam coal systems. Sci. Rep. 2025, 15, 34102. [Google Scholar] [CrossRef] [Scilit] [PubMed]
  46. Wang, T.; Deng, Z.; Hu, H.; Ding, R.; Tian, F.; Zhang, T.; Ma, Z.; Wang, D. Pore structure of deep coal of different ranks and its effect on coalbed methane adsorption. Int. J. Hydrogen Energy 2024, 59, 144–158. [Google Scholar] [CrossRef] [Scilit]
  47. Wang, T.; Deng, Z.; Hu, H.; Wang, H.; Jiang, Z.; Wang, D. Study on the Pore Structure and Multifractal Characteristics of Medium- and High-Rank Coals Based on the Gas Adsorption Method: A Case Study of the Benxi Formation in the Eastern Margin of the Ordos Basin. Energy Fuels 2024, 38, 4102–4121. [Google Scholar] [CrossRef] [Scilit]
  48. Sun, L.; Zhao, S.; Wei, J.; Li, Y.; Wu, D.; Wu, C. Quantitative Analysis of the Influence of Volatile Matter Content in Coal Samples on the Fractal Dimension of Their Nanopore Characteristics. Appl. Sci. 2025, 15, 7236. [Google Scholar] [CrossRef] [Scilit]
  49. Liu, L.; Ge, Z.; Zhou, Z.; Li, Z.; Deng, Q. Mineral composition, pore structure and mechanical properties of coal measure strata rocks: A case study of Pingdingshan Coalfield. Sci. Total Environ. 2024, 952, 175944. [Google Scholar] [CrossRef] [Scilit] [PubMed]
  50. Feng, P.; Li, S.; Tang, S.; Tang, D.; Zhang, C.; Zhong, G.; Fan, L.; Zhang, Z. Unraveling the Nanopores Evolution: Chemical Structure Control in Coal during Coalification. Energy Fuels 2024, 38, 8688–8699. [Google Scholar] [CrossRef] [Scilit]
  51. Liu, T.; Lin, B.; Sang, S.; Yang, W.; Liu, T.; Liu, S.; Zheng, S.; Wang, T. Control Mechanisms of Macromolecular Compositions and Structures of Coals on the Evolution of Nanopores during Coalification. Energy Fuels 2024, 38, 13002–13018. [Google Scholar] [CrossRef] [Scilit]
Figure 1. CO2 adsorption capacities and pore-size distributions of the samples.
Fractalfract 10 00443 g001
Figure 2. Fractal fitting curves of CO2 adsorption experiments for coal samples.
Fractalfract 10 00443 g002
Figure 3. N2 adsorption/desorption isotherms and pore-size distribution curves of the samples.
Fractalfract 10 00443 g003
Figure 4. Fitted fractal dimension curves based on N2 adsorption data.
Fractalfract 10 00443 g004
Figure 5. Mercury intrusion–extrusion volumes and pore-size distribution curves of the samples.
Fractalfract 10 00443 g005
Figure 6. Fractal fitting curves from MIP experiments on coal samples.
Fractalfract 10 00443 g006
Figure 7. Three-dimensional NMR T2 spectral visualization showing the multiscale pore-structure distribution of the tested coal samples.
Fractalfract 10 00443 g007
Figure 8. Pore fractal characteristics obtained based on NMR experiments.
Fractalfract 10 00443 g008
Figure 9. Comparison of full-scale and NMR-derived pore-size distributions of tested samples.
Fractalfract 10 00443 g009
Figure 10. Relationship between fractal dimension and coalification degree: (a) DX1 and Ro,max; (b) DY1, DY2, and Ro,max; (c) DZ1, DZ2, DZ3, and Ro,max.
Fractalfract 10 00443 g010
Figure 11. Schematic of multi-method calibrated full-scale pore fractal dimension model.
Fractalfract 10 00443 g011
Figure 12. Sensitivity coefficients of input parameters calculated using a one-at-a-time perturbation method.
Fractalfract 10 00443 g012
Figure 13. Comparison of the comprehensive fractal dimension with single-method fractal dimensions [44].
Fractalfract 10 00443 g013
Figure 14. Correlation heatmap between calibrated/single-method fractal dimensions and coal-quality/physical-property parameters.
Fractalfract 10 00443 g014
Figure 15. Relationships between coal pore structure and ash yield, moisture, volatile matter, and fixed carbon: (a) total pore volume and ash yield; (b) micropore volume and ash yield; (c) mesopore volume and ash yield; (d) macropore volume and ash yield; (e) total pore volume and moisture; (f) micropore volume and moisture; (g) mesopore volume and moisture; (h) macropore volume and moisture; (i) total pore volume and volatile matter; (j) micropore volume and volatile matter; (k) mesopore volume and volatile matter; (l) macropore volume and volatile matter; (m) total pore volume and fixed carbon; (n) micropore volume and fixed carbon; (o) mesopore volume and fixed carbon; (p) macropore volume and fixed carbon.
Fractalfract 10 00443 g015
Figure 16. Relationships between DM and coal air-dried industrial analysis indicators: (a) ash yield and fractal dimension DM; (b) moisture content and fractal dimension DM; (c) volatile matter and fractal dimension DM; (d) fixed carbon and fractal dimension DM.
Fractalfract 10 00443 g016
Figure 17. Relationship between pore structure and vitrinite, inertinite, and liptinite in samples: (a) total pore volume and vitrinite content; (b) micropore volume and vitrinite content; (c) mesopore volume and vitrinite content; (d) macropore volume and vitrinite content; (e) total pore volume and inertinite content; (f) micropore volume and inertinite content; (g) mesopore volume and inertinite content; (h) macropore volume and inertinite content; (i) total pore volume and liptinite content; (j) micropore volume and liptinite content; (k) mesopore volume and liptinite content; (l) macropore volume and liptinite content.
Fractalfract 10 00443 g017
Figure 18. Relationship between DM and vitrinite, inertinite, and liptinite: (a) DM and vitrinite content; (b) DM and inertinite content; (c) DM and liptinite content.
Fractalfract 10 00443 g018
Figure 19. Relationship between different pore structures and Ro,max: (a) total pore volume and Ro,max; (b) micropore volume and Ro,max; (c) mesopore volume and Ro,max; (d) macropore volume and Ro,max; (e) total specific surface area and Ro,max; (f) specific surface area of micropores and Ro,max; (g) specific surface area of mesopores and Ro,max; (h) specific surface area of macropores and Ro,max.
Fractalfract 10 00443 g019
Figure 20. Relationship between fractal dimension and Ro,max: (a) DM and Ro,max; (b) DX and Ro,max; (c) DY and Ro,max; (d) DN and Ro,max; (e) DZ and Ro,max.
Fractalfract 10 00443 g020
Table 1. Sample physical properties.
NumberDepth/mRo,max/%Mad/%Aad/%Vad/%FCad/%Vitrinite/%Inertinite/%Liptinite/%Porosity/%
DJ1-61880.832.861.0130.778.4359.7967.6932.210.106.09
DJ1-81881.402.841.1019.077.5572.2872.1226.581.306.20
DJ1-111882.362.881.1012.636.3979.8874.0224.341.647.31
DJ4-41961.982.831.255.435.8787.4585.1214.260.628.12
DJ4-71962.992.920.9613.626.3879.0485.6213.271.117.79
DJ4-91963.572.901.019.626.0383.3478.4019.442.167.99
DJ4-131964.842.910.7533.618.1657.4877.1322.350.525.59
DJ4-171965.792.951.0819.616.9972.3273.9525.390.668.04
Note: Mad, moisture; Aad, ash yield; Vad, volatile matter; FCad, fixed carbon.
Table 2. Calculated pore fractal dimensions based on CO2 and N2 adsorption experiments.
NumberLow-Pressure CO2 AdsorptionLow-Temperature N2 Adsorption
DX1R2DY1R2DY2R2
DJ1-62.4080.99352.7630.94642.3970.9451
DJ1-82.4080.99322.8040.91562.4640.9183
DJ1-112.4100.99382.5340.92912.4800.9137
DJ4-42.3990.99282.6640.93272.6080.9173
DJ4-72.3930.99302.6510.97912.4450.9764
DJ4-92.4020.99232.5060.94832.6120.9090
DJ4-132.4110.99302.5720.98832.5150.9835
DJ4-172.4080.99332.6240.99002.4840.9455
Table 3. Calculated pore fractal dimensions based on MIP experiments.
NumberMIP Method
DZ1R2DZ2R2DZ3R2
DJ1-60.4610.71282.8430.80192.0880.9891
DJ1-80.2250.66632.9870.91252.0060.9982
DJ1-110.0880.89142.8460.87602.3070.9649
DJ4-40.3370.66792.8580.89252.4630.9920
DJ4-70.0930.84342.9800.92852.8950.9951
DJ4-90.4040.71852.9880.98282.4480.9881
DJ4-130.1460.77722.9060.88142.1170.9362
DJ4-170.4910.76262.9950.97252.5990.9101
Table 4. Fractal dimensions from different methods evaluated by pore-size interval, fitting quality, and physical plausibility.
NumberCharacterization of Fractal Dimension D Using Combined CO2, N2, and MIP Methods
r < 2 nmR22 nm < r < 0.1 μmR20.1 < r < 1 μmR2r > 1 μmR2
DJ1-62.4080.99352.3970.94512.9330.80192.0880.9891
DJ1-82.4080.99322.4640.91832.9870.91252.0060.9982
DJ1-112.4100.99382.4800.91372.8460.87602.3070.9649
DJ4-42.3990.99282.6080.91732.9580.89252.4630.9920
DJ4-72.3930.99302.4450.97642.9800.92852.8950.9951
DJ4-92.4020.99232.6120.90902.9880.98282.4480.9881
DJ4-132.4110.99302.5150.98352.9600.88142.1170.9362
DJ4-172.4080.99332.4840.94552.9950.97252.5990.9101
NumberCharacterization of Fractal Dimension D by NMR Method
r < 10 nmR210 nm < r < 0.1 μmR20.1 < r < 1 μmR2r > 1 μmR2
DJ1-61.6840.72142.8700.87062.7940.99852.9480.9356
DJ1-81.6530.73312.9690.90712.8630.99922.9730.8557
DJ1-111.6640.73412.7920.67032.8540.99782.6720.8809
DJ4-41.6790.71752.9920.84482.9820.99462.7330.8824
DJ4-71.6370.73532.9840.72712.7830.98952.8960.9019
DJ4-91.6530.72352.9870.80332.9550.98162.8510.8912
DJ4-131.7030.70352.9970.45352.7680.98952.9450.8744
DJ4-171.6990.70742.9740.85412.9580.99822.9190.8103
Table 5. Final calibrated fractal dimensions for different pore-size intervals.
NumberCalibrated Full-Pore-Size Pore-Structure Fractal Dimensions D
r < 2 nmR22 nm < r < 0.1 μmR20.1 < r < 1 μmR2r > 1 μmR2
DJ1-62.4080.99352.3970.94512.7940.99852.0880.9891
DJ1-82.4080.99322.4640.91832.8630.99922.0060.9982
DJ1-112.4100.99382.4800.91372.8540.99782.3070.9649
DJ4-42.3990.99282.6080.91732.9820.99462.4630.9920
DJ4-72.3930.99302.4450.97642.7830.98952.8950.9951
DJ4-92.4020.99232.6120.90902.9550.98162.4480.9881
DJ4-132.4110.99302.5150.98352.7680.98952.1170.9362
DJ4-172.4080.99332.4840.94552.9580.99822.5990.9101
Average2.4040.99312.5000.93862.8690.99362.3650.9717
Disclaimer/Publisher’s Note: The statements, opinions and data contained in all publications are solely those of the individual author(s) and contributor(s) and not of MDPI and/or the editor(s). MDPI and/or the editor(s) disclaim responsibility for any injury to people or property resulting from any ideas, methods, instructions or products referred to in the content.