Article

Individualized Prediction of Meningioma Response to Gamma Knife Radiosurgery Using Nested Consensus Machine Learning with 3D Fractal, Lacunarity and Radiomic Features from MRI


1
Centro Gamma Knife Dominicano, CEDIMAT, Plaza de la Salud, Santo Domingo 10514, Dominican Republic
2
Department of Radiology, CEDIMAT, Plaza de la Salud, Santo Domingo 10511, Dominican Republic
3
Department of Basic and Environmental Science, Instituto Tecnológico de Santo Domingo (INTEC), Santo Domingo 10602, Dominican Republic
4
Department of Experimental Oncology, Institute for Oncology & Radiology of Serbia, 11000 Belgrade, Serbia
*
Author to whom correspondence should be addressed.
Fractal Fract. 2026, 10(6), 357; https://doi.org/10.3390/fractalfract10060357
Submission received: 1 April 2026 / Revised: 4 May 2026 / Accepted: 8 May 2026 / Published: 25 May 2026
(This article belongs to the Special Issue Fractal Analysis in Biology and Medicine)

Abstract

Background: This study aimed to develop a fully nested, information leakage-free machine-learning workflow to predict the volumetric response of meningioma to Gamma Knife radiosurgery (GKRS) from pre-treatment MRI and to compare the predictive value of radiomic, fractal, lacunarity and clinical/radiosurgical features. GKRS is widely used for treating meningiomas because of its high precision and efficacy. Variability in tumor volumetric response highlights the need for reliable predictors of treatment outcome. Methods: This retrospective cohort study included 204 patients treated with GKRS for grade I meningioma. Radiomic, fractal and lacunarity features were extracted from pre-treatment CE-T1w 3-Tesla MRIs. Feature signatures were generated using a machine-learning workflow incorporating five feature selectors based on a consensus principle to reduce spurious feature selection, followed by five classifiers to predict binary outcome. Results: The models demonstrated consistent predictive performance in the test folds, with AUC values from 0.77 to 0.84. Supplementing radiomic features with clinical, fractal or lacunarity features did not improve predictive performance. Conclusions: Radiomic features showed the strongest predictive value for meningioma volumetric response to GKRS. Darker intratumoral intensity values were associated with a favorable volumetric response, possibly reflecting biologically less active tumor regions. The supplied code enables individual-level prediction for newly encountered patients.

1. Introduction

Meningiomas are the most common primary brain tumors and are usually benign, with 80–90% classified as WHO grade I [1]. Although most grow slowly and remain noninvasive, a subset shows more aggressive behavior and is classified as WHO grade II or III [1]. Treatment options include surgical resection, radiosurgery or radiotherapy. Despite favorable overall outcomes after Gamma Knife radiosurgery (GKRS), individual treatment response in meningiomas varies considerably, underscoring the need for more reliable predictors of outcome [2,3]. Currently used prognostic indicators include clinical symptoms, patient age, general health status, neurological deficits, recurrence after prior treatment, tumor size, location, degree of delineation from surrounding brain tissue and the presence of cystic components [4,5,6,7,8]. Larger tumor size and male sex have been reported to predispose patients to meningioma progression following GKRS [9,10]. In addition, diffusion-weighted imaging (DWI) and diffusion tensor imaging (DTI) parameters have been investigated as predictors of meningioma type and prognosis after stereotactic radiosurgery (SRS) [9,11,12,13]. Among imaging biomarkers, first-order texture features derived from conventional MRI sequences, fractional anisotropy combined with other DTI-derived parameter maps and the third eigenvalue of the DTI tensor have shown strong correlations with treatment outcomes after SRS. Among standard MRI sequences, the strongest conventional imaging predictor of volumetric outcome was the standard deviation of voxel intensities on T2-weighted images, reflecting the degree of intratumoral signal heterogeneity [14].
Radiomics has shown promise across oncology as a non-invasive method for predicting treatment response and prognosis [15,16]. It extracts quantitative intensity, shape and texture features from medical images to capture tumor characteristics beyond visual assessment. Most radiomic analyses rely on texture features derived from statistical gray-level matrices, such as GLCM, GLRLM and GLSZM, which quantify spatial heterogeneity of voxel intensities and are widely used because of their relative reproducibility, methodological maturity and standardized computation. Descriptors derived from fractal analysis, such as fractal dimension, together with related measures such as lacunarity, provide complementary information by quantifying structural complexity, spatial organization and heterogeneity across scales, but are not incorporated into standard radiomics frameworks. These features are mostly used separately to evaluate diagnostic and prognostic value in MRI and CT studies, including glioblastoma survival prediction and tumor grading [17,18,19].
We previously found that 2D fractal and textural features derived from 2D MRI slices showed similar classification performance [20]. Another study in locally advanced rectal cancer compared 2D textural, intensity and fractal features on T2-weighted MRI and reported that fractal features were the most informative for predicting pathologic complete response after chemoradiotherapy [21]. Other studies have also been limited to 2D fractal features, which are not directly comparable to 3D radiomic features because the two approaches quantify tumor structure in different dimensional frameworks [22,23]. Although other studies did calculate 3D fractal features, they did not compare their performance against standard radiomics features [19,24,25].
Our previous machine-learning study for predicting meningioma volumetric response after GKRS used 337 radiomic features, including features derived from Laplacian of Gaussian (LoG), logarithm and exponential image filters [15]. This made biological interpretation difficult because the resulting predictors obtained on filtered images were less directly linked to the original tumor appearance on MRI [15]. In the present study, we addressed this limitation by restricting the radiomic analysis to 107 features extracted only from the original images and by implementing a strict nested machine-learning framework with consensus-based feature selection. This approach allowed a more reliable assessment of feature stability, reproducibility and relative importance while minimizing information leakage. Furthermore, we hypothesized that incorporation of 3D fractal and lacunarity features into conventional radiomics may improve characterization of tumor heterogeneity and consequently the prediction of meningioma volumetric response. To our knowledge, a direct comparison of standard radiomic texture features with fractal/lacunarity descriptors has not previously been reported.
Deep network architectures are increasingly used for medical image classification purposes. However, these tools are still associated with reduced interpretability [26]. Furthermore, part of the observed predictive performance could reflect the mirage effect [27] or other influences not genuinely grounded in image-derived biological information. Although the MLP-like Kolmogorov–Arnold neural network architecture was designed with improved interpretability in mind (https://arxiv.org/abs/2510.25781, (accessed on 7 May 2026), evidence supporting this advantage remains limited. Therefore, in this study, we used simpler and more interpretable machine-learning tools.
The primary aim of this study was to determine whether pre-treatment MRI provides predictive information even when analyzed using a rigorous, fully nested machine-learning workflow designed to avoid information leakage. The second aim was to reduce the influence of chance feature selection by applying consensus feature selection. We also aimed to improve the biological interpretation of the selected predictors, as the nested ML workflow enabled assessment of feature stability and, together with SHAP, helped identify the most important features and imaging characteristics associated with favorable or unfavorable tumor response. The fourth aim was to directly compare the predictive performance of 3D fractal features and conventional radiomic features. To match the intended real-world application of predicting future patients from a retrospective institutional cohort, the dataset was divided chronologically rather than randomly into development and test subsets. Our code freezes the final optimized models and enables prospective, individual predictive assessment for each newly encountered patient. The clinical relevance of improved treatment outcome prediction lies in supporting personalized treatment planning and optimization of therapeutic strategies, ultimately enhancing patient care. If an unfavorable outcome is predicted, a higher prescribed tumor dose or greater consideration of surgical resection may be warranted. Conversely, if a very favorable outcome is predicted, the tumor dose may be reduced to minimize the risk of treatment-related complications.

2. Materials and Methods

This study adheres to the guidelines set out in the STROBE statement for cohort studies.

2.1. Ethics Approval Statement

The study received approval (CEI-290) from the CEDIMAT Institutional Review Board and adheres to The Code of Ethics of the World Medical Association (Declaration of Helsinki), as published in the British Medical Journal (18 July 1964) and its 7th revised edition in 2013. The need for written informed consent was waived by the ethics committee due to the retrospective nature of the analysis.

2.2. Patients

A total of 204 patients with grade I meningioma were included in this study. Patient age ranged from 15.2 to 88.7 years (mean 53.6). All patients were treated at our Gamma Knife center. Magnetic resonance imaging (MRI) had been performed within 4 weeks prior to radiosurgery, and follow-up imaging was available for at least 12 months after treatment (range 12–152 months; mean 47.4 months; Table 1). Tumor volumes ranged from 0.3 to 50.9 cm3 (mean 8.4 cm3).
Tumor location was at the skull base in 133 cases, at the convexity in 61, at the falx in 5, at the tentorium in 3, and intraventricular in 2 patients. A history of previous surgery was documented in 88 cases. Histological results were available in 25 of these patients. Among these, 19 tumors were classified as meningothelial or psammomatous meningiomas, five as fibroblastic meningiomas, and one as transitional meningioma; none showed atypical features. In cases without available histology, tumors were presumed to represent WHO grade I meningiomas based on typical radiological characteristics, including homogeneous contrast enhancement, presence of a dural tail, absence of extension through cranial foramina, minimal or no peritumoral edema, and lack of significant lobulation.

2.3. Gamma Knife Treatment

Treatments were performed using a Gamma Knife model 4C from 2011 to 2021, subsequently using the model ICON (Elekta Instrument AB, Stockholm, Sweden). Details of the Gamma Knife treatment technique were previously described [28]. On treatment day MRI sequences were coregistered to a stereotactic 3D CT image set.
Depending on tumor size and location, the prescribed margin dose ranged from 11 to 24 Gy (Table 1). Most meningiomas (177 cases) were treated in a single session, with margin doses between 11 and 18 Gy (mean 13.7 Gy).
According to our institutional protocol, tumors located close to organs at risk (OARs), particularly the anterior optic pathway (AOP), were treated with hypofractionated stereotactic radiosurgery (HFSRS). This approach was used in 27 cases. These patients received either 6 Gy in three fractions or 5–6 Gy in four fractions on consecutive days.
To allow comparison between different fractionation regimens, the biologically effective dose (BED) was calculated based on the widely used linear–quadratic (LQ) model, acknowledging its limitations at high doses [29]. HFSRS doses were further converted into single-fraction equivalent doses (SFED) [30] to facilitate comparison with conventional single-session radiosurgery. Using an α/β ratio of 3.76 Gy [31], the calculated margin SFED for HFSRS treatments ranged from 9.4 to 13.5 Gy (mean 11.9 Gy).
All treatments were planned using the Leksell GammaPlan workstation (Elekta AB). Planning aimed to achieve high tumor coverage (mean 96.3%) while limiting radiation exposure to critical structures such as the anterior optic pathway, cochlea and brainstem.

2.4. Sample Size Calculation

Sample size was prospectively calculated based on a pilot experiment including 100 patients, which showed that 136 patients, with 23 positive cases, were required to detect an AUC of 0.70 with α = 0.05 and β = 0.10 (MedCalc v20; MedCalc Software Ltd., Ostend, Belgium). The 100 patients from the pilot experiment were included in the final cohort.
In total, the final CE-T1w cohort comprised 204 patients, including 45 positive cases, with AUCs ranging from 0.77 to 0.84.

2.5. MRI

MRI was performed on a 3-Tesla scanner (Achieva; Philips, Eindhoven, The Netherlands). Contrast-enhanced sequence was acquired with the following parameters:
3D-T1w magnetization-prepared rapid acquisition (MPRAGE) sequence: gradient echo, TR/TE/TI 6.8/3.2/900 ms, flip angle 8°, measured voxel size 0.6 × 0.6 × 1.0 mm, before and after intravenous injection of contrast medium.

2.6. Postprocessing

All 204 meningiomas were manually delineated on CE-T1w images using the Leksell GammaPlan (Elekta Instrument AB, Stockholm, Sweden) workstation by experienced neurosurgeons with 5 to 16 years of radiosurgical experience, in collaboration with a neuroradiologist with more than 43 years of experience. Image sets were reviewed for quality, and sequences with artifacts were excluded.

2.7. Follow-Up

Imaging and clinical follow-up were performed every six months for the first two years after GKRS and annually thereafter.

2.8. Extraction of Radiomics Features

MRI intensities were normalized using z-score normalization before feature extraction. In addition, all images were resampled to isotropic 1 × 1 × 1 mm voxels using interpolation to standardize spatial resolution across scans. The radiomics analysis was conducted using Pyradiomics (version 5.6.1) [32]. The parameter file instructed the preprocessing computation of all available image transformations and feature types. We only used the 107 features per MRI scan obtained from original images. Prior to Pyradiomics analysis, MRI scans underwent z-score intensity normalization, followed by scaling with a factor of 600. To standardize image resolution, all scans were resampled to an isotropic voxel spacing of 1 × 1 × 1 mm using B-spline interpolation. For detailed descriptions of the extracted radiomics features please see: https://pyradiomics.readthedocs.io/en/latest/features.html (accessed on 7 May2026).

2.9. Extraction of Fractal, Lacunarity and Additional Shape Features

3D fractal and lacunarity features were computed from isotropically resampled (1 mm3) segmented tumor volumes.
Binary-mask fractal features (binROI3D_Db_D) were derived from the 3D segmented tumor volume after binarization of the mask (tumor voxels = 1, background = 0) using box counting across spatial scales; the resulting slope (Db_D) represented the fractal dimension, while r2, se and yint described the regression fit.
Surface fractal features (surfROI3D_Ds_D) were also computed together with the corresponding regression-derived parameters r2, se and yint, but only on the extracted 3D tumor boundary shell, thereby characterizing surface irregularity rather than the full filled volume.
The grayscale fractal feature (grayROI3D_dbc_D) was computed from normalized tumor intensities using a 3D differential box-counting approach.
The main grayscale lacunarity feature was gray3D_lac_nonoverlap_mean, which quantified the multiscale heterogeneity of grayscale box masses across non-overlapping boxes. In addition, regression-derived parameters describing the scale dependence of lacunarity were calculated, including the scale-dependence parameter slope_loglac_vs_log1s and the fit-related parameters r2, se, and yint. These features, together with the thirteen additional shape features, are described in more detail in Supplementary File.
The following 14 clinicopathological features were used alongside the fractal, lacunarity, and standard radiomic features: age at first GK session, gender, volumetric classification, hypofractionation, number of fractions, margin dose/fraction [Gy/fx], maximum dose/fraction [Gy], total physical dose to the margin (dose per fraction × number of fractions), BED, SFED, coverage [%], selectivity, Paddick index, and initial volume [cm3].

2.10. Machine Learning Workflow

A total of 191 features calculated from the CE-T1w sequence were included in the ML workflow. A fully nested repeated stratified cross-validation framework was used to prevent information leakage and provide an unbiased estimate of predictive performance. In each split, features were z-score normalized and filtered for near-zero variance, univariate AUC and high pairwise correlation. The remaining features were then evaluated using five feature selection methods: mRMR, N-mRMR, Boruta, L1-regularized selection and Elastic Net. Features selected by at least three of these methods were retained by consensus. The resulting feature set was used to train five classifiers: Gaussian Naïve Bayes, Gaussian Process, ExtraTrees, logistic regression and stochastic gradient descent with log-loss.

2.11. Outer Folds

In each outer iteration, the development cohort was divided into outer-training and outer-validation folds. All preprocessing, feature filtering, feature selection, model fitting and hyperparameter tuning were performed using only the outer-training data. The outer-validation folds were reserved solely for performance evaluation.

2.12. Inner Folds

Within each outer-training set, stratified five-fold inner cross-validation was used for model selection and hyperparameter tuning. Feature robustness was assessed by selection frequency across folds and repeats.

2.13. Final Model Refitting, Independent Test-Set Evaluation and Inference

Test-set performance was assessed by refitting the complete preprocessing, feature-selection and classification pipeline on the entire development cohort (train and validation subsets) using the optimal hyperparameters and then evaluating this final refit model once on the independent holdout test set.
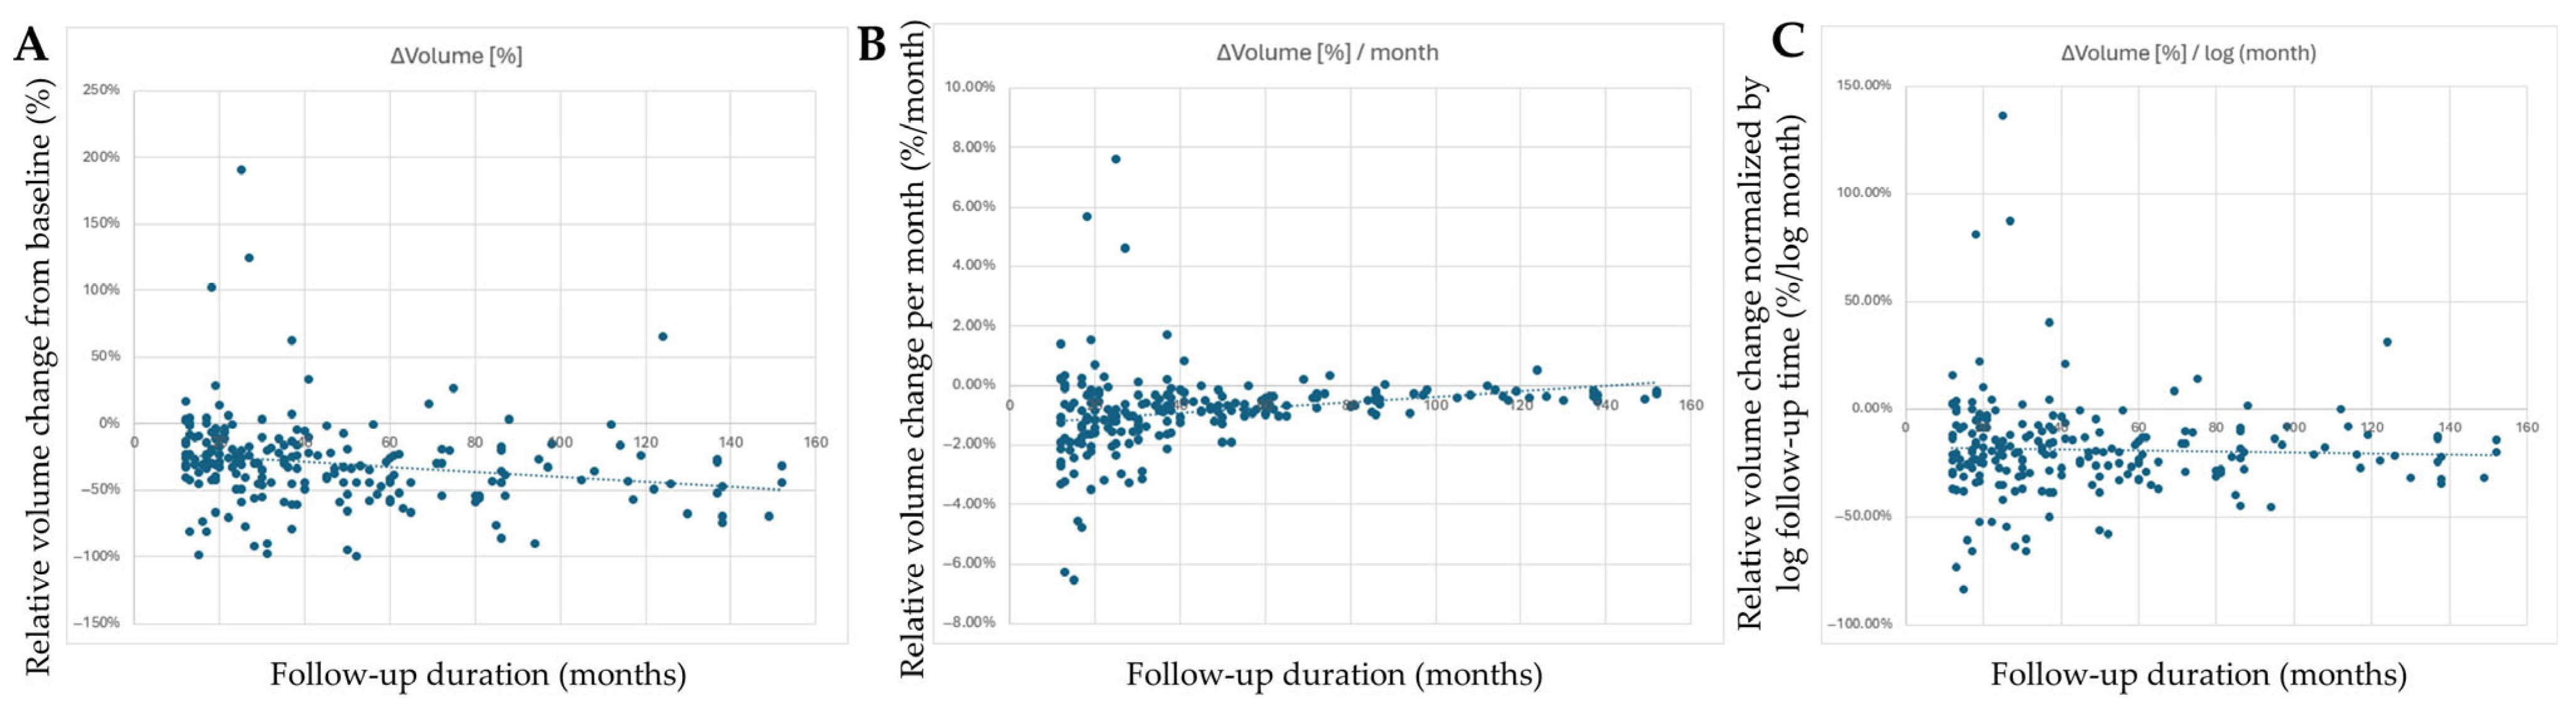
Because follow-up duration differed substantially among patients, simple relative volume change was not considered an optimal outcome measure, as it does not distinguish treatment response from length of observation. Normalization by follow-up time in months partially addresses this issue but assumes a linear rate of volume change, which did not adequately reflect the observed behavior of meningioma volume after radiosurgery. In this study, serial meningioma volume measurements demonstrated an approximately exponential pattern of volume decay, supporting the use of logarithmic time adjustment. The approximately exponential tumor volume regression was also previously observed after SRS [33], particularly beyond an initial phase of approximately twelve months [34]. Because exponential processes become linear when expressed against ln(time), quantifying response relative to ln(time) enables more consistent comparisons across patients with different follow-up durations [15].Therefore, relative volume change normalized by logarithmic follow-up time was selected as the primary outcome. This transformation reduced the dependence of the outcome on follow-up duration, produced an approximately stable regression trend across time, and preserved a wide dynamic range of response values, making it more suitable for modeling individualized volumetric response after radiosurgery (Figure 1).
The normalized endpoint was computed as:
ΔV_log = (V_last − V_SRS)/(V_SRS·ln(T_FU))
where “V_SRS” denotes tumor volume at radiosurgery, “V_last” the tumor volume at last follow-up, and “T_FU” the time interval from SRS to the final follow-up [15].
Inference in our workflow refers to applying the frozen, finalized model to a new patient. Because model training and feature selection are omitted at this stage, this prediction step is computationally lightweight and takes 30 s.

2.14. Feature Importance Using SHAP

Feature importance was assessed using SHapley Additive exPlanations (SHAP), which quantifies each feature’s contribution to an individual prediction relative to the model’s expected output. For each feature, SHAP values were calculated for each sample in the test set, and the mean absolute SHAP value was used to summarize feature importance.
SHAP values were computed using model-specific explainers when supported: TreeExplainer was used for the tree-based ExtraTrees model, and LinearExplainer was used for logistic regression and SGD (log-loss) models. In contrast, Gaussian Naïve Bayes and the Gaussian Process classifier do not provide a model structure compatible with fast analytical SHAP explainers.

3. Results

The treatment results are presented in Table 1. After a mean follow-up of 47.4 (12–152) months, the control rate was 96.1%. The volume of meningiomas at the latest imaging follow-up was compared to pre-SRS imaging data and categorized according to RANO criteria for meningiomas [35]. Partial response was achieved in 45 (22.1%) meningiomas, while a minor response was observed in 81 (39.7%). Stable disease occurred in 70 (34.3%) cases, and progressive disease was observed in eight (3.9%) meningiomas at the last follow-up. The absolute volume decreased by 2.24 cm3 at the last follow-up, with a mean volume change rate of 0.87% per month.
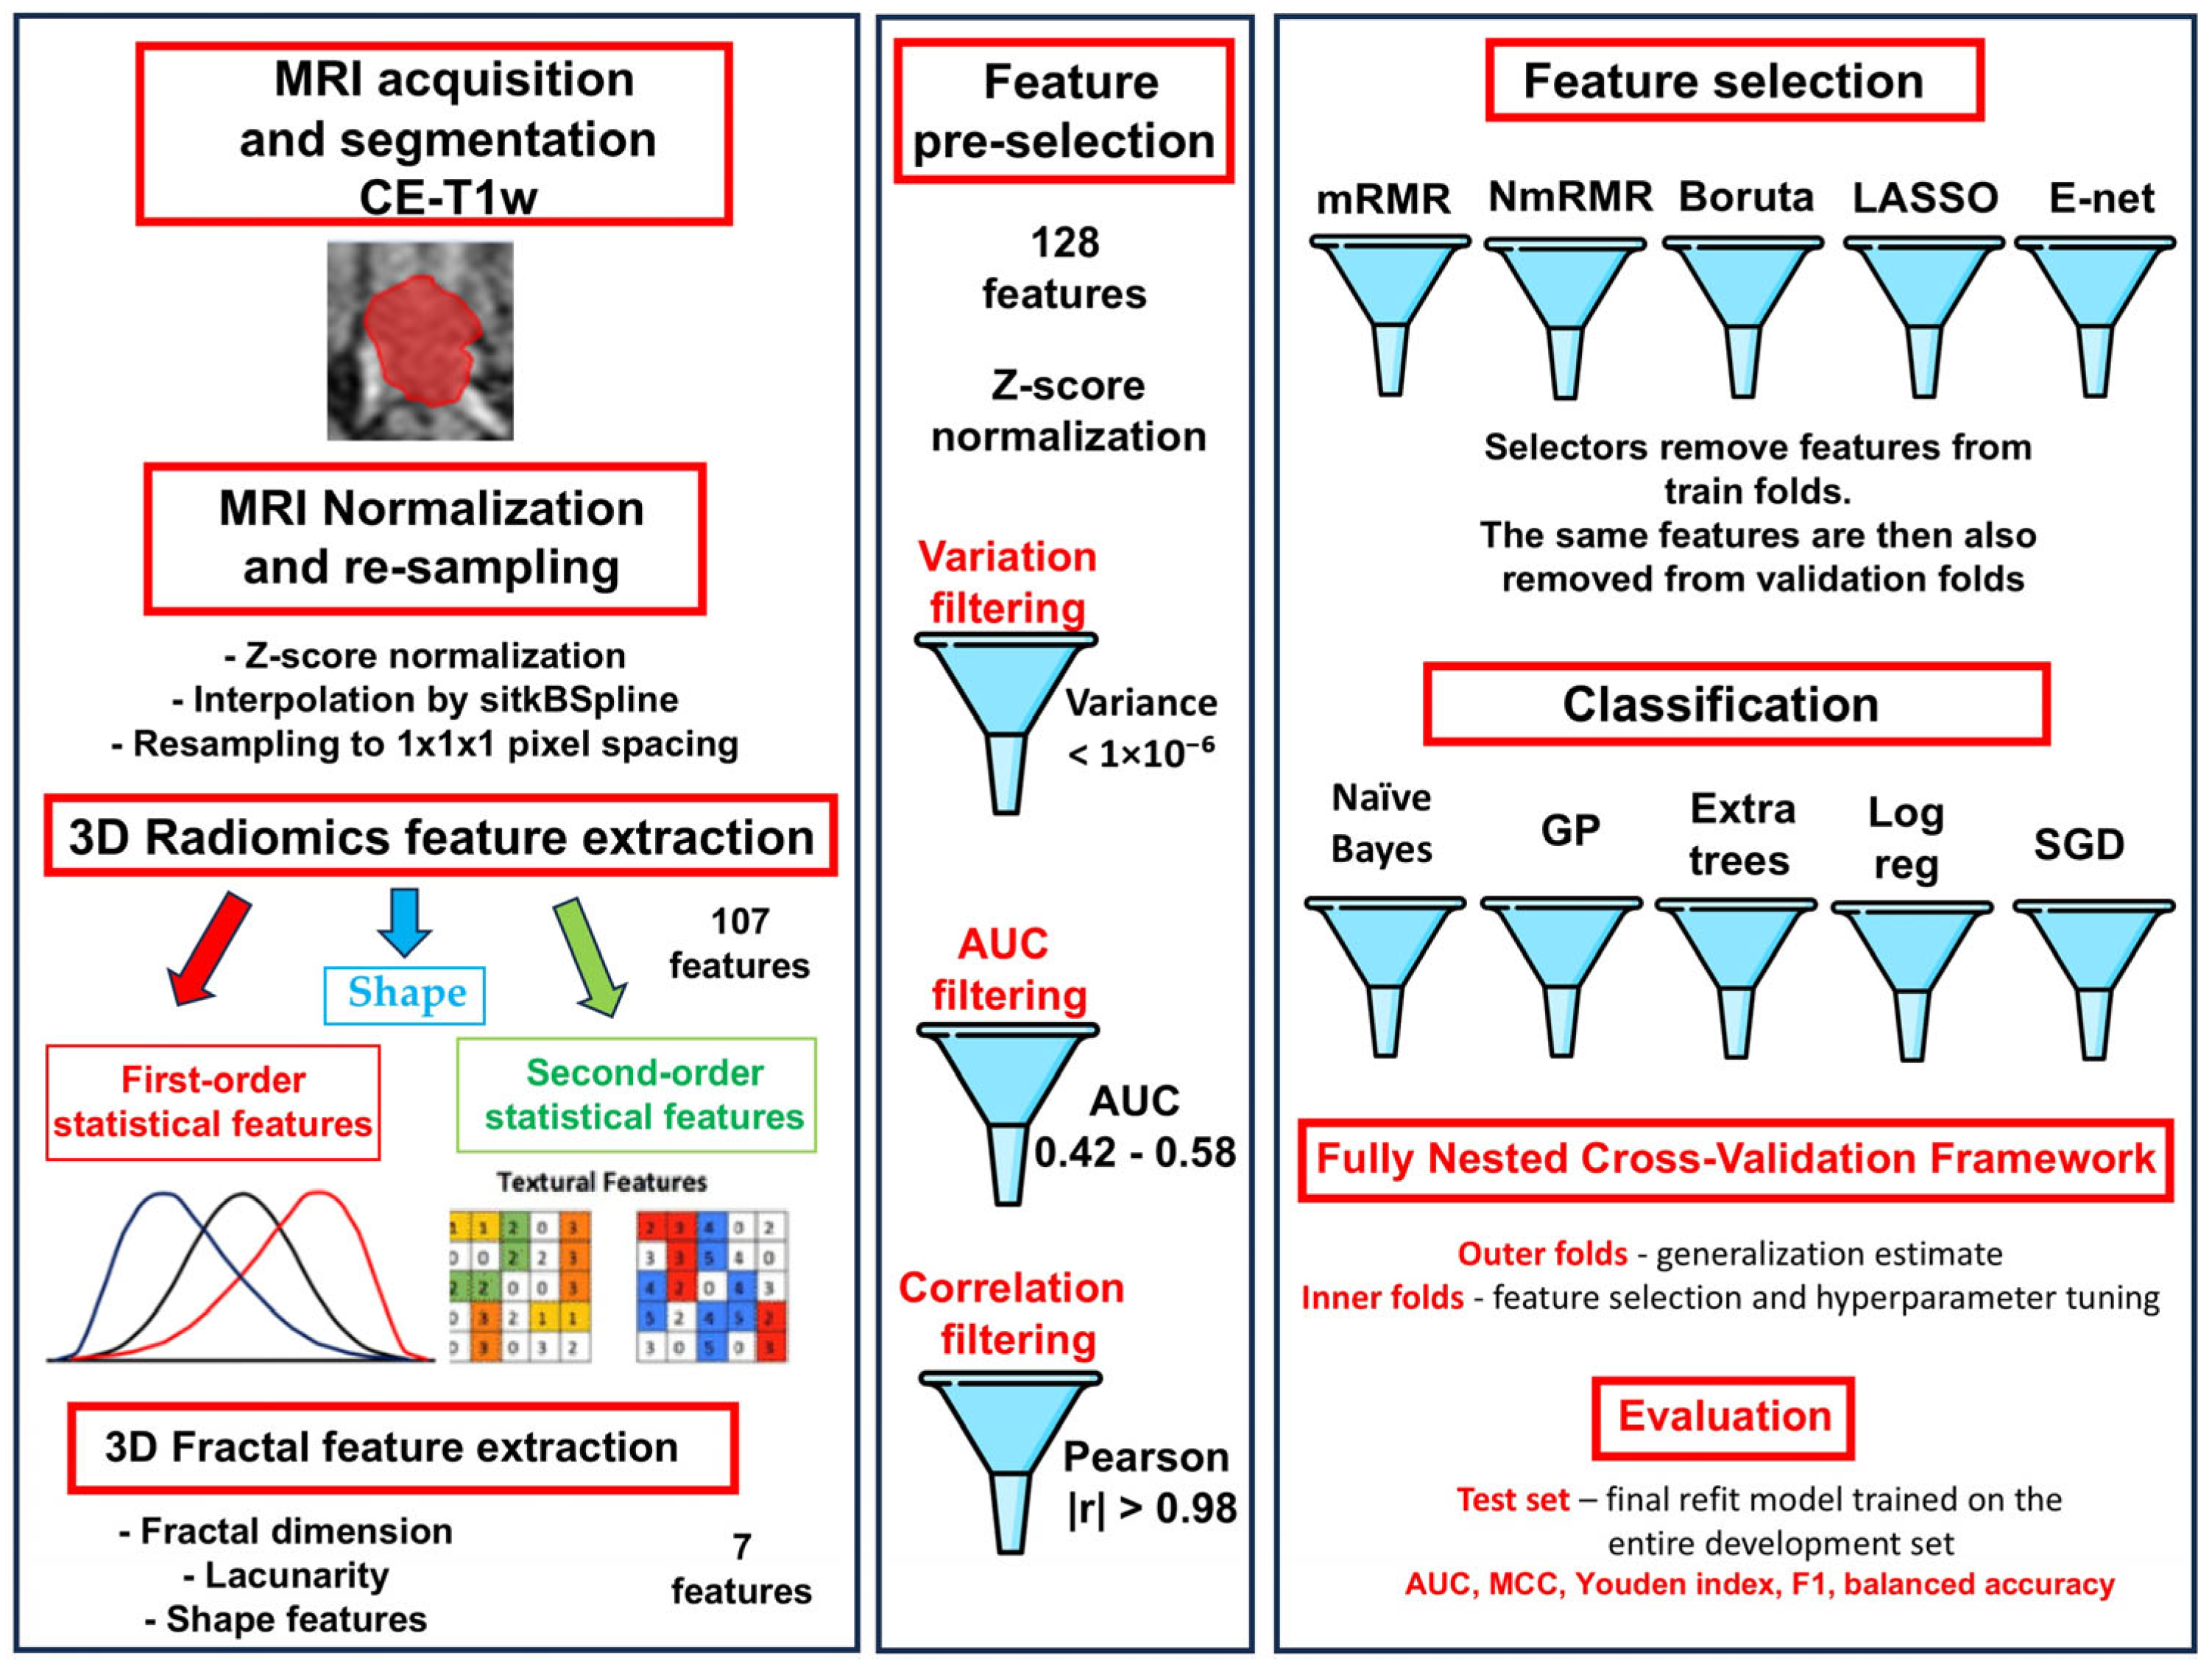
The workflow of the study is shown in Figure 2. The predictive models for meningioma response to radiosurgery were developed using contrast-enhanced T1-weighted MRI. Feature processing and selection were implemented exclusively in a nested way, only within training folds to prevent information leakage. After within-fold z-score normalization, features passed through three filters: a low-variance (threshold variance < 1 × 10⁻⁶), followed by a univariate AUC-based filter to remove near-random predictors (AUCs 0.42–0.58) and a Pearson correlation filter (|r| > 0.98) to reduce redundancy (Figure 2). The remaining features were then subjected to five feature selection methods: mRMR, normalized mRMR, Boruta (random forest–based selection), L1-regularized selection (LASSO-type) and Elastic Net selection. A consensus rule was applied, retaining features selected by at least three of the five selectors. Such agreement across multiple feature selectors reduced the influence of selector-specific instability and helped limit spurious features from affecting model performance. Thus, the use of multiple complementary feature selectors was intended to improve robustness, rather than to obtain a favorable result by chance (Figure 2). The consensus feature sets were used to train multiple classifiers: Gaussian Naïve Bayes, Gaussian Process, Extremely Randomized Trees (ExtraTrees), logistic regression and SGD classification with log-loss (Figure 2).
Two separate cross-validation procedures were applied: the inner loop was used for model development, including preprocessing, feature selection, hyperparameter tuning and determination of the decision threshold, while the outer loop was used for unbiased evaluation of generalization performance in unseen patients. This ensured that model optimization and final performance assessment were performed independently, in separate cross-validation loops, reducing the risk of overfitting and information leakage.
Additionally, the repeated nested design enabled assessment of feature-selection stability, defined as the product of the frequency with which a feature entered the consensus set across the five folds and the mean number of feature-selector votes (n_folds_in_consensus x mean_selector_votes).
Final test performance was assessed once by retraining the full workflow: preprocessing, feature-selection and classification pipeline on the entire development cohort with the previously selected hyperparameters and applying this final refit model to the independent holdout test set. AUC, MCC, Youden index, F1, accuracy and balanced accuracy were used for predictive evaluation.
This machine-learning classification workflow integrated clinical features together with three imaging-derived feature groups: standard radiomics, fractal features and lacunarity features. Standard PyRadiomics features comprise first-order intensity features that describe the distribution of voxel values, shape features that characterize VOI geometry and texture features derived from matrices such as GLCM, GLRLM, GLSZM, GLDM, NGTDM, which quantify spatial gray-level patterns and intratumoral heterogeneity. In contrast, fractal dimension (FD) quantifies the scale-dependent geometric complexity of tumor structure, whereas lacunarity measures the distribution of gaps, voids and clustering, thereby reflecting spatial “gappiness” and heterogeneity.
Because the clinicopathological feature set (n = 14) and the fractal/lacunarity feature sets (n = 17) were small, they were not analyzed as standalone feature groups (Table 2). Instead, their contribution was assessed by comparing the radiomics-only model with models in which CP and/or fractal/lacunarity features were added to the radiomic feature set (Table 2). These additions did not improve classification performance, as the AUC did not increase beyond 0.840, which was achieved using radiomic features alone (Table 2).
However, CP, fractal and lacunarity features still demonstrated predictive relevance, as both were included among the top 20 selected features (Table 3). One fractal feature ranked among the top 20, grayROI3D_dbc_se, in which se denotes the standard error of the regression used to derive the grayscale fractal dimension, thereby reflecting the goodness-of-fit and stability of that estimate across scales. Among the most important lacunarity features was gray3D_lac_nonoverlap_r2, where r2 denotes the coefficient of determination, reflecting how well lacunarity conforms to a scale-invariant relationship across spatial scales. Notably, both selected features represented fit-quality parameters, rather than the primary fractal or lacunarity measures themselves, which weakens their interpretation. Based on grayROI3D_dbc_se, a better response was associated with less tightly fitted grayscale fractal scaling, whereas based on gray3D_lac_nonoverlap_r2, a better response was associated with a more regular and better-defined lacunarity pattern across scales (Table 3). Overall, tumors with better response tended to show a less uniform fractal intensity pattern but a more consistent multiscale gap/texture organization. The main fractal features grayROI3D_dbc_D and binROI3D_dbc_D, as well as the main lacunarity feature gray3D_lac_nonoverlap_mean, were not among the top 20 selected features.
Although shape features seem enriched in the selected set, with four of the top 20 selected features (20%) being shape-related, they were not, because in the total pool, 27 of 151 features (18%) were shape-related. All selected shape features reflect tumor geometry: shape3D_roughness (surface irregularity relative to the convex hull), shape3D_radius_max_min_ratio, shape3D_radius_min_mm_volume_mm3 and original_shape_Flatness (low values mean the VOI is very thin/flat). Shape features suggested that better radiotherapy response was associated with tumors that had smoother surfaces and a more elongated shape, whereas poorer response tended to occur in tumors with rougher surfaces and a more spherical morphology (Table 3).
Five of the selected features (25%) were emphasis features but this again did not represent enrichment because emphasis features already comprised 24 of 107 standard radiomic features (22.4%) in the total pool. These features describe how strongly the image contains particular structural patterns, such as small homogeneous regions, long continuous runs or high-intensity areas. These texture features suggested that a good outcome was associated with greater representation of low-gray-level components, including long runs of low-intensity voxels, more low-intensity zones and overall emphasis on low (darker) gray levels. Taken together, better responders appeared to show a texture pattern shifted toward darker lower intensities and away from extensive compact high-intensity areas (Table 3).
Several selected features were clinical, including Selectivity, Coverage (%) and Paddick. Overall, the top 20 selected features included all feature classes used in the study: clinical, standard radiomic, fractal and lacunarity.
The features in Table 3 are ranked by stability and importance, enabling comparison of the relative contribution of CP, standard radiomics, fractal and lacunarity features. Stability was defined by combining the number of folds in which a feature was retained by the selector consensus, multiplied by the mean number of selector votes. This stability value was further multiplied by the mean absolute SHAP value to obtain feature importance. SHAP values were calculated through a logistic regression classifier because the best-performing classifier, Naïve Bayes, does not support SHAP analysis. However, the performance difference between the logistic regression (AUC = 0.812) and Naive Bayes (AUC = 0.833) classifiers was only marginal, suggesting that the importance analysis is unlikely to be affected. The most important feature was Skewness, a first-order intensity feature that measures the asymmetry of the voxel-intensity distribution around the mean, indicating whether the histogram has a heavier tail toward higher or lower intensities. Because its AUC was below 0.5, lower Skewness values were associated with better volumetric response, implying that relatively darker VOIs were associated with better response.

4. Discussion

This study demonstrates that radiomic signatures derived from pre-GKRS MRI data can predict tumor volumetric response to radiosurgery even within a rigorously implemented, fully nested radiomics machine-learning pipeline designed according to best-practice standards to prevent information leakage and minimize optimism bias. Fractal and lacunarity features did not provide additional predictive value beyond standard radiomic features, while the radiomics-only model achieved an AUC of 0.84.
Previous studies have demonstrated the value of advanced MRI techniques, particularly DWI and DTI, as predictors of meningioma histological type and prognosis following stereotactic radiosurgery [9,10,11,12,13,14]. These diffusion-derived metrics have been associated with tumor cellularity, microstructural integrity and biological aggressiveness, making them promising biomarkers for outcome prediction. Unfortunately, the predictive performance of these studies cannot be directly compared with that of our current study, as they did not report AUC, F1 score or other standard measures of prediction performance. Instead, they reported hazard ratios, correlation coefficients and F-values. In addition, other investigations have shown the benefit of applying texture analysis [14] and broader radiomics methodologies [15] to conventional MRI sequences for forecasting volumetric tumor behavior after SRS. Study [15] outperformed our current study by achieving an AUC of 0.88; however, it included a small cohort of 93 patients and did not use a nested workflow. Furthermore, the aim of the present study was not to compete with previously reported AUC values, but to estimate the true predictive value of radiomics and compare it with that of 3D fractal features.
Although 3D fractal and lacunarity descriptors are theoretically appealing as complementary imaging biomarkers, because they quantify multiscale structural complexity, space-filling irregularity and spatial nonuniformity beyond the scope of conventional texture analysis, in this study, their addition did not improve predictive performance over standard radiomic features alone. This should not be interpreted as evidence that MRI fractal or lacunarity features lack biological relevance, but rather as highlighting a key methodological challenge in their application to magnetic resonance imaging. In this study, the average number of voxels within the tumor VOI was 10,454 ± 8832, which is approximately 1000-fold lower than the number of pixels in a typical 10-megapixel tumor histology image. Therefore, even the largest meningioma in this study, containing 43,286 voxels, remains far below the pixel count typically available in histopathology images. Reliable fractal estimation depends on the availability of a sufficiently broad range of spatial scales, while an MRI tumor VOI might contain too few voxels to support stable multiscale analysis. As a result, only a small number of 3–5 3D spatial scales can be sampled, making regression-based estimates of fractal dimension vulnerable to noise and numerical instability. This limitation arises from the relatively low spatial resolution of routine clinical MRI, which restricts the structural detail available for robust fractal characterization. By contrast, conventional radiomic texture features rely on local voxel-intensity relationships and can therefore be extracted more reliably from a smaller number of MRI voxels. Taken together, these findings suggest that, in the MRI setting, the added value of fractal and lacunarity analysis is limited. This is consistent with previous findings showing that 3D fractal features calculated from MRI achieved modest classification performance in meningioma, with AUC values up to 0.74 [25].
Fractal and lacunarity descriptors extracted from tumor VOIs on MRI or CT have previously been investigated as imaging biomarkers for tumor characterization and prognosis, including glioblastoma survival prediction [17] meningioma grading [36] and glioma classification [19]. Mezei et al. used fractal dimension and lacunarity features extracted from MRI tumor segmentations for predicting meningioma histological grade using logistic regression models, without the use of machine-learning classifiers. Fractal features alone achieved moderate predictive performance (AUC = 0.697 for WHO grade); however, standard radiomic texture features were not included in the analysis for comparison [25]. Fractal dimension and lacunarity derived from tumor MRI were tested for the preoperative classification of pediatric posterior fossa tumors and a scoring system was proposed by combining fractal metrics with conventional imaging features. Although the model achieved moderate discriminative performance (AUC = 0.79), it relied on logistic regression rather than modern machine-learning approaches and did not include standard radiomic features for comparison [37]. Our previous directionally sensitive fractal analysis study of osteosarcoma MRI scans also did not compare fractal and radiomics features, or calculated 3D fractal features [38,39]. Importantly, all the above studies calculated fractal features in 2D tumor slices, which have several methodological limitations: 2D analysis ignores inter-slice tumor heterogeneity, depends strongly on slice selection and might primarily capture boundary complexity rather than the full three-dimensional tumor architecture [25,37,40]. The 3D whole-volume analysis used in this study has been shown to provide greater interobserver reproducibility of radiomic and fractal features in MRI studies [36,41]. Unlike prior studies that used 2D fractal descriptors as auxiliary radiomic features, our current study integrates 3D fractal and lacunarity features with radiomics in a fully nested machine-learning framework optimized for unbiased prediction of individual future patients.
Feature importance based on stability and SHAP analysis indicated that the top 20 selected features included eight textural features, three intensity, one fractal, one lacunarity, four shape and three clinico-dosimetric features. We extracted 1781 reliably calculable PyRadiomics features from the original and all filtered or transformed image versions, with reliability defined by gray-level discretization such that the selected bin width was expected to produce 30–130 bins across patient scans. However, only the 107 features derived from the original images were included in the final analysis, as this smaller set improves model usability by being more practical for prospective individual-level prediction and facilitating clinical interpretation. In addition, the inclusion of approximately 1600 extra features from transformed images provided only marginal improvement in predictive AUC (unpublished observation). Better volumetric response to GKRS was associated with a smoother tumor surface, increased flatness and greater elongation, as well as with textures shifted toward darker, lower-intensity components and a more regular multiscale lacunarity pattern. In contrast, poorer response tended to occur in less elongated, rounder tumors with rougher surfaces and a greater prominence of compact, lighter, higher-intensity regions. The selected fractal/lacunarity-related features were primarily fit-quality parameters rather than direct primary fractal and lacunarity descriptors of tumor morphology or texture. Therefore, their biological interpretation is limited. This supports the view that MRI provides relatively low resolution and voxel counts; therefore, fractal/lacunarity estimates may be influenced by the stability and quality of model fitting. Surface regularity, flatness and elongation features have previously been evaluated for the prediction of meningioma grade, but not GKRS response [42]. Features identified as important in the present study, such as t1c_original_shape_MajorAxisLength and t1c_original_shape_Flatness, were also previously reported as important for predicting recurrence in atypical meningioma [43].
Furthermore, the interpretation of the selected features extends to the first-order intensity features: kurtosis and the 10th percentile, which were among the most informative predictors in this study. Together, these features indicate that tumors containing a greater proportion of darker, lower-intensity components on contrast-enhanced T1-weighted MRI were more likely to respond favorably. This is consistent with previous radiomics studies suggesting that first-order intensity-based features may outperform higher-order texture metrics in predicting outcome in benign brain tumors, particularly under standardized imaging conditions [44,45]. There is no direct link between darker intensity values and skewness, because skewness reflects the asymmetry of the intensity distribution rather than absolute signal intensity itself. Our findings align with an earlier report implicating skewness as a marker of biologically relevant heterogeneity associated with radiosurgical outcome, although direct comparison is limited because that study evaluated post-treatment rather than pre-treatment MRI [46]. In addition to their predictive value, first-order features may offer greater translational potential because they are relatively robust, reproducible and straightforward to interpret.
A possible biological explanation is that lower signal intensity, resulting from less enhancement on contrast-enhanced T1-weighted MRI, may reflect cystic change, intratumoral hemorrhage, reduced vascular density, fibrotic transformation, edema, necrosis or calcification [47,48]. Such properties could correspond to lower cellularity, lower proliferative activity, or impaired microvascular supply, all of which may favor radiosurgical response or limit post-irradiation tumor expansion. This interpretation is supported by prior Gamma Knife studies showing that heterogeneous MRI appearance, including mixed enhancement patterns and non-uniform internal architecture, is associated with improved local control and lower progression rates after stereotactic radiosurgery [49,50,51]. Our results extend this concept by indicating that relatively simple first-order radiomic features can capture clinically meaningful heterogeneity relevant to treatment response. This was consistent with second-order emphasis features showing in this study that long dark runs were associated with good response, whereas extensive compact high-intensity areas were associated with poor response.
From a treatment-planning perspective, pre-radiosurgical prediction of volumetric response may have practical clinical value. Imaging signatures associated with unfavorable response could support consideration of dose escalation, hypofractionation, or earlier surgical resection, whereas highly favorable predicted response might justify dose de-escalation to reduce the risk of radiation-induced complications, particularly near critical neurovascular structures. More broadly, this approach is consistent with the emerging concept of personalized radiosurgery, in which treatment is adapted to tumor-specific biological characteristics rather than based solely on size and location [52].
To our knowledge, this is only the second meningioma study to apply computational prognostic or predictive modelling. A further novel aspect is the newly developed machine-learning framework, which combines a nested workflow to prevent information leakage with consensus feature selection to reduce chance-driven feature selection. Although nested machine learning is widely regarded as the appropriate approach, it remains rarely implemented in published prognostic and predictive studies. To illustrate this, we added in the Supplementary Materials an example set of 25 PubMed-listed machine-learning studies identified using the keywords “prognosis”, “predict”, “cancer”, and “machine learning”; only one explicitly mentioned a nested design, while three provided the code used in the study (Supplementary File). This is important because, without a proper workflow, it becomes difficult to determine whether reported results reflect true predictive value or are inflated by information leakage.
The nested design strengthened the study in several ways. It separated model selection from model evaluation, with the inner loop used for hyperparameter tuning and pipeline selection and the outer loop used for unbiased performance estimation. In addition, all supervised feature-selection and preprocessing steps—including scaling, variance filtering, AUC-based filtering, correlation filtering, and class balancing—were performed only within the training folds. This prevented validation-fold labels, defined here as the binary outcome of good versus poor responder, from influencing feature selection or preprocessing, and ensured that the reported internal performance reflected the full model-building procedure rather than a classifier evaluated after globally optimized preprocessing or feature selection.
Another novel aspect is the direct comparison between 3D fractal features and conventional radiomic features. In addition, the study provides implementation-ready code for Google Colab, making it suitable for users who are not experienced with complex coding tools.
Limitations of this study include the cohort size, although the cohort was highly homogeneous and widely exceeded minimum sample size requirements. Larger cohorts are needed to further confirm the association between the features selected here and meningioma volumetric response to GKRS. Additional limitations include the relatively short follow-up period and the retrospective study design. Although the models were validated on a patient subset from the same institution that was used for model development, external validation is required to confirm broader generalizability and clinical applicability. However, this institutional validation is clinically relevant, as the model would initially be intended for use in our own institutional patients. Finally, despite the objective computational framework, some degree of subjectivity remained in tumor VOI segmentation. Although all tumor segmentations were performed by experienced radiosurgical neurosurgeons in collaboration with an experienced neuroradiologist, ROI delineation remains a potential source of variability. Minor boundary differences may affect radiomic features and could be amplified in features that depend on 3D spatial organization, including fractal and lacunarity estimates. A formal segmentation-perturbation or interobserver variability analysis was beyond the scope of the present study and should be addressed in future work.

5. Conclusions

To our knowledge, this is the first study to compare radiomic, fractal and lacunarity features within the same 3D framework for the classification of MRI or CT scans. One fractal and one lacunarity feature were selected in the final model, indicating predictive value; however, their inclusion did not improve the performance of standard MRI-based radiomic features for classifying meningioma volumetric response to GKRS. Darker intratumoral intensity values on pre-treatment contrast-enhanced T1-weighted MRI were associated with a more favorable volumetric response to stereotactic radiosurgery, possibly reflecting biologically less active tumor regions.
The applied machine-learning pipeline used a fully nested design to prevent information leakage and supports one-by-one prediction for future individual patients using a frozen model trained retrospectively on an institutional cohort, making it suitable for potential internal use within our institution.

Supplementary Materials

The following supporting information can be downloaded at: https://www.mdpi.com/article/10.3390/fractalfract10060357/s1, Supplementary File: Prediction of survival in patients with spinal metastatic disease.

Author Contributions

Conceptualization, H.S., V.V. and M.R.; methodology, H.S., V.V. and M.R.; software, M.R.; validation, H.S.; formal analysis, H.S., V.V. and M.R.; investigation, H.S., I.G., G.H., J.B., D.R., L.S., S.V., I.P., J.P., T.B., I.R. and P.S.; resources, H.S., I.G., G.H., J.B., D.R., L.S., S.V., I.P., J.P., T.B., I.R. and P.S.; data curation, H.S. and I.G.; writing—original draft preparation, H.S., V.V. and M.R.; writing—review and editing, H.S., I.G., G.H., J.B., D.R., L.S., S.V., I.P., J.P., T.B., I.R., P.S., V.V. and M.R.; visualization, H.S., V.V. and M.R.; supervision, H.S. and V.V.; project administration, H.S. and V.V.; funding acquisition, V.V. All authors have read and agreed to the published version of the manuscript.

Funding

This work was supported by the University Instituto Tecnologico de Santo Domingo (INTEC), Dominican Republic, grant number CBA-220903-2024-P-1.

Data Availability Statement

Data and the used code are available in a publicly accessible repository at https://github.com/jonasharad/NESTED_CONSENSUS_ML.git (accessed on 7 May 2026).

Conflicts of Interest

The authors declare no conflicts of interest. The funders had no role in the design of the study; in the collection, analyses, or interpretation of data; in the writing of the manuscript; or in the decision to publish the results.

Abbreviations

The following abbreviations are used in this manuscript: 3D, three-dimensional; AOP, anterior optic pathway; AUC, area under the curve; BED, biologically effective dose; CE-T1w, contrast-enhanced T1-weighted; CP, clinical parameters; CT, computed tomography; GKRS, Gamma Knife radiosurgery; GLCM, gray-level co-occurrence matrix; GLRLM, gray-level run-length matrix; GLSZM, gray-level size-zone matrix; HFSRS, hypofractionated stereotactic radiosurgery; LQ, linear-quadratic; MCC, Matthews correlation coefficient; ML, machine learning; mRMR, minimum redundancy maximum relevance; MRI, magnetic resonance imaging; MPRAGE, magnetization-prepared rapid acquisition gradient echo; OARs, organs at risk; RANO, Response Assessment in Neuro-Oncology; SFED, single-fraction equivalent dose; SGD, stochastic gradient descent; SHAP, SHapley Additive exPlanations; SRS, stereotactic radiosurgery; STROBE, Strengthening the Reporting of Observational Studies in Epidemiology; TR, repetition time; TE, echo time; TI, inversion time; VOI, volume of interest; WHO, World Health Organization.

References

  1. Sheppard, J.; Kannan, S.; Halliday, J.; Rutherford, S.; Lavin, T.; Forde, C.; Smith, M.J.; Evans, G.; King, A.T.; Islim, A.I.; et al. A systematic review and meta-analysis of outcomes following active surveillance, surgery and radiotherapy of meningiomas in NF2-related schwannomatosis. Neurooncol. Adv. 2026, 8, vdag022. [Google Scholar] [CrossRef] [Scilit]
  2. Dayawansa, S.; Abbas, S.O.; Mantziaris, G.; Dumot, C.; Donahue, J.H.; Sheehan, J.P. Volumetric Assessment of Nonfunctional Pituitary Adenoma Treated With Stereotactic Radiosurgery: An Assessment of Long-Term Response. Neurosurgery 2023, 93, 1339–1345. [Google Scholar] [CrossRef] [Scilit]
  3. Pomeraniec, I.J.; Xu, Z.; Lee, C.C.; Yang, H.C.; Chytka, T.; Liscak, R.; Martinez-Alvarez, R.; Martinez-Moreno, N.; Attuati, L.; Picozzi, P.; et al. Dose to neuroanatomical structures surrounding pituitary adenomas and the effect of stereotactic radiosurgery on neuroendocrine function: An international multicenter study. J. Neurosurg. 2022, 136, 813–821. [Google Scholar] [CrossRef] [Scilit]
  4. DiBiase, S.J.; Kwok, Y.; Yovino, S.; Arena, C.; Naqvi, S.; Temple, R.; Regine, W.F.; Amin, P.; Guo, C.; Chin, L.S. Factors predicting local tumor control after gamma knife stereotactic radiosurgery for benign intracranial meningiomas. Int. J. Radiat. Oncol. Biol. Phys. 2004, 60, 1515–1519. [Google Scholar] [CrossRef] [Scilit]
  5. Starke, R.M.; Nguyen, J.H.; Rainey, J.; Williams, B.J.; Sherman, J.H.; Savage, J.; Yen, C.P.; Sheehan, J.P. Gamma Knife surgery of meningiomas located in the posterior fossa: Factors predictive of outcome and remission. J. Neurosurg. 2011, 114, 1399–1409. [Google Scholar] [CrossRef] [Scilit] [PubMed]
  6. Santacroce, A.; Walier, M.; Regis, J.; Liscak, R.; Motti, E.; Lindquist, C.; Kemeny, A.; Kitz, K.; Lippitz, B.; Martinez Alvarez, R.; et al. Long-term tumor control of benign intracranial meningiomas after radiosurgery in a series of 4565 patients. Neurosurgery 2012, 70, 32–39; discussion 39. [Google Scholar] [CrossRef] [Scilit]
  7. Sheehan, J.P.; Starke, R.M.; Kano, H.; Kaufmann, A.M.; Mathieu, D.; Zeiler, F.A.; West, M.; Chao, S.T.; Varma, G.; Chiang, V.L.; et al. Gamma Knife radiosurgery for sellar and parasellar meningiomas: A multicenter study. J. Neurosurg. 2014, 120, 1268–1277. [Google Scholar] [CrossRef] [Scilit]
  8. Mansouri, A.; Larjani, S.; Klironomos, G.; Laperriere, N.; Cusimano, M.; Gentili, F.; Schwartz, M.; Zadeh, G. Predictors of response to Gamma Knife radiosurgery for intracranial meningiomas. J. Neurosurg. 2015, 123, 1294–1300. [Google Scholar] [CrossRef] [Scilit] [PubMed]
  9. Cesme, D.H.; Alkan, A.; Sari, L.; Yabul, F.; Temur, H.O.; Aykan, M.E.; Seyithanoglu, M.H.; Hatiboglu, M.A. Importance of Pre-treatment Fractional Anisotropy Value in Predicting Volumetric Response in Patients with Meningioma Treated with Gamma Knife Radiosurgery. Curr. Med. Imaging 2021, 17, 871–877. [Google Scholar] [CrossRef] [Scilit]
  10. O’Connor, K.P.; Algan, O.; Vesely, S.K.; Palejwala, A.H.; Briggs, R.G.; Conner, A.K.; Cornwell, B.O.; Andrews, B.; Sughrue, M.E.; Glenn, C.A. Factors Associated with Treatment Failure and Radiosurgery-Related Edema in WHO Grade 1 and 2 Meningioma Patients Receiving Gamma Knife Radiosurgery. World Neurosurg. 2019, 130, e558–e565. [Google Scholar] [CrossRef] [Scilit] [PubMed]
  11. Tropine, A.; Dellani, P.D.; Glaser, M.; Bohl, J.; Ploner, T.; Vucurevic, G.; Perneczky, A.; Stoeter, P. Differentiation of fibroblastic meningiomas from other benign subtypes using diffusion tensor imaging. J. Magn. Reson. Imaging 2007, 25, 703–708. [Google Scholar] [CrossRef] [Scilit]
  12. Speckter, H.; Bido, J.; Hernandez, G.; Mejia, D.R.; Suazo, L.; Valenzuela, S.; Perez-Then, E.; Stoeter, P. Prognostic value of diffusion tensor imaging parameters for Gamma Knife radiosurgery in meningiomas. J. Neurosurg. 2016, 125, 83–88. [Google Scholar] [CrossRef] [Scilit]
  13. Berberat, J.; Roelcke, U.; Remonda, L.; Schwyzer, L. Long-term apparent diffusion coefficient value changes in patients undergoing radiosurgical treatment of meningiomas. Acta Neurochir. 2021, 163, 89–95. [Google Scholar] [CrossRef] [Scilit]
  14. Speckter, H.; Bido, J.; Hernandez, G.; Rivera, D.; Suazo, L.; Valenzuela, S.; Miches, I.; Oviedo, J.; Gonzalez, C.; Stoeter, P. Pretreatment texture analysis of routine MR images and shape analysis of the diffusion tensor for prediction of volumetric response after radiosurgery for meningioma. J. Neurosurg. 2018, 129, 31–37. [Google Scholar] [CrossRef] [Scilit] [PubMed]
  15. Speckter, H.; Radulovic, M.; Trivodaliev, K.; Vranes, V.; Joaquin, J.; Hernandez, W.; Mota, A.; Bido, J.; Hernandez, G.; Rivera, D.; et al. MRI radiomics in the prediction of the volumetric response in meningiomas after gamma knife radiosurgery. J. Neurooncol. 2022, 159, 281–291. [Google Scholar] [CrossRef] [Scilit]
  16. Ocampo-Navia, M.I.; Agudelo-Arrieta, M.; Marin-Navas, F.; Taub-Krivoy, A.; Perez-Mendez, W.; Arana-Isaac, N.; Mitre, L.P.; Feo-Lee, O.H. Radiomics and artificial intelligence for predicting pituitary neuroendocrine tumor consistency: A systematic review and meta-analysis. Neurosurg. Rev. 2025, 49, 67. [Google Scholar] [CrossRef] [Scilit] [PubMed]
  17. Liu, S.; Wang, Y.; Xu, K.; Wang, Z.; Fan, X.; Zhang, C.; Li, S.; Qiu, X.; Jiang, T. Relationship between necrotic patterns in glioblastoma and patient survival: Fractal dimension and lacunarity analyses using magnetic resonance imaging. Sci. Rep. 2017, 7, 8302. [Google Scholar] [CrossRef] [Scilit]
  18. Smitha, K.A.; Gupta, A.K.; Jayasree, R.S. Fractal analysis: Fractal dimension and lacunarity from MR images for differentiating the grades of glioma. Phys. Med. Biol. 2015, 60, 6937–6947. [Google Scholar] [CrossRef] [Scilit]
  19. Yadav, N.; Mohanty, A.; V, A.; Tiwari, V. Fractal dimension and lacunarity measures of glioma subcomponents are discriminative of the grade of gliomas and IDH status. NMR Biomed. 2024, 37, e5272. [Google Scholar] [CrossRef] [Scilit] [PubMed]
  20. Djuricic, G.J.; Radulovic, M.; Sopta, J.P.; Nikitovic, M.; Milosevic, N.T. Fractal and Gray Level Cooccurrence Matrix Computational Analysis of Primary Osteosarcoma Magnetic Resonance Images Predicts the Chemotherapy Response. Front. Oncol. 2017, 7, 246. [Google Scholar] [CrossRef] [Scilit]
  21. Cusumano, D.; Dinapoli, N.; Boldrini, L.; Chiloiro, G.; Gatta, R.; Masciocchi, C.; Lenkowicz, J.; Casa, C.; Damiani, A.; Azario, L.; et al. Fractal-based radiomic approach to predict complete pathological response after chemo-radiotherapy in rectal cancer. Radiol. Medica 2018, 123, 286–295. [Google Scholar] [CrossRef] [Scilit] [PubMed]
  22. Di Dio, C.; Chiloiro, G.; Cusumano, D.; Catucci, F.; Boldrini, L.; Romano, A.; Meldolesi, E.; Marazzi, F.; Corvari, B.; Barbaro, B.; et al. Fractal-Based Radiomic Approach to Tailor the Chemotherapy Treatment in Rectal Cancer: A Generating Hypothesis Study. Front. Oncol. 2021, 11, 774413. [Google Scholar] [CrossRef] [Scilit] [PubMed]
  23. Fan, Z.; Gao, A.; Zhang, J.; Meng, X.; Yin, Q.; Shen, Y.; Hu, R.; Gao, S.; Yang, H.; Xu, Y.; et al. Study of prediction model for high-grade meningioma using fractal geometry combined with radiological features. J. Neurooncol. 2025, 171, 431–442. [Google Scholar] [CrossRef] [Scilit] [PubMed]
  24. Won, S.Y.; Lee, J.H.; Lee, N.; Park, Y.W.; Ahn, S.S.; Kim, J.; Chang, J.H.; Kim, S.H.; Lee, S.K. Three-dimensional fractal dimension and lacunarity features may noninvasively predict TERT promoter mutation status in grade 2 meningiomas. PLoS ONE 2022, 17, e0276342. [Google Scholar] [CrossRef] [Scilit]
  25. Markia, B.; Mezei, T.; Baskay, J.; Pollner, P.; Matyas, A.; Simon, A.; Varallyay, P.; Banczerowski, P.; Eross, L. Consistency and grade prediction of intracranial meningiomas based on fractal geometry analysis. Neurosurg. Rev. 2025, 48, 598. [Google Scholar] [CrossRef] [Scilit]
  26. Panboonyuen, T. Seeing Isn’t Always Believing: Analysis of Grad-CAM Faithfulness and Localization Reliability in Lung Cancer CT Classification. In Proceedings of the 2026 18th International Conference on Knowledge and Smart Technology (KST), Pattaya, Thailand, 21–24 January 2026; pp. 80–86. [Google Scholar]
  27. Mohammad, A. MIRAGE: The Illusion of Visual Understanding. arXiv 2026, arXiv:2603.21687v2. [Google Scholar] [CrossRef] [Scilit]
  28. Patibandla, M.R.; Lee, C.C.; Tata, A.; Addagada, G.C.; Sheehan, J.P. Stereotactic radiosurgery for WHO grade I posterior fossa meningiomas: Long-term outcomes with volumetric evaluation. J. Neurosurg. 2018, 129, 1249–1259. [Google Scholar] [CrossRef] [Scilit]
  29. McMahon, S.J. The linear quadratic model: Usage, interpretation and challenges. Phys. Med. Biol. 2018, 64, 01TR01. [Google Scholar] [CrossRef] [Scilit]
  30. Speckter, H.; Santana, J.; Miches, I.; Hernandez, G.; Bido, J.; Rivera, D.; Suazo, L.; Valenzuela, S.; Garcia, J.; Stoeter, P. Assessment of the alpha/beta ratio of the optic pathway to adjust hypofractionated stereotactic radiosurgery regimens for perioptic lesions. J. Radiat. Oncol. 2019, 8, 279–289. [Google Scholar] [CrossRef] [Scilit]
  31. Vernimmen, F.J.; Slabbert, J.P. Assessment of the alpha/beta ratios for arteriovenous malformations, meningiomas, acoustic neuromas, and the optic chiasma. Int. J. Radiat. Biol. 2010, 86, 486–498. [Google Scholar] [CrossRef] [Scilit]
  32. van Griethuysen, J.J.M.; Fedorov, A.; Parmar, C.; Hosny, A.; Aucoin, N.; Narayan, V.; Beets-Tan, R.G.H.; Fillion-Robin, J.C.; Pieper, S.; Aerts, H. Computational Radiomics System to Decode the Radiographic Phenotype. Cancer Res. 2017, 77, e104–e107. [Google Scholar] [CrossRef] [Scilit]
  33. Speckter, H.; Palque-Santos, S.; Mota-Gonzalez, R.; Bido, J.; Hernandez, G.; Rivera, D.; Suazo, L.; Valenzuela, S.; Gonzalez-Curi, M.; Stoeter, P. Can Apparent Diffusion Coefficient (ADC) maps replace Diffusion Tensor Imaging (DTI) maps to predict the volumetric response of meningiomas to Gamma Knife Radiosurgery? J. Neurooncol. 2023, 161, 547–554. [Google Scholar] [CrossRef] [Scilit] [PubMed]
  34. Harrison, G.; Kano, H.; Lunsford, L.D.; Flickinger, J.C.; Kondziolka, D. Quantitative tumor volumetric responses after Gamma Knife radiosurgery for meningiomas. J. Neurosurg. 2016, 124, 146–154. [Google Scholar] [CrossRef] [Scilit]
  35. Huang, R.Y.; Bi, W.L.; Weller, M.; Kaley, T.; Blakeley, J.; Dunn, I.; Galanis, E.; Preusser, M.; McDermott, M.; Rogers, L.; et al. Proposed response assessment and endpoints for meningioma clinical trials: Report from the Response Assessment in Neuro-Oncology Working Group. Neuro Oncol. 2019, 21, 26–36. [Google Scholar] [CrossRef] [Scilit] [PubMed]
  36. Kim, S.; Park, Y.W.; Park, S.H.; Ahn, S.S.; Chang, J.H.; Kim, S.H.; Lee, S.K. Comparison of Diagnostic Performance of Two-Dimensional and Three-Dimensional Fractal Dimension and Lacunarity Analyses for Predicting the Meningioma Grade. Brain Tumor Res. Treat. 2020, 8, 36–42. [Google Scholar] [CrossRef] [Scilit] [PubMed]
  37. Mezei, T.; Baskay, J.; Markia, B.; Varallyay, P.; Banczerowski, P.; Pollner, P. Fractal-geometry analysis of pediatric posterior fossa tumors—A preoperative tool for prediction of histopathology. Neurosurg. Rev. 2026, 49, 141. [Google Scholar] [CrossRef] [Scilit]
  38. Djuricic, G.J.; Ahammer, H.; Rajkovic, S.; Kovac, J.D.; Milosevic, Z.; Sopta, J.P.; Radulovic, M. Directionally Sensitive Fractal Radiomics Compatible With Irregularly Shaped Magnetic Resonance Tumor Regions of Interest: Association with Osteosarcoma Chemoresistance. J. Magn. Reson. Imaging 2023, 57, 248–258. [Google Scholar] [CrossRef] [Scilit]
  39. Ahammer, H.; Reiss, M.A.; Hackhofer, M.; Andronache, I.; Radulovic, M.; Labra-Sprohnle, F.; Jelinek, H.F. ComsystanJ: A collection of Fiji/ImageJ2 plugins for nonlinear and complexity analysis in 1D, 2D and 3D. PLoS ONE 2023, 18, e0292217. [Google Scholar] [CrossRef] [Scilit]
  40. Bebas, E.; Pauk, K.; Pauk, J.; Daunoraviciene, K.; Mojsak, M.; Hladunski, M.; Domino, M.; Borowska, M. Application of Fractal Radiomics and Machine Learning for Differentiation of Non-Small Cell Lung Cancer Subtypes on PET/MR Images. J. Clin. Med. 2025, 14, 5776. [Google Scholar] [CrossRef] [Scilit]
  41. Sudjai, N.; Siriwanarangsun, P.; Lektrakul, N.; Saiviroonporn, P.; Maungsomboon, S.; Phimolsarnti, R.; Asavamongkolkul, A.; Chandhanayingyong, C. Robustness of Radiomic Features: Two-Dimensional versus Three-Dimensional MRI-Based Feature Reproducibility in Lipomatous Soft-Tissue Tumors. Diagnostics 2023, 13, 258. [Google Scholar] [CrossRef] [Scilit]
  42. Diebold, M.; Becker, L.; Demerath, T.; Reisert, M.; Erny, D.; Braun, A.; Hauser, T.K.; Grauvogel, J.; Hohenhaus, M.; Urbach, H.; et al. Non-invasive Prediction of Meningioma Tumor Grade by Quantification of Shape-based Radiomics Features and Surface Regularity. Clin. Neuroradiol. 2026, 36, 169–176. [Google Scholar] [CrossRef] [Scilit] [PubMed]
  43. Song, D.; Wei, Q.; Zhao, S.; Lou, Y.; Zhang, K.; Duan, C.; Wang, F.; Gao, Q.; Yan, J.; Yan, D.; et al. Exploring a recurrence model for atypical meningioma based on multiparametric MRI radiomic and clinical characteristics: A multicenter retrospective cohort study. Radiat. Oncol. 2025, 20, 30. [Google Scholar] [CrossRef] [Scilit] [PubMed]
  44. Kickingereder, P.; Burth, S.; Wick, A.; Gotz, M.; Eidel, O.; Schlemmer, H.P.; Maier-Hein, K.H.; Wick, W.; Bendszus, M.; Radbruch, A.; et al. Radiomic Profiling of Glioblastoma: Identifying an Imaging Predictor of Patient Survival with Improved Performance over Established Clinical and Radiologic Risk Models. Radiology 2016, 280, 880–889. [Google Scholar] [CrossRef] [Scilit] [PubMed]
  45. Zwanenburg, A.; Vallieres, M.; Abdalah, M.A.; Aerts, H.; Andrearczyk, V.; Apte, A.; Ashrafinia, S.; Bakas, S.; Beukinga, R.J.; Boellaard, R.; et al. The Image Biomarker Standardization Initiative: Standardized Quantitative Radiomics for High-Throughput Image-based Phenotyping. Radiology 2020, 295, 328–338. [Google Scholar] [CrossRef] [Scilit]
  46. Swinburne, N.; LoCastro, E.; Paudyal, R.; Oh, J.H.; Taunk, N.K.; Shah, A.; Beal, K.; Vachha, B.; Young, R.J.; Holodny, A.I.; et al. Computational Modeling of Interstitial Fluid Pressure and Velocity in Non-small Cell Lung Cancer Brain Metastases Treated With Stereotactic Radiosurgery. Front. Neurol. 2020, 11, 402. [Google Scholar] [CrossRef] [Scilit]
  47. Goldbrunner, R.; Stavrinou, P.; Jenkinson, M.D.; Sahm, F.; Mawrin, C.; Weber, D.C.; Preusser, M.; Minniti, G.; Lund-Johansen, M.; Lefranc, F.; et al. EANO guideline on the diagnosis and management of meningiomas. Neuro Oncol. 2021, 23, 1821–1834. [Google Scholar] [CrossRef] [Scilit]
  48. Nowosielski, M.; Galldiks, N.; Iglseder, S.; Kickingereder, P.; von Deimling, A.; Bendszus, M.; Wick, W.; Sahm, F. Diagnostic challenges in meningioma. Neuro Oncol. 2017, 19, 1588–1598. [Google Scholar] [CrossRef] [Scilit]
  49. Kondziolka, D.; Levy, E.I.; Niranjan, A.; Flickinger, J.C.; Lunsford, L.D. Long-term outcomes after meningioma radiosurgery: Physician and patient perspectives. J. Neurosurg. 1999, 91, 44–50. [Google Scholar] [CrossRef] [Scilit]
  50. Lee, J.Y.; Niranjan, A.; McInerney, J.; Kondziolka, D.; Flickinger, J.C.; Lunsford, L.D. Stereotactic radiosurgery providing long-term tumor control of cavernous sinus meningiomas. J. Neurosurg. 2002, 97, 65–72. [Google Scholar] [CrossRef] [Scilit]
  51. Speckter, H.; Santana, J.; Bido, J.; Hernandez, G.; Rivera, D.; Suazo, L.; Valenzuela, S.; Oviedo, J.; Gonzalez, C.F.; Stoeter, P. Texture Analysis of Standard Magnetic Resonance Images to Predict Response to Gamma Knife Radiosurgery in Vestibular Schwannomas. World Neurosurg. 2019, 132, e228–e234. [Google Scholar] [CrossRef] [Scilit]
  52. Mousavi, S.H.; Niranjan, A.; Akpinar, B.; Monaco, E.A.; Cohen, J.; Bhatnagar, J.; Chang, Y.F.; Kano, H.; Huq, S.; Flickinger, J.C.; et al. A proposed plan for personalized radiosurgery in patients with trigeminal neuralgia. J. Neurosurg. 2018, 128, 452–459. [Google Scholar] [CrossRef] [Scilit]
Figure 1. Relationship between tumor volume change and follow-up duration. Scatter plots showing (A) relative tumor volume change from baseline (%), (B) monthly relative tumor volume change from baseline (%/month), and (C) relative tumor volume change normalized by logarithmic follow-up time (%/log month), each plotted against follow-up duration in months. The dotted trend lines indicate the overall linear regression trend for each outcome measure. The log-time-normalized measure was used to reduce dependence on follow-up duration while accounting for the approximately exponential pattern of post-treatment volume change.
Fractalfract 10 00357 g001
Figure 2. Workflow of the machine-learning classification analysis. Pre-GKRS MRI scans were acquired and tumor VOIs were segmented. Prior to feature extraction, images underwent z-score normalization, interpolation and resampling. All feature classes were extracted with application of all transformation filters, but only 107 features obtained on original images were used in analysis. The resulting feature values were subsequently z-score normalized, and features with low variance, near-random univariate AUC, or high pairwise correlation were excluded. Five feature-selection methods and five classifiers were assessed. Final evaluation on the independent test set was performed using a refit model trained on the entire development cohort with the optimized hyperparameters.
Fractalfract 10 00357 g002
Table 1. Patients, treatment characteristics and treatment results.
Patient and Treatment CharacteristicsValueRange
Number of patients204-
Age in years (mean, range)53.6(15.2/88.7)
Pre-SRS tumor volume in cm3 (mean, range)8.4(0.3/50.9)
Previous RT, SRS0 [0%]-
Previous surgeries88 [43.1%]-
Single fraction SRS treatments177-
Hypofractionated SRS treatments27-
Number of Fractions (mean, range)1.35(1/4)
Coverage index (mean, range)96.3%(67.0%/100%)
Selectivity index (mean, range)70.2%(16.0%/93.0%)
Paddick conformity index (mean, range)67.5%(16.0%/92.1%)
Margin physical Dose in Gy (mean, range)14.5(11.0/24.0)
Maximum physical Dose in Gy (mean, range)29.0(22.0/48.0)
Margin BED in Gy (mean, range)62.5(33.0/104.2)
Margin SFED in Gy (mean, range)13.5(9.4/18.0)
Treatment ResultsValueRange
Follow-up period in months (mean, range)47.4(12.0/152.0)
Complete response (CR)0 [0%]-
Partial response (PR, decrease by ≥50%)45 [22.1%]-
Minor response (MR, ≥25% and <50% decrease)81 [39.7%]-
Stable disease (SD, <25% decrease but <25% increase)70 [34.3%]-
Progressive disease (PD, ≥25% increase)8 [3.9%]-
Absolute volume change in cm3 (mean, range)−2.24(−42.42/42.44)
Relative volume change (mean, range)−30.00%(−99.5%/190.5%)
Volume change per month (mean, range)−0.87%(−6.56%/7.62%)
Abbreviations: SRS, stereotactic radiosurgery; RT, radiotherapy; BED, biologically effective dose; SFED, single fraction equivalent dose; Gy, gray.
Table 2. Prognostic performance of machine-learning models based on clinical parameters, radiomics and fractal/lacunarity features a.
Test Set b
ModelAUCAcc.Balanced Acc.MCCYoudenF1
Naïve Bayes
Radiomics0.8330.9000.8900.7250.7800.769
CP + radiomics0.8400.9000.8130.6710.6250.727
Radiomics + fractal0.8260.9000.8130.6710.6250.727
CP + radiomics + fractal0.8330.8660.8540.6410.7080.714
Gaussian Process
Radiomics0.7010.7670.6670.3150.3330.462
CP + radiomics0.7710.8330.8330.5830.6670.667
Radiomics + fractal0.8190.8000.8120.5300.6250.625
CP + radiomics + fractal0.8120.8330.7080.4470.4170.545
ExtraTrees
Radiomics0.8330.9330.8960.7920.7920.833
CP + radiomics0.8000.8670.7920.5830.5830.667
Radiomics + fractal0.8190.9000.8120.6710.6250.727
CP + radiomics + fractal0.8060.9000.8120.6710.6250.727
Logistic Regression
Radiomics0.8120.9000.8120.6710.6250.727
CP + radiomics0.8120.9000.8120.6710.6250.727
Radiomics + fractal0.8000.8330.7080.4470.4170.545
CP + radiomics + fractal0.7780.8670.7920.5830.5830.667
Stochastic Gradient Descent with logistic loss
Radiomics0.7920.8330.8330.5820.6670.667
CP + radiomics0.6940.6000.6880.3010.3750.455
Radiomics + fractal0.6770.8000.6880.3750.3750.500
CP + radiomics + fractal0.7710.7330.7710.4420.5420.556
a Models were trained against a meningioma volumetric response threshold of −0.30% per logarithmic month. Good responders were coded as events; therefore, an AUC above 0.5 indicates that higher feature values are associated with a better volumetric response. b The final refit was performed on the entire development set and performance metrics were evaluated on the test set. Abbreviations: CP, clinical parameters.
Table 3. SHAP and stability-based importance of selected clinical, radiomic, fractal and lacunarity features in the logistic regression model a.
Logistic Regression Classifier
FeatureConsensus FoldsAvg.
Votes
StabilityMean
SHAP
ImportanceAUC bFeature
Type
orig_firstorder_Skewness54.2210.0911.9090.67Textural
gray3D_lac_nonoverlap_r254.4220.0841.8520.64Lacunarity
Selectivity34.0120.0991.1870.30Clinical
orig_gldm_LargeDepHighGrayLevelEmph54.2210.0561.1670.30Textural
Coverage [%]53.8190.0561.0680.62Clinical
orig_glszm_LargeAreaHighGrayLevelEmph54.4220.0440.9730.33Textural
shape3D_roughness53.8190.0510.9640.37Shape
orig_firstorder_Kurtosis43.2130.0690.8920.35Intensity
shape3D_radius_max_min_ratio44.5180.0440.7890.62Shape
shape3D_radius_min_mm34.3130.0600.7810.32Shape
grayROI3D_dbc_se43.2130.0600.7790.59Fractal
orig_glcm_Imc143.2130.0530.6870.63Textural
orig_glrlm_LongRunLowGrayLevelEmph43.7150.0440.6660.66Textural
orig_glszm_LowGrayLevelZoneEmph33.6110.0500.5450.64Textural
Paddick24.080.0650.5200.32Clinical
orig_glcm_ClusterShade33.6110.0460.5040.58Textural
orig_firstorder_10Percentile24.080.0620.4950.40Intensity
orig_gldm_LowGrayLevelEmph24.590.0510.4560.67Textural
orig_glcm_Imc253.4170.0260.4430.66Textural
original_shape_Flatness24.590.0300.310.39Shape
a This model was trained against a meningioma volumetric response threshold of −0.30% per logarithmic month. Good responders were coded as events; therefore, an AUC above 0.5 indicates that higher feature values are associated with a better volumetric response. b The final refit was performed on the entire development set, and AUC was evaluated on the test set. Abbreviations: Avg. average; Dep, dependence; Emph, emphasis.
Disclaimer/Publisher’s Note: The statements, opinions and data contained in all publications are solely those of the individual author(s) and contributor(s) and not of MDPI and/or the editor(s). MDPI and/or the editor(s) disclaim responsibility for any injury to people or property resulting from any ideas, methods, instructions or products referred to in the content.