Article

Quantifying Tissue Complexity via Fractal Analysis of Salivary Gland Ultrasound Images in Patients with Autoimmune Thyroid Disease


by
Seda Kan Yakuboğlu
* and
Meryem Toraman
Department of Oral and Maxillofacial Radiology, Faculty of Dentistry, Gazi University, Ankara 06490, Turkey
*
Author to whom correspondence should be addressed.
Fractal Fract. 2026, 10(6), 358; https://doi.org/10.3390/fractalfract10060358
Submission received: 7 April 2026 / Revised: 21 May 2026 / Accepted: 21 May 2026 / Published: 26 May 2026

Abstract

This study aimed to evaluate the ultrasonographic images of salivary glands using fractal analysis in patients with autoimmune thyroid disease and healthy controls and perform a statistical assessment of the findings. ImageJ software and the box-counting method were utilized for the fractal analysis of the salivary gland ultrasound images of 30 patients with autoimmune thyroid disease and 30 healthy individuals and the results were statistically compared. The mean fractal dimension value of the submandibular salivary gland was 1.68 ± 0.08 in the study group and 1.78 ± 0.05 in the control group (p < 0.001). The mean fractal dimension value of the parotid gland in the longitudinal plane was 1.71 ± 0.06 in the study group and 1.79 ± 0.03 in the control group (p < 0.001). For the parotid gland in the transverse plane, the mean fractal dimension value was 1.72 ± 0.06 in the study group and 1.79 ± 0.03 in the control group (p < 0.001). The significant reduction in fractal dimension values of ultrasound images observed in both parotid and submandibular glands of patients with autoimmune thyroid disease suggests that fractal analysis can be utilized as a potential adjunctive tool for identifying parenchymal changes for evaluating salivary gland involvement in this patient population.

1. Introduction

Autoimmune thyroid disease (AITD) is the most common organ-specific autoimmune disorder [1]. It is characterized by a T-cell response against thyroid follicular cells. In AITD, autoantibodies triggered by T-cells are produced against thyroglobulin (TG), thyroid peroxidase (TPO), and the thyroid-stimulating hormone receptor (TSHR). AITD, which encompasses Graves’ disease (GD) and Hashimoto’s thyroiditis (HT), involves the formation of autoreactive T and B lymphocytes. Changes in thyroid function are subsequently observed following the infiltration of these cells into the thyroid parenchyma [2].
AITD may present alone; however, it can also be associated with other autoimmune diseases [3]. The coexistence of multiple autoimmune diseases provides evidence for polyautoimmunity and the presence of common immunopathogenic pathways [4,5]. Immunological imbalance in the salivary glands has been shown to cause secretory dysfunction in other autoimmune diseases, such as psoriasis, rheumatoid arthritis, and systemic sclerosis. Furthermore, a genetic and immunopathological similarity between Sjögren’s Syndrome (SS) and AITD has been reported [6].
A study on euthyroid females with HT revealed depleted salivary glutathione and uric acid, alongside elevated catalase and peroxidase activities. This imbalance indicates oxidative stress-induced damage to salivary proteins and lipids. This salivary oxidative stress is reported to be driven by autoimmunity-related inflammation rather than thyroid hormones or thyroid-stimulating hormone (TSH) levels. In particular, the secretory function of the submandibular glands was reduced in the euthyroid state, manifesting as a significant decrease in unstimulated salivary secretion [7]. Agha-Hosseini et al. reported significantly reduced stimulated and unstimulated salivary flow rates in HT patients under long-term thyroxine treatment with normalized TSH levels compared to controls. Although SS was excluded and thyroid functions were restored, the authors attributed the xerostomia to autoimmune-mediated salivary gland damage [1].
Studies highlight the link between GD-related genes and T-cells, emphasizing their role in AITD pathogenesis [8]. Evidence confirms that T-cell activation significantly alters serum and salivary levels of key cytokines (IL-1, 6, 12, TNF-α, IFN-γ) and chemokines (CXCL9–11) [9,10].
Through ultrasound (US) examination, the echogenicity of the salivary glands can be subjectively evaluated by comparing it with the adjacent muscles and the thyroid gland [11,12]. Many previous studies have reported that semi-quantitative analysis of parenchymal heterogeneity via US scores is a useful method for assessing the condition of the salivary gland [13,14]. Studies have reported that subjective US scoring systems may have limited sensitivity in terms of diagnostic accuracy, particularly during the early stages of the disease [15,16]. The limited sensitivity and subjectivity of US scoring systems have paved the way for the development of software-based image analysis methods that provide quantitative, measurable, and reproducible results while eliminating observer-dependent variability [17,18,19].
Ultrasonographic evaluation of children with AITD revealed no significant changes in salivary gland volumes; however, heterogeneous parenchymal patterns and increased vascularity were prominent findings in the patient group compared to controls; consequently, researchers have suggested that salivary glands in AITD patients should also be evaluated using quantitative methods [20]. Fractal analysis, a quantitative analysis method, offers advantages over subjective assessments by preventing operator-dependent variability and providing reproducible results [21]. Fractal analysis is a widely utilized method across various fields of medicine and dentistry. It has become a preferred approach for analyzing complex biological structures and disease processes, as well as for the diagnosis and classification of various conditions [22]. In dentistry, fractal analysis has been integrated into various imaging modalities, including panoramic, periapical, and bitewing radiography, as well as Cone Beam Computer Tomography (CBCT), micro-CT, sialography, and US [23]. Despite its potential, the use of fractal analysis for evaluating salivary gland parenchyma via ultrasonography has been explored in only a very limited number of studies [21,24,25,26].
To the best of our knowledge, no previous study has utilized fractal analysis for the detailed evaluation of salivary gland US images in patients with AIDT. The primary objectives of this study were to calculate and compare the fractal dimension values of the parotid and submandibular salivary glands in both the patient and control groups.

2. Materials and Methods

2.1. Study Participants and Design

This prospective study was conducted in accordance with the Declaration of Helsinki and approved by the Ethics Committee of Gazi University (Date: 13 February 2024, No: 2024–272). A priori power analysis was performed using G*Power software (Version 3.1.9.2; Heinrich Heine University, Düsseldorf, Germany), which determined a required sample size of 60 participants (n = 30 per group; α = 0.05, effect size d = 0.811, power [1 − β] = 0.80). The study included female patients diagnosed with AITD (n = 30) on the basis of clinical and laboratory findings, and healthy female volunteers (n = 30) who presented to the Department of Oral and Maxillofacial Radiology, Faculty of Dentistry, Gazi University for routine dental examination and consented to participate.
Participants were recruited from those registered in e-Nabız (Personal Health Record System of the Ministry of Health, Ankara, Türkiye). Inclusion criteria for the study group were as follows: age 18 years or older; confirmed diagnosis of AITD evidenced by positivity for at least one thyroid autoantibody (Anti-TPO, Anti-TG, or TRAb); euthyroid status, defined as free thyroxine (fT4) and thyroid-stimulating hormone (TSH) levels within laboratory reference ranges; absence of any systemic disease known to affect the salivary glands; and no use of medications known to affect salivary gland function. Exclusion criteria included a history of head and neck radiotherapy or chemotherapy, a history of salivary gland neoplasm, prior radioactive iodine therapy, any systemic disease or endocrinopathy other than AITD, and current use of medications known to affect salivary flow rate or salivary gland morphology.

2.2. Ultrasound Examination of Parotid and Submandibular Glands

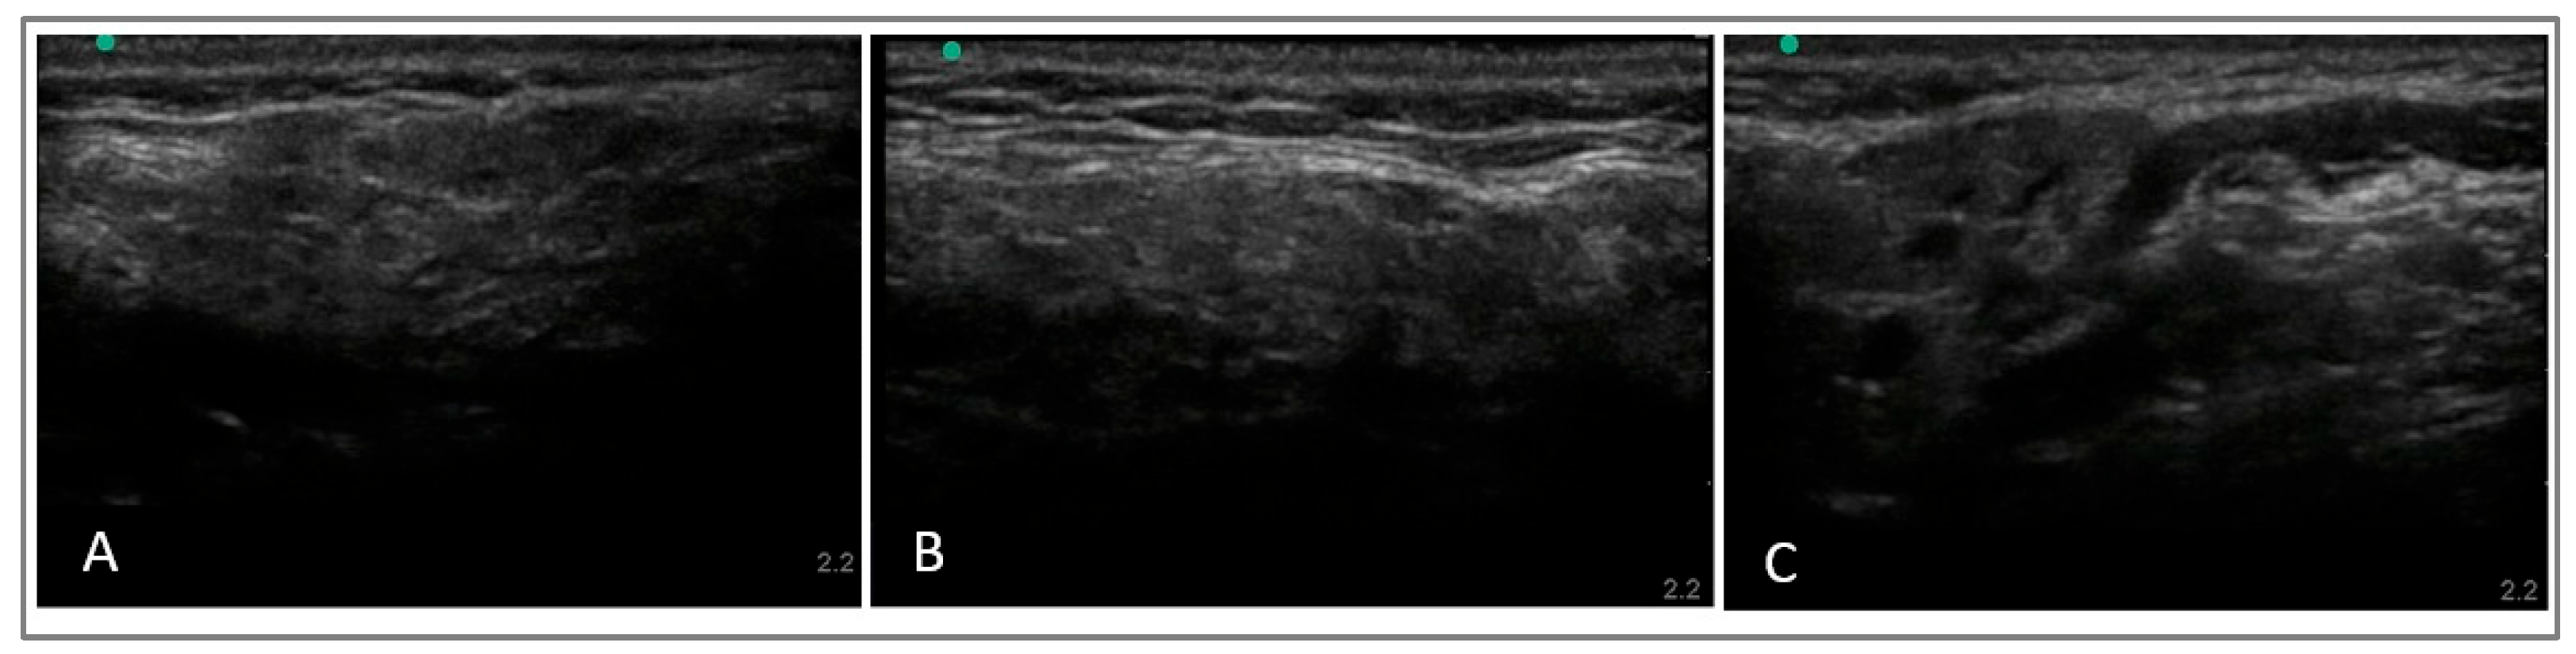
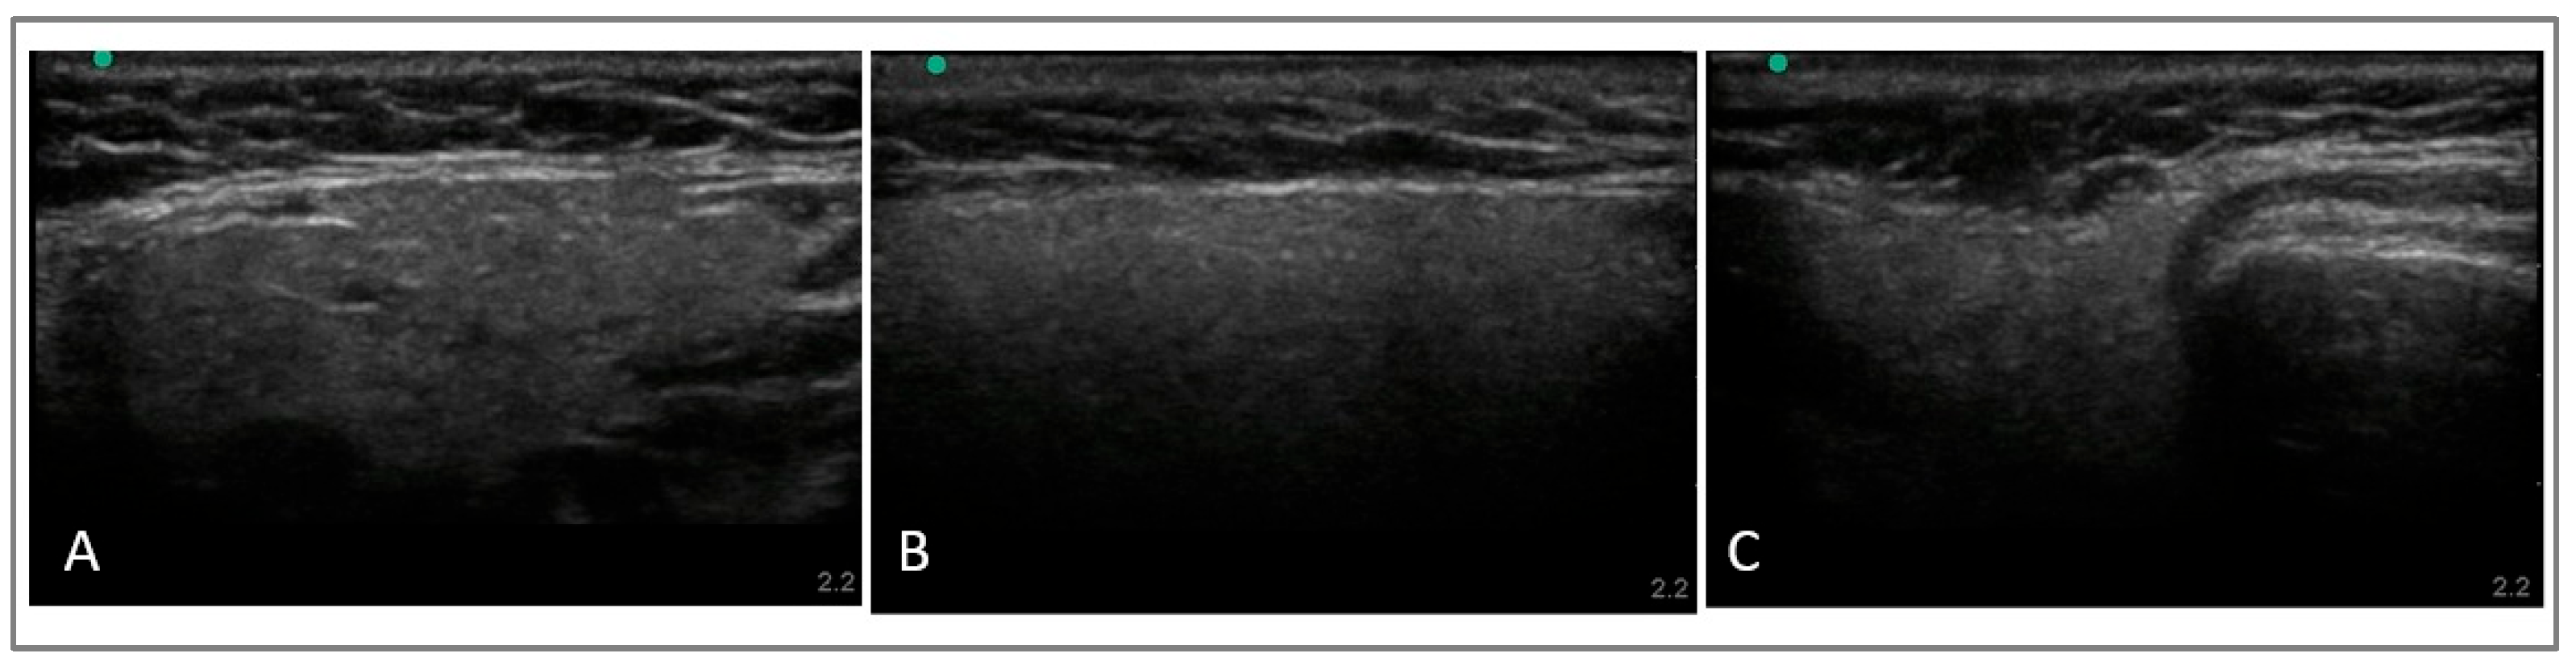
All ultrasonographic examinations of the salivary glands were performed by the same radiologist at X University using a Fujifilm SonoSite M-Turbo device (Bothell, WA, USA) equipped with an HFL38X 13–6 MHz linear transducer. All participants were positioned supine with the head hyperextended. Ultrasonic gel was applied to ensure optimal acoustic transmission. The submandibular glands were scanned in the transverse plane, while the parotid glands were assessed in both the transverse (A) and longitudinal (B) planes by positioning the transducer perpendicular and parallel to the mandibular ramus, respectively (Figure 1 and Figure 2). The ultrasound system was operated under the Small Parts (SmP) preset with Multi-Beam (SonoMB) optimization enabled to enhance tissue border definition. Scanning depth was standardized at 2.2 cm for all examinations. Gain, dynamic range, and time-gain compensation (TGC) were all maintained at the SmP preset defaults without manual adjustment, ensuring consistency across all subjects. The Mechanical Index (MI) was 0.8 and the Thermal Index for Soft Tissue (TIS) was 0.1. A single transmit focal zone was positioned at the target gland depth for all examinations.
Data collection was standardized at a single center using a consistent ultrasound device and a single experienced operator, minimizing potential variability arising from technical parameters such as gain, depth, and focal zone settings. By eliminating inter-scanner calibration differences, this approach enabled the reliable detection of parenchymal texture alterations, as reflected by fractal dimension measurements.

2.3. Image Processing of Salivary Gland Ultrasonographic Images

The ImageJ (version 1.53, National Institutes of Health, Bethesda, MD, USA) image processing and analysis software, which is provided free of charge by the National Institute of Health, was utilized in this study. The 2-D box-counting method, which was previously used by Chikui et al. in 2009 for the quantitative evaluation of parotid glands in SS patients, was employed for fractal analysis [24].
Fractal dimension (FD) was calculated separately for the right and left parotid and submandibular glands in each group, and the mean FD values for the right and left glands were also recorded.
  • FD of the left submandibular gland (left SMG-FD);
  • FD of the right submandibular gland (right SMG-FD);
  • The mean of the FD of the right and left submandibular glands (mean SMG-FD);
  • FD of the left parotid gland in the transverse plane (left PGT-FD);
  • FD of the right parotid gland in the transverse plane (right PGT-FD);
  • The mean FD of the right and left parotid glands in the transverse plane (mean PGT-FD);
  • FD of the left parotid gland in the longitudinal plane (left PGL-FD);
  • FD of the right parotid gland in the longitudinal plane (right PGL-FD);
  • The FD of the right and left parotid glands in the longitudinal plane (mean PGL-FD) was calculated individually.
For the evaluation of all acquired US images using fractal dimension analysis, the images were first transferred to a personal computer in .jpg format and subsequently converted to Tagged Image File Format (.TIFF) format. Images were saved in TIFF format to prevent further re-compression artifacts during the ImageJ workflow.
Only one region of interest (ROI) was obtained from each gland, centered within the gland. An ROI sized 64 × 64 pixels, as described in the reference study [24], was selected from the center of the relevant gland, provided that it remained strictly within the parenchymal borders of the gland. The upper border of the selected ROI was determined to be 4–8 mm away from the skin surface.
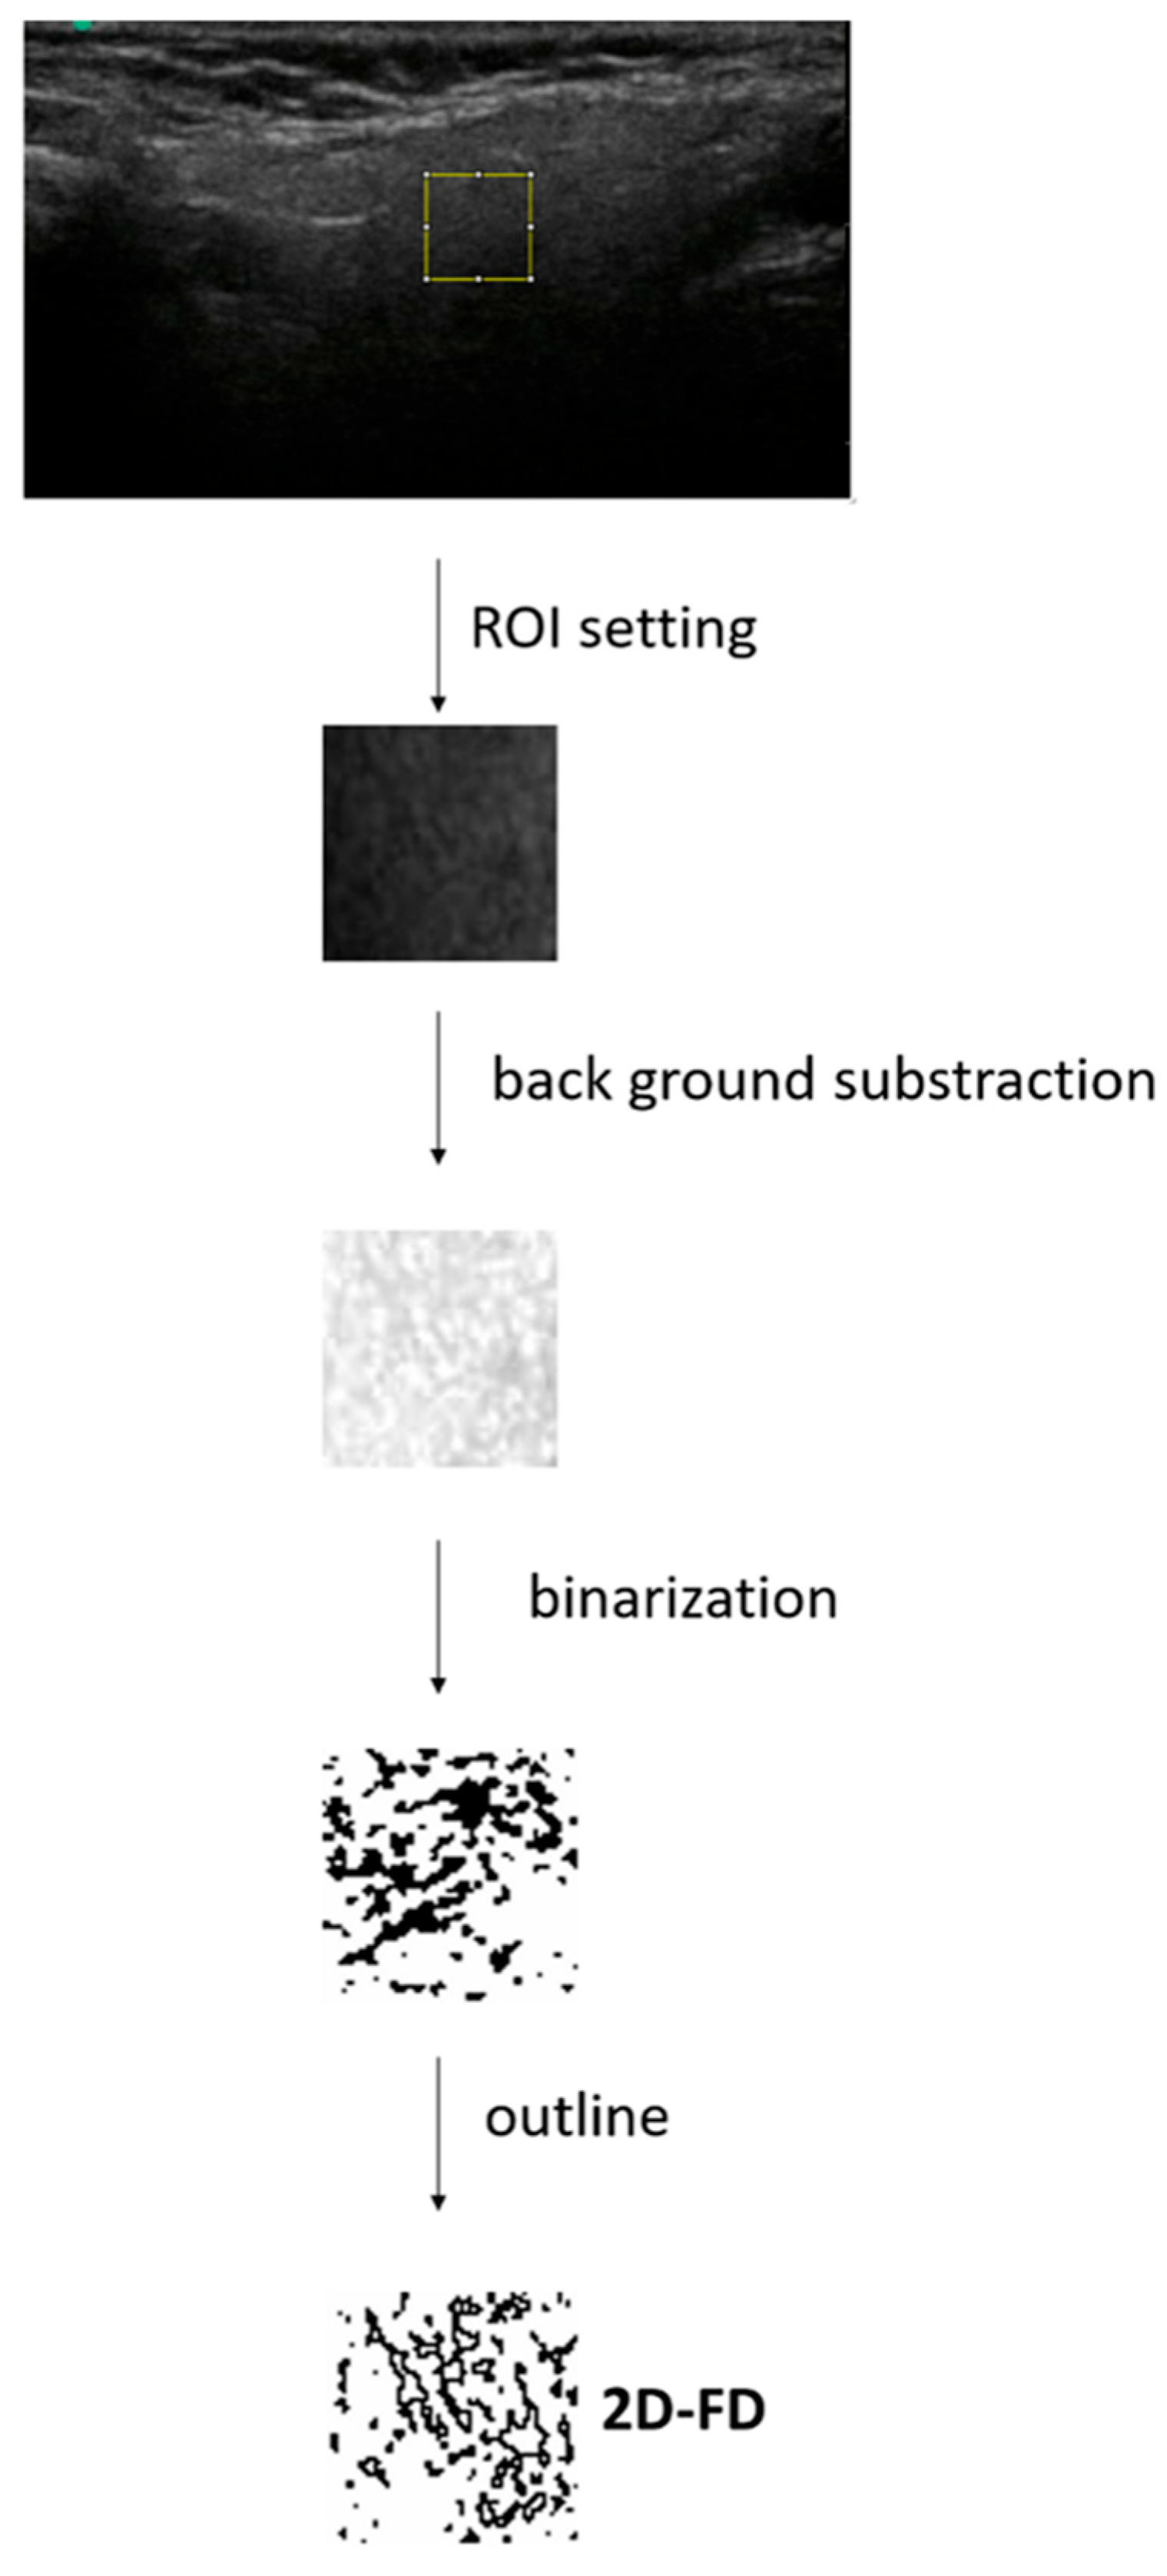
The following steps were performed sequentially for this analysis (Figure 3):
  • ROI selection.
  • Background Subtraction: To eliminate effects caused by US signal attenuation, the background of the image was subtracted from the original image using the “rolling ball” method with a radius of 20 pixels (background subtraction). Since 2D grayscale US images possess a third dimension (height) provided by the pixel value at each point, they are considered to form a surface. The surface area created when a ball rolls is assumed to represent the image’s background. As sonographic images contain background signals resulting from signal attenuation and inconsistent gain, these signals were eliminated using the “rolling ball” technique within the ImageJ software [14].
  • Binarization: The images were converted into binary (binarized) images to highlight hypo-echoic areas or echogenic lines within the US images. During the conversion to a binarized image, a threshold value was determined using the Iso-data method (Iso-data threshold). Iso-data binarization process filtered out random speckle noise by converting the grayscale image into a binary format based on an optimal threshold.
  • Outline Detection: The outer boundaries of the binarized image were determined (outline). Analyzing the detected outlines, we ensured that the FD reflects only the structural shape of the tissue.
  • Fractal Analysis: Fractal dimension analysis was applied to the image with its determined outer boundaries.
Prior to fractal analysis, the images were randomized and coded by a research assistant in maxillofacial radiology (S.K.Y) to ensure a blinded evaluation. All evaluations were performed in a quiet, semi-darkened room by two independent observers who were blinded to the group allocation of the participants.

2.4. Calculation of Fractal Dimension (FD)

Fractal analysis is a mathematical method used to study and characterize complex patterns and structures observed in disciplines such as mathematics, physics, computer science, biology, and finance. Fractals are defined as self-similar patterns that repeat at multiple scales and exhibit consistent structural features regardless of magnification level. The concept of fractals was first introduced in 1970 by mathematician Benoit Mandelbrot [27]. Various fractal models have been developed to calculate the fractal dimensions of images, including fractal Brownian motion, box counting, and fractal interpolation function systems [28,29]. The box-counting algorithm was employed as it is the most widely used and validated method for estimating the fractal dimension in medical imaging, providing a reliable quantitative description of complex biological shapes [30]. In the image processing section, the potential impact of noise on fractal dimension calculation was carefully examined through a multi-step preprocessing workflow. This approach effectively separates true biological complexity from random noise artifacts.
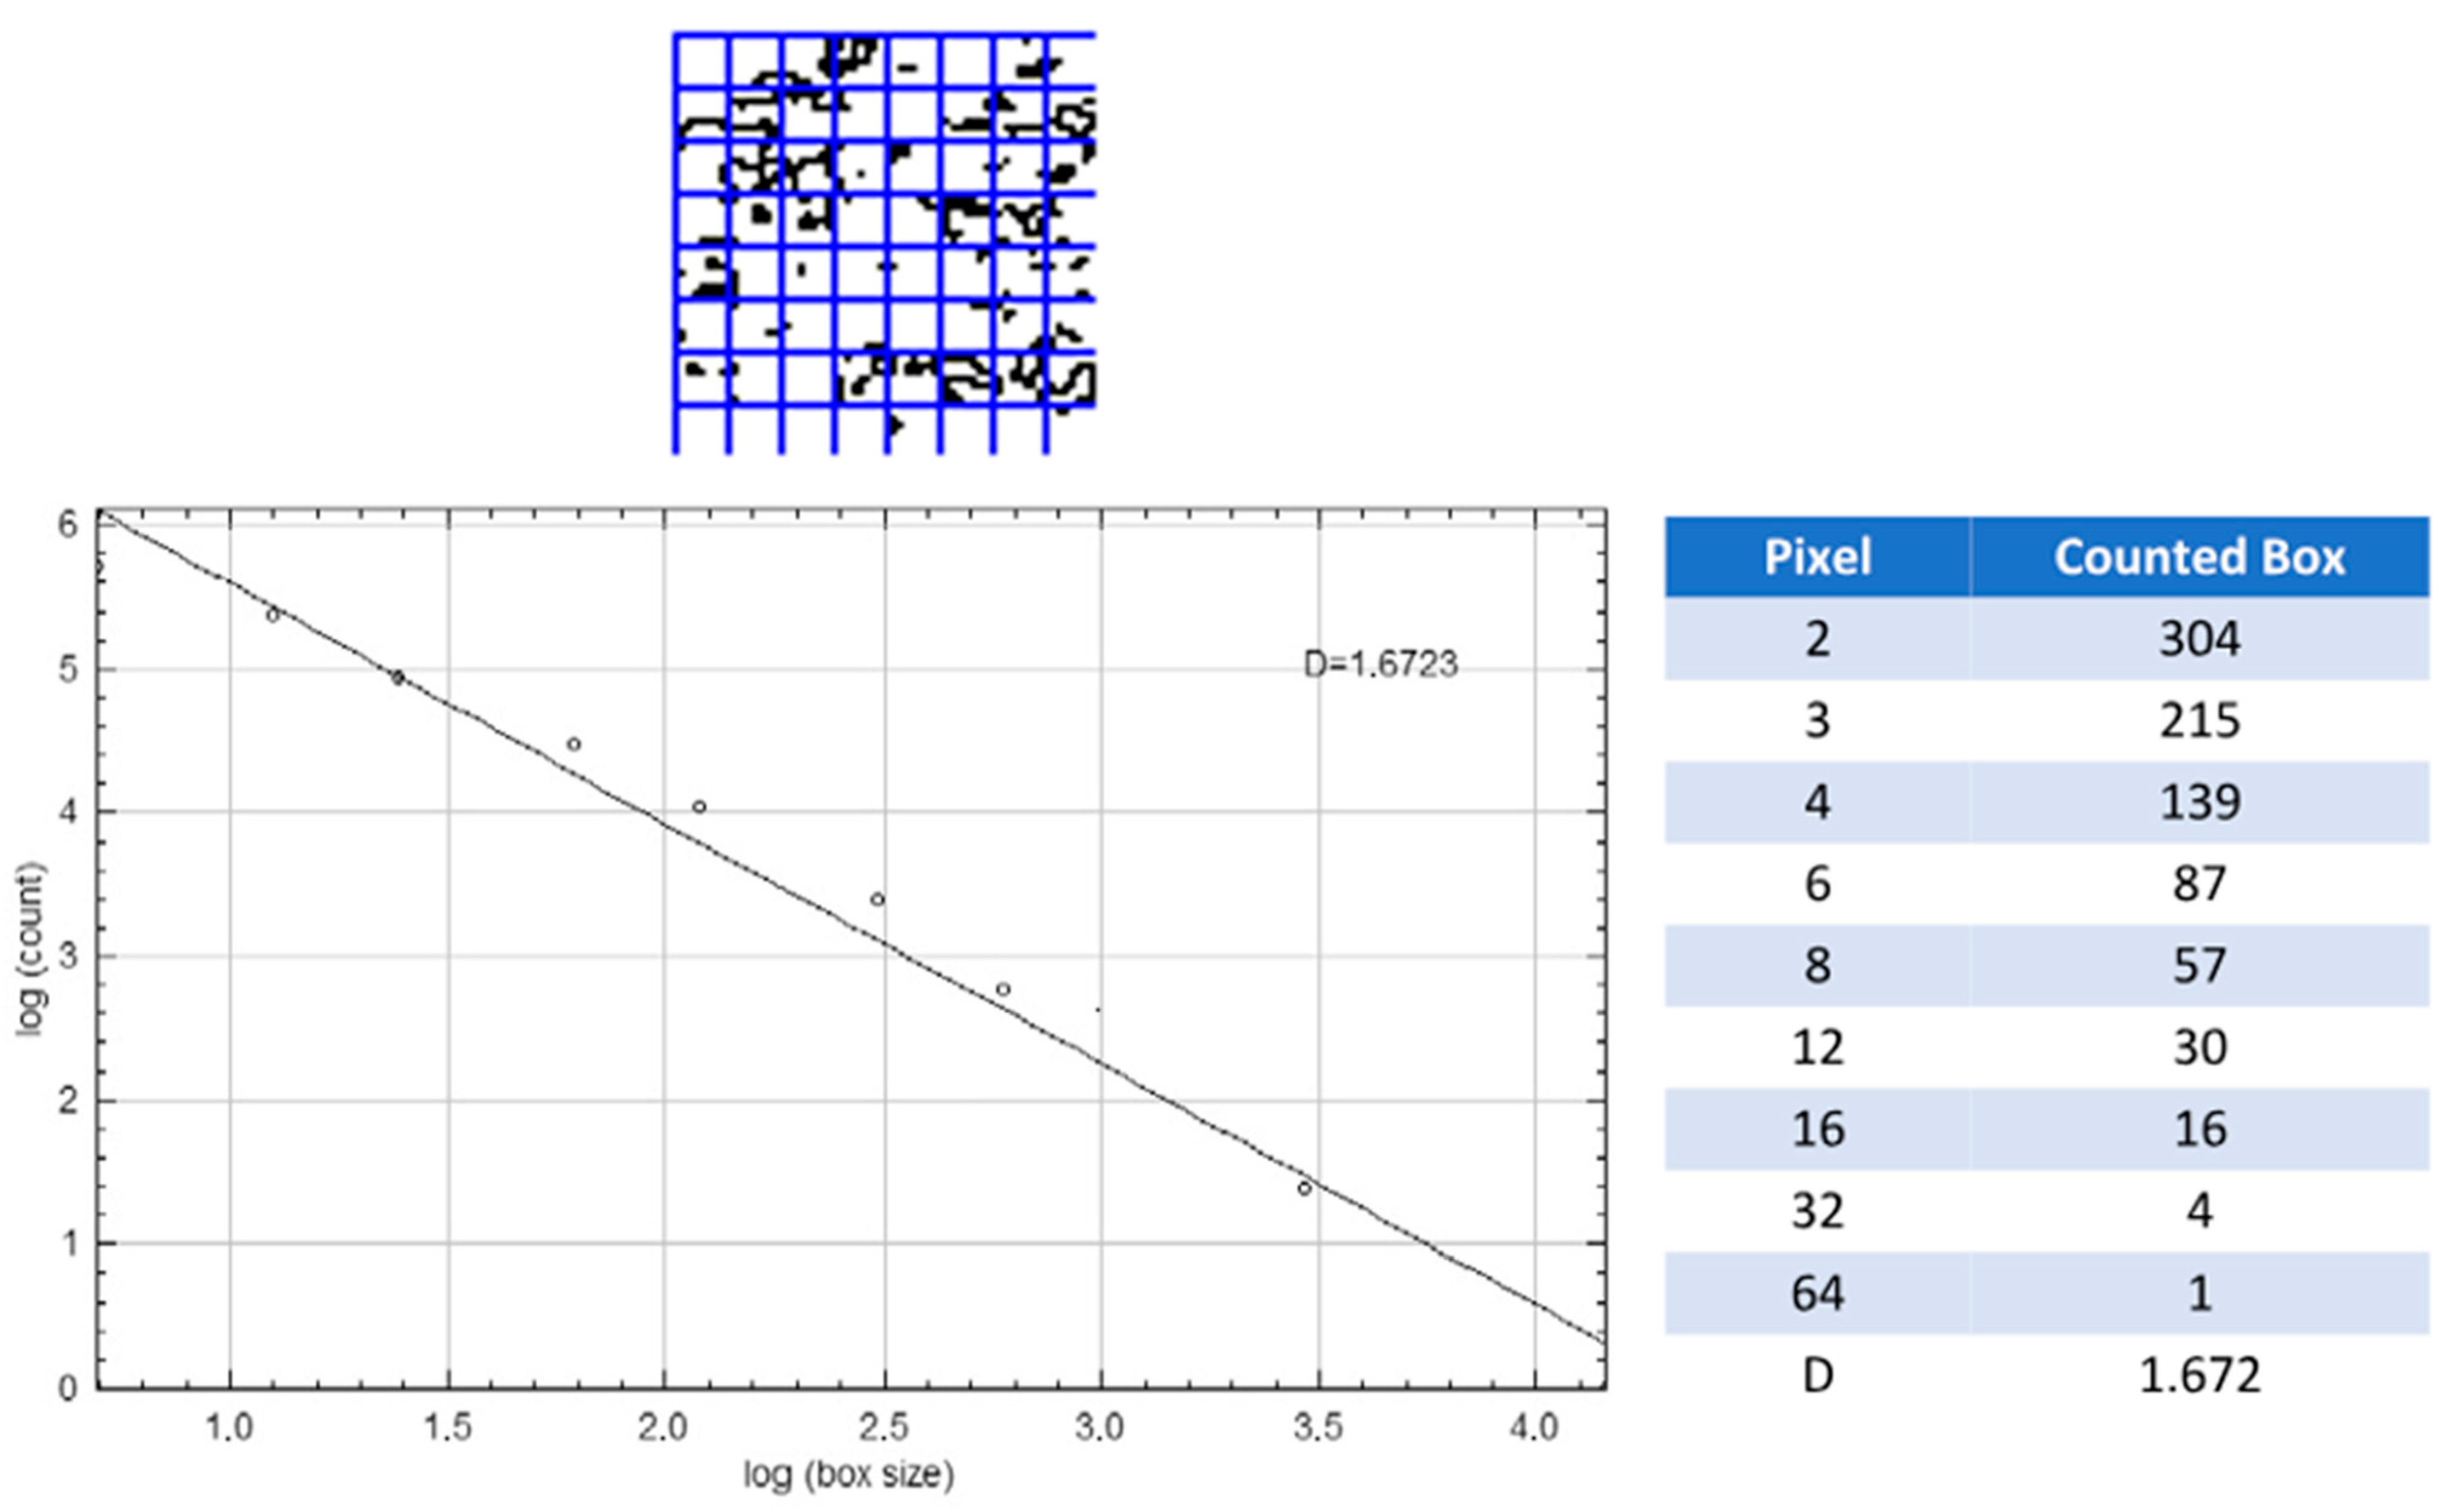
Next, for the calculation of the FD value, which reflects the parenchymal complexity in US images, the images were divided into squares of various sizes such as 2, 3, 4, 6, 8, 12, 16, 32, and 64 pixels using the ‘fractal box counter’ tool (Figure 4). FD was determined using a log–log plot and a box-counting grid generated by ImageJ software. As illustrated in Figure 4, the blue grid cells represent the superimposed box-counting framework, while the black dots indicate the specific intersections where tissue structure overlaps with the boxes. The FD value was subsequently calculated from the slope of the resulting log–log linear regression line. In the analysis process, both the number of squares containing hypoechoic areas/echogenic lines and the total number of squares in the image area were calculated for each box size (s). These data were graphed on a logarithmic scale. The FD value was determined based on the slope of the best-fit line to the data points plotted on this log–log graph. Therefore, we determined the linearity of the scaling relationship to distinguish the fractal structure from a possible multifractality. The relationship between box sizes and the total number and the final fractal dimension were calculated using the following formula: D = lim s 0 l o g N s log 1 s (Figure 4) [31].

2.5. Statistical Analysis

The data analysis was performed using Statistical Package for Social Sciences (SPSS Inc., Chicago, IL, USA) version 26.0 for Windows software. To determine the suitability of the measurements for normal distribution, kurtosis and skewness coefficients were examined. Kurtosis and skewness values obtained from the scales are considered sufficient for normal distribution if they fall between +3 and −3 [32]. Additionally, normality was confirmed using the Shapiro–Wilk test (p > 0.05) for all variables, and parametric test techniques were employed in our analyses. To account for multiple comparisons, the Bonferroni correction was applied (α = 0.05).
The difference in measurements between the groups was analyzed using the Independent Samples t-test. The relationship between the measurements was analyzed using the Pearson Correlation test. The difference between the means was analyzed using the Paired Samples t-test (or Dependent Samples t-test). The results of the analyses are reported as mean ± standard deviation or median (min-max) for the quantitative variables. The results were evaluated at a significance level of p < 0.05, with a 95% confidence interval. To determine the intraclass correlation coefficient (ICC) with a 95% confidence interval (CI), 25% of the US images were randomly selected two weeks later and fractal analyses were repeated.

3. Results

The study comprised 60 female participants, divided into a study group (n = 30) and a control group (n = 30). Regarding the mean ages of the participants, the study group was 35.83 ± 6.49 years, while the control group was 34.87 ± 6.37 years. In the study group, the mean duration of illness was recorded as 7.69 ± 3.58 years (Table 1).
In this study, fractal analysis was performed on a total of 180 salivary gland ultrasound images obtained from 60 individuals (30 in the study group and 30 in the control group), which included 60 submandibular glands, 60 parotid glands in the transverse plane, and 60 parotid glands in the longitudinal plane. The intra-observer reliability was excellent for all fractal dimension measurements. The Intraclass Correlation Coefficient (ICC) values, along with their 95% confidence intervals, were as follows: mean SMG-FD (ICC = 0.916; 95% CI: 0.88–0.94), mean PGL-FD (ICC = 0.924; 95% CI: 0.89–0.95), and mean PGT-FD (ICC = 0.887; 95% CI: 0.85–0.92) (all p < 0.001).
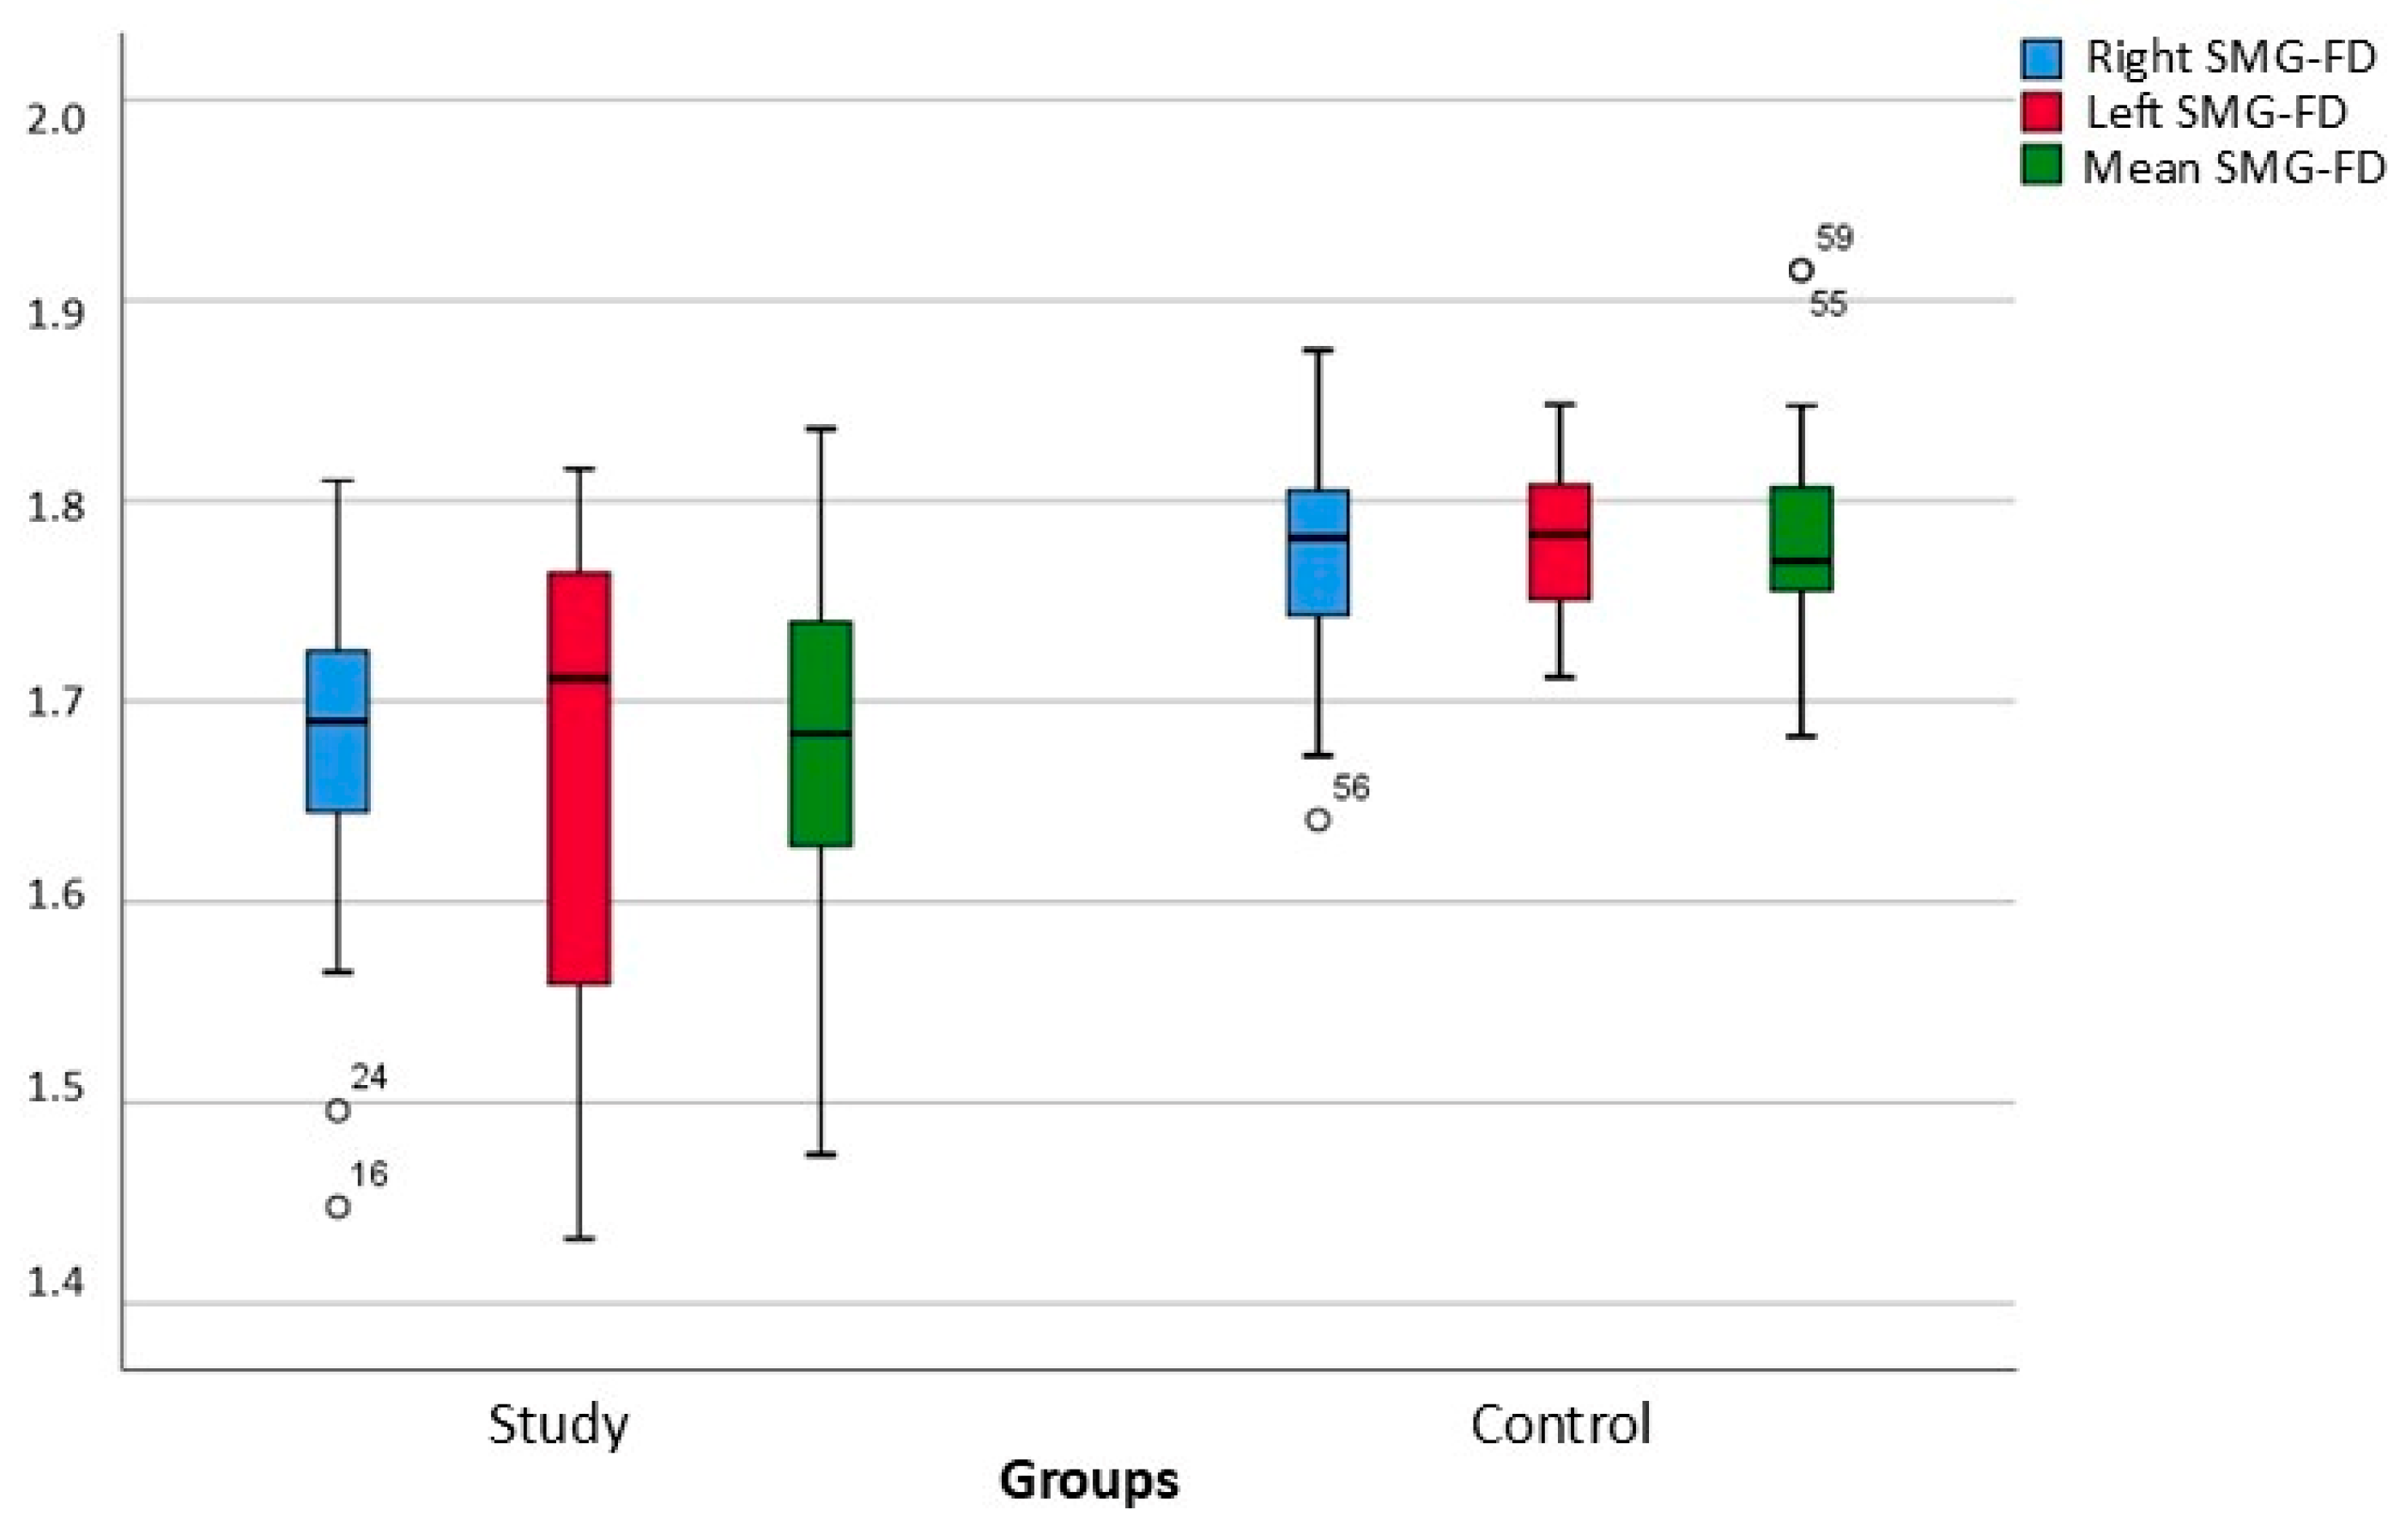
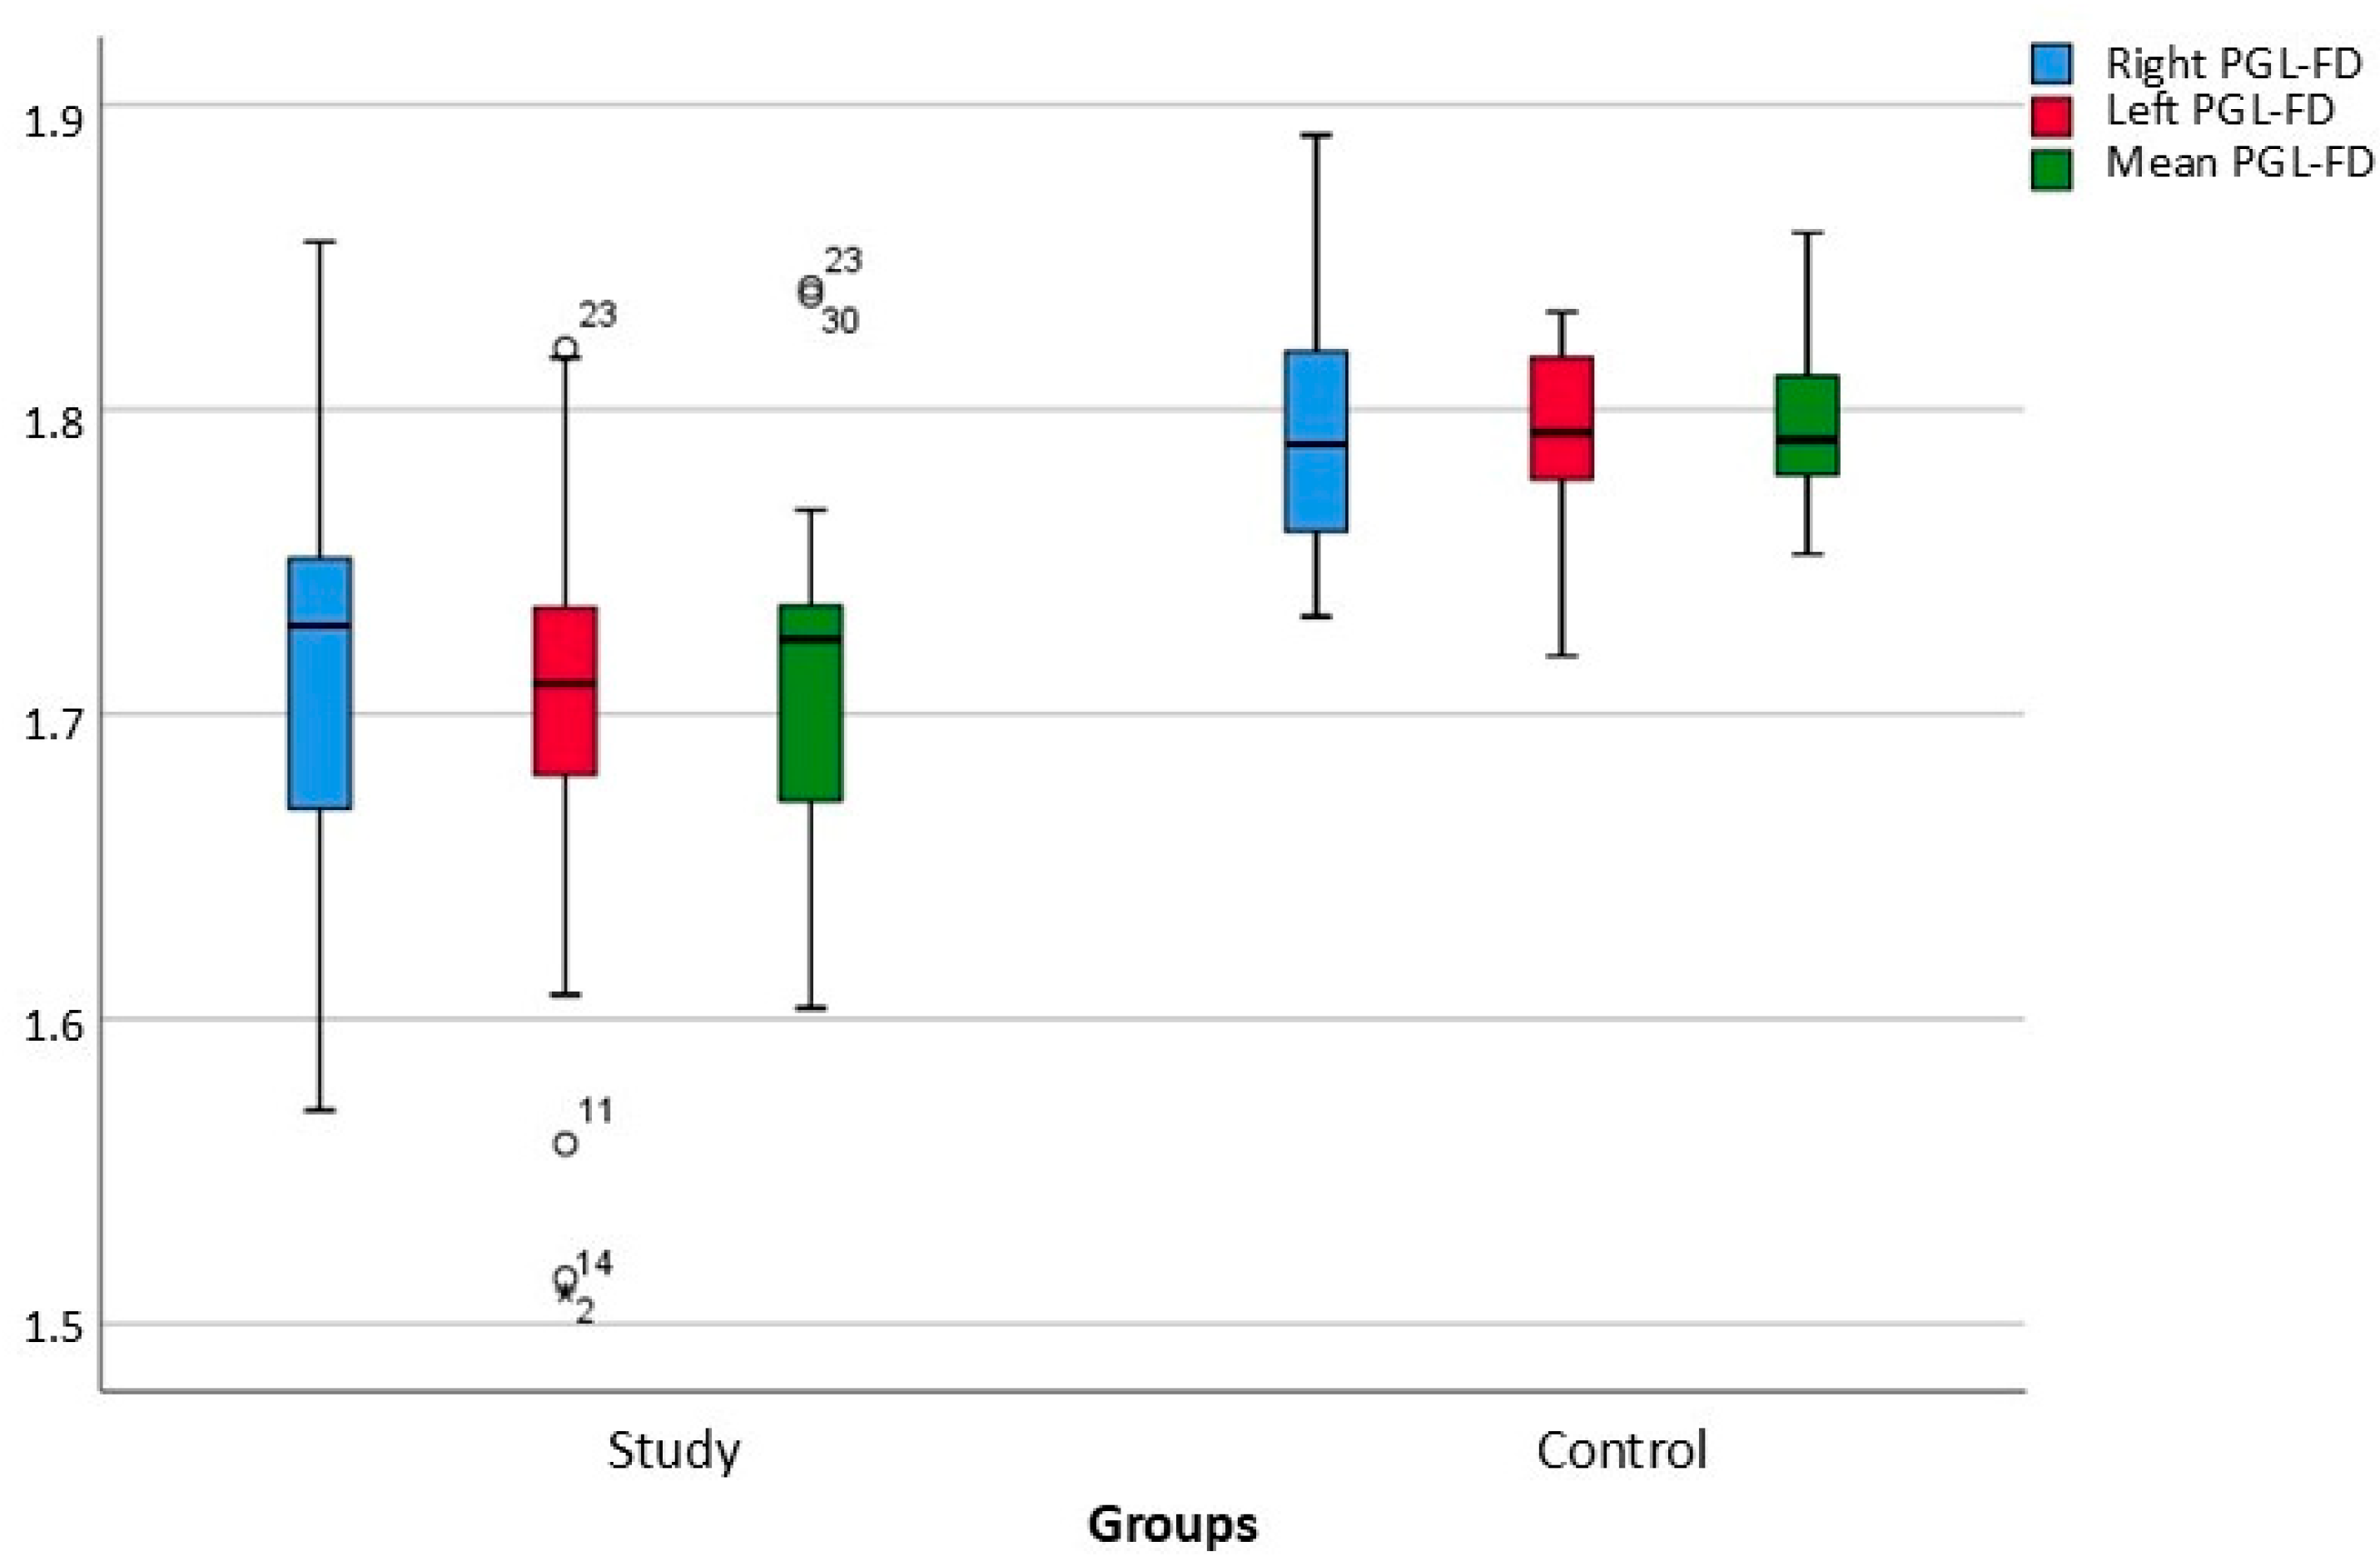
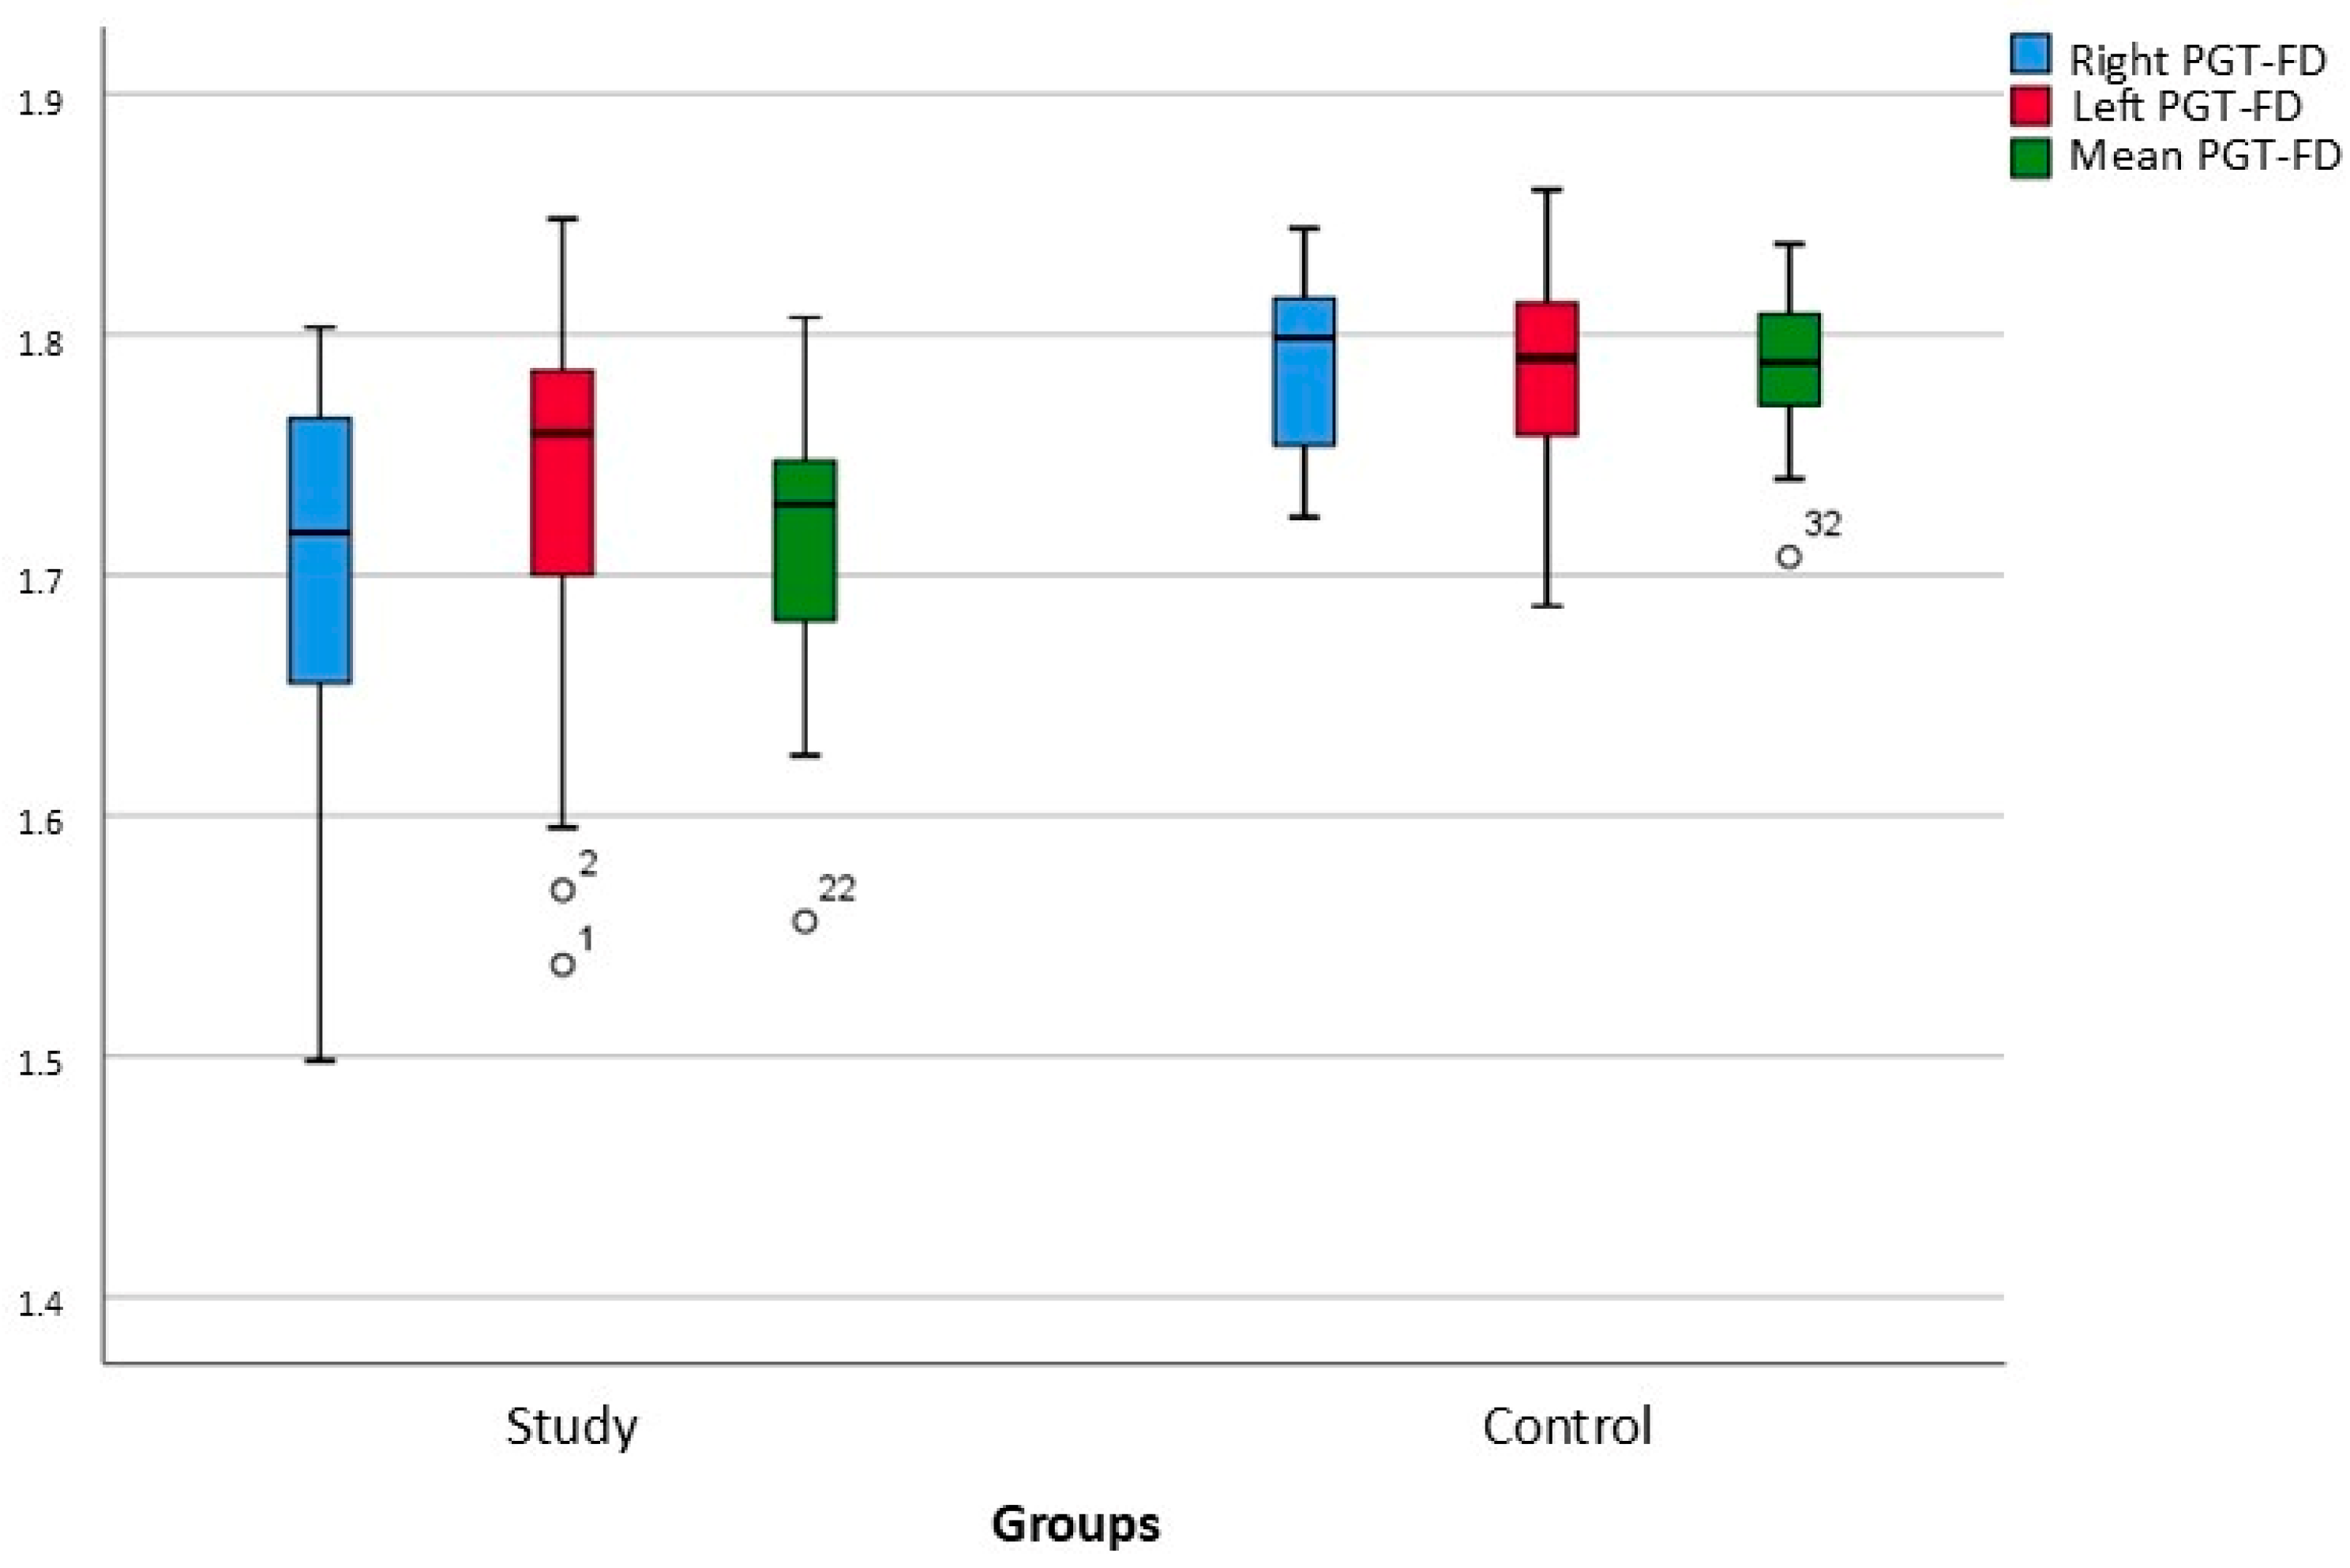
FD was calculated separately for the right and left parotid and submandibular glands in each group, and the mean FD values for the right and left glands were also recorded. The mean SMG-FD was found to be 1.68 ± 0.08 in the study group and 1.78 ± 0.05 in the control group; a statistically significant difference was identified between the groups (p < 0.001) (Table 2 and Figure 5). The mean PGL-FD was found to be 1.71 ± 0.06 in the study group and 1.79 ± 0.03 in the control group; this difference was statistically significant (p < 0.001) (Table 2 and Figure 6). Furthermore, when the mean PGT-FD was evaluated, it was found to be 1.72 ± 0.06 in the study group and 1.79 ± 0.03 in the control group; this difference was significant (p < 0.001) (Table 2 and Figure 7).

4. Discussion

AITD is a common organ-specific autoimmune disease with a higher prevalence in females than in males [1]. In a study retrospectively evaluating patients with HT, 306 (84.7%) were female and 55 (15.2%) were male [33]. Another retrospective study of 165 AITD patients (75.2% female) reported a predominant age group was 41–60 years (41.2%) [34]. To exclude age-related salivary changes, our study group was intentionally younger (35.83 ± 6.49 years), with a similar mean age in the control group (34.87 ± 6.37 years) for standardization. Furthermore, given the high female predominance of AITD, all participants in both groups were selected from the female population to eliminate potential hormone-related variations.
The coexistence of systemic and organ-specific autoimmune diseases is defined as polyautoimmunity, a phenomenon likely driven by shared genetic and environmental factors. SS exhibits strong polyautoimmune characteristics through its association with various conditions, most notably autoimmune thyroiditis, which is significantly more prevalent in SS patients than other organ-specific diseases [35]. Building on the concept of polyautoimmunity, this study aimed to evaluate salivary gland parenchymal changes in individuals with AITD. The study group consisted of patients under medical treatment who maintained euthyroid status but tested positive for at least one thyroid autoantibody. This specific cohort was selected to isolate the effect of autoantibody presence on salivary gland morphology, thereby excluding the potential confounding influence of hypothyroidism or hyperthyroidism.
US enables the visualization of glandular parenchyma and ductal changes in salivary glands [36]. US was preferred in this study due to its numerous advantages, including low cost, accessibility, lack of ionizing radiation, and absence of contraindications. However, the interpretation of US images is experience-dependent, and the diagnostic accuracy of inexperienced radiologists has been reported to be low [37]. These limitations have paved the way for the development of objective methods such as software-based image analysis, elastography, and deep learning-based tools (e.g., ImageJ 1.53 (National Institutes of Health, Bethesda, MD, USA), MATLAB R2025a (The MathWorks, Inc., Natick, MA, USA), Python version 3.2 that provide quantitative and reproducible results while eliminating observer dependency [17,18]. Furthermore, texture analysis examines the differential intensity of image elements through mathematical algorithms and has been widely utilized in medical research to investigate the characteristics of complex biological structures [38].
Badea et al. reported that subtle details in radiological images, which may conceal tumors, degenerations, or inflammatory lesions, are not always discernible to the human eye. They suggested that the intricate geometry of tissues captured via US can be identified using methods that analyze complexity, such as fractal analysis [25]. As a quantitative approach, fractal analysis offers distinct advantages over subjective assessments by eliminating operator-dependent variability and ensuring reproducible results [21]. Since reflected US signals are influenced by the shape and spatial distribution of tissue scatterers, B-mode images are considered to follow a random dynamic pattern reflecting the underlying structures. When pixel intensity is viewed as height above a plane, these images can be treated as rough surfaces. Fractal analysis evaluates textural patterns by quantifying the randomness of tissues or tumors in US images. According to fractal geometry, US images are regarded as fractal objects, and their characteristics can be quantitatively assessed using the fractal dimension [39]. Following a study where the parenchymal echogenicity, vascularity, and volume of salivary glands in children with AITD were subjectively evaluated, researchers emphasized the necessity of incorporating quantitative methods into US assessments [20]. Accordingly, the present study utilized fractal analysis for the quantitative evaluation of salivary glands on US images.
Numerous studies have applied fractal analysis to US images [14,21,24,29,39]. Badea et al. applied the box-counting method via ImageJ to perform fractal analysis on elastography, Doppler, and two-dimensional grayscale ultrasound images of patients with submandibular sialadenitis. The authors reported an upward trend in FD values in pathological cases, suggesting that elevated fractal dimension reflects increased tissue complexity and may effectively differentiate inflammatory from non-inflammatory states [25]. Dedeoglu et al. evaluated the parotid and submandibular glands of healthy individuals before and after stimulation using 50 × 50 pixel circular ROIs; however, no statistically significant difference in FD was detected [26]. Conversely, Honda et al. applied fractal analysis to sialographic images of patients with SS and found a decreased FD due to reduced ductal pattern complexity [40].
Chikui et al. used fractal analysis on parotid US images of patients with suspected SS. Their quantitative findings were consistent with sialography results, where patients with abnormal findings showed a lower FD compared to those with normal findings. They concluded that fractal analysis can effectively detect abnormal parotid patterns in US images [24]. Similarly, in the present study, the FD values were found to be statistically significantly lower in both the submandibular and parotid glands of the patient group compared to the control group.
Kato et al., in their review of fractal analysis, reported that square ROI of 64 × 64 pixels, the White and Rudolph [41] technique, the box-counting method, and ImageJ software are frequently utilized, particularly in bone tissue studies [23]. However, a lack of standardization in image processing techniques and filter applications remains a challenge in the literature. In the present study, we employed the 2D box-counting method [24] and 64 × 64 pixel square ROIs via ImageJ, consistent with frequently used protocols. Due to the limited number of fractal analysis studies on salivary gland US images, a comprehensive comparison of our results with existing literature was restricted. We believe that standardizing fractal analysis methods and image processing steps would enhance the reliability of this technique. Furthermore, the scarcity of research in this area may be attributed to a lack of technical knowledge regarding software use, unclear guidelines, and insufficient detail in reported methodologies.
The acquisition process for US images differs fundamentally from radiographic imaging, as US probes dynamically capture sound waves reflected from biological structures [42]. Since fractal analysis measures structures based on pixel projections in 2D images, the acquisition method is critical; imaging conditions and image quality directly influence fractal dimensions [23]. Various algorithms exist in the literature, and applying different techniques to the same images can yield divergent results. Factors such as low resolution, high signal-to-noise ratio, and variations in bit depth may lead to inconsistent reporting. Additionally, improper ROI selection can result in erroneous calculations [43]. Notably, Pekince et al. reported that even changing the angle of ROIs from the same region could alter fractal analysis results [44].
Despite these variables, statistically significant results can be achieved as long as the same technique, including filter values and ROI sizes, is applied consistently to both patient and control groups. In this study, a statistically significant difference was similarly found between the fractal analysis values of the study and control groups.
To the best of our knowledge, this is the first study to evaluate salivary gland ultrasonographic images in patients with AITD using fractal analysis. Although Chikui et al. demonstrated this method in Sjögren’s syndrome, the salivary gland parenchyma in AITD presents a distinct acoustic signature, and the present study quantifies this specific tissue complexity. We propose that AITD induces structural changes in the salivary gland parenchyma that are reflected as a reduction in the fractal dimension of ultrasound images. Furthermore, this quantitative approach has the potential to reduce inter-observer variability in the ultrasonographic evaluation of salivary glands in patients with AITD. However, the scarcity of prior literature on this specific topic has limited our ability to perform a comprehensive comparison of the current findings. Incorporating additional quantitative imaging modalities in a comparative framework could provide a more detailed understanding of parenchymal changes in this patient population.
This study has several limitations that should be acknowledged. First, the sample size was relatively small and derived from a single center using a single ultrasound scanner, which may limit the generalizability of the findings. Second, the cohort consisted entirely of female patients; while autoimmune thyroid diseases are more prevalent in women, future studies should include male participants to ensure broader clinical applicability. Third, fractal dimension values were not correlated with clinical symptoms or objective salivary function tests, and no external validation was performed on an independent dataset. Fourth, a formal sensitivity analysis regarding minor spatial shifts in ROI positioning was not performed; although the excellent intra-observer reliability indicates highly consistent ROI placement across repeated measurements, this does not directly substitute for a dedicated spatial sensitivity analysis. Finally, 2D image-based texture analysis, while highly accessible and practical, has inherent technical limitations compared to advanced volumetric assessments and whole-gland segmentation approaches. Addressing these constraints through future longitudinal research incorporating larger multicenter cohorts and multimodal data integration will be essential to fully establish the diagnostic value of fractal analysis in AITD.

5. Conclusions

In conclusion, this study demonstrates that fractal analysis of ultrasound images can quantitatively detect structural alterations in the salivary glands of patients with AITD. The significant reduction in fractal dimension values observed in the parotid and submandibular glands suggests a loss of parenchymal complexity in this patient population. These findings indicate that fractal analysis may serve as a valuable adjunctive tool for identifying parenchymal changes in the salivary glands. By providing objective and reproducible measurements, this method has the potential to contribute meaningfully to the diagnosis and treatment planning of systemic and salivary gland diseases. Future studies involving larger, multicenter patient cohorts and conducted in multidisciplinary collaboration with endocrinology should incorporate detailed assessments of thyroid autoantibody and hormone levels, as well as salivary gland flow rates, to further establish the clinical utility of this approach.

Author Contributions

Conceptualization: S.K.Y., Methodology: S.K.Y. and M.T., Validation: S.K.Y., Formal analysis: S.K.Y. and M.T., Investigation: S.K.Y. and M.T., Resources: S.K.Y., Data Curation: S.K.Y. and M.T., Writing—original draft preparation: S.K.Y. and M.T., Writing—review and editing: M.T., Visualization: S.K.Y. and M.T., Supervision: M.T. All authors have read and agreed to the published version of the manuscript.

Funding

This research received no external funding.

Institutional Review Board Statement

The study received ethical approval from the Research Ethics Committee of the Faculty of Dentistry at Gazi University, and was conducted in accordance with the Declaration of Helsinki guidelines (Approval date: 13 February 2024; Approval number: 2024–272).

Informed Consent Statement

Informed consent was obtained from all subjects involved in the study. Written informed consent has been obtained from the patients to publish this paper.

Data Availability Statement

The data generated during and/or analysed during the current study are available from the corresponding author on reasonable request.

Conflicts of Interest

The authors declare no conflicts of interest.

Abbreviations

The following abbreviations are used in this manuscript:
AITDAutoimmune Thyroid Disease
TGThyroglobulin
TPOThyroid Peroxidase
TSHRThyroid-Stimulating Hormone Receptor
TSHThyroid-Stimulating Hormone
GDGraves’ Disease
HTHashimoto’s thyroiditis
FDFractal Dimension
USUltrasound
ROIRegion of Interest
SSSjögren’s Syndrome
SMGSubmandibular Gland
PGLParotid Gland in Longitudinal Plane
PGTParotid Gland in Transverse Plane

References

  1. Agha-Hosseini, F.; Shirzad, N.; Moosavi, M.S. Evaluation of Xerostomia and salivary flow rate in Hashimoto’s Thyroiditis. Med. Oral Patol. Oral Cir. Bucal 2016, 21, e1–e5. [Google Scholar] [CrossRef]
  2. Ibili, A.B.P.; Selver Eklioglu, B.; Atabek, M.E. General properties of autoimmune thyroid diseases and associated morbidities. J. Pediatr. Endocrinol. Metab. 2020, 33, 509–515. [Google Scholar] [CrossRef]
  3. Kahaly, G.; Frommer, L. Polyglandular autoimmune syndromes. J. Endocrinol. Investig. 2018, 41, 91–98. [Google Scholar] [CrossRef]
  4. McLachlan, S.M.; Rapoport, B. Breaking tolerance to thyroid antigens: Changing concepts in thyroid autoimmunity. Endocr. Rev. 2014, 35, 59–105. [Google Scholar] [CrossRef] [PubMed]
  5. Tunbridge, W.M.; Brewis, M.; French, J.M.; Appleton, D.; Bird, T.; Clark, F.; Evered, D.C.; Evans, J.G.; Hall, R.; Smith, P.; et al. Natural history of autoimmune thyroiditis. Br. Med. J. (Clin. Res. Ed.) 1981, 282, 258–262. [Google Scholar] [CrossRef]
  6. Moreno-Quispe, L.A.; Serrano, J.; Virto, L.; Sanz, M.; Ramírez, L.; Fernández-Castro, M.; Hernández, G.; López-Pintor, R.M. Association of salivary inflammatory biomarkers with primary Sjögren’s syndrome. J. Oral Pathol. Med. 2020, 49, 940–947. [Google Scholar] [CrossRef]
  7. Morawska, K.; Maciejczyk, M.; Popławski, Ł.; Popławska-Kita, A.; Kretowski, A.; Zalewska, A. Enhanced Salivary and General Oxidative Stress in Hashimoto’s Thyroiditis Women in Euthyreosis. J. Clin. Med. 2020, 9, 2102. [Google Scholar] [CrossRef]
  8. Lasagni, L.; Francalanci, M.; Annunziato, F.; Lazzeri, E.; Giannini, S.; Cosmi, L.; Sagrinati, C.; Mazzinghi, B.; Orlando, C.; Maggi, E.; et al. An alternatively spliced variant of CXCR3 mediates the inhibition of endothelial cell growth induced by IP-10, Mig, and I-TAC, and acts as functional receptor for platelet factor 4. J. Exp. Med. 2003, 197, 1537–1549. [Google Scholar] [CrossRef]
  9. Antonelli, A.; Rotondi, M.; Ferrari, S.M.; Fallahi, P.; Romagnani, P.; Franceschini, S.S.; Serio, M.; Ferrannini, E. Interferon-gamma-inducible alpha-chemokine CXCL10 involvement in Graves’ ophthalmopathy: Modulation by peroxisome proliferator-activated receptor-gamma agonists. J. Clin. Endocrinol. Metab. 2006, 91, 614–620. [Google Scholar] [CrossRef] [PubMed]
  10. Romagnani, P.; Rotondi, M.; Lazzeri, E.; Lasagni, L.; Francalanci, M.; Buonamano, A.; Milani, S.; Vitti, P.; Chiovato, L.; Tonacchera, M.; et al. Expression of IP-10/CXCL10 and MIG/CXCL9 in the thyroid and increased levels of IP-10/CXCL10 in the serum of patients with recent-onset Graves’ disease. Am. J. Pathol. 2002, 161, 195–206. [Google Scholar] [CrossRef] [PubMed]
  11. Bialek, E.J.; Jakubowski, W.; Zajkowski, P.; Szopinski, K.T.; Osmolski, A. US of the major salivary glands: Anatomy and spatial relationships, pathologic conditions, and pitfalls. Radiographics 2006, 26, 745–763. [Google Scholar] [CrossRef]
  12. Katz, P.; Hartl, D.M.; Guerre, A. Clinical ultrasound of the salivary glands. Otolaryngol. Clin. N. Am. 2009, 42, 973–1000. [Google Scholar] [CrossRef]
  13. Hočevar, A.; Bruyn, G.A.; Terslev, L.; De Agustin, J.J.; MacCarter, D.; Chrysidis, S.; Collado, P.; Dejaco, C.; Fana, V.; Filippou, G.; et al. Development of a new ultrasound scoring system to evaluate glandular inflammation in Sjögren’s syndrome: An OMERACT reliability exercise. Rheumatology 2021, 61, 3341–3350. [Google Scholar] [CrossRef]
  14. Ariji, Y.; Ohki, M.; Eguchi, K.; Izumi, M.; Ariji, E.; Mizokami, A.; Nagataki, S.; Nakamura, T. Texture analysis of sonographic features of the parotid gland in Sjögren’s syndrome. AJR Am. J. Roentgenol. 1996, 166, 935–941. [Google Scholar] [CrossRef]
  15. Leehan, K.M.; Pezant, N.P.; Rasmussen, A.; Grundahl, K.; Moore, J.S.; Radfar, L.; Lewis, D.M.; Stone, D.U.; Lessard, C.J.; Rhodus, N.L. Minor salivary gland fibrosis in Sjögren’s syndrome is elevated, associated with focus score and not solely a consequence of aging. Clin. Exp. Rheumatol. 2017, 36, 80. [Google Scholar] [PubMed]
  16. Park, Y.; Oh, M.; Lee, Y.S.; Kim, W.-U. Salivary ultrasonography and histopathologic evaluation of secondary Sjögren’s syndrome in rheumatoid arthritis patients. Sci. Rep. 2023, 13, 11339. [Google Scholar] [CrossRef]
  17. Grob, A.T.; Veen, A.A.; Schweitzer, K.J.; Withagen, M.I.; van Veelen, G.A.; van der Vaart, C.H. Measuring echogenicity and area of the puborectalis muscle: Method and reliability. Ultrasound Obs. Gynecol. 2014, 44, 481–485. [Google Scholar] [CrossRef]
  18. Di Matteo, A.; Moscioni, E.; Lommano, M.G.; Cipolletta, E.; Smerilli, G.; Farah, S.; Airoldi, C.; Aydin, S.Z.; Becciolini, A.; Bonfiglioli, K. Reliability assessment of ultrasound muscle echogenicity in patients with rheumatic diseases: Results of a multicenter international web-based study. Front. Med. 2023, 9, 1090468. [Google Scholar] [CrossRef] [PubMed]
  19. Vukicevic, A.M.; Radovic, M.; Zabotti, A.; Milic, V.; Hocevar, A.; Callegher, S.Z.; De Lucia, O.; De Vita, S.; Filipovic, N. Deep learning segmentation of Primary Sjögren’s syndrome affected salivary glands from ultrasonography images. Comput. Biol. Med. 2021, 129, 104154. [Google Scholar] [CrossRef] [PubMed]
  20. Taşolar, S.D.; Sığırcı, A.; Çiftçi, N.; Cengiz, A.; Doğan, G.M.; Akıncı, A. Evaluation of Salivary Glands by Ultrasonography and Inflammatory Markers in Children with Autoimmune Thyroiditis. Istanb. Med. J. 2023, 24, 246–250. [Google Scholar]
  21. Chikui, T.; Tokumori, K.; Yoshiura, K.; Oobu, K.; Nakamura, S.; Nakamura, K. Sonographic texture characterization of salivary gland tumors by fractal analyses. Ultrasound Med. Biol. 2005, 31, 1297–1304. [Google Scholar] [CrossRef]
  22. Heymans, O.; Fissette, J.; Vico, P.; Blacher, S.; Masset, D.; Brouers, F. Is fractal geometry useful in medicine and biomedical sciences? Med. Hypotheses 2000, 54, 360–366. [Google Scholar] [CrossRef]
  23. Kato, C.N.; Barra, S.G.; Tavares, N.P.; Amaral, T.M.; Brasileiro, C.B.; Mesquita, R.A.; Abreu, L.G. Use of fractal analysis in dental images: A systematic review. Dentomaxillofac. Radiol. 2020, 49, 20180457. [Google Scholar] [CrossRef]
  24. Chikui, T.; Shimizu, M.; Kawazu, T.; Okamura, K.; Shiraishi, T.; Yoshiura, K. A quantitative analysis of sonographic images of the salivary gland: A comparison between sonographic and sialographic findings. Ultrasound Med. Biol. 2009, 35, 1257–1264. [Google Scholar] [CrossRef]
  25. Badea, A.F.; Lupsor Platon, M.; Crisan, M.; Cattani, C.; Badea, I.; Pierro, G.; Sannino, G.; Baciut, G. Fractal analysis of elastographic images for automatic detection of diffuse diseases of salivary glands: Preliminary results. Comput. Math. Methods Med. 2013, 2013, 347238. [Google Scholar] [CrossRef]
  26. Dedeoğlu, N.; Altun, O.; Çelik Özen, D.; Eşer, G. Comparison of stimulated and unstimulated salivary gland parenchyma using fractal analysis of ultrasonographic images. Oral Radiol. 2025, 41, 396–402. [Google Scholar] [CrossRef] [PubMed]
  27. Mandelbrot, B. How long is the coast of britain? Statistical self-similarity and fractional dimension. Science 1967, 156, 636–638. [Google Scholar] [CrossRef] [PubMed]
  28. Fiz, J.A.; Monte-Moreno, E.; Andreo, F.; Auteri, S.J.; Sanz-Santos, J.; Serra, P.; Bonet, G.; Castellà, E.; Manzano, J.R. Fractal dimension analysis of malignant and benign endobronchial ultrasound nodes. BMC Med. Imaging 2014, 14, 22. [Google Scholar] [CrossRef] [PubMed]
  29. Chen, D.-R.; Chang, R.-F.; Chen, C.-J.; Ho, M.-F.; Kuo, S.-J.; Chen, S.-T.; Hung, S.-J.; Moon, W.K. Classification of breast ultrasound images using fractal feature. Clin. Imaging 2005, 29, 235–245. [Google Scholar] [CrossRef]
  30. Lopes, R.; Betrouni, N. Fractal and multifractal analysis: A review. Med. Image Anal. 2009, 13, 634–649. [Google Scholar] [CrossRef]
  31. Foroutan-pour, K.; Dutilleul, P.; Smith, D.L. Advances in the implementation of the box-counting method of fractal dimension estimation. Appl. Math. Comput. 1999, 105, 195–210. [Google Scholar] [CrossRef]
  32. DeCarlo, L.T. On the meaning and use of kurtosis. Psychol. Methods 1997, 2, 292. [Google Scholar] [CrossRef]
  33. Calcaterra, V.; Nappi, R.E.; Regalbuto, C.; De Silvestri, A.; Incardona, A.; Amariti, R.; Bassanese, F.; Clemente, A.M.; Vinci, F.; Albertini, R. Gender differences at the onset of autoimmune thyroid diseases in children and adolescents. Front. Endocrinol. 2020, 11, 229. [Google Scholar] [CrossRef] [PubMed]
  34. Shah, S.; Singh, D.; Kohli, S. Prevalence of Autoimmune Thyroid Disease and Associated Autoimmune Conditions in Hypothyroidism: A Cross-Sectional Study from a Tertiary Care Hospital in New Delhi. Cureus 2025, 17, e95209. [Google Scholar] [CrossRef]
  35. Dogru, A.; Gur Hatip, F. Autoimmune Thyroid Disease and Sjögren Disease: Organ-Specific Disease Triggered by Systemic Autoimmunity? Medicina 2025, 61, 287. [Google Scholar] [CrossRef] [PubMed]
  36. Kalinowski, M.; Heverhagen, J.T.; Rehberg, E.; Klose, K.J.; Wagner, H.J. Comparative study of MR sialography and digital subtraction sialography for benign salivary gland disorders. AJNR Am. J. Neuroradiol. 2002, 23, 1485–1492. [Google Scholar]
  37. Jazzar, A.; Manoharan, A.; Brown, J.E.; Shirlaw, P.J.; Carpenter, G.H.; Challacombe, S.J.; Proctor, G.B. Predictive value of ultrasound scoring in relation to clinical and histological parameters in xerostomia patients. Oral Dis. 2019, 25, 150–157. [Google Scholar] [CrossRef]
  38. Raja, J.V.; Khan, M.; Ramachandra, V.K.; Al-Kadi, O. Texture analysis of CT images in the characterization of oral cancers involving buccal mucosa. Dentomaxillofac. Radiol. 2012, 41, 475–480. [Google Scholar] [CrossRef]
  39. Yan, Y.; Zhu, W.; Wu, Y.-y.; Zhang, D. Fractal dimension differentiation between benign and malignant thyroid nodules from ultrasonography. Appl. Sci. 2019, 9, 1494. [Google Scholar] [CrossRef]
  40. Honda, E.; Domon, M.; Sasaki, T.; Obayashi, N.; Ida, M. Fractal dimensions of ductal patterns in the parotid glands of normal subjects and patients with Sjögren syndrome. Investig. Radiol. 1992, 27, 790–795. [Google Scholar] [CrossRef]
  41. White, S.C.; Rudolph, D.J. Alterations of the trabecular pattern of the jaws in patients with osteoporosis. Oral Surg. Oral Med. Oral Pathol. Oral Radiol. Endodontol. 1999, 88, 628–635. [Google Scholar] [CrossRef] [PubMed]
  42. Marotti, J.; Heger, S.; Tinschert, J.; Tortamano, P.; Chuembou, F.; Radermacher, K.; Wolfart, S. Recent advances of ultrasound imaging in dentistry—A review of the literature. Oral Surg. Oral Med. Oral Pathol. Oral Radiol. 2013, 115, 819–832. [Google Scholar] [CrossRef] [PubMed]
  43. Lennon, F.E.; Cianci, G.C.; Cipriani, N.A.; Hensing, T.A.; Zhang, H.J.; Chen, C.-T.; Murgu, S.D.; Vokes, E.E.; Vannier, M.W.; Salgia, R. Lung cancer—A fractal viewpoint. Nat. Rev. Clin. Oncol. 2015, 12, 664–675. [Google Scholar] [CrossRef] [PubMed]
  44. Pekince, A.; Azlağ Pekince, K.; Yasa, Y. How does the direction of region of interest selection affect the fractal dimension? Oral Radiol. 2025, 41, 180–189. [Google Scholar] [CrossRef]
Figure 1. Ultrasound Images of the Salivary Glands of a Study Group. (A) Submandibular gland (SMG); (B) Parotid gland in longitudinal plane (PGL); (C) Parotid gland in transverse plane (PGT).
Fractalfract 10 00358 g001
Figure 2. Ultrasound Images of the Salivary Glands of a Control Group. (A) Submandibular gland (SMG); (B) Parotid gland in longitudinal plane (PGL); (C) Parotid gland in transverse plane (PGT).
Fractalfract 10 00358 g002
Figure 3. Sequential steps of the image processing workflow for fractal analysis.
Fractalfract 10 00358 g003
Figure 4. ImageJ-generated log–log plot and box-counting grid utilized for determining the FD. Blue grid cells represent the box-counting grid, and black dots mark the intersections where the structure overlaps with a box.
Fractalfract 10 00358 g004
Figure 5. Box plot distribution of submandibular gland fractal dimension values in the study and control groups. Open circles (○) represent outliers. Numbers adjacent to the symbols denote the corresponding case IDs.
Fractalfract 10 00358 g005
Figure 6. Box plot distribution of parotid gland in longitudinal plane fractal dimension values in the study and control groups. Open circles (○) represent outliers, and asterisks (*) indicate extreme outliers (values more than 3 times the interquartile range). Numbers adjacent to the symbols denote the corresponding case IDs.
Fractalfract 10 00358 g006
Figure 7. Box plot distribution of parotid gland in transverse plane fractal dimension values in the study and control groups. Open circles (○) represent outliers. Numbers adjacent to the symbols denote the corresponding case IDs.
Fractalfract 10 00358 g007
Table 1. Comparison of age and duration of illness between the study and control groups.
Groupstp-Value
StudyControlTotal
(Min_Max) MedianMean ± SD(Min_Max) MedianMean ± SD(Min_Max) MedianMean ± SD
Age #(21_47) 3635.83 ± 6.49(23_44) 3634.87 ± 6.37(21_47) 3635.34 ± 6.390.5740.568
Disease Duration #(2_15) 77.69 ± 3.58
#: mean ± standard deviation (minimum-maximum), SD: Standard deviation, p: Statistical significance.
Table 2. Evaluation of salivary gland fractal dimensions in the study and control groups.
GroupstMean Diff. 95% CICohen’s dp-Value
StudyControlTotal
(Min_Max)
Median
Mean ± SD(Min_Max)
Median
Mean ± SD(Min_Max)
Median
Mean ± SD
Right SMG FD(1.45_1.81)
1.69
1.68 ± 0.08(1.64_1.88)
1.78
1.78 ± 0.07(1.45_1.88)
1.74
1.73 ± 0.09−5.007−0.100
(0.062, 0.138)
−1.330<0.001 ***
Left SMG FD(1.43_1.82)
1.72
1.68 ± 0.13(1.71_1.85)
1.78
1.79 ± 0.05(1.43_1.85)
1.76
1.73 ± 0.11−4.097−0.110
(0.051, 0.169)
−1.122<0.001 ***
Mean SMG FD(1.47_1.84)
1.68
1.68 ± 0.08(1.68_1.92)
1.77
1.78 ± 0.05(1.47_1.92)
1.75
1.73 ± 0.08−6.071−0.100
(0.065, 0.135)
−1.493<0.001 ***
Right PGL FD(1.57_1.86)
1.73
1.72 ± 0.09(1.73_1.89)
1.79
1.79 ± 0.04(1.57_1.89)
1.76
1.76 ± 0.07−4.045−0.070
(0.034, 0.106)
−1.005<0.001 ***
Left PGL FD(1.51_1.82)
1.71
1.70 ± 0.07(1.72_1.83)
1.79
1.80 ± 0.03(1.51_1.83)
1.77
1.75 ± 0.07−6.657−0.100
(0.073, 0.127)
−1.849<0.001 ***
Mean PGL FD(1.6_1.84)
1.72
1.71 ± 0.06(1.75_1.86)
1.79
1.79 ± 0.03(1.6_1.86)
1.76
1.75 ± 0.06−7.421−0.080
(0.055, 0.105)
−1.684<0.001 ***
Right PGT FD(1.5_1.8)
1.72
1.70 ± 0.06(1.72_1.84)
1.8
1.79 ± 0.03(1.5_1.84)
1.75
1.75 ± 0.07−6.329−0.090
(0.064, 0.116)
−1.765<0.001 ***
Left PGT FD(1.54_1.85)
1.76
1.73 ± 0.08(1.69_1.86)
1.79
1.79 ± 0.04(1.54_1.86)
1.77
1.76 ± 0.07−3.353−0.060
(0.092, 0.028)
−0.949<0.002 **
Mean PGT FD(1.56_1.81)
1.73
1.72 ± 0.06(1.71_1.84)
1.79
1.79 ± 0.03(1.56_1.84)
1.76
1.75 ± 0.06−6.136−0.070
(0.045, 0.095)
−1.492<0.001 ***
Mean ± standard deviation (minimum–maximum); Statistical significance; ** p = 0.01; *** p = 0.001 (Statistically significant after Bonferroni correction, threshold p < 0.0055), SD: Standard Deviation, Mean Diff.: Mean Difference, CI: Confidence Interval.
Disclaimer/Publisher’s Note: The statements, opinions and data contained in all publications are solely those of the individual author(s) and contributor(s) and not of MDPI and/or the editor(s). MDPI and/or the editor(s) disclaim responsibility for any injury to people or property resulting from any ideas, methods, instructions or products referred to in the content.