Article

Surface Fractal Characterization of Granite Cut by Diamond Wire Saw

1
Key Laboratory of High Efficiency and Clean Mechanical Manufacture, Ministry of Education, School of Mechanical Engineering, Shandong University, Jinan 250061, China
2
State Key Laboratory of Advanced Equipment and Technology for Metal Forming, Shandong University, Jinan 250061, China
*
Author to whom correspondence should be addressed.
Fractal Fract. 2026, 10(5), 276; https://doi.org/10.3390/fractalfract10050276
Submission received: 1 March 2026 / Revised: 17 April 2026 / Accepted: 20 April 2026 / Published: 22 April 2026

Abstract

The surface quality of granite cut by diamond wire saw significantly impacts the cost of subsequent processes such as grinding and polishing. Traditional evaluation parameters like surface roughness (Ra) or peak-to-valley value (PV) face challenges in characterizing the surface morphology. This study introduces fractal dimension (FD) as a potential auxiliary parameter for evaluating the surface quality of sawn granite. Cutting experiments were conducted on Shanxi Black granite using varying wire speeds, feed speeds, and workpiece sizes. The box-counting method was employed to extract the three-dimensional fractal dimension (3D FD) of the granite surface, which characterizes the overall surface complexity, as well as the distribution of two-dimensional fractal dimensions (2D FD) for granite surface cross-sectional profiles at different angles. The results indicate that the granite-sawn surface exhibits complex micro-morphology featuring brittle micro-pits and wavelike saw marks along the feed direction. A strong negative correlation exists between the 3D FD and both surface roughness Ra and PV value, suggesting that 3D FD can serve as an indicator of granite surface quality, with higher FD values corresponding to better surface quality. Moreover, compared to the PV value constrained by material heterogeneity, 3D FD more effectively represents the true surface quality of the granite. Additionally, the distribution characteristics of 2D FD at different angles effectively reveal surface anisotropy and damage. The results suggest that a more symmetrical 2D FD distribution is associated with consistent surface integrity in the evaluated samples. This suggests that FD has the potential to serve as a meaningful auxiliary parameter for characterizing granite surface quality. The findings hold significant importance for the accurate evaluation of diamond wire-saw-cut granite surfaces and provide a basis for the formulation of subsequent grinding process.

1. Introduction

Granite is primarily composed of minerals including feldspar, quartz, and mica. Its distinctive veining patterns, color variations, compact structure, high hardness, corrosion resistance, and weather durability endow it with significant value in construction engineering applications [1]. One application of granite is in architectural curtain walls and interior decorative panels. The primary mechanical processing steps for these panels include sawing, grinding, and polishing [2,3]. High-quality sawn surfaces can reduce or eliminate subsequent grinding processes, thereby lowering overall processing costs. Conventional granite cutting techniques include diamond circular saw blade cutting [4], frame saw cutting [5], diamond bead saw cutting [6], and abrasive waterjet cutting [7]. Li et al. [8] established a theoretical model of the sawing force generated during ultrasonic vibration-assisted diamond wire sawing of monocrystalline silicon, taking into account the brittle–ductile material removal mode, and validated the model through experiments. The results show that the sawing force increases with feed speed and decreases with wire speed and ultrasonic amplitude. The variation in sawing force affects the sawn surface quality. Wang et al. [9] systematically investigated the effects of process parameters and cutting orientation on surface quality during silicon wire sawing. Their findings demonstrate that cutting orientation, process parameters, and silicon ingot dimensions collectively determine surface morphology, roughness Ra, and waviness. Li et al. [10] studied silicon nitride diamond wire saw cutting. They analyzed material removal mechanisms and changes in PV value and Ra roughness on saw marks. The results prove that PV value and Ra have a positive correlation with feed speed but a negative correlation with wire speed. Cheng et al. [11] investigated the prediction method of excess kerf loss during diamond wire saw slicing of monocrystalline silicon by measuring and processing vibration source signals. They pointed out that wire lateral vibration causes periodic waviness. Currently, researchers use surface roughness Ra and PV value to judge surface quality.
During diamond wire sawing, defects form on the surface. These defects raise both difficulty and time in later processing. Granite surfaces show brittle pits after diamond sawing. Different components interact inside the rock, creating a complex morphology [12]. However, numerous investigations have demonstrated that the surface morphology characterization methods employed in diamond wire saw cutting experiments suffer from limitations in quantitative analysis and are constrained by instrumental resolution and magnification factors [13,14,15]. Surface roughness parameters are influenced by factors such as sampling size, evaluation length, and instrumental resolution [14,16]. A primary drawback of these parameters is their neglect of the overall microstructure and their inability to adequately capture micro-morphological features across various scales. Furthermore, the PV value solely calculates the difference between a single peak and a single valley. It thus provides information only on the highest and lowest points of the surface, failing to reflect the overall distribution of the surface profile, the mean height deviation, or the concentration of the height distribution; its value is significantly susceptible to outliers [17]. Therefore, a more comprehensive method is required to characterize the surface quality of granite cut by diamond wire sawing.
Fractal theory has been widely applied in the characterization of machined surfaces. The fractal dimension is scale-independent and incorporates all roughness information across the full spectrum of scales on a fractal surface, enabling superior characterization of machined surfaces. Numerous researchers have employed fractal theory to study the fractal dimensions of machined surfaces. Li et al. [18] proposed a method for calculating the fractal dimension of milled surfaces. Their results demonstrated that the wavelet-based calculation method provided more accurate and effective determination of the fractal dimension for milled surfaces compared to other fractal dimension calculation approaches. Jin et al. [19] conducted machining experiments on porous bronze and used fractal theory to compute the fractal dimension and porosity before and after cutting. Their findings indicated that the fractal dimension can serve as an effective parameter for characterizing porous surface morphology. Furthermore, machining experiments combined with surface morphology analysis were demonstrated to be a viable approach for obtaining the optimal characterization tool to achieve relatively ideal surface morphology. Wang [20] employed fractal analysis to investigate ground monocrystal sapphire surfaces. Their study examined the relationship between the 3D surface fractal dimension and surface roughness, while also exploring the distribution of 2D cross-sectional profile fractal dimensions relative to the material removal mode. The results demonstrated a negative correlation between the 3D fractal dimension and the surface roughness parameter Ra. Furthermore, the material removal mode was determined to be inferable from the distribution of 2D cross-sectional profile fractal dimensions. Liu [21] conducted a similar investigation on diamond-wire-sawn surfaces of monocrystal silicon using fractal analysis, yielding analogous conclusions. The fractal behavior of machined surfaces varies substantially depending on the material and processing technique. Fractal geometry has been proven to be a vital metrological tool for documenting the surface evolution and polish development of stone-based materials, providing a scale-independent characterization of surface irregularities. Stemp and Stemp [22] utilized laser profilometry and fractal geometry to quantitatively record the topographical evolution of experimental stone tools across various wear stages. Their findings confirmed that the fractal dimension (FD) can accurately capture subtle variations on heterogeneous stone surfaces, exhibiting sensitivity significantly higher than that of traditional roughness measurement methods. Currently, there is a lack of comprehensive research applying fractal theory to characterize diamond-wire-sawn granite surfaces. It remains uncertain whether the fractal dimension of processed granite surfaces can function as a valuable parameter for machined surface analysis.
This study conducted diamond wire saw cutting experiments on granite. Machined surfaces were characterized using a laser confocal microscope to obtain surface morphology images. The 3D FD can comprehensively characterize the entire surface of diamond-wire-sawn monocrystal silicon wafers. The 2D FD enables characterization of processing characteristics along different material orientations. Therefore, Fiji ImageJ 2.14.0 and MATLAB R2024a software were employed to calculate the 3D FD and the 2D FD of cross-sectional profiles of machined surfaces, respectively. Based on the results, the correlation between the surface roughness parameter Ra and PV value with the three-dimensional fractal dimension was investigated. Simultaneously, the relationship between machined surface quality and the distribution of two-dimensional fractal dimensions was examined. This study aims to utilize the fractal dimension as a metrological tool for characterizing the diamond-wire-sawn surfaces of granite—a typically heterogeneous material—distinguishing it from previous fractal analyses focused on the sawn surfaces of homogeneous materials. These findings hold significant implications for accurate evaluation of diamond-wire-sawn granite surface quality and provide a basis for the formulation of subsequent grinding processes to reduce grinding cost.

2. Experiment and Method

2.1. Experimental Materials, Experimental Equipment and Experimental Design

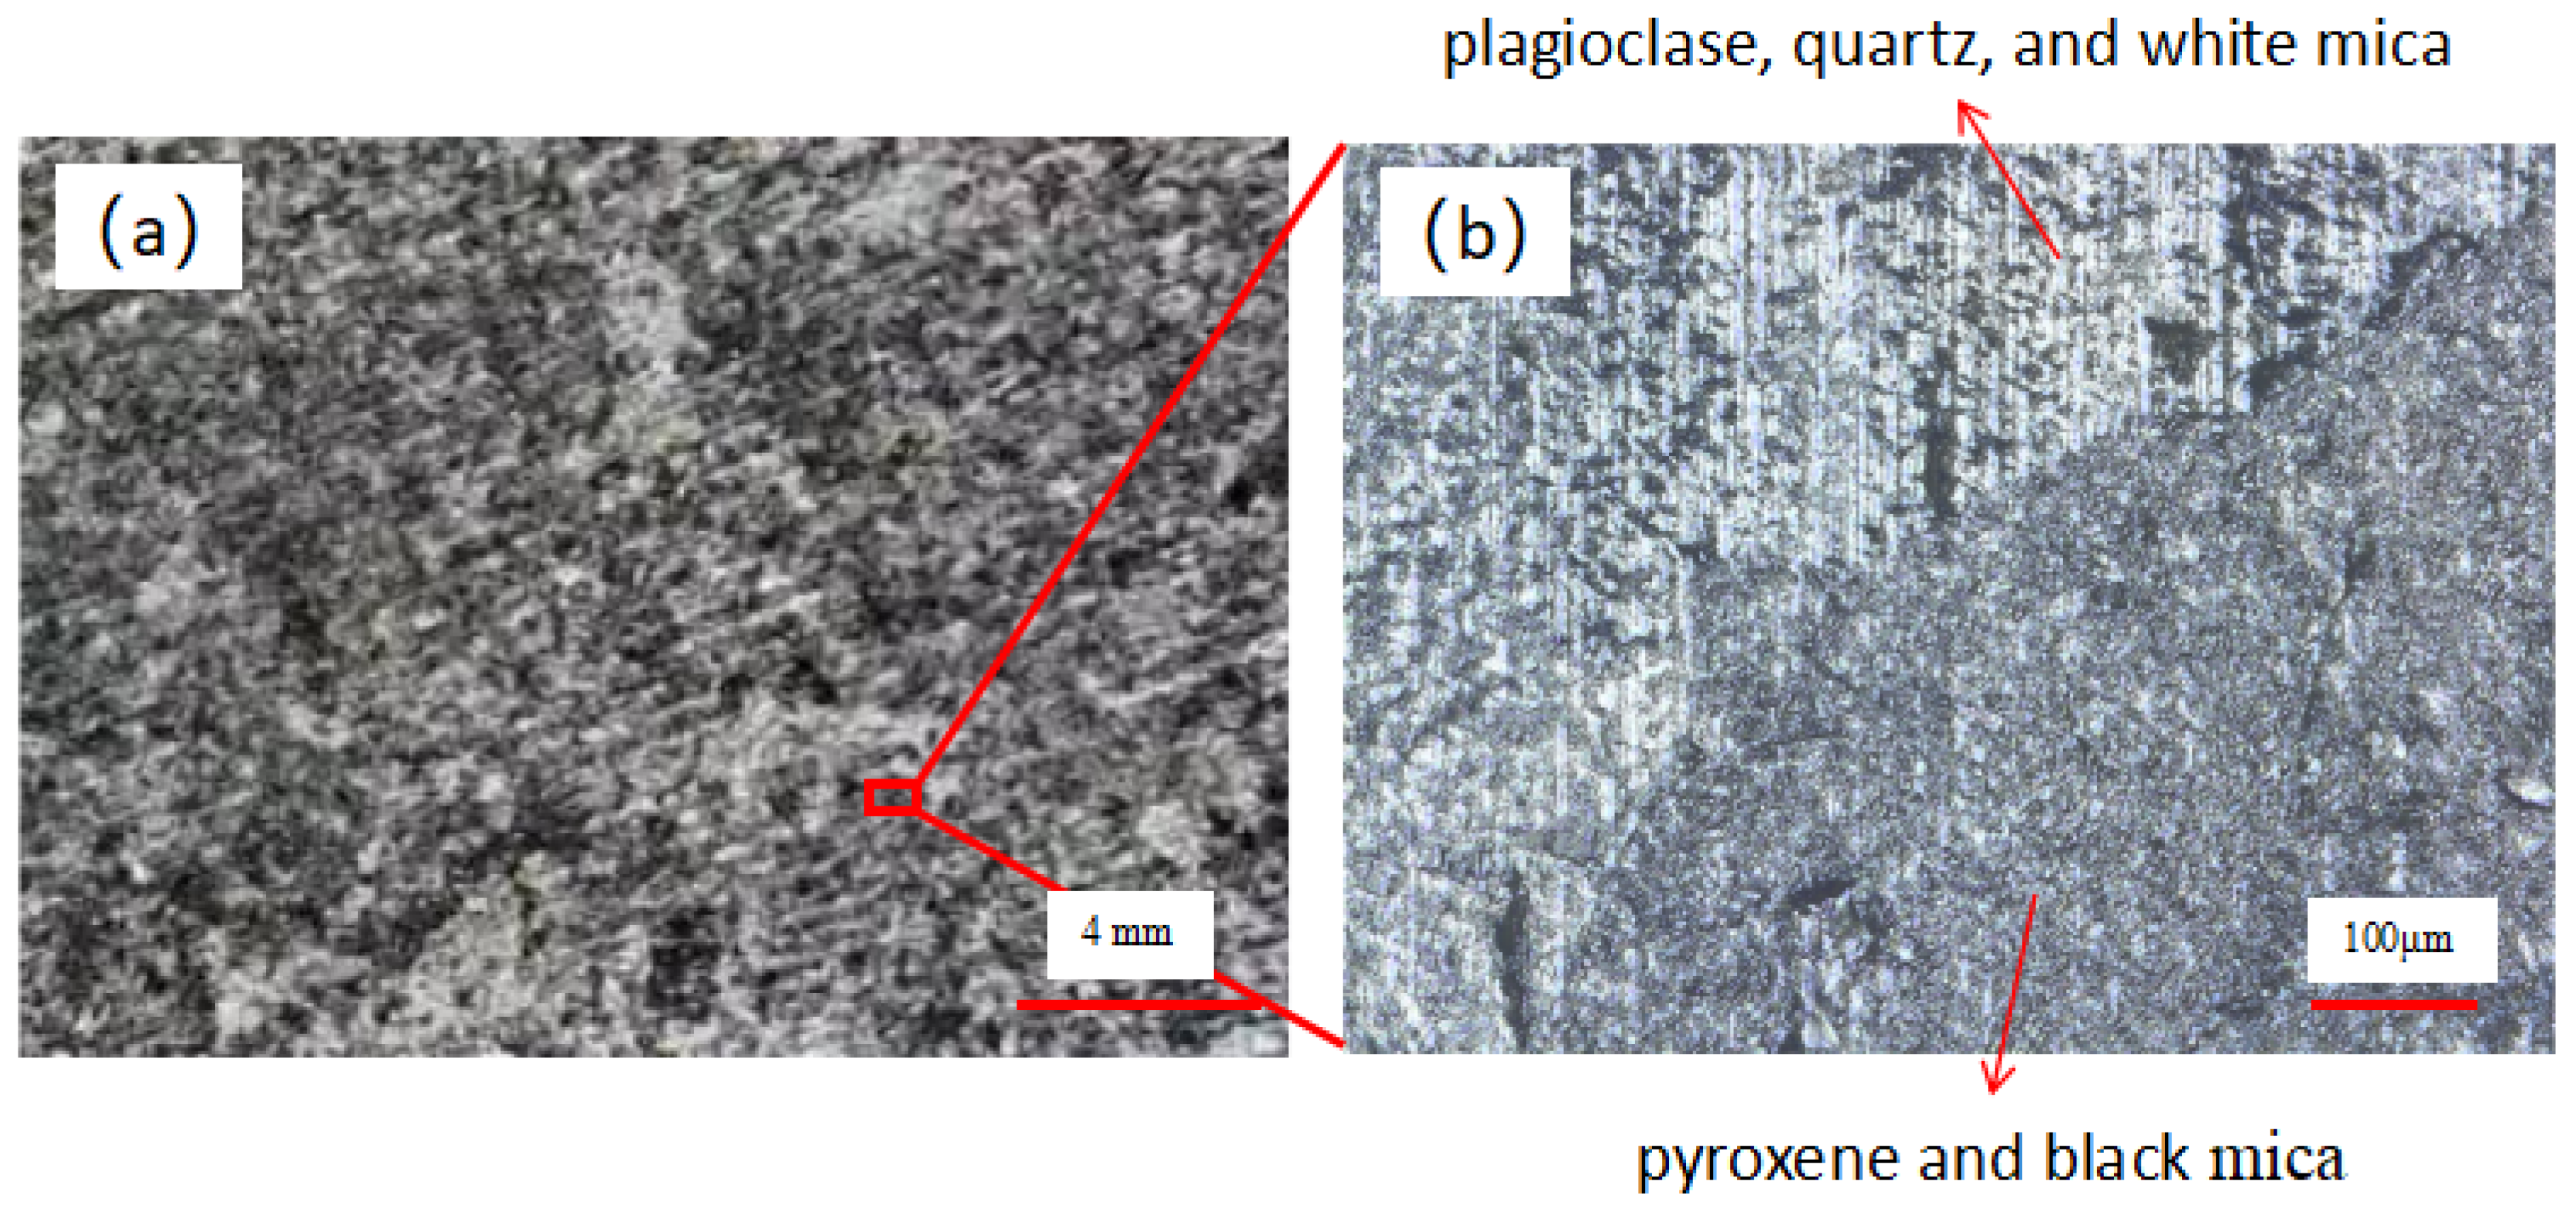
Shanxi Black granite has a wide range of applications and a high market share in China. Therefore, we chose Shanxi Black as the experimental material. Shanxi Black granite is primarily composed of feldspar (50–60%) and pyroxene (20–40%) [12]. Minor constituents include mica (5–15%) and quartz (trace amounts, 5–10%). The characteristic dark coloration results from the dominance of pyroxene and black mica, contrasting with the lighter hues typically shown by plagioclase feldspar, quartz, and white mica, the surface morphology of granite is shown in Figure 1.
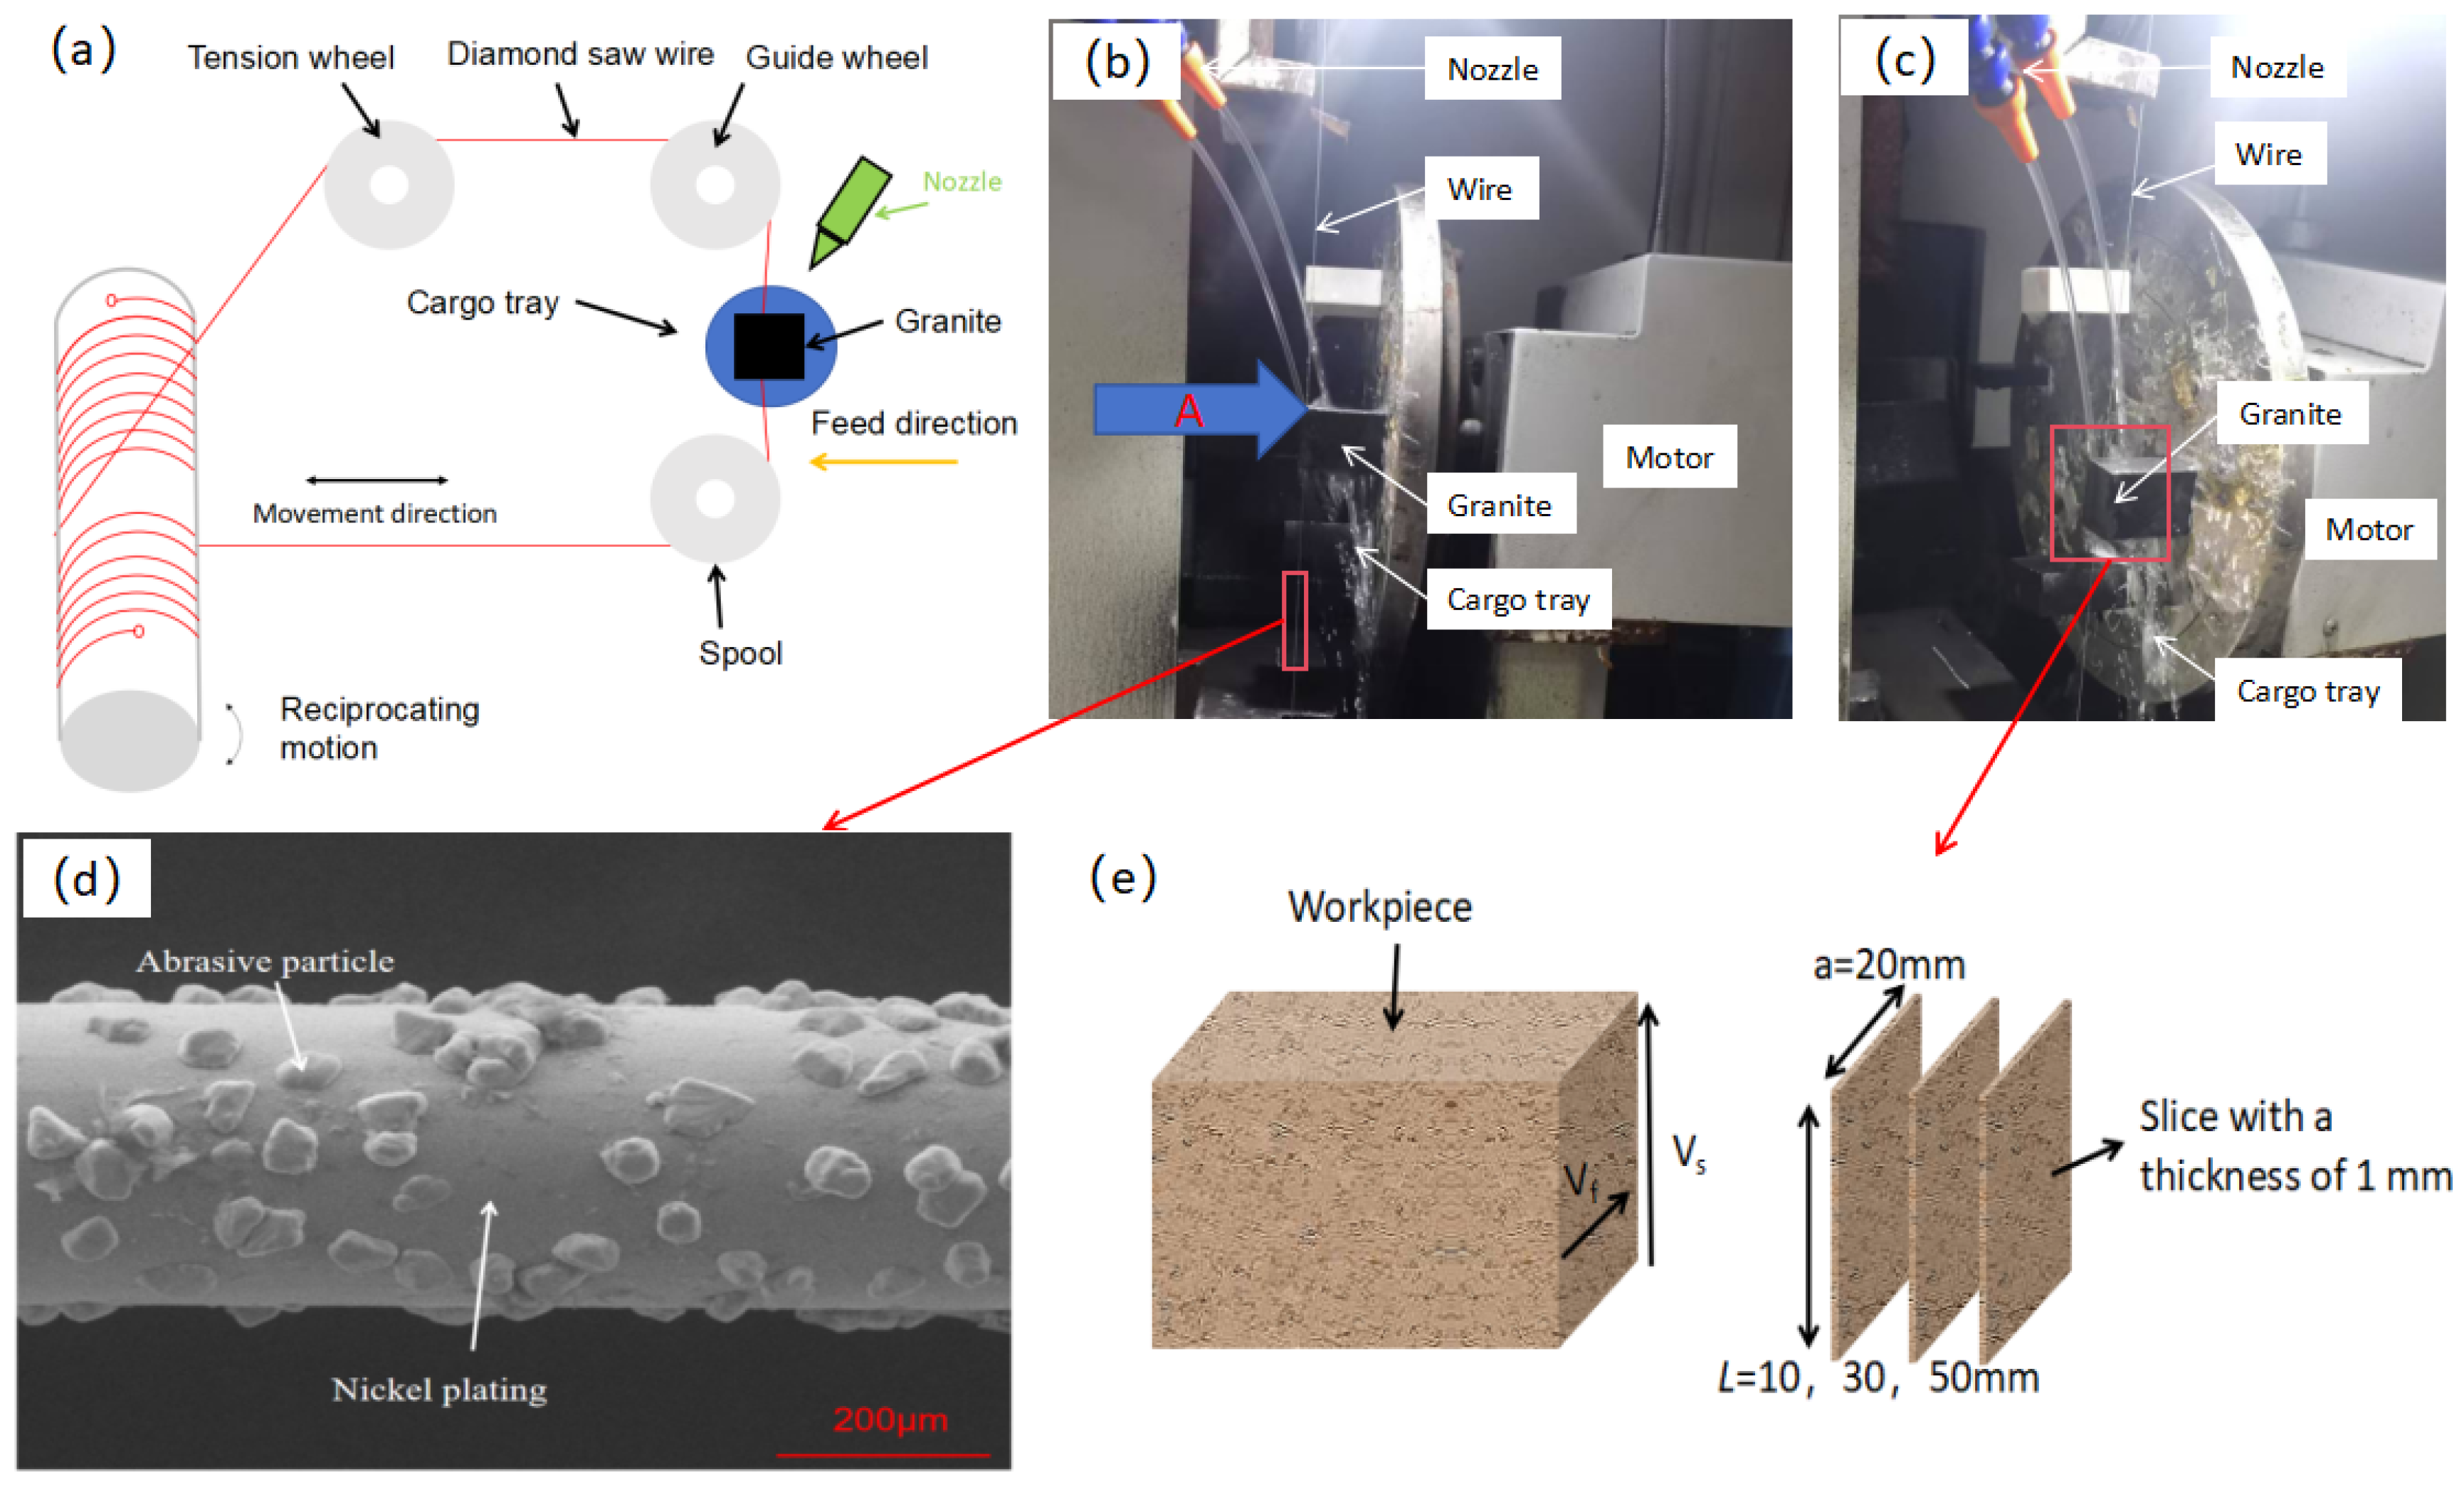
This experiment employed a reciprocating diamond wire saw device (SH300, Guangzhou Shenghai Electronic Technology Co., Ltd., Guangzhou, China) for cutting operations. The cutting apparatus primarily comprised a winding wheel, guide wheels, tension wheels, and a workpiece stage. The winding wheel drives the wire to execute reciprocating linear motion. The guide wheels position the wire to define the cutting zone. The tension wheel maintains wire tension to ensure effective cutting performance. Water was used as the cutting fluid for both cooling and chip evacuation in the cutting region. Figure 2 illustrates the actual cutting zone of the diamond wire saw, operational schematic, the wire morphology, and the workpiece cutting schematic. Detailed wire parameters are provided in Table 1. Three granite specimens with cutting surface dimensions L × a of 10 mm × 20 mm, 30 mm × 20 mm, and 50 mm × 20 mm were prepared, where the workpiece width L denotes both the cutting surface dimension and workpiece size as depicted in Figure 2e.
To validate the suitability of fractal dimension as a valuable parameter for characterizing machined surfaces, an orthogonal experimental design comprising nine test groups was established. Wire speed (Vs), feed speed (Vf), and workpiece size (L) were designated as experimental parameters. Different parameter combinations yield distinct surface morphologies. This study conducted fractal analyses on the sawn surfaces to investigate correlations between fractal dimension and surface characteristics under varying processing conditions. The experimental design is summarized in Table 2.
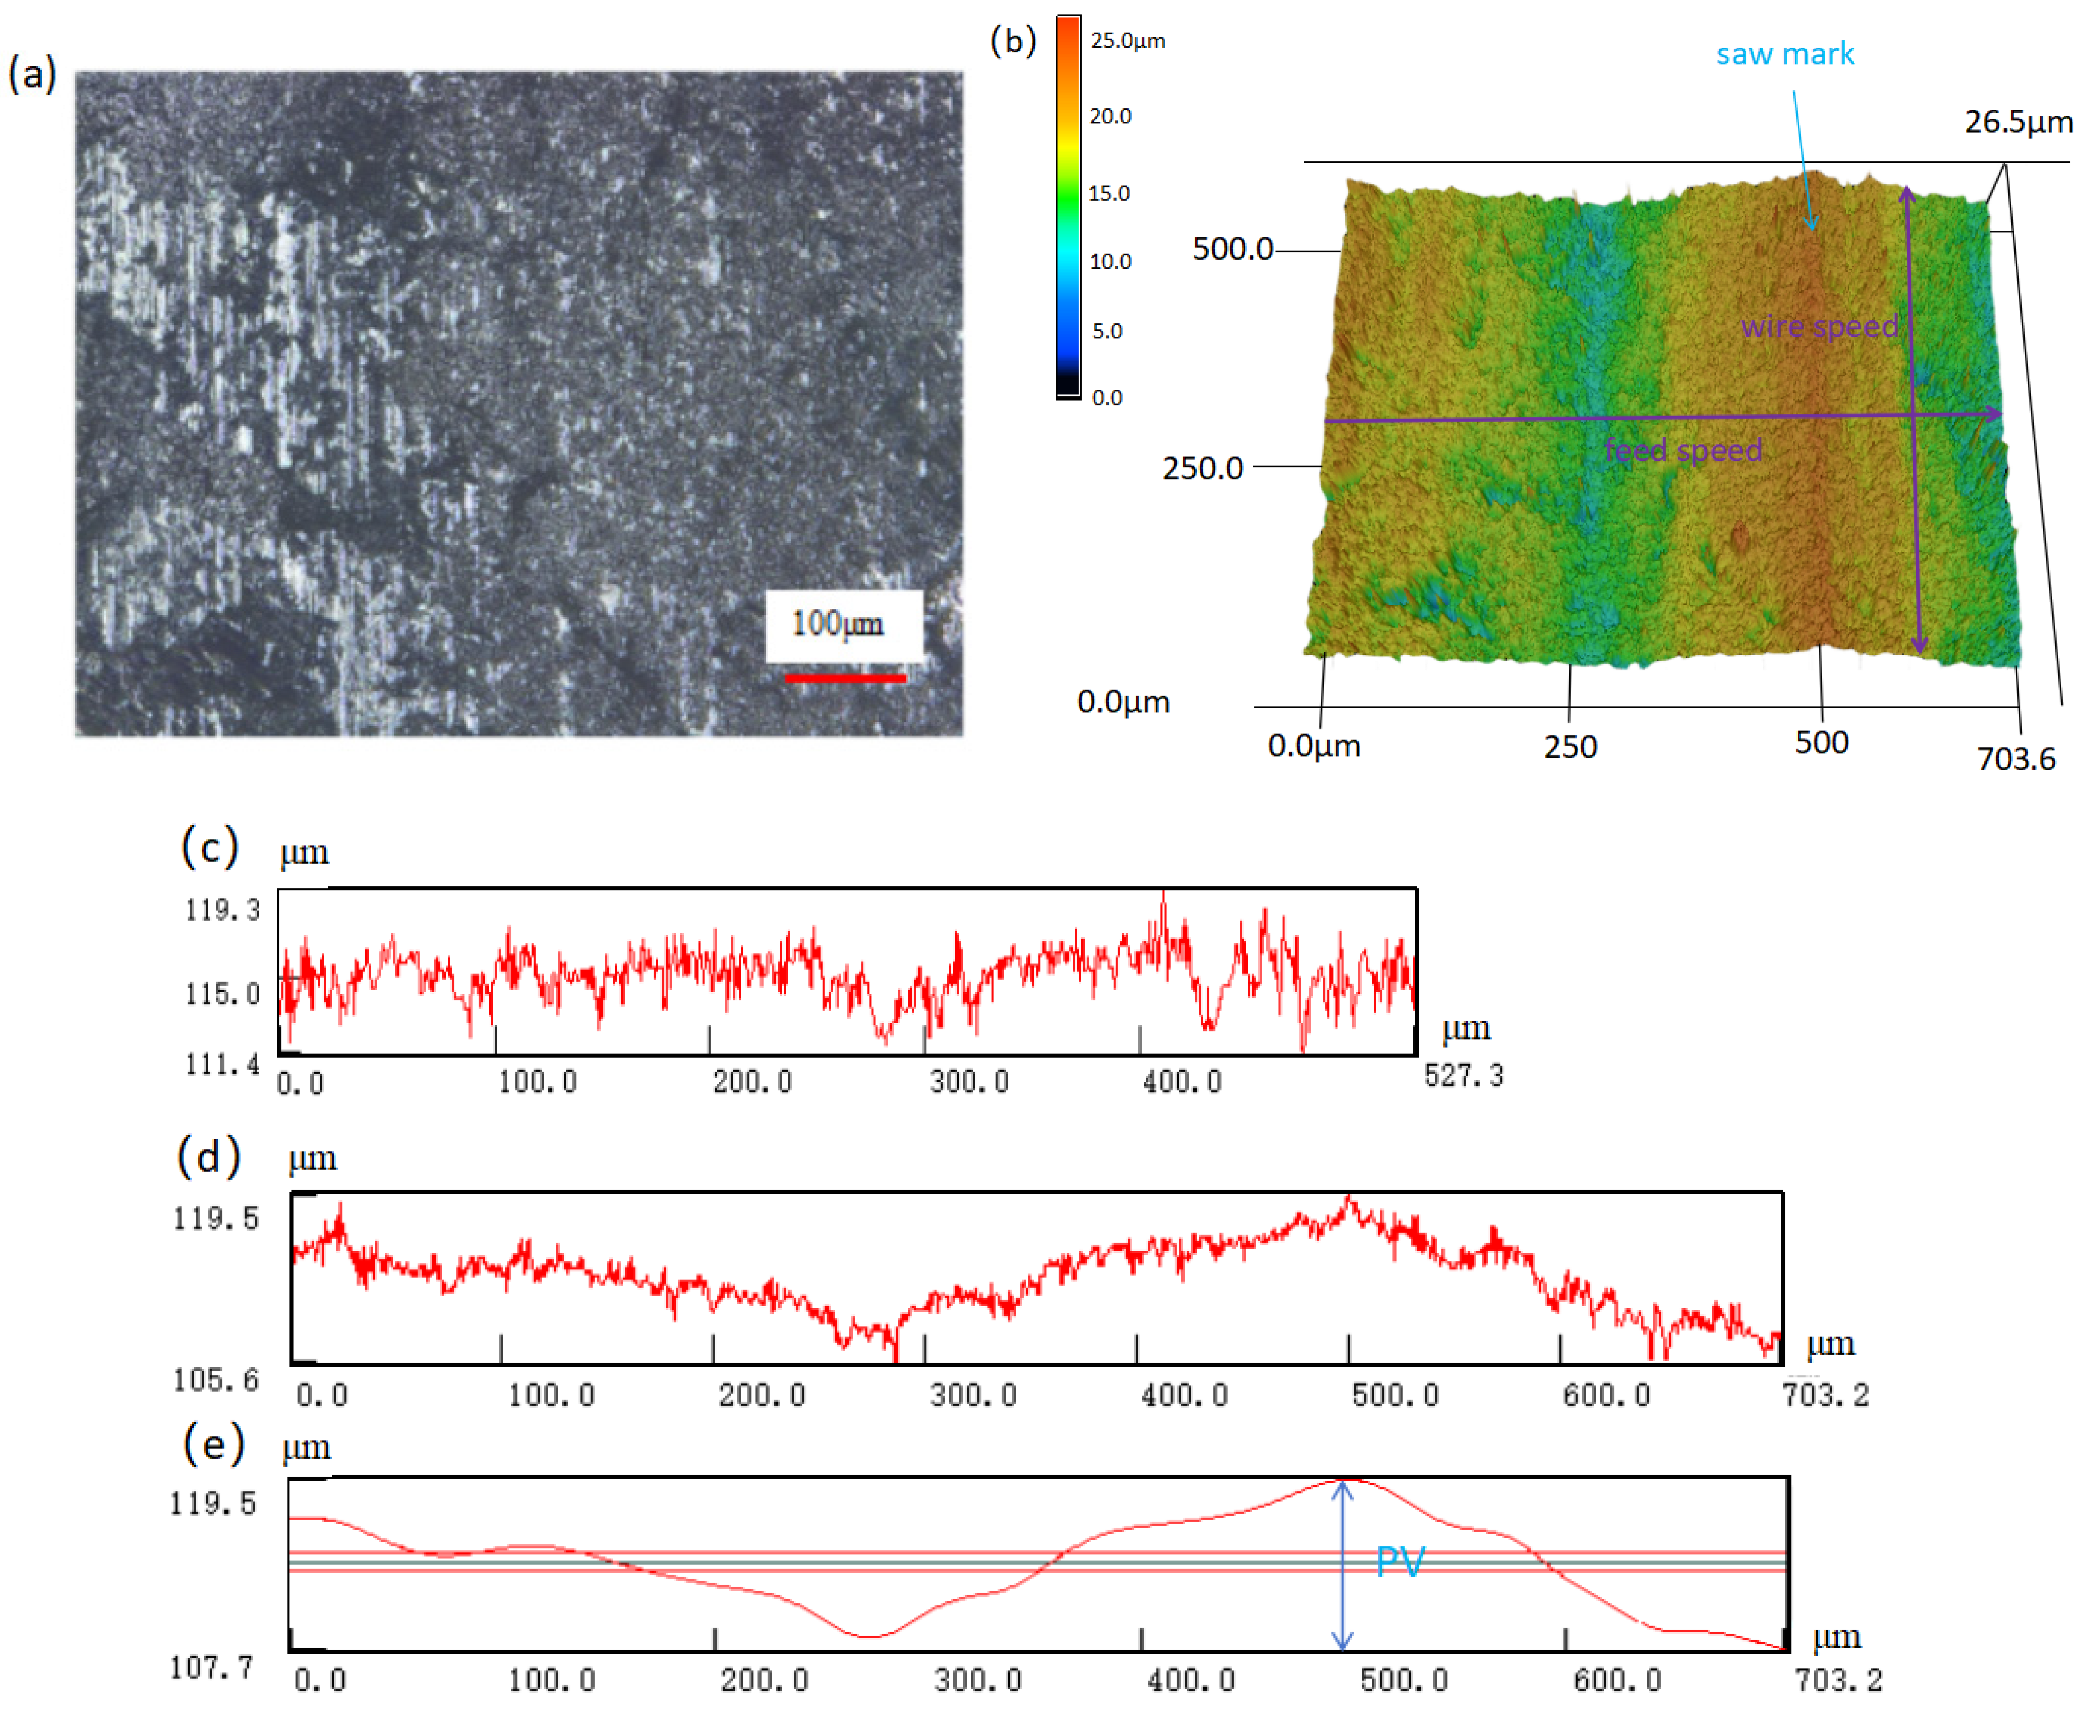
Figure 3 displays the machined granite surface obtained under parameter set 7 of diamond wire sawing. Figure 3a reveals the fragmented surface morphology of the granite slice with complex composition, exhibiting numerous pits of varying sizes and depths. Wire marks induced by lateral oscillations [23] of the saw wire along the workpiece feed direction are observed in Figure 3b,d,e, where the peak-to-valley distance defines the PV value. Conversely, Figure 3c confirms the absence of saw marks along the wire motion direction. As established in [21], the roughness along the feed speed direction substantially exceeds that along the wire speed direction and exerts a more significant influence on surface quality. Consequently, this work focuses on evaluating the surface roughness Ra along the feed direction. Conventional characterization parameters provide essential information regarding surface amplitude. However, they have certain inherent limitations in describing complex spatial topographies. To establish a more comprehensive and multi-dimensional surface quality evaluation framework for diamond-wire-sawn granite, this study introduces 3D fractal theory as a vital complement to the standard ISO [24] areal parameters. The areal parameters, including arithmetic mean height (Sa) and root-mean-square height (Sq), were extracted and interpreted based on the latest framework for areal surface texture characterization [25]. The integration of fractal dimensions with traditional roughness metrics enables a more robust characterization of both the vertical amplitude and the spatial structural intricacy of the sawn surfaces.

2.2. Two-Dimensional and Three-Dimensional Fractal Theory of Machined Surfaces

In mathematics, fractal geometry—a branch of measure theory—studies geometric shapes exhibiting detailed structures at arbitrarily small scales, typically possessing a fractal dimension [26] that exceeds their topological dimension in a practical sense. The fractal dimension serves as an intuitive metric for quantifying structural complexity: denser surfaces with higher information content exhibit greater fractal dimensions. Currently, fractal theory is extensively applied to surface quality characterization, functioning as an analytical tool for evaluating roughness, material removal mechanisms, and tool wear patterns [27,28,29,30].
To compute the fractal dimension of machined surfaces, established methodologies include the power spectrum method [31], structure function method [32], and box-counting method [33]. The box-counting method was selected for this study due to its superior computational efficiency and precision. Consequently, two-dimensional fractal dimension values were calculated using the open-source Fiji ImageJ software.
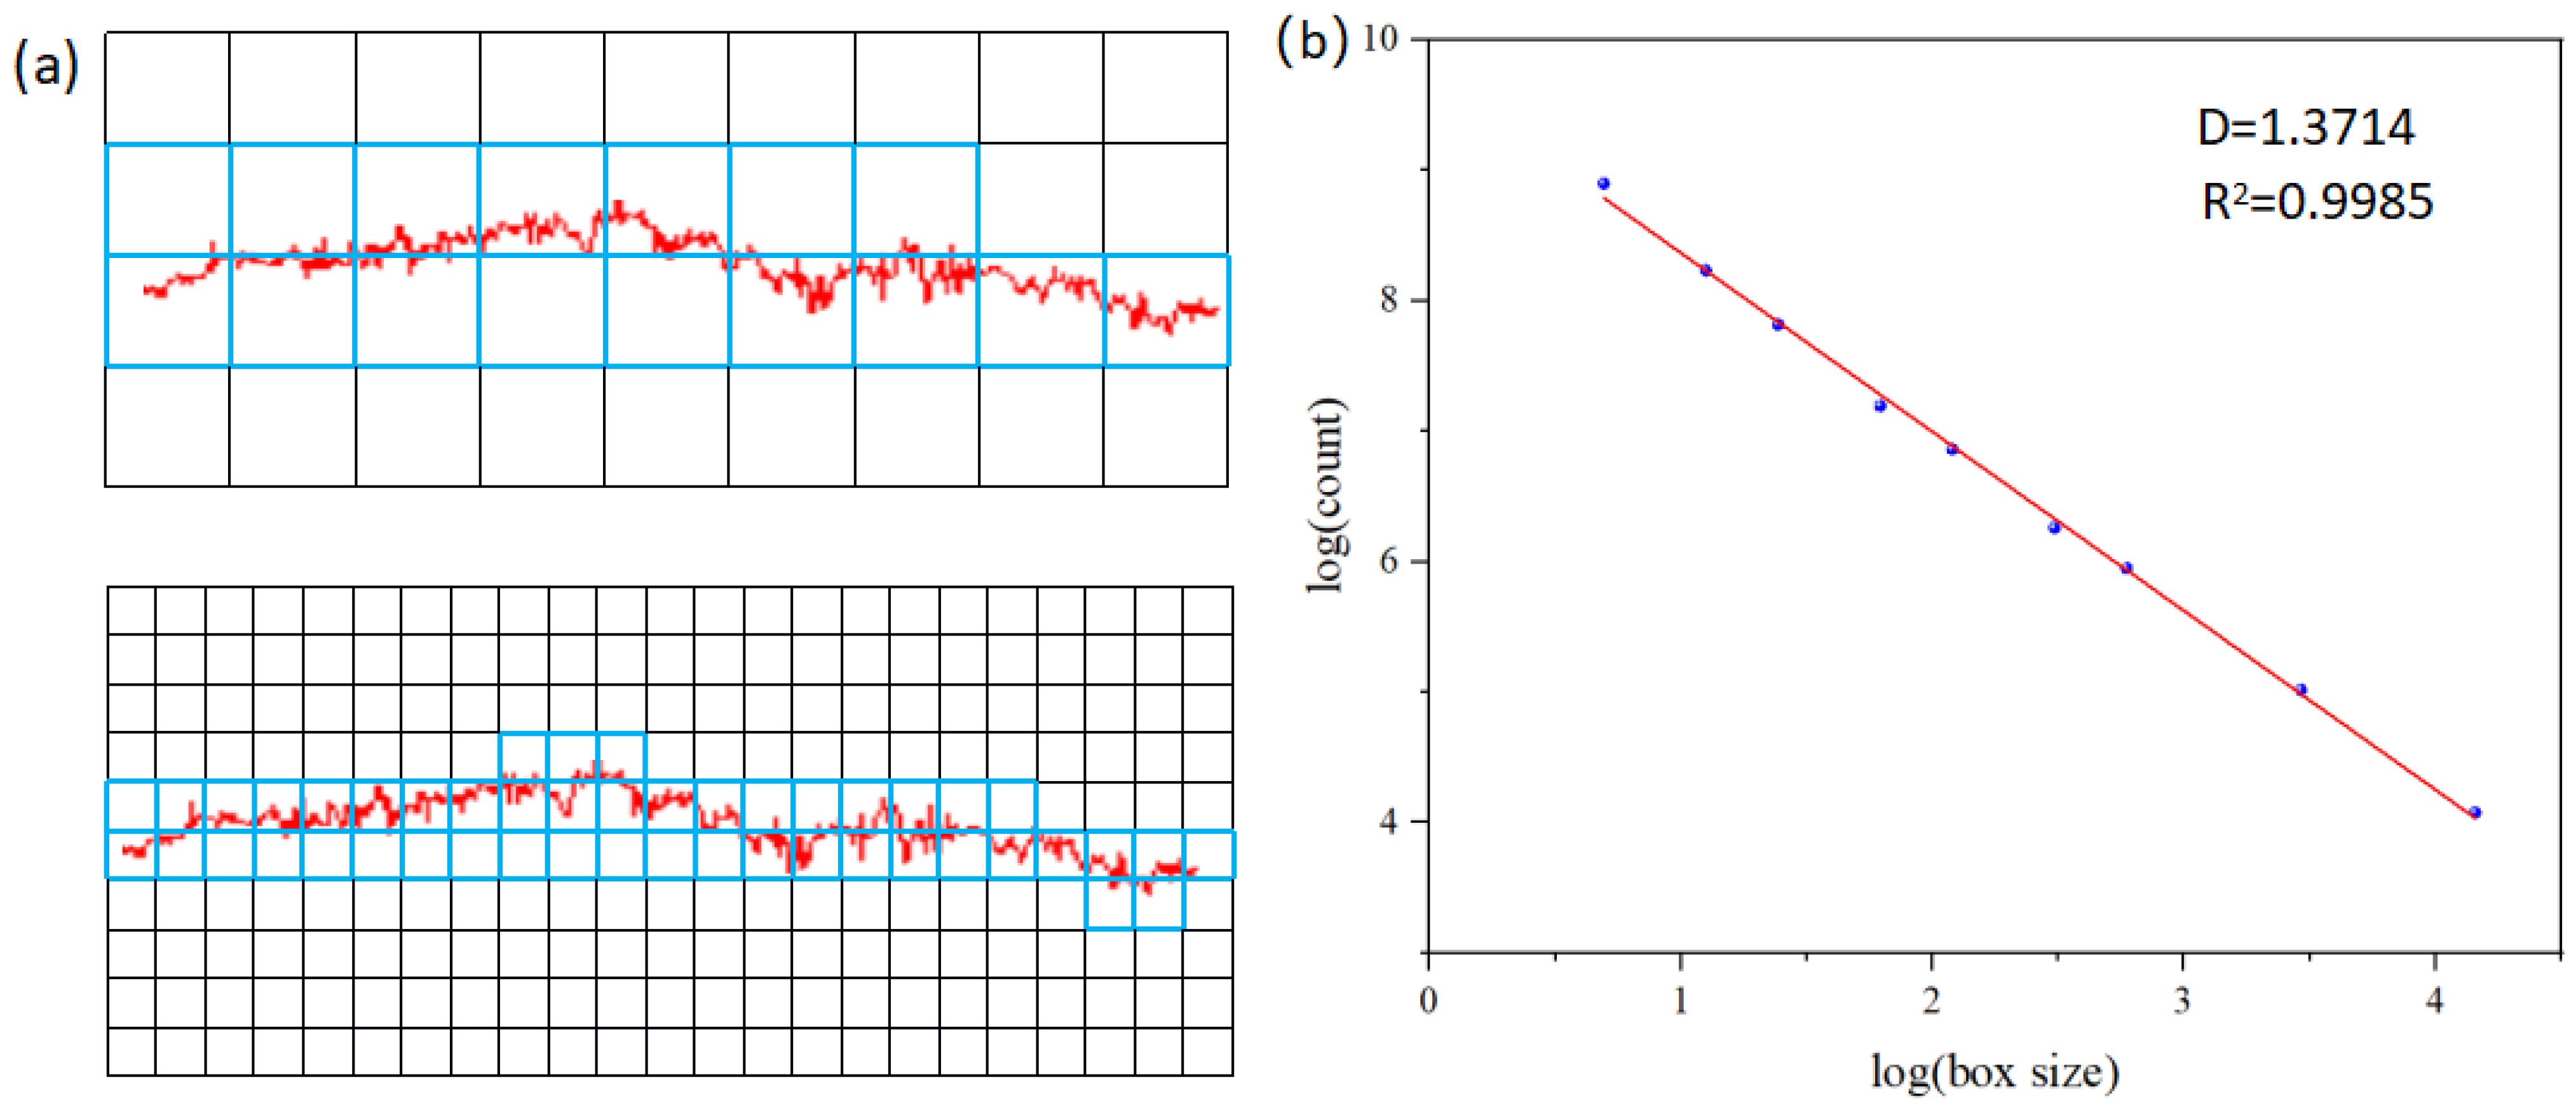
The box-counting method determines the two-dimensional fractal dimension by calculating the minimum number of square grids required to cover an object. As grid size decreases, a linear relationship emerges between the logarithm of box counts and the logarithm of the reciprocal of scaling factors. The absolute value of this fitted line’s slope defines the box-counting fractal dimension of the image. Implementation proceeds as follows: the operational sequence initiates with the selection of optimally sized square grids arranged to fully encompass the profile image, followed by calculating the total count of non-empty boxes N(r) required for complete coverage; subsequent iterations progressively reduce box size r while replicating this enumeration protocol, as visually demonstrated in Figure 4a where the red trace depicts the granite cross-sectional profile along the wire-sawing direction under process parameter set 5 and blue-bordered boxes illustrate the scale-adaptive coverage scheme—box quantities exhibit a monotonic increase with decreasing grid dimensions; upon importing the profile image into Fiji ImageJ software, a scatter plot is generated correlating the logarithm of box counts (y-axis) against the logarithm of software-defined box sizes (x-axis), with the absolute value of the fitted linear regression slope in Figure 4b yielding the two-dimensional fractal dimension as given by the mathematical relationship
D = lim r 0 log N ( r ) log r
where D is the fractal dimension. N(r) is the number of boxes, whose size is r, and is used to cover the entire fractal object.
This study employs the three-dimensional fractal dimension calculation method documented in Reference [19] to perform fractal analysis on sliced 3D surface topographies and determine their fractal dimensions. The methodology parallels the two-dimensional box-counting approach, where the fundamental objective remains computing the number N(r) of cubic cells required to completely cover the three-dimensional surface morphology across varying cell dimensions. The procedure involves partitioning the base plane of the 3D morphology into grid units according to the cubic cell size, then counting the number of vertically stacked cells at each grid position. For any measured grid location, where the minimum and maximum elevation values of the fractal surface respectively reside within the Q-th and P-th cubic cell along the height axis, the relationship is expressed as
nr(i,j) = Q − P + 1
where nr(i,j) is the number of cubic cells in the vertical direction at grid position (i,j).
At this point, by summing the number of vertically aligned cubic cells across all grid positions, one obtains the total number of cubic cells N(r) required to cover the entire three-dimensional surface morphology. By adjusting the size of the cubic cells, different counts of cubic cells can be acquired. According to Formula (1), the fractal dimension of the three-dimensional surface morphology can be determined:
N ( r ) = i . j n r ( i , j )
By adjusting the size of the cubic cells, different counts of cubic cells can be acquired. With the relationship between cube dimensions and counts available, the fractal dimension of the three-dimensional surface morphology can be calculated according to Formula (1).
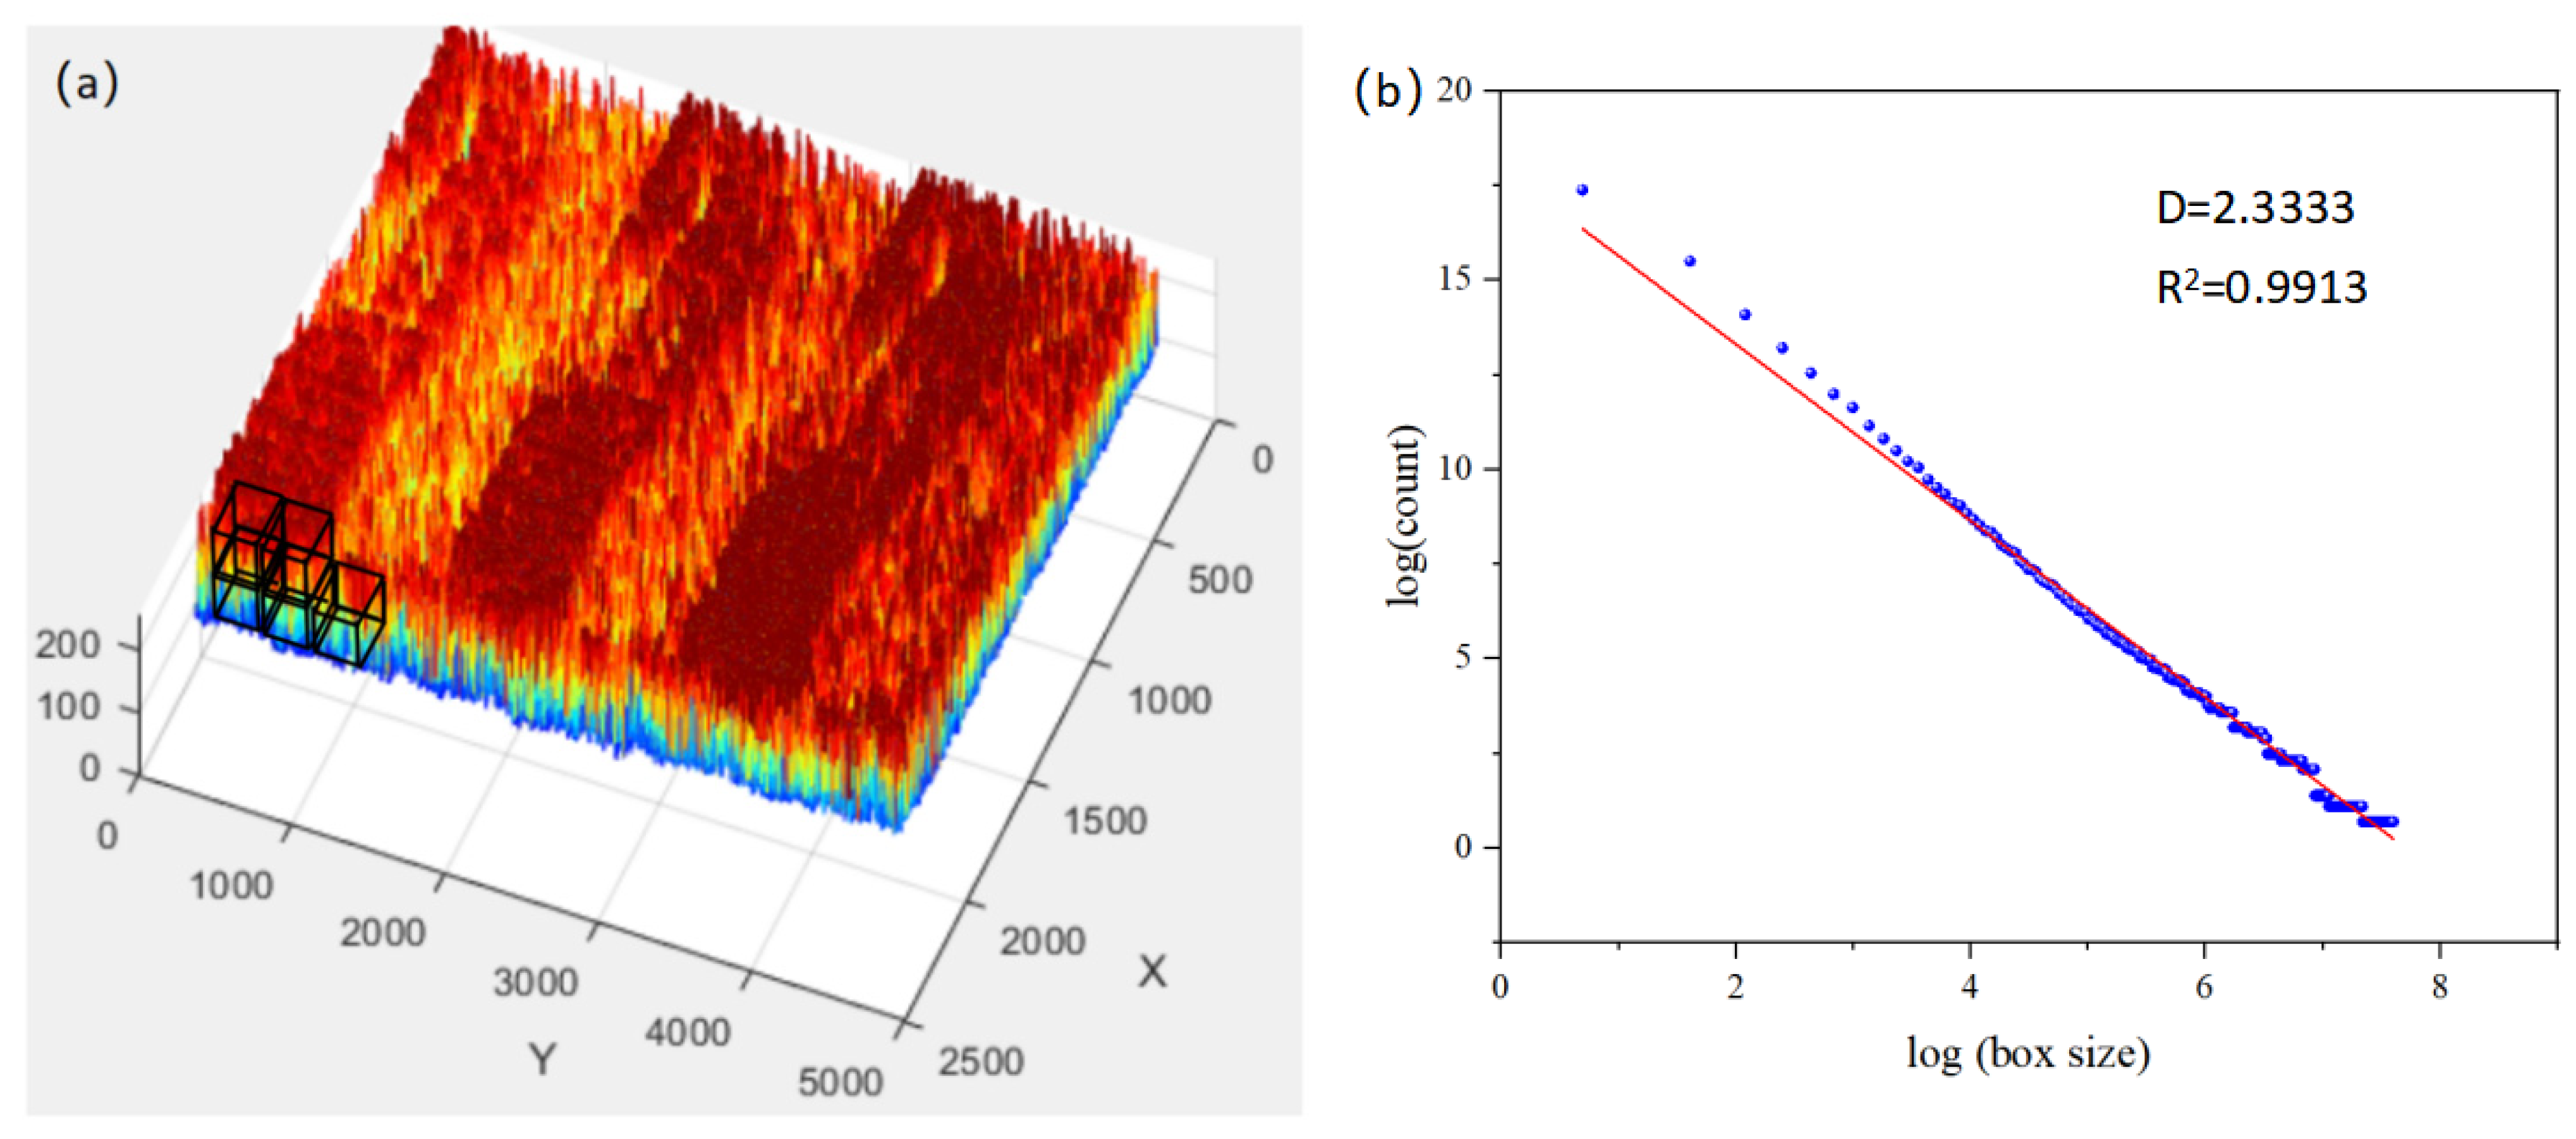
As illustrated in Figure 5a, MATLAB R2024a was used to generate a point cloud diagram of the granite’s 3D morphology and a schematic of the three-dimensional fractal dimension calculation method. The point cloud data originates from a granite surface sawn under the 9th parameter combination, measured using a laser confocal microscope. In the point cloud diagram, the black cubes represent the ‘boxes’ in the measurement of the three-dimensional fractal dimension. When the cube size changes, the total number of cubes required to cover the entire point cloud diagram inevitably changes. By importing the point cloud data into MATLAB R2024a and applying the aforementioned method, a scatter plot depicting the relationship between the logarithm of the box count and the logarithm of the box size is obtained. The slope of the fitted straight line represents the 3D FD of the granite surface morphology, as shown in Figure 5b.

2.3. Measurement and Evaluation of Experimental Results

This paper employs surface morphology, surface roughness Ra, PV value along the feed direction, Sa, Sq and fractal dimensions as representations of surface quality. After completing the cutting experiments, a laser confocal microscope (Keyence VK-X200, Keyence (China) Co., Ltd., Shanghai, China) was used to capture the 3D surface morphologies under different processing parameters. To ensure the reproducibility of the measurements and facilitate comparison with established standards, the sampling interval was set to 0.1 μm, and a Gaussian filtering cutoff of 0.8 mm was applied during the surface roughness data processing.
To guarantee true experimental reproducibility rather than mere measurement repeatability, three independent cutting experiments were performed for each of the nine sets of orthogonal processing parameters. Furthermore, to account for the natural heterogeneity of the material, measurements were conducted at three random locations on each of these independently sawn granite replicates. The Ra, PV, Sa, Sq and fractal dimensions were extracted for each independent sample, and their average values were calculated. Based on these experimental replicates, the correlations between the fractal dimensions and conventional surface parameters were systematically analyzed, and the specific material removal mechanisms of the heterogeneous granite were explored.
It should be noted that for typical machined surfaces, the absolute value of the 3D FD derived from the box-counting method can be influenced by the vertical scaling factor (Z-exaggeration). To ensure the comparability and reproducibility of the results, a strictly identical and standardized vertical amplification protocol was applied to all experimental datasets. By maintaining a constant scaling ratio, the calculated FD serves as an effective auxiliary descriptor, effectively capturing the intrinsic transitions in surface integrity without artifacts from non-uniform processing.

3. Results

3.1. Surface Morphology

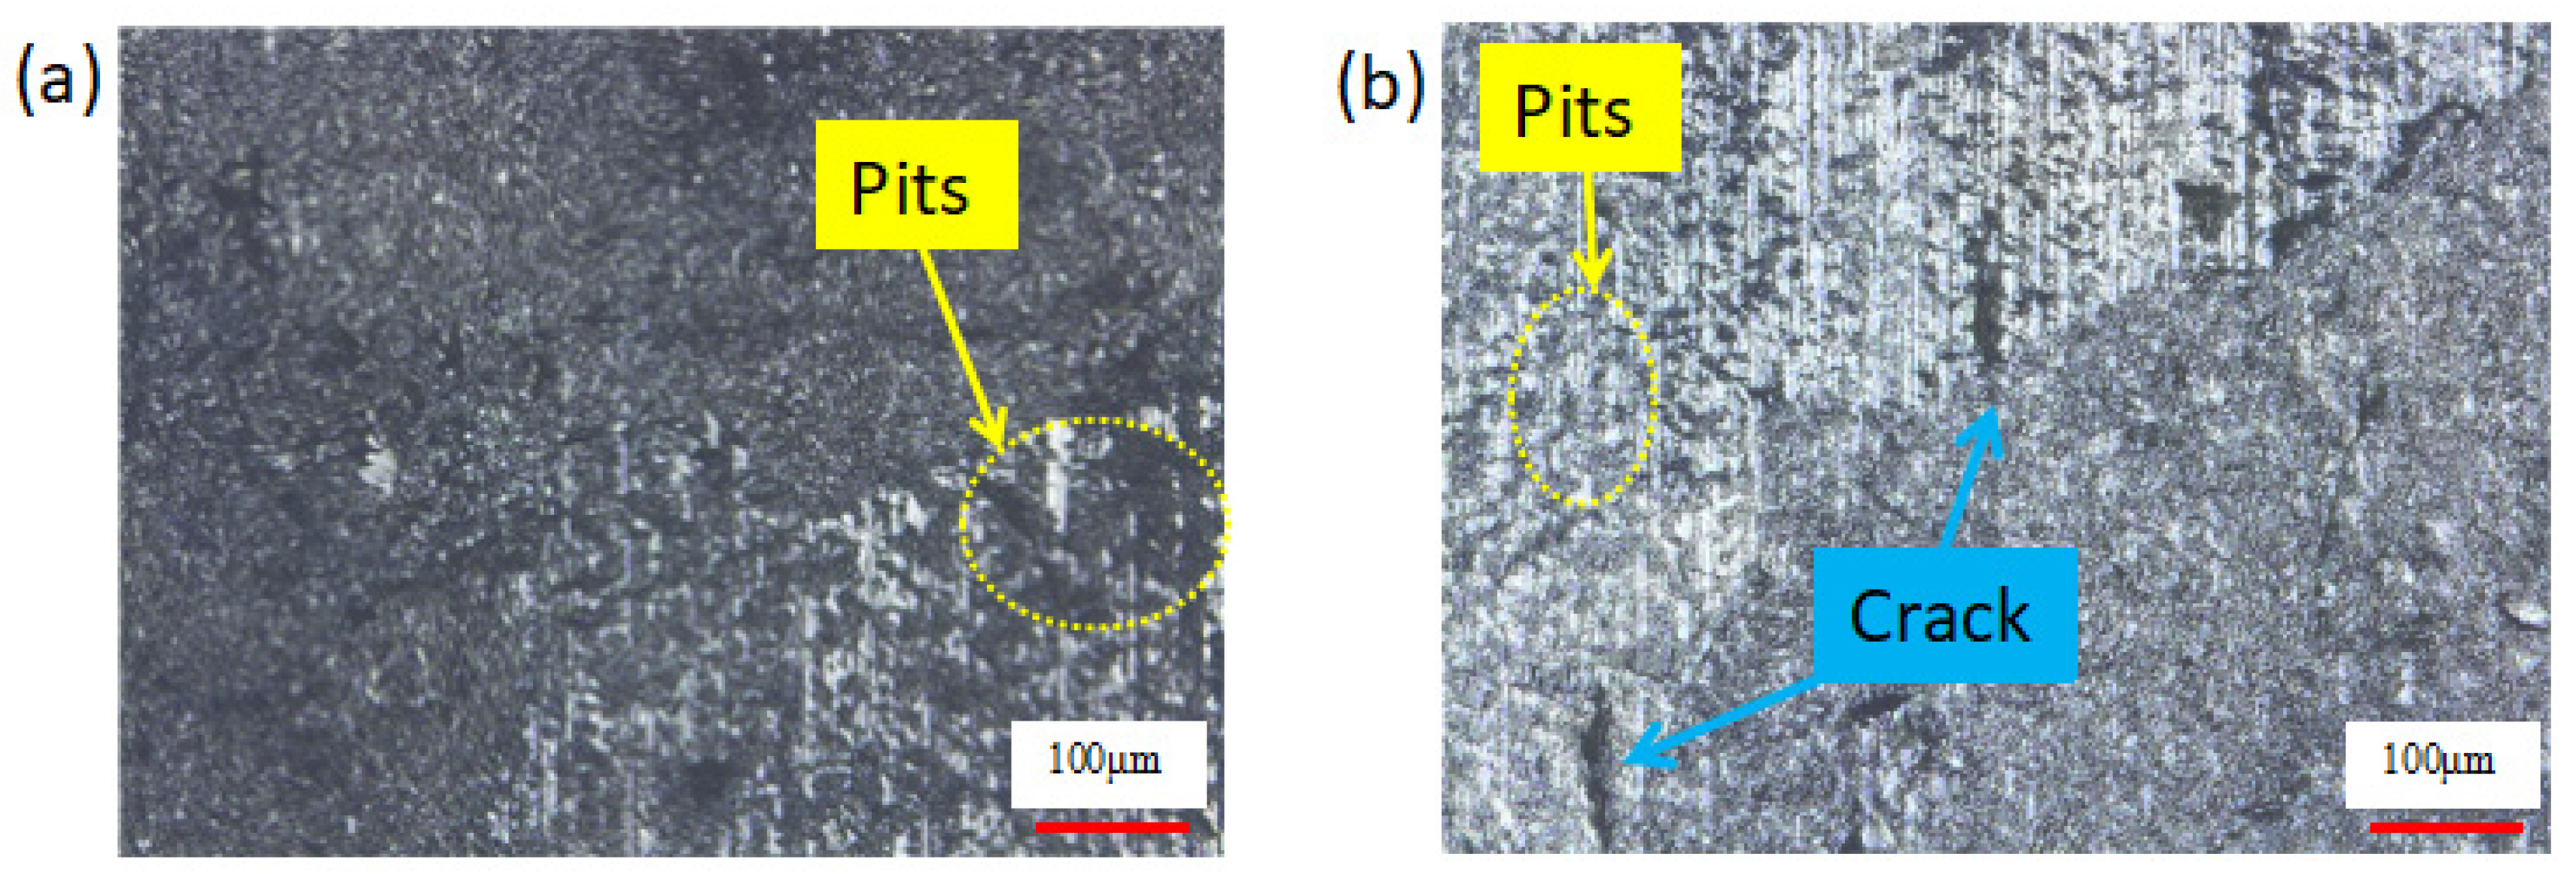
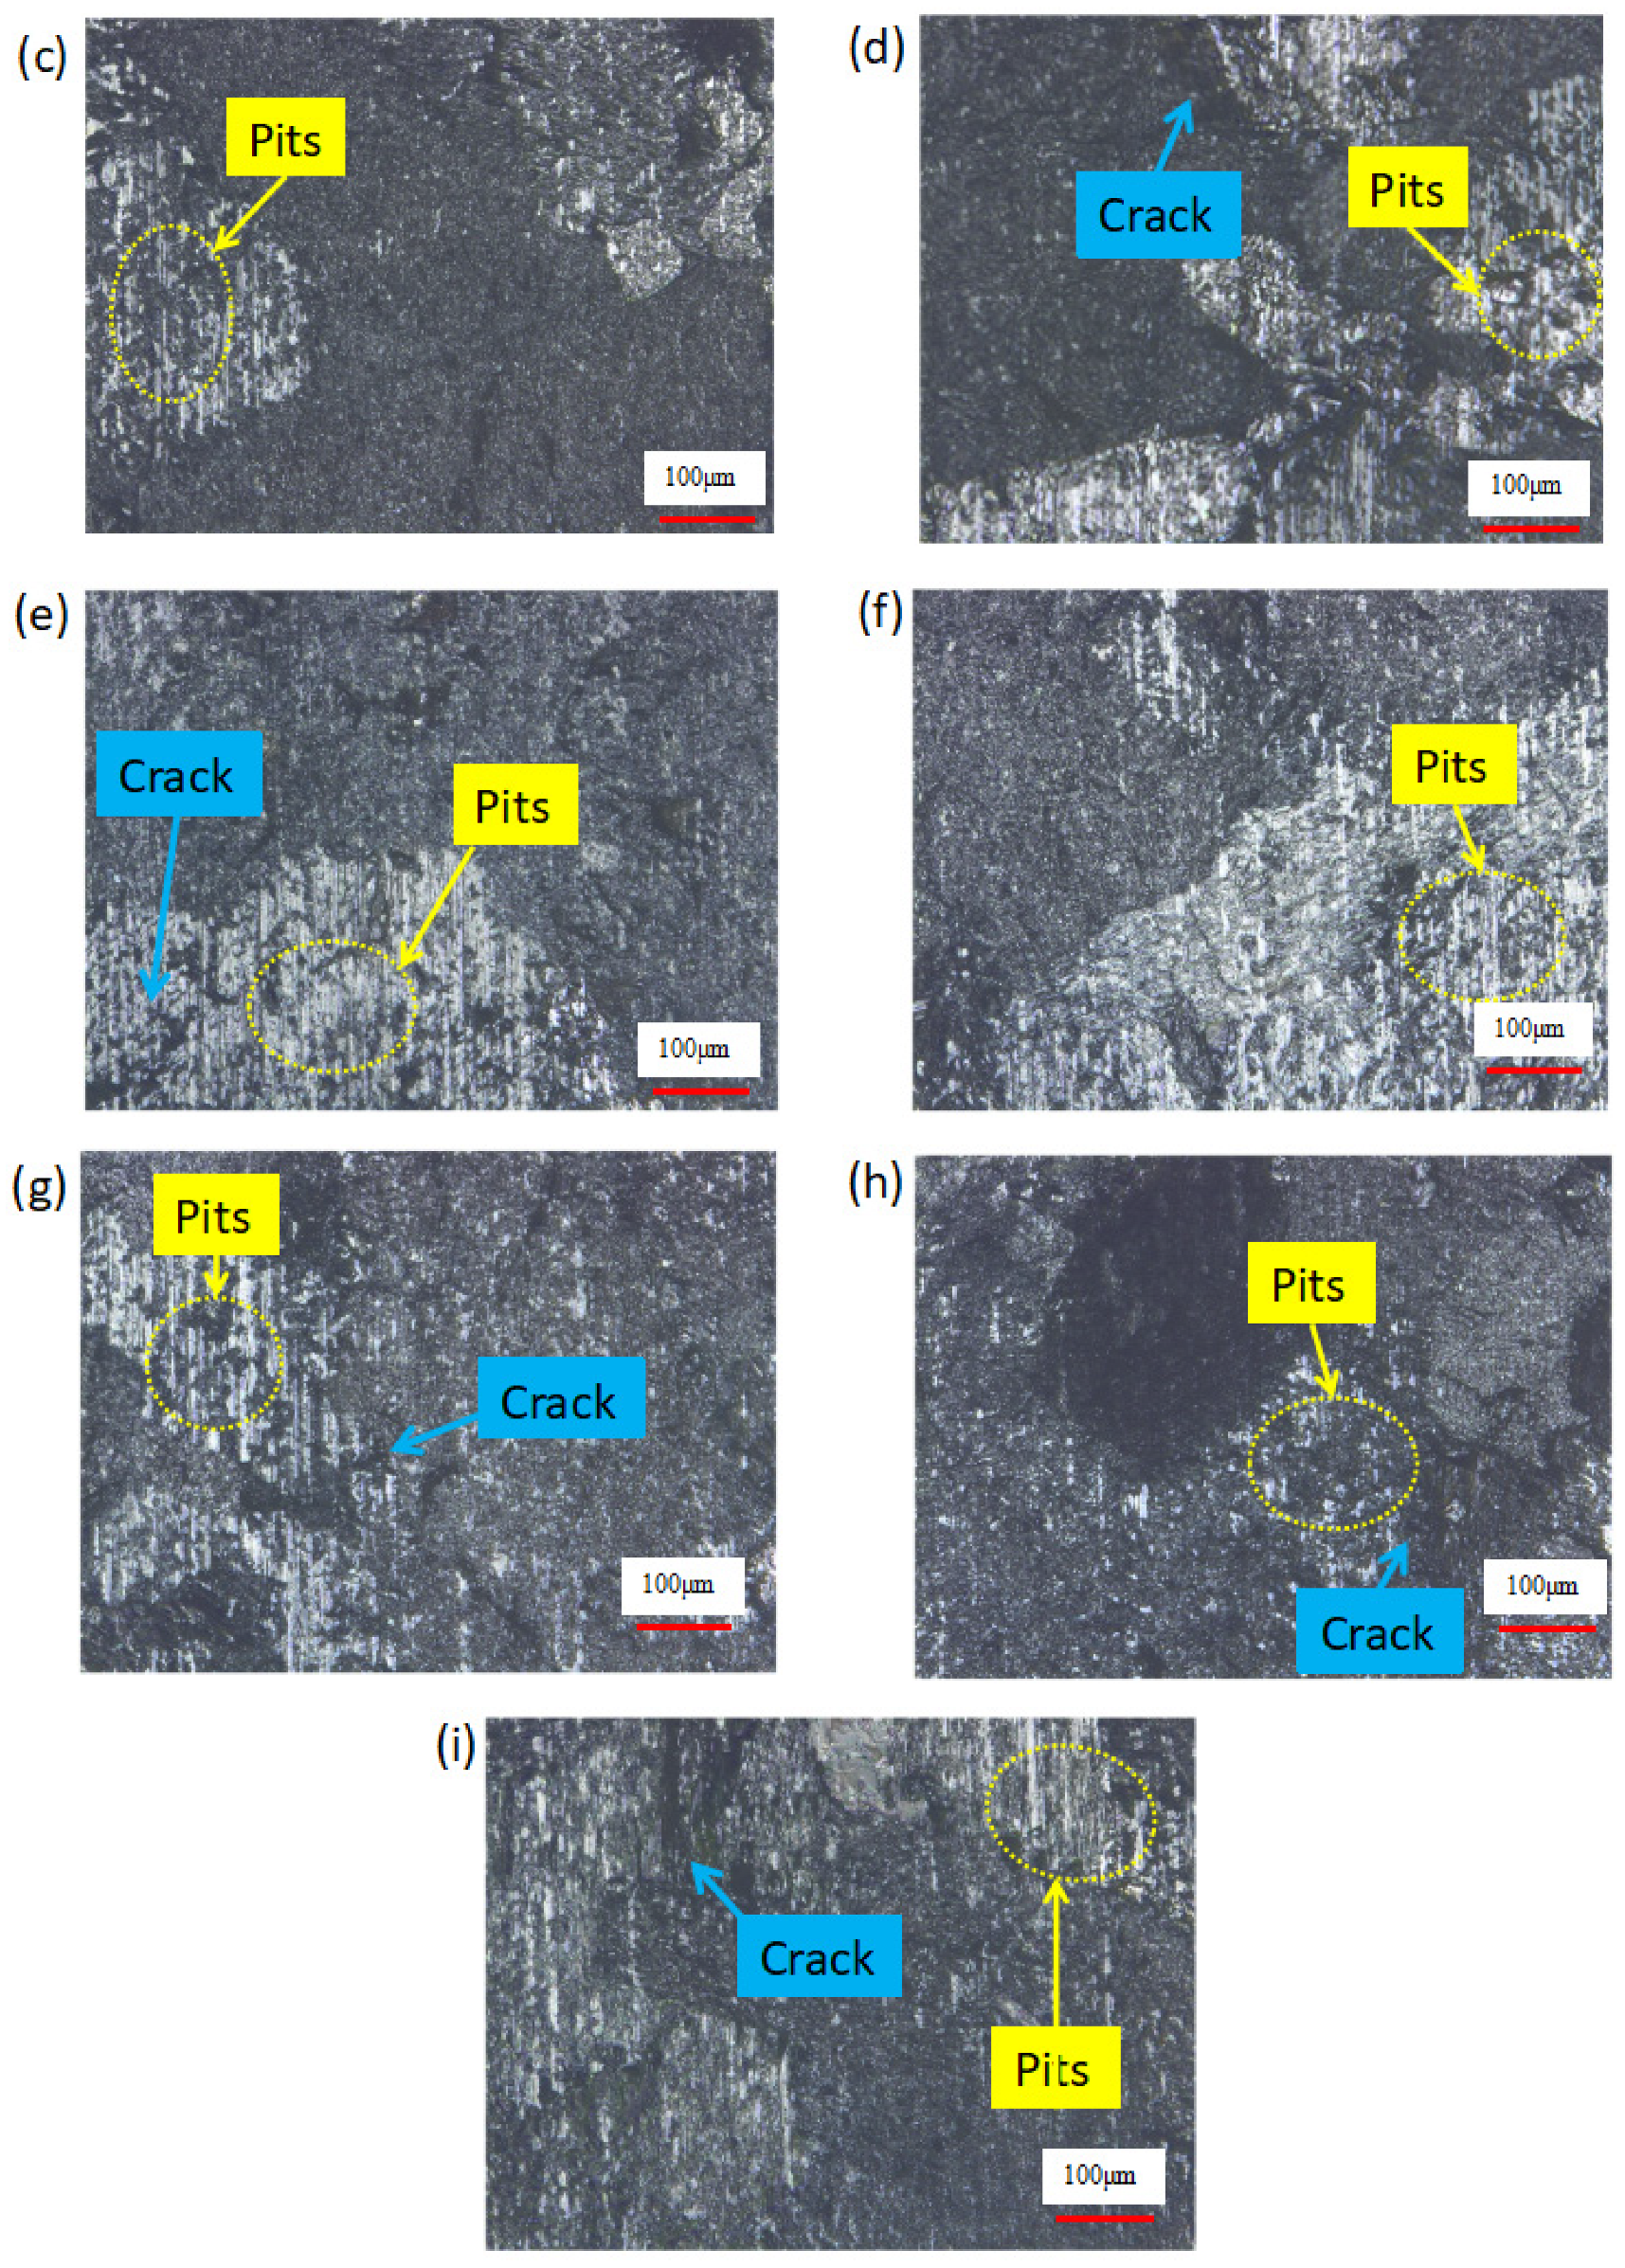
The surface morphology after wire saw cutting under nine sets of parameters is shown in Figure 6.
The current requirements for sliced surface quality are increasingly stringent. While surface morphology of machined granite allows quality assessment through pits and cracks, such evaluations lack objectivity and accuracy. Consequently, this study integrates fractal theory with Ra and PV values to investigate whether the fractal dimension can serve as a valuable parameter for characterizing the surface quality of diamond wire-saw-cut granite.

3.2. Surface Roughness and 3D FD

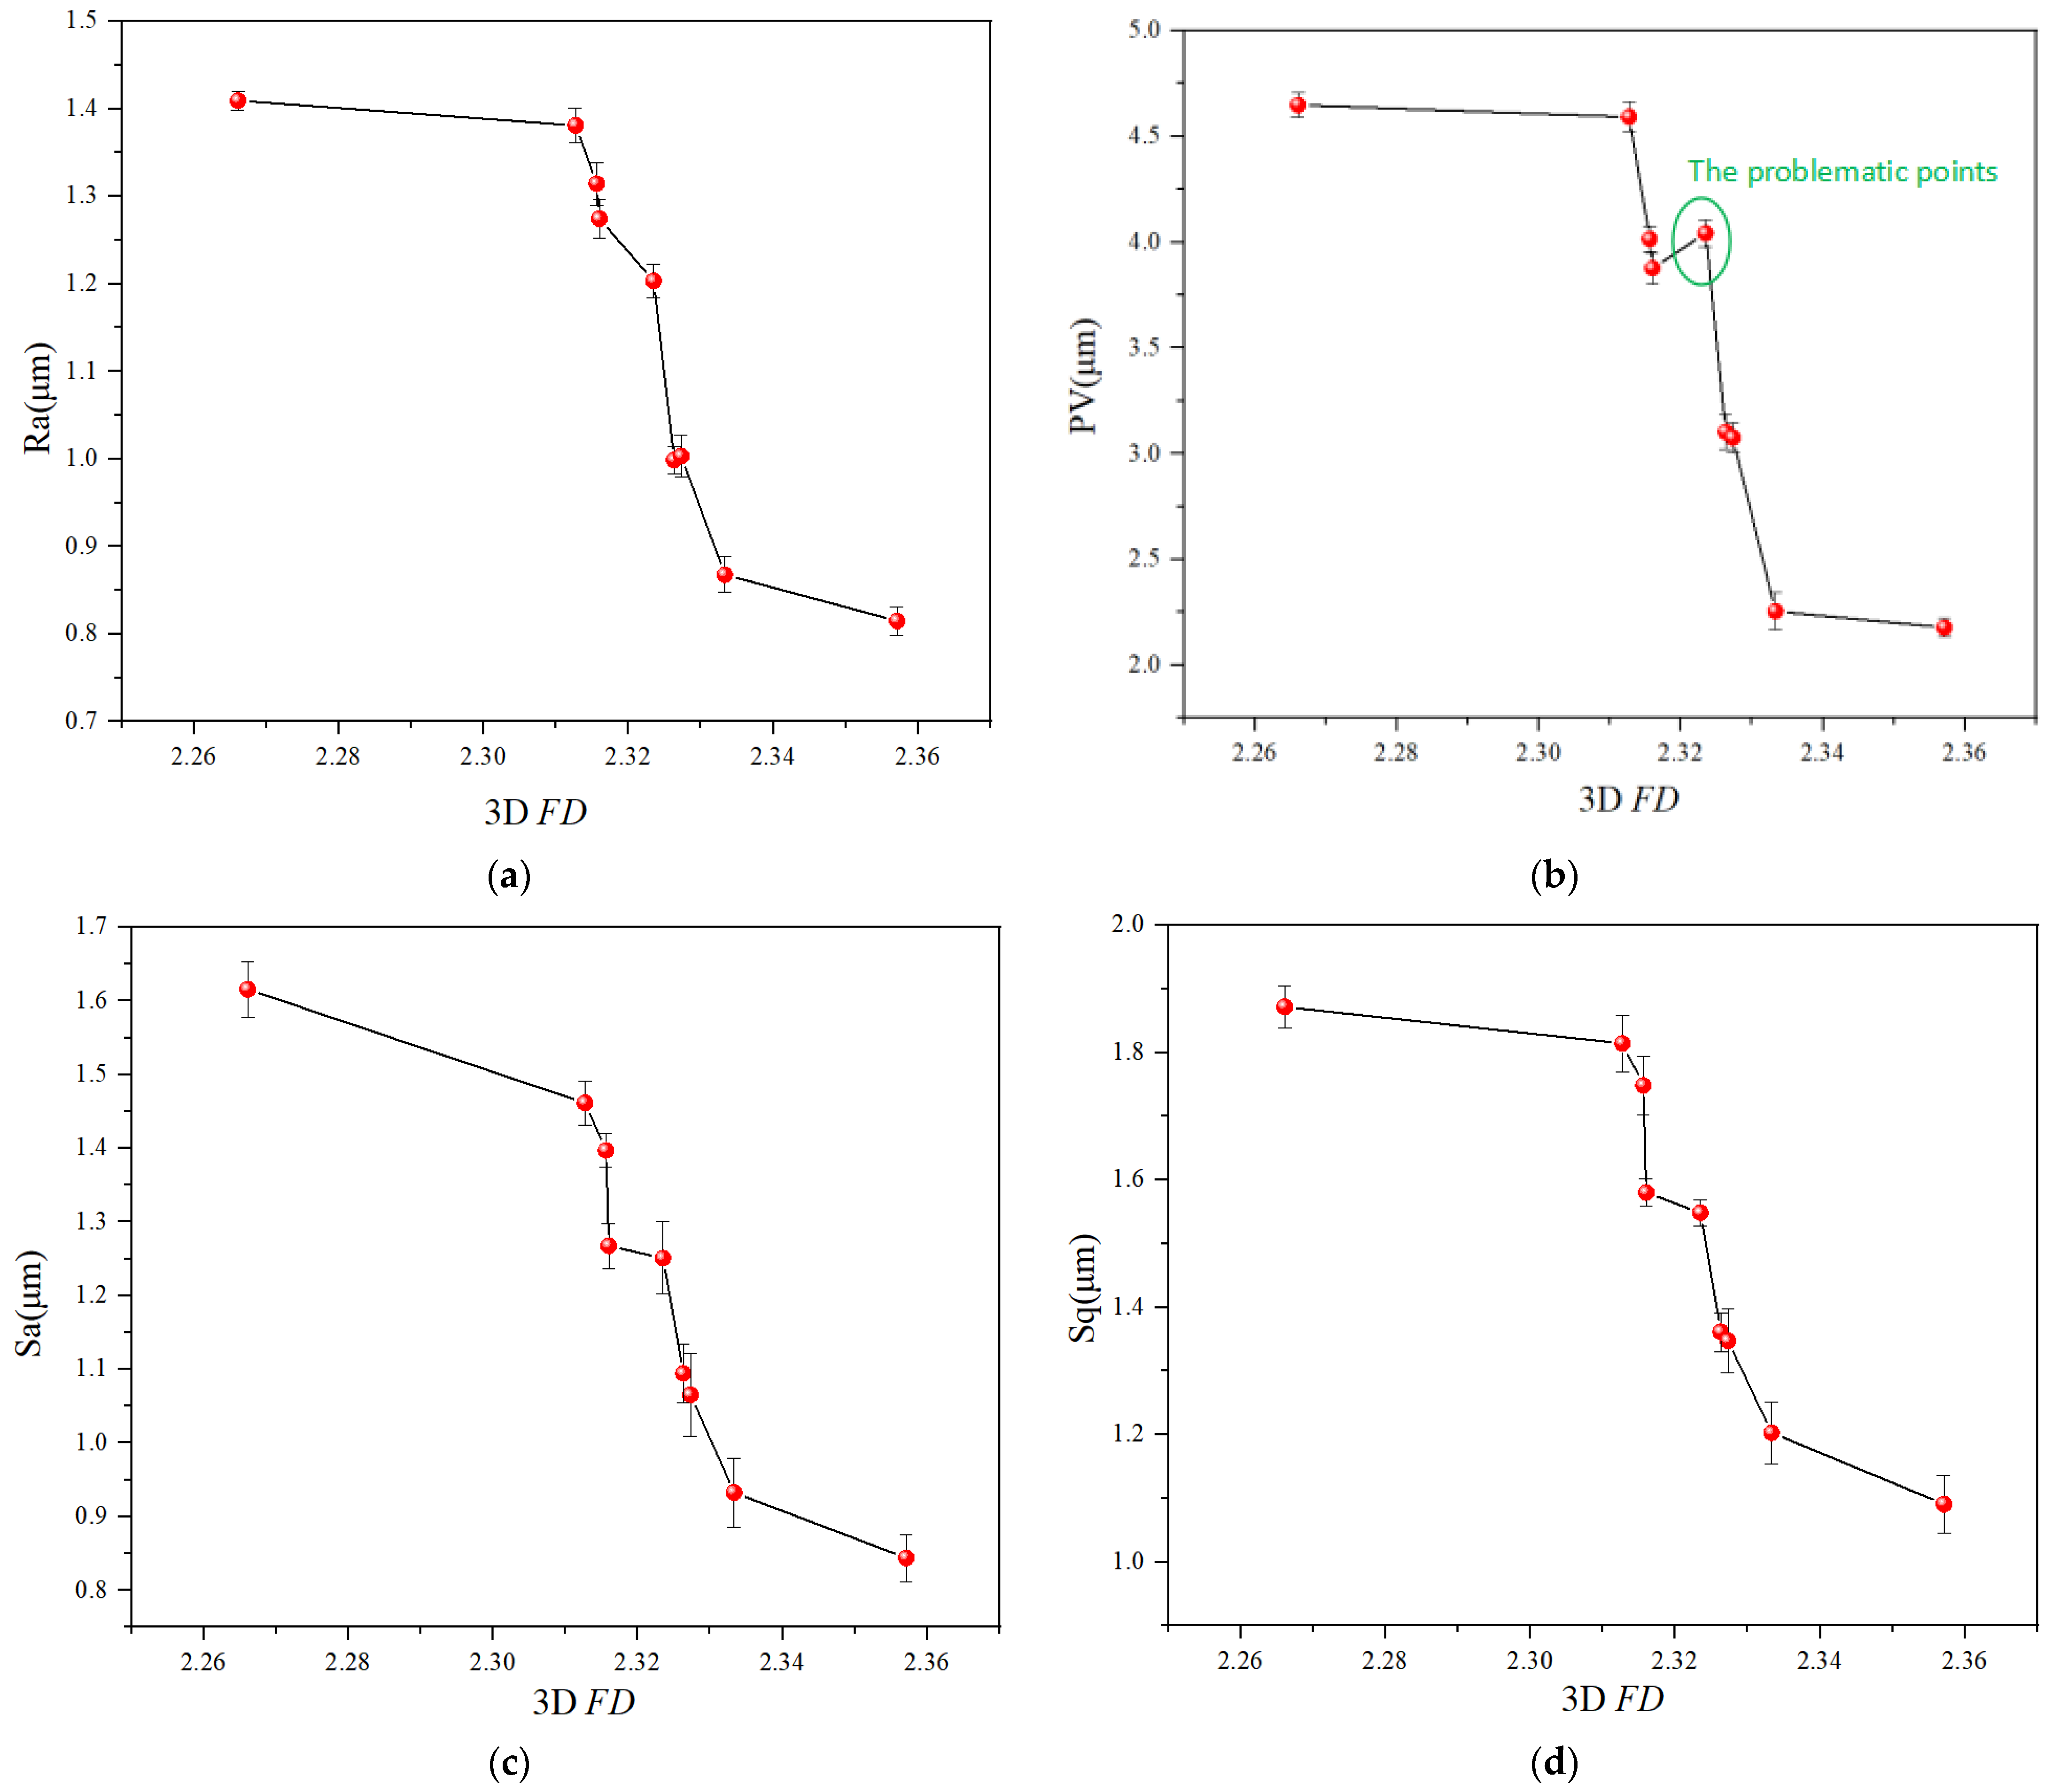
This study measured the surface roughness Ra along the workpiece feed direction and PV values of machined surfaces after cutting, as shown in Table 3. Experimental results indicate that parameter Groups 1, 2, 3, 6, and 9 exhibit smaller Ra and PV values, signifying better surface quality—consistent with their corresponding surface morphologies. However, as conventional surface characterization parameters, the Ra inadequately describes the complexity of surface morphology, while PV value is significantly influenced by extreme data points. The 3D FD reflects the degree of refinement of machined surfaces and encapsulates topographical complexity, providing a crucial complementary spatial evaluation. To investigate the correlations between surface roughness parameters and fractal dimensions, this study examines the relationships between the 3D FD and conventional 2D profile parameters (Ra and PV), as well as 3D areal parameters (Sa and Sq). Table 3 presents the measured values of Ra, PV, Sa, and Sq, as well as the calculated average results of the 3D fractal dimension. The relationships between these obtained roughness parameters and the fractal dimensions are illustrated in Figure 7.

3.3. 2D FD Analysis

The 3D FD characterizes the overall features of granite surfaces. However, for anisotropic granite composed of multiple mineral components, cross-sectional profiles in different directions exhibit distinct topographic features such as pits and cracks, leading to heterogeneous fractal structures. While 3D FD captures global characteristics, it fails to characterize direction-specific fractal properties. In contrast, fractal analysis of 2D cross-sectional profiles serves as a tool for investigating the anisotropy of machined granite surfaces. Investigating the fractal characteristics of 2D cross-sectional contours along different orientations is imperative to comprehensively characterize the machined surface morphology.
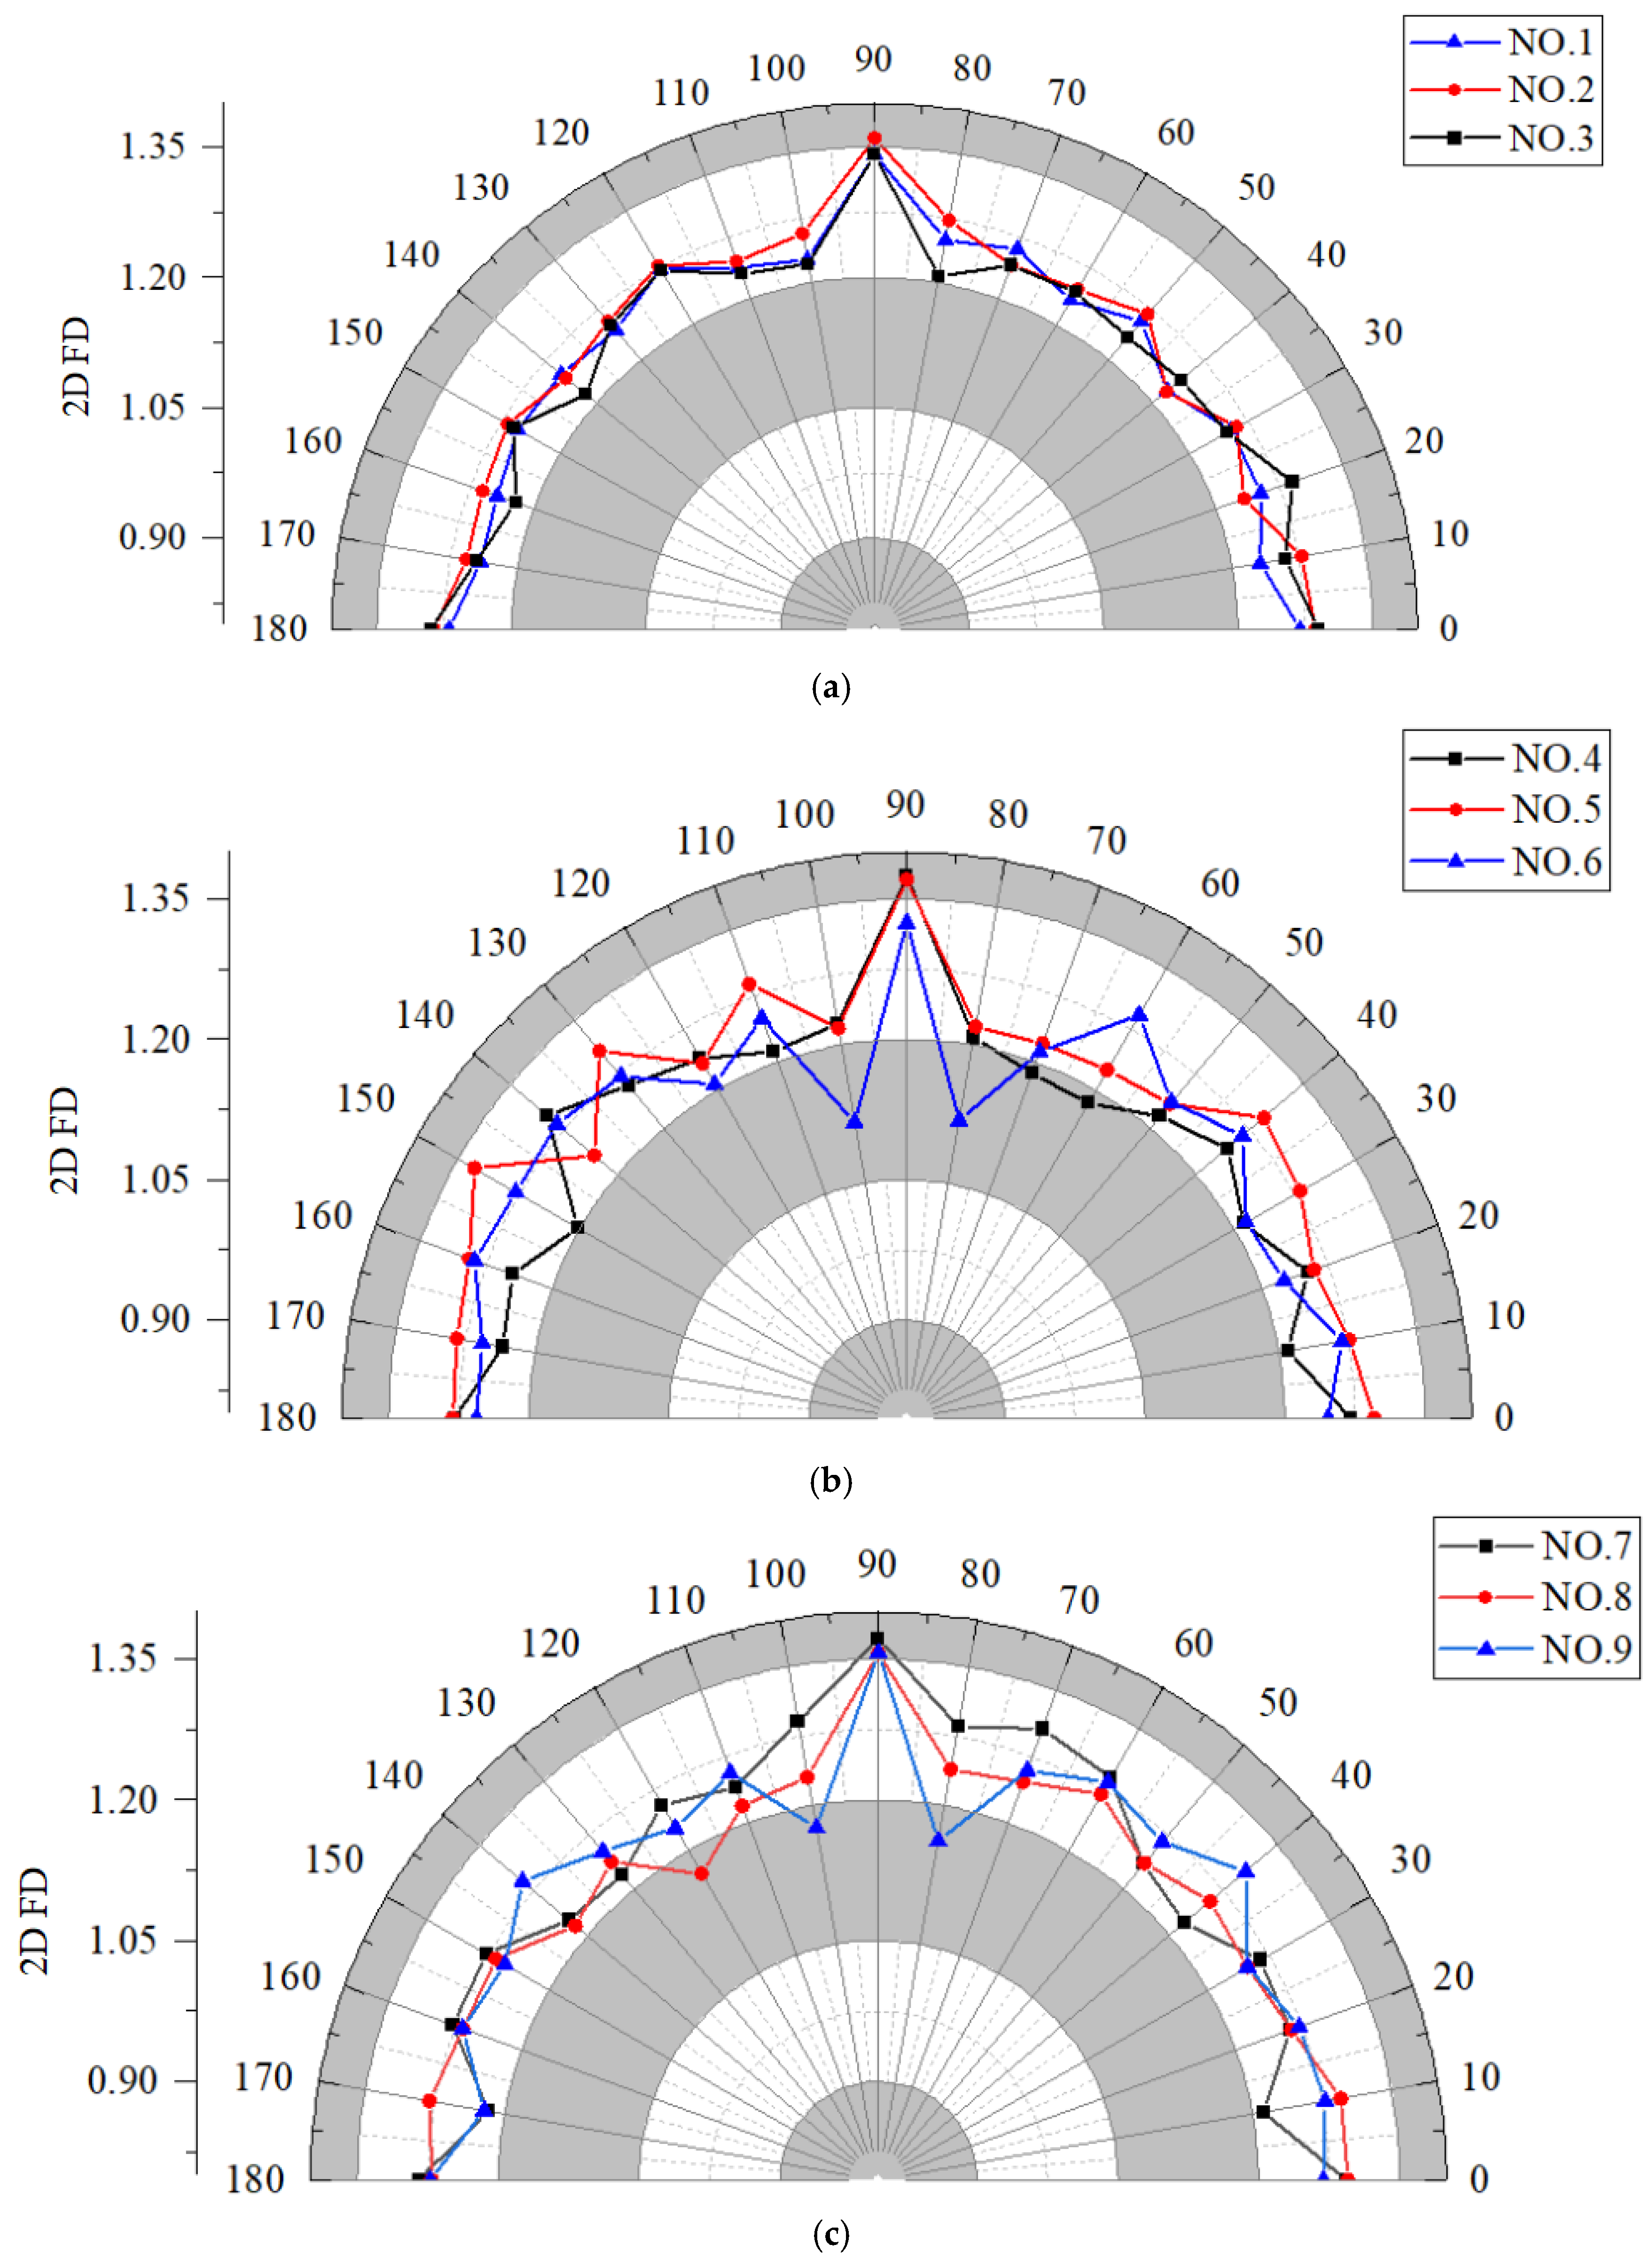
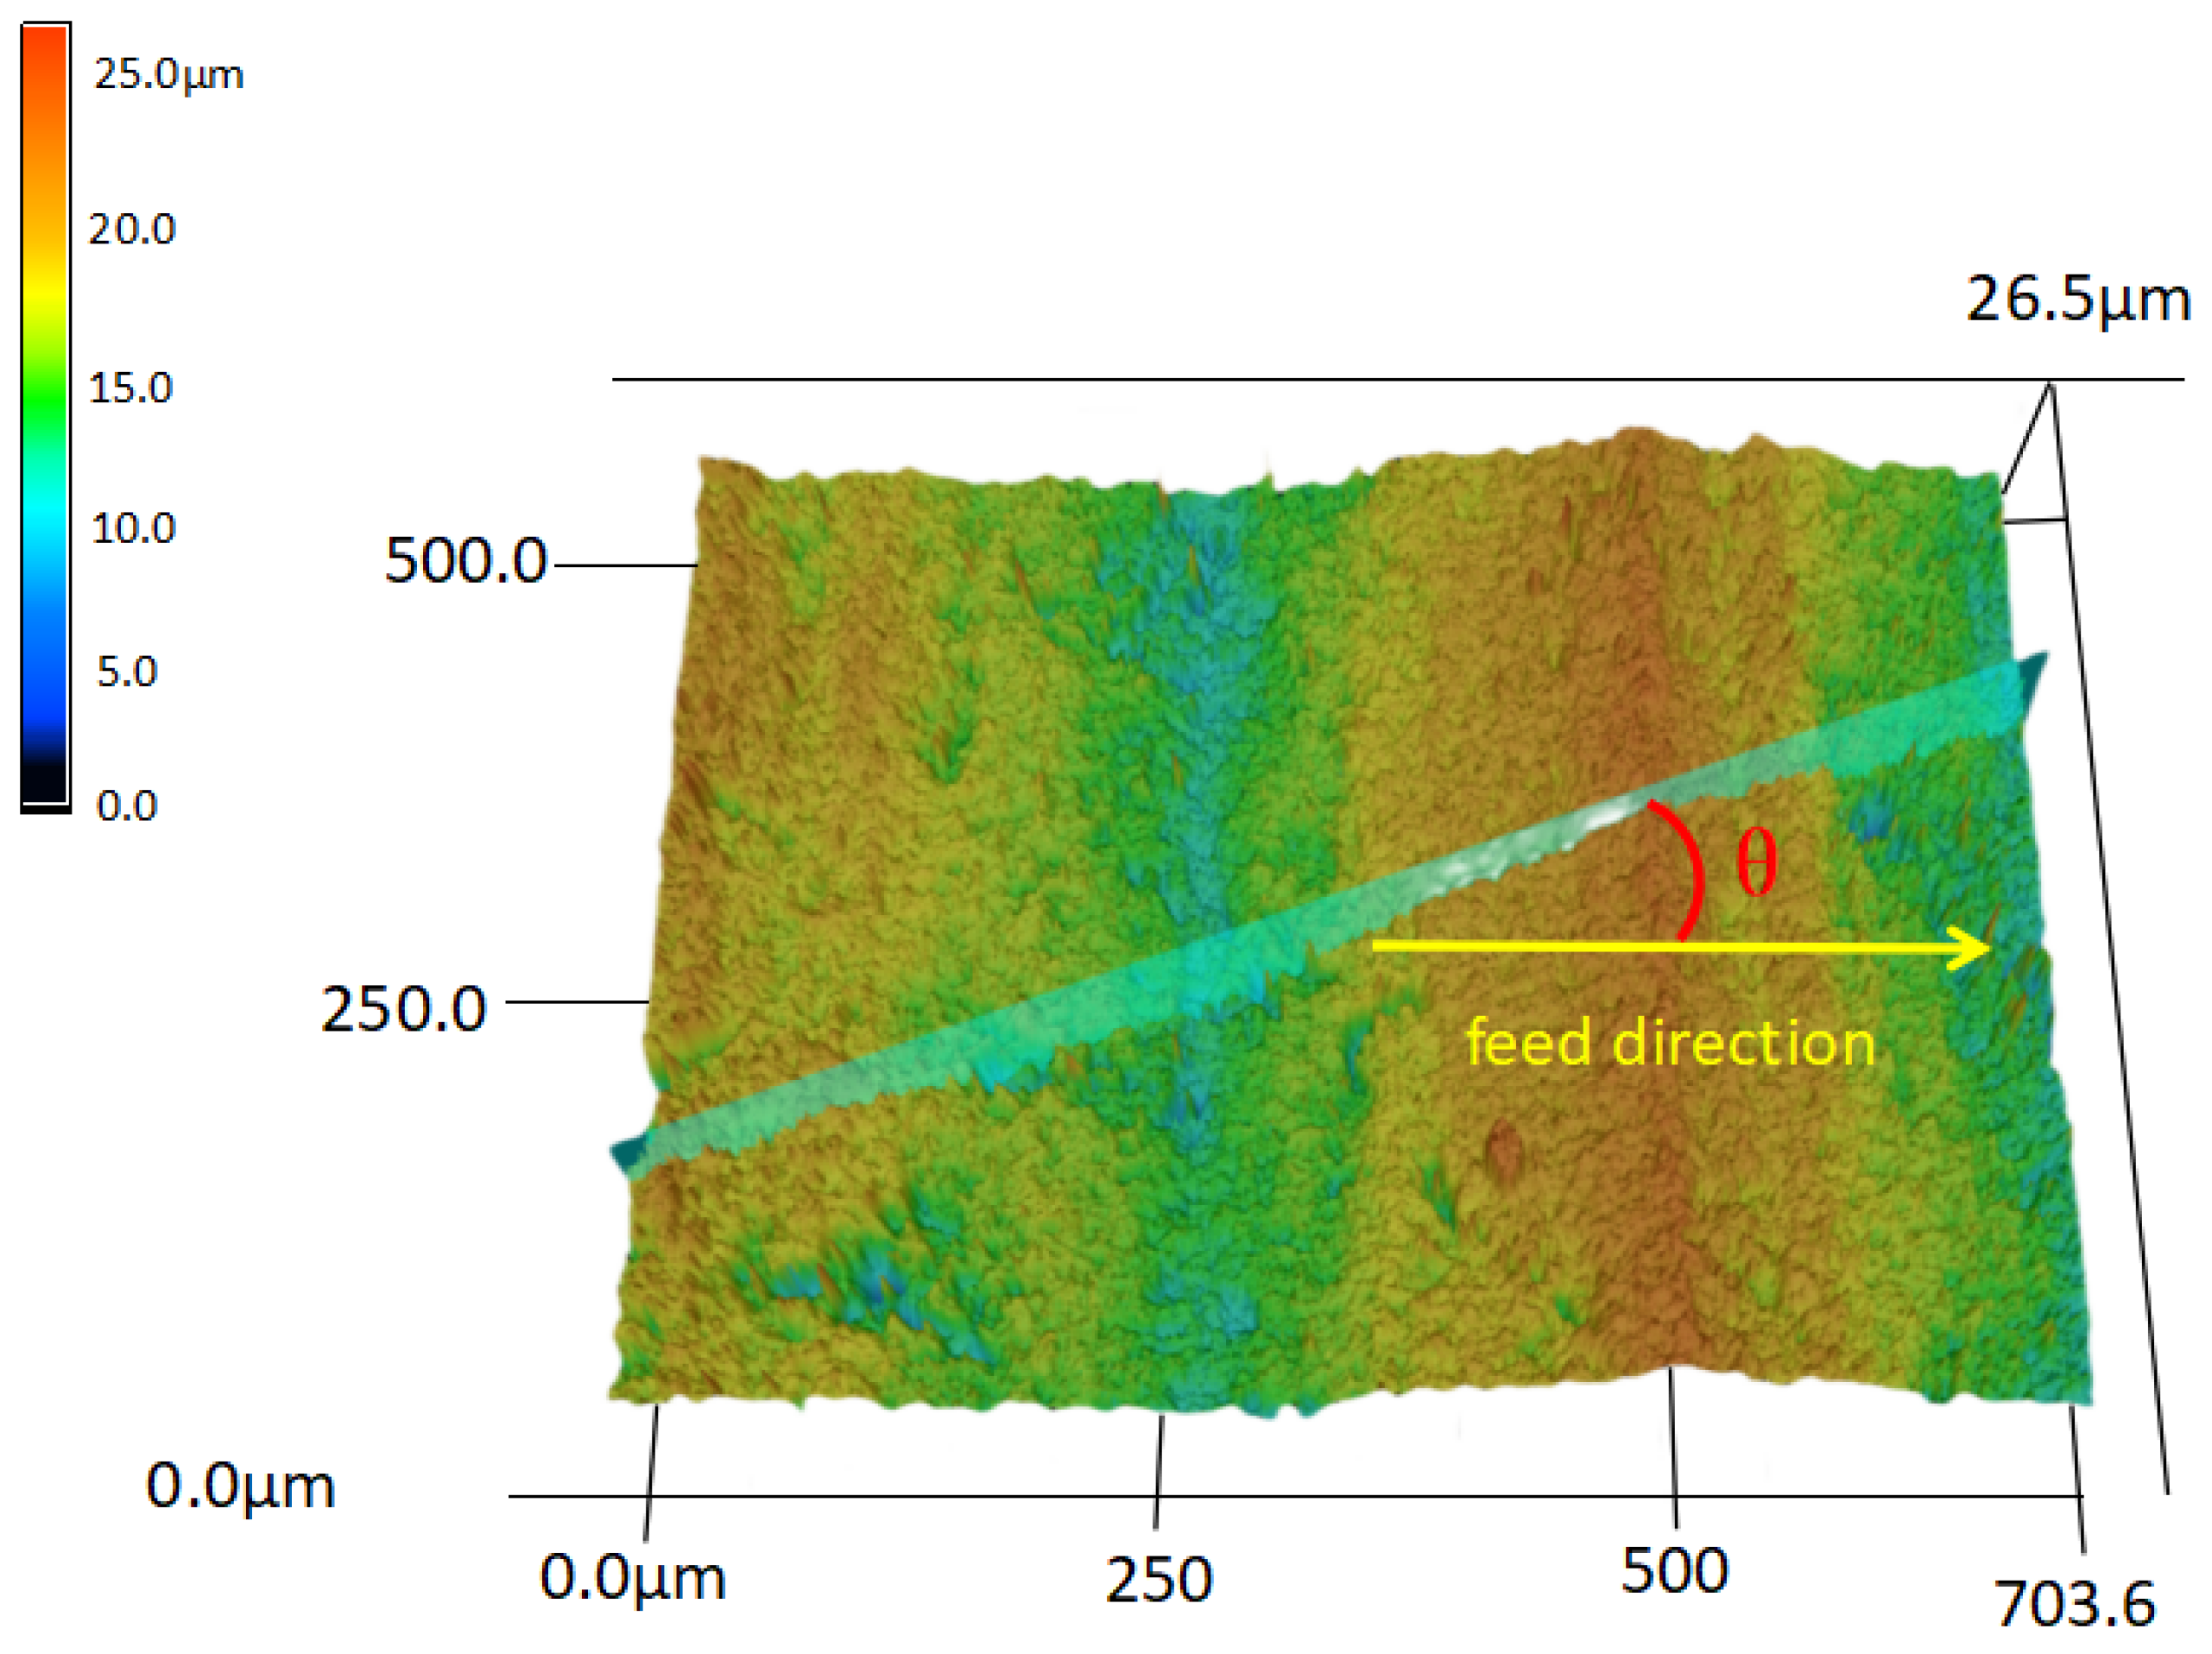
The cross-sections selected in this study are planes perpendicular to the sawn surface and oriented at an angle θ to the workpiece feed direction. These sections yield 2D FD along different orientations, with the measurement schematic illustrated in Figure 8. The angle θ between the blue section plane and the yellow arrow (representing the workpiece feed direction) in Figure 8 characterizes the orientation of the 2D cross-sectional profiles. Using this methodology, cross-sectional profiles were measured at angular intervals from 0° to 180° (in 10° increments), and their respective 2D FD were calculated. The angular distributions of 2D FD for sliced surfaces under varying machining parameters are presented in Figure 9.
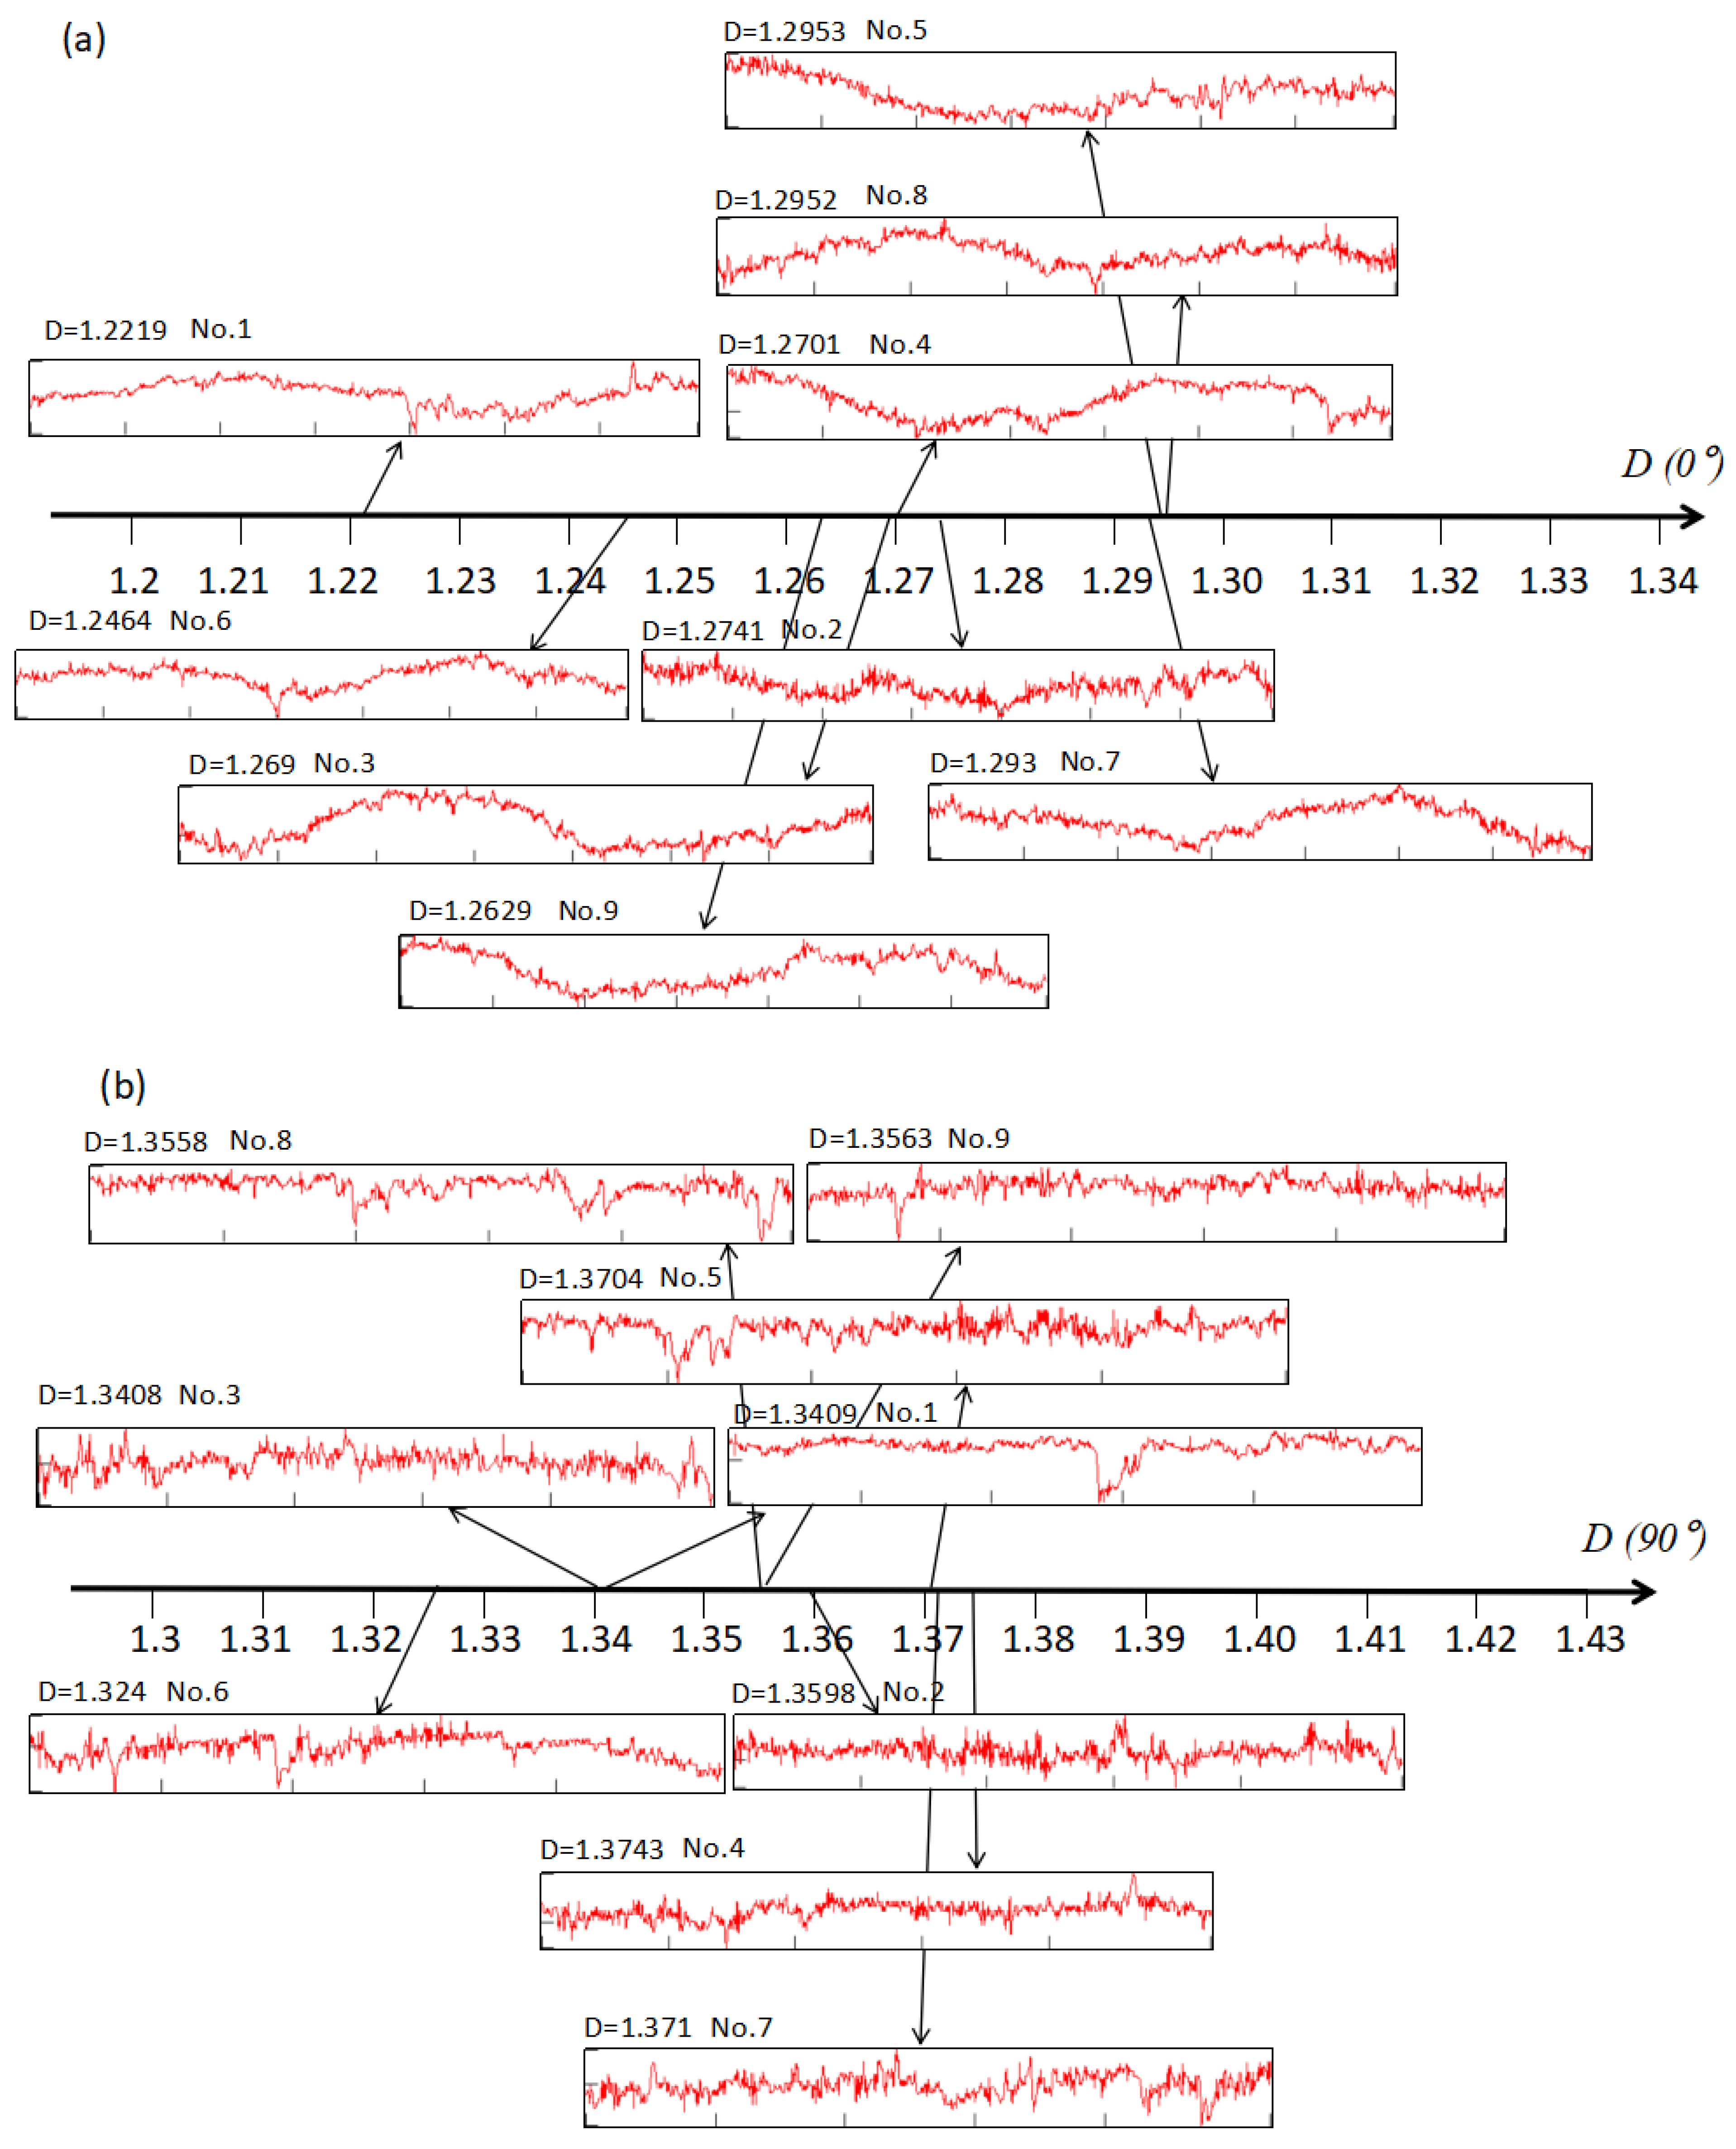
Figure 9 reveals that all results exhibit a peak fractal dimension at the 90° measurement direction (perpendicular to the feed speed). These results indicate superior surface quality in the wire direction relative to the feed direction. These observations align with findings from Scholar [20]. To further study the relationship between 2D FD and cross-sectional profiles, this paper analyzes the profiles of cross-sections along and perpendicular to the feed direction with different 2D FDs (D(0°) and D(90°)). The fractal dimension results and the corresponding profiles and processing parameter combinations are shown in Figure 10.

4. Discussion

4.1. Surface Morphology

Brittle pits can be clearly observed in Figure 6, with light regions exhibiting more pits while dark regions show relatively better performance. This may occur because the main components of lighter regions are plagioclase and white mica (where plagioclase has higher hardness), while darker regions primarily consist of pyroxene with relatively lower hardness. Additionally, cracks appear on some machined surfaces. These cracks are more numerous and cover larger areas at the interfaces between dark and light regions; under certain parameters, cracks also exist within light regions. In Figure 6a–c,i, small brittle pits are observable, but the overall surface morphology remains clear and intact without large cracks, indicating better surface quality.
Figure 6b clearly shows cracks at the interface between dark and light regions. As demonstrated by Ghasemi et al. [34], the impact loads imposed by the cutting tool induce incompatible deformation among mineral grains. Adjacent heterogeneous minerals exhibit differential strain responses due to differences in elastic modulus and hardness, leading to local stress concentration at interfaces, where the linear microcrack density of intergranular cracks increases first. Meanwhile, frictional heat generated during cutting raises the surface temperature. Because the thermal expansion coefficients of different minerals vary significantly, adjacent grains undergo unequal expansion upon heating, producing additional thermal stresses at the interfaces. Li et al. [35] demonstrated through GBM model simulations that thermal cracks preferentially nucleate at mineral interfaces with contrasting expansion coefficients and gradually coalesce into complex crack networks as temperature increases. The coupling of mechanical and thermal effects thus jointly generates localized stress concentrations at mineral interfaces, promoting the initiation and propagation of interfacial cracks.

4.2. Surface Roughness and 3D FD

The 3D FD results indicate that machined surfaces of parameter Groups 1, 2, 3, 6, and 9 exhibit higher 3D FD, whereas Groups 4, 5, and 7 show lower values. This trend aligns with surface morphology analysis. Figure 7 shows negative correlations between Ra, PV, Sa, Sq and 3D FD, though these relationships are nonlinear. Qualitatively, fractal dimension quantifies structural complexity and correlates positively with spatial characteristics of microstructures. As highlighted in the recent study by Bigerelle et al. [36], the implementation of advanced fractal pattern evaluation provides a more refined understanding of surface irregularities at multiple scales. Therefore, 3D FD theoretically serves as a valuable parameter for characterizing machined surfaces. The higher values indicate refined surfaces with greater micro-scale density, signifying superior surface quality. Conversely, severely damaged surfaces exhibit microstructures, reducing 3D FD. This phenomenon can be explained by the calculation principle of the box-counting method at the micro-scale. A high-quality sawn surface has dense and uniform micro-scratches caused by the normal cutting of abrasives. These fine structures fill the 3D space effectively, resulting in a higher 3D FD. However, when severe brittle fracture occurs, large macroscopic pits appear. These large defects directly destroy the originally dense and complex micro-textures on the surface. This reduces the overall spatial complexity, meaning fewer boxes are needed to cover the surface topography during the calculation. Therefore, as the surface quality deteriorates and the conventional roughness parameters increase, the 3D FD decreases.
Outliers in Figure 7b that deviate from the decreasing trend reveal limitations of the conventional parameter PV values in characterizing heterogeneous materials. Under this parameter combination, the cutting surface forms a relatively refined dense morphology, achieving higher 3D FD. However, granite being a heterogeneous material, light regions exhibit more severe damage than dark-colored regions, resulting in larger PV values in cross-sections. As PV values are significantly influenced by extreme values, they primarily characterize surface quality in light regions while ignoring dark regions. This demonstrates substantial limitations of PV values for heterogeneous materials. Comparatively, 3D FD more accurately represents actual surface damage. According to the results from Figure 6d,g, when the two groups exhibit similar Ra and PV values, Group 4 shows a higher 3D FD. This corresponds to the superior surface morphology in Figure 6d, which displays fewer pits and cracks than Figure 6g. This phenomenon indicates that surface damage such as pits and cracks significantly affects Ra and PV values. The 3D FD of the granite surfaces in this study shows very different characteristics compared to homogeneous brittle materials like monocrystalline silicon. In the wire sawing of silicon, because the material has a simple structure with obvious plastic scratches and regular brittle pits, the 3D FD usually has a strong linear correlation with roughness parameters, and the values are clearly affected by the sawing direction. In contrast, granite contains different minerals such as quartz, feldspar, and mica, which have huge differences in hardness. Therefore, the 3D FD of granite is not only affected by the sawing parameters but also by the random cracks at mineral interfaces and multi-scale brittle pits. This high complexity at the micro-level makes the 3D FD of granite generally higher than that of uniform silicon or advanced ceramics. 3D FD effectively captures complex topographical variations and microstructural damage, serving as a powerful supplement to conventional parameters. To quantitatively analyze the correlation between 3D FD, Ra, PV, Sa and Sq, this study conducted a correlation analysis on the calculated results. The correlation was characterized using the correlation coefficient r and p-value, with the calculation formula for r given as follows:
r = S x y S x S y = ( x i x ¯ ) ( y i y ¯ ) ( x i x ¯ ) 2 ( y i y ¯ ) 2
where the magnitude and sign of the correlation coefficient r indicate the strength and direction of the correlation respectively. Sxy denotes the sample covariance, while Sx and Sy represent the sample standard deviations of the x and y values across data points.
The quantitative correlation analysis further substantiates these observations. The Pearson correlation coefficients (R) are −0.814 for Ra, −0.796 for PV, −0.811 for Sa, and −0.815 for Sq, respectively. The high degree of correlation across both 2D and 3D parameters highlights the potential of 3D FD as a promising auxiliary metric for characterizing surface quality. The results demonstrate that p-values for all correlations are less than 0.01, indicating high statistical significance. Thus, the integration of 3D FD with traditional ISO parameters offers a more comprehensive framework for evaluating the surface integrity of diamond-wire-sawn granite.

4.3. 2D FD Analysis

Figure 9 shows distinct symmetric distributions of 2D FD of Groups 1, 2, 3, 6, and 9. This symmetry reflects consistent surface damage severity across orientations. Strong symmetry implies homogeneous machining-induced damage and weak surface anisotropy under those specific conditions. Additionally, Groups 1, 2, 3 demonstrate minimal fluctuation in 2D FD across all measured angles. Such stability indicates the absence of large and deep pits or cracks on the machined surface. If such defects exist, abrupt decreases in 2D FD along specific orientations would induce significant distribution irregularities. Consequently, the symmetric distributions of the 2D FD indicate that the machined surfaces from Groups 1, 2, 3, 6, and 9 exhibit weak anisotropy. The stable fractal dimension values further demonstrate superior surface quality specifically in Groups 1, 2, 3. In contrast, Groups 4, 5, and 7 display asymmetric fractal dimension distributions signifying strong anisotropy, accompanied by marked fluctuations in fractal dimension values that reveal the presence of substantial pits and cracks, ultimately confirming compromised surface quality.
To evaluate the dispersion of data across different orientations, this study employs circular variance (V) as an anisotropy indicator to quantify the symmetry of the 2D fractal dimensions. The core formula is defined as follows:
X = i = 1 n ( D i cos 2 θ i )
Y = i = 1 n ( D i sin 2 θ i )
R w = X 2 + Y 2 i = 1 n D i
V = 1 R w
The calculated results of the circular variance are presented in Table 4.
The calculated circular variance (V) remains at a high level (typically V > 0.99), which signifies a pronounced statistically isotropic characteristic of the sawn granite surfaces. The circular variance (V) of sawn silicon wafers is typically lower than that of granite, reflecting a more pronounced directional texture. Unlike the homogeneous structure of monocrystalline silicon or advanced ceramics, the grain boundaries and different hardness levels in granite cause many random brittle cracks and fractures. This result is consistent with the findings of Wang et al. [37], who performed fractal characterization on the rough surfaces of granite. Their research indicates that due to the heterogeneous mineral distribution, the fractal dimensions of granite surfaces across different orientations exhibit minimal fluctuations (within a 1–3% range). Consequently, the dominance of random micro-fracture features tends to mask the directional influence of the sawing process, leading to a circular variance approaching unity. This suggests that the fractal complexity of the surface is more sensitive to the material’s intrinsic breaking mechanism than to the macroscopic tool path. The results indicate that for Groups 1, 2, 3, 6, and 9, the circular variance is relatively large, suggesting superior symmetry in the 2D fractal dimensions. In contrast, Groups 4, 5, and 7 exhibit smaller circular variance values, reflecting a lower degree of symmetry in their fractal distribution. These characterization results of 2D FD correspond directly with the surface morphology analysis presented in Figure 6 and the 3D FD assessments. The angular distribution characteristics of 2D FD serve as an indicator for granite surface integrity: highly symmetric distributions signify weak material anisotropy, stable fractal dimension values reflect superior surface quality, asymmetric distributions denote strong anisotropy, and irregular fractal dimension variations indicate significant sub-surface damage. This establishes a correlation between 2D FD distribution patterns and surface quality.
Figure 10 shows that 2D FD directly reflects the degree to which a line tends towards a surface. The more information a line contains, the more complex it is, and the denser its structure, the more it tends towards a surface, and the greater its 2D FD. It can be clearly observed in Figure 10 that as the fractal dimension increases, the two-dimensional cross-sectional profile contains more information. Figure 10a shows that, compared with the section at D(0°) of 1.2952, the section at D(0°) of 1.2219 has many pits. These pits destroy the dense structure of the surface and reduce the surface fractal dimension. When D(0°) increases from 1.2219 to 1.2952, the information contained in the cross-section increases and the surface structure becomes denser. As shown in Figure 10b, when the 2D FD D(90°) perpendicular to the feed direction increases from 1.324 to 1.3743, the section contains more information, the section profile becomes denser, the overall section is relatively flatter, and the number of larger and deeper pits and protrusions decreases. In addition, we can observe that there are obvious waves in the cross-section along the feed direction, while the cross-section perpendicular to the feed direction is almost unaffected by the waves. Based on previous research and conclusions, the PV value has a significant impact on surface quality, which makes D(0°) significantly smaller than D(90°), also confirming the previous studies in this paper.

5. Conclusions

This paper conducted an experiment of granite with diamond wire saw and investigated the possibility of characterizing the machined surface quality of granite using fractal dimension. The findings suggest that the fractal dimension holds potential as an auxiliary parameter for characterizing the surface quality of processed granite. The use of 3D FD and 2D FD can characterize the surface quality of granite processing. Therefore, the 3D FD serves as a meaningful auxiliary indicator. Based on this study, the following conclusions are drawn:
The processed surface of granite is fragmented, with a complex composition and a large number of pits of different sizes and depths. There are saw marks along the feed direction of the workpiece.
The 3D FD of the granite-sawn surface is negatively correlated with the surface roughness parameters. When the surface quality decreases and roughness parameters increase, the fine structure of the surface will be damaged by pits and cracks, resulting in a decrease in the 3D FD of the surface. Moreover, the 3D FD effectively quantifies the overall spatial complexity and microstructural damage (such as brittle pits and cracks).
The spatial distribution of the 2D FD across the granite surface serves as a meaningful complementary indicator for evaluating surface anisotropy and identifying the potential presence of significant localized defects. The strong symmetry of the distribution of 2D FD indicates weak anisotropy. The 2D FD is stable, indicating good surface quality and no major defects on the surface. In addition, there is a significant correlation between the 2D FD and the cross-sectional profiles. Cross-sectional profiles with a large 2D FD are finer and denser. The more information the cross-section contains, the less it suffers from damage such as pits and cracks that destroy the dense surface structure.
It is important to acknowledge the statistical limitations of the current study. The nine-group orthogonal experimental design successfully identified strong correlations between 3D FD and conventional surface parameters within the targeted processing window. However, due to the relatively small sample size, the current dataset is insufficient for constructing a comprehensive, multi-variable predictive regression model complete with rigorous residual and sensitivity analyses. While the present study highlights 3D FD as a promising complementary indicator, expanding the experimental matrix and conducting broader parameter comparisons remain a key direction for our future research.


Author Contributions

Conceptualization, Y.G.; methodology, Y.L., Y.G. and J.X.; investigation, Y.L.; data curation, Y.L.; writing—original draft preparation, Y.L.; writing—review and editing, Y.G.; visualization, Y.L.; project administration, Y.G. All authors have read and agreed to the published version of the manuscript.

Funding

This research was funded by the Natural Science Foundation of Shandong Province (No. ZR2023ME145).

Data Availability Statement

All data generated or analyzed during this study are included in this published article.

Acknowledgments

The authors express their gratitude to Li Jiankao for his assistance in mathematics during the research.
Conflicts of Interest

The authors declare that they have no known competing financial interests or personal relationships that could have appeared to influence the work reported in this paper.

Abbreviations

The following abbreviations are used in this manuscript:
PVpeak-to-valley value
RAsurface roughness
FDfractal dimension

References

  1. Zhang, J.; Peng, C.; Fu, J.; Dong, G.; Zhang, H.; Cao, Q.; Su, Y. Granite mechanical properties and SHPB testing in geothermal development: A review. Geoenergy Sci. Eng. 2024, 243, 213361. [Google Scholar] [CrossRef]
  2. Kumar, V.; Saraswat, P.; Kumar, A. Experimental investigation of rotary ultrasonic face milling on red granite: A comparison with conventional grinding. Mater. Today Proc. 2022, 58, 27–32. [Google Scholar] [CrossRef]
  3. Farhadian, A.; Ghasemi, E.; Hoseinie, S.H.; Bagherpour, R. Development of a new test method for evaluating the abrasivity of granite building stones during polishing process based on weight loss of abrasive tool. Constr. Build. Mater. 2021, 303, 124497. [Google Scholar] [CrossRef]
  4. Kang, J.; Zhang, H.; Zhang, J. Understanding the wear mechanisms of diamond circular saw blades during machining hard rocks. Int. J. Refract. Met. Hard Mater. 2024, 123, 106767. [Google Scholar] [CrossRef]
  5. Zhang, H.; Zhang, J.; Wang, Z.; Sun, Q.; Fang, J. A new frame saw machine by diamond segmented blade for cutting granite. Diam. Relat. Mater. 2016, 69, 40–48. [Google Scholar] [CrossRef]
  6. Wang, F.; Xu, C. Dynamic modeling and experimental validation of vibration for diamond beaded rope during granite cutting. Mech. Syst. Signal Process. 2021, 159, 107825. [Google Scholar] [CrossRef]
  7. Li, Z.; Ge, Z.; Deng, Q.; Zhou, Z.; Liu, L.; Shangguan, J.; Shao, C. Micro-characteristics of granite impinged by abrasive water jet from a mineralogical perspective. J. Rock Mech. Geotech. Eng. 2024, 17, 1008–1017. [Google Scholar] [CrossRef]
  8. Li, H.H.; Gao, Y.F.; Cheng, D.M.; Yang, C.F. Modeling and experimental investigation on sawing force in ultrasonic vibration–assisted diamond wire sawing mono-Si considering material removal mode. Int. J. Adv. Manuf. Technol. 2025, 138, 471–489. [Google Scholar] [CrossRef]
  9. Wang, Y.; Xu, K.; Xue, H.; Li, J.; Li, Y. Anisotropic mechanism of monocrystalline silicon on surface quality in precision diamond wire saw cutting. Mater. Sci. Semicond. Process. 2025, 185, 108961. [Google Scholar] [CrossRef]
  10. Li, G.; Gao, Y.; Huang, W.; Shi, Z. Improvement of wire marks on the surface of Si3N4 ceramics cut by diamond wire saw. Mater. Sci. Eng. B 2024, 310, 117725. [Google Scholar] [CrossRef]
  11. Cheng, D.M.; Gao, Y.F.; Huang, W.B. Prediction of excess kerf loss in diamond wire sawing based on vibration source signal measurement and processing. Measurement 2026, 257, 118969. [Google Scholar] [CrossRef]
  12. Silva, B.; Aira, N.; Martínez-Cortizas, A.; Prieto, B. Chemical composition and origin of black patinas on granite. Sci. Total Environ. 2009, 408, 130–137. [Google Scholar] [CrossRef]
  13. Yuan, Z.; Xu, X.; Zuo, D.; Yuan, J.; Yao, Y. Relation Study of Roughness and Glossiness to Fractal for Granite Surface Profiles. Key Eng. Mater. 2008, 315–316, 455–458. [Google Scholar]
  14. Yin, S.; Xiao, H.; Wu, H.; Wang, C.; Cheng, C.F. Image-processing-based model for the characterization of surface roughness and subsurface damage of silicon wafer in diamond wire sawing. Precis. Eng. 2022, 77, 263–274. [Google Scholar] [CrossRef]
  15. Kang, R.; Zhang, Y.; Gao, S.; Huang, J.; Zhu, X. High surface integrity fabrication of silicon wafers using a newly developed nonwoven structured grind-polishing wheel. J. Manuf. Process. 2022, 77, 229–239. [Google Scholar] [CrossRef]
  16. Cheng, D.; Guo, Y.; Gao, Y.; Shi, Z. Research on the reliability of wire web in diamond multi-wire saw slicing photovoltaic monocrystalline silicon wafer. Sol. Energy Mater. Sol. Cells 2025, 279, 113247. [Google Scholar] [CrossRef]
  17. Zhang, N.; Gao, Y. Surface properties of monocrystalline silicon in diamond wire electrical discharge combined sawing. Int. J. Adv. Manuf. Technol. 2025, 136, 5227–5240. [Google Scholar] [CrossRef]
  18. Li, G.; Zhang, K.; Gong, J.; Jin, X. Calculation method for fractal characteristics of machining topography surface based on wavelet transform. Procedia CIRP 2019, 79, 500–504. [Google Scholar] [CrossRef]
  19. Xu, J.; Zhang, X.; Wang, P.; Zhu, F. Study on the effects of the machining process on porous bronze morphology via fractal dimension and pore parameters. Precis. Eng. 2024, 89, 252–261. [Google Scholar] [CrossRef]
  20. Wang, Q.; Liang, Z.; Wang, X.; Zhao, W.; Wu, Y.; Zhou, T. Fractal analysis of surface topography in ground monocrystal sapphire. Appl. Surf. Sci. 2015, 327, 182–189. [Google Scholar] [CrossRef]
  21. Liu, T.; Zhang, P.; Su, Y.; Sun, Y. Fractal analysis on the surface topography of monocrystalline silicon wafers sawn by diamond wire. Mater. Sci. Semicond. Process. 2024, 180, 108588. [Google Scholar] [CrossRef]
  22. Stemp, W.J.; Stemp, M. Documenting stages of polish development on experimental stone tools: Surface characterization by fractal geometry using UBM laser profilometry. J. Archaeol. Sci. 2003, 30, 297–316. [Google Scholar] [CrossRef]
  23. Lai, Z.; Liao, X.; Yang, H.; Hu, Z.; Huang, H. Experimental study on the formation mechanism of saw marks in wire sawing. Int. J. Mech. Sci. 2024, 265, 108894. [Google Scholar] [CrossRef]
  24. ISO 25178-2:2021; Geometrical Product Specifications (GPS)—Surface Texture: Areal—Part 2: Terms, Definitions and Surface Texture Parameters. International Organization for Standardization: Geneva, Switzerland, 2021.
  25. Blateyron, F. The areal field parameters. In Characterisation of Areal Surface Texture; Springer International Publishing: Cham, Switzerland, 2024; pp. 15–46. [Google Scholar]
  26. Falconer, K. Fractal Geometry: Mathematical Foundations and Applications; Wiley: New York, NY, USA, 1990. [Google Scholar]
  27. Zhang, S.; Li, Y.; Wang, G.; Qi, Z.; Zhou, Y. A novel method for calculating the fractal dimension of three-dimensional surface topography on machined surfaces. Chaos Solitons Fractals 2024, 180, 114573. [Google Scholar] [CrossRef]
  28. Feng, W.; Chu, X.; Hong, Y.; Deng, D. Surface morphology analysis using fractal theory in micro electrical discharge machining. Mater. Trans. 2017, 58, 433–441. [Google Scholar] [CrossRef]
  29. Li, Y.; Zheng, G.; Chen, Y.; Hou, L.; Ye, C.; Chen, S.; Huang, X. Multi-objective optimization of surface morphology using fractal and multi-fractal analysis for dry milling of AISI 4340. Measurement 2023, 222, 113574. [Google Scholar] [CrossRef]
  30. Kong, Y.L.; Muniandy, S.V.; Fakir, M.S.; Sulaiman, K. Morphological image interpretation of organic nickel(II) phthalocyanine-tetrasulfonic acid tetrasodium film using fractal analysis. Appl. Surf. Sci. 2014, 301, 363–368. [Google Scholar] [CrossRef]
  31. Russ, J.C. Fractal Surfaces; Plenum: New York, NY, USA, 1994. [Google Scholar]
  32. Dubuc, B.; Quiniou, J.F.; Roques-Carmes, C.; Tricot, C.; Zucker, S.W. Evaluating the fractal dimension of profiles. Phys. Rev. A 1989, 39, 1500–1512. [Google Scholar] [CrossRef] [PubMed]
  33. Thomas, T.R. Rough Surfaces; Imperial College Press: London, UK, 1999. [Google Scholar]
  34. Ghasemi, S.; Khamehchiyan, M.; Taheri, A.; Nikudel, M.R.; Zalooli, A. Crack evolution in damage stress thresholds in different minerals of granite rock. Rock Mech. Rock Eng. 2020, 53, 1163–1178. [Google Scholar] [CrossRef]
  35. Li, J.; Peng, J.; Ranjith, P.G.; Li, Y. Energy Partitioning Evolution and Crack Interaction in Granite Under Sequential Thermal and Mechanical Loading. Rock Mech. Rock Eng. 2025, 59, 3133–3152. [Google Scholar] [CrossRef]
  36. Bigerelle, M.; Berkmans, F.; Lemesle, J. Evaluating the Fractal Pattern of the Von Koch Island Using Richardson’s Method. Fractal Fract. 2025, 9, 483. [Google Scholar] [CrossRef]
  37. Wang, J.; Sun, Z.; Li, Q. Fractal characterization on anisotropy and fractal reconstruction of rough surface of granite under orthogonal shear. Powder Technol. 2020, 371, 142–152. [Google Scholar]
Figure 1. Granite surface morphology (a): macroscopic morphology; (b): local magnification image.
Fractalfract 10 00276 g001
Figure 2. Equipment processing photo and processing schematic diagram. (a) Processing schematic diagram from the perspective of arrow A in Figure (b) (left view); (b) equipment processing photo; (c) cutting area photo; (d) appearance of saw wire; (e) cutting schematic diagram of the workpiece.
Fractalfract 10 00276 g002
Figure 3. The surface characteristics of granite sawn by diamond under the combination of the 7th group of process parameters: (a) surface morphology; (b) three-dimensional surface morphology diagram; (c) cross-sectional profile in the direction of saw wire speed in the middle section; (d) cross-sectional profile in the direction of feed speed in the middle section; (e) wavy profile curve and PV diagram of the cross-sectional surface in the direction of feed speed.
Fractalfract 10 00276 g003
Figure 4. (a) Schematic diagram of the cross-sectional profile curve of the granite surface along the saw wire velocity direction obtained by sawing with the two-dimensional fractal dimension box-counting method under the combination of the 5th group of process parameters. (b) Calculation result of the two-dimensional fractal dimension D of the cross-sectional profile curve.
Fractalfract 10 00276 g004
Figure 5. (a) Schematic diagram of the three-dimensional fractal dimension box-counting method applied to the granite surface sawn under the combination of the 9th set of process parameters. (b) Calculation result of the three-dimensional fractal dimension D of the sawn granite surface.
Fractalfract 10 00276 g005
Figure 6. Surface morphologies of granite sawn by diamond wire saws with different process parameters: (a) No. 1, (b) No. 2, (c) No. 3, (d) No. 4, (e) No. 5, (f) No. 6, (g) No. 7, (h) No. 8, (i) No. 9.
Fractalfract 10 00276 g006aFractalfract 10 00276 g006b
Figure 7. Correlation between the 3D fractal dimension (3D FD) and surface topographical parameters: (a) profile parameter Ra; (b) profile parameter PV; (c) areal parameter Sa; (d) areal parameter Sq.
Fractalfract 10 00276 g007
Figure 8. Schematic diagram of the cross-sectional contour.
Fractalfract 10 00276 g008
Figure 9. 2D FD distribution with different included angles θ (°). (a) 2D FD distribution with different included angles θ for NO. 1, 2, 3. (b) 2D FD distribution with different included angles θ for NO. 4, 5, 6. (c) 2D FD distribution with different included angles θ for NO. 7, 8, 9.
Fractalfract 10 00276 g009
Figure 10. Cross-sectional profiles along and perpendicular to the feed direction under different two-dimensional fractal dimensions, as well as their corresponding parameter combinations. (a) The cross-sectional profiles with different 2D FDs along the feed direction. (b) The cross-sectional profiles with different 2D FDs along the feed direction.
Fractalfract 10 00276 g010
Table 1. The parameters of saw wire.
ParametersValue
Diamond wire length (m)65
Maximum envelope outer diameter of the saw wire (μm)350
Type of abrasive grainNickel-plated diamond surface (25% weight gain)
Size of abrasive grain (μm)30–40
Density of abrasive particle distribution (grits/mm)70–80
Table 2. Experimental design table.
No.Vs (m/min)Vf (mm/min)L (mm)
110000.510
212001.030
314001.550
410001.050
512001.510
614000.530
710001.530
812000.550
914001.010
Table 3. Experimental result table.
No.3D FDRaPVSaSq
12.331.0033.07631.09441.3612
22.32930.99863.10361.06541.3473
32.32451.20334.04271.26751.5801
42.31411.38104.59311.46141.8141
52.31641.31434.01551.39721.7483
62.35910.81462.17900.94381.2908
72.26611.40934.64851.61551.8422
82.31721.27433.87791.34081.6885
92.33450.86772.25620.93271.2027
Table 4. Results of circular variance.
No. V
10.9962
20.9961
30.9978
40.9928
50.9881
60.9919
70.9894
80.9927
90.9941
Disclaimer/Publisher’s Note: The statements, opinions and data contained in all publications are solely those of the individual author(s) and contributor(s) and not of MDPI and/or the editor(s). MDPI and/or the editor(s) disclaim responsibility for any injury to people or property resulting from any ideas, methods, instructions or products referred to in the content.