Article

Physics of the Unsteady Response of Turbine Cascade to Pulsed Flow Conditions †

Departement d’Aerodynamique, Energetique et Propulsion (DAEP), ISAE-SUPAERO, Universite de Toulouse, 10 Avenue Edouard Belin BP 54032, 31055 Toulouse Cedex 4, France
*
Author to whom correspondence should be addressed.
This manuscript is an extended version of our paper published in the proceedings of the 15th European Turbomachinery Conference, Budapest, Hungary, 24–28 April 2023.
Int. J. Turbomach. Propuls. Power 2024, 9(2), 19; https://doi.org/10.3390/ijtpp9020019
Submission received: 9 November 2023 / Revised: 1 April 2024 / Accepted: 9 April 2024 / Published: 27 May 2024

Abstract

:
The present contribution is in direct continuation of previous work which aimed at demonstrating the possible benefit of the unsteady feeding of turbines. Some numerical analyses of the flow inside a skeletal cascade revealed that instantaneous overloading occurs on the blades. However, such an academic case is far from a realistic configuration. The present paper investigates the influence of a simplified thickness distribution to check whether the instantaneous benefit is still observed. Based on numerical simulations, an analysis of the physical origin of the overloading is proposed on a single blade. It results in the choice of a triangular thickness distribution, which should promote the physical phenomena responsible for the overloading. A parametric study of such a distribution demonstrates that it is possible to obtain instantaneous performance very close to the optimum of the flat plate. Conclusions drawn from the single-blade analysis are extended to cascades and stator–rotor configurations and show an increase in the complexity of physical phenomena. Ultimately, the aim is to optimize the geometric shape to obtain maximum overloading. Consequently, the same type of study was carried out for the expansion phase, and similar results were obtained.

1. Introduction

The performance of turbines in unsteady flow is the subject of long-term research. Very active in turbocharging, it is currently also stimulated by the prospect of breakthroughs in aeronautical propulsion [1,2,3,4]. Engine cycles with constant volume combustion (CVC) should improve the thermal efficiency of such devices, at least on the theoretical ground. George et al. [5] demonstrates that some experimental evidence of such an improvement exists. The conception of those engines (e.g., pulsating detonation engine, rotating detonation engine, etc.) requires turbines adapted to supersonic flows, unsteady feeding, or both. Regarding unsteadiness, the expectation is a penalty on efficiency, which is one of the technical issues regarding CVC engines. Indicators quantifying the mean efficiency or the detailed comprehension of the instantaneous performance are still discussed in the literature. Many technologies exist and each has its advantages and disadvantages: some use deflagration, while others are based on detonation phenomena. Some have no valve system, like the wave rotor, while others do (shockless explosion, PDE, etc.). The unsteady character of pulsed flows is poorly represented in the literature. The present study seeks to optimize the potential of the Humphrey cycle. The aim is not to start from an existing technology and improve it, but to understand and characterize the physics involved. Once the physics are better understood in academic cases, the question arises of how to implement them in a more industrial configuration. Based on an analysis of the wave propagation, Hermet [6] demonstrated that the instantaneous overloading of the blades occurs inside a skeletal cascade. Numerical simulations on more realistic geometries, such as radial turbines [7], also predict it. Those observations open the ground to turbine designs, promoting the overloading and taking benefits of the unsteadiness. The present paper is in direct continuation of this work. It aims at (i) identifying the physical origin of the overloading on a single airfoil case and (ii) proposing a gradual evolution in the complexity of the geometry toward more realistic configurations. The first part of the paper describes some fundamental behaviors of wave propagation along walls. Then, the methodology is synthetically described. The third one depicts the overloading generation along a flat plate. Those observations are used to propose the thickness distribution, which should preserve the overloading. The fourth part of the paper describes a parametric study performed on a single triangular airfoil. In the last part of the paper, the optimum airfoil is tested inside the full-stage configurations. The main purpose of this paper is to seek a thickness distribution that will preserve the driving physics of the overloading. In the longer term, the aim is to characterize and optimize overloading in a pulsed flow. A pulsed flow consists of alternating valve opening and closing. During the valve opening phase, there is a large temperature and pressure difference between the combustion chamber and the turbine section. A shock wave will, therefore, propagate to inform the rest of the field. This is why it is important to characterize the behavior of different geometries during expansion wave propagation.

2. Methodology

2.1. Physical Origin of the Overloading

A simplified configuration helps illustrate the physics producing the overloading. Let us consider a flat plate with positive incidence in inviscid flow. An unsteady shock wave, normal to the upstream flow direction, propagates and impinges the plate. On the pressure and suction side of the plate, some reflections appear. Many types of reflection exist, and they are extremely well detailed in the work of [8].
However, it is possible to understand the basic mechanism without entering into a detailed characterization of the reflection type. Figure 1 is an illustration of the configuration observed on both the pressure side (a) and the suction side (b) of the plate. The shock wave propagates from left to right. Its frame of reference is used to evaluate the velocity vectors in the different regions of the flow (0), (1) and (2).
On the pressure side of the plate, Figure 1 (left), the incident shock wave i deflects the velocity from its initial direction, toward the wall. A reflected shock r is thus required to recover the proper direction, imposed by the plate, provoking a strong pressure rise in region (2). On the suction side, Figure 1 (center), the opposite mechanism occurs.
On the suction side ( P 2 > P 1 ), Figure 1 (center), the shock is curved and weakened by the interaction of an expansion on the suction side, issued from either the plate leading edge or the wall curvature. This results in a lesser upper pressure ( P 2 < P 1 ). In the fixed frame of reference, this shock diffraction results in a local deceleration of the shock wave, which suffers a delay compared with the one propagating along the lower part of the plate. This delay has the following two consequences.
  • A portion of the flat plate, the length [a,b] in Figure 1 (right), is submitted to a strong difference of pressure during the propagation of the shock-wave.
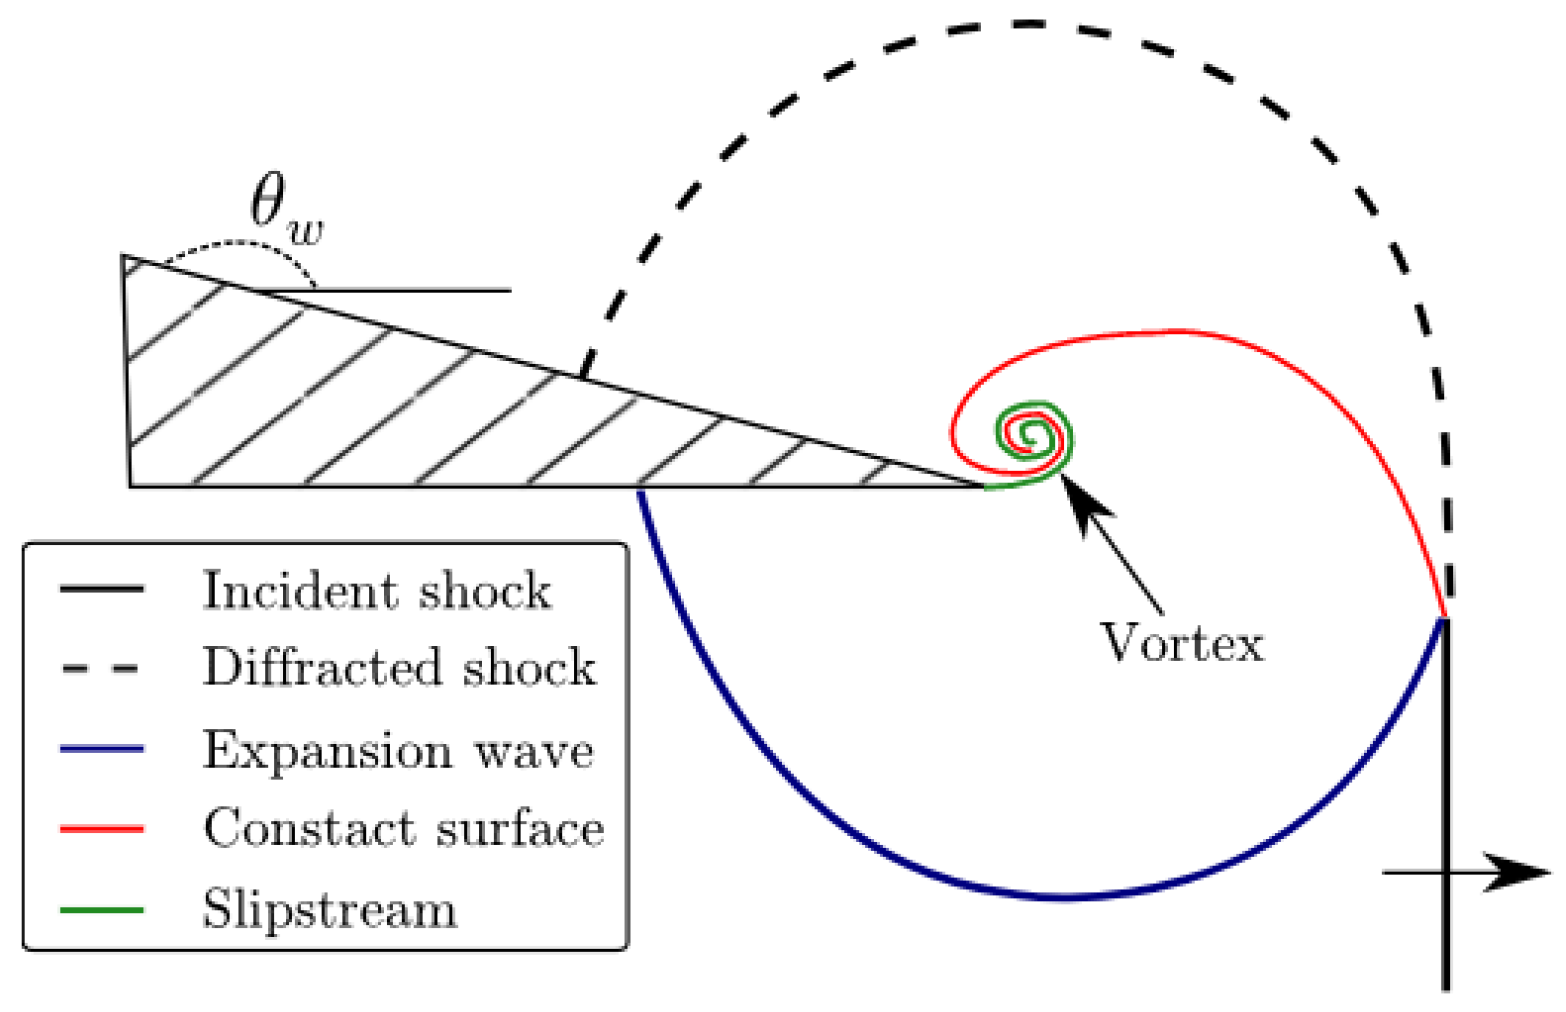
  • The lower shock will arrive first at the trailing edge, diffract and generate vorticity. This is indicated in Hermet [6] and shown in Figure 2.
Concerning this last phenomenon, as explained above, there is a delay between the arrival of the wave at the trailing edge depending on whether it is on the pressure side or the suction side. There is a significant widening of the passage cross-section when the wave arrives at this end: the shock wave diffracts. This phenomenon has a number of notable effects, which have a direct impact on the force and therefore on the performance of the case studied. Firstly, the flow is detached from the wall due to the excessive angle. A vortex appears at the trailing edge and moves into the flow (in green in Figure 2). In addition, the flow does not have the same history between the pressure side and the suction side. The two sides have not been subjected to the same shocks and this is a non-isentropic phenomenon. A contact discontinuity therefore appears (in red in Figure 2).
The first consequence is the physical reason for the overloading. The second one may become an issue for configurations in which there is a succession of rows. The promotion of the overloading thus requires a reflection as intense as possible on the pressure side, together with the strongest possible local deceleration of the shock on the suction side. Both phenomena are linked to the angle of the wall, and it is easily understood that a flat plate is an optimal geometry, since it maximizes both at the same time.
Two-dimensional numerical simulations are used to observe and analyze such a generic pattern and its consequences on different geometric configurations. The numerical setup is now detailed.

2.2. Numerical Method

2.2.1. Geometries Investigated

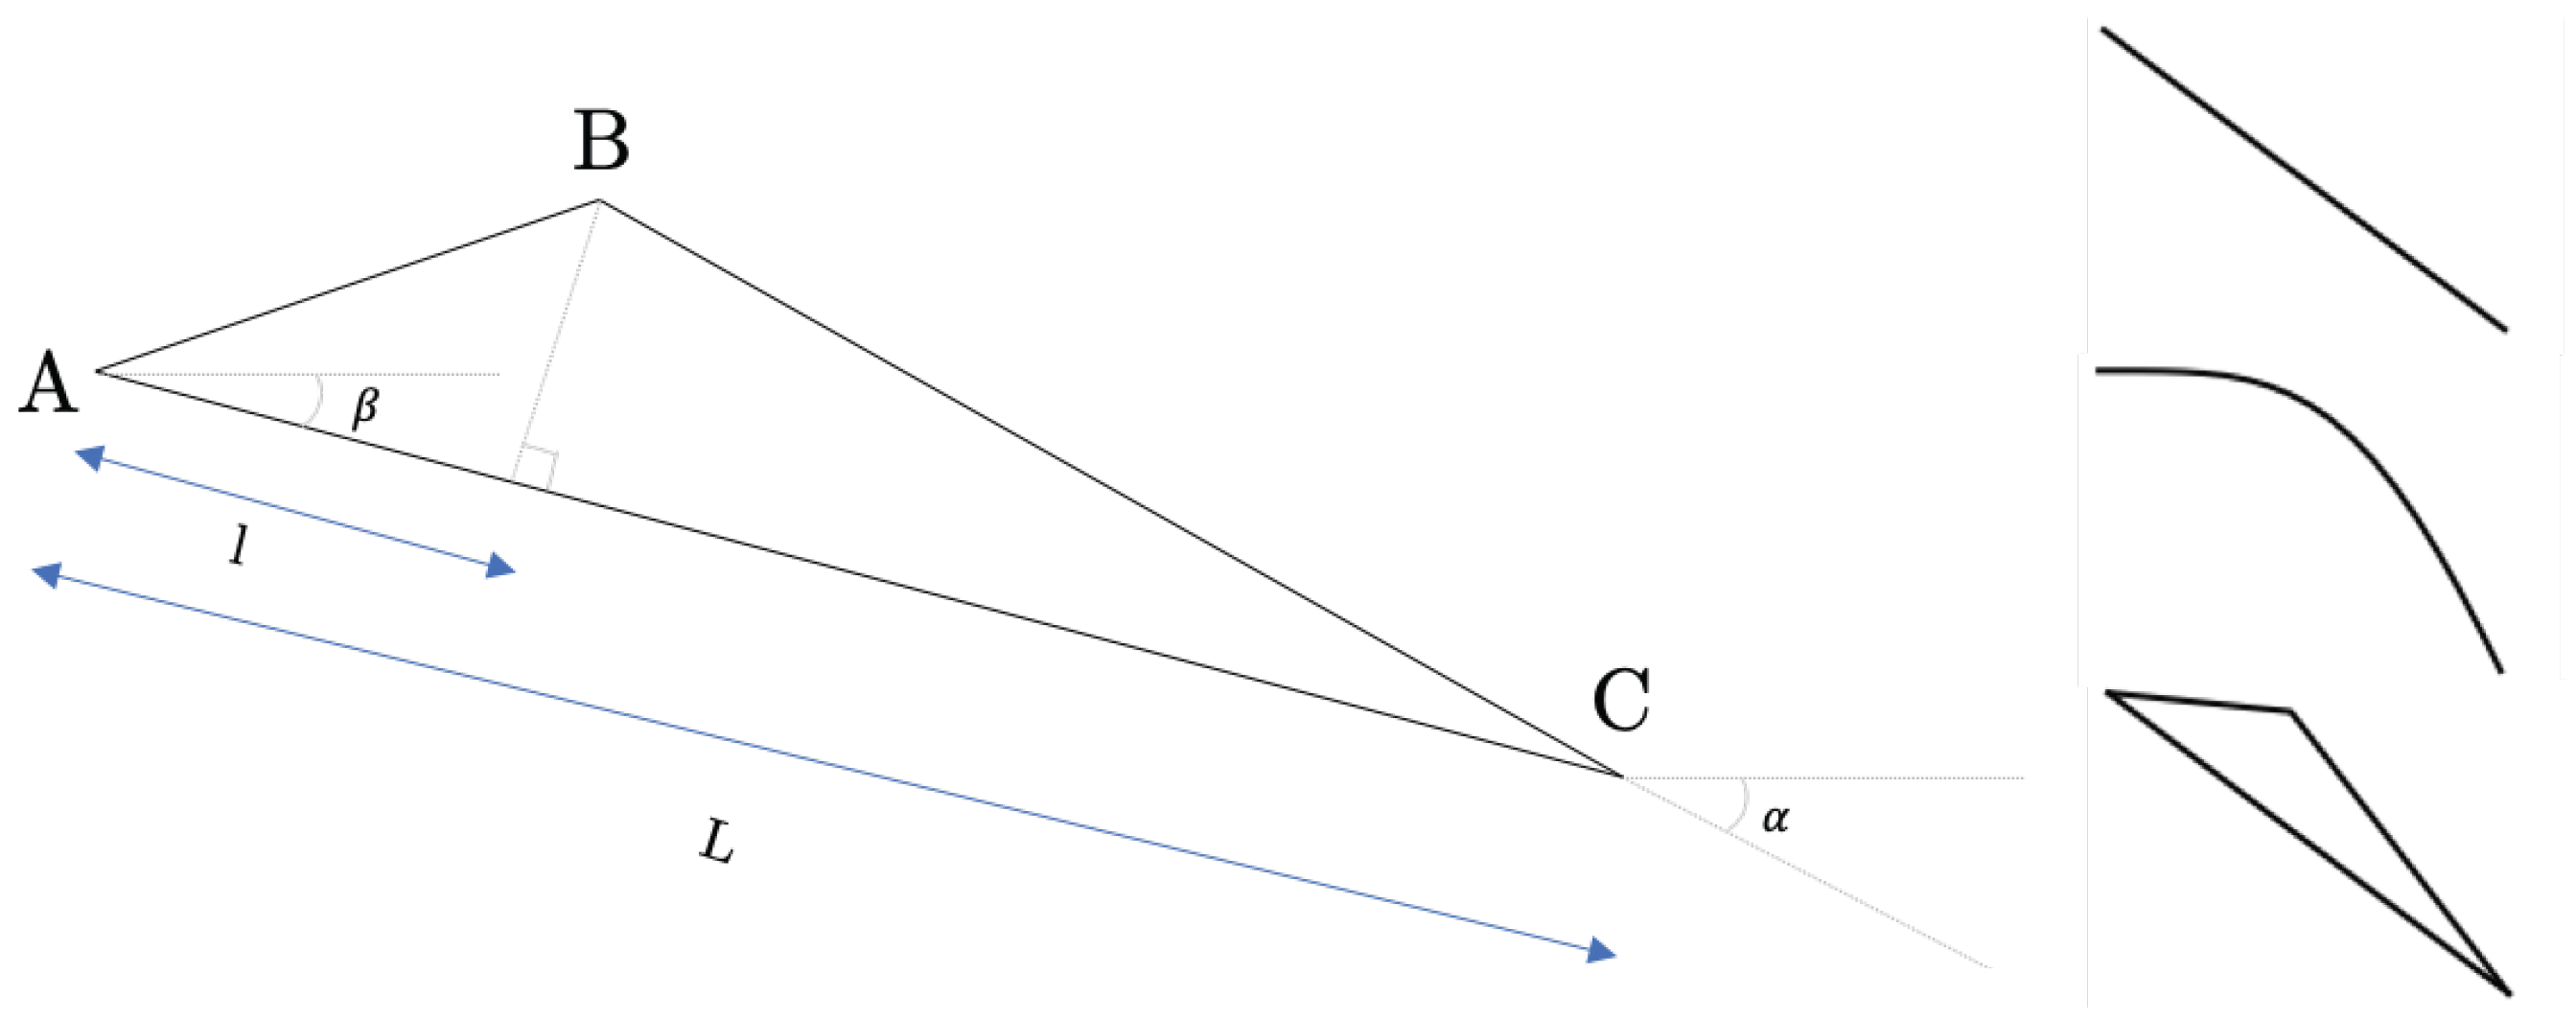
Three different families of geometries were investigated so far, as presented in Figure 3. The geometry of the flat plate is used to highlight the leading physics and will be detailed in the following section. The curved plate case was thoroughly investigated by Hermet [6] and will be briefly discussed. The main focus of this paper is the third one: the triangular-shaped blade. This unusual design is the simplest configuration likely preserving the physics aforementioned while having a non-zero thickness distribution. It is an evolution toward more realistic blades. However, it is still an academic case that might not be well-suited for real turbine applications. The sharp angles will presumably affect performance and efficiency in real flow cases, for example, in promoting separation.

2.2.2. Solver

All the numerical simulations are two-dimensional and were performed with the in-house solver IC3 [9]. It is based on the resolution of the compressible formulation of the Navier–Stokes equations in their conservative form, spatially filtered, on an unstructured mesh using a finite volume method. An explicit third-order Runge–Kutta scheme was used for time advancement while an essentially non-oscillatory (ENO) second-order shock-capturing scheme (with HLLC Riemann flux) was applied to compute the flux. The non-conformal and sliding interface, which results from the relative movement between the rotor and stator domains, is treated using a sliding mesh method developed by [10]. The code has been validated on similar cases (pulsed flow) by [11,12] but also by [13]. The mesh is composed of 163,980 cells and a mesh convergence has been performed to ensure good quality and reliability of the simulations. The Richardson method [14] was used to ensure good mesh convergence. This was carried out on the two major quantities of interest in the study, namely lift and entropy. The GCI was calculated using the Fs safety value recommended by [15], i.e., F S = 1.25 . The two GCIs are 1.3% and 0.17%, respectively.
The introduction of this paper recalled the dominant role of wave propagation effects in the transient flows presently analyzed. This dominance has been observed by [6], who proved that the predictions of inviscid simulations are identical to those of large eddy simulations during the transient, regarding the instantaneous pressure distribution and the aerodynamic force provoked by a shock wave propagation on a curved plate. In accordance with this conclusion, only simulations of inviscid flows are presented in the present work.

2.2.3. Numerical Domain

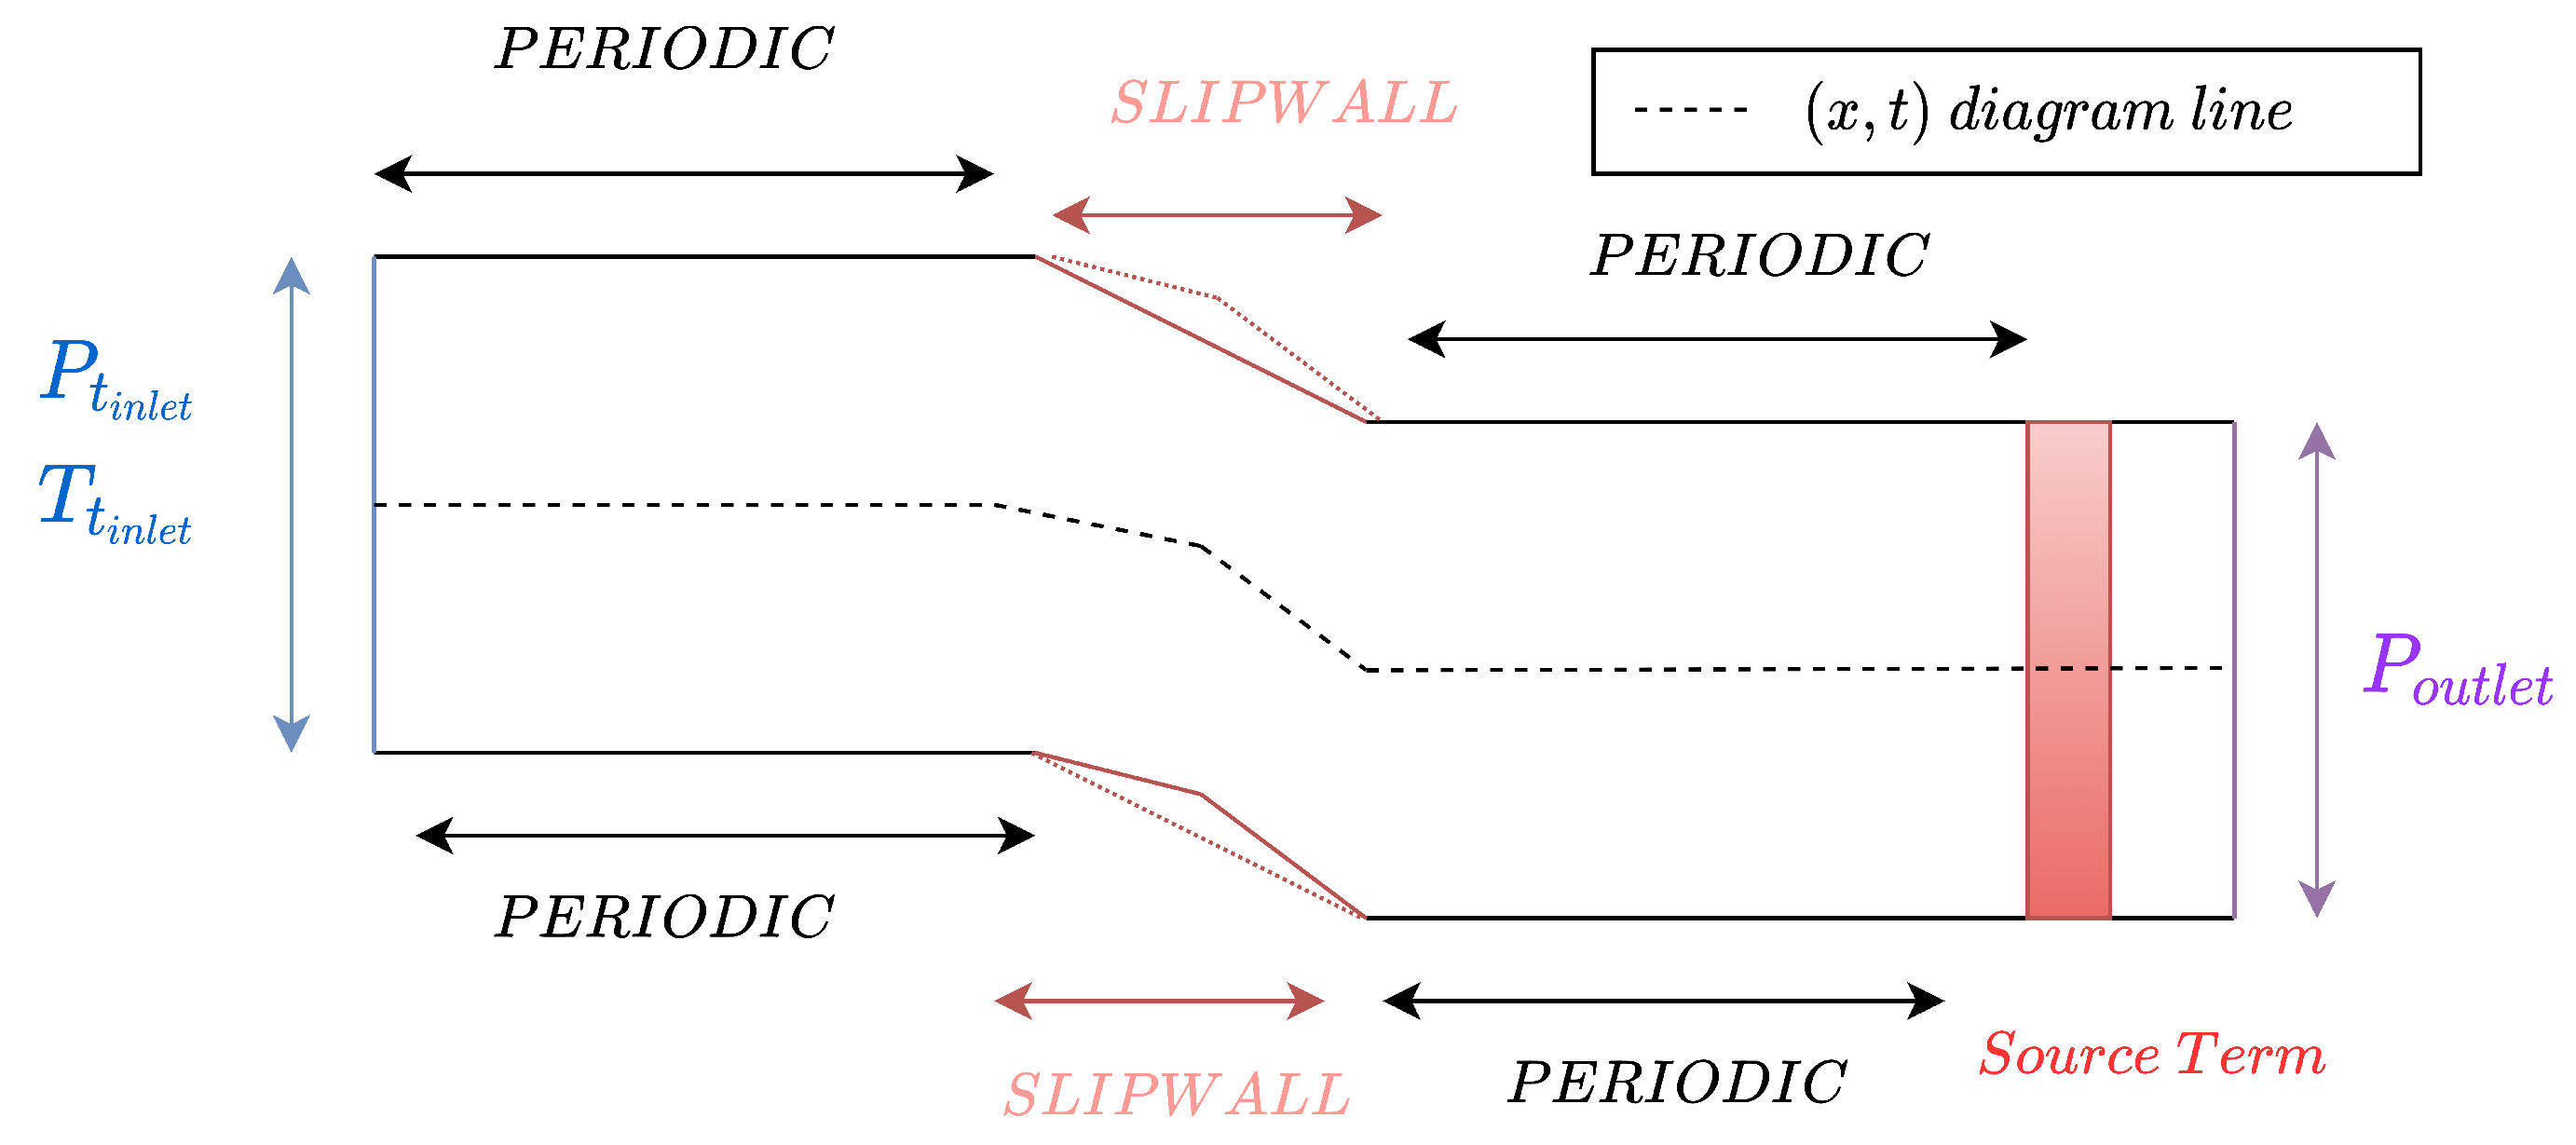
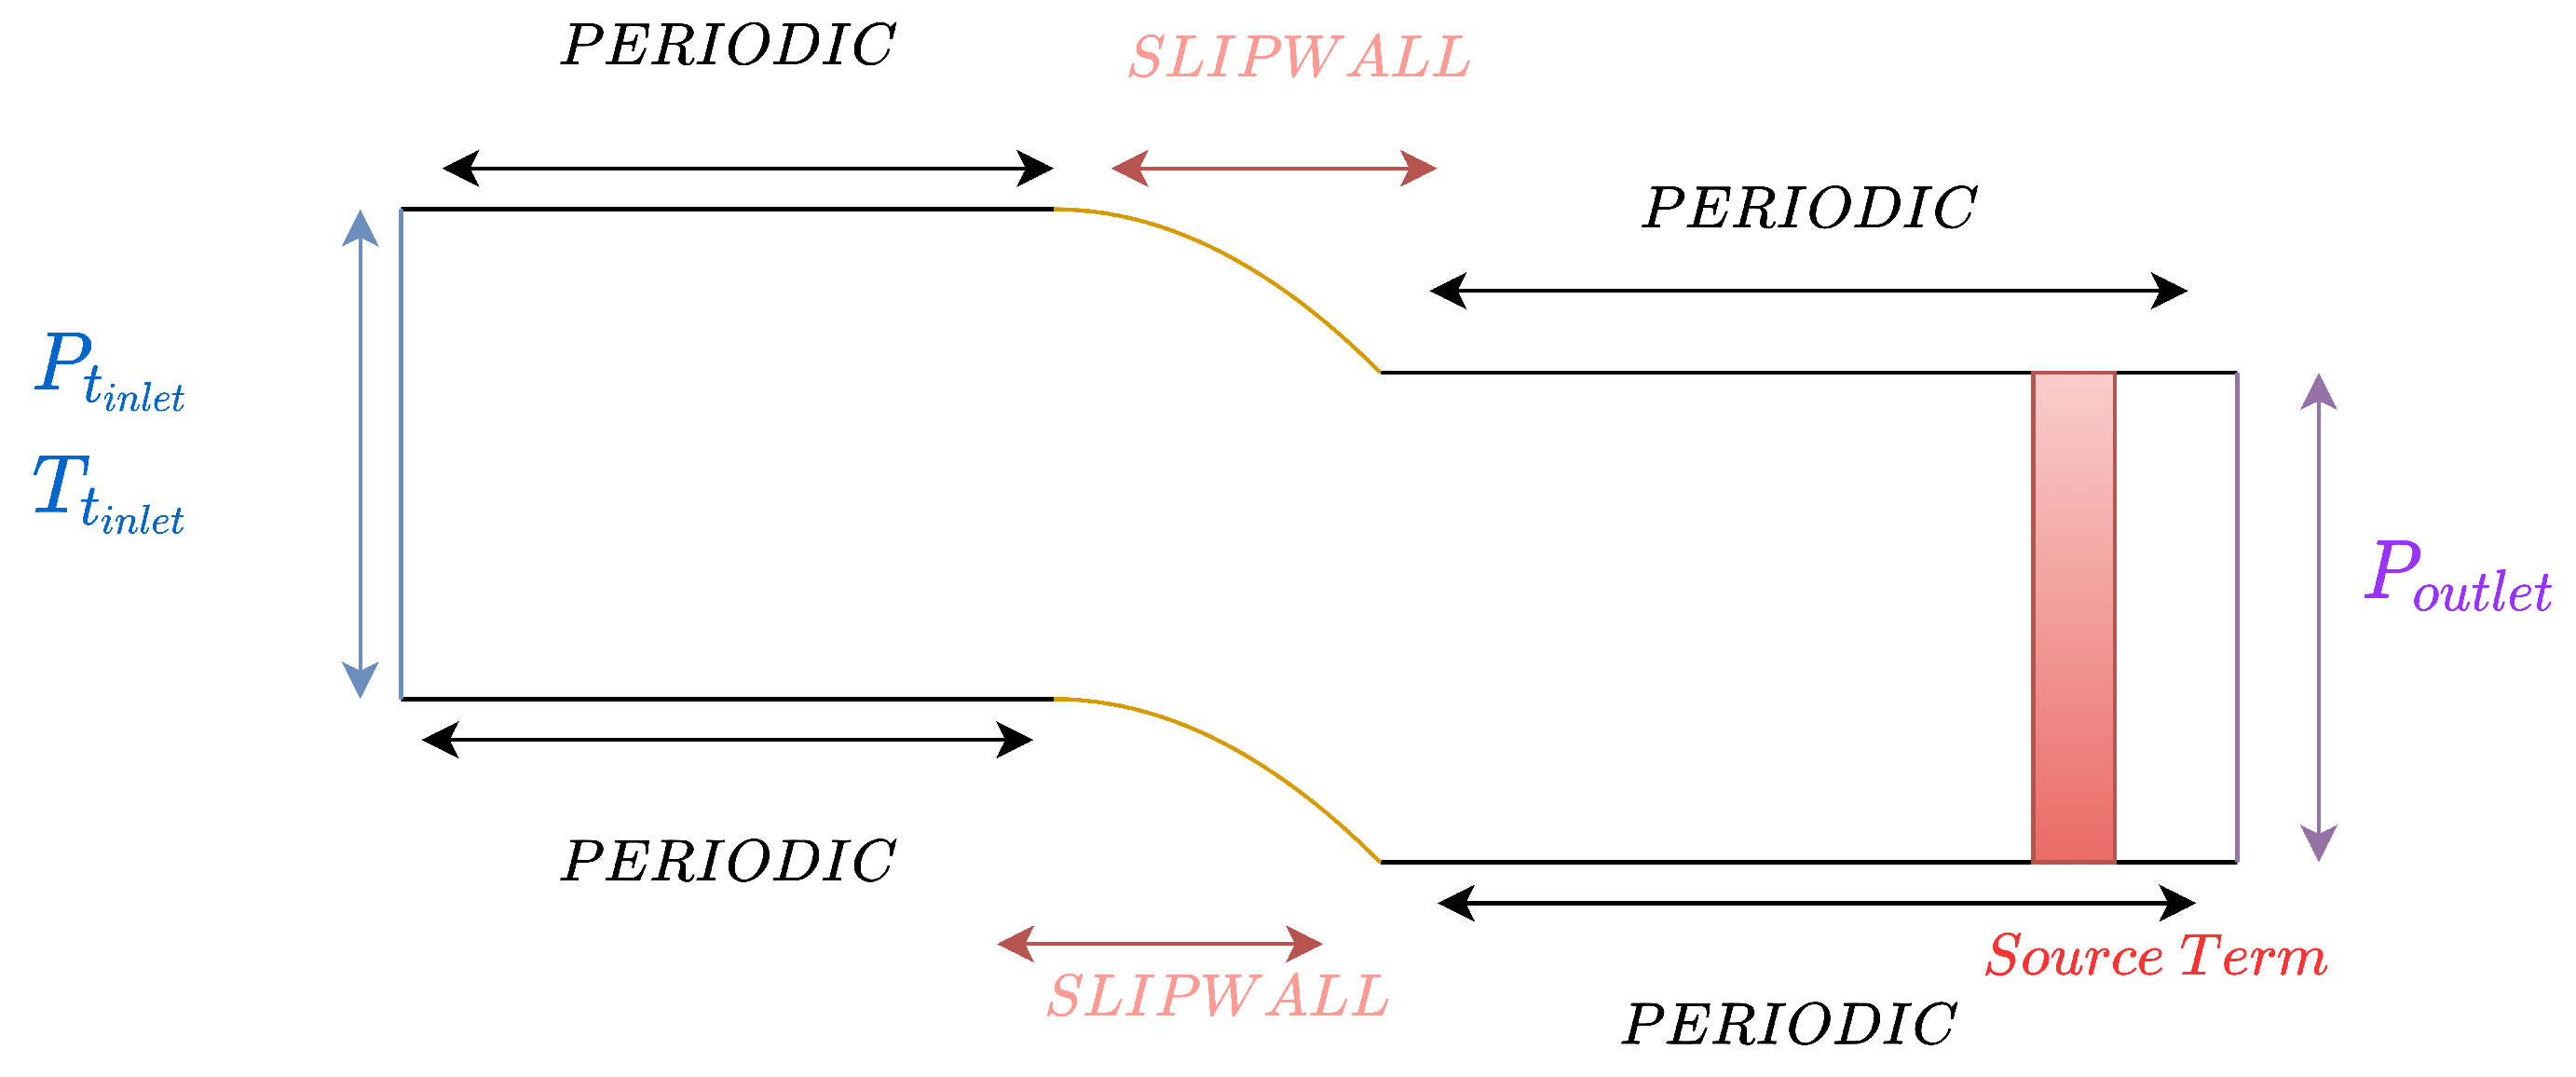
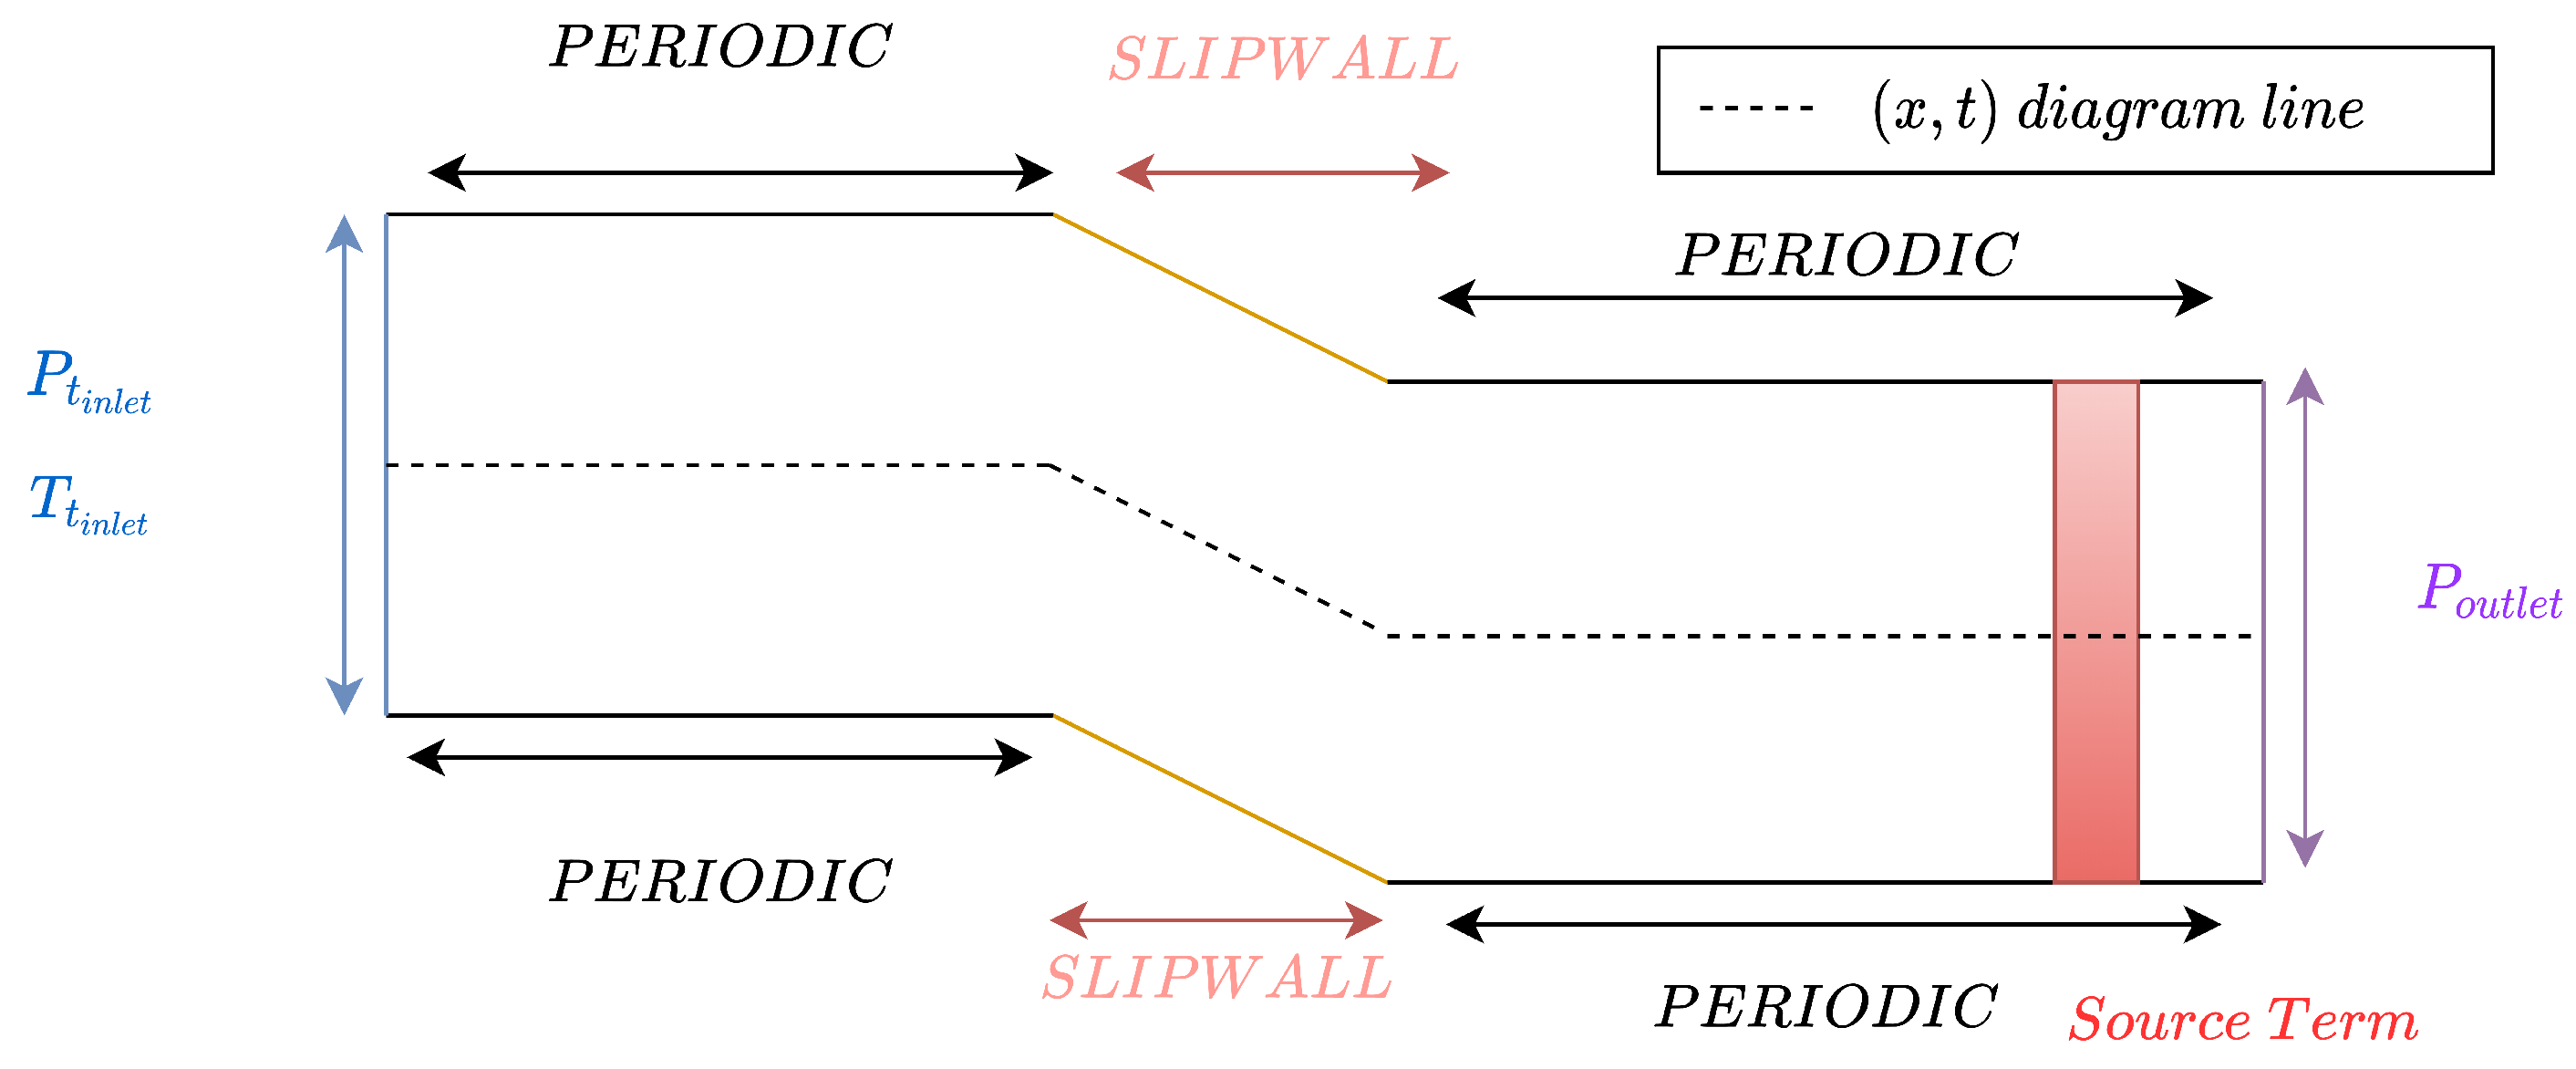
To model a cascade, the numerical domain consists of a single blade with periodicity conditions on the top/bottom boundaries, as illustrated in Figure 4, Figure 5 and Figure 6. The height of the domain thus sets the solidity h / x c of the cascade and will be a parameter of the study. The inlet plane prescribes the total quantities, and the outlet plane imposes the static pressure. The transient phase is initiated through a sudden variation of the inlet total pressure, which results in a shock wave traveling through the domain. The pressure ratio generating the shock is Π = P t i n / P o u t = 2.0 , and the total temperature is T t = 300 K.
This wave will finally interact with the outlet static pressure condition and produce reflections at the outlet condition, which may not have physical significance. A zone, close to the outlet boundary condition, imposes a source term acting as a convergent–divergent nozzle with the aim of obtaining a choked flow (as far as it is possible). This region thus simulates a downstream device: blade row, nozzle, etc. In the following step, a second cascade can be implemented within a moving frame of reference, in order to simulate a complete stage stator–rotor.

2.2.4. Source Term to Model a Converging/Diverging Geometry

As described in the previous theoretical part, an interaction between the outlet boundary condition and the different waves will appear. After reflection, these waves will return to the studied configuration. These non-physical waves will therefore come back and, consequently, distort our analysis. This is why a source term, similar to a converging–diverging geometry, has been added in order to have a Mach number greater than one.
The source term is introduced in Equation (1). Some parameters are introduced like h, initial height of the surface; d, which corresponds to the convergent length; x, the abscissa; and Σ , the ratio of restriction, superior to 1. Since we wish to model the equivalent of a convergent–divergent, the surface equation is given in Equation (2).
Q t + · F = S ( Q )
A ( x ) = h Σ 1 + Σ 1 x d
Either, once derived gives Equation, (3)
1 A ( x ) d A d x = s i g n ( x ) Σ 1 d 1 + Σ 1 x d

3. Results

The aim is to characterize and identify the mechanisms involved in the creation of overloading (or underloading). Two distinct physical phenomena will act: first, the propagation of a shock wave, then the propagation of an expansion wave. For the sake of clarity, the effect of shock wave propagation is first described for increasingly complex configurations (from the flat plate to the triangular configuration with the addition of the rotor part). The analysis of the expansion phase and its possible consequences can be found at the end of this section.

3.1. Results for an Isolated Flat Plate

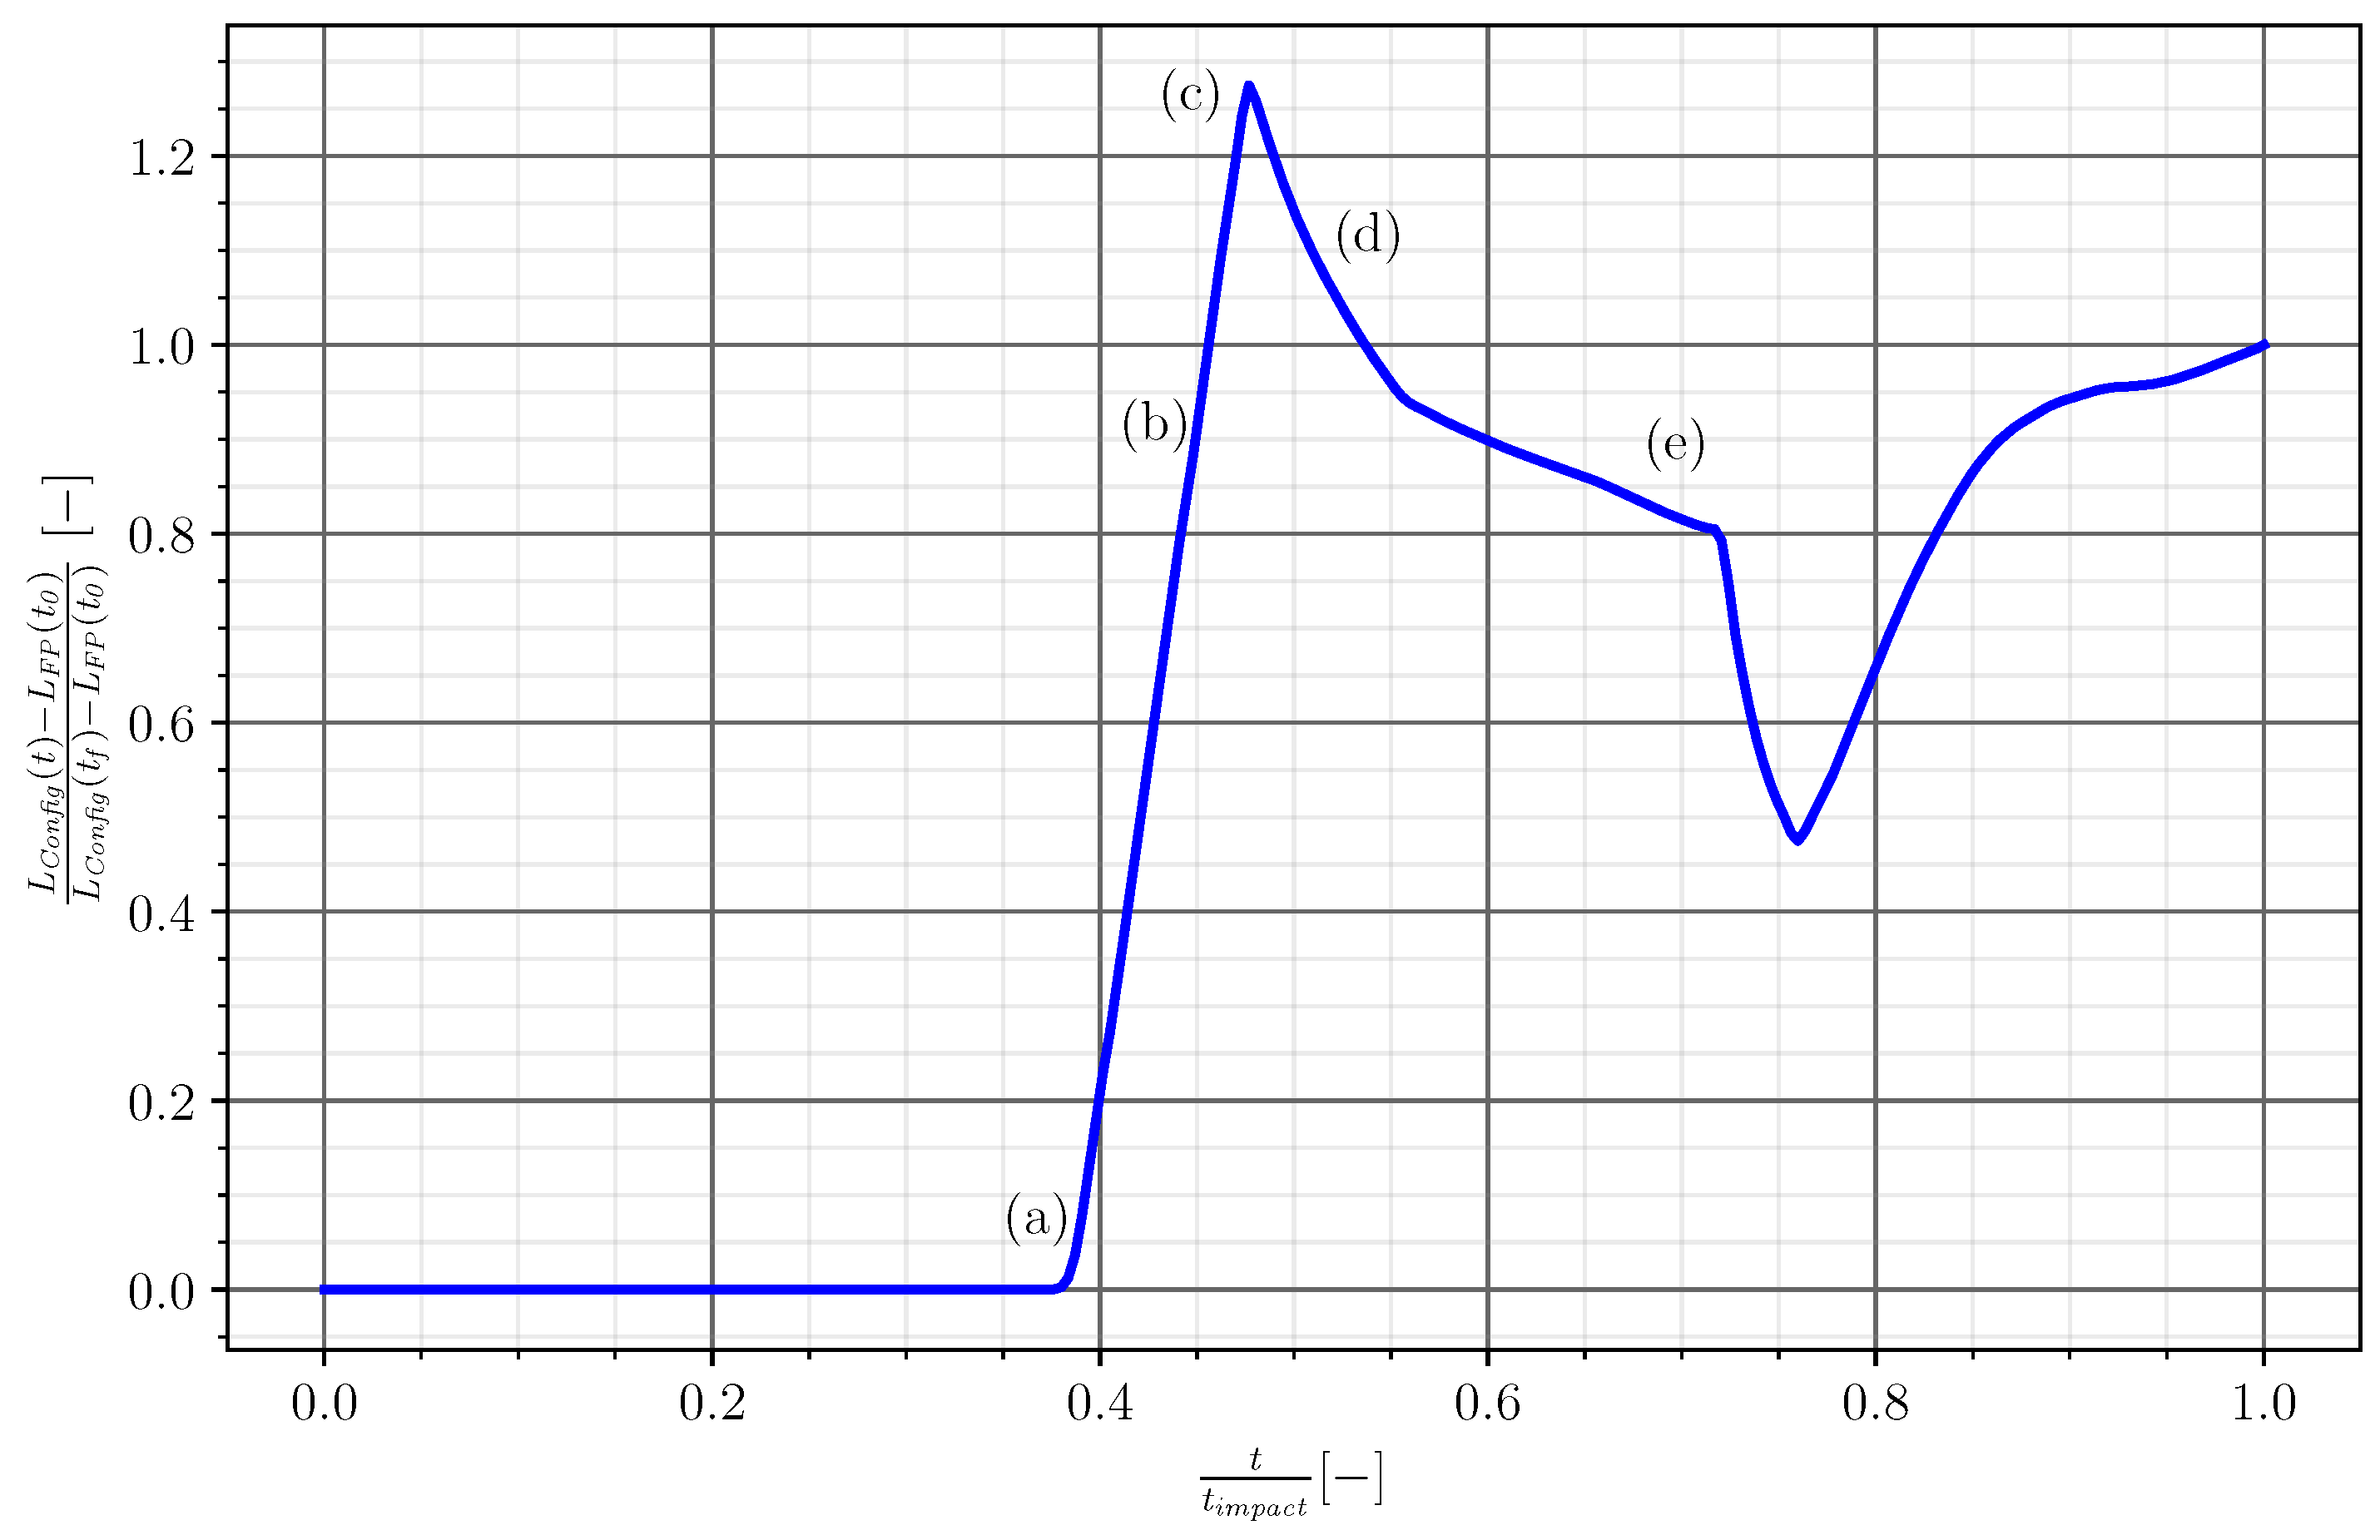
The configuration of the flat plate with incidence (50°) is used as a reference since it naturally maximizes the deviation effects on both the pressure and suction side of the blade. The expected pattern was described in the first part of the paper. Figure 7 presents the evolution of the pressure field for five instants. At (a), the incident shock wave reaches the leading edge of the plate. It propagates on both the pressure and suction side (b), and then reaches trailing edge (c). The two pictures display particularly well the expected pattern described above: the shock reflection induces high pressure on the pressure side and the weakening wave on the suction side of the plate due to the diffraction. The delay between the two waves maintains the additional difference in pressure between the two surfaces. Finally, once the wave reaches the trailing edge, a new diffraction phenomenon appears on the trailing edge (d), then propagates downstream and upstream (e), and affects the two surfaces, reducing the pressure difference. After (e), a decrease is visible. It is due to the reflection wave (coming from the stator above), which impacts the upper surface, and thus, attenuates the pressure difference between both sides.
Figure 8 tracks the aerodynamic force generated on the blade. It depicts the time evolution of the normalized lift ( Lift * ), as the wave propagates along the geometry. The abscissa t / t i m p a c t is a normalized value of the time. t i m p a c t corresponds to the instant when the incident shock wave reaches the outlet boundary condition. The five instants of Figure 7 are quoted along the curve. A sudden increase appears as soon as the wave reaches the leading edge. It reaches a maximum when the lower-side wave reaches the trailing edge, at (c), while the delay between the wave is the most important. The diffraction of the wave at the trailing edge in (d) then reaches both surfaces and provokes a drop of the lift.
This sequence, which is very close to the theoretical expectation, gives a clear explanation of the instantaneous overloading experienced by the blade. However, in the prospect of a realistic design, an actual thickness is required. A triangular shape, such as the one illustrated in Figure 3 is close to a flat plate configuration and has some thickness. This similarity should preserve the propagation pattern creating the overloading. A parametric analysis of this configuration is now presented.

3.2. Parametric Study of the Triangle-Shaped Profile

3.2.1. Design of Experiment Configuration

The high complexity of the flow does not allow us to define a triangular shape, which will maximize the overloading. A parametric study based on the design of experiments (DOE) approach will help screen the parametric space and define the first trends. The main interest of this method is to obtain the maximum information on the right set of parameters while minimizing the number of configurations to be tested. The design type (described by Goupy [16]) is a D-optimal fractional factorial design. Instead of having to test 3 n configurations, which represent all possible combinations of the three values of the parameters, only 3 ( n p ) (n being the number of factors, and p the number of aliased factors) are analyzed.
At this point, only a single non-moving airfoil is considered (single stator row). A triangle geometry is a simple shape, and only three parameters are required. Those are, according to Figure 3:
  • The chordwise position l / L of B on the pressure surface;
  • The trailing edge angle α ;
  • The angle β .
The range selected for those three factors is given in Table 1 and normalized to obtain three “levels”: ( 1 , 0 , + 1 ) .
With three factors, and only one aliased, the plan needs nine configurations, and the central one ( 0 , 0 , 0 ) must also be added. It results in a ten-configuration plan, which is presented in Table 2.

3.2.2. Results of the Design of Experiments

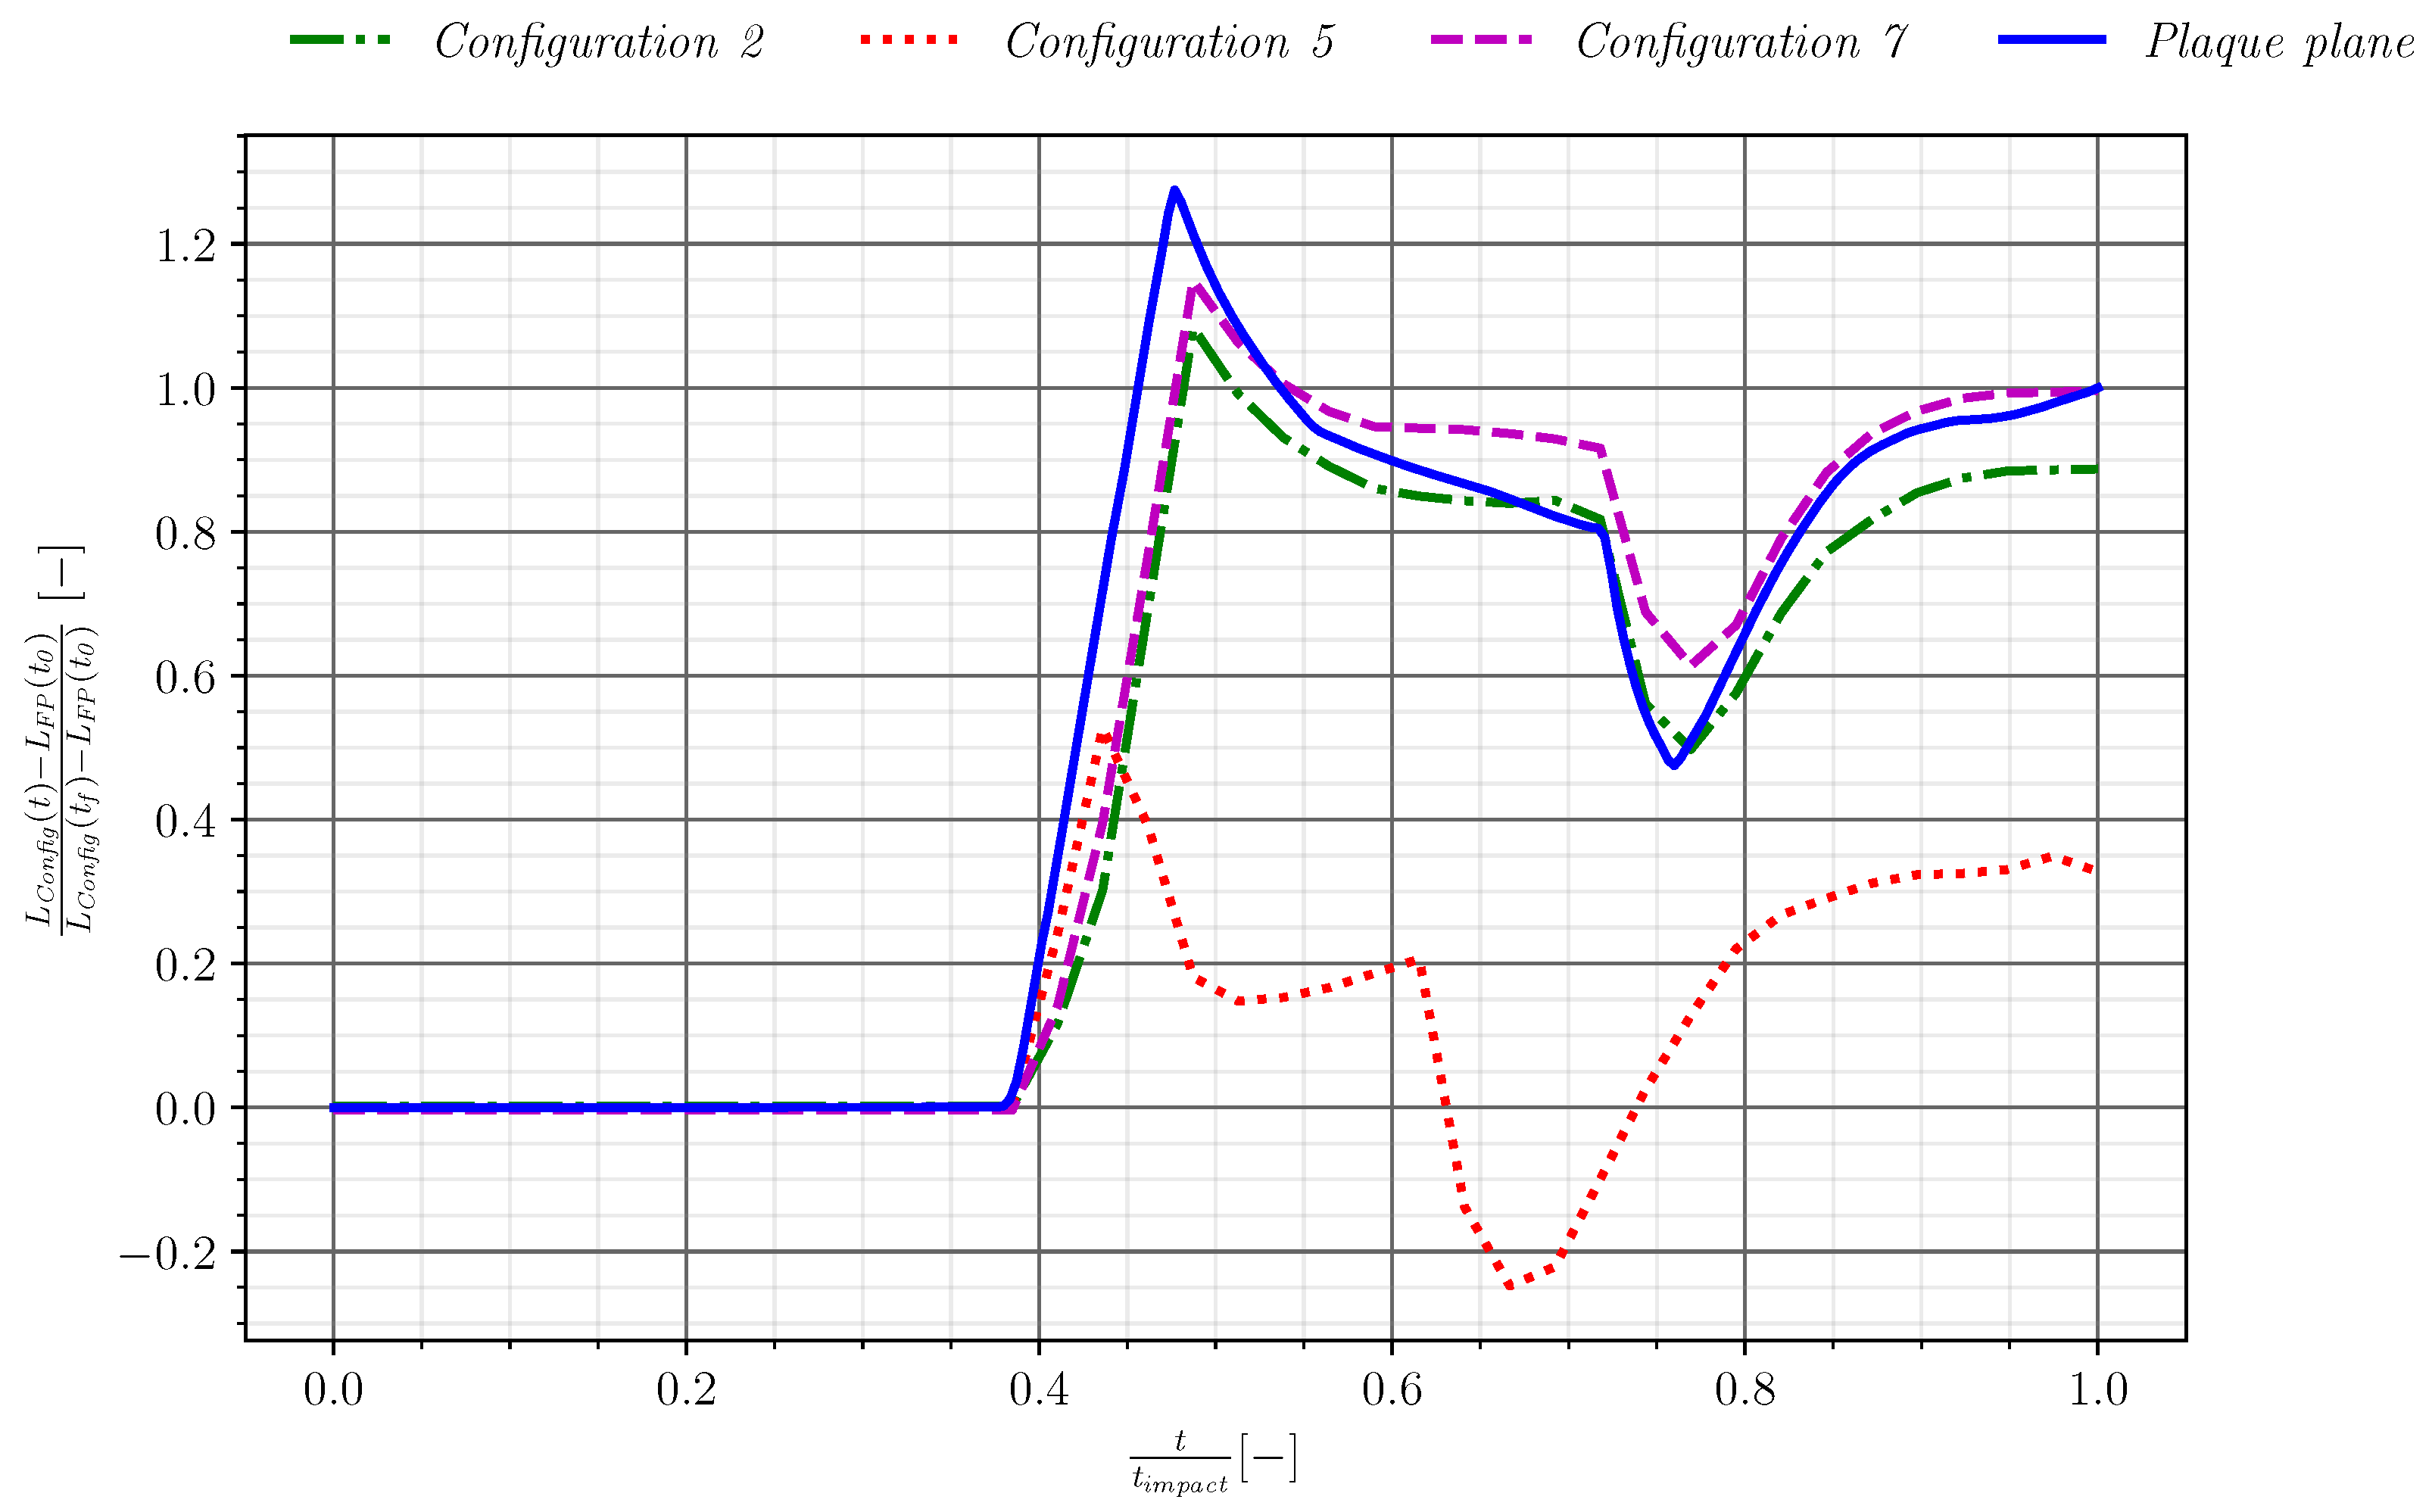
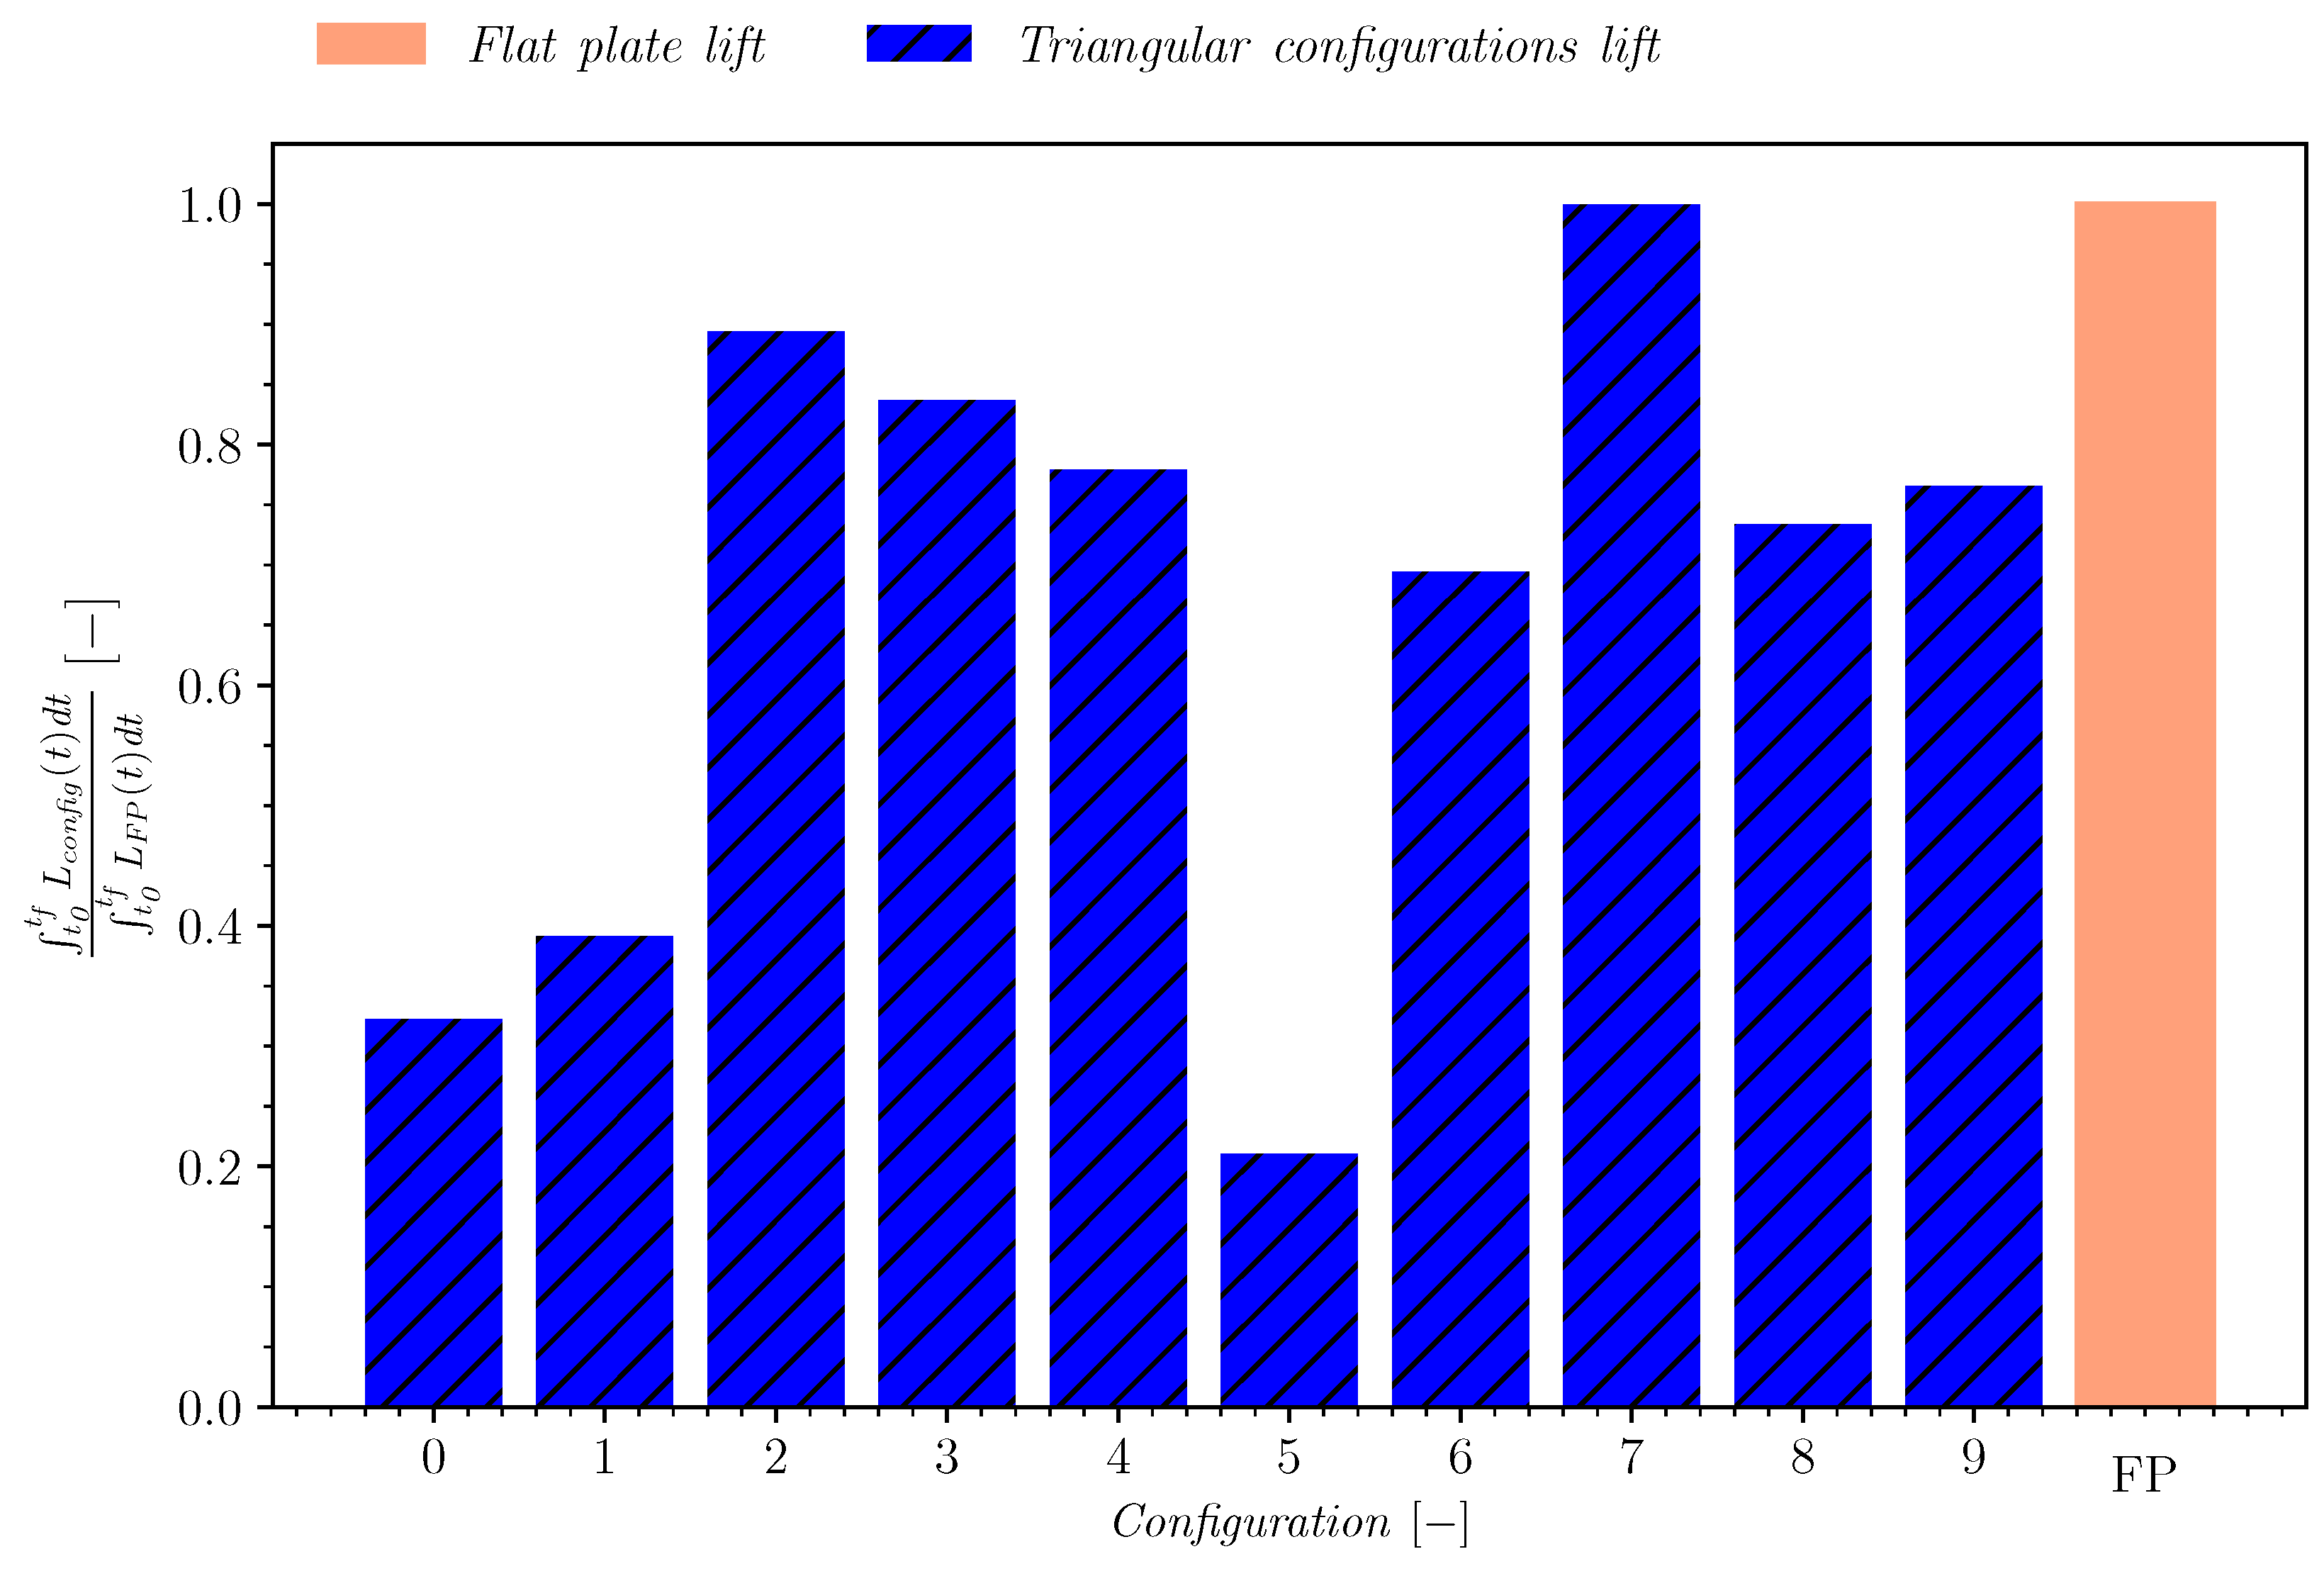
Figure 9 presents the temporal evolution of the loading. Only three curves are presented (among 10) for reasons of readability, and compared with the flat plate case. The overall shape of the curves follows the same pattern, with a sudden rise caused by the shock impact and then a decrease in the loading. The level is, however, very different between these cases. The worst configuration generates an instantaneous negative loading while the best configuration is very close to the flat plate case. A more quantitative comparison is proposed in Figure 10. It represents the integrated loading during the transient phase, for the ten configurations simulated and the flat plate. It exhibits a strong dispersion of the results and confirms that configuration 7 achieves the same performance as the flat plate.
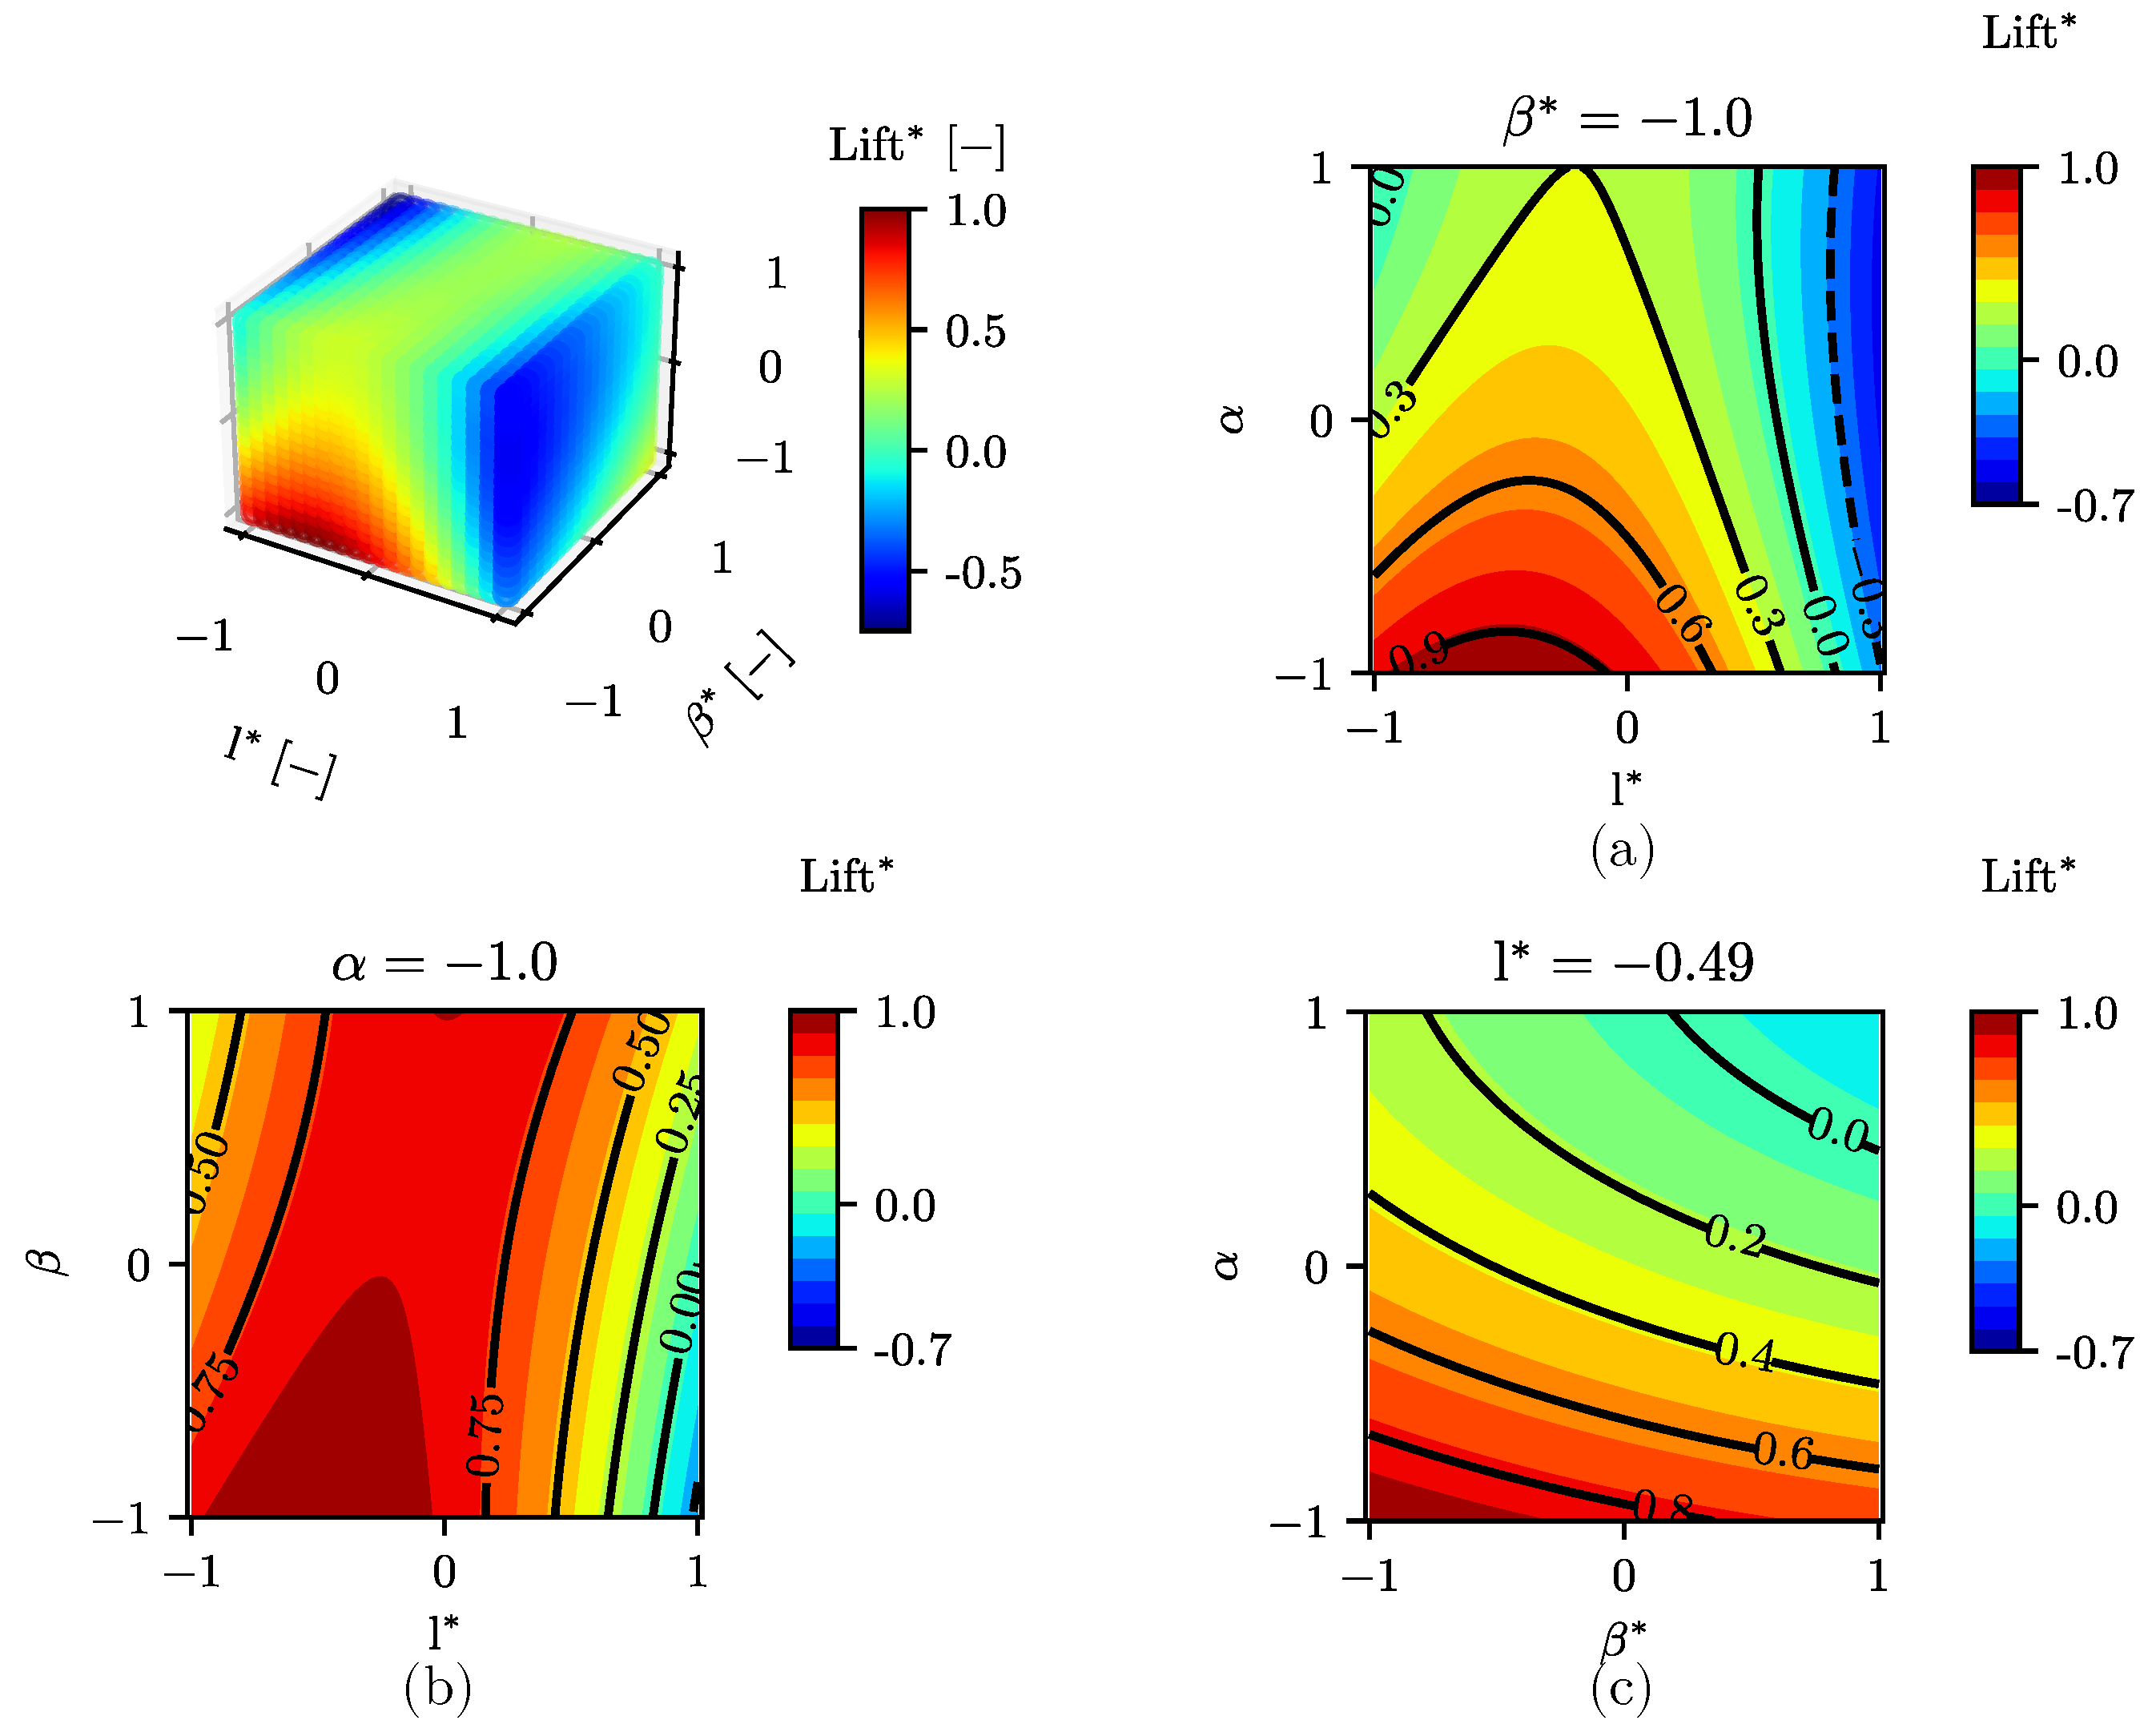
The integrated loading has been postprocessed to extract a model that can be represented by a response surface on Figure 11. For readability reasons, only projections in the plane are represented at a fixed parameter. The value of this fixed parameter is the one that maximizes the loading. Figure 11 shows that low alpha and beta/alpha tend to maximize performance. This is logical because a configuration with high alpha and beta/alpha values leads to a geometry where the various waves, and in particular the shock wave, are faced with a very significant reduction in cross-section and are subject to reflections that are not conducive to maximizing the effort on the triangular configuration. Finally, the length parameter also tends to be minimal, but this is less pronounced than that for the angles mentioned above. This ratio indicates the moment of the first break (which occurs only on the extrados). The upper surface is characterized by two cross-sectional widenings (one at the leading edge and one at the trailing edge). On the leading edge, the cross-sectional widening is less important than on the trailing edge. As a result, diffraction is less significant. Thus, the phenomena shown in Figure 1 (shock weakening and phase lag) are less significant. It, therefore, seems important to minimize this length to reach the slope break and maximize the phenomena shown in Figure 1.
The analysis of the response surface reveals an optimum at l * = 0.49 , α = 1.0 and β * = 1.0 . This optimum is very close to configuration 7 ( 1 , 0 , 1 ) , on which a focus is now proposed.
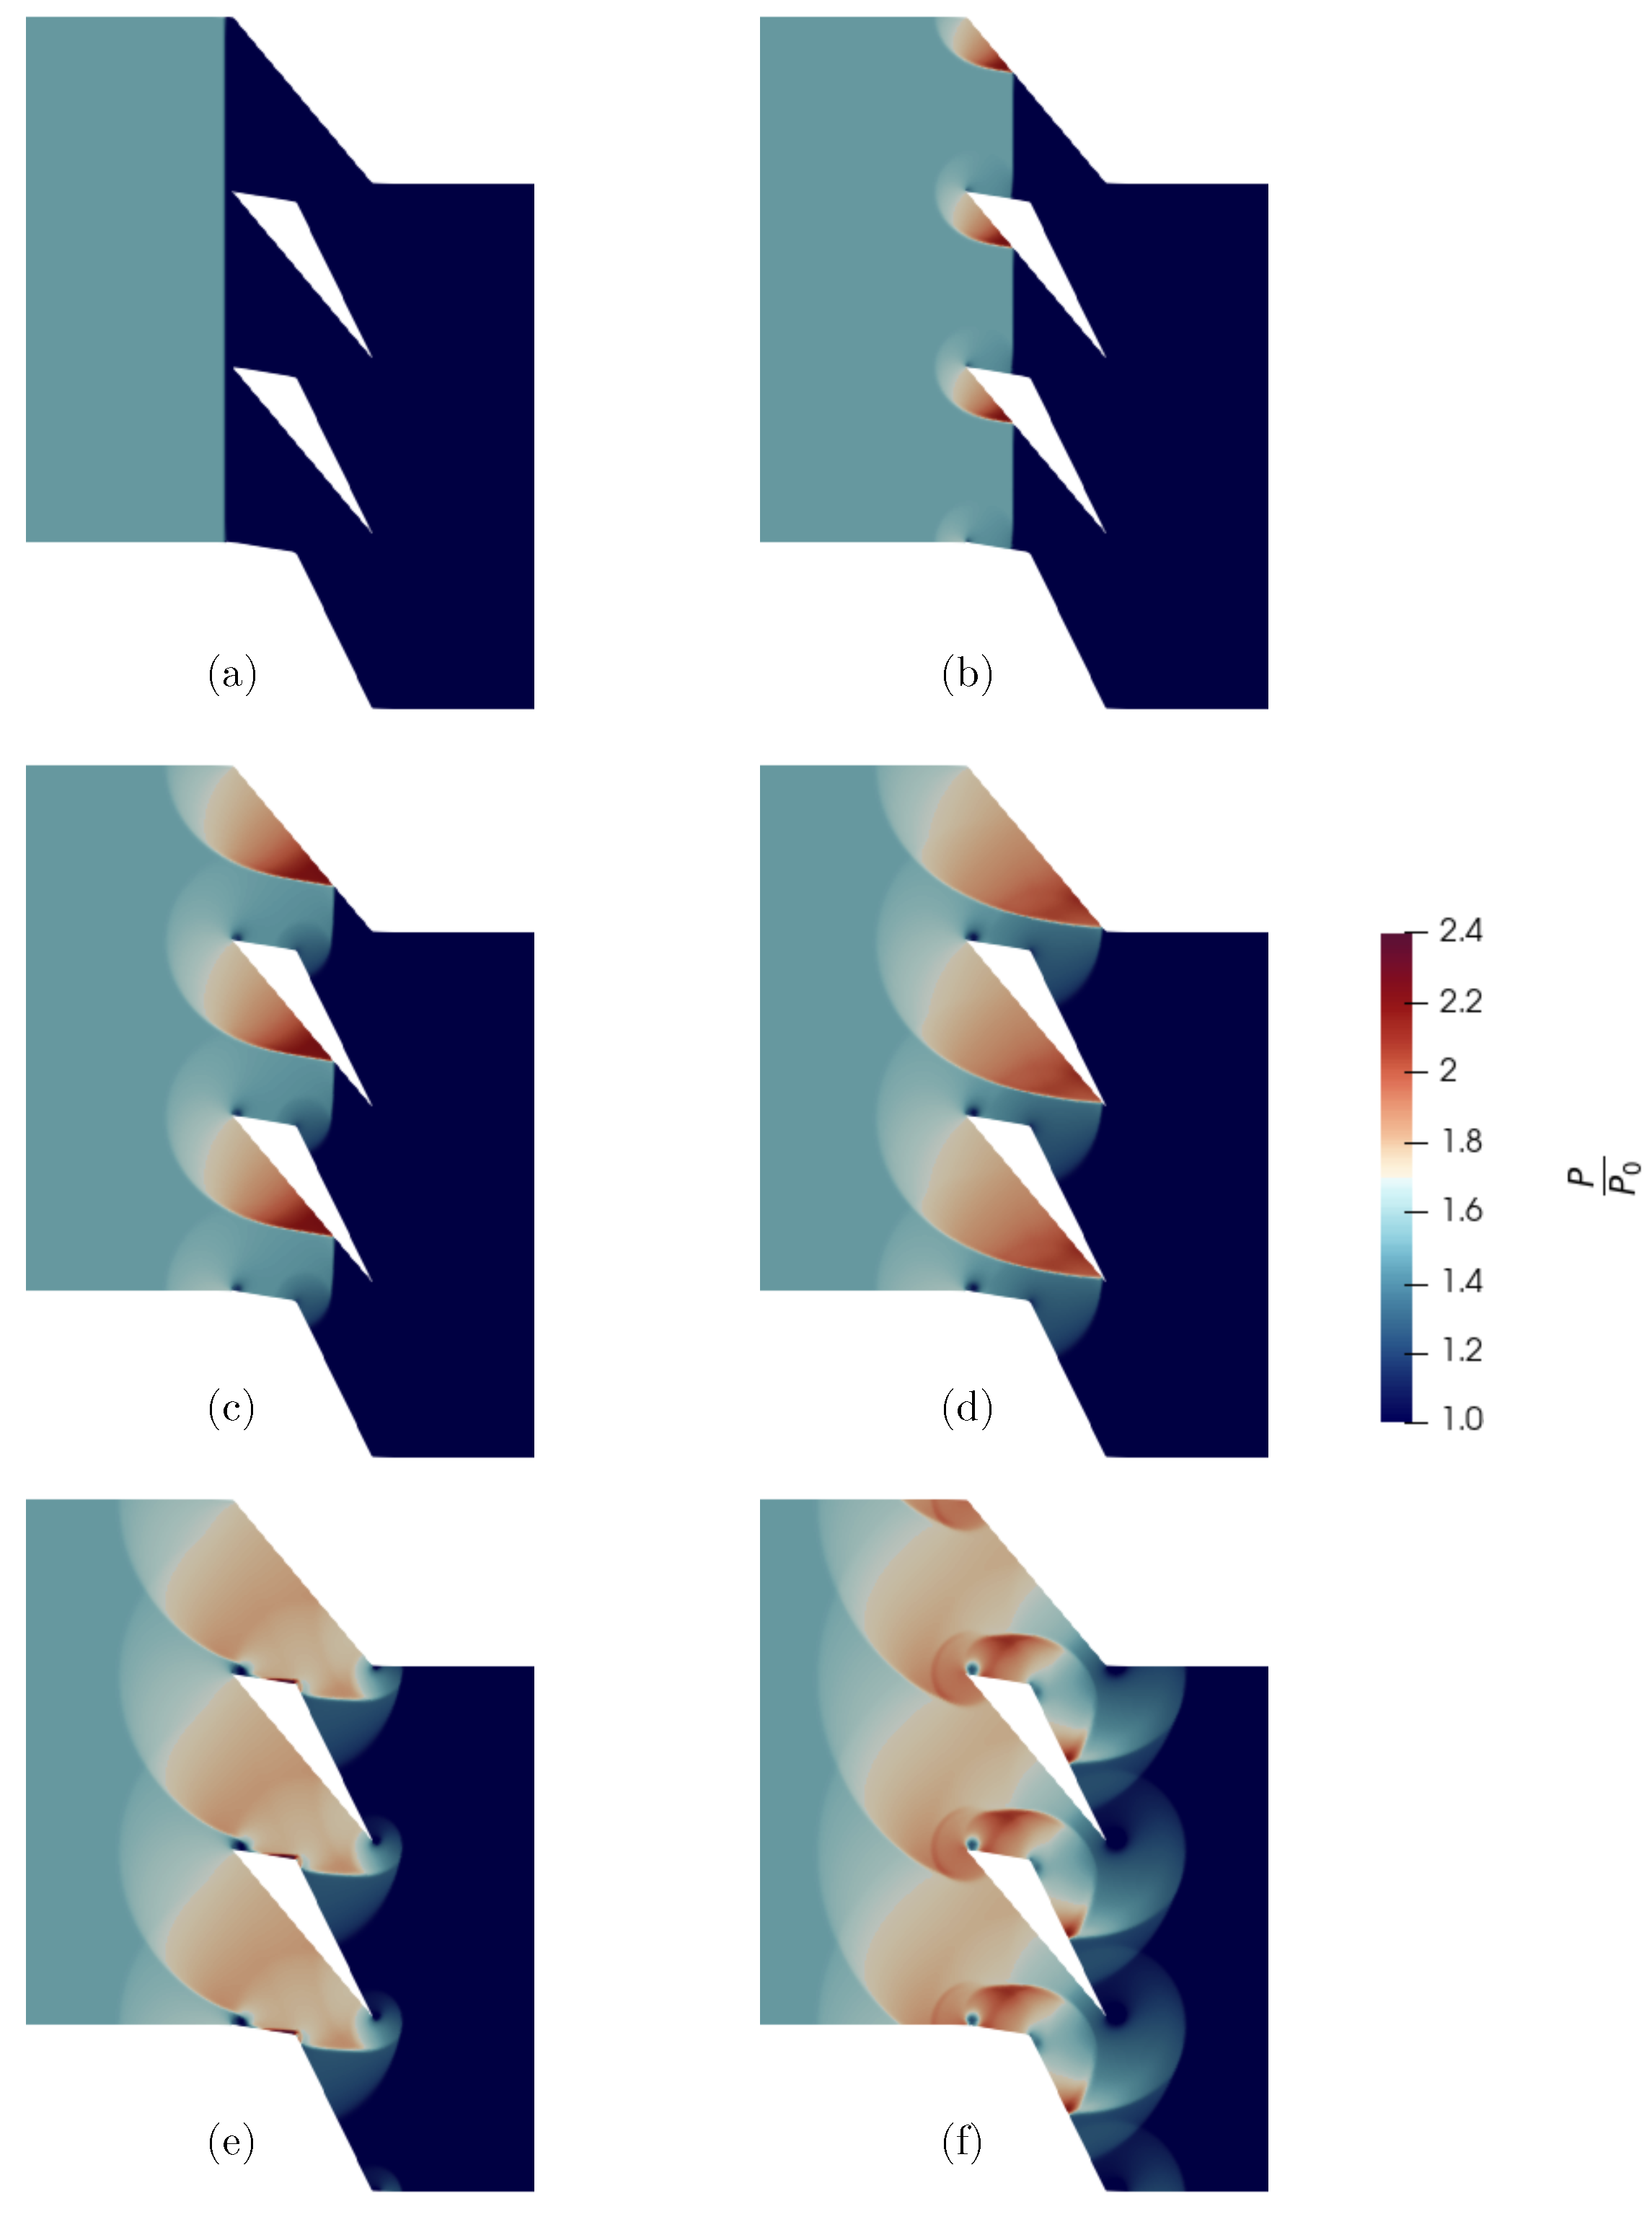
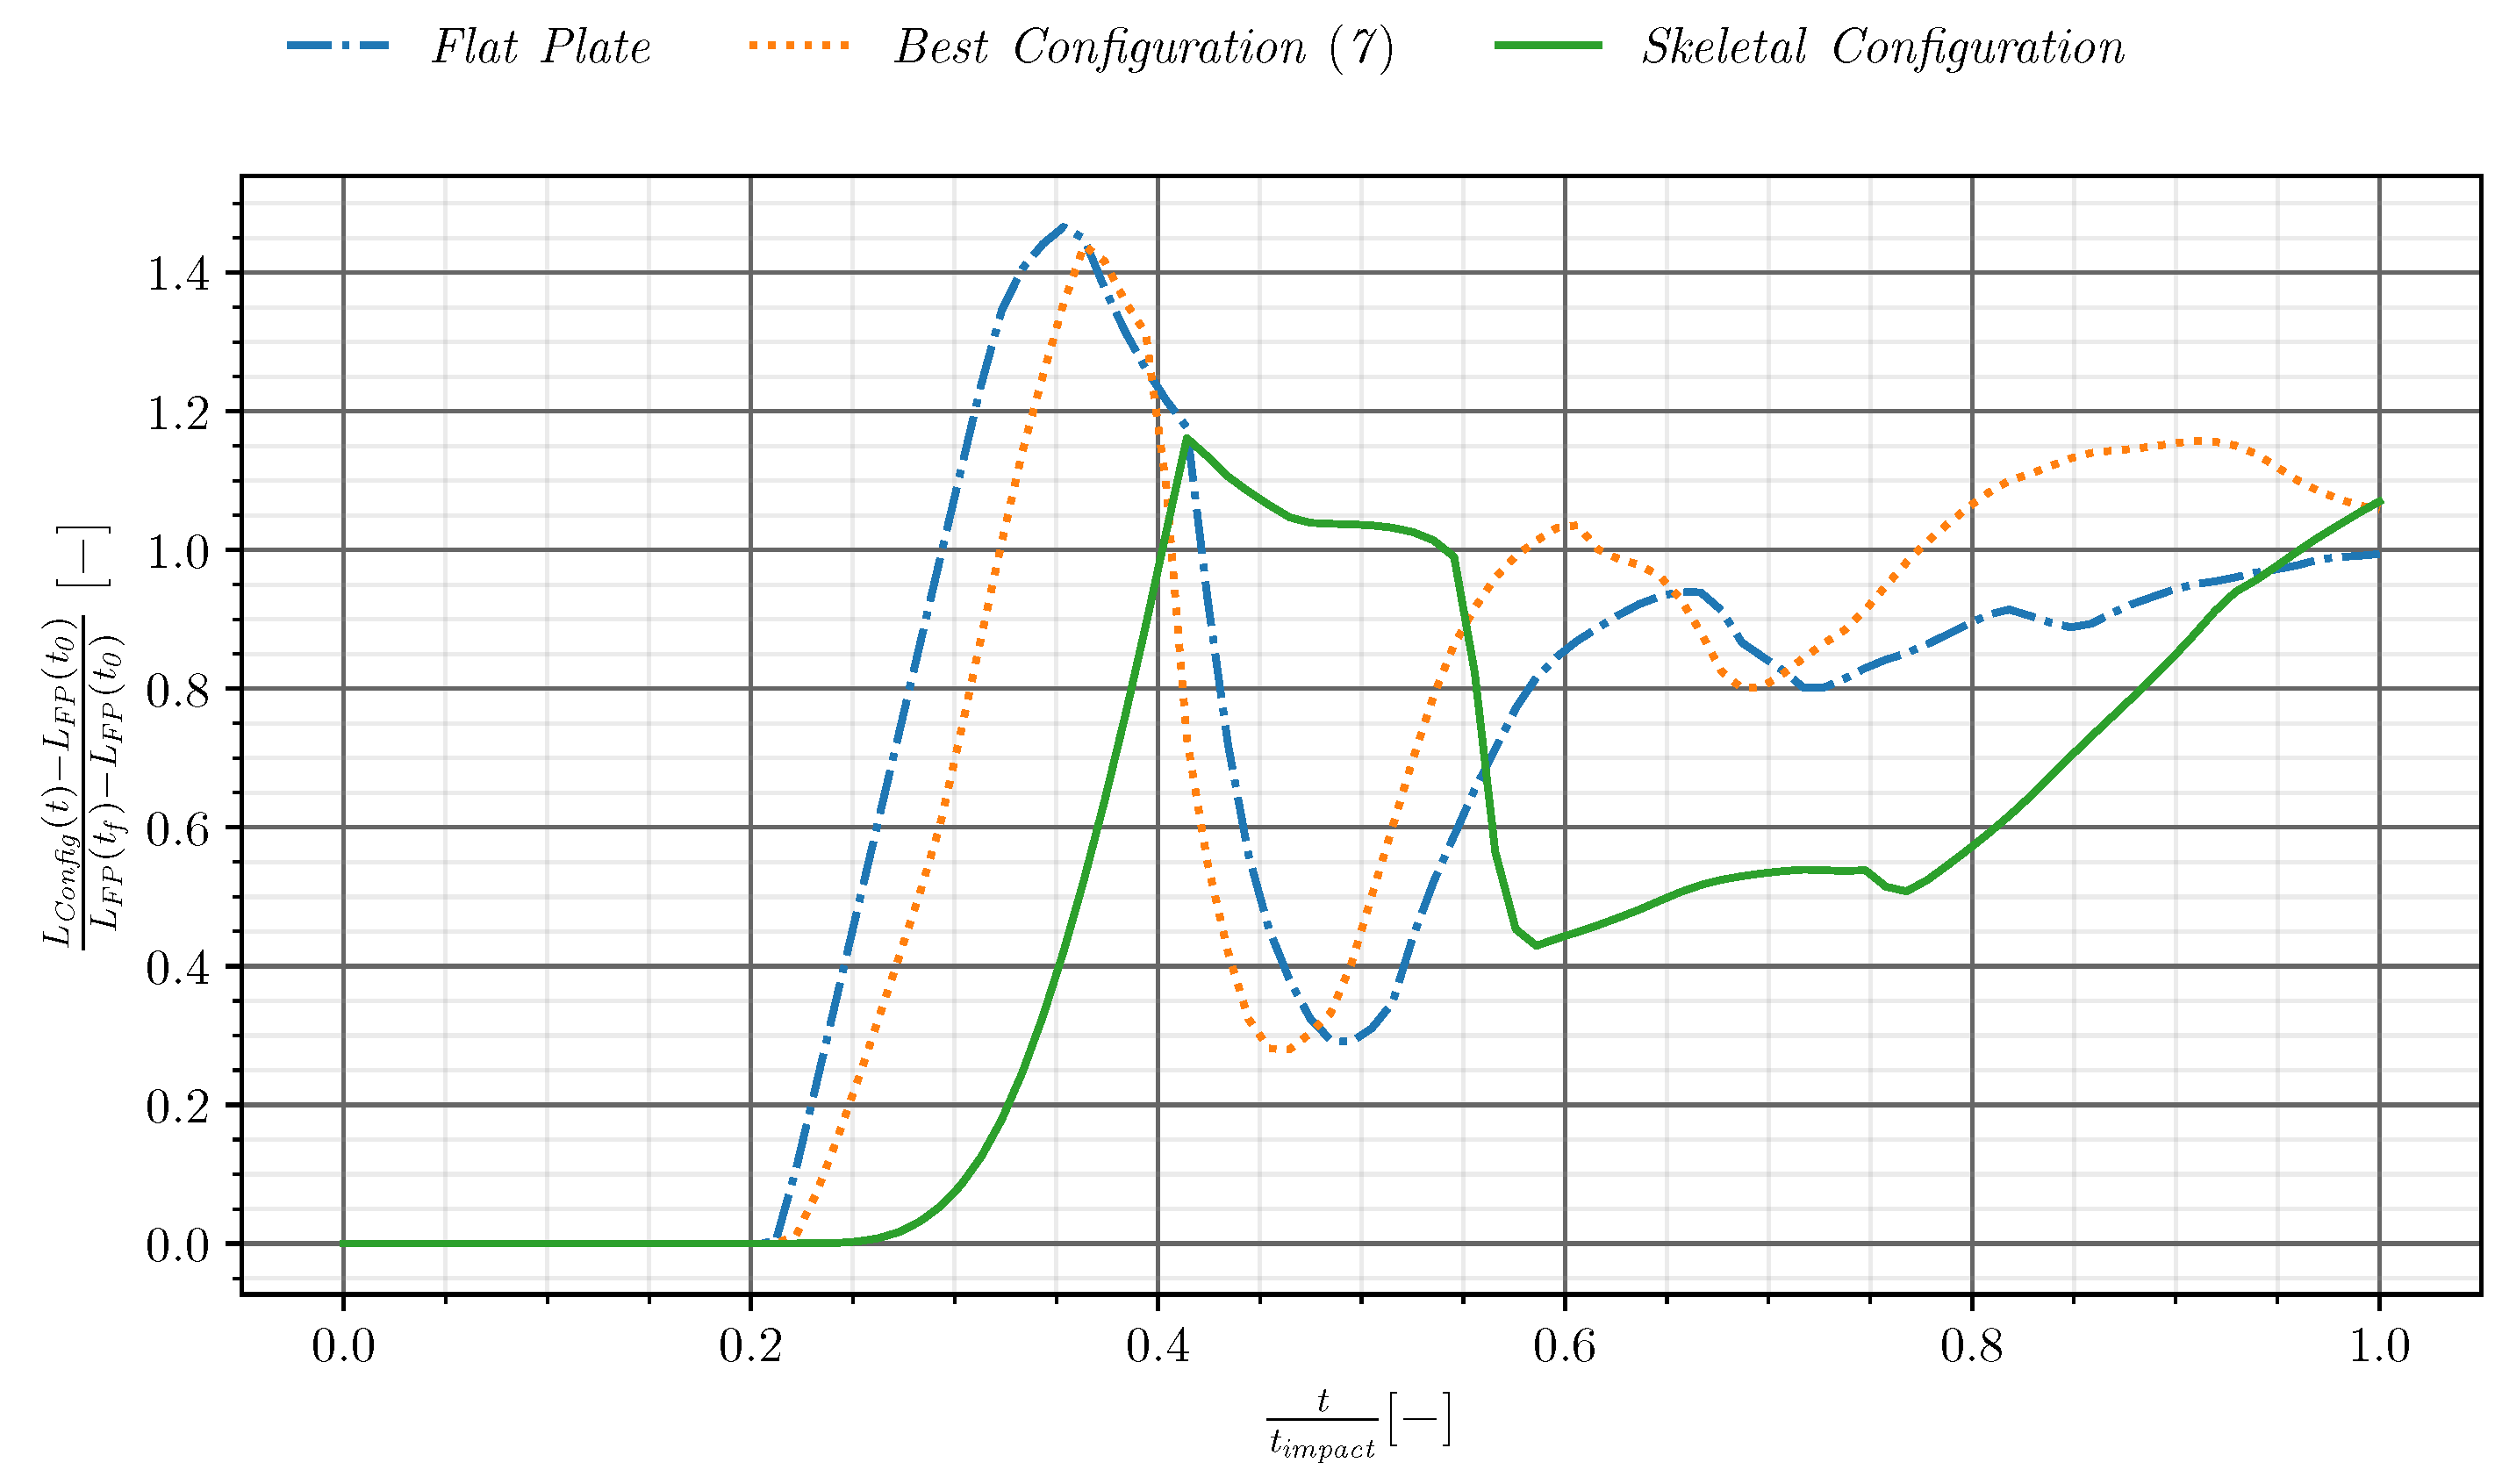
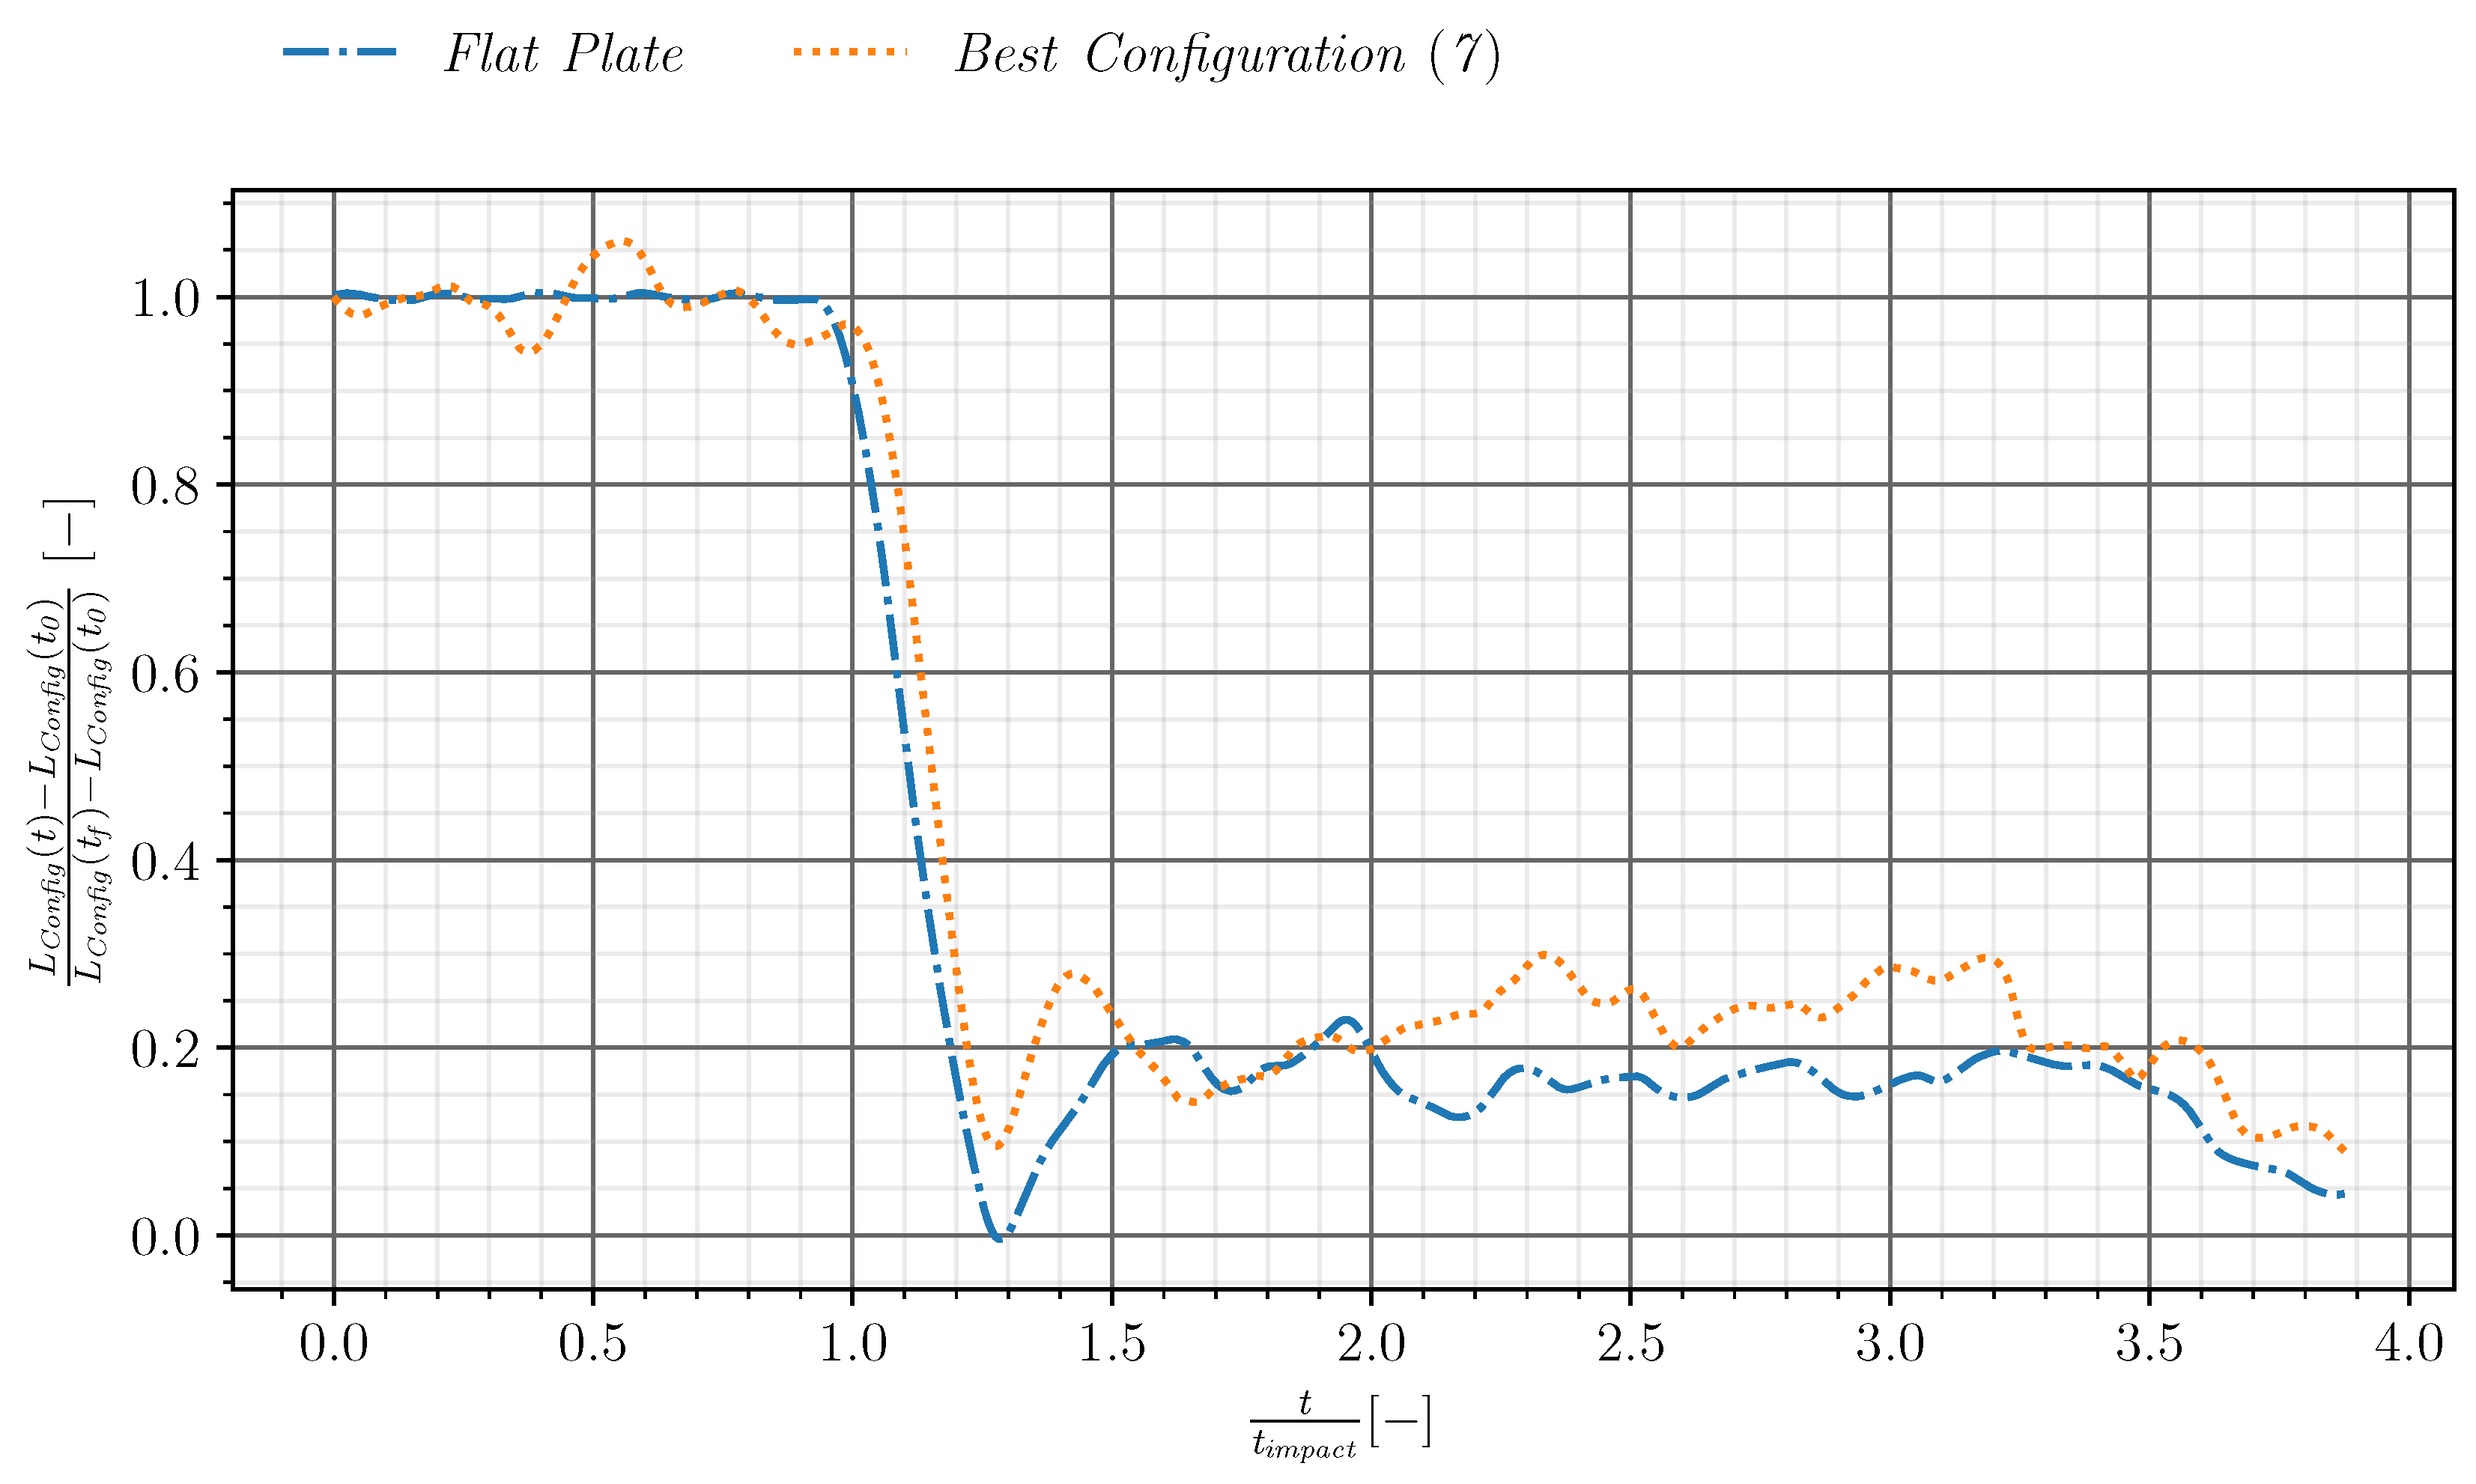
Figure 12 represents six key instants of the transient flow imposed on the triangular-shaped airfoil, with the parametric configuration 7. The main features observed in Figure 7 are still present. On the pressure side, the geometry is equivalent to a flat plate, and no change is expected. On the suction side, the main difference comes from the fact that the diffraction happens in two steps, because of the deviation at point B (Figure 3). However, at instant (b–d), the delay between the waves is still clear, and it generates instantaneous overloading. This case, with a thickness distribution, behaves the same as a flat plate and generates more loading than the curved plate analyzed by [6]. A comparison of the three cases of the instantaneous loading during the transient is presented in Figure 13 and demonstrates that.

3.2.3. Influence of Solidity

The next step toward more realistic geometries is the cascade configuration. The possible reflections on the neighboring blades may disturb the wave pattern and modify the instantaneous loading. Configuration 7 is thus taken as a reference for a solidity analysis. This solidity h / x c is varied in the range of 0.6 to 2.0. Figure 14 presents the results of this analysis. A bell-shaped curve is obtained with an optimum achieved for the value h / x c = 0.8 . No clear alteration of the wave pattern is observed. It mainly affects the intensity of the different phenomena, for which an optimal combination exists. The study was not extended over a wider range as a trend emerged. This value is used for the last step of the study which consists of a stator–rotor arrangement.
Figure 13 shows the superposition of the three cases studied previously: the flat plate, the optimal triangular geometry, and the skeletal configuration studied by [17]. It should be noticed that the different configurations presented in Figure 3 have been realized with the same boundary conditions. At the inlet total variables ( P t , T t ) imposed, the outlet pressure is imposed, but what really matters in the end is the source term placed before the outlet; periodic conditions are applied on the lateral boundaries of the domain except for the walls of the stator and, finally, symmetry conditions are applied on the pressure and suction side. Figure 13 displays a great similarity between the flat plate curve and the one with thickness.

3.3. Complete Stage Configuration

In this last part, a complete turbine stage (stator–rotor) is studied on the basis of configuration 7 with a solidity of 0.8 and a theoretical degree of reaction of 0.5 in the equivalent steady case. In this context, there is therefore, a perfect symmetry between the stator and the rotor. A sliding mesh interface with a translation speed of U = 100 m/s is imposed so that characteristic times are t c o n v e c t i o n / t r o t a t i o n = 68.18 and t c o n v e c t i o n / t a c o u s t i c = 4.11 . The triangular-shaped stage is compared to the skeletal case of former studies [6]. As in the previous sections, the pressure ratio generating the shock is Π = P t i n / P o u t = 2.0 .
Figure 15 presents snapshots of the pressure field in the stage, and Figure 16 reports the corresponding loading on the rotor blades, compared with that recorded on a cascade case (as in the case presented above). Only the part of the curve showing the passage of the shock at the rotor is shown in Figure 16 in order to facilitate reading and understanding. The general behavior is comparable to the case with the cascade. Indeed, what happens at instants (a,b) (Figure 15) is similar to what can be seen in the first part of the study. The incident shock wave arrives at the leading edge of the rotor and, from that moment on, a pressure difference appears on the pressure and suction side of the rotor. From this instant, the lift increases, and the expected overloading curve is obtained. This is due, in particular, to the various shock wave reflections on the walls and the strong variations in the lift curve.
It is mainly due to an unsteady feeding of the rotor by the stator. It is thus expected to not satisfy the theoretical degree of reaction. One of the main differences between the stator and rotor cases is the difference in the shape of the incident wavefront. In the stator case, the incident shock wave arrives perfectly straight, whereas in the rotor case, the impinging shock reaches the leading edge with a twisted shape. Specifically, the wave diffraction by the upstream stator generates strong perturbations on the incoming flow and, as a result, the loading. Instant (d) is particularly detrimental. However, the overloading is still present, and the integrated loading is higher than in the simple skeletal case. Nevertheless, the strong stator–rotor interaction observed here needs to be damped, which is the next step of the present work. Figure 15 and Figure 16 illustrate the importance of the phenomena of reflection and diffraction of waves mentioned at the beginning of the article. Indeed the peaks (c–f), whether they are in the direction favorable or unfavorable to the creation of effort, are related to these phenomena. For example, the unfavorable peak (d) is due to the reflection of the wave, which now impacts the pressure side. This implies an increase in pressure on the lower surface and thus a less marked difference between the two sides. Inversely, for peak (e), it is the wave on the inside that goes toward the top surface. This time, there is an increase in the difference and, therefore, in the effort. Finally, for peak (f), it is different. It is the impact of the zone linked to the diffraction (created during the widening of the section). It hits the pressure side first and results in a pressure drop. This increases the loading. However, there will be a drop once it hits the upper surface.
The longer-term objective is to give design recommendations for a turbine that would follow the Humphrey cycle. This involves alternating shock waves (as studied in the previous section) and expansion waves (corresponding to the opening of the valve between the combustion chamber and the turbine). Now that the shock propagation has been detailed, it seems important to study the expansion wave propagation during the valve closing phase in order to verify that this new phenomenon will not annihilate the gain.

3.4. Expansion Wave Propagation

It was shown in the first part of this paper that the phase with the propagation of the shock wave could, with an adapted geometry, be exploited to obtain an overloading. However, the shock phase is not isolated, and there will be a succession between the shock phase and the expansion phase. When the expansion wave propagates, it is expected to have the opposite characteristics. It is expected that there will be an underloading of the geometry as the expansion wave goes through. The question is whether this underloading has the potential to wipe out the gain previously obtained, or whether, in the end, it is possible to mitigate the effects of this phase and obtain a positive effect if the entire cycle is taken into account. Expansion waves are isentropic but are also more diffuse than shock waves and, therefore, more difficult to show on a two-dimensional representation. This is why the 2D representation is not necessarily the most appropriate for visualizing the propagation and interactions of the expansion wave.
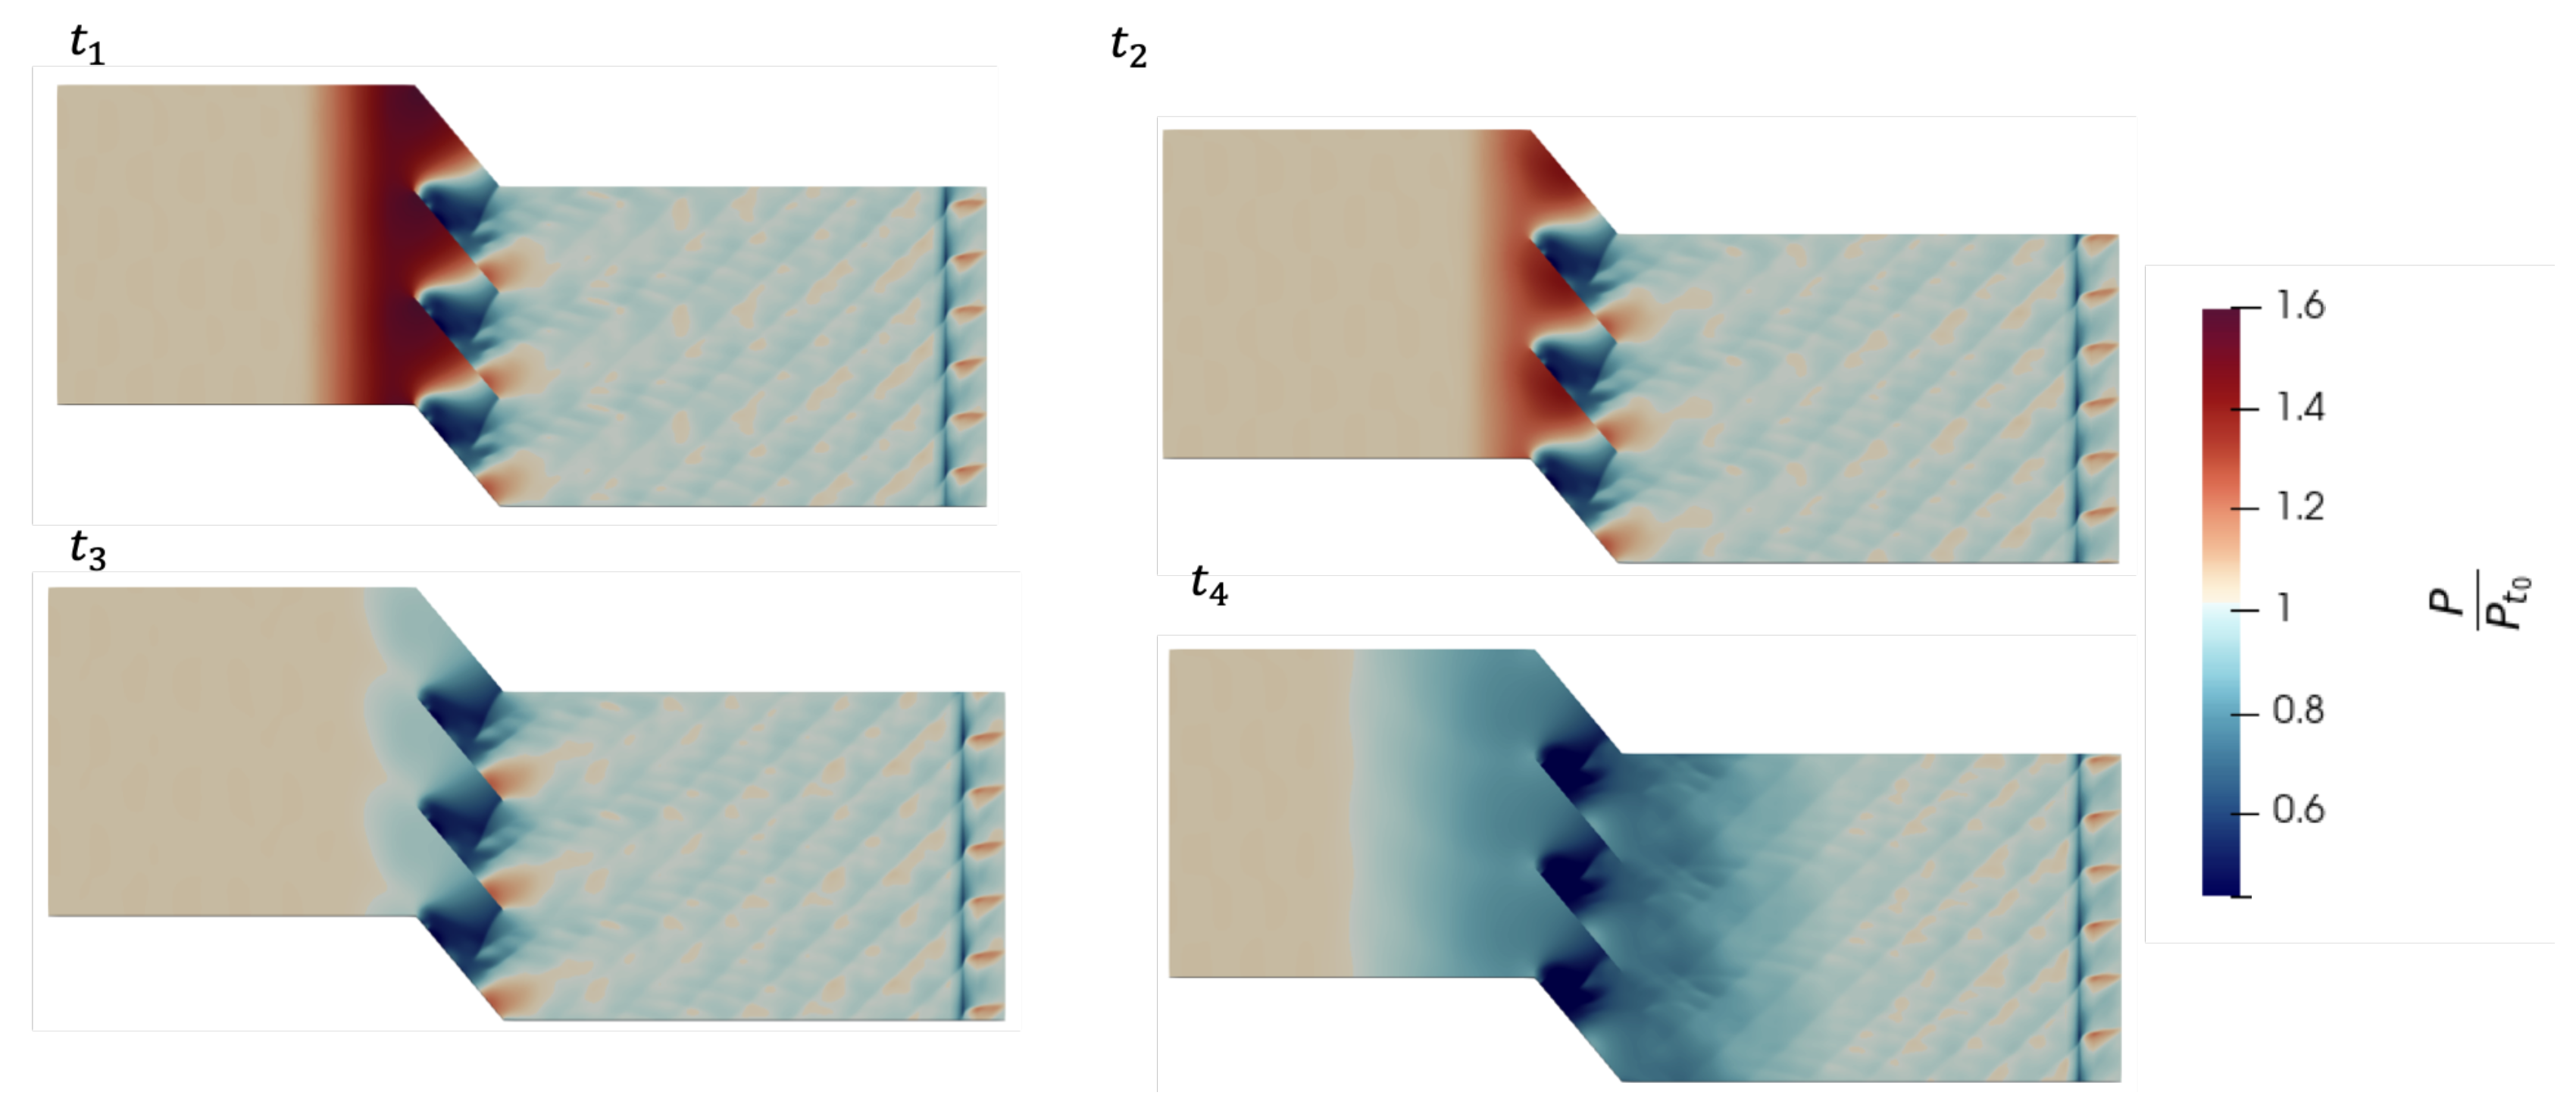
An ( x , t ) diagram represents the time evolution of a variable (pressure, Mach number, entropy, etc.) along an axis. The longitudinal position is given on the x-axis, while time is represented on the y-axis. The time is normalized by t i m p a c t , which corresponds to the moment when the reflected wave reaches the leading edge of the geometry under study. The two-dimensional pressure field is shown in Figure 17. The ( x , t ) diagram for the pressure field (along the x-axis defined in Figure 6) is shown in Figure 18. The four snapshots in Figure 17 correspond to the four highlighted instants in Figure 18.
The ( x , t ) representation improves the visualization of the wave propagation in the system. At the initial instant, the flow is not at rest and this is what can be seen in Figure 18 at time t = 0 . The incoming expansion wave is visible at (I).
Contrary to the shock wave case, here, the initial state of the simulation is not a flow at rest but the stationary solution of the shock wave propagation. From this initial moment, the inlet boundary condition is modified. It is no longer a total pressure and temperature condition but a wall condition. This change of boundary condition brutally stops the flow created by the propagation of the shock wave, leading to the formation of an expansion wave. This can be seen in Figure 18 (I) (where we can also see the divergent feature of the expansion wave) and in Figure 17 at times t 1 and t 2 .
As the expansion wave spreads during its propagation, a new parameter must be taken into account, which is the distance between the location of the generation of the wave and the arrival at the geometry. The greater the distance, the more diffuse the wave will be when it impinges on the geometry of interest. However, we can relate this to the work of Hermet [12], who was interested in the different vane cycles (direct application to our case study with the pulsed regime).
The source term can be seen at x = 4.0 in both the 1D and 2D representations. The waves arriving and reflecting at the outflow condition are no longer able to travel back to the region of interest. However, the upstream waves are still reflected on the source term but interact with the choked section in a physical way. The interaction of the wave with the leading edge gives rise to a reflected expansion wave, which will propagate to the entry condition (R1), which will, itself, reflect with a wave of the same nature because it is a wall condition (R2). We can see (R1) at times t 3 and t 4 in Figure 17. Between t 1 and t 2 , the expansion wave interacts with the flat plate. The result is a drop in pressure on the pressure and suction side. As a result, the lift decreases, as shown in Figure 19.
The same diffraction/intensification phenomena described in the first part also apply to the expansion. The expansion wave on the pressure side is intensified, while the wave on the suction side is reflected. This gives rise to an expansion wave and an additional compression wave. However, the phenomena are much less visible and persistent over time.
All this can be seen as a factor of interest: the overloading. As the initial state is a stationary state, a plateau appears at the level of the force (for the two configurations, flat and triangular plate). It is only when the expansion wave reaches the geometry that there is a change in the curve on Figure 19. From that point on (at t 1 and then t 2 ), lift falls sharply. This is due to the previous explanations, with the intensification of the expansion wave on one side and diffraction on the other. However, a plateau is quickly reached and there is much less variation than in the shock phase. This is shown in the curve in Figure 19. The conclusion is the same for the flat plate case, the triangular case and the skeletal case. Moreover, the lift drop is less than in the shock impingement, so not all of the benefits would be lost. Therefore, it seems important to study in greater depth the alternation between the shock phase and the expansion phase: the cyclic part.

4. Conclusions

This paper provided additional findings compared with the conference paper [18]. In this article, the instantaneous performance of turbines submitted to shock propagation is examined. Former work explored academic configurations (skeletal cascades). The present work proposes a progressive evolution toward more realistic geometries: thick airfoils arranged in cascades and stacked in a complete stage (stator–rotor). A preliminary analysis has revealed the physical origin of the instantaneous overloading caused by the shock wave propagation. It is expected to be maximum on a flat plate.
A parametric study then demonstrated that it is possible to obtain the same level of overloading with an adequate triangular thickness distribution. This overloading is affected by the solidity, and there is an optimum value on the bell-shaped curve. However, the analysis of the flow around the rotor is more complex since it suffers from unsteady feeding from the stator.
Finally, and this the results obtained during the expansion phase are promising. Phases with expansion wave propagation follow the shock wave propagation phases. The opposite effects were obtained as expected. However, interestingly, the underloading linked to the expansion is less significant than the overloading obtained during the shock propagation phase. Optimizing the shock/expansion cycle for this type of configuration, therefore, seems very promising and will be the subject of future work.
Further investigations of the stator–rotor configuration will be needed to endorse the present work. Many additional parameters have appeared (degree of reaction, free space, flow coefficient, etc.) and need to be examined. Also, the influence of viscosity needs to be further analyzed, in order to confirm that the wave pattern is still dominating in a realistic case. If not, some smoother geometries that still produce the beneficial wave pattern will be required. It could also be interesting, in future work, to analyze a more classical industrial configuration under conditions similar to those present in this study.

Author Contributions

Conceptualization, P.B., N.B. and J.G.; software, P.B., N.B. and J.G.; formal analysis, P.B.; investigation, P.B.; visualization, P.B., N.B. and J.G.; data curation, P.B.; writing—original draft preparation, P.B.; writing—review and editing, P.B., N.B. and J.G.; supervision, N.B. and J.G.; project administration, N.B. and J.G.; funding acquisition, N.B. and J.G. All authors read and agreed to the published version of the manuscript.

Funding

This research was funded by the Direction Générale de l’Armement (DGA). This work was performed using resources from GENCI [TGCC-CINES-IDRIS] (Grant 2022 2023 A0142A07178) and from CALMIP (Grant 2022-2023-p1425).

Data Availability Statement

The data presented in this study are available upon request from the corresponding author.

Acknowledgments

The authors would like to thank the DGA for their financial support and for permitting this study.

Conflicts of Interest

The authors declare no conflicts of interest. The funders had no role in the design of the study; in the collection, analyses or interpretation of data; in the writing of the manuscript; nor in the decision to publish the results.

Abbreviations

The following abbreviations are used in this manuscript:
x c Chord [m]
aSpeed of sound [ m / s ]
UTranslation Speed of the blade [ m / s ]
SSource term
ASection
F P Flat Plate
LLift force [N]
P t Total Pressure [ P a ]
T t Total Temperature [K]
t 0 Initial time [s]
t i m p a c t Time when the first wave impacts outlet boundary condition [s]
Π = P t i n P o u t Pressure ratio [-]
l * Length parameter of the triangle [ m / s ]
α First angle parameter of the triangle [°]
β Second angle parameter of the triangle [°]
l * Normalized length parameter of the triangle [-]
Lift * Normalized lift [-]
β * β / α [-]
Subscripts
i n Inlet
o u t Outlet
xAxial coordinate
iIncident shockwave
rReflected shockwave

References

  1. Anand, V.; George, A.; Knight, E.; Gutmark, E. Investigation of pulse detonation combustors–Axial turbine system. Aerosp. Sci. Technol. 2019, 93, 105350. [Google Scholar] [CrossRef]
  2. Naples, A.; Hoke, J.; Battelle, R.; Schauer, F. T63 Turbine response to rotating detonation combustor exhaust flow. J. Eng. Gas Turbines Power 2019, 141, 021029. [Google Scholar] [CrossRef]
  3. Sousa, J.; Paniagua, G.; Morata, E.C. Thermodynamic analysis of a gas turbine engine with a rotating detonation combustor. Appl. Energy 2017, 195, 247–256. [Google Scholar] [CrossRef]
  4. Yokoo, R.; Goto, K.; Kasahara, J.; Athmanathan, V.; Braun, J.; Paniagua, G.; Meyer, T.R.; Kawasaki, A.; Matsuoka, K.; Matsuo, A.; et al. Experimental study of internal flow structures in cylindrical rotating detonation engines. Proc. Combust. Inst. 2021, 38, 3759–3768. [Google Scholar] [CrossRef]
  5. George, A.; Driscoll, R.; Gutmark, E.; Munday, D. Experimental Comparison of Axial Turbine Performance Under Steady and Pulsating Flows. J. Turbomach. 2014, 136, 111005. [Google Scholar] [CrossRef]
  6. Hermet, F. Simulation des Transitoires Violents et des Ecoulements Pulses Dans les Turbines. Ph.D. Thesis, ISAE-SUPAERO, Toulouse, France, 2021. Available online: http://www.theses.fr/2021ESAE0005/document (accessed on 8 November 2023).
  7. Binder, N.; Bousquet, Y.; Hermet, F. Physics and Instantaneous Performance of Radial Turbines in Unsteady Flows: Validity of the Quasi-Steady Assumption for the Rotor. J. Turbomach. 2022, 144, 281–287. [Google Scholar] [CrossRef]
  8. Ben-Dor, G. Shock Wave Reflection Phenomena, 1st ed.; Springer: Berlin/Heidelberg, Germany, 1992. [Google Scholar]
  9. Raphael, L.; Jeremie, G.; Gilles, G. High-Order Compact Limiter Based on Spatially Weighted Projections for the Spectral Volume and the Spectral Differences Method. J. Sci. Comput. 2016, 67, 375–403. [Google Scholar] [CrossRef]
  10. Saez-Mischlich, G. High Order Numerical Methods for Unstructured Grids and Sliding Mesh. Ph.D. Thesis, ISAE-SUPAERO, Toulouse, France, 2021. Available online: http://www.theses.fr/2021ESAE0024/document (accessed on 8 November 2023).
  11. Hermet, F.; Binder, N.; Gressier, J.; Sáez-Mischlich, G. Pulsed Flow Turbine Design Recommendations. Int. J. Turbomach. Propuls. Power 2021, 6, 24. [Google Scholar] [CrossRef]
  12. Hermet, F.; Binder, N.; Gressier, J. Shock motion inside a varying cross-section channel and consequences on the downstream flow. Phys. Rev. Fluids 2021, 6, 044802. [Google Scholar] [CrossRef]
  13. Grebert, A. Simulations of shock wave/turbulent boundary layer interaction with upstream micro vortex generators. Int. J. Heat Fluid Flow 2018, 72, 73–85. [Google Scholar] [CrossRef]
  14. Richardson, L.F. Perspective: The Deferred Approach to the Limit. Philos. Trans. R. Soc. Lond. 1994. [Google Scholar] [CrossRef]
  15. Roache, P.J. Perspective: A Method for Uniform Reporting of Grid Refinement Studies. J. Fluids Eng. 1994, 116, 405–413. [Google Scholar] [CrossRef]
  16. Goupy, J. Ntroduction aux Plans d’Experiences, 2nd ed.; Dunod: Malakoff, France, 2001. [Google Scholar]
  17. Hermet, F.; Binder, N.; Gressier, J. Transient flow in infinitely thin airfoil cascade. In Proceedings of the 13 th European Conference on Turbomachinery Fluid dynamics & Thermodynamics, Lausanne, Switzerland, 8–12 April 2019. [Google Scholar] [CrossRef]
  18. Bertojo, P.; Binder, N.; Gressier, J. Effect of thickness on the unsteady response of turbine submitted to pulsed flow conditions. In Proceedings of the 15th European Turbomachinery Conference, Paper n. ETC2023-247, Budapest, Hungary, 24–28 April 2023; Available online: https://www.euroturbo.eu/publications/proceedings-papers/etc2023-247 (accessed on 8 November 2023).
Figure 1. Basic illustration of the reflection (r) induced by an incident shock wave (i) propagating along a flat plate. The black arrows represent the velocity vector in reference to the moving shock wave.
Ijtpp 09 00019 g001
Figure 2. Illustration of the diffraction phenomenon at the trailing edge (extracted from Hermet [6]).
Ijtpp 09 00019 g002
Figure 3. (Left): Geometric configuration. (Right): Different configurations (flat plate, skeletal configuration and the triangular one).
Ijtpp 09 00019 g003
Figure 4. Illustration of boundary conditions on the triangular profile.
Ijtpp 09 00019 g004
Figure 5. Illustration of boundary conditions on the skeletal profile.
Ijtpp 09 00019 g005
Figure 6. Illustration of boundary conditions on the flat plate profile.
Ijtpp 09 00019 g006
Figure 7. Pressure distribution over flat plate configuration (shock wave propagation). (ae) correspond to five instants.
Ijtpp 09 00019 g007
Figure 8. Normalized lift evolution along time in flat plate configuration. (ae) correspond to the same instants as in Figure 7.
Ijtpp 09 00019 g008
Figure 9. Design of experiment results. Instantaneous overloading for different configurations.
Ijtpp 09 00019 g009
Figure 10. Design of experiment results. Integral load for different configurations.
Ijtpp 09 00019 g010
Figure 11. Design of experiment results. (a) corresponds to the projection at β * fixed, (b) the projection at α fixed, (c) the projection at l * fixed.
Ijtpp 09 00019 g011
Figure 12. Best configuration pressure distribution (shock wave propagation) (af).
Ijtpp 09 00019 g012
Figure 13. Instantaneous loading for the three geometries.
Ijtpp 09 00019 g013
Figure 14. Influence of the solidity on the best configuration (7).
Ijtpp 09 00019 g014
Figure 15. Pressure distribution over the triangular turbine stage (af).
Ijtpp 09 00019 g015
Figure 16. Instantaneous loading for the stator case and the rotor case (including the sliding interface) (af).
Ijtpp 09 00019 g016
Figure 17. Flat plate configuration pressure distribution (expansion wave) for four instants ( t 1 t 4 ).
Ijtpp 09 00019 g017
Figure 18. The ( x , t ) representation for flat plate case (pressure field). (I): Initial expansion wave, (R1) (R2): Reflections due to interaction with geometry and boundary condition, (S): Source Term, (C): Reflection with converging–diverging term.
Ijtpp 09 00019 g018
Figure 19. Instantaneous loading with expansion.
Ijtpp 09 00019 g019
Table 1. Code table.
Code Number l / L α β / α
−10.3500.75
00.5601.0
10.7701.25
Table 2. Design of experiments table.
Simulation Number l / L α β / α
001−1
1000
21−1−1
3101
4−111
5110
6−1−10
7−10−1
80−11
9−100
Disclaimer/Publisher’s Note: The statements, opinions and data contained in all publications are solely those of the individual author(s) and contributor(s) and not of MDPI and/or the editor(s). MDPI and/or the editor(s) disclaim responsibility for any injury to people or property resulting from any ideas, methods, instructions or products referred to in the content.