Article

Rotating Stall Inception Prediction Using an Eigenvalue-Based Global Instability Analysis Method †

1
School of Power and Energy, Northwestern Polytechnical University, Xi’an 710072, China
2
School of Energy and Power Engineering, Beihang Univerisity, Beijing 100191, China
3
Departamento de Matemática Aplicada a la Ingeniería Aeroespacial, E.T.S.I. Aeronáutica y del Espacio, Universidad Politécnica de Madrid, 28040 Madrid, Spain
*
Authors to whom correspondence should be addressed.
This manuscript is an extended version of our paper published in the Proceedings of the 16th International Symposium on Unsteady Aerodynamics, Aeroacoustics and Aeroelasticity of Turbomachines, Toledo, Spain, 19–23 September 2022; paper No. ISUAAAT16-29.
Int. J. Turbomach. Propuls. Power 2024, 9(2), 20; https://doi.org/10.3390/ijtpp9020020
Submission received: 6 November 2023 / Revised: 13 March 2024 / Accepted: 29 April 2024 / Published: 4 June 2024

Abstract

:
The accurate prediction of rotating stall inception is critical for determining the stable operating regime of a compressor. Among the two widely accepted pathways to stall, namely, modal and spike, the former is plausibly believed to originate from a global linear instability, and experiments have partially confirmed it. As for the latter, recent computational and experimental findings have shown it to exhibit itself as a rapidly amplified flow perturbation. However, rigorous analysis has yet to be performed to prove that this is due to global linear instability. In this work, an eigenanalysis approach is used to investigate the rotating stall inception of a transonic annular cascade. Steady analyses were performed to compute the performance characteristics at a given rotational speed. A numerical stall boundary was first estimated based on the residual convergence behavior of the steady solver. Eigenanalyses were then performed for flow solutions at a few near-stall points to determine their global linear stability. Once the relevant unstable modes were identified according to the signs of real parts of eigenvalues, they were examined in detail to understand the flow destabilizing mechanism. Furthermore, time-accurate unsteady simulations were performed to verify the obtained eigenvalues and eigenvectors. The eigenanalysis results reveal that at the rotating stall inception condition, multiple unstable modes appear almost simultaneously with a leading mode that grows most rapidly. In addition, it was found that the unstable modes are continuous in their nodal diameters, and are members of a particular family of modes typical of a dynamic system with cyclic symmetries. This is the first time such an interesting structure of the unstable modes is found numerically, which to some extent explains the rich and complex results constantly observed from experiments but have never been consistently explained. The verified eigenanalysis method can be used to predict the onset of a rotating stall with a CPU time cost orders of magnitude lower than time-accurate simulations, thus making compressor stall onset prediction based on the global linear instability approach feasible in engineering practice.

1. Introduction

As one of the main components in an aero-engine, the compressor plays a vital role in the system. During the design process of a compressor, it is important to predict the stall boundary accurately and quickly. A too-conservative stall boundary prediction will drive the working line away from the working condition with the highest efficiency and the potential of a compressor cannot be brought into full play. On the other hand, a too-optimistic stall boundary prediction will lead to an insufficient stable margin of a compressor and the compressor is likely to stray into a stall condition, where the performance of the compressor will deteriorate and sometimes lead to rotating stall [1], or even a surge where the whole system can be damaged [2]. Thus, studying and predicting the rotating stall efficiently and accurately is of great importance for the design of a compressor.
In the early years, rotating stalls were mainly investigated by experimental approaches. Emmons et al. [3] explored this phenomenon and built a widely approved model for the propagation of stall cells based on cascade experimental results. Day [4] confirmed the existence of two types of stall inception through experimental studies: one is the spike type, with a small length scale and rapidly amplified perturbation, and the other is the modal type, featuring a gradually amplified disturbance. Furthermore, based on a large number of experimental results from a variety of compressors, a huge database was established and some simple analytical models were proposed to predict the rotating stall. The diffusion factor, proposed by Leiblein et al. [5], was used to evaluate the adverse pressure gradient on the suction side of a blade and it is still used as a criterion [6] to determine the stall boundary in a preliminary blade design. Koch [7] compared a compressor blade to a two-dimensional diffuser and a set of empirical correlations were established to associate the pressure-rise coefficient with the geometry parameters in stall conditions. However, as blades are nowadays designed with much higher loading, the accuracy and effectiveness of such simple models are no longer satisfactory.
With the rapid development of computational resources, unsteady simulation is a popular approach to studying rotating stall. He [8] carried out a two-dimensional unsteady simulation on an axial compressor and related the rotating speed of stall cells to their spatial length scales. Gourdian et al. [9] conducted a three-dimensional (3D) full-annulus numerical simulation and used the Fast Fourier Transform (FFT) to investigate the stall process. Romera et al. used the passage-spectral method to conduct a nonlinear stability analysis of a generic fan subjected to distorted inflow [10], revealing a dependence of fan stability on the nodal diameter of the inflow distortion. With unsteady simulations, detailed flow physics leading to and post rotating stall inceptions can be captured and stall mechanisms can be revealed to some extent. Vahdati studied the influence of intake disturbance on the operation of fan blades and solved the possible aerodynamic instability problem of the fan-intake system [11,12], which provided an important theoretical basis for understanding and predicting rotating stall. However, time-accurate unsteady simulations incur orders-of-magnitude higher computational cost, both in terms of CPU time and memory usage compared with more dominantly used steady analyses, and their deployment for cases with industrial relevance is still a challenge.
With the view that the operating point of rotating stall inception is an instability point, experimental results have indicated that the modal stall is a linear instability in nature. Linear stability analysis has previously been conducted on LPT blades and Floquet analysis has even been conducted on LP compressors [13,14]. Therefore, it is reasonable to rigorously investigate this phenomenon using an eigenvalue-based global instability analysis method. Based on the small perturbation assumption, the destabilization problem can be solved as an eigenvalue problem. Eigenanalysis has been successfully used in external flow studies [15,16], especially for the prediction of the shock buffet phenomenon, which is a flow instability phenomenon caused by the interaction between the shock wave and the boundary layer separation. With the consideration that the initial unsteadiness of an unstable steady dynamic system is caused by the system’s instability, Crouch proposed a generalized approach to predicting the onset of flow unsteadiness based on a global stability theory. The method was applied to predict the critical Reynolds number for the flow around a cylinder and the critical angle of attack for shock buffet on the NACA0012 airfoil with a specific Reynolds number and Mach number [17]. Furthermore, the structures of the buffet mode were also extracted and compared with the experimental results [18], which verified the accuracy of the method. Timme [19] started from the discretized Reynolds averaged Navier–Stokes (RANS) equations and extracted the discrete Jacobian matrix of the dynamic system, the eigenvectors of which were solved by the implicitly restarted Arnoldi method [20]. It was found that the shock buffet unsteadiness was related to a single unstable oscillatory eigenmode at the critical condition. More stable modes would become unstable with the increase in the angle of attack.
For internal flows, based on the small perturbation theory, with the incompressible, inviscid, and axisymmetric assumptions, Gordon [21] transformed the instability prediction problem into an eigenvalue problem. To avoid modeling the complex shape of a blade while retaining its perturbing effect, a blade force model was employed. Based on Gordon’s work, Sun et al. [22] proposed a general theory for flow instability analysis. In this theory, the immersed boundary theory was introduced, and the turning and the drag effects of a blade was replaced with source terms in the linearized RANS equations. Based on the small perturbation theory, the eigenvalue problem was established and solved. The method has been successfully used in the stall prediction of axial [23] and centrifugal compressors [24] in various conditions. Xu et al. [25] considered the effect of a blade by solving the RANS equations directly instead of using a blade force mode and performed eigenanalysis for the flow around a cylinder and the flow in an annular cascade. The equilibrium conditions were found and several eigenmodes, together with their developing patterns, were obtained at the same time. The studies show that eigenanalysis can predict flow stability boundaries and capture the characteristics of the flow modes in the disturbance. However, the correctness of this method still needs to be verified against time-accurate unsteady analysis results, especially for characteristics of the flow modes.
In this study, an eigenvalue approach was first applied to a full-annulus cascade to search for the stall boundary, and then more detailed investigations were performed to study the characteristics of perturbations in the flow field at the stall onset based on the obtained eigenmodes. Finally, a time-accurate unsteady simulation was also conducted to verify the eigenanalysis results and reveal how the stall inception develops into a rotating stall.

2. Methods and Tools

2.1. Flow Solver

The solver used in this study is NutsCFD [26], an in-house unstructured-mesh finite-volume RANS solver. The integral form of the governing equations in a frame of reference rotating at a constant angular velocity of ω is represented as follows:
d d t Ω r W d V + Ω r ( F c r F v ) · n d S + Ω r F ω d V = 0
where W denotes the conservative variable vector, F c r represents the convective flux vector in the frame of reference attached to the blade row under consideration, F v is the viscous flux vector, and F ω is an additional source term due to the rotation of a frame of reference. The above vectors are expanded as follows:
W = ρ ρ u ρ E F c = ρ u ρ u u + p ρ H u F c r = F c ( ω × r ) W F v = 0 τ u · τ + κ · T F ω = 0 ρ ω × u 0
where ρ is the density, u = [ u , v , w ] T is the absolute velocity of fluid in the three coordinate directions, and E is the total energy carried by the fluid. n is the surface out-normal vector, and H is the total enthalpy. ω is the angular velocity vector of rotation with a fixed magnitude, and r = [ x , y , z ] T is the coordinate vector. τ is the stress tensor, κ is the thermal conductivity, and T is the temperature.
For the steady solver, a modified Roe scheme for a relative frame of reference was used to discretize the convective flux, and the viscous convective flux was discretized with a corrected central scheme to suppress the odd–even decoupling of a solution. The negative Spalart–Allmaras model [27] was used for turbulent modeling to allow for non-physical solutions during the process of a numerical simulation. The convective flux of the turbulence model equation was discretized by a first-order accurate upwind scheme for better convergence [28]. As for temporal discretization, the Newton method was used to solve the steady-state nonlinear equation iteratively. The key to the Newton method is to form the Jacobian matrix. In NutsCFD, the automatic differentiation tool Tapenade [29] was used to calculate the derivatives of the residuals with respect to the flow variables. The Jacobian forming process was further accelerated with the graph coloring tool Colpack [30]. The large sparse linear system of equations was preconditioned by incomplete LU factorization with zero fill-in and solved by the generalized minimal residual (GMRES) method. For the unsteady solver, a dual-time-stepping method based on the second-order backward difference formula (BDF2) was used, and the inner loop was solved by the GMRES method.

2.2. Eigenanalysis Method

The eigenanalysis method was used to determine the stability of a flow system efficiently. This section presents the underlying theory of the eigenanalysis method.
The discretized RANS equation for a control volume can be written as
d W i d t = 1 Ω i R i ,
where W i and R i represent the vectors of the conservative variable and residual for the i-th control volume, respectively, and Ω i is the volume of the control volume. By assembling the above equation for all control volumes, we can obtain the following equation for the whole domain:
d W d t = R ( W ) ,
where W is a vector formed with W i in each control volume and R represents the discrete residual operator with the volume of each control volume included.
Based on the small perturbation theory, the transient solution of flow field W can be decomposed into a steady-state solution W 0 and a small perturbation term W ˜ . With the first-order Taylor expansion of R ( W ) at W 0 , the equation becomes
d W ˜ d t = R ( W 0 ) R W W ˜ .
The first term on the right side is zero once a fully converged steady solution is obtained. The partial derivative in the second term on the right side R W is the system Jacobian matrix A . Thus the above equation can be reduced to
d W ˜ d t = A W ˜ .
Generally, the Jacobian matrix A can be factorized as
A = V Λ V 1 ,
where Λ is a diagonal matrix with all eigenvalues of A as its elements, and V is composed of all corresponding right eigenvectors. As the perturbation W ˜ in the flow field is the linear combination of all the eigenmodes, it can be represented as
W ˜ = V η ,
where η is a column vector. By substituting the above into Equation (6) and rearranging it, we can obtain
d η d t = Λ η .
Then, all the equations are decoupled and can be expressed as
d η i d t = λ i η i i .
The solution of the above equation is given by
η i = b i e λ i t ,
where b i is a constant complex number that depends on the initial condition and does not vary with time. Note that the eigenvalue is a complex number. The stability of an eigenmode depends on the sign of the real part of an eigenvalue. A positive real part indicates an unstable eigenmode and a negative real part indicates a stable eigenmode. Therefore, the key to a flow stability analysis is to find the eigenvalue with the biggest real part. In NutsCFD, the ARPACK library [31] with the implicitly restarted Arnoldi method [20] was employed to solve the eigenvalue problem, using the Jacobian matrix formed in the flow solver.

2.3. Eigenanalysis Verification

In this study, unsteady simulation was used to verify the eigenanalysis method. More specifically, a linear unsteady perturbation was projected onto several eigenmodes; then, the growth rates and the frequencies of the projections were used for comparison with the eigenanalysis results. The projection of an unsteady perturbation W ˜ onto a specific right eigenmode v j can be represented as
W ˜ · v j = V η · v j = i = 1 N v i η i · v j .
In the above, N is the number of modes and is equal to the dimension of the Jacobian matrix A. Substituting Equation (11) into the above equation, the projection has the form of
W ˜ · v j = i = 1 N ( v i · v j ) b i e λ i t .
It can be seen that the projection is determined by all the eigenvectors that are not orthogonal to v j when the flow perturbation is projected onto one specific right eigenvector v j . Unfortunately, for a compressor system, the right eigenvectors are not orthogonal to each other. Therefore, the projection onto a right eigenvector cannot reflect the accurate evolution of the mode associated with the eigenvector. This phenomenon is a consequence of the Euler Equations, which give rise to nonsymmetric Jacobians.
However, a right eigenvector of a matrix is always orthogonal to the left eigenvectors except for the one with the same eigenvalue, namely,
v i · y j 0 i = j = 0 i j
where y j is a left eigenvector of the Jacobian matrix A . Therefore, it is a better choice to project a perturbation onto the left eigenvectors. The projection can be formulated as
W ˜ · y j = i = 1 N ( v i · y j ) b i e λ i t = ( v j · y j ) b j e λ j t
Equation (15) shows that when the flow perturbation is projected onto a specific left eigenvector y j , the effects of other eigenvectors vanish; thus, the evolution of the concerned eigenvector can be extracted from the projections. In this study, an unsteady flow perturbation was projected onto the left eigenvectors to capture the growth rates and frequencies of the related modes.

3. Results and Discussions

3.1. Steady Simulation

In this paper, the quasi-three-dimensional cascade at approximately 50% span of NASA Rotor 67 [32], which is a widely studied transonic fan rotor with 22 blades, was used as the test configuration. Considering that the circumferential length scale of a stall cell is often different from that of a blade pitch, a full-annulus domain was used. The inlet and outlet were located two times and three times the chord length away from the blade leading and trailing edges, respectively. NASA Rotor 67, the quasi-three-dimensional cascade, and the entire computational domain are shown in Figure 1.
Steady simulations were performed at first to obtain fully converged steady flow solutions. In this study, three sets of grid with 270, 490, and 1100 thousand grid points were used to conduct the grid independence study. The speedlines were calculated by gradually increasing the static pressure at the outlet and are shown in Figure 2. The mass flow rates were normalized by the relevant choke mass flow rates. With the Newton solver in NutsCFD, the residuals at each operating point were reduced by approximately 14 orders of magnitude, which was vital for the eigenvalue analyses in the following sections. It can be seen that there exist differences in the calculated pressure ratio and efficiency characteristics between different grids. However, considering the computing resources and computing time, the following analyses were performed based on the coarse grid. In this study, we were most concerned to find the stability boundary; thus, a few more steady simulations were conducted in the neighborhood of the numerical stall point. For convenience, three operating points near the stall point were labeled with A, B, and C.

3.2. Search for the Rotating Stall Inception Point

In this section, the results of searching for the rotating stall inception operating point are presented. The number of eigenpairs in a system is equal to the number of degrees of freedom in the system. For the annulus cascade considered in this work, the number of degrees of freedom is more than 1.5 million even for the coarsest grid. To calculate all the eigenpairs is not only computationally intensive but also unnecessary. To reduce the computational cost of stability analysis, one needs to have a good guess of the target eigenvalues and center the calculation around the guessed eigenvalue.
Herein, the stability analysis is to find the rotating stall inception point. It is well known that the frequency of a rotating stall is at the same magnitude as the shaft frequency. Therefore, the eigenvalue of a stall inception mode is expected to have a zero real part and an imaginary part in the same order as the shaft frequency. To find such an eigenvalue, first, the exact Jacobian matrix formed for solving the steady equation is scaled by the reciprocal of the angular shaft frequency. Then, the shift-and-invert method is used to find eigenvalues close to 0 + σ i , where σ is the estimated angular frequency (normalized by the angular shaft frequency) of a flow mode to be searched for. For this particular case, ten eigenvalues can be obtained in each eigenvalue computation within six hours on a modern workstation with 64 cores.
Figure 3a shows the process of searching the rotating stall inception point. The x-axis and y-axis are both normalized by the shaft angular frequency. At the beginning, an eigen-analysis was performed at point A, which is the leftmost point among the three points of A, B, and C. It can be seen that five eigenvalues are located in the unstable region with positive real parts, which indicates that this point is unstable and the bifurcation point is located at a condition with a lower back pressure. Then an eigen-analysis was performed at point B, which has three unstable modes. Compared with point A, the real parts of most eigenvalues are reduced. Thus, the whole eigenspectrum moves to the left, which means that point B is much closer to the bifurcation point than point A. At point C, all the eigenmodes become stable. The results indicate that the bifurcation point is located between point B and point C. As the difference in the outlet back pressure between point B and point C is only 10 Pa, there is not much point to perform further eigen-analysis between point B and point C. Point B is chosen as the stall inception point for the following analyses. Another interesting observation is that eleven eigenvalues (marked with blue crosses in Figure 3a) are located on a smooth curve, and this will be analyzed in the next section.
To ensure that no eigenvalues with positive real parts are missed at point B, a few more searches were performed with the expanded spectrum shown in Figure 3b. For each circle in Figure 3b, the center represents an estimated eigenvalue, and the area enclosed by the circle represents the swept area in an eigenvalue search. All eigenvalues with an imaginary part less than 2.5 times the shaft frequency in the neighborhood of the stability boundary have been discovered.

3.3. Analysis of the Eigenmodes

The eigenanalysis results suggest that point B is unstable and there are three unstable eigenmodes. As the three unstable modes are part of a family consisting of eleven modes distributed along a smooth curve, we will turn our attention to these eleven modes. The eleven modes are indexed from 1 to 11 in Figure 3a with their angular frequencies in ascending order.
An eigenmode can be represented as follows:
V i η i = V i b i e λ i t .
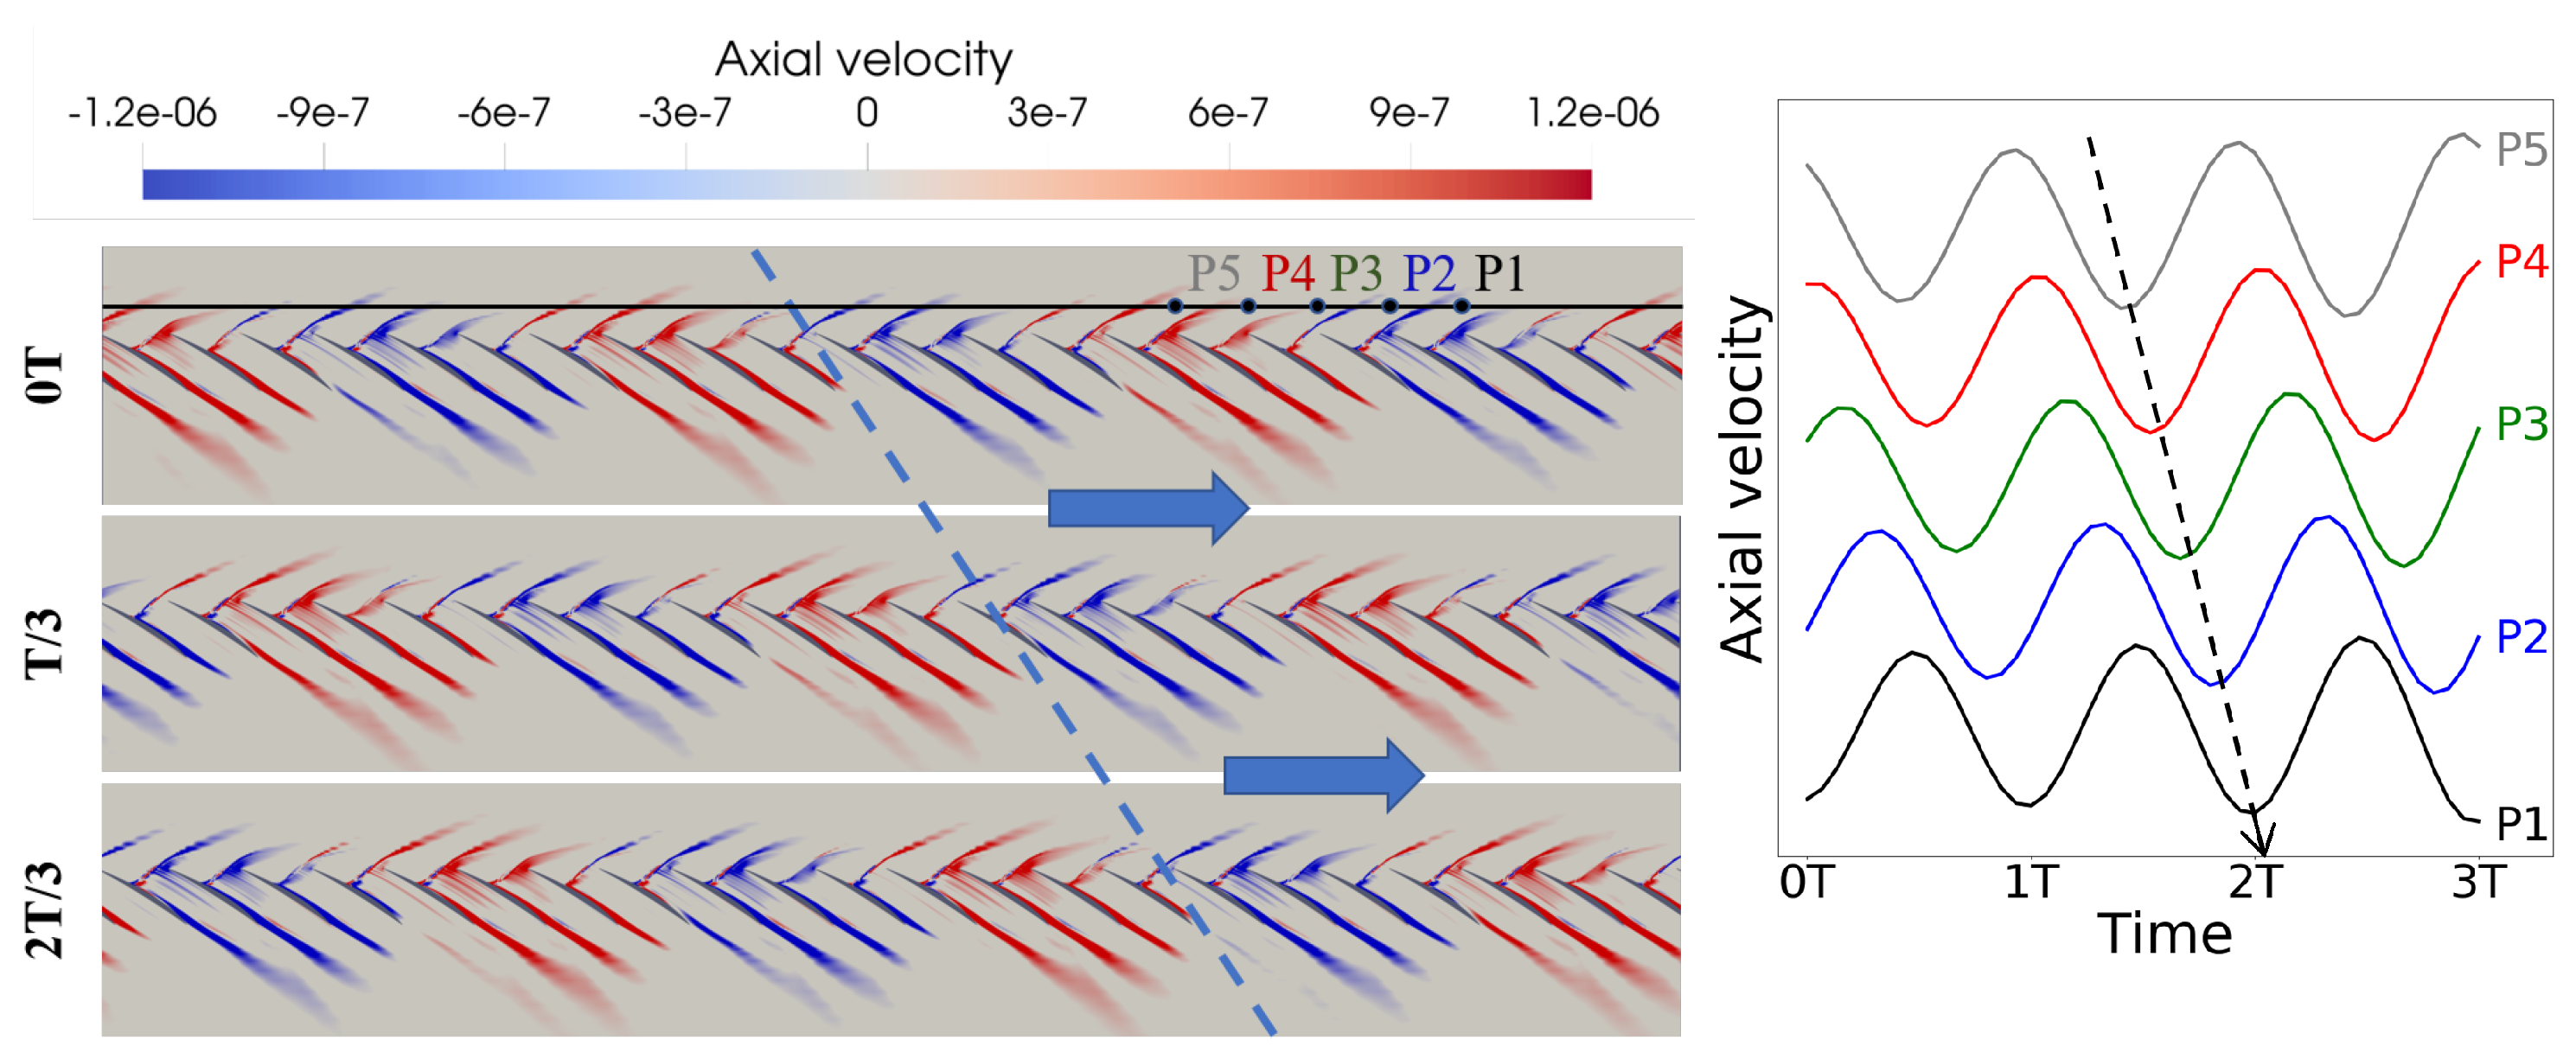
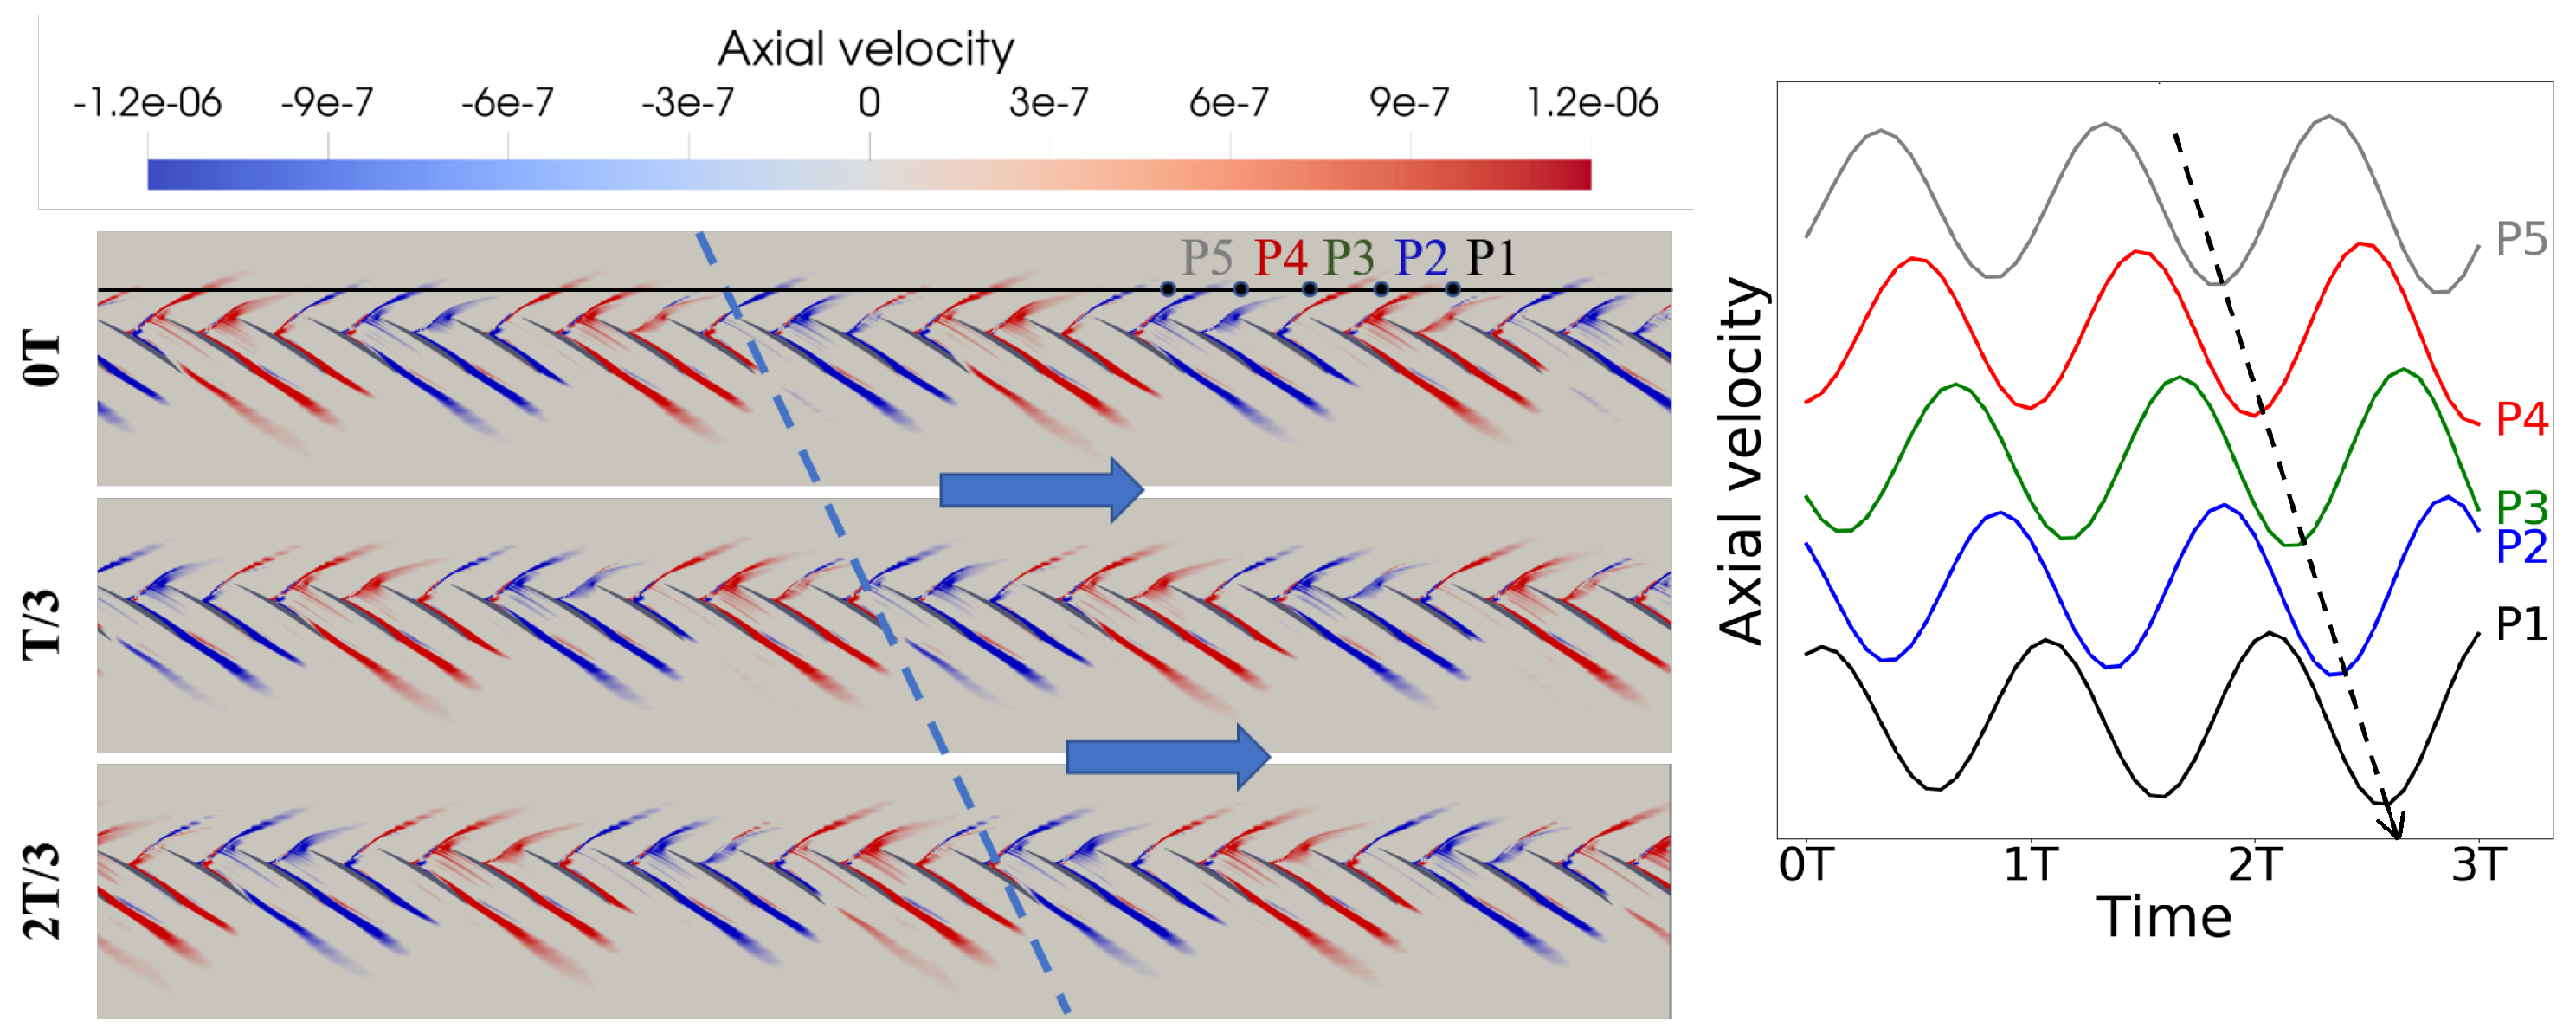
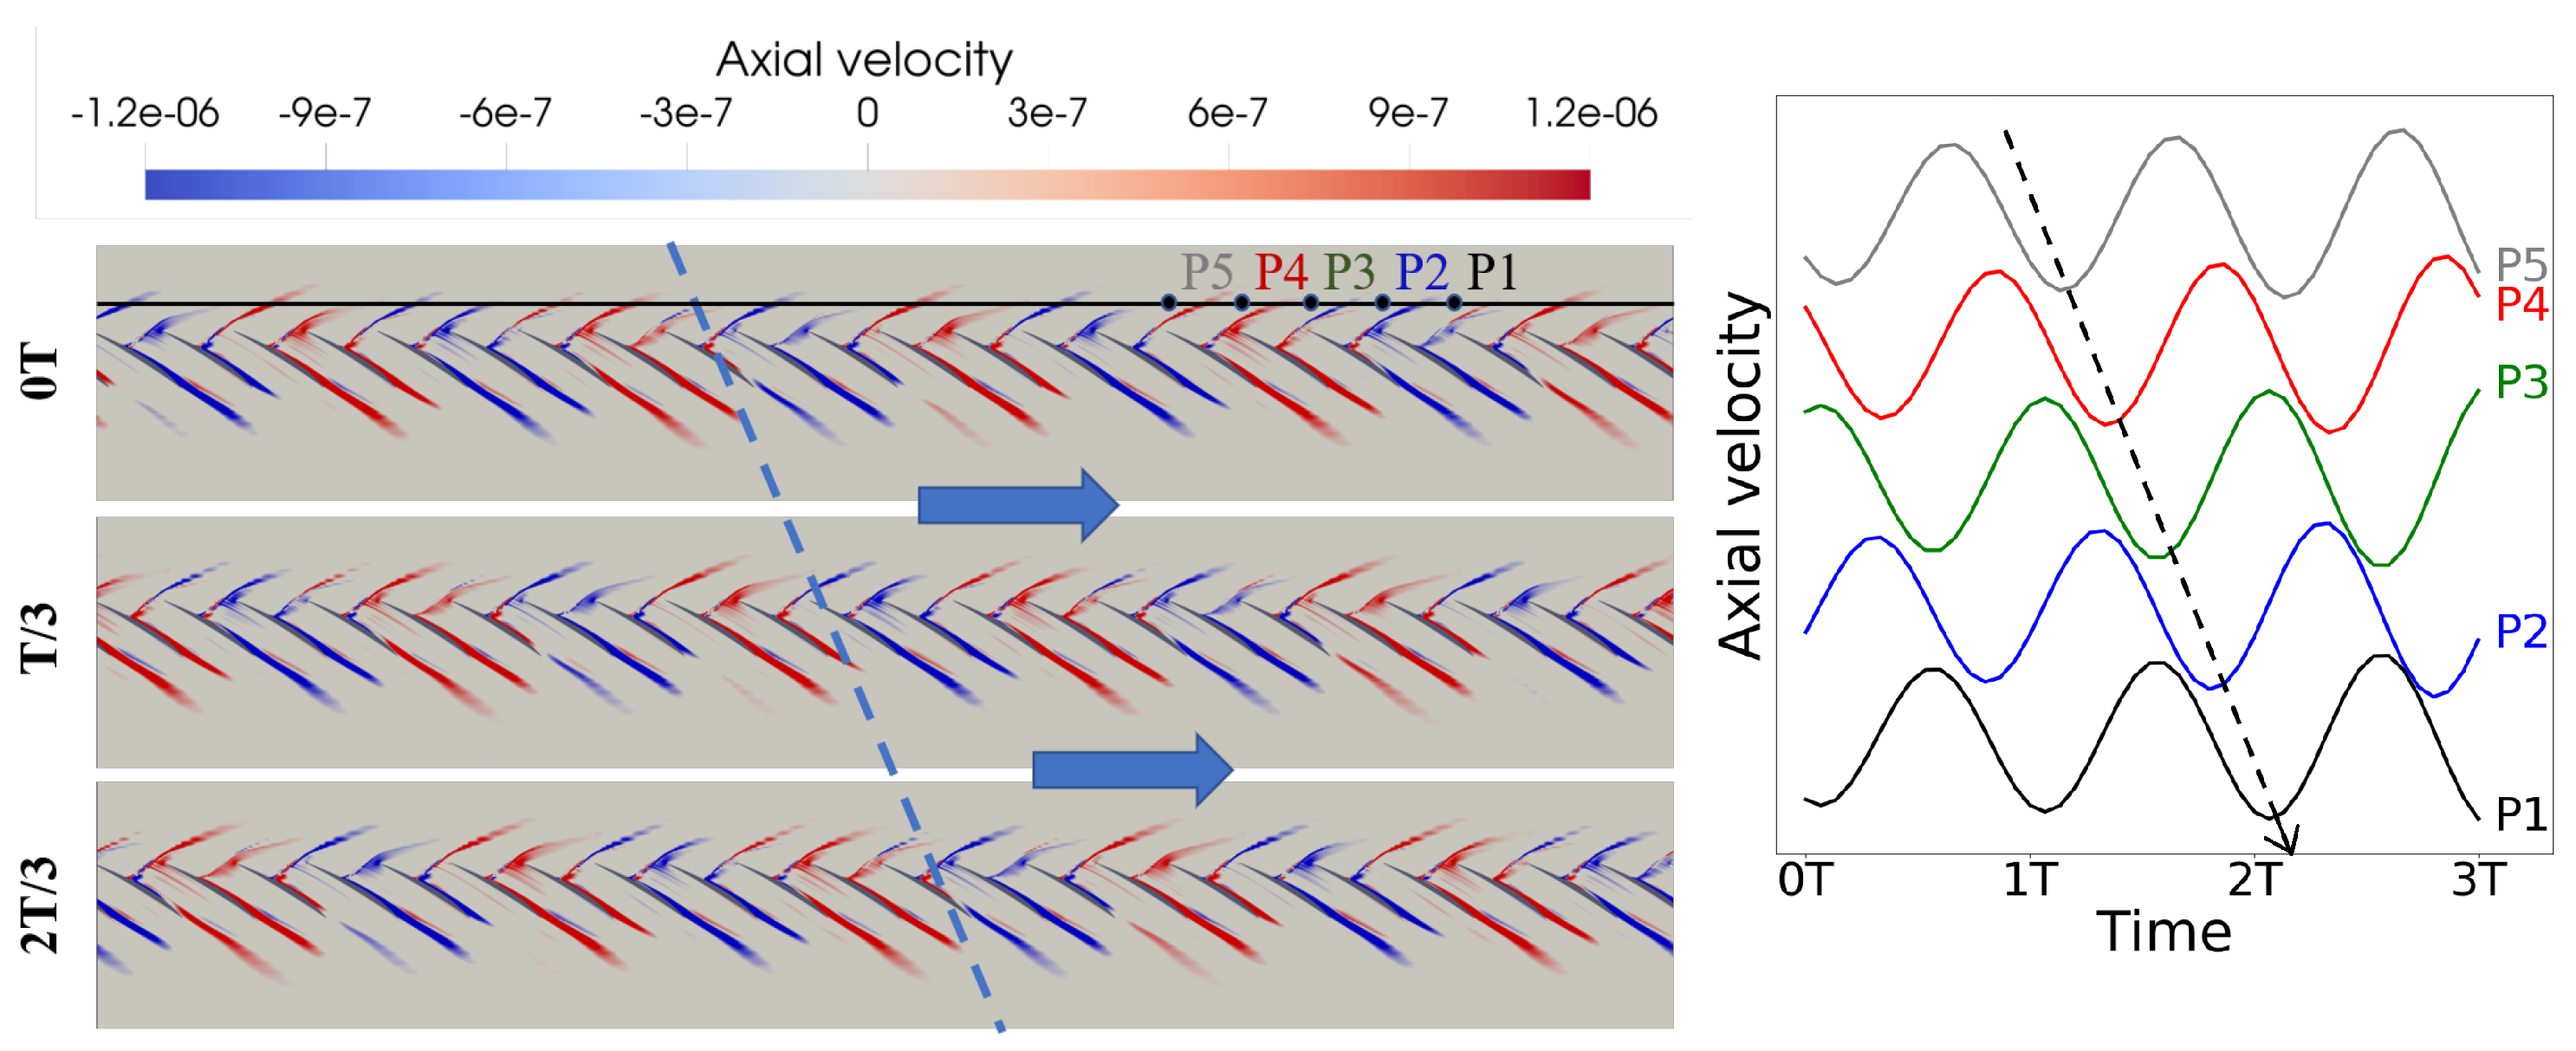
For the three unstable modes, their amplitudes grow exponentially with time. Nevertheless, we visualize the three unstable modes without changes in their amplitudes at three typical time instants of 0T, 1/3T, and 2/3T, with T being their own respective periods. Figure 4, Figure 5 and Figure 6 show the reconstructed axial velocity fields. It can be seen that the perturbations of the three modes are mainly located at shock wave, suction side flow separation, and wake regions. The major difference between the three unstable modes lies in the number of global patterns in the circumferential direction. The number of patterns is also referred to as the nodal diameter. The nodal diameters are three, four, and five for modes 3, 4 and 5, respectively. The snapshots at three different time instants also indicate that the eigenmodes are traveling in the circumferential direction.
Velocity time traces at five points that are located upstream of five adjacent blades were also reconstructed and are presented in Figure 4, Figure 5 and Figure 6. The time traces also reveal the traveling characteristics of the three modes. The three modes are traveling in a direction opposite to the blade rotation in the rotating frame of reference. The traveling speed in terms of angular frequency in the rotating frame of reference is given by I m a g ( λ ) N with, N being the nodal diameter. The traveling speed normalized by the shaft speed in the stationary frame of reference is then given by
U R S = 1 I m a g ( λ ) N ω shaft .
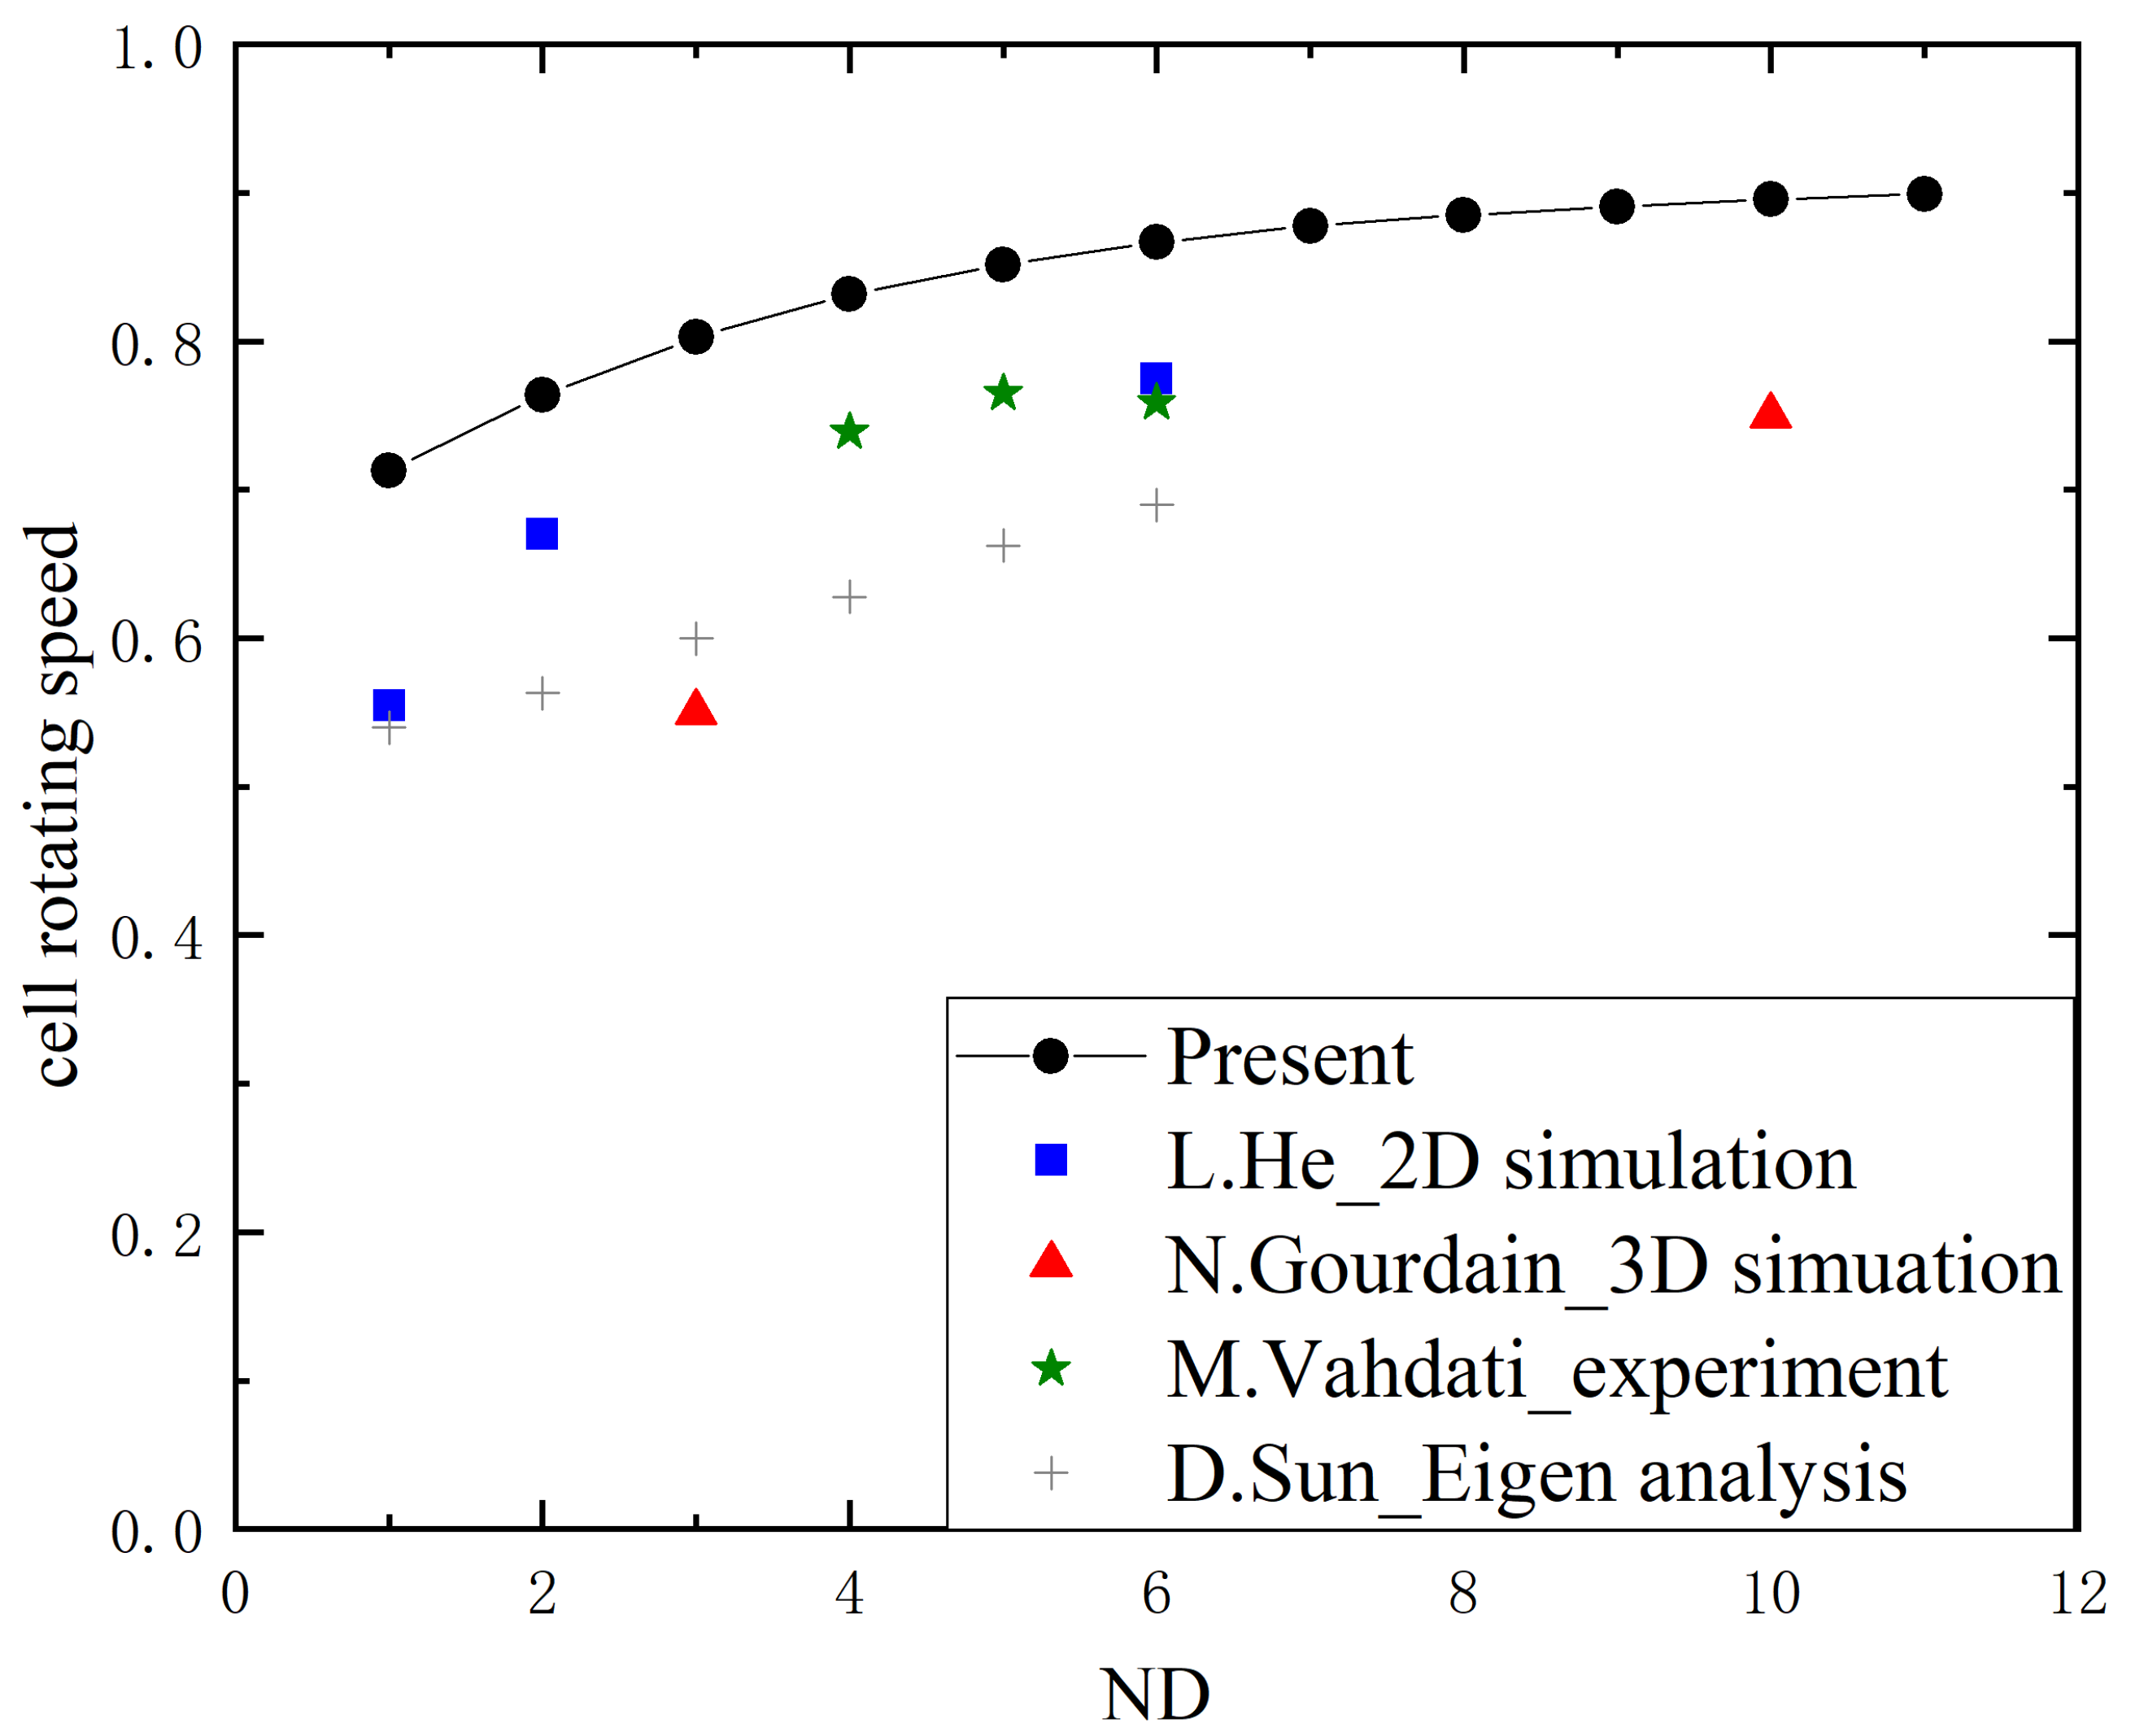
The other eight modes, as marked in Figure 3a, were also visualized to reveal their nodal diameters (not presented here to save space). The nodal diameters of modes 1, 2, and 6–11 are 1, 2, and 6–11, respectively. The traveling speeds of the 11 eigenmodes are plotted in Figure 7. It can be seen that the traveling speed of an eigenmode increases with the increase in the nodal diameter.
The relationship between the number of stall cells and rotating stall traveling speed has long been studied. He [8] introduced disturbances with different circumferential lengths in a single-blade-row case and captured different stall patterns. Gourdain et al. [9] carried out Fourier transformation in a numerical simulation and captured the signals of part and full span stall cells. Vahdati et al. [33] monitored the static pressure upstream of a fan and concluded that the disturbances were formed by many stall cells rotating at different speeds. Sun et al. [22] developed an eigenanalysis method and applied it to NASA Rotor 37, and the modes with different rotating speeds were obtained at the stall inception. Their findings about the relationship between the number of stall cells and rotating stall speed are also included in Figure 7. In general, the results in the present study are in accordance with those in the open literature.
Note that the quantitative difference between our results and others is not an indication of the inaccuracy of ours or others. This difference can be attributed to at least two aspects: 3D effects and nonlinearities. Our analysis is a 2D linear analysis, while others are 3D and/or nonlinear analyses, let alone the experimental results from Vahdati [33], of which the geometry may include things, like geometric mistuning, which are not considered in our analysis at all.

3.4. Unsteady Simulation

At point B, there are three unstable modes. Hence, the flow is unstable. If the projection of a disturbance onto the three eigenmodes is not zero, then the disturbance will grow exponentially. The growth rate is given by the real part of an eigenvalue as obtained through an eigenanalysis. To verify the eigenanalysis results, a time-accurate unsteady simulation was performed using the same solver of NutsCFD. In the unsteady analysis, the physical time step was set to 7.9 × 10 6 s, which is 1/800 of one period of mode 3 (leading mode). The physical time for the unsteady simulation was 4.2 s, which is more than 600 times the period of mode 3. The Newton–Krylov method was used for an inner loop.
A snapshot of the transient axial velocity field at 3.2 s with the base flow subtracted is shown in Figure 8. The transient axial velocity field has a strong resemblance to that of mode 3 as shown in Figure 4. The disturbance is mainly concentrated around the shock, suction side flow separation, and wake regions. The nodal diameter of three in the circumferential direction is also very clear.
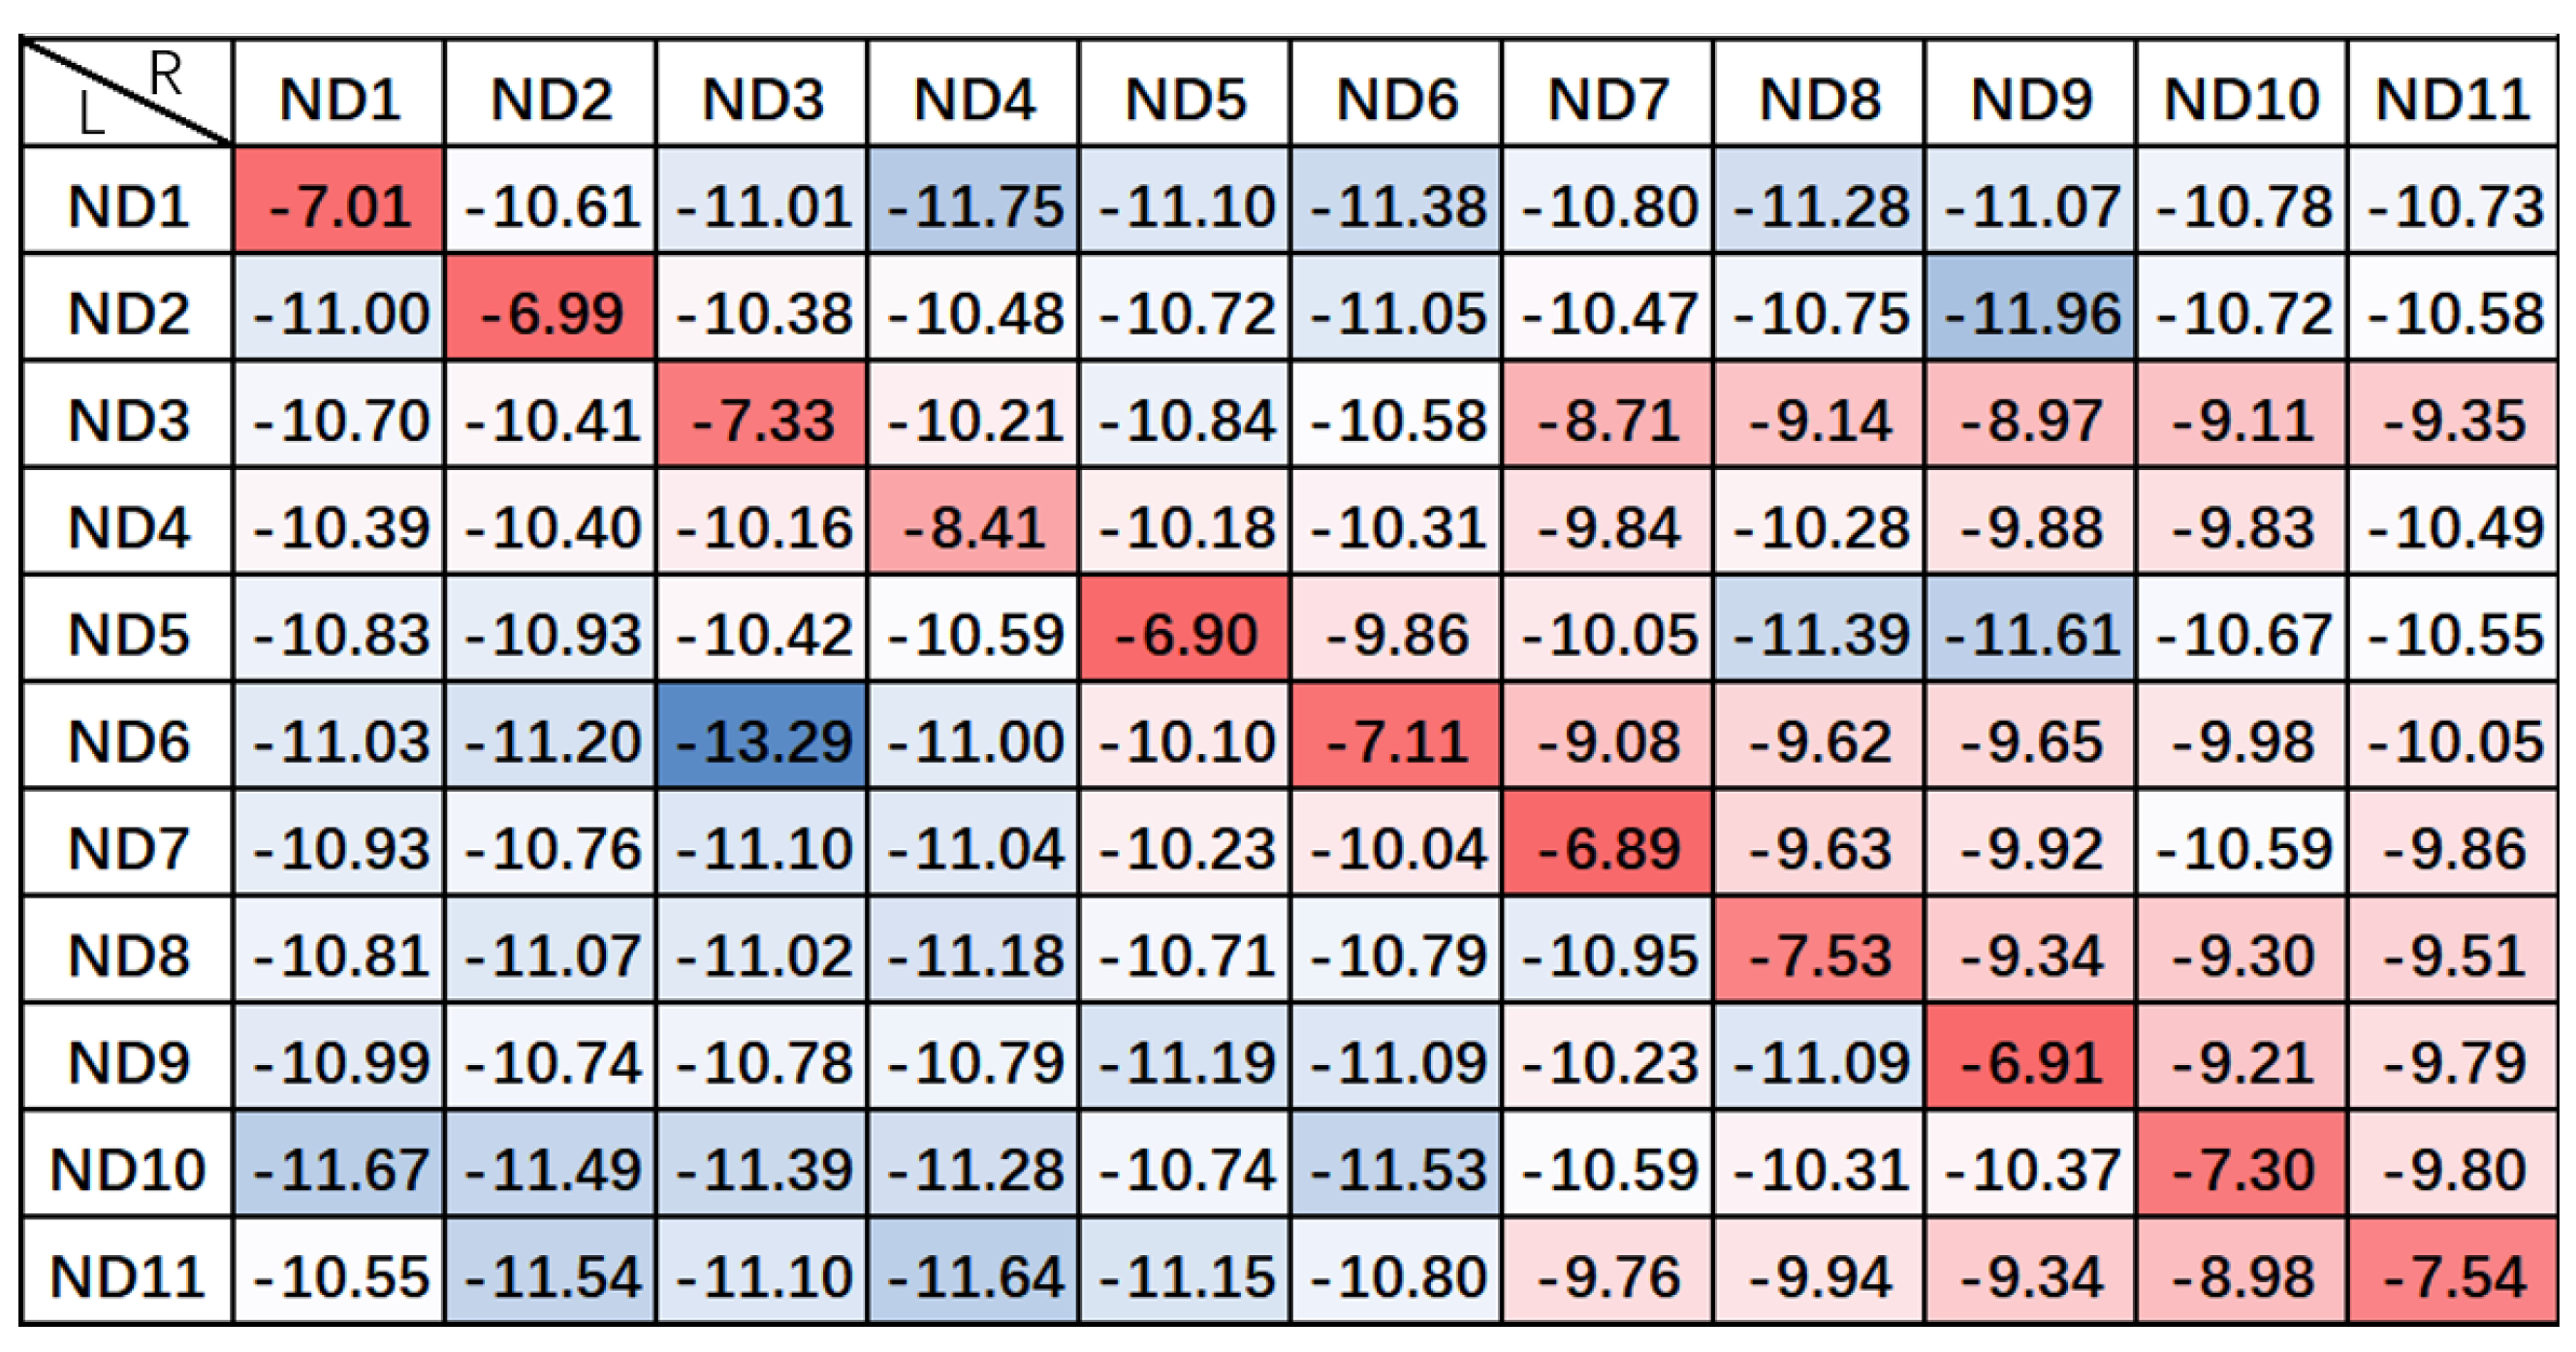
To perform a more quantitative verification of the eigenanalysis results, there is a need to compare the growth rate and frequency of an eigenmode with those from the unsteady analysis. To do this, the unsteady disturbance was projected onto an eigenmode to extract the growth rate and frequency. As mentioned earlier, the orthogonality between the eigenmodes plays a vital part in a projection calculation. Thus, the orthogonality of the eigenmodes was checked first. For the eleven eigenmodes, the dot products between the corresponding left and right eigenvectors are given in Figure 9 at a logarithmic scale. The magnitudes of the dot products are rendered with a blue-to-red colormap. For either a left or right eigenvector, its dot product with a right or left eigenvector of the same nodal diameter has the biggest magnitude. Ideally, the dot product between a left or right eigenvector with a right or left eigenvector of a different nodal diameter is machine zero. However, the dot products between eigenvectors of different nodal diameters in Figure 9 are far from machine zero. It is not clear what causes this deviation. The orthogonality deviation between eigenvectors will have a significant impact on the following projection analysis.
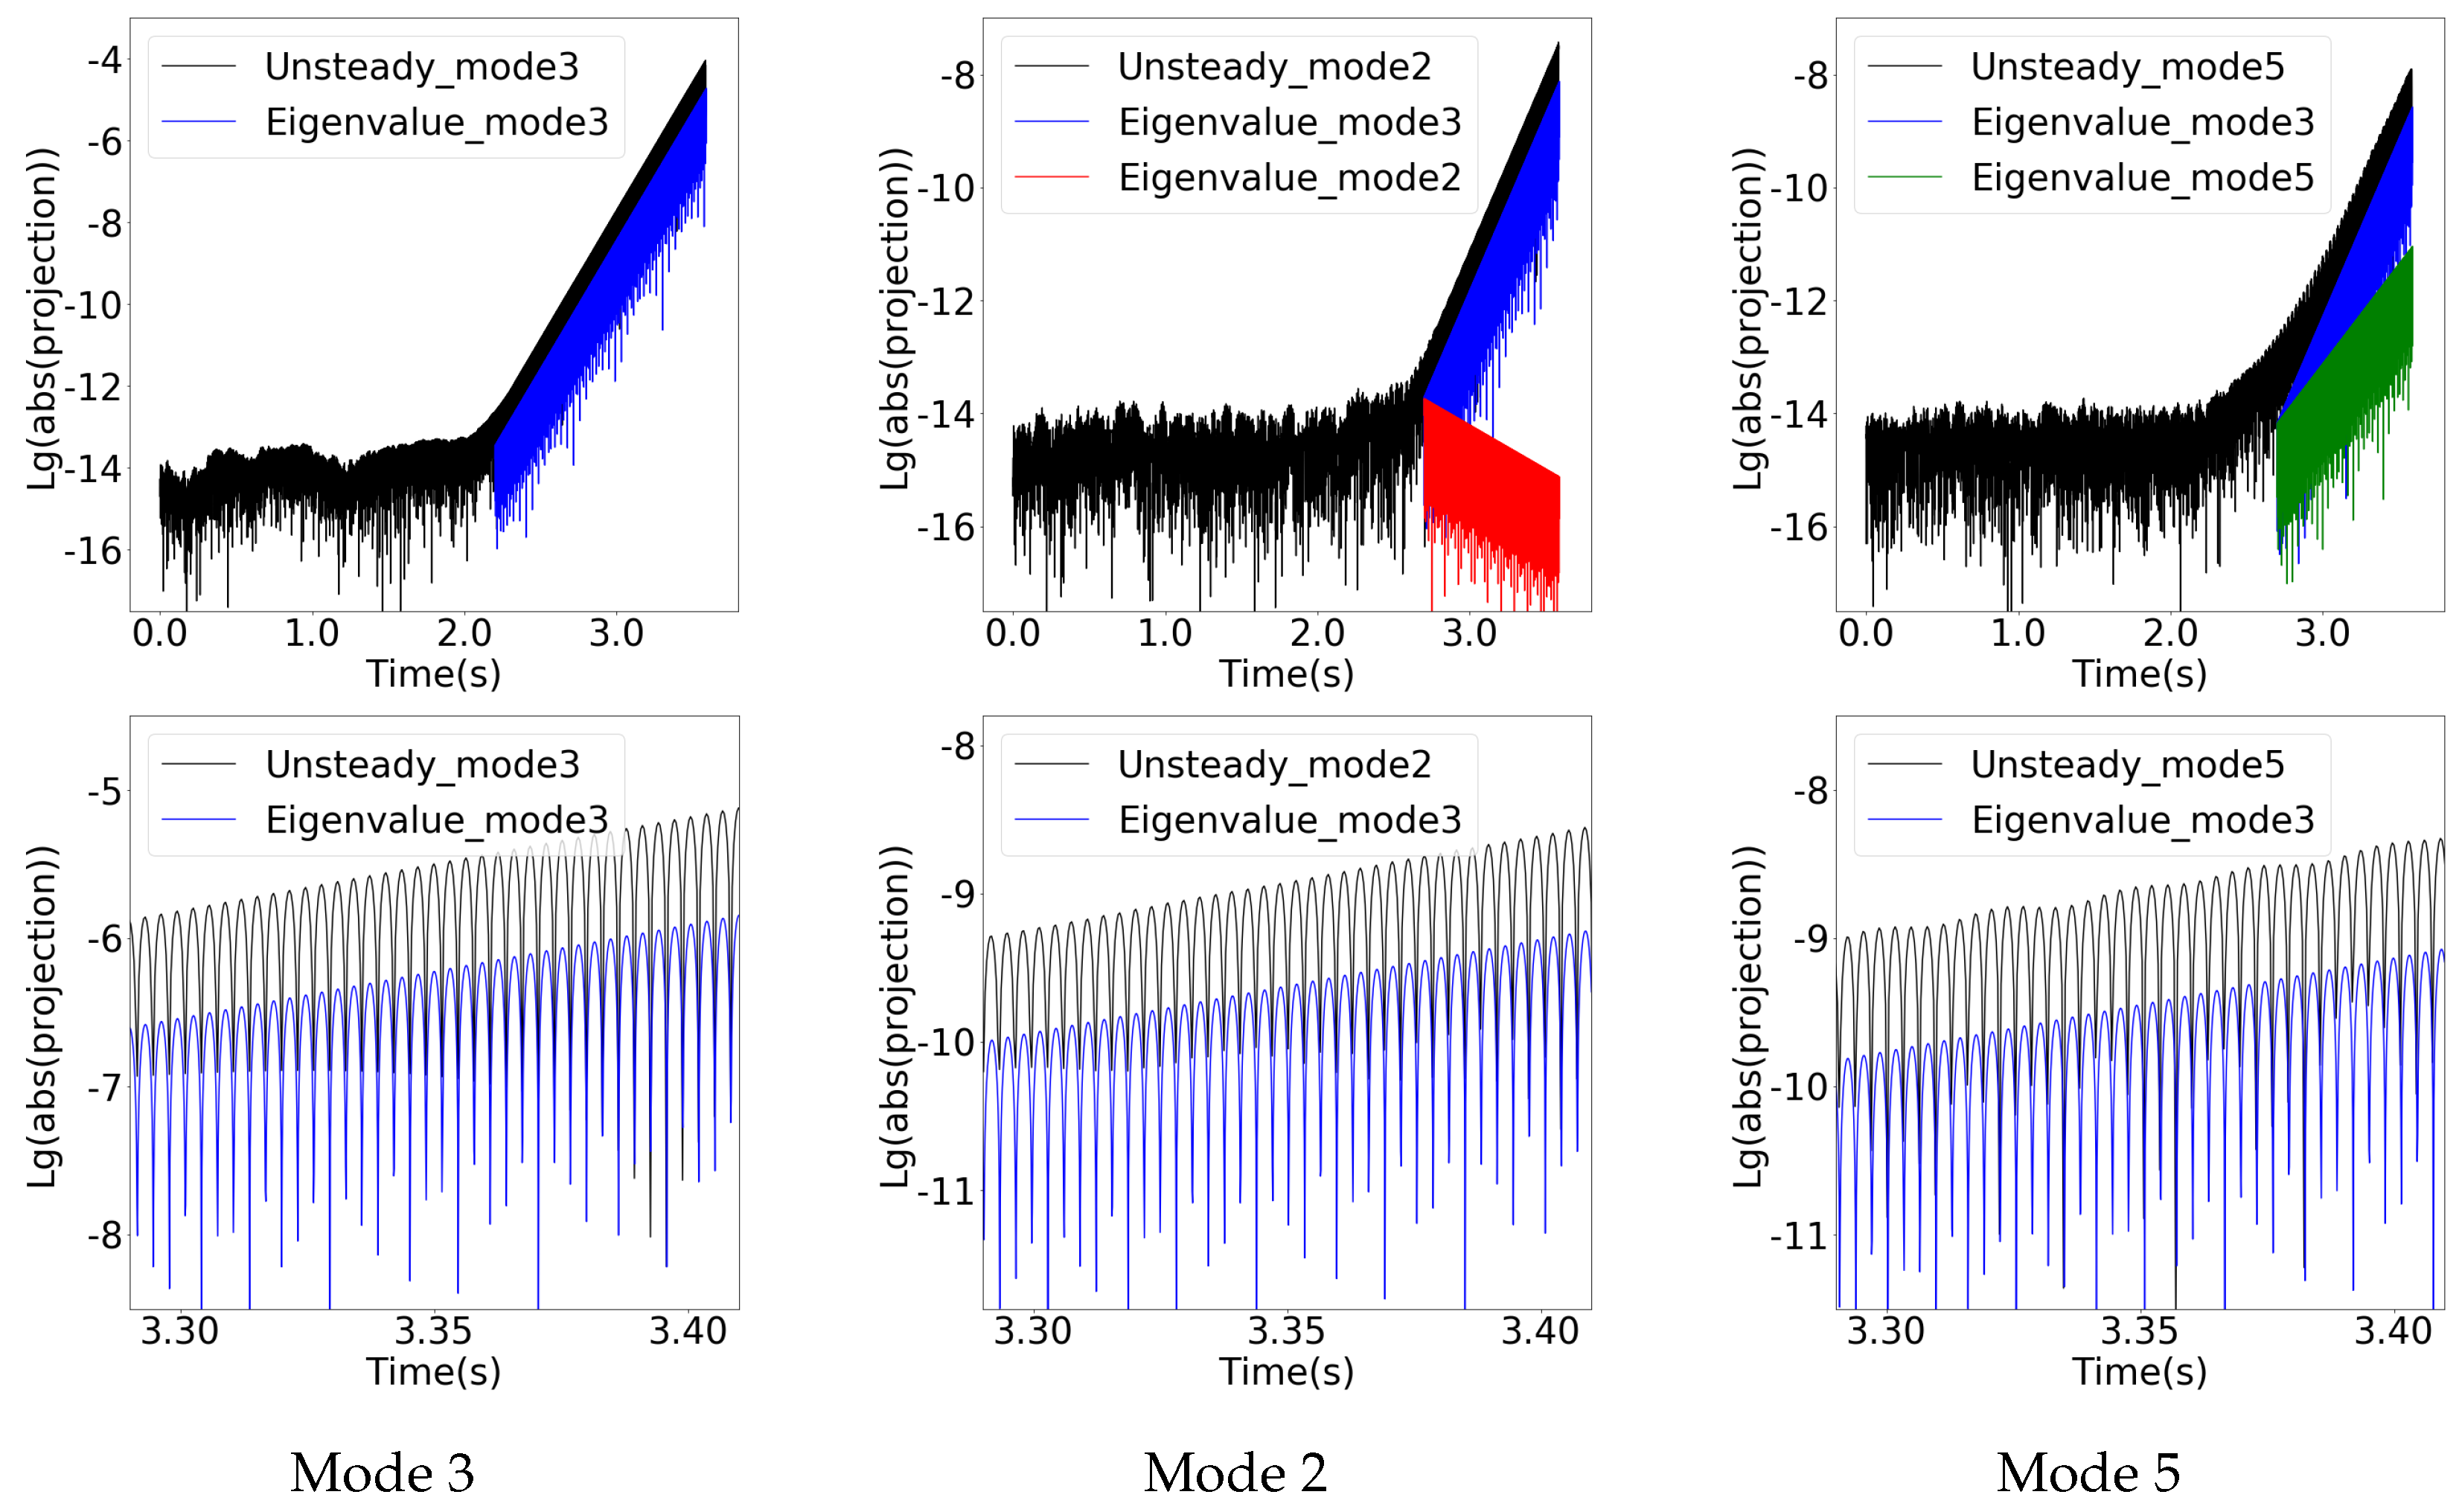
First, the projection of an unsteady disturbance onto mode 3 was analyzed. Figure 10 shows the evolution of the projection with time. For the first 2 s, the projection is dominated by noise due to rounding errors. After that, the projection grows exponentially. The reconstructed evolution from an eigenanalysis is also included for comparison. It can be seen that the slopes of the two time histories are in very good agreement. A close-up of the time histories is also included in Figure 10 to reveal the periods/frequencies. The frequency of the projection is also in good agreement with the eigenfrequency. This verifies the eigenvalue of mode 3 from the eigenanalysis.
Then, the investigation was also extended to other modes. The time evolutions of the projections of the unsteady disturbance onto mode 2 and mode 5 are presented in Figure 10. The evolutions of mode 2 and mode 5 reconstructed from the eigenanalysis are also included in the figure for comparison. The projections onto the two eigenmodes are in better agreement with mode 3 rather than their corresponding eigenmodes. The projection onto mode 2 is not decaying as suggested by the eigenanalysis. Furthermore, the growth rate of the mode 5 projection is also different from that from the eigenanalysis. It is speculated that this disagreement is attributed to the non-ideal orthogonality of eigenvectors and rounding errors.
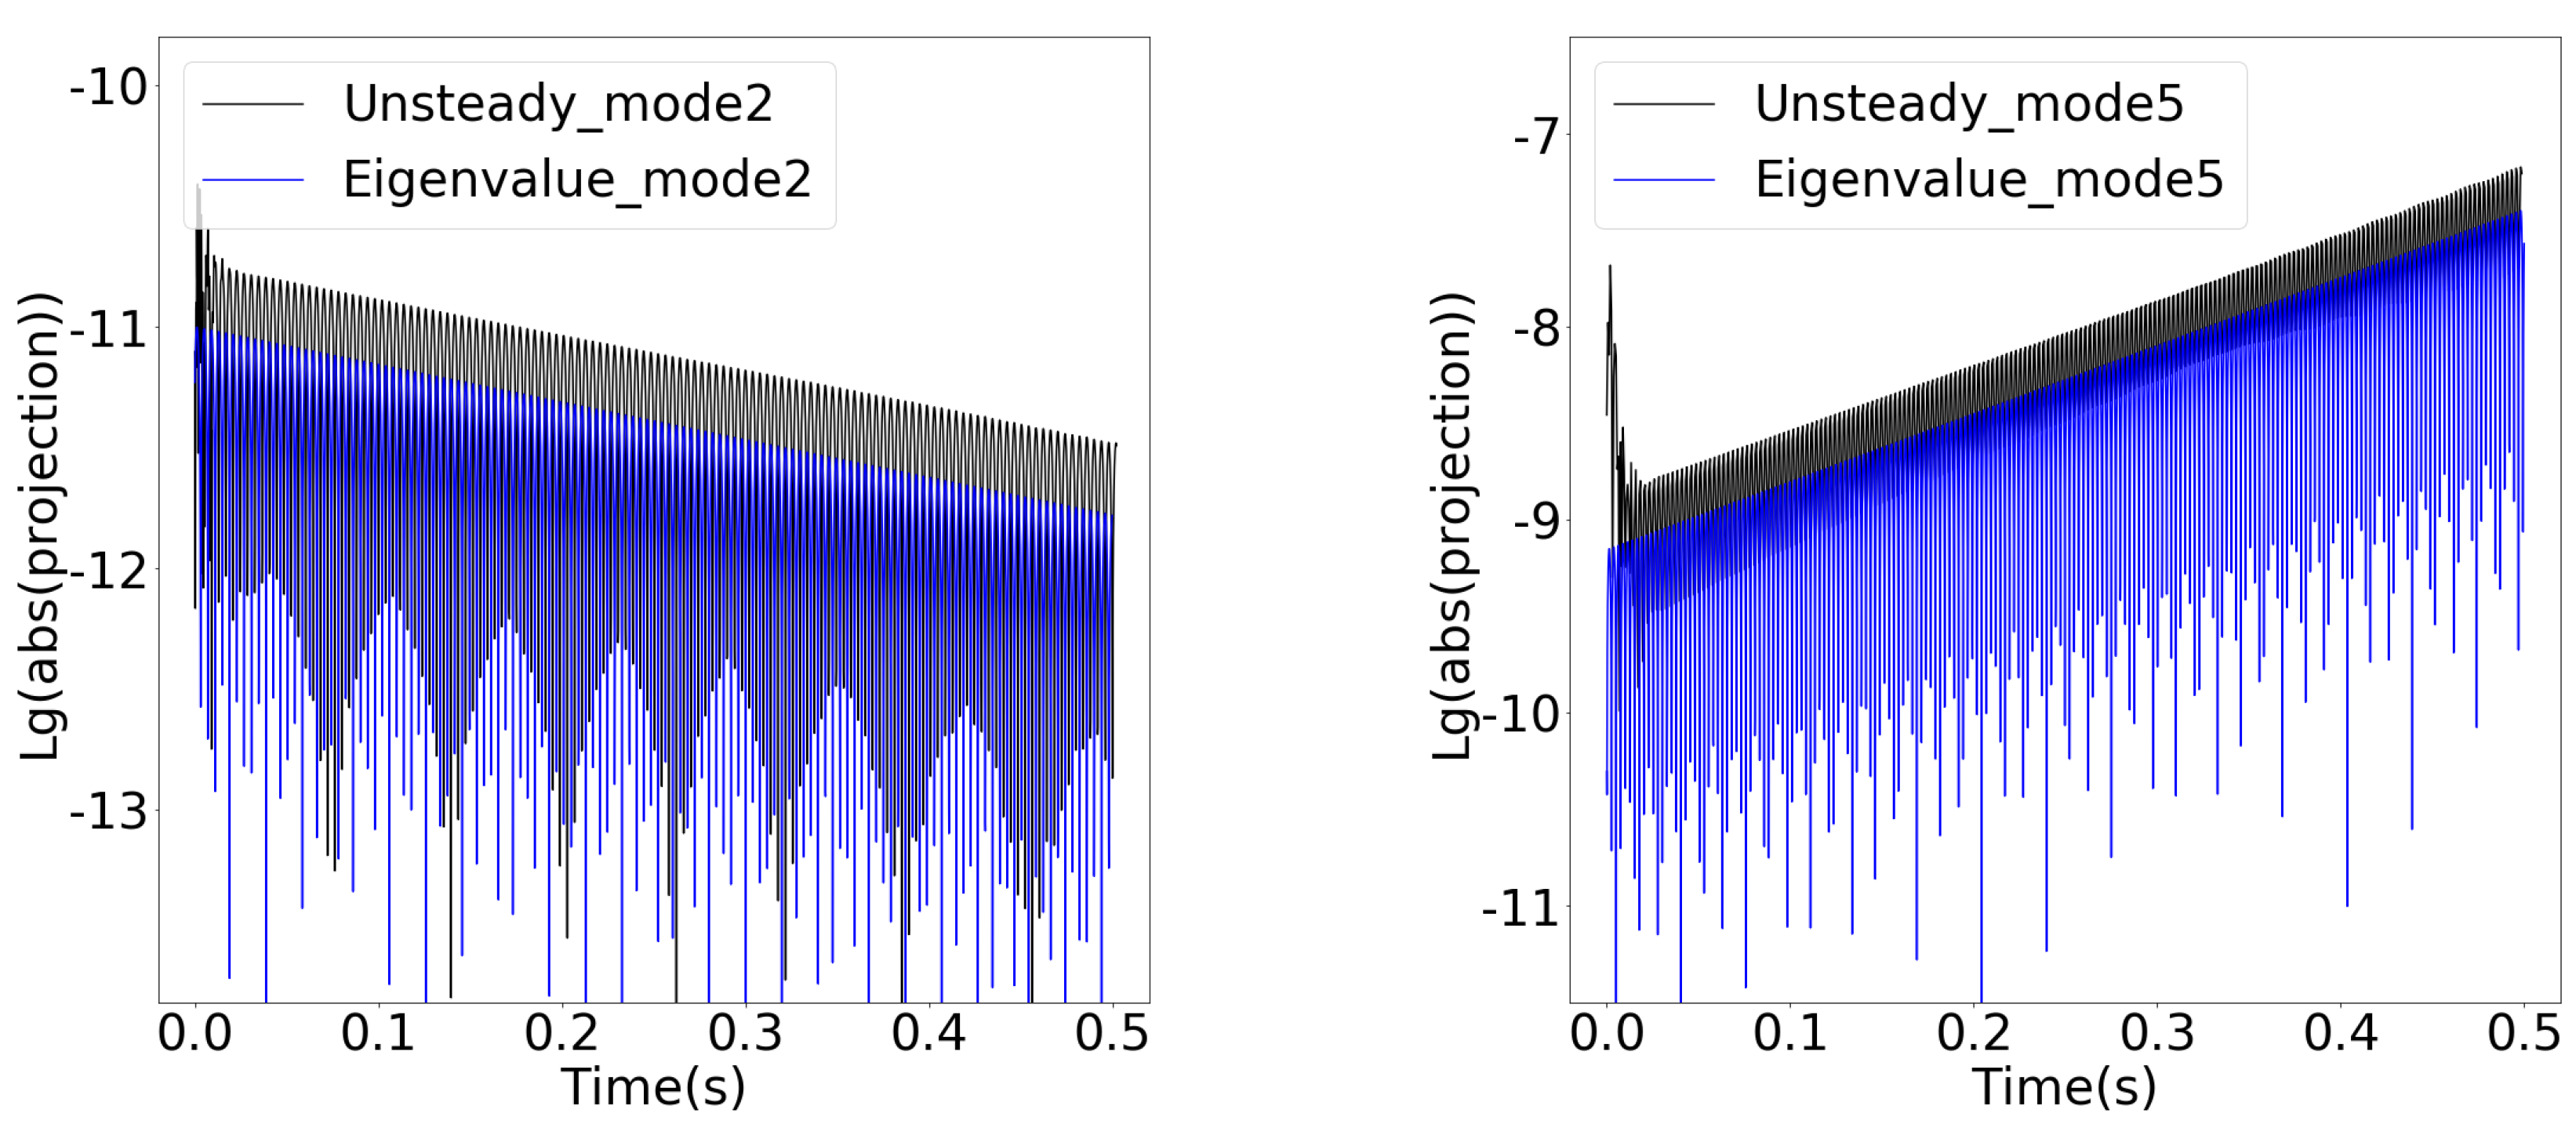
To verify this speculation, an extra unsteady analysis was performed. In this unsteady analysis, disturbances with a nodal diameter of two and a nodal diameter of five were introduced. The disturbances were introduced to the static pressure at the domain outlet in the initial solution:
δ p = 0.0001 · cos ( 2 θ ) + 0.01 · cos ( 5 θ )
The introduced disturbances were expected to increase the proportion of the relevant eigenmodes in the unsteady flow solution and reduce masking by mode 3. The evolutions of the projections onto mode 2 and mode 5 are plotted in Figure 11. Unlike the original projections, the growth rates and the frequencies of the projected mode 2 and mode 5 are the same as the ones obtained by the eigenanalysis method. This verifies the eigenvalues of mode 2 and mode 5 by the eigenanalysis method.

4. Conclusions

In this paper, the two-dimensional cascade at 50% span of NASA Rotor 67 was used to study the rotating stall inception using an eigenanalysis method. Based on the speed line from a steady analysis, a few eigenanalyses were performed at different operating points to determine the stability boundary; the eigenmodes, together with their growth rates and frequencies, were obtained. In order to verify the eigenanalysis results, time-accurate unsteady simulations were performed. The unsteady flow was projected onto different eigenmodes and the evolutions of the projections were monitored. The growth rates and the frequencies obtained by the two methods were compared and the following conclusions can be drawn:
  • The eigenanalysis results for the annular casade show that the bifurcation point is located between point B and point C. Point B is unstable and has three unstable modes. The unsteady simulation also verifies that the flow field is unstable at point B.
  • At point B, three time-varying flow perturbations are reconstructed from corresponding eigenmodes. The three flow perturbations are locally similar, with main components concentrated in the shock, suction side flow separation, and wake regions, but are globally different in nodal diameter in the circumferential direction. The three unstable modes are part of a family consisting of 11 modes with nodal diameters ranging from 1 to 11. It also reveals that all the 11 eigenmodes are traveling against the blade rotation in the rotating frame of reference. In the stationary frame of reference, the traveling speed of an eigenmode increases with the nodal diameter.
  • Unsteady analyses were performed to verify the eigenanalysis results. For the leading unstable mode 3 at point B, the nodal diameter, the growth rate, and the frequency from the eigenanalysis are verified by the unsteady analysis that is initialized using a converged steady solution. For mode 2 and mode 5, their growth rates and frequencies are verified through an unsteady analysis with disturbances of nodal diameters two and five to avoid masking by mode 3.
  • On the time cost side, the eigenanalysis method is much more efficient than the time-accurate unsteady analysis method. For this particular case, in a workstation with 24 cores and the CPU model Intel Xeon E52678W v4, it took 356.2 h to obtain the growth rate and frequency of an unstable mode, while it took 2.3 h to find the 10 most unstable eigenvalues using the eigenanalysis method. This demonstrates that the eigenanalysis method can be a more efficient method for stability analysis.

Author Contributions

Conceptualization, S.X., and D.W.; methodology, S.X., and D.W.; software, S.X.; investigation, S.X., D.W., and C.Y.; writing—original draft preparation, C.Y., and S.X.; writing—review and editing, S.X., C.H., D.W., C.M., H.C., D.C., and D.S.; supervision, S.X., and D.W.; funding acquisition, S.X., and D.W. All authors have read and agreed to the published version of the manuscript.

Funding

This research was funded by Science Center for Gas Turbine Project (Project No. P2022-C-II-001-001), the National Natural Science Foundation of China (Grant No. 52006177 and 51976172) and the National Science and Technology Major Project (Grant No. 2017-II-0009-0023).

Data Availability Statement

Data is contained within the article.

Conflicts of Interest

The authors declare no conflicts of interest.

References

  1. Pampreen, R.C. Compressor Surge and Stall; Concepts ETI, Inc.: Norwich, VT, USA, 1993; p. 457. [Google Scholar]
  2. Iura, T.; Rannie, W.D. Observations of Propagating Stall in Axial-Flow Compressors; California Institute of Technology: Pasadena, CA, USA, 1953; pp. 16–19. [Google Scholar]
  3. Emmons, H.W.; Pearson, C.E.; Grant, H.P. Compressor surge and stall Propagation. Trans. ASME 1955, 77, 455–469. [Google Scholar] [CrossRef]
  4. Day, I.J. Stall inception in axial flow compressors. ASME J. Turbomach. 1993, 113, 1–9. [Google Scholar] [CrossRef]
  5. Lieblein, S.; Schwenk, F.C.; Broderick, R.L. Diffusion Factor for Estimating Losses and Limiting Blade Loadings in Axial-Flow Compressor Blade Elements; NACA RM E53D01; National Advisory Committee for Aeronautics: Washington, DC, USA, 1953.
  6. Lieblein, S. Loss and stall analysis of compressor cascades. ASME J. Basic Eng. 1959, 81, 387–400. [Google Scholar] [CrossRef]
  7. Koch, C.C. Stalling pressure rise capability of axial flow compressor stages. J. Eng. Power 1981, 103, 645–656. [Google Scholar] [CrossRef]
  8. He, L. Computational Study of Rotating-Stall Inception in Axial Compressors. J. Propuls. Power 1997, 13, 31–38. [Google Scholar] [CrossRef]
  9. Gourdain, N.; Burguburu, S.; Leboeuf, F.; Miton, H. Numerical simulation of rotating stall in a subsonic compressor. Aerosp. Sci. Technol. 2006, 10, 9–18. [Google Scholar] [CrossRef]
  10. Romera, D.; Corral, R. Nonlinear stability analysis of a generic fan with distorted inflow using passage-spectral method. J. Turbomach. 2021, 143, 061001. [Google Scholar] [CrossRef]
  11. Zhang, W.; Vahdati, M. A Parametric Study of the Effects of Inlet Distortion on Fan Aerodynamic Stability. J. Turbomach. 2019, 141, 011011. [Google Scholar] [CrossRef]
  12. Lee, K.; Wilson, M.; Vahdati, M. Effects of Inlet Disturbances on Fan Stability. J. Eng. Gas Turbines Power 2018, 141, 051014. [Google Scholar] [CrossRef]
  13. Abdessemed, N.; Sherwin, S.J.; Theofilis, V. Linear instability analysis of low-pressure turbine flows. J. Fluid Mech. 2009, 628, 57–83. [Google Scholar] [CrossRef]
  14. Rocco, G.; Zaki, T.; Mao, X.; Blackburn, H.; Sherwin, S.J. Floquet and transient growth stability analysis of a flow through a compressor passage. Aerosp. Sci. Technol. 2015, 44, 116–124. [Google Scholar] [CrossRef]
  15. Jackson, C.P. A finite-element study of the onset of vortex shedding in flow past variously shaped bodies. J. Fluid Mech. 1987, 182, 23–45. [Google Scholar] [CrossRef]
  16. Zebib, A. Stability of viscous flow past a circular cylinder. J. Eng. Math. 1987, 21, 155–165. [Google Scholar] [CrossRef]
  17. Crouch, J.D.; Garbaruk, A.; Magidov, D. Predicting the Onset of Flow Unsteadiness Based on Global Instability. J. Comput. Phys. 2007, 224, 924–940. [Google Scholar] [CrossRef]
  18. Crouch, J.D.; Garbaruk, A.; Magidov, D.; Jacquin, L. Global structure of buffeting flow on transonic airfoils. In Proceedings of the IUTAM Symposium on Unsteady Separated Flows and their Control, Corfu, Greece, 18–22 June 2007; Springer: Dordrecht, The Netherlands, 2009; pp. 297–306. [Google Scholar]
  19. Timme, S. Global Instability of Wing Shock-Buffet Onset. J. Fluid Mech. 2020, 885, A37. [Google Scholar] [CrossRef]
  20. Sorensen, D.C. Implicit application of polynomial filters in a k-step Arnoldi method. SIAM J. Matrix Anal. Appl. 1992, 13, 357–385. [Google Scholar] [CrossRef]
  21. Gordon, K.A. Three-Dimensional Rotating Stall Inception and Effects of Rotating Tip Clearance Asymmetry in Axial Compressors. Ph.D. Thesis, Massachusetts Institute of Technology, Cambridge, MA, USA, 1999. [Google Scholar]
  22. Sun, X.; Liu, X.; Hou, R.; Sun, D. A General Theory of Flow-Instability Inception in Turbomachinery. AIAA J. 2013, 51, 1675–1687. [Google Scholar] [CrossRef]
  23. Sun, X.; He, C.; Liu, X.; Ma, Y.; Sun, D. Research Progress in Prediction of Flow Instability of Aero-Compressor. J. Propuls. Technol. 2017, 38, 2172–2185. [Google Scholar]
  24. Sun, X.; Ma, Y.; Liu, X.; Sun, D. Flow stability model of centrifugal compressors based on eigenvalue approach. AIAA J. 2016, 54, 2361–2376. [Google Scholar] [CrossRef]
  25. Xu, S.; He, C.; Sun, D.; Wang, D. Flow Instability Prediction via Eigenanalysis and Its Application to Rotating Stall. In Proceedings of the Global Power & Propulsion Society, Beijing, China, 16–18 September 2019. [Google Scholar]
  26. Xu, S.; Li, Y.; Huang, X.; Wang, D. Robust Newton–Krylov Adjoint Solver for the Sensitivity Analysis of Turbomachinery Aerodynamics. AIAA J. 2021, 59, 4014–4030. [Google Scholar] [CrossRef]
  27. Spalart, P.; Allmaras, S. A one-equation turbulence model for aerodynamic flows. In Proceedings of the 30th Aerospace Sciences Meeting and Exhibit, Reno, NV, USA, 6–9 January 1992. [Google Scholar]
  28. Langer, S. Agglomeration multigrid methods with implicit Runge–Kutta smoothers applied to aerodynamic simulations on unstructured grids. J. Comput. Phys. 2014, 277, 72–100. [Google Scholar] [CrossRef]
  29. Hascoet, L.; Pascual, V. The Tapenade automatic differentiation tool: Principles, model, and specification. ACM Trans. Math. Softw. (TOMS) 2013, 39, 1–43. [Google Scholar] [CrossRef]
  30. Gebremedhin, A.H.; Nguyen, D.; Patwary, M.M.A.; Pothen, A. Colpack: Software for graph coloring and related problems in scientific computing. ACM Trans. Math. Softw. (TOMS) 2013, 40, 1–31. [Google Scholar] [CrossRef]
  31. Lehoucq, R.B.; Sorensen, D.C.; Yang, C. ARPACK Users’ Guide—Solution of Large-Scale Eigenvalue Problems with Implicitly Restarted Arnoldi Methods; SIAM: Philadelphia, PA, USA, 1998. [Google Scholar]
  32. Strazisar, A.J.; Wood, J.R.; Hathaway, M.D.; Sude, K.L. Laser Anemometer Measurements in a Transonic Axial-Flow Fan Rotor; NASA Technical Paper 2879; National Aeronautics and Space Administration: Washington, DC, USA, 1989.
  33. Choi, M.K.; Vahdati, M. Numerical strategies for capturing rotating stall in fan. Proc. Inst. Mech. Eng. Part A J. Power Energy 2011, 225, 655–664. [Google Scholar] [CrossRef]
Figure 1. NASA Rotor 67, the test configuration at 50% blade span, and the computation domain.
Ijtpp 09 00020 g001
Figure 2. Speed lines for grid independence study (eigenanalyses were performed at the three near stall operating points of A, B and C).
Ijtpp 09 00020 g002
Figure 3. Eigen-spectra obtained from eigenvalue analyses.
Ijtpp 09 00020 g003
Figure 4. Reconstructed snapshots (left) and time traces (right) for mode 3.
Ijtpp 09 00020 g004
Figure 5. Reconstructed snapshots (left) and time traces (right) for mode 4.
Ijtpp 09 00020 g005
Figure 6. Reconstructed snapshots (left) and time traces (right) for mode 5.
Ijtpp 09 00020 g006
Figure 7. Correlation between rotating speed in the stationary frame of reference and nodal diameter of the eigenmodes.
Ijtpp 09 00020 g007
Figure 8. A snapshot of the axial velocity field at 3.2 s.
Ijtpp 09 00020 g008
Figure 9. Dot products between eleven right and left eigenvectors (at a logarithmic scale).
Ijtpp 09 00020 g009
Figure 10. Evolutions of projections onto the selected modes.
Ijtpp 09 00020 g010
Figure 11. Evolutions of projections onto mode 2 and mode 5 with introduced perturbations.
Ijtpp 09 00020 g011
Disclaimer/Publisher’s Note: The statements, opinions and data contained in all publications are solely those of the individual author(s) and contributor(s) and not of MDPI and/or the editor(s). MDPI and/or the editor(s) disclaim responsibility for any injury to people or property resulting from any ideas, methods, instructions or products referred to in the content.