Article

Design and Characterization of Highly Diffusive Turbine Vanes Suitable for Transonic Rotating Detonation Combustors †

Zucrow Laboratories, Purdue University, 500 Allison Road, West Lafayette, IN 47907, USA
*
Author to whom correspondence should be addressed.
This paper is an extended version of our paper published in the Proceedings of the 15th European Turbomachinery Conference, Budapest, Hungary, 24–28 April 2023.
Int. J. Turbomach. Propuls. Power 2024, 9(2), 18; https://doi.org/10.3390/ijtpp9020018
Submission received: 22 December 2023 / Revised: 11 January 2024 / Accepted: 29 March 2024 / Published: 9 May 2024

Abstract

:
In rotating detonation engines the turbine inlet conditions may be transonic with unprecedented unsteady fluctuations. To ensure an acceptable engine performance, the turbine passages must be suited to these conditions. This article focuses on designing and characterizing highly diffusive turbine vanes to operate at any inlet Mach number up to Mach 1. First, the effect of pressure loss on the starting limit is presented. Afterward, a multi-objective optimization with steady RANS simulations, including the endwall and 3D vane design is performed. Compared to previous research, significant reductions in pressure loss and stator-induced rotor forcing are obtained, with an extended operating range and preserving high flow turning. Finally, the influence of the inlet boundary layer thickness on the vane performance is evaluated, inducing remarkable increases in pressure loss and downstream pressure distortion. Employing an optimization with a thicker inlet boundary layer, specific endwall design recommendations are found, providing a notable improvement in both objective functions.

1. Introduction

Rotating detonation combustors are a potential alternative to minimize fuel consumption and greenhouse gas emissions for future power generation thanks to the total pressure increase during the combustion process. Sousa et al. [1] built an engine model replacing the deflagration-based combustor with a pressure gain. To precisely quantify the overall benefit on the engine, the impact of the combustor on other components was assessed using NASA’s software T-MATS [2]. The engine efficiency rose by 5 percentage points at low-pressure ratios, compared to the traditional Joule–Brayton cycle. However, the pressure augmentation is achieved through a rotating shock-induced combustion wave [3], which introduces a transient behavior at the exhaust. Braun et al. [4] evaluated the flow field in an RDC with different accelerating and diffusing passages using unsteady RANS simulations, showing that the outlet Mach number fluctuates and that it can be subsonic or supersonic. Thus, combustor–turbine integration demands ad-hoc designs to maximize the aerodynamic performance potential.
To extract power efficiently from the transonic outflow of RDCs, Liu et al. [5] proposed different options. One is to install a nozzle downstream of the combustor, to accelerate the flow beyond Mach 2 and damp the fluctuations, and then use a supersonic axial turbine. Nonetheless, this configuration provides little flow turning and its operating envelope is restricted to inlet Mach numbers higher than two, due to unstarting [6]. The starting Mach number depends exclusively on the inlet-to-throat passage area ratio [7]; hence, to attain more flow turning in supersonic turbines, the inlet Mach number must be increased further. However, this yields stronger shock and viscous losses [8]. To lower the starting Mach number and extend the operating range without reducing the vane turning, the turbine endwall geometry may be modified. Mushtaq et al. [9] studied the effect of the endwall design in supersonic turbines for RDEs. The channel height was increased by 20% along the stator and rotor passages but the inlet Mach number was still limited to values equal to or beyond two, to guarantee started operation. This suggests that a larger outlet-to-inlet height ratio is necessary to extend the working range to a lower supersonic regime.
Another option consists of a diffuser that decelerates the flow to the high subsonic regime, followed by an axial turbine. Nevertheless, conventional subsonic turbines operate at inlet Mach numbers typically around 0.1–0.15 and are unable to ingest high subsonic inflows. As a result, Liu et al. [10] proposed using endwall diffusion in the stator row to obtain started operation at an inlet Mach number of 0.6. Nonetheless, the diffusion in the radial direction introduced flow detachment near the endwalls, penalizing the aerodynamic performance. Liu et al. [5] obtained efficiency enhancements of up to 12 percentage points at steady-state conditions by optimizing the endwall contour of a subsonic axial turbine with a multi-step approach, including a steady optimization followed by an unsteady one with only three design parameters. The unsteady-optimized turbine outperformed the steady-optimized under pulsating conditions; however, the latter still offered notable efficiency gains compared to the baseline design.
This manuscript proposes, for the first time in the open literature, design guidelines for highly diffusive turbine vanes that ingest flow up to Mach 1, suitable for RDCs with transonic outflows. The novelty of the current research resides in the parametrization and combined design of the 3D vane and endwall profile. First, a multi-objective optimization with steady RANS simulations is carried out, with pressure loss and downstream pressure distortion as the objectives. The design trends and their impact on the flow field and performance are discussed. Afterward, the performance of the optimized designs is evaluated with a different level of inlet boundary layer thickness. Finally, an additional optimization, including a thicker inlet boundary layer is performed, highlighting the geometric differences with the previously optimized designs and the impact of the geometry variations on flow detachment.

2. Effect of Pressure Losses on the Starting

The exhaust of an RDC may be in the high subsonic-transonic or supersonic regime, depending on the pressure ratio across the combustor [3]. To maximize the potential thermodynamic cycle improvement, the turbine passages must be tailored to accept high inlet Mach numbers, avoiding unstarted operation. Paniagua et al. [7] showed that the starting limit is exclusively defined by the inlet Mach number and the throat-to-inlet area ratio, which limits the maximum vane turning, hence restricting power extraction. For a supersonic inflow, if this constraint is not respected, sonic conditions will be reached before the geometric throat. This results in an unstable condition in which an unsteady shock wave is pushed up to the inlet, unstarting the passage and creating a pronounced increase in total pressure loss. On the other hand, for a subsonic inflow, the mass flow will be reduced, shifting the operating point of the combustor. This is especially disturbing in RDCs, given their highly transient behavior.
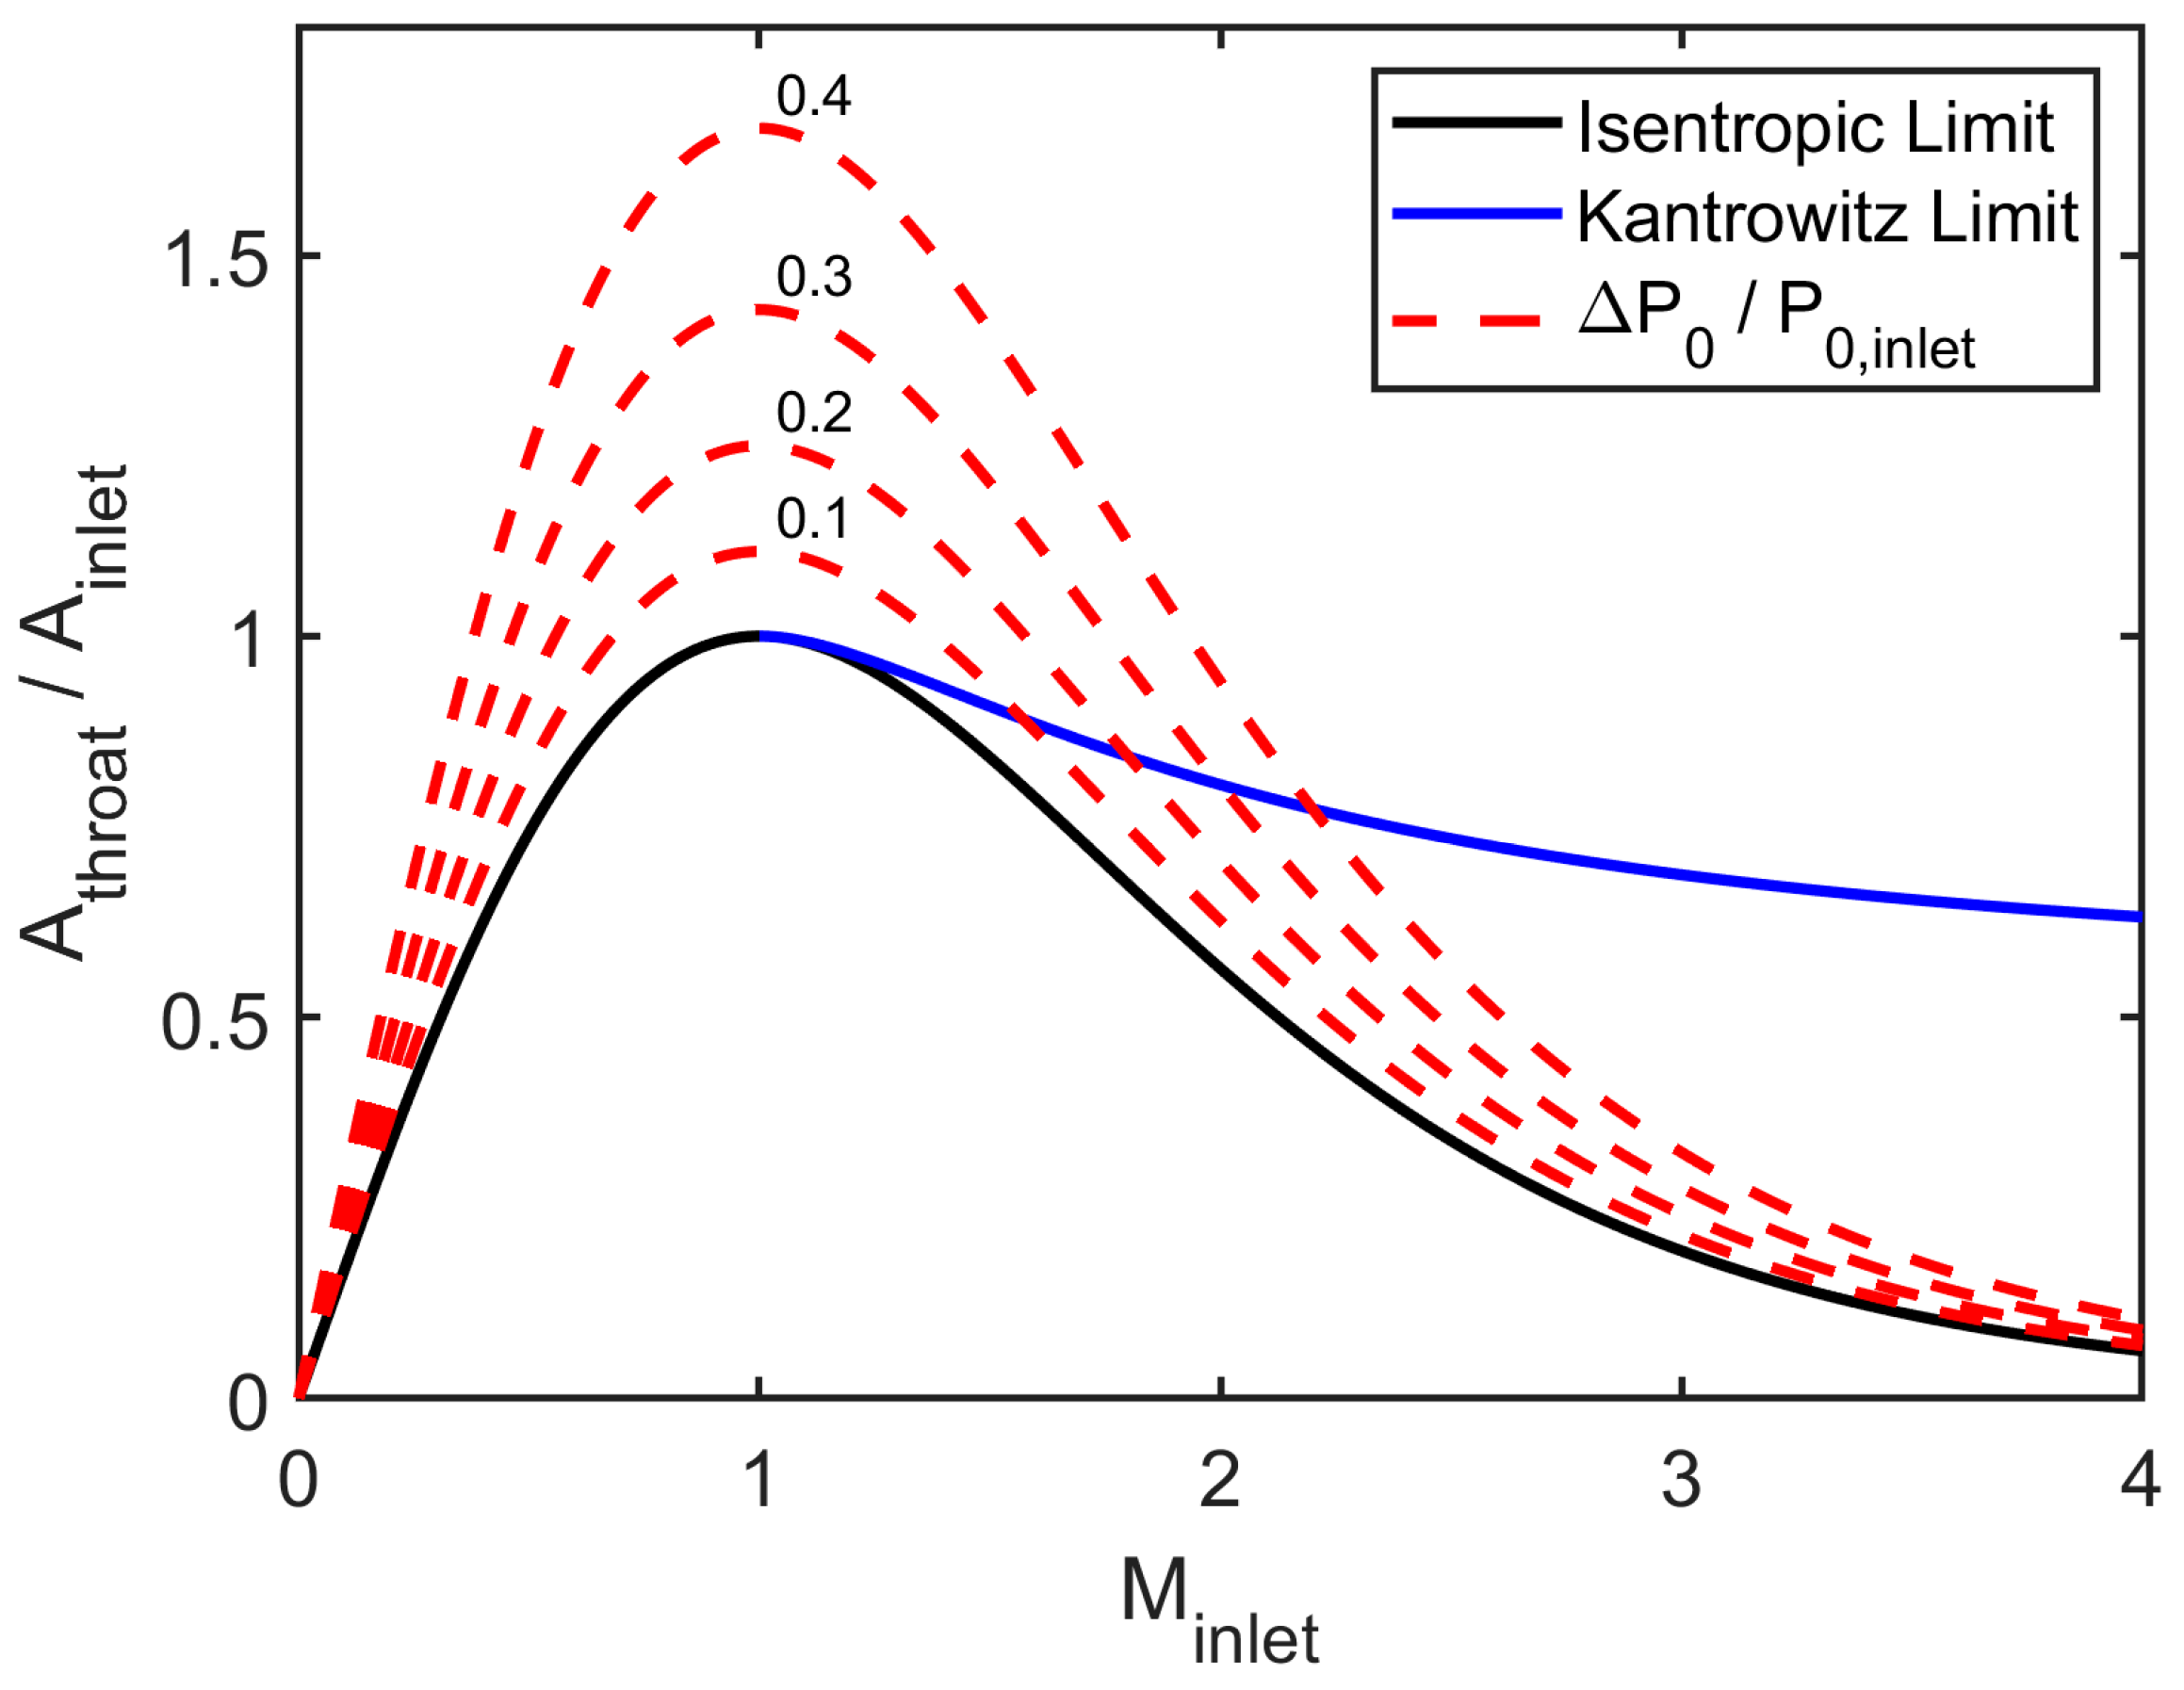
Paniagua et al. [7] computed this limit assuming isentropic flow. However, to accurately determine the unstarting condition and the operating range of the NGV, it is essential to consider the pressure loss [11]. Using the compressible mass-flow equation defined by Equation (1), equating mass flows at the inlet and the throat and assuming no change in total temperature and specific heat ratio, Equation (2) is obtained in which the minimum required throat-to-inlet area ratio is a function of the inlet Mach number and the ratio of total pressures. Figure 1 displays the limit for different pressure loss levels, up to 40% of the inlet value, assuming γ = 1.3.
m ˙ = γ R T 0 P 0 · A · D M
A t h A i n = D M i n P 0 , i n D 1 P 0 , t h
For any inlet Mach number, the larger the pressure loss, the larger the area ratio must be. The effect is the same as in Fanno Flow; a drop in total pressure pushes the outlet Mach number towards 1 for subsonic and supersonic conditions [12]. Nevertheless, the impact is minor for low-subsonic and high-supersonic inflows, whereas it becomes critical in the transonic regime. For instance, for an inlet Mach number of 0.8, the limiting area ratio in an isentropic flow is 0.95. With a 10% pressure loss, the value increases to 1.05, and for a 30% loss, it grows to 1.4. Thus, it is essential to consider this effect to ensure the starting of the passage and to determine the range of operation. Additionally, if the pressure loss rises significantly while increasing the area ratio, the operating range may not be enlarged. The pressure loss effect is particularly relevant for cases in the low-supersonic regime, where the appearance of shocks and shock-boundary layer interactions may cause a notable growth in loss, potentially requiring higher area ratios than for the Mach 1 condition.

3. Methodology of NGV Optimization

3.1. Optimization Methodology

As mentioned before, the outflow of an RDC exhibits a transient behavior; therefore, unsteady simulations (URANS) would provide a more precise representation of the flow field and performance of the NGV. Nonetheless, the computational cost is significantly higher than in steady RANS. This becomes a critical factor in an optimization context since more expensive simulations would inherently reduce the number of individuals that can be run, complicating the identification of design guidelines, which is one of the main objectives of the work. Thus, a steady approach is preferred for the optimization.
A schematic of the optimization routine is included in Figure 2. The first step is geometry generation, using a parametric model with 47 design parameters. Then the individuals are meshed before solving the 3D RANS equations. In the post-processing phase, the two objective functions (pressure loss and distortion) are computed and sent to a differential evolution optimizer based on genetic algorithms. This kind of evolutionary algorithm can deal with complex problems and is well suited to multi-objective optimization cases [13], being commonly used for turbomachinery optimizations. Finally, based on the design and the performance of the previous individuals, the optimizer creates a new population and the process is repeated.
The first objective is to minimize pressure loss, which is evaluated with the pressure loss coefficient ( Y P = ( P 01 P 02 ) / ( P 02 P 2 )). The second objective is to reduce the stator-induced forcing on the rotor, abate tonal noise and prevent harmful structural vibrations. Puente et al. [14] proposed a model based only on steady computations, considering the non-uniformity of the pressure field downstream of the stator as the main source of rotor forcing. Joly et al. [15] used the standard deviation along the pitch-wise direction as a metric to assess the pressure distortion, which proved effective in reducing the unsteady forcing on the rotor. In this case, the same metric is employed, computing it at an axial plane 25% of the chord downstream of the vane trailing edge, expressed by Equation (3). First, the pitch-wise standard deviation is calculated at ten different spans, from 5% to 95%, with 10% increments. For averaging purposes, each value is considered representative over an area covering +/− 5% span (e.g., a 5% span value is assumed to cover an area from 0 to 10% span). Finally, an area-averaged value is obtained, using Equation (4). Despite not being defined as an objective function, an extended inlet Mach number operating range is desired, ideally up to Mach 1, achieving complete operation in the subsonic regime, which constrains the throat-to-inlet area ratio of the selected designs.
σ = θ 0 θ 0 + p i t c h ( p 1.25 C , θ p ¯ ) 2 p i t c h d θ
σ a v = i = 1 n = 10 σ i A i A t o t a l

3.2. Parametric Model

Parametrization is a critical part of the optimization, as it establishes the type of geometries that may be generated. A large number of parameters (design vector) provides an improved geometric resolution; however, more individuals are required to assess the impact of every parameter. Moreover, it becomes harder to interpret the effect of each parameter on the objective functions [15]. On the other hand, the design space, defined by the upper and lower bounds of each parameter, determines the level of geometric variety. A vast design space will probably be able to represent the ideal shape. However, it will also generate more poor-performing or unphysical geometries, potentially increasing the computational cost of the optimization. Thus, a compromise must be found.
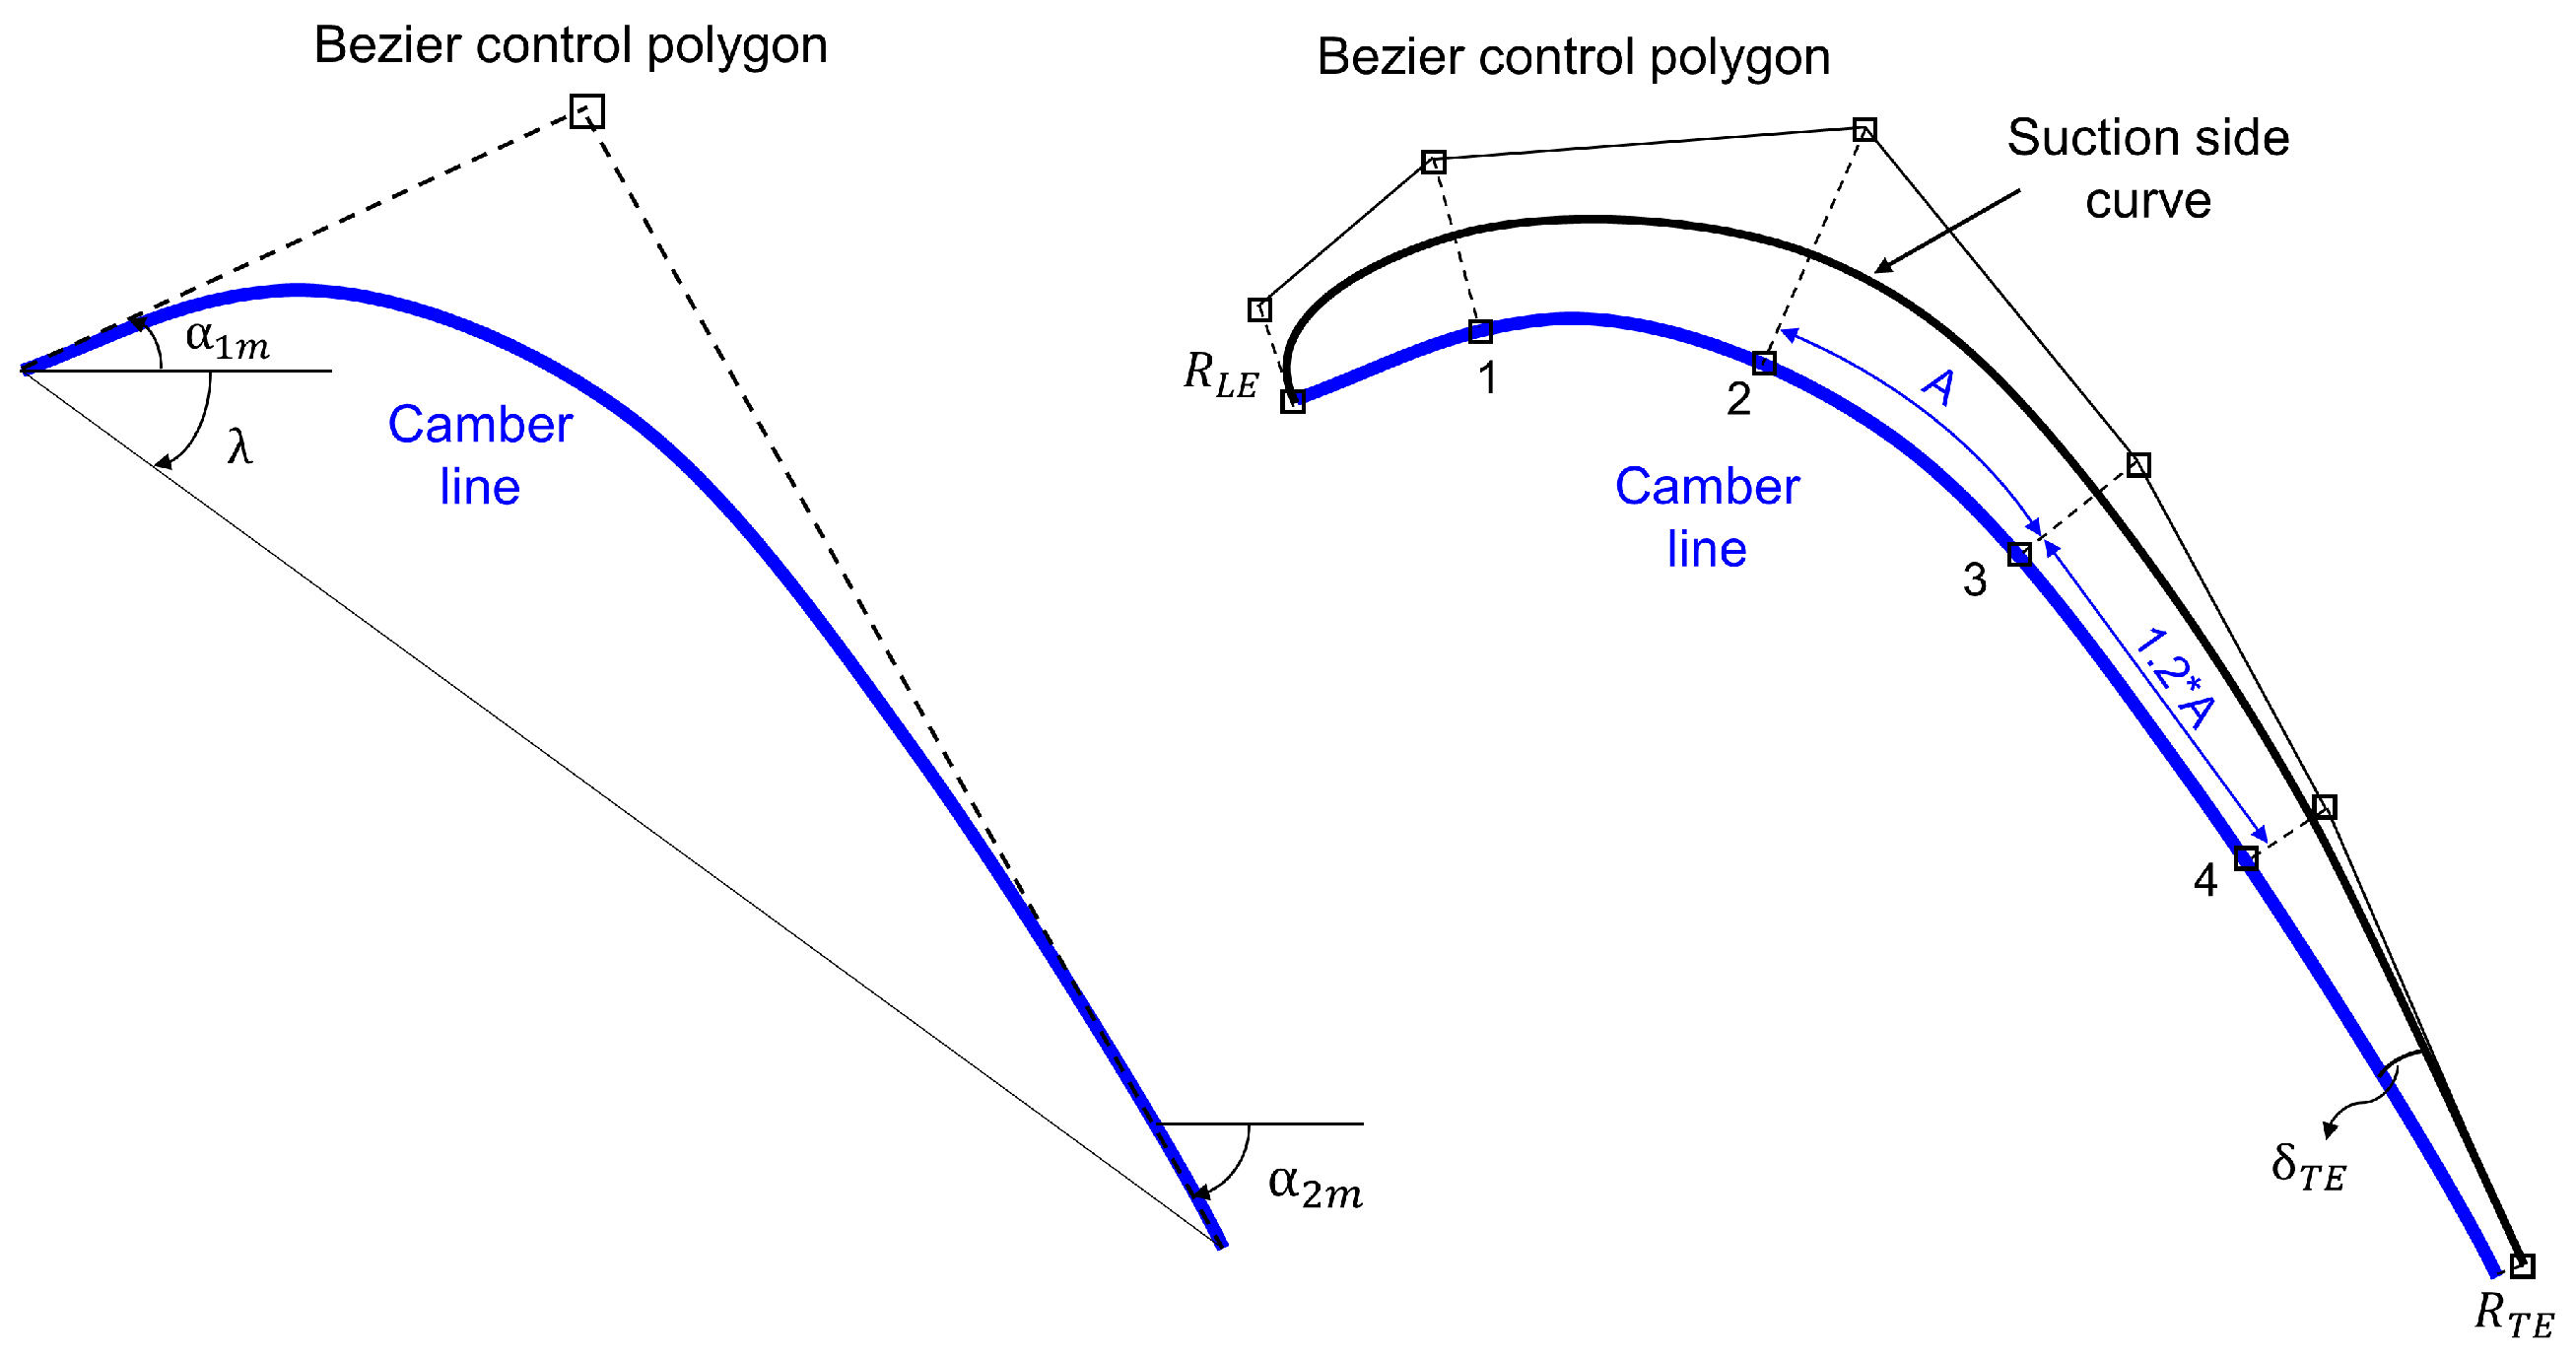
The parametric model is built using Autoblade from Numeca. Initially, 2D sections are defined at three spans (0, 50, and 100%). The camber line is set as a simple Bezier curve, using the inlet metal angle, the outlet metal angle, and the stagger angle. The suction and pressure sides are also Bezier curves, with four and three intermediate control points, respectively. This type of curve ensures a high degree of differentiability, providing a smooth aerodynamic response [14]. The stretching factor determines the spacing between control points along the camber line, by defining the increase in length between consecutive segments. As shown in Figure 3, it is set to 1.2. The section is completed with the leading edge radius and trailing edge radius and wedge angle. In this case, manufacturing and thermal considerations impose the trailing edge radius at 2 mm. Therefore, a total of 12 parameters per section are employed.
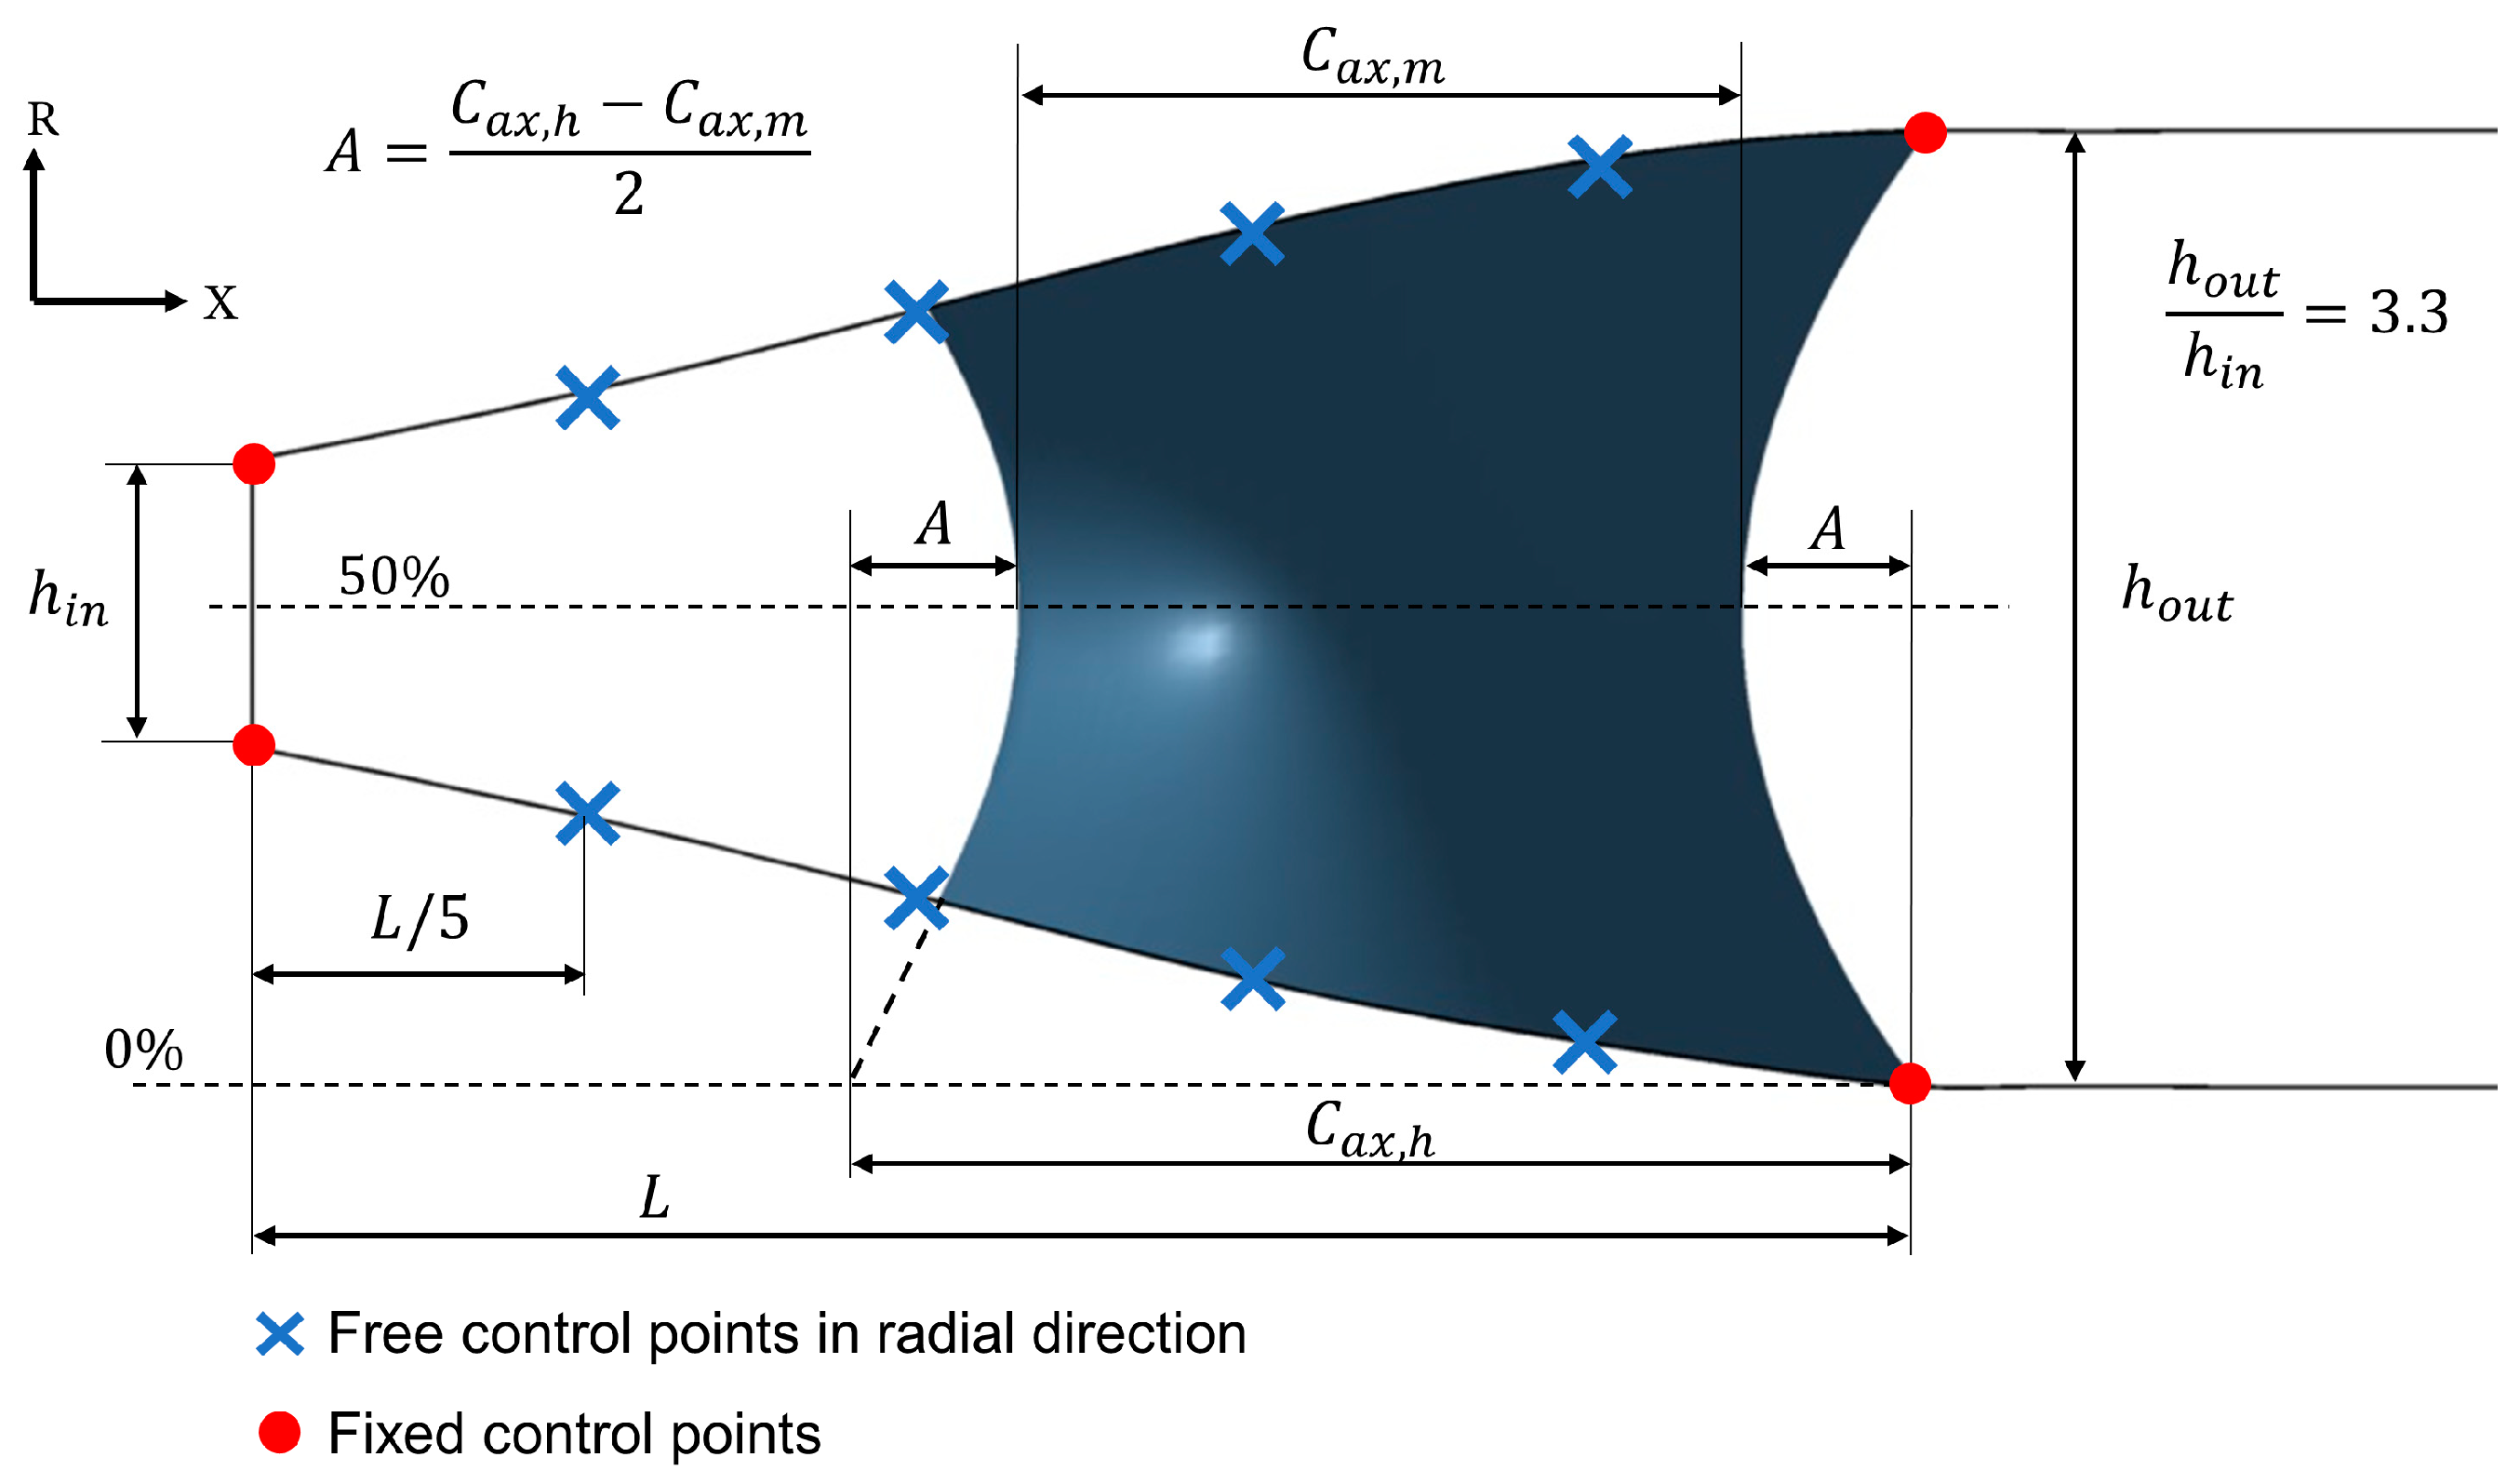
The radial stacking of the 2D airfoil sections is conducted using a Spline curve with three parameters, uniformly distributed along the span. This law determines the azimuthal position of the trailing edge at any radial location with respect to the hub trailing edge, providing different lean configurations (tangential displacement) that enable more control over the outlet flow radial distribution [14]. A meridional law models the variation of the axial chord along the radial direction. A spline curve is used, keeping the trailing edge fixed at the hub, with two control points at 50% and 100% span. The law is defined such that the axial mid-points of the three airfoil sections are always aligned in the radial direction, as shown in Figure 4. This way, only three parameters are required, the three axial chords. Due to the endwall contour, the axial chord of the 2D airfoil defined at 0% span does not necessarily match the axial chord of the 3D vane at the hub, as illustrated in Figure 4.
Regarding the endwall profiling, the hub and shroud are symmetric to the mean radius, cutting in half the number of parameters employed. Additionally, axisymmetry is assumed [5]. A Spline curve is preferred to a Bezier curve, since the control points are part of the curve, making it easier to define the bounds. The inlet and outlet coordinates remain fixed, with four intermediate, equally spaced points (Figure 4). As they can only move in the radial direction, the entire profile is modeled with four parameters. Summing all of them and including the number of blades, the total number of parameters is 47.
The NGV baseline geometry is based on a scaled high-pressure transonic turbine [16], being the result of a previous steady optimization [5]. An outlet-to-inlet height ratio of 3.3 allows a high level of turning and throat-to-inlet area ratio, ingesting flow with an inlet Mach number up to 0.64. Table 1 includes the most relevant details of the geometry.

3.3. Computational Domain and Solver

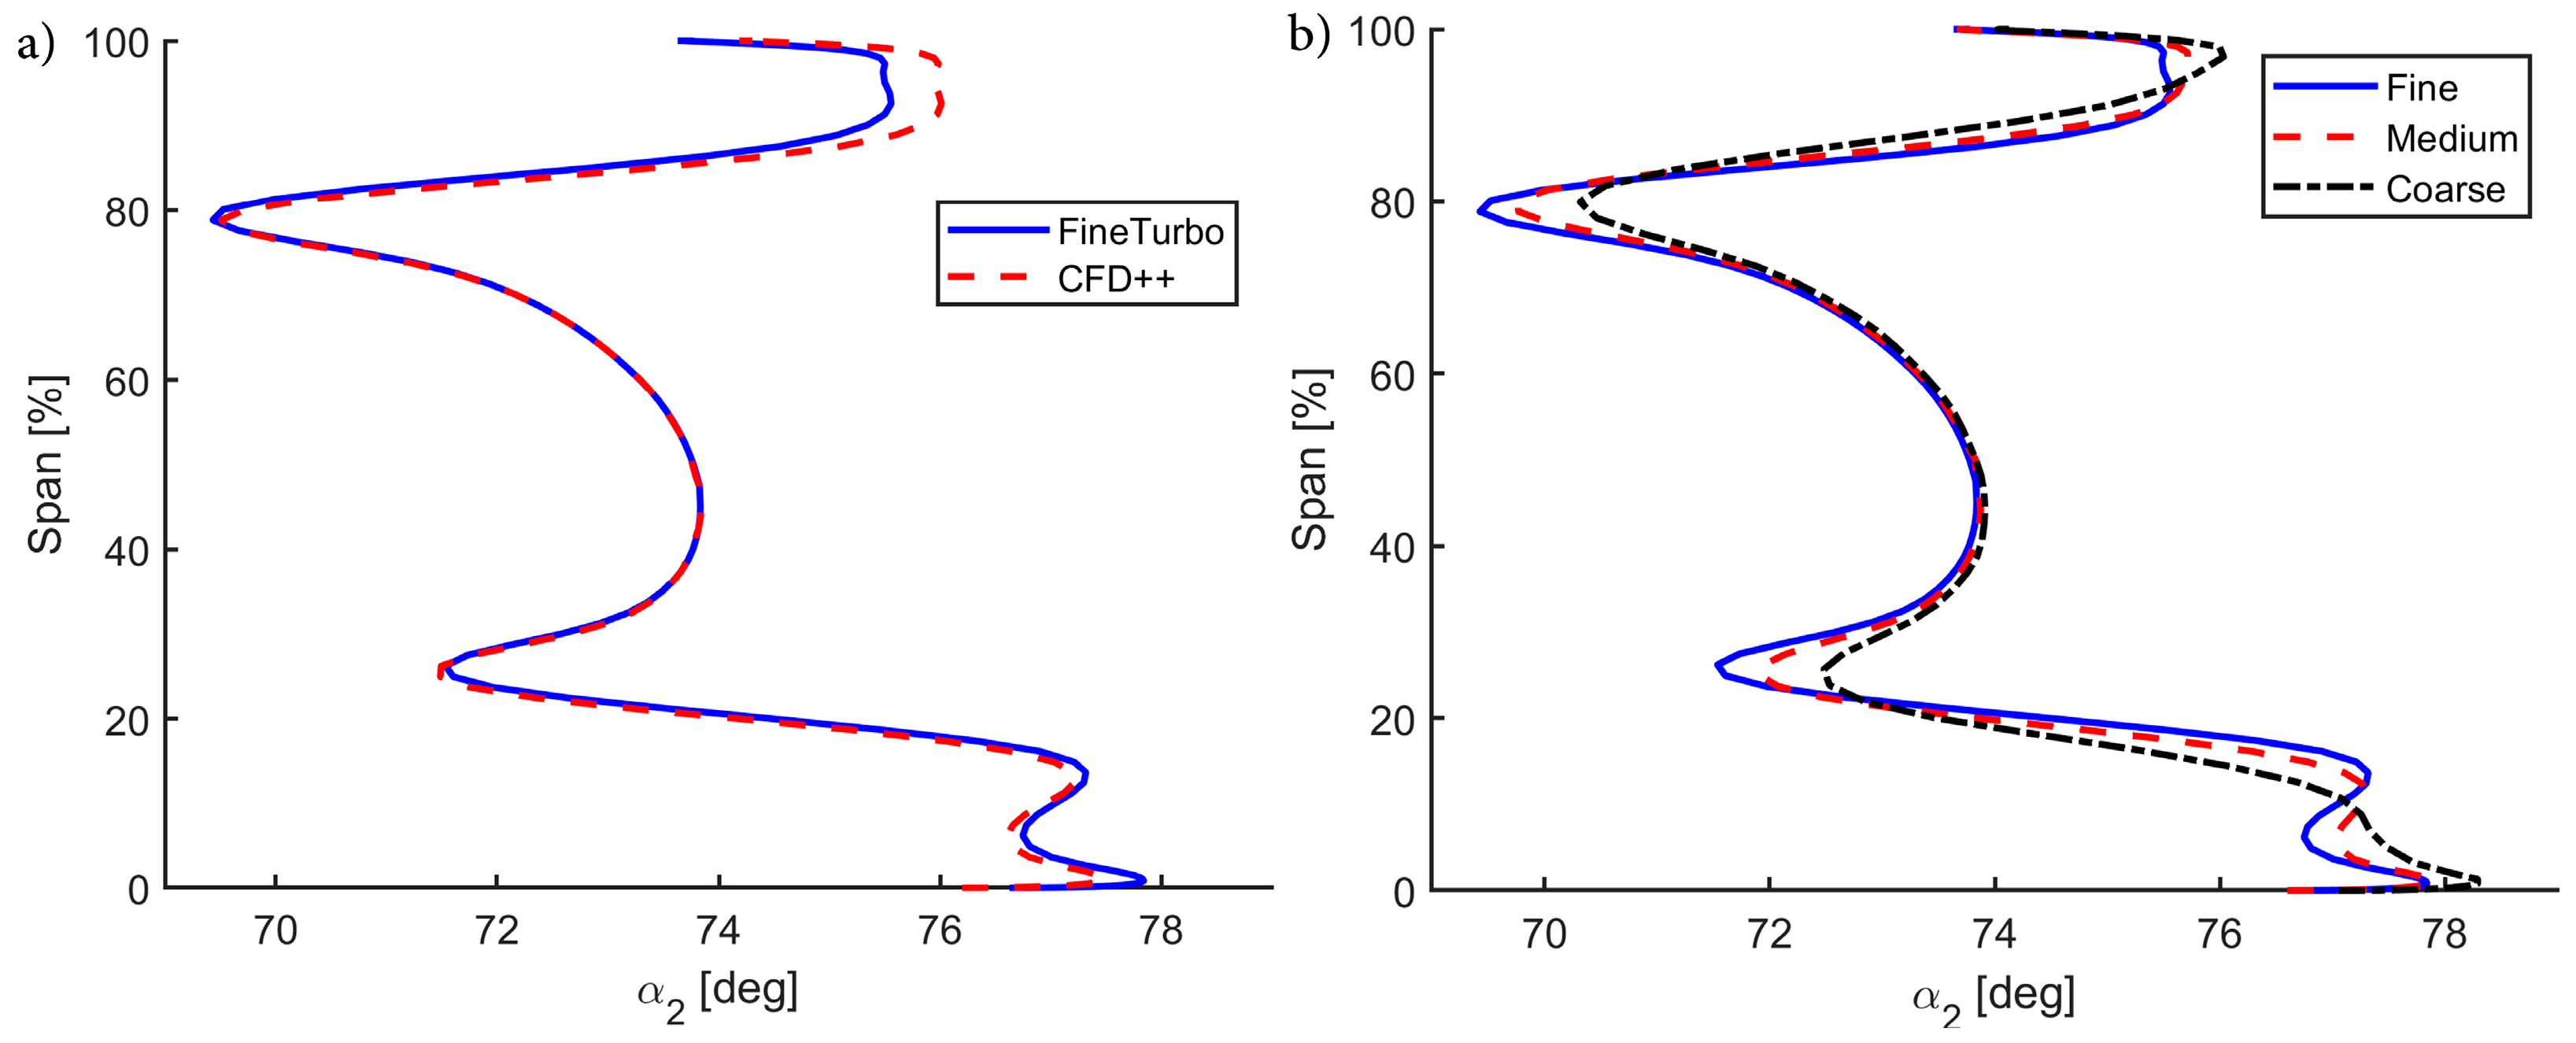
FineTurbo from Numeca is selected to solve the RANS equations. The k-w SST model provides the turbulence closure and the y+ is kept below 1 in the entire domain, to resolve the viscous sublayer. The solver is verified by running the baseline NGV geometry and comparing it with the results in [5], using the same mesh in both computations. CFD ++, which has been previously validated [6,17] is used as a solver in [5]. The discrepancy in the outlet mass-flow-averaged total pressure and flow angle is 0.11% and 0.18%, respectively. Figure 5a shows the outlet flow angle distribution, with a good agreement between solvers.
The structured grid is generated with Autogrid5 from Numeca. To determine the appropriate settings, a mesh independence study is conducted. Three different grids are evaluated: coarse (1.42 million cells), medium (2.2 M), and fine (3.3 M). The differences in the outlet mass-flow-averaged total pressure and flow angle are below 0.09% and 0.14%, respectively. Nevertheless, in the outlet angle radial distribution, a notable discrepancy appears between the coarse and the other two meshes (Figure 5b). Thus, the medium grid is chosen for the optimization.
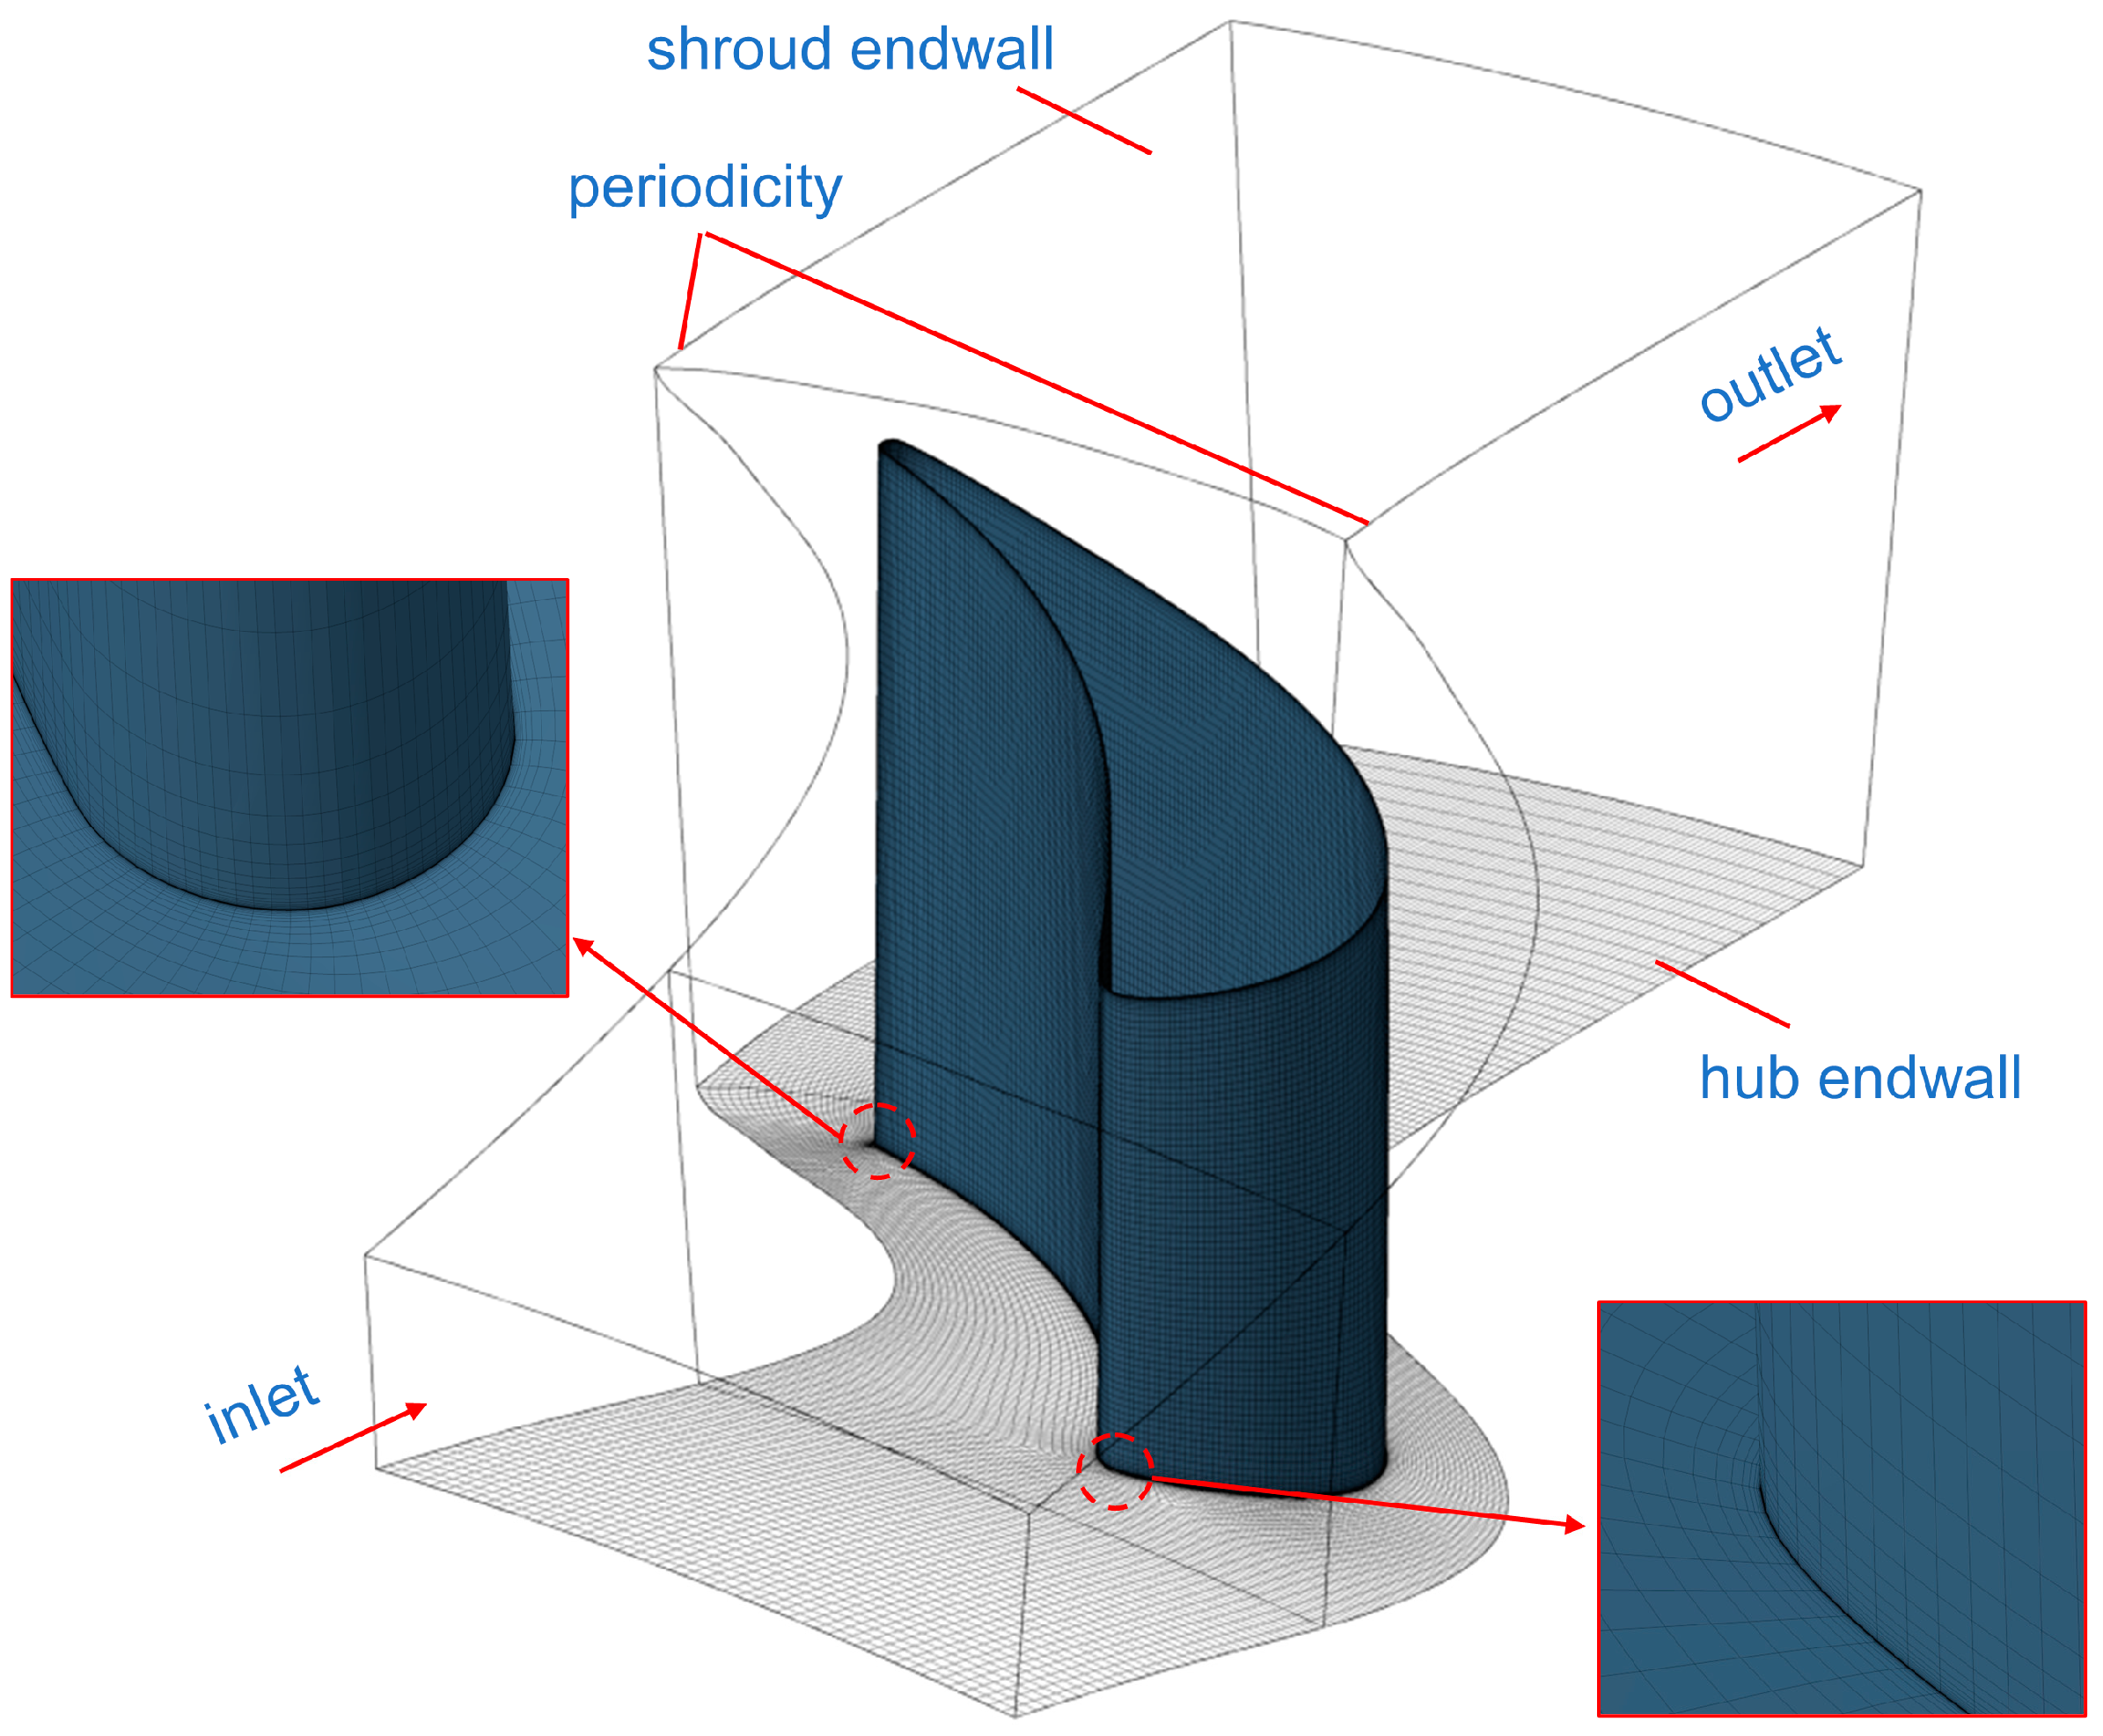
The computational domain is illustrated in Figure 6, with a detailed view of the mesh on the leading and trailing edges. The boundary conditions are summarized in Table 2; total pressure, total temperature, and flow angle were set at the inlet, with mass flow imposed at the outlet. Since it is a steady simulation, the inlet flow conditions will differ from the actual RDC exhaust, due to its transient nature. The values for total pressure and temperature are kept unaltered from the work of Liu et al. [5]. The inflow is considered to be axial, based on the results of Braun et al. [4], which show that despite the transient fluctuations the mass flow-averaged outlet flow angle of an RDC is nearly zero. Regarding the mass flow, since the objective is to design vanes that can ingest flow up to Mach 1, this value might have been set. However, that would have led to a large number of invalid geometries, unable to operate at a Mach 1 inflow, particularly at the beginning of the optimization.
Additionally, the baseline design, used as a reference from previous work, has a maximum inlet Mach number of 0.64. Therefore, to avoid these issues, the mass flow was selected to impose a mass flow-averaged inlet Mach number of 0.6. Still, thanks to the use of a constraint during the optimization (see Section 3.4), designs with started operation at Mach 1 can be achieved. Finally, the fluid is air, treated as a perfect gas with a constant specific heat ratio, computed at the inlet. All walls are adiabatic.

3.4. Optimizer

FineDesign3D from Numeca is chosen as the multi-objective differential evolution optimizer based on the SPEA algorithm [18]. To ensure that local minima are avoided, the mutation and crossover parameters are selected based on Numeca’s recommendations [19] and on the work of Braembussche [20], who analyzed the optimal mutation and crossover settings to ensure an efficient convergence and correct coverage of the design space. The optimizations were first initiated with a Design of Experiment using a Latin Hypercube Sampling (LHS) approach [21]. Following Numeca’s recommendation [19], 200 individuals were run, approximately four times the number of parameters (47). Kriging is the selected surrogate model type [19], and both objective functions had the same relative weights. All optimizations were run on 256 cores, each with 2 GB of memory, running four processes simultaneously.
Constraints are applied to control the range of throat-to-inlet area ratio. Since the outlet Mach number depends on the diffusion or contraction of the passage it is used as a constraint, imposing a penalty on those designs with an outlet Mach number above a threshold. The penalty value grows quadratically with the difference between the value for each individual and the threshold [19].

4. Turbine Vane Design Analysis

The number of individuals per population is set to four, following Numeca’s advice [19]. Multiple populations are generated until a clear Pareto Front is attained, ensuring the optimization process reaches full convergence. Overall, 138 populations are evaluated, accounting for 552 geometries with an approximate computational time of 135 h. Based on the Design of Experiments results, to achieve an outlet-to-inlet area ratio range between 1.1 and 1.2, the outlet Mach number lies between 0.53 and 0.47. Because a range of operation up to Mach 1 at the inlet is desired, the constraint threshold was set at 0.5 for the first 100 populations, ensuring throat-to-inlet area ratios above 1. For the final 38 populations, the threshold was increased to 0.55 to generate individuals with slightly lower area ratios and identify potential differences in performance.
The optimization results are shown in Figure 7a. The constraint worked as expected, with almost all geometries having a throat-to-inlet area ratio higher than 1. Most individuals follow the Pareto front; however, some individuals with a pressure loss coefficient below 0.1 lie outside. This is caused by the change in the outlet Mach number constraint for the last group of populations. The range of area ratios was reduced, which allowed the optimizer to generate designs with lower pressure loss, as illustrated in Figure 7b. The figure shows that for area ratios above 1, the pressure loss coefficient grows almost quadratically with the area ratio.
Two optimized geometries are selected and compared to the baseline design in Table 3. IND 497 significantly outperforms the baseline in both objective functions, especially in pressure distortion, while featuring a higher area ratio. Thanks to a 19% increase in area ratio, IND 567 offers a more extensive inlet Mach number operating range. As shown in Figure 7b, that large increase implies more losses; however, it still has a 12% enhancement in loss and 28% in pressure distortion compared to the baseline. Regarding the number of vanes, both designs include one more than the baseline.
The impact on the turbine thermodynamic efficiency can be approximated using the Horlock estimation [22], defined in Equation (5). This definition enables the accurate prediction of the turbine efficiency based on single-row calculations, as proved in [10]. The rotor performance ( ξ R = w 3 s 2 / w 3 2 1 , w 3 ) and stage total enthalpy change ( h 01 h 03 ) are taken from the full-stage simulation of the baseline design [5]. Additionally, the Euler equation agrees with the total enthalpy drop, the value of V 2 is taken from [5], making the stage efficiency a function of the stator kinetic loss coefficient ( ξ N = V 2 s 2 / V 2 2 1 ). IND 567 has a similar efficiency whereas IND 497 has a notable increase of 0.9 percentage points.
η t t = 1 + ξ N V 2 2 + T 3 T 2 ξ R w 3 2 2 h 01 h 03 1
Figure 8 displays the pitch-wise averaged Mach number flow field and the axial evolution of the local-to-inlet area ratio for IND 497. The first section of the channel is a diffusing region that decelerates the flow from Mach 0.6 to 0.35 with minimal flow detachment. Downstream of the leading edge, the radial diffusion continues, but due to the contracting effect of the vane passage, the area starts to be reduced up to the trailing edge. Still, the throat-to-inlet area ratio is above 1.
Figure 9 depicts the Mach number flow field at 50% span (left), 90% span (center), and the isentropic Mach number distribution at both spans (right). The 2D airfoil design at 90% span has a larger stagger angle (+3°) and a smaller throat (−14%); however, the acceleration is considerably lower than at mid-span, especially along the first half of the airfoil, with a difference of 0.22 in isentropic Mach number. This is caused by the local effect of radial diffusion, which significantly decelerates the flow near the endwalls. In contrast, the impact is lower at mid-span, having a higher outlet isentropic Mach number. Consequently, this must be considered for the airfoil design close to the endwalls. To avoid excessive diffusion which will lead to extensive secondary flow separation [23,24], the 2D passage has to be notably convergent to balance with the endwall contouring local effects. This analysis concludes that a 2D linear cascade test or computational simulation of the airfoil geometry will not represent the flow field near the endwalls in the 3D case.
Initially, it was expected that the optimizer would recommend as little turning as possible to minimize separation in the rear suction side and attain large outlet areas. Nonetheless, optimized designs have high outlet metal angles. Table 4 includes the mean value and standard deviation for the 20 designs with the lowest pressure loss. The mean values are well into the upper region of the allowed range and far from the lower bound (60°). As explained before, an excessive diffusion along the channel will lead to a complete detachment of the secondary flows. Therefore, to avoid it the vane passages must provide a high level of convergence, which can be conducted by increasing the turning.

5. Impact of Inlet Boundary Layer Thickness

In recent research on turbine stator passages with contoured endwalls, no analysis has been made on the effect of the inlet boundary layer thickness [5,9,10]. Sharma et al. [23] showed that for reaction cascades typical of high bypass turbofans, the increase in loss caused by a thicker boundary layer at the inlet plane was independent of the blade design, suggesting that inlet losses are additive. However, he also noted that for impulse and very low-aspect-ratio cascades the condition of the inlet boundary layer may have a more pronounced effect on the secondary flow topology and the losses generated in the passage. More recently, Coull et al. [25] studied the sensitivity of endwall loss in turbine cascades, demonstrating it is design-dependent. To quantify the dependency, an Amplification Factor is presented, which is proportional to the square of the inlet-to-outlet velocity ratio. Blade geometries with high Amplification Factors are shown to have higher losses and are more sensitive to the inlet boundary layer thickness. Hence, since the investigated vane designs have low aspect ratios, substantial diffusion, and strong adverse pressure gradients, it is relevant to evaluate this effect.

5.1. Boundary Layer Thickness Effect on Vane-Row Performance

First, several of the best individuals obtained in Section 4 have been evaluated with an inlet boundary layer thickness of 5.5% of the channel height ( δ 1 / h i n = 0.055) both at the hub and shroud endwalls. This value is considered a reference for the inlet of a turbine passage based on the values used in [25,26] and has been achieved by adding a straight, constant-area region ahead of the passage inlet, as illustrated in Figure 10. The necessary length was estimated with the 99% thickness equation for a turbulent flat plate [27], defined in Equation (6). After verifying with the 3D RANS results, this distance was set to 55 mm. In the pressure loss coefficient calculation, the inlet total pressure is taken at the passage inlet plane and not at the domain inlet (Figure 10). Depending on the combustor design and the level of unsteadiness, the chosen value for the inlet BL thickness might differ from the actual inlet flow conditions. Regardless, the objective is to assess the impact of a thicker inlet BL on the NGV performance and determine if the increase in loss is independent of the geometry, rather than evaluating it for the exact inlet boundary layer conditions.
δ = 0.38 x 4 5 V ν 1 5
These results are summarized in Table 5. First, it is confirmed that the rise in pressure loss due to a thicker boundary layer notably depends on the passage geometry, as opposed to Sharma’s conclusion. The downstream pressure distortion also experiences significant growth, caused by enlarged separated flow regions, which introduce perturbations in the outlet pressure field. Comparing the pitch-wise averaged Mach number contour for IND 497 (Figure 10) to the one with no inlet boundary layer (Figure 8), an important region of low-speed flow appears along the diffusing section of the passage. The exact extent of the separated flow can be visualized with iso-surfaces of negative axial velocity. Figure 11 includes a 3D view comparing both cases, using an iso-surface with an axial velocity of −1. With a thicker BL, the flow detaches earlier and almost along the entire pitch, unlike the zero BL case, where separation is localized only ahead of the leading edge. The area of the iso-surface, which is proportional to the volume of detached flow is 4.7 times larger.
Since the impact of the inlet boundary layer thickness on the performance of the NGV is remarkable and depends on the geometry, it is crucial to determine which designs provide the best performance for developed boundary layers. From the results in Table 5, there is a relation between the increase in the pressure loss coefficient and the highest local-to-inlet area ratio along the passage, suggesting that reduced diffusion ahead of the vane could mitigate the aerodynamic losses. Anyhow, a new optimization will be carried out to evaluate the lowest level of loss that may be achieved with a thicker inlet boundary layer and to determine the geometric differences between the optimized individuals in both cases, including the straight region that provides a 5.5% BL thickness.

5.2. Vane Optimization with Inlet Boundary Layer and Impact on Vane Design

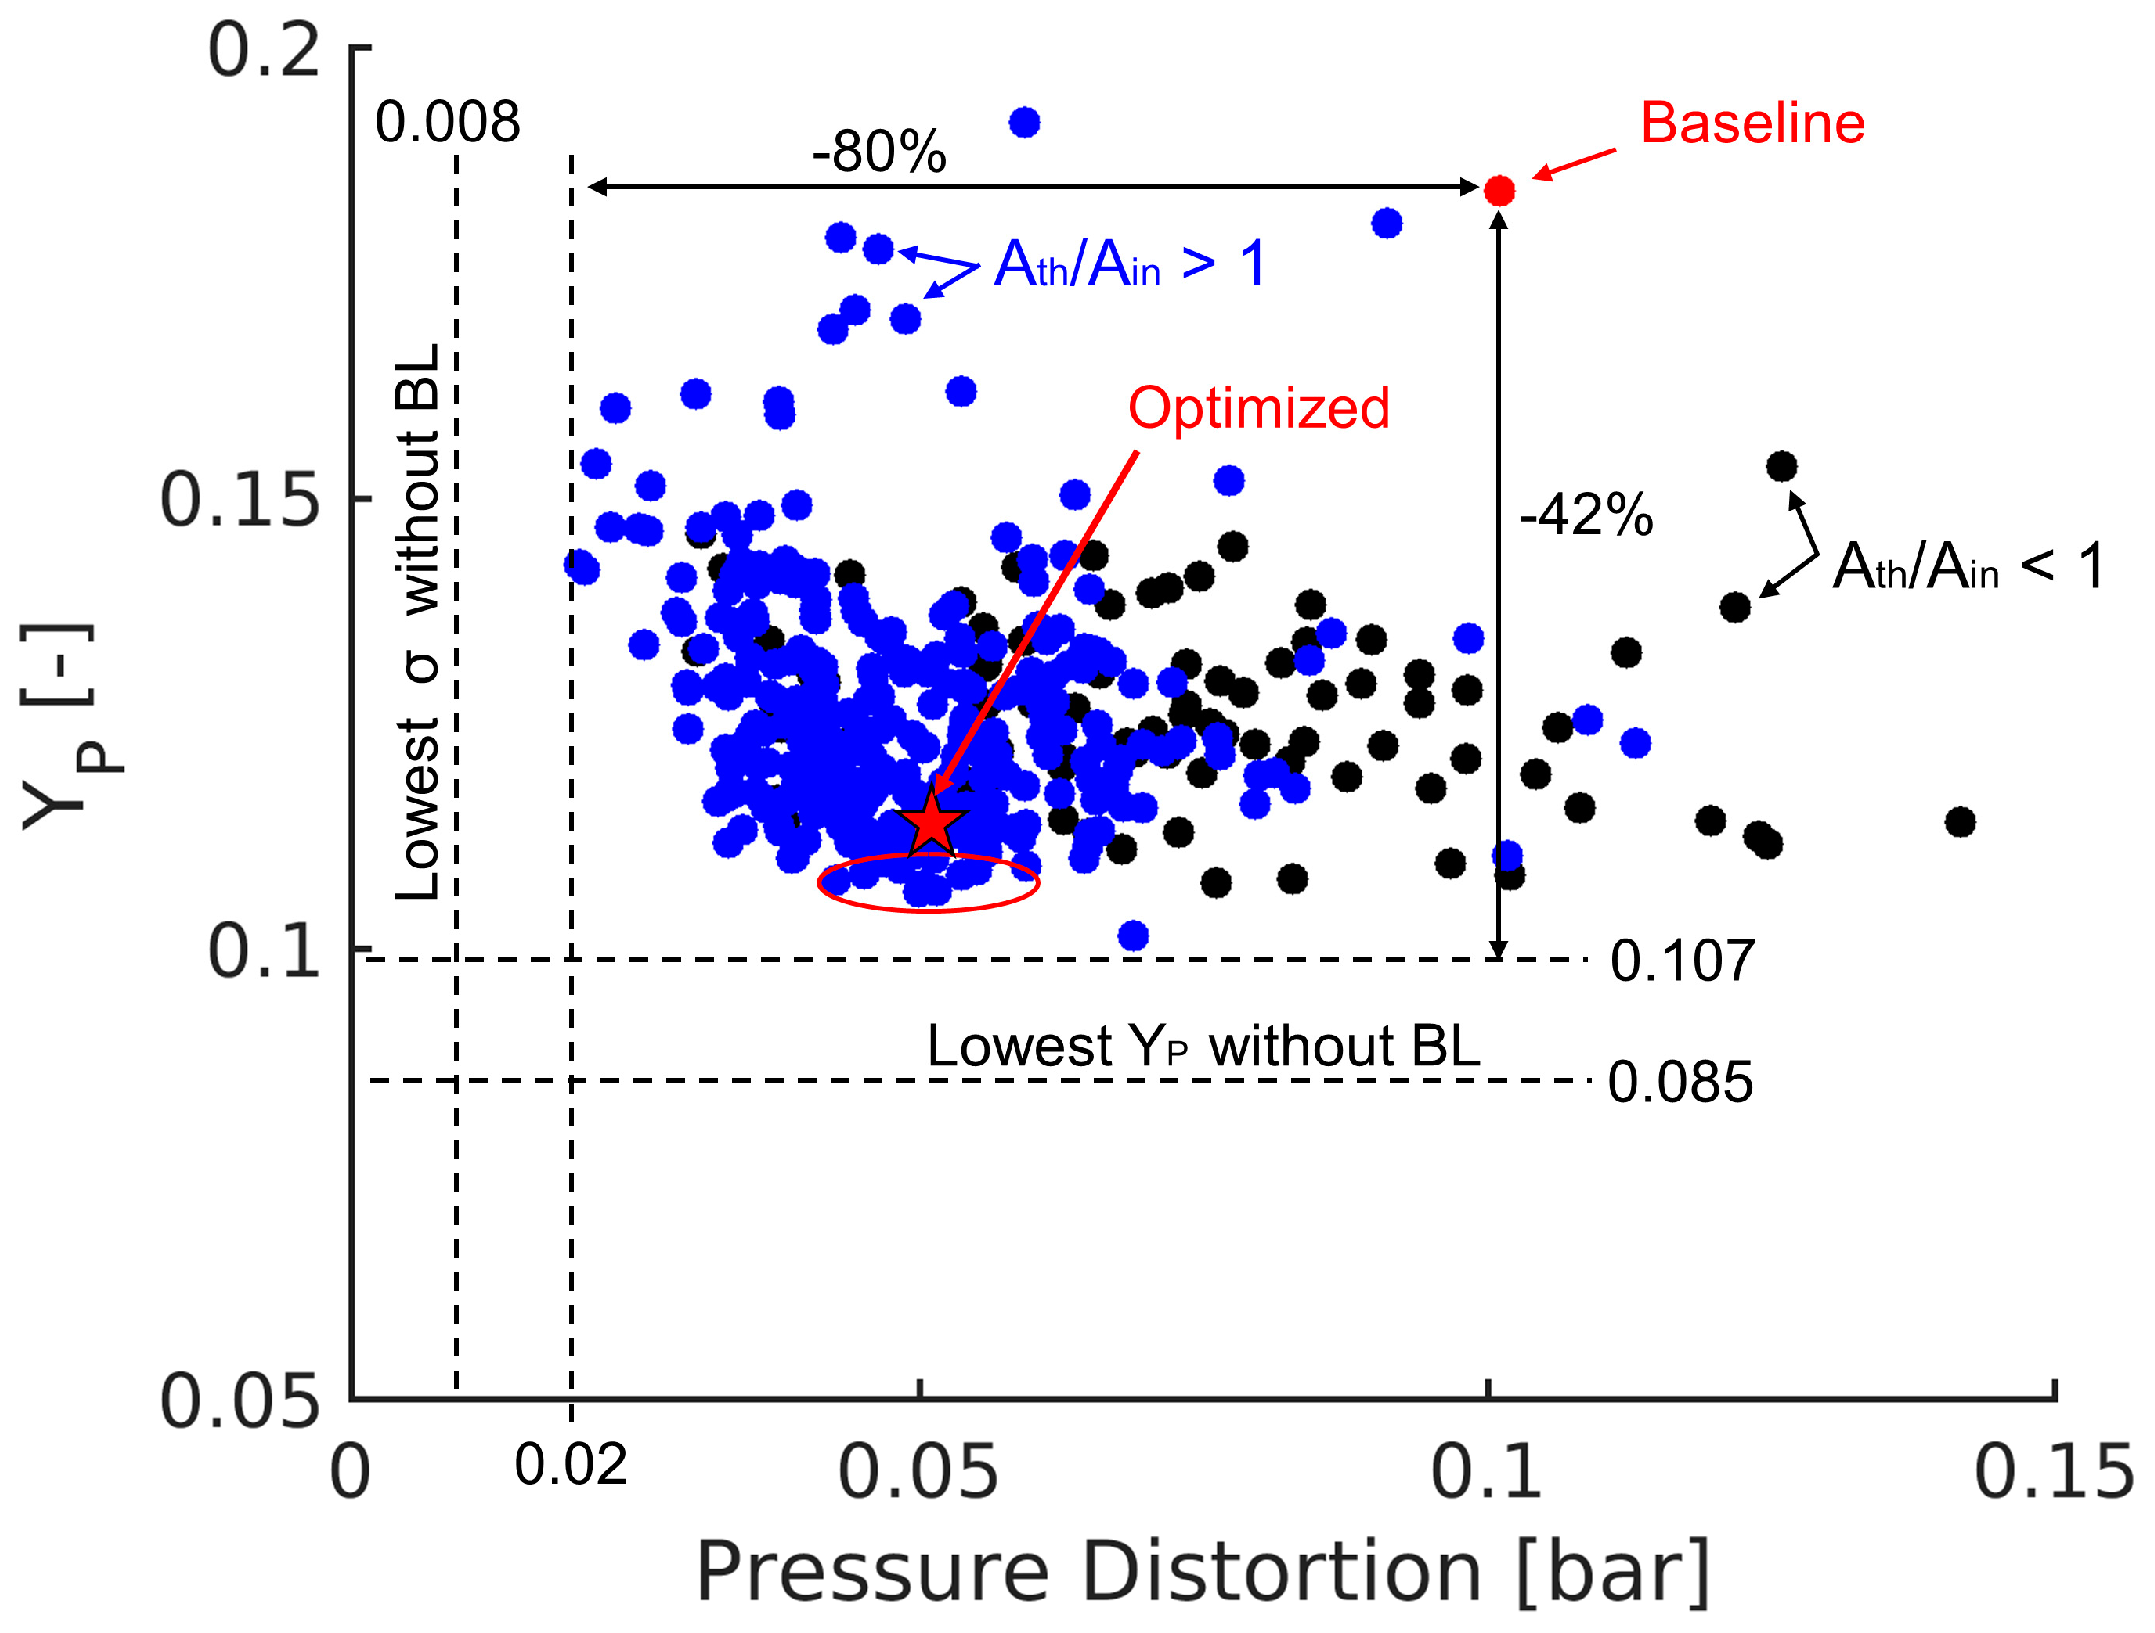
A total of 118 populations and 472 individuals were generated, with unaltered mesh and solver settings and the parametric model bounds. The outlet Mach number threshold has been kept at 0.5 to obtain outlet-to-inlet area ratios of around 1.15. As expected, the lowest values of both objective functions increased compared to the previous optimization, as shown in Figure 12. However, the percentual improvement with respect to the baseline has grown since that geometry was originally optimized with no inlet boundary layer [5]. Additionally, the performance of the optimized geometries is significantly greater than that of the designs initially optimized with no inlet boundary layer and later evaluated with a 5.5% BL thickness. For instance, those within the red oval highlighted in Figure 12 have pressure loss coefficients around 11% and pressure distortions between 0.04 and 0.05 bar. However, those in Table 5 range between 13.3 and 16.2% and 0.054 and 0.105 bar. The optimized geometry offers a 50% enhancement in pressure distortion and a 38% in pressure loss, increasing the stage efficiency by two percentage points (Table 6). Furthermore, three fewer vanes are employed and the throat-to-inlet area ratio grows by 21%, potentially allowing ingest flow up to Mach 1.
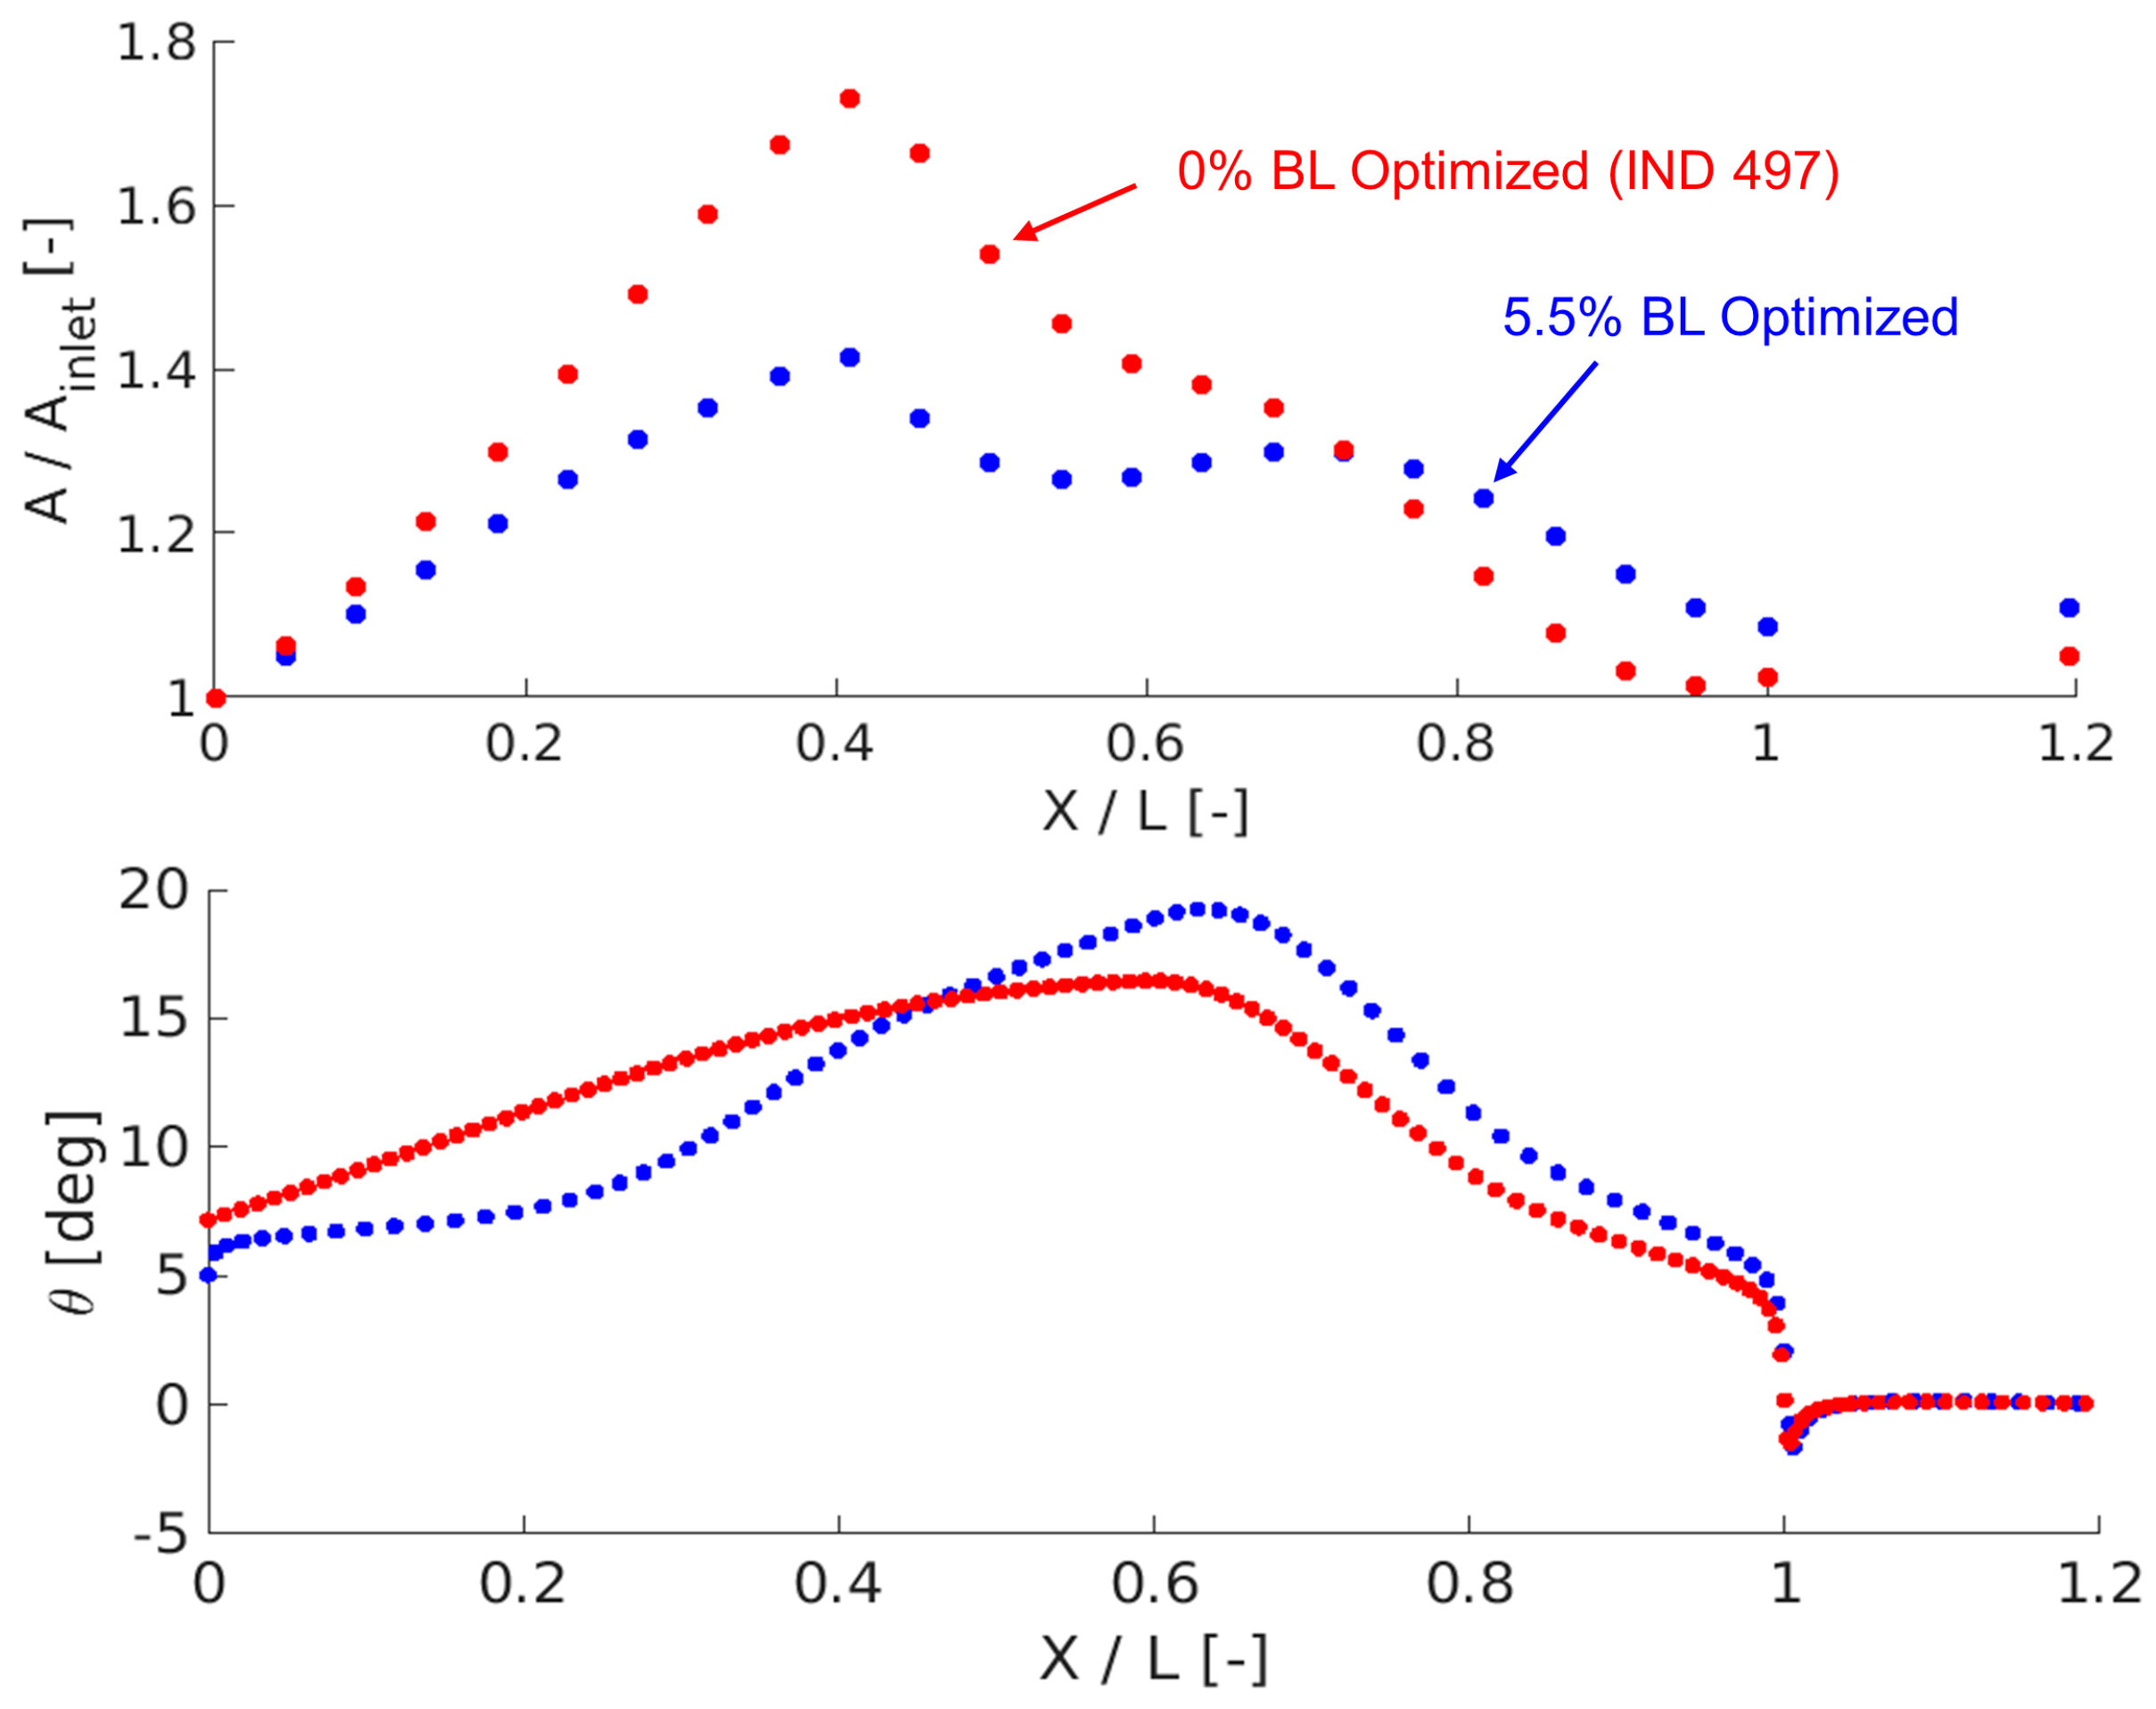
Figure 13 illustrates the local-to-inlet area ratio and the endwall contour angle ( θ = t a n 1 ( d r d z ) ) along the axial direction for the optimized design with a 5.5% inlet BL and one of the optimized designs with no inlet BL (IND 497, Figure 8). For a given adverse pressure gradient, thicker boundary layers are more prone to separation. Thus, the amount of diffusion ahead of the vane is reduced to minimize flow detachment. Comparing the peaks of the local-to-inlet area ratio, the 5.5% BL optimized design has 1.4, whereas, for the individuals optimized with no inlet boundary layer, it ranges between 1.68 and 1.77 (Table 5). Regarding the endwall profile, along the first 20% of the length, the angle is smaller and almost constant (6°) for a thicker inlet BL, which helps to prevent early flow separation. However, as it gets closer to the vane, the angle increases notably, with a value of 15° at the vane’s leading edge, and goes beyond the peak for the optimized geometry with no inlet BL. The highest angle and channel height increase occur in both cases along the first half of the vane (40–70% of the total length), effectively balancing the large acceleration provided by the vane passage with a high radial diffusion.
Concerning the overall geometry, some differences are found between the optimized designs with and without the inlet boundary layer. First, as mentioned, the endwall contour has less diffusion upstream of the vane, concentrating most of the height increase along the first half of the vane axial chord. Secondly, in the previous optimization, higher stagger angles were found at the hub and tip, compared with the mid-span, as shown in Figure 9. Table 7 includes the mean value and standard deviation of different parameters for the 20 designs with the lowest pressure loss. It is observed that the difference has been accentuated with a thicker boundary layer. Higher stagger angles near the endwalls provide more acceleration, which minimizes secondary flow growth and detachment [28,29], effectively balancing with the radial diffusion. Since the local throat size is reduced with higher stagger angles, at mid-span, the stagger is lowered, to guarantee that the throat-to-inlet area ratio does not drop below 1. These changes also affect the axial chords. To maintain the pitch-chord ratio, the axial chord is significantly increased at mid-span due to the reduced stagger angle, as presented in Table 7. Additionally, the overall axial chords are remarkably higher than in the baseline case (55 mm). This shortens the region of pure diffusion, minimizing the risk of separation as the flow speeds up in-between vanes. This opposes the conventional design trend of maximizing the aspect ratio to minimize secondary losses [30,31].

5.3. Off-Design Analysis

To determine the operating range and to confirm the effectiveness of the proposed methodology, several optimized designs have been run with higher inlet Mach numbers. Table 8 shows the main performance metrics for a Mach 1 inflow and the difference with the values at on-design conditions for the optimized geometry and another potential candidate (IND 511). The kinetic loss coefficient has been included in Table 8 because it is less dependent on the Mach number compared with the pressure loss coefficient, which varies considerably with the Mach number [22]; therefore, it provides a better representation of the effective variation in loss and the effect on the stage efficiency. As expected, the losses have grown compared to the design point; however, the loss increase in the optimized geometry has been considerably smaller. Regarding the pressure distortion, higher outlet Mach numbers tend to induce larger pressure fluctuations along the pitch-wise direction, providing a less uniform outlet pressure field. This explains the growth for the Mach 1 inlet case as well as the difference between the two analyzed geometries.
Figure 14 depicts the pitch-wise averaged Mach number contour for an inlet Mach number of 0.6 and 1, together with the iso-surfaces of axial velocity with a value of −1, for the optimized design only. A larger amount of separated flow is observed in the diffusing region upstream of the vane for the higher Mach number case, with the area of the iso-surface being 2.2 times larger than at on-design conditions. Based on these results, reducing the endwall angle upstream of the vane may be a potential alternative to minimize flow detachment and pressure loss for higher inlet Mach numbers.
Despite the increment in loss, the turbine passage is started, achieving full subsonic inlet Mach number operation. This highlights the relevance of the constraint imposed in the optimizations, which has effectively satisfied a design requirement without the need to introduce an additional objective function. Furthermore, it confirms that the targeted range of throat-to-inlet area ratio is enough to obtain a started operation.
After reaching an inlet Mach number of 1, the vane passage can still operate at higher total-to-static pressure ratios (P01/P2). Figure 15 presents three-dimensional Mach number contours of the optimized geometry for a pressure ratio of 2.1. As the static outlet pressure drops, the flow in the diverging section of the passage, upstream of the vane leading edge, starts to accelerate to higher supersonic Mach numbers, reaching a peak at approximately 1.15. Then, a normal shock occurs, bringing the flow back to the subsonic regime, remaining subsonic up to the vane throat. Downstream of the trailing edge, the flow is accelerated again, reaching a mass flow-averaged outlet Mach number of 1.03. As outlined in [14,15], a complex subsonic-supersonic outflow is obtained, with a clearly distinct shock. The result demonstrates the capability of the optimized geometry to operate up to an inlet Mach number of 1 and provide a range of different outlet Mach numbers, both subsonic and supersonic.

6. Conclusions

This article presents a study to enhance the performance and extend the operating range of turbine nozzle guide vanes at transonic inlet conditions up to Mach 1, offering a possibility to enable efficient integration with Rotating Detonation Combustors with subsonic exhausts. First, to better estimate the starting limit, the effect of pressure loss must be considered as it considerably shortens the operating range in the transonic regime compared to the isentropic case. To ensure started operation while minimizing pressure loss and stator-induced forcing on the rotor, a multi-objective optimization approach with steady RANS simulations is proposed, including the 3D airfoil shape and endwall profile design. A pressure loss abatement of 24% and a downstream pressure distortion reduction of 63% are obtained, compared to the baseline case. Additionally, the throat-to-inlet area ratio is increased beyond 1, enlarging the operating range, while maintaining high flow turning.
The impact of the inlet boundary layer thickness on the NGV performance is studied, with the growth in pressure loss ranging from 33% to 80% of the value with no inlet boundary layer, and from 48% to 145% in pressure distortion. Furthermore, it is concluded that the increment depends on the geometry for this design case, opposing the conclusions from a previous study in the turbine research field. Afterward, a similar optimization with a boundary layer thickness of 5.5% of the channel height is performed, achieving lower pressure loss and pressure distortion, while increasing the operating range and reducing the vane count. For that boundary layer thickness value, the optimized designs perform notably better than those optimized with no inlet boundary layer, having significantly less diffusion upstream of the vane and concentrating most of the radial growth along the first half of the vane axial chord. Finally, the started operation of the optimized geometry for an inlet Mach number of 1 is demonstrated, attaining full subsonic inflow operation.
Author Contributions

Conceptualization, S.G. and G.P.; methodology, S.G. and G.P.; software, S.G.; validation, S.G.; formal analysis, S.G. and G.P.; investigation, S.G.; resources, S.G. and G.P.; data curation, S.G.; writing—original draft preparation, S.G.; writing—review and editing, S.G. and G.P.; visualization, S.G.; supervision, S.G. and G.P.; project administration, S.G. and G.P.; funding acquisition, G.P. All authors have read and agreed to the published version of the manuscript.

Funding

This research was funded by the U.S. Department of Energy, award number DE-FE0032075.

Institutional Review Board Statement

Not applicable.

Informed Consent Statement

Not applicable.

Data Availability Statement

Data are contained within the article.

Acknowledgments

The authors would like to acknowledge the US Department of Energy for the part-time faculty appointment of Guillermo Paniagua to the Faculty Research Participation Program at the National Energy Technology Laboratory. The authors would like to thank Logan Tuite for his help with the optimization setup and troubleshooting.

Conflicts of Interest

The authors declare no conflicts of interest.

Nomenclature

AArea [mm2]
CChord length [mm]
DMass flow function [-]
hChannel height [mm]
h0Total enthalpy [J/kg]
Mass flow rate [kg/s]
MAbsolute Mach number [-]
MisIsentropic Mach number [-]
PStatic pressure [bar]
P0Total pressure [bar]
rRadius [mm]
RSpecific gas constant [J/(kg.K)]
TStatic temperature [K]
T0Total temperature [K]
VAbsolute flow velocity [m/s]
wRelative flow velocity [m/s]
xAxial coordinate [mm]
y+Non-dimensional wall distance [-]
YPPressure loss coefficient [-]
αFlow angle [deg]
α1mVane inlet metal angle [deg]
α2mVane outlet metal angle [deg]
γSpecific heat ratio [-]
δBoundary layer thickness [mm]
δTETrailing edge wedge angle [deg]
ηttTurbine stage total-total efficiency [-]
θEndwall contour angle [deg]
λStagger angle [deg]
νKinematic viscosity [m2/s]
ξKinetic loss coefficient [-]
σPressure standard deviation [bar]

Abbreviations

BLBoundary Layer
HPTHigh-Pressure Turbine
INDIndividual
NGVNozzle Guide Vane
PSPressure Side
RANSReynolds-Averaged Navier-Stokes
RDCRotating Detonation Combustor
RDERotating Detonation Engine
SPEAStrength Pareto Evolutionary Algorithm
SSSuction Side
SSTShear Stress Transport
STDStandard Deviation
URANSUnsteady RANS
Subscripts
1Passage inlet
2Passage outlet
3Rotor outlet
axAxial direction
inInlet
hHub
LELeading edge
mMid-span
NNozzle guide vane
outOutlet
RRotor
sIsentropic
tTip
TETrailing edge
thThroat

References

  1. Sousa, J.; Paniagua, G.; Morata, E. Thermodynamic analysis of a gas turbine engine with a rotating detonation combustor. Appl. Energy 2017, 195, 247–256. [Google Scholar] [CrossRef]
  2. Chapman, J.; Lavelle, T.; May, R. Toolbox for the Modeling and Analysis of Thermodynamic Systems (T-MATS) User’s Guide; NASA; Glenn Research Center: Cleveland, OH, USA, 2014.
  3. Braun, J.; Saracoglu, B.; Paniagua, G. Unsteady performance of rotating detonation engines with different exhaust nozzles. J. Propuls. Power 2016, 33, 121–130. [Google Scholar] [CrossRef]
  4. Braun, J.; Paniagua, G.; Ferguson, D. Aero-thermal characterization of accelerating and diffusing passages downstream of rotating detonation combustors. In Proceedings of the ASME Turbo Expo 2021, Online, 7–11 June 2021. [Google Scholar]
  5. Liu, Z.; Braun, J.; Paniagua, G. Thermal power plant upgrade via a rotating detonation combustor and retrofitted turbine with optimized endwalls. Int. J. Mech. Sci. 2020, 188, 105918. [Google Scholar] [CrossRef]
  6. Liu, Z.; Braun, J.; Paniagua, G. Characterization of a supersonic turbine downstream of a rotating detonation combustor. J. Eng. Gas Turbines Power 2019, 141, 031501. [Google Scholar] [CrossRef]
  7. Paniagua, G.; Lorio, M.; Vinha, N.; Sousa, J. Design and analysis of pioneering high supersonic axial turbines. Int. J. Mech. Sci. 2014, 89, 65–77. [Google Scholar] [CrossRef]
  8. Sousa, J.; Collado-Morata, E.; Paniagua, G. Design and optimization of supersonic turbines for detonation combustors. Chin. J. Aeronaut. 2022, 35, 33–44. [Google Scholar] [CrossRef]
  9. Mushtaq, N.; Persico, G.; Gaetani, P. The role of endwall shape optimization in the design of supersonic turbines for rotating detonation engines. J. Turbomach. 2023, 145, 081015. [Google Scholar] [CrossRef]
  10. Liu, Z.; Braun, J.; Paniagua, G. Integration of a transonic high-pressure turbine with a rotating detonation combustor and a diffuser. Int. J. Turbo Jet Eng. 2020, 40, 1–10. [Google Scholar] [CrossRef]
  11. Grasa, S.; Paniagua, G. Design and characterization of highly diffusive turbine vanes suitable for transonic rotating detonation combustors. In Proceedings of the 15th European Turbomachinery Conference, Budapest, Hungary, 24–28 April 2023; Paper n. ETC2023-273. Available online: https://www.euroturbo.eu/publications/conference-proceedings-repository/ (accessed on 20 December 2023).
  12. Greitzer, E.; Tan, C.; Graf, M. Internal Flow Concepts and Applications; Cambridge University Press: New York, NY, USA, 2004. [Google Scholar]
  13. Fonseca, C.; Fleming, P. An overview of evolutionary algorithms in multiobjective optimization. Evol. Comput. 1995, 3, 1–16. [Google Scholar] [CrossRef]
  14. Puente, R.; Paniagua, G.; Verstraete, T. Design trade-off study between efficiency and rotor forcing attenuation in a transonic turbine stage. Appl. Math. Model. 2015, 39, 838–850. [Google Scholar] [CrossRef]
  15. Joly, M.; Verstraete, T.; Paniagua, G. Differential evolution based soft optimization to attenuate vane-rotor shock interaction in high-pressure turbines. Appl. Soft Comput. 2013, 13, 1882–1891. [Google Scholar] [CrossRef]
  16. Denos, R.; Arts, T.; Paniagua, G.; Michelassi, V.; Martelli, F. Investigation of the unsteady rotor aerodynamics in a transonic turbine stage. J. Turbomach. 2001, 123, 81–89. [Google Scholar] [CrossRef]
  17. Sousa, J.; Paniagua, G. Entropy minimization design approach of supersonic internal passages. Entropy 2015, 17, 5593–5610. [Google Scholar] [CrossRef]
  18. Thiele, L.; Zitzler, E. Multiobjective evolutionary algorithms: A comparative case study and the strength pareto approach. IEEE Trans. Evol. Comput. 1999, 3, 257–271. [Google Scholar] [CrossRef]
  19. Numeca International. User Guide FINE/Design3D 15.1; Numeca International: Brussels, Belgium, 2020. [Google Scholar]
  20. Van Den Braembussche, R. Chapter 6: Numerical optimization for advanced turbomachinery design. In Optimization and Computational Fluid Dynamics; Springer: Berlin/Heidelberg, Germany, 2008. [Google Scholar]
  21. Gunzburger, M.; Saka, Y.; Burkardt, J. Latinized, improved lhs, and cvt point sets in hypercubes. Int. J. Num. Anly. Model. 2007, 4, 729–743. [Google Scholar]
  22. Horlock, J. Losses and efficiencies in axial-flow turbines. Int. J. Mech. Sci. 1960, 2, 48–75. [Google Scholar] [CrossRef]
  23. Sharma, O.; Butler, T. Predictions of Endwall Losses and Secondary Flows in Axial Flow Turbine Cascades. J. Turbomach. 1987, 109, 229–236. [Google Scholar] [CrossRef]
  24. Sieverding, C. Recent progress in the understanding of basic aspects of secondary flows in turbine blade passages. J. Eng. Gas Turbines Power 1985, 107, 248–257. [Google Scholar] [CrossRef]
  25. Coull, J.; Clark, C.; Vazquez, R. The sensitivity of turbine cascade endwall loss to inlet boundary layer thickness. J. Glob. Power Propuls. Soc. 2019, 3, 540–554. [Google Scholar] [CrossRef]
  26. Lynch, S. Three-dimensional boundary layer in a turbine blade passage. J. Propuls. Power 2017, 33, 954–963. [Google Scholar] [CrossRef]
  27. Schlichting, H. Boundary-Layer Theory, 7th ed.; McGraw Hill: New York, NY, USA, 1979. [Google Scholar]
  28. Traupel, W. Thermische Turbomaschinen Zweiter Band Geländerte Betriebsbedingungen, Regelung, Mechanische Probleme, Temperaturprobleme; Springer: Berlin, Germany, 1977. [Google Scholar]
  29. Dejc, M.; Trojanovskij, B. Investigation and Calculation of Axial-Turbine Stages; Wright Patterson Air Force Base: Montgomery, OH, USA, 1964. [Google Scholar]
  30. Dunham, J.; Came, P. Improvements to the Ainley-Mathieson Method of Turbine Performance Prediction. J. Eng. Power 1970, 92, 252–256. [Google Scholar] [CrossRef]
  31. Craig, H.; Cox, H. Performance estimation of axial flow turbines. Proc. Inst. Mech. Eng. 1970, 185, 32–71. [Google Scholar] [CrossRef]
Figure 1. Starting limit: red dashed lines mark the minimum throat-to-inlet area ratio for different pressure loss levels.
Ijtpp 09 00018 g001
Figure 2. Optimization Strategy.
Ijtpp 09 00018 g002
Figure 3. Camber line and Suction side parametrization.
Ijtpp 09 00018 g003
Figure 4. Meridional law and Endwall contour parametrization.
Ijtpp 09 00018 g004
Figure 5. Outlet angle radial distribution: (a) Solver Verification. (b) Grid Independence.
Ijtpp 09 00018 g005
Figure 6. Computational domain of baseline geometry with detailed view of grid topology.
Ijtpp 09 00018 g006
Figure 7. Optimization results: (a) Pressure loss coefficient versus pressure distortion. (b) Effect of throat-to-inlet area ratio on pressure loss coefficient.
Ijtpp 09 00018 g007
Figure 8. IND 497: Pitch-wise averaged Mach number contour (top) and axial evolution of local-to-inlet area ratio (bottom).
Ijtpp 09 00018 g008
Figure 9. IND 497: 50% span Mach number contour (left), 90% span Mach number contour (center), Isentropic Mach number distribution at 50–90% span (right).
Ijtpp 09 00018 g009
Figure 10. IND 497: Pitch-wise averaged Mach number contour with 5.5% BL thickness at passage inlet plane.
Ijtpp 09 00018 g010
Figure 11. Iso-surface of Vax = −1 for IND 497 with zero (left) and 5.5% (right) inlet BL thickness.
Ijtpp 09 00018 g011
Figure 12. Optimization with 5.5% inlet BL. Pressure loss coefficient versus pressure distortion.
Ijtpp 09 00018 g012
Figure 13. Evolution of local-to-inlet area ratio (top) and endwall contour angle (bottom) for optimized designs with different inlet BL thicknesses.
Ijtpp 09 00018 g013
Figure 14. Optimized geometry: Pitch-wise averaged Mach number contour and iso-surface of Vax = −1 for on-design conditions (top) and for Mach 1 inflow (bottom).
Ijtpp 09 00018 g014
Figure 15. Optimized geometry: Three-dimensional Mach number contours (P01/P2 = 2.1).
Ijtpp 09 00018 g015
Table 1. Baseline Geometry.
Vane Count43
Cax,m [mm]55.7
(Rh/Rt)outlet [-]0.87
Rm [mm]477.1
hout/Cax,m [-]1.17
α2m,m [deg]72
Table 2. Boundary Conditions.
T01 [K]1800
P01 [bar]16.5
[kg/s]75.43
α1 [deg]0
γ [-]1.305
R [J/kg.K] 287
Table 3. Performance of baseline and two optimized geometries.
INDAth/Ain [-]YP [%]σ [bar]ηtt [%]
Baseline0.911.30.06-
4971.01 (+12%)8.6 (−24%)0.022 (−63%)+0.9
5671.07 (+19%)10.0 (−12%)0.043 (−28%)+0.09
Table 4. Outlet metal angle mean value and standard deviation for individuals with lowest pressure loss.
MeanSTD
α2m,h [deg]68.33.7
α2m,m [deg]69.62.5
α2m,t [deg]72.72.5
Table 5. Effect of a thicker inlet BL on the performance of several optimized geometries.
IND(A/Ain)max [-]YP [%]ΔYP [%]σ [bar]Δσ [bar]
4721.6813.63.5 (+35%)0.1050.034 (+48%)
4971.7314.25.6 (+65%)0.0540.032 (+145%)
5101.7716.27.2 (+80%)0.0930.039 (+72%)
5671.68 13.33.3 (+33%)0.0770.034 (+79%)
Table 6. Performance of the baseline and optimized geometry with 5.5% inlet BL.
CaseAth/Ain [-]YP [%]σ [bar]ηtt [%]Vane Count
Baseline0.918.40.101-43
Optimized1.09 (+21%)11.4 (−38%)0.051 (−50%)+2.040
Table 7. Optimization with 5.5% BL: Mean value and STD of several parameters for individuals with lowest pressure loss.
MeanSTD
Cax,h [mm]61.1 (−0.5)2.6
Cax,m [mm]68 (+5.6)1.9
Cax,t [mm]61.4 (+1.5)2.4
λh [deg]50.5 (+1.2)1.4
λm [deg]43.1 (−2.7)1
λt [deg]50.2 (+0.6)3.1
Table 8. Performance of two optimized geometries with 5.5% inlet BL for Mach 1 inflow.
CaseAth/Ain [-]YP [%]ξ [%]σ [bar]M2 [-]
Optimized1.0915.9 (+4.5)10.9 (+1.6)0.149 (+0.098)0.82 (+0.29)
IND 5111.1417.7 (+6.7)12.6 (+3.4)0.092 (+0.043)0.72 (+0.23)
Disclaimer/Publisher’s Note: The statements, opinions and data contained in all publications are solely those of the individual author(s) and contributor(s) and not of MDPI and/or the editor(s). MDPI and/or the editor(s) disclaim responsibility for any injury to people or property resulting from any ideas, methods, instructions or products referred to in the content.