Experimental Characterization of Unsteady Forces Triggered by Cavitation on a Centrifugal Pump †


Abstract
1. Introduction
2. Materials and Methods
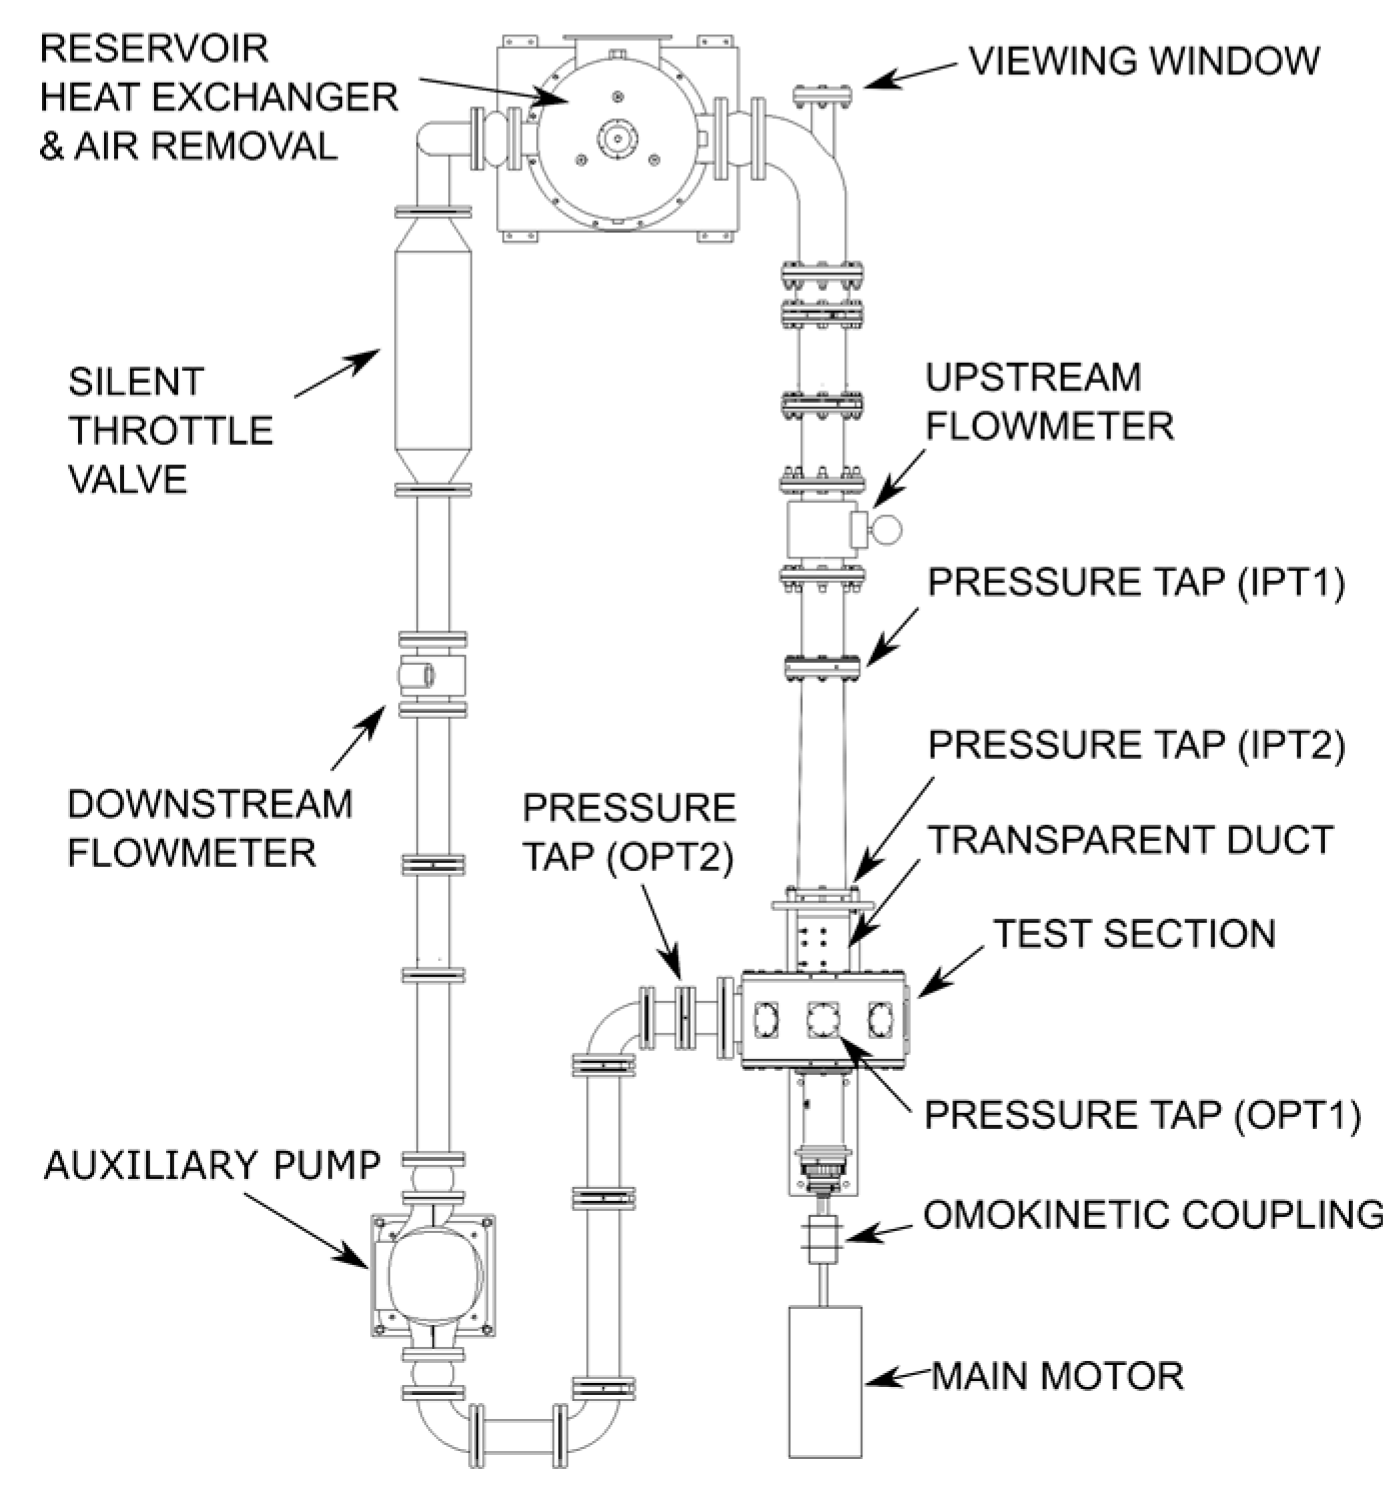
2.1. Experimental Apparatus
- two electromagnetic flowmeters (Fisher-Rosemount, Saint Louis, MO, US, model 8732E, range: 0–100 l/s, accuracy 0.5% FS (full scale)), for the measurement of the inlet and outlet flow rates;
- an absolute pressure transducer (@IPT1) placed six diameters upstream, with respect to the blade leading edge (General Electric, Boston, MA, US, model Druck PMP1400, range 0–1 bar, accuracy 0.25% FS), for the assessment of the inlet cavitation number ;
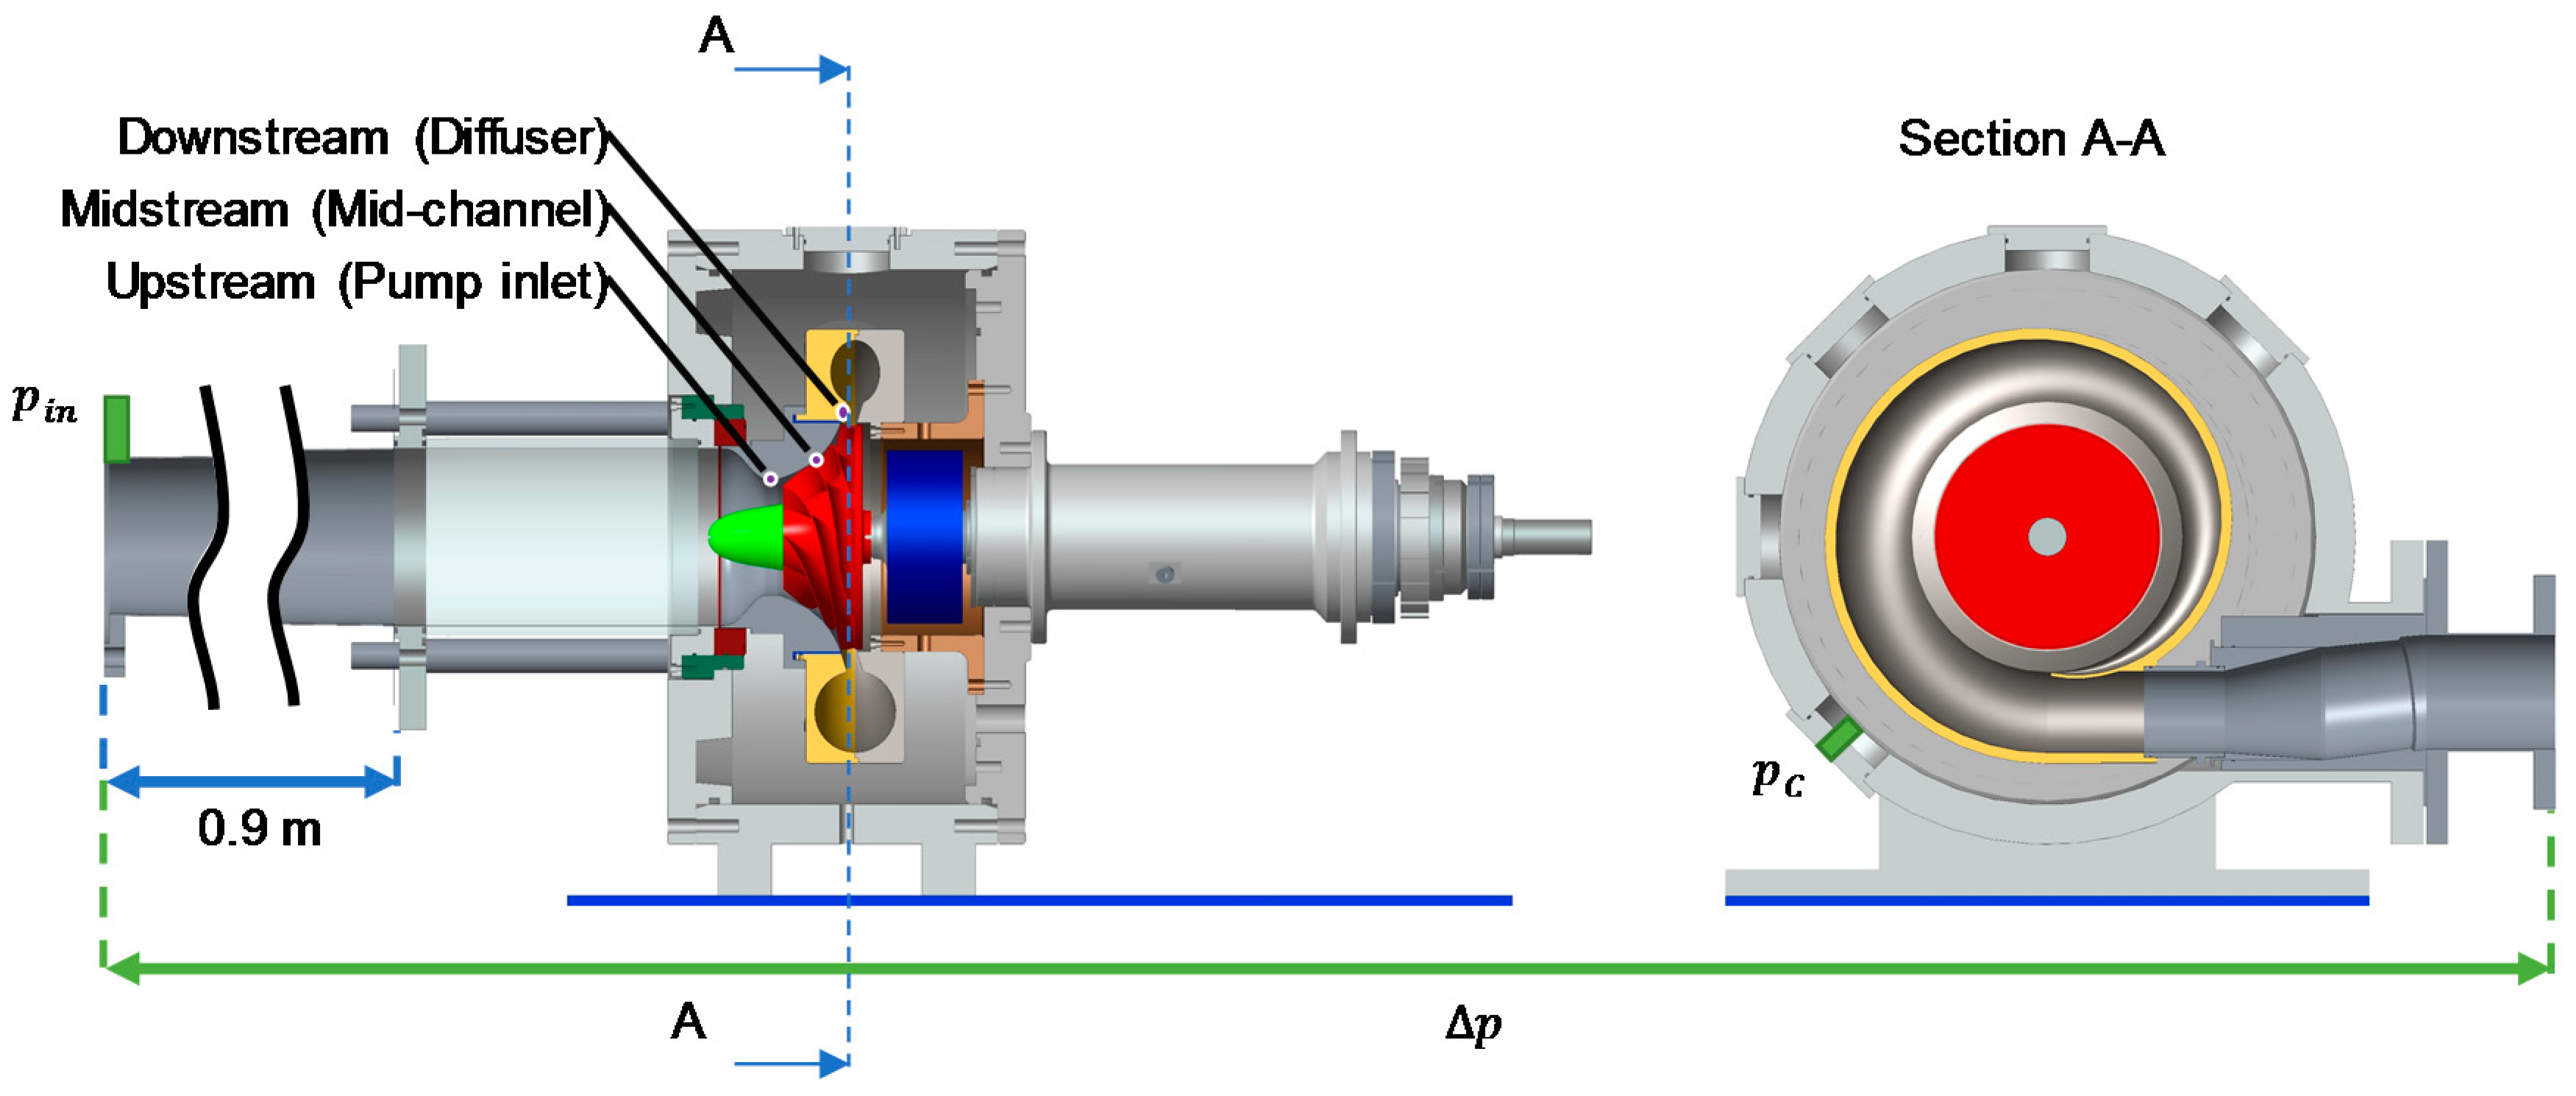
- an absolute pressure transducer (@OPT1) placed in the test chamber/section in order to measure the influence of the pressure on the axial force measured by the dynamometer. In fact, there is a measured force related only to the pressure difference between the water pressure and the sealed dynamometer which is internally at atmospheric condition (General Electric, Boston, MA, US, model UNIK5000, range 0–6 bar, accuracy 0.1% FS);
- one differential pressure transducer ( @IPT1 to OPT2) which measures the pump pressure rise between the inlet station placed at 6 diameters upstream of the blade leading edge, and the outlet station placed about two diameters downstream of the blade trailing edge (General Electric, Boston, MA, US, model UNIK5000, range 0–5 bar, accuracy 0.1% FS);
- one temperature sensor PT100 (range 0–100 °C, accuracy 0.5 °C).
2.2. Pumping Performance
2.3. Cavitating Performance
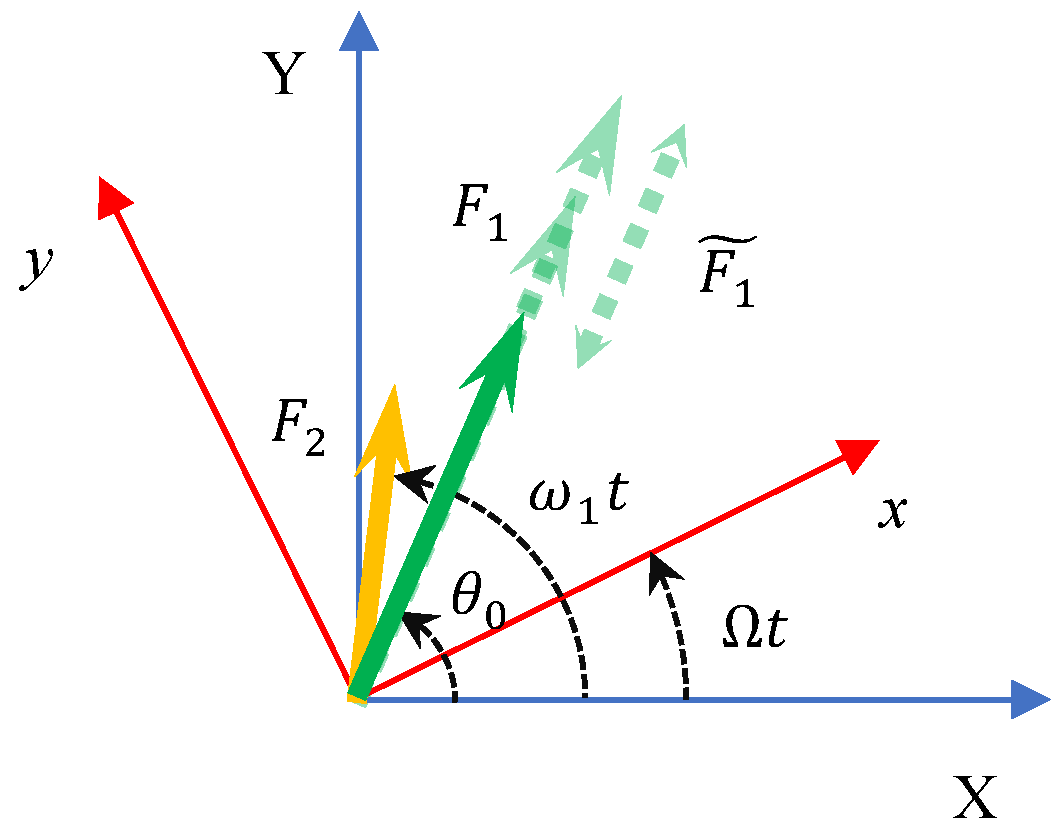
2.4. Flow Instabilities and Unsteady Fluid Forces
3. Results and Discussion
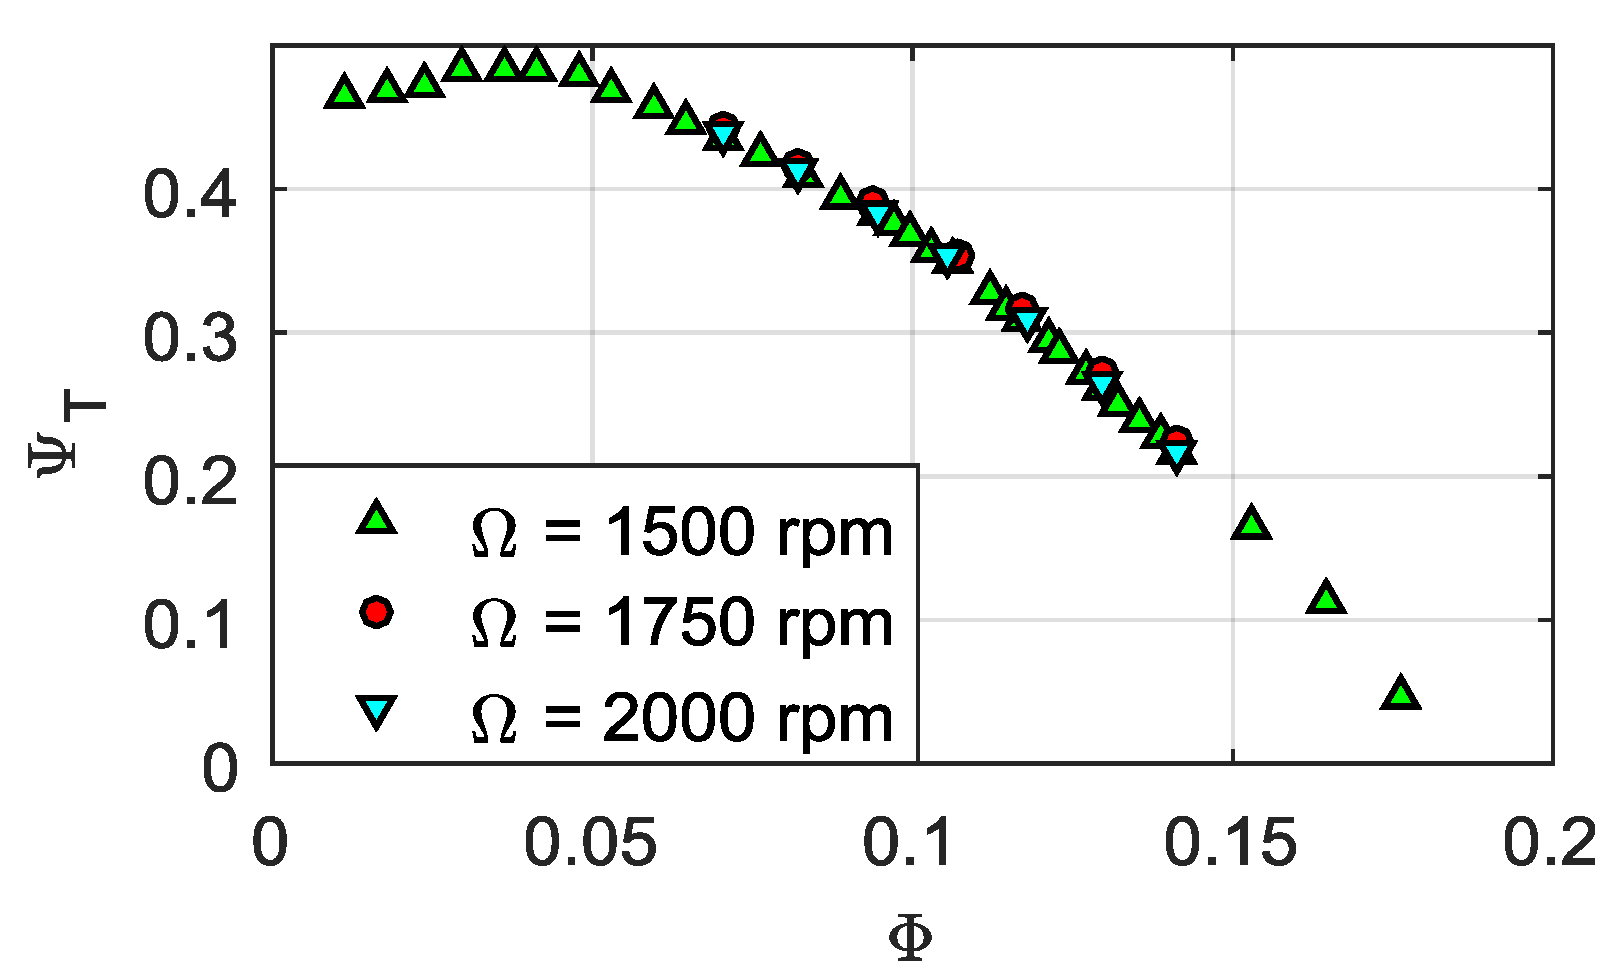
3.1. Pumping Performance
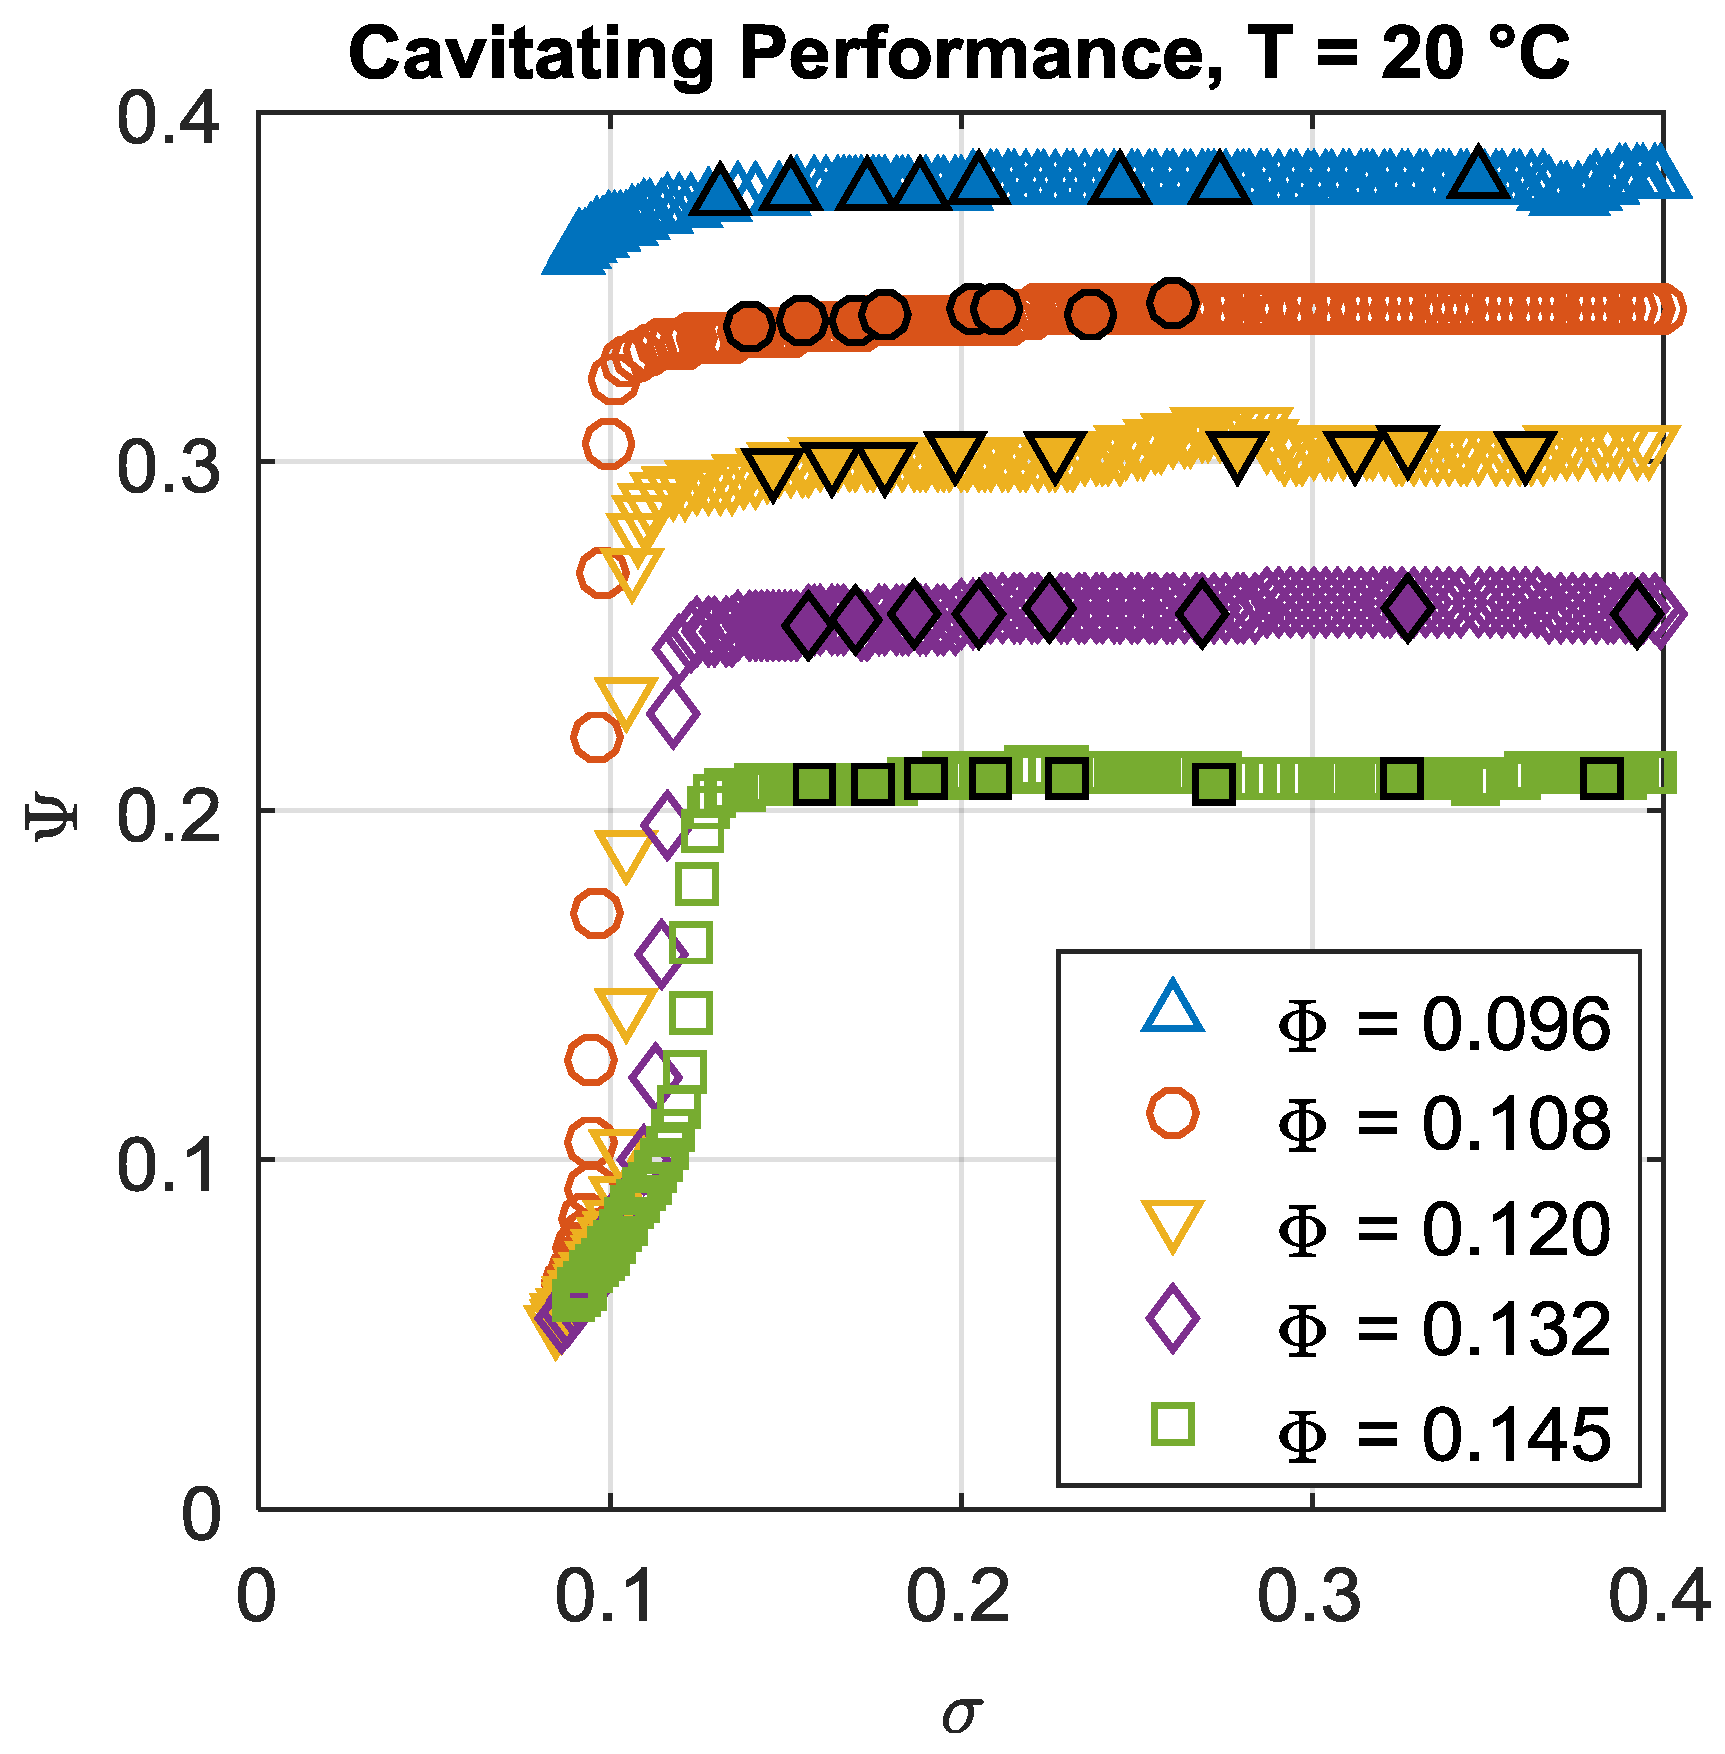
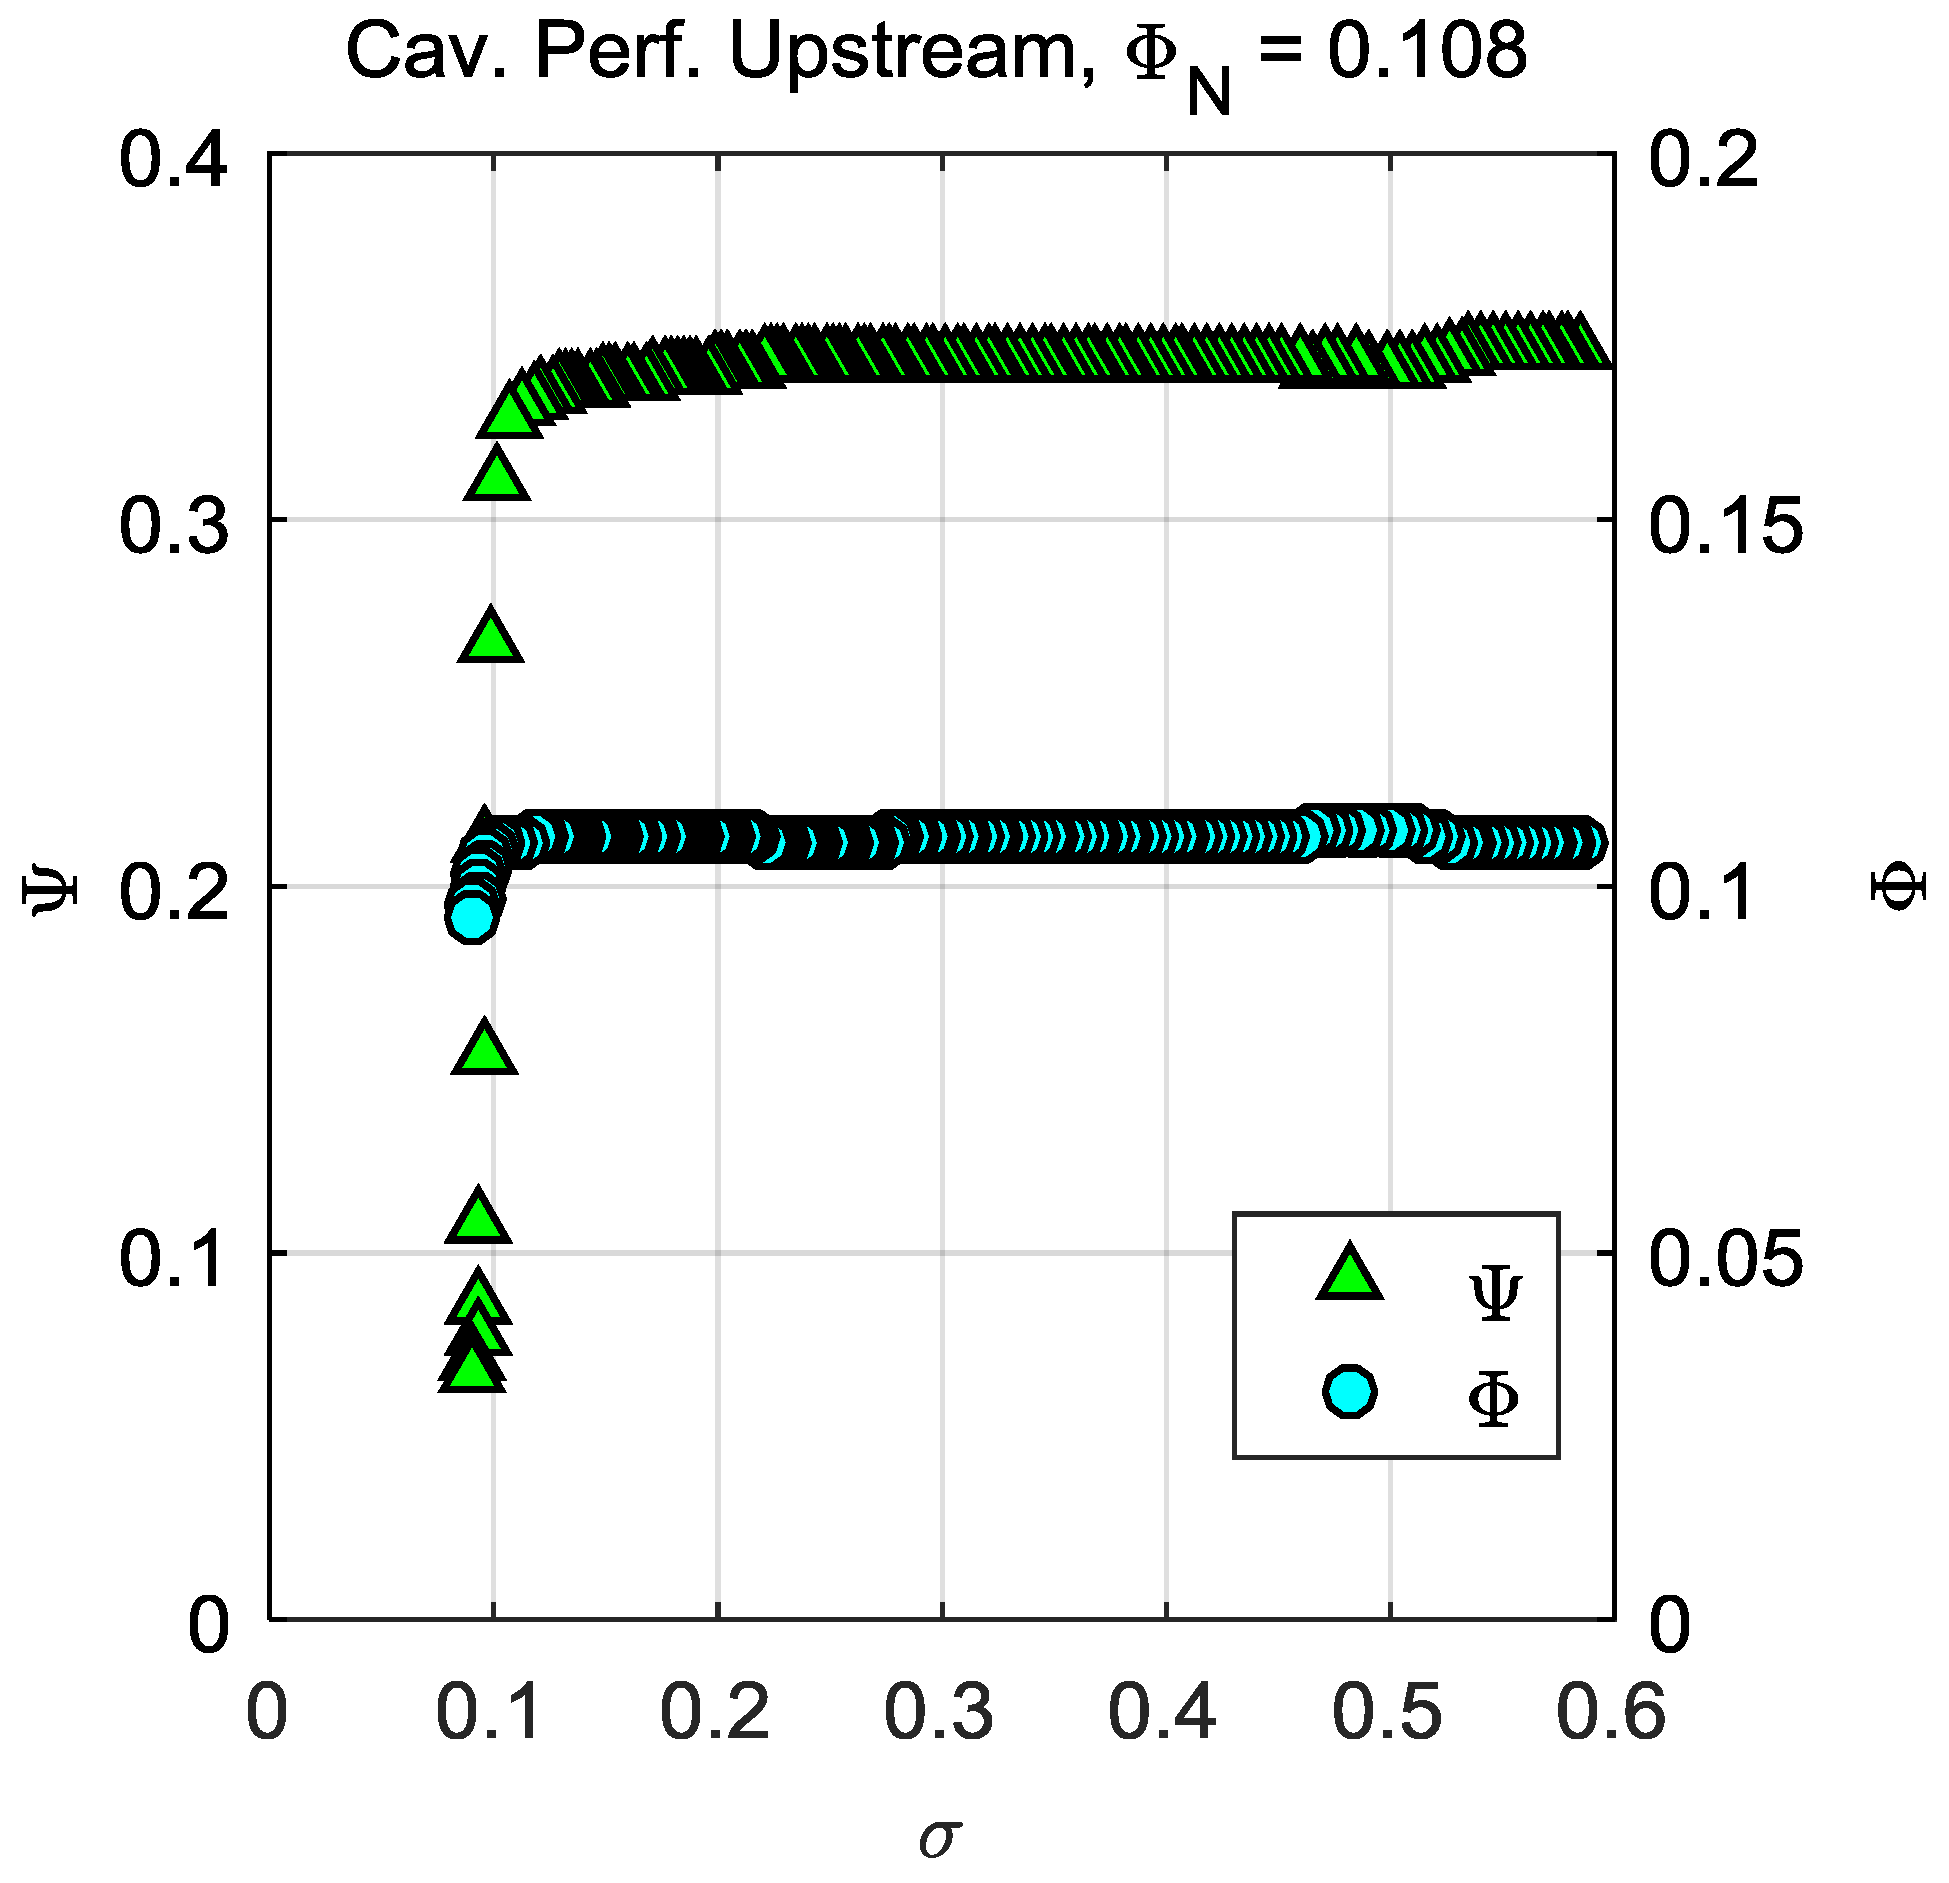
3.2. Cavitating Performance
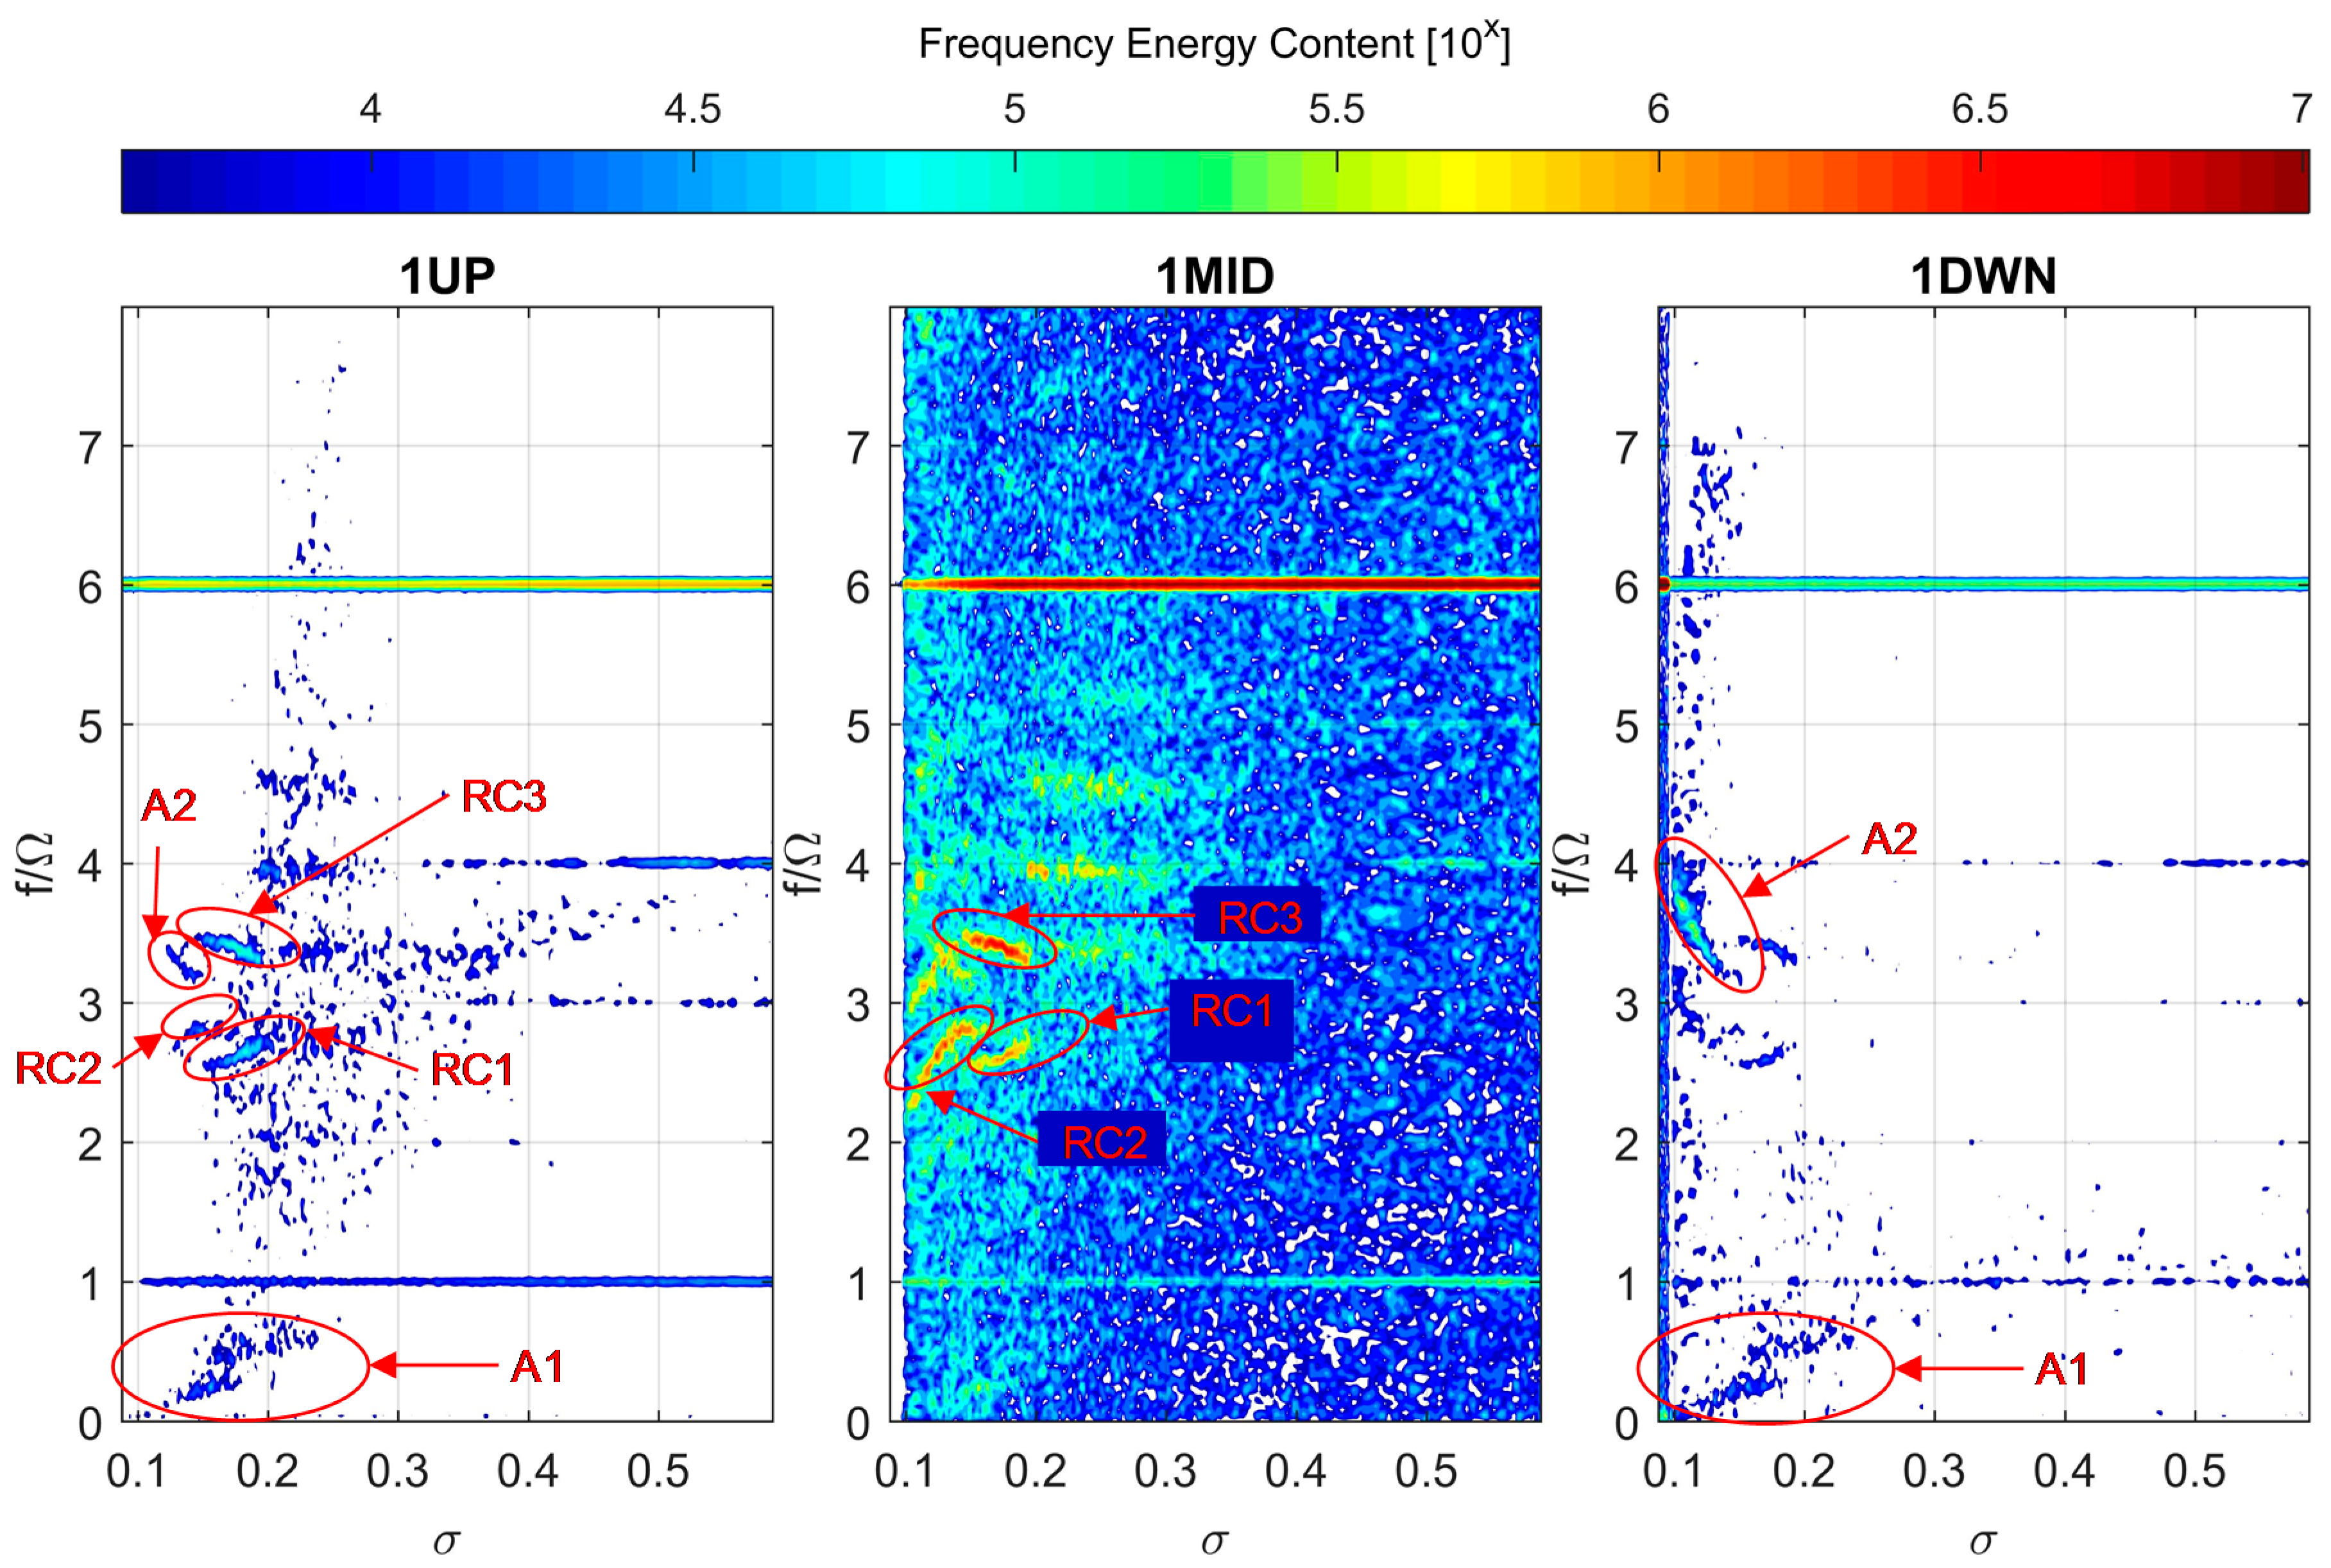
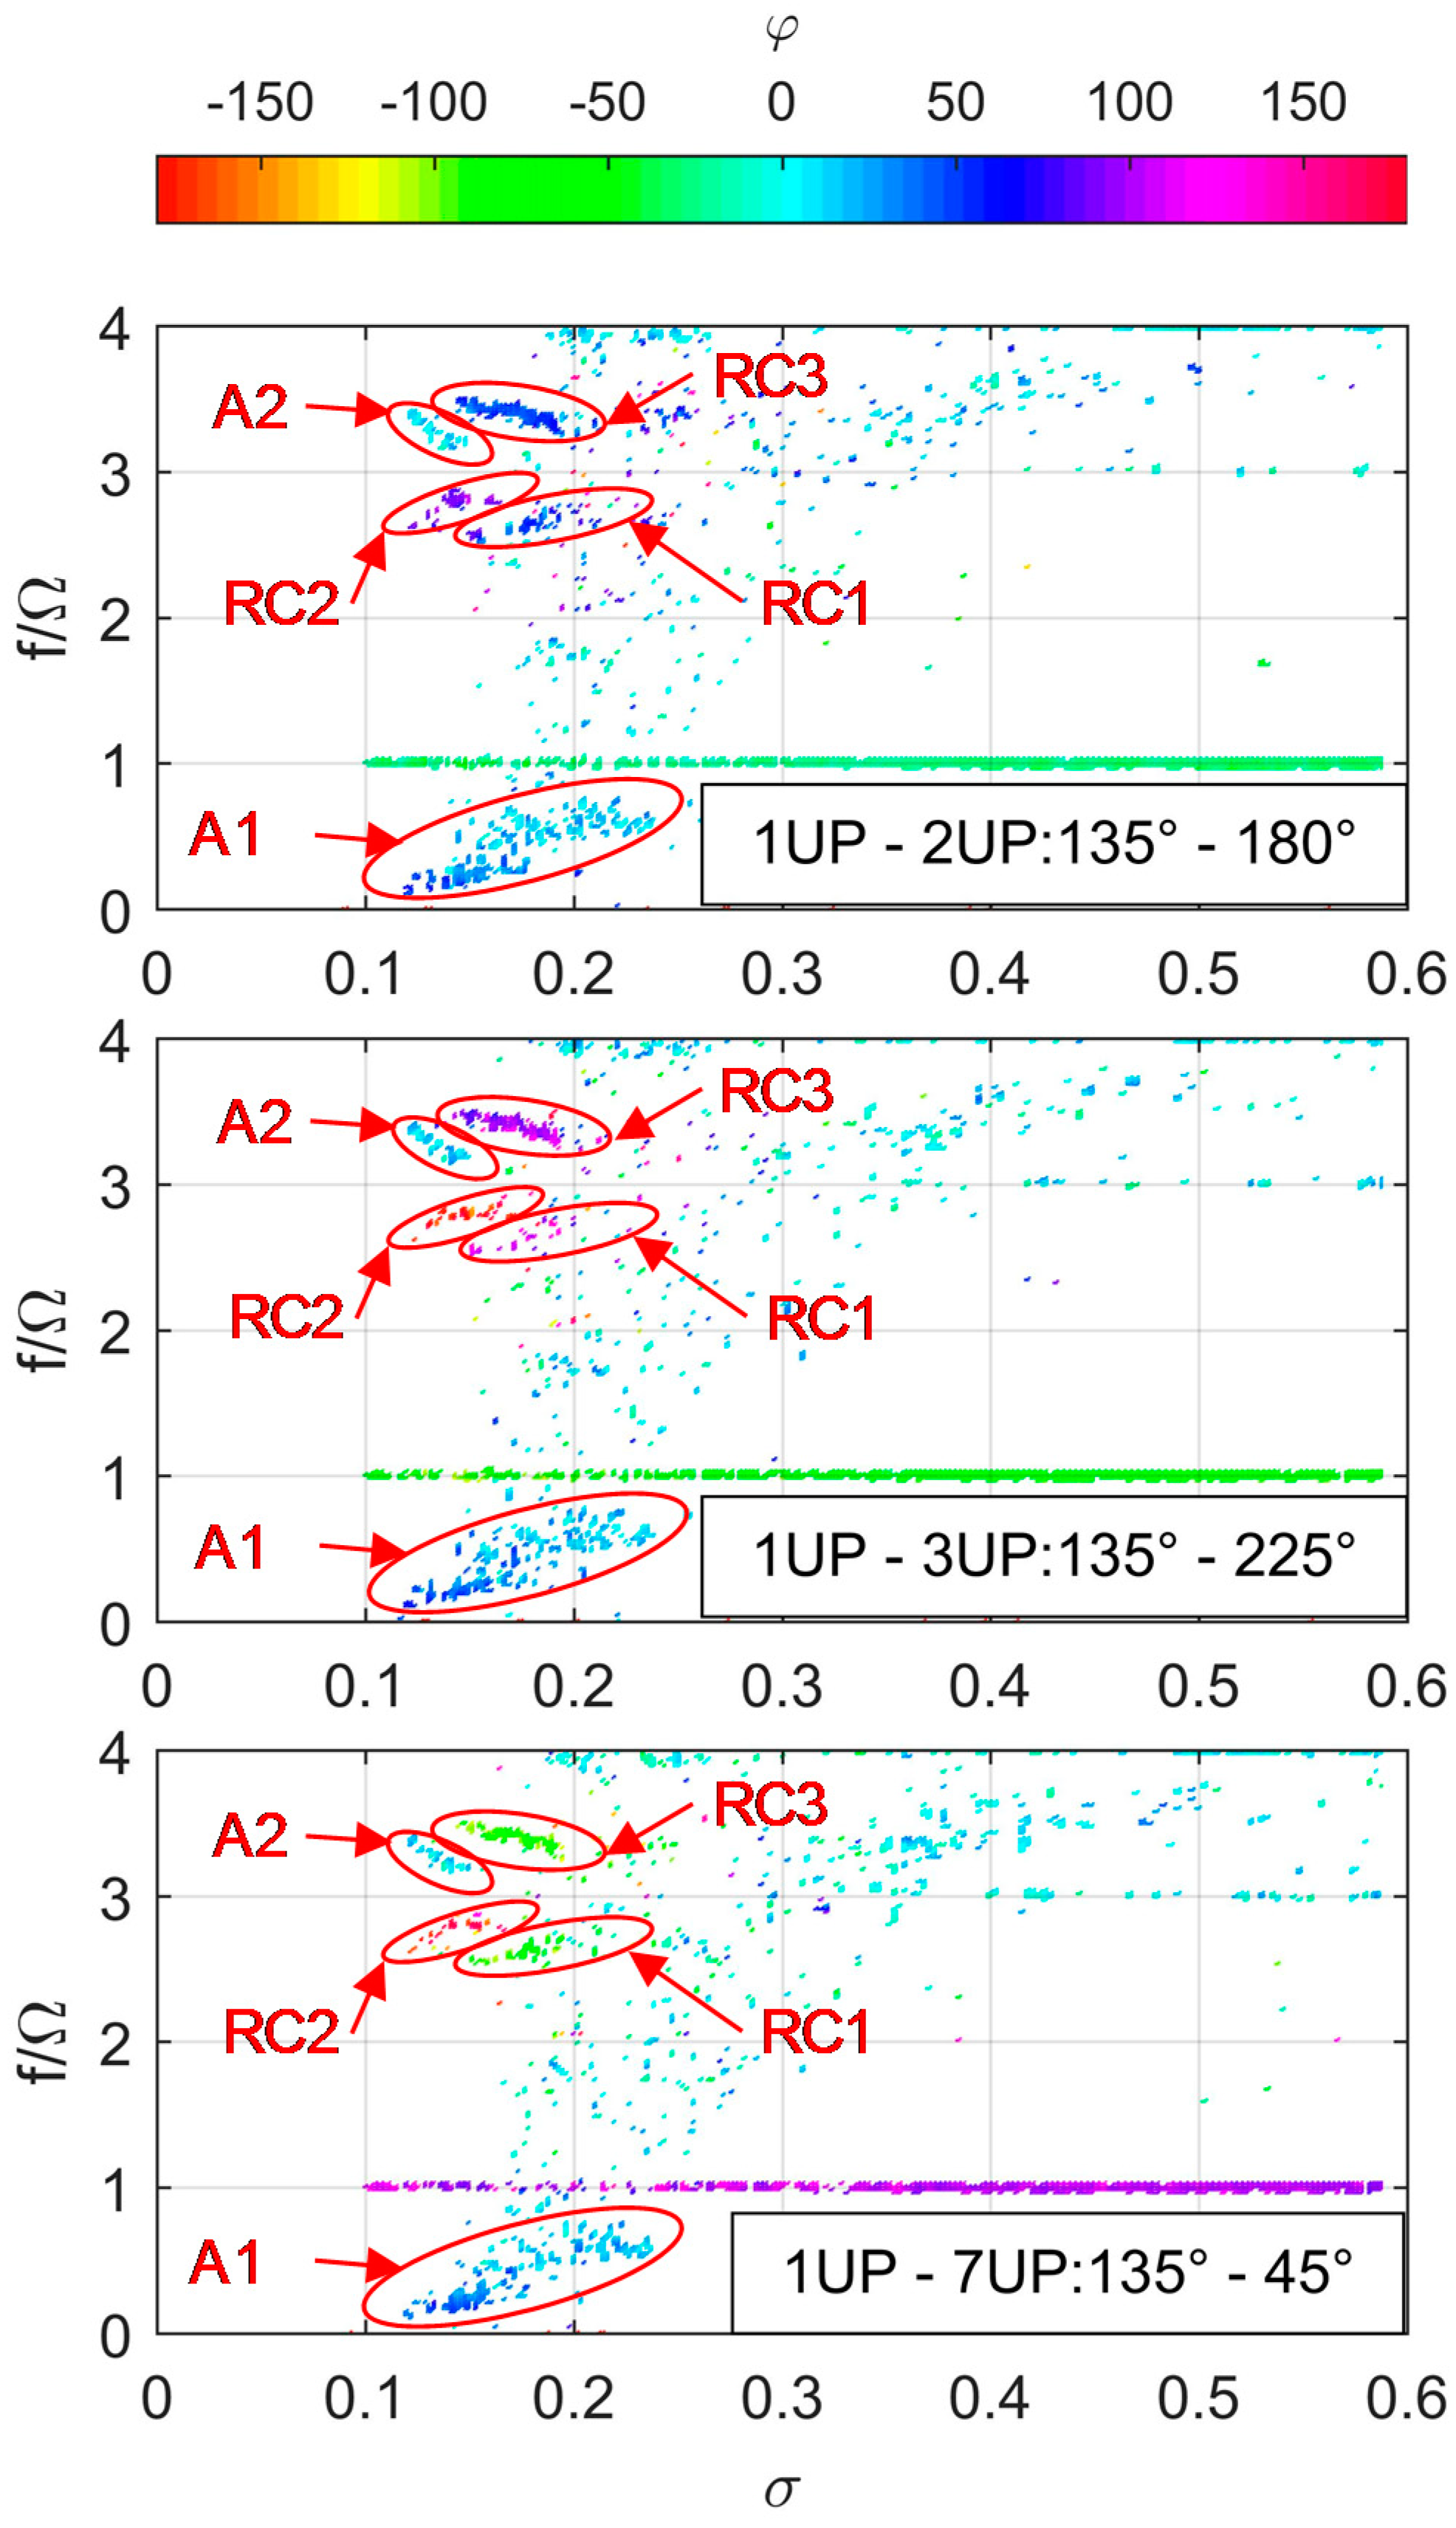
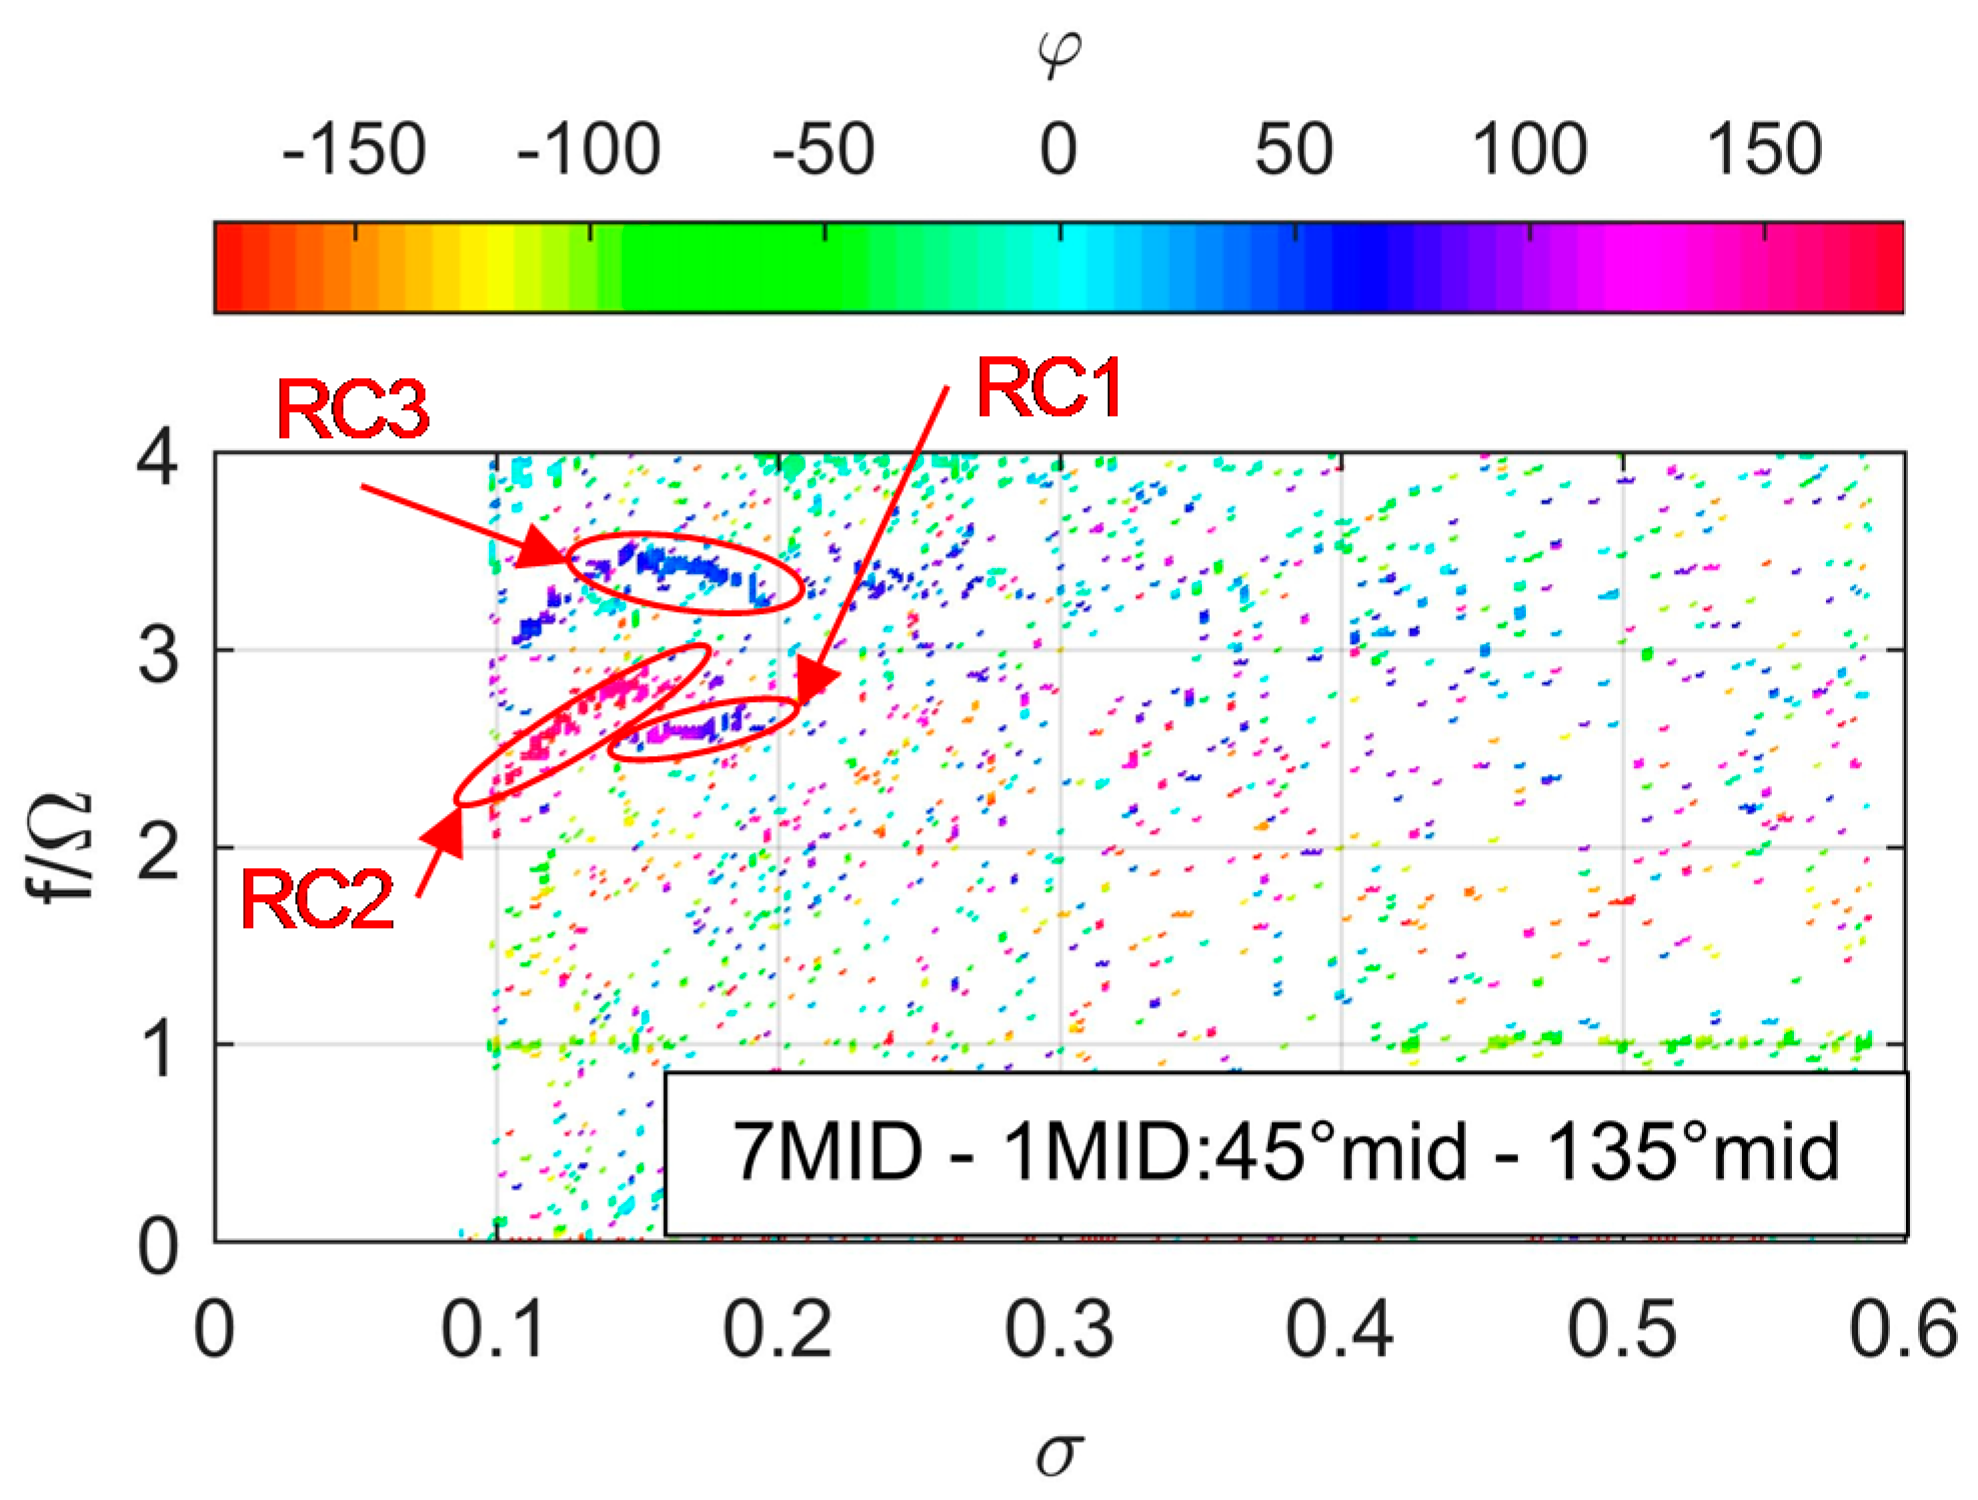
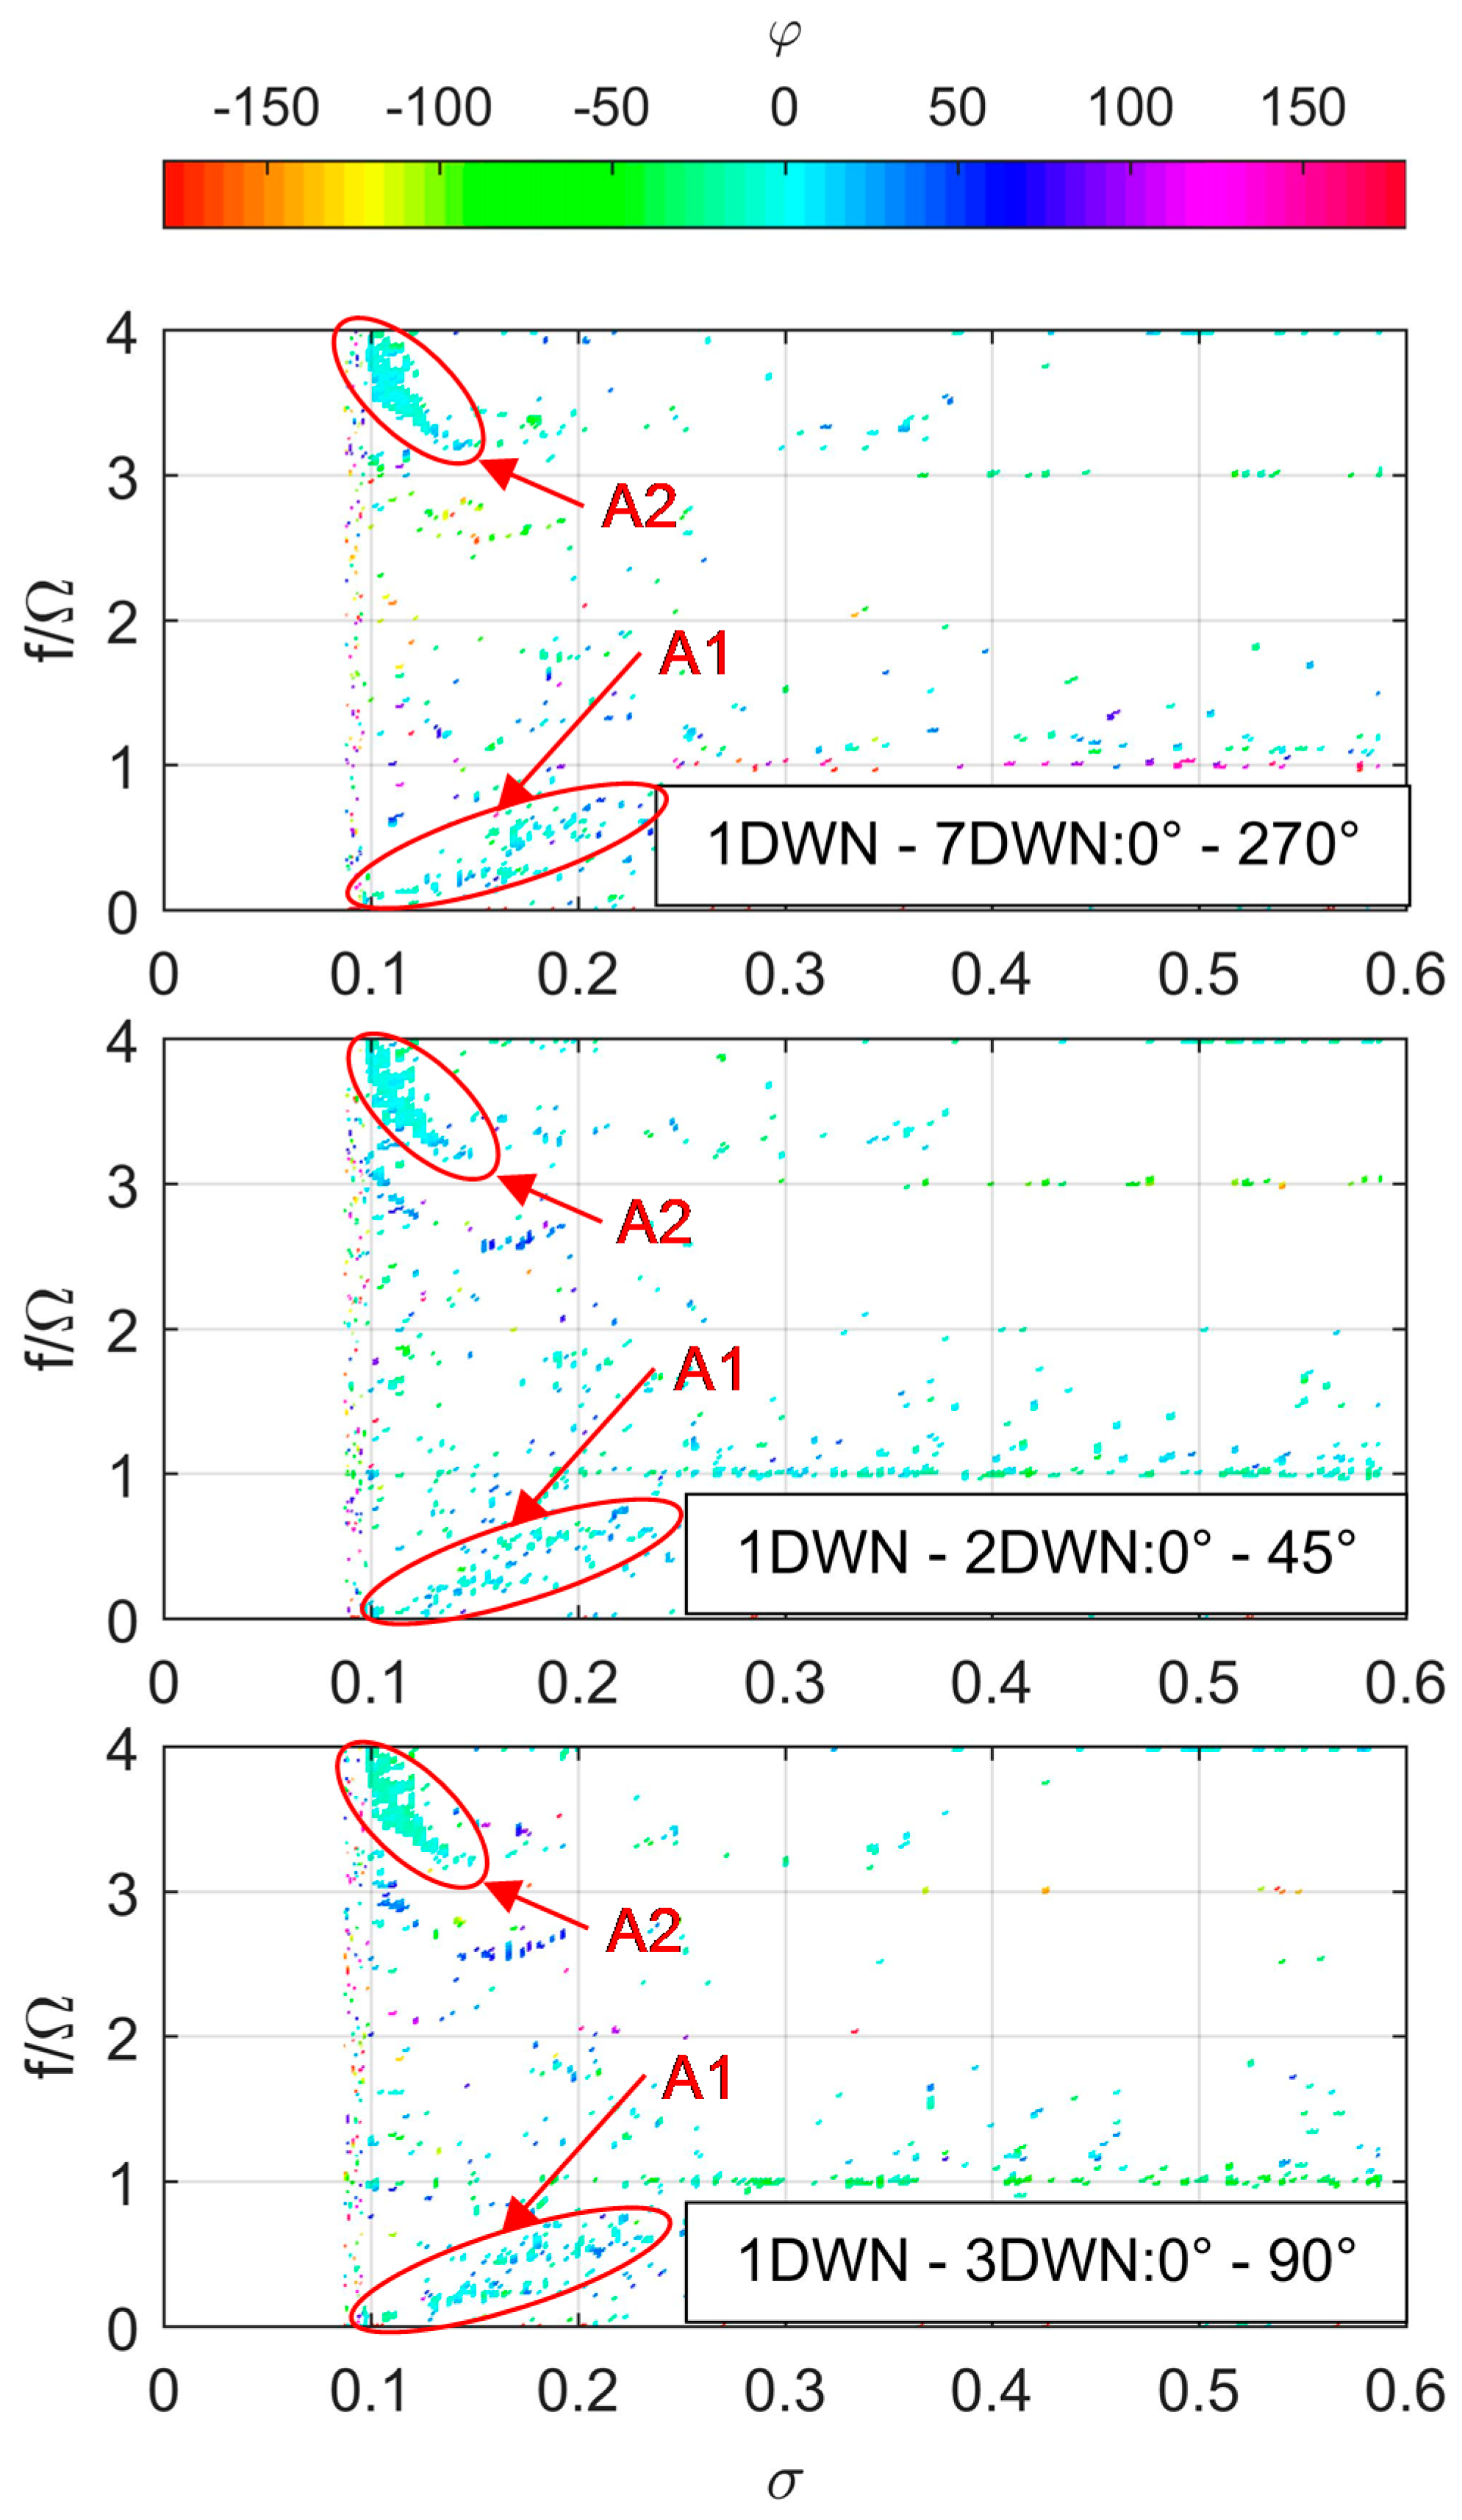
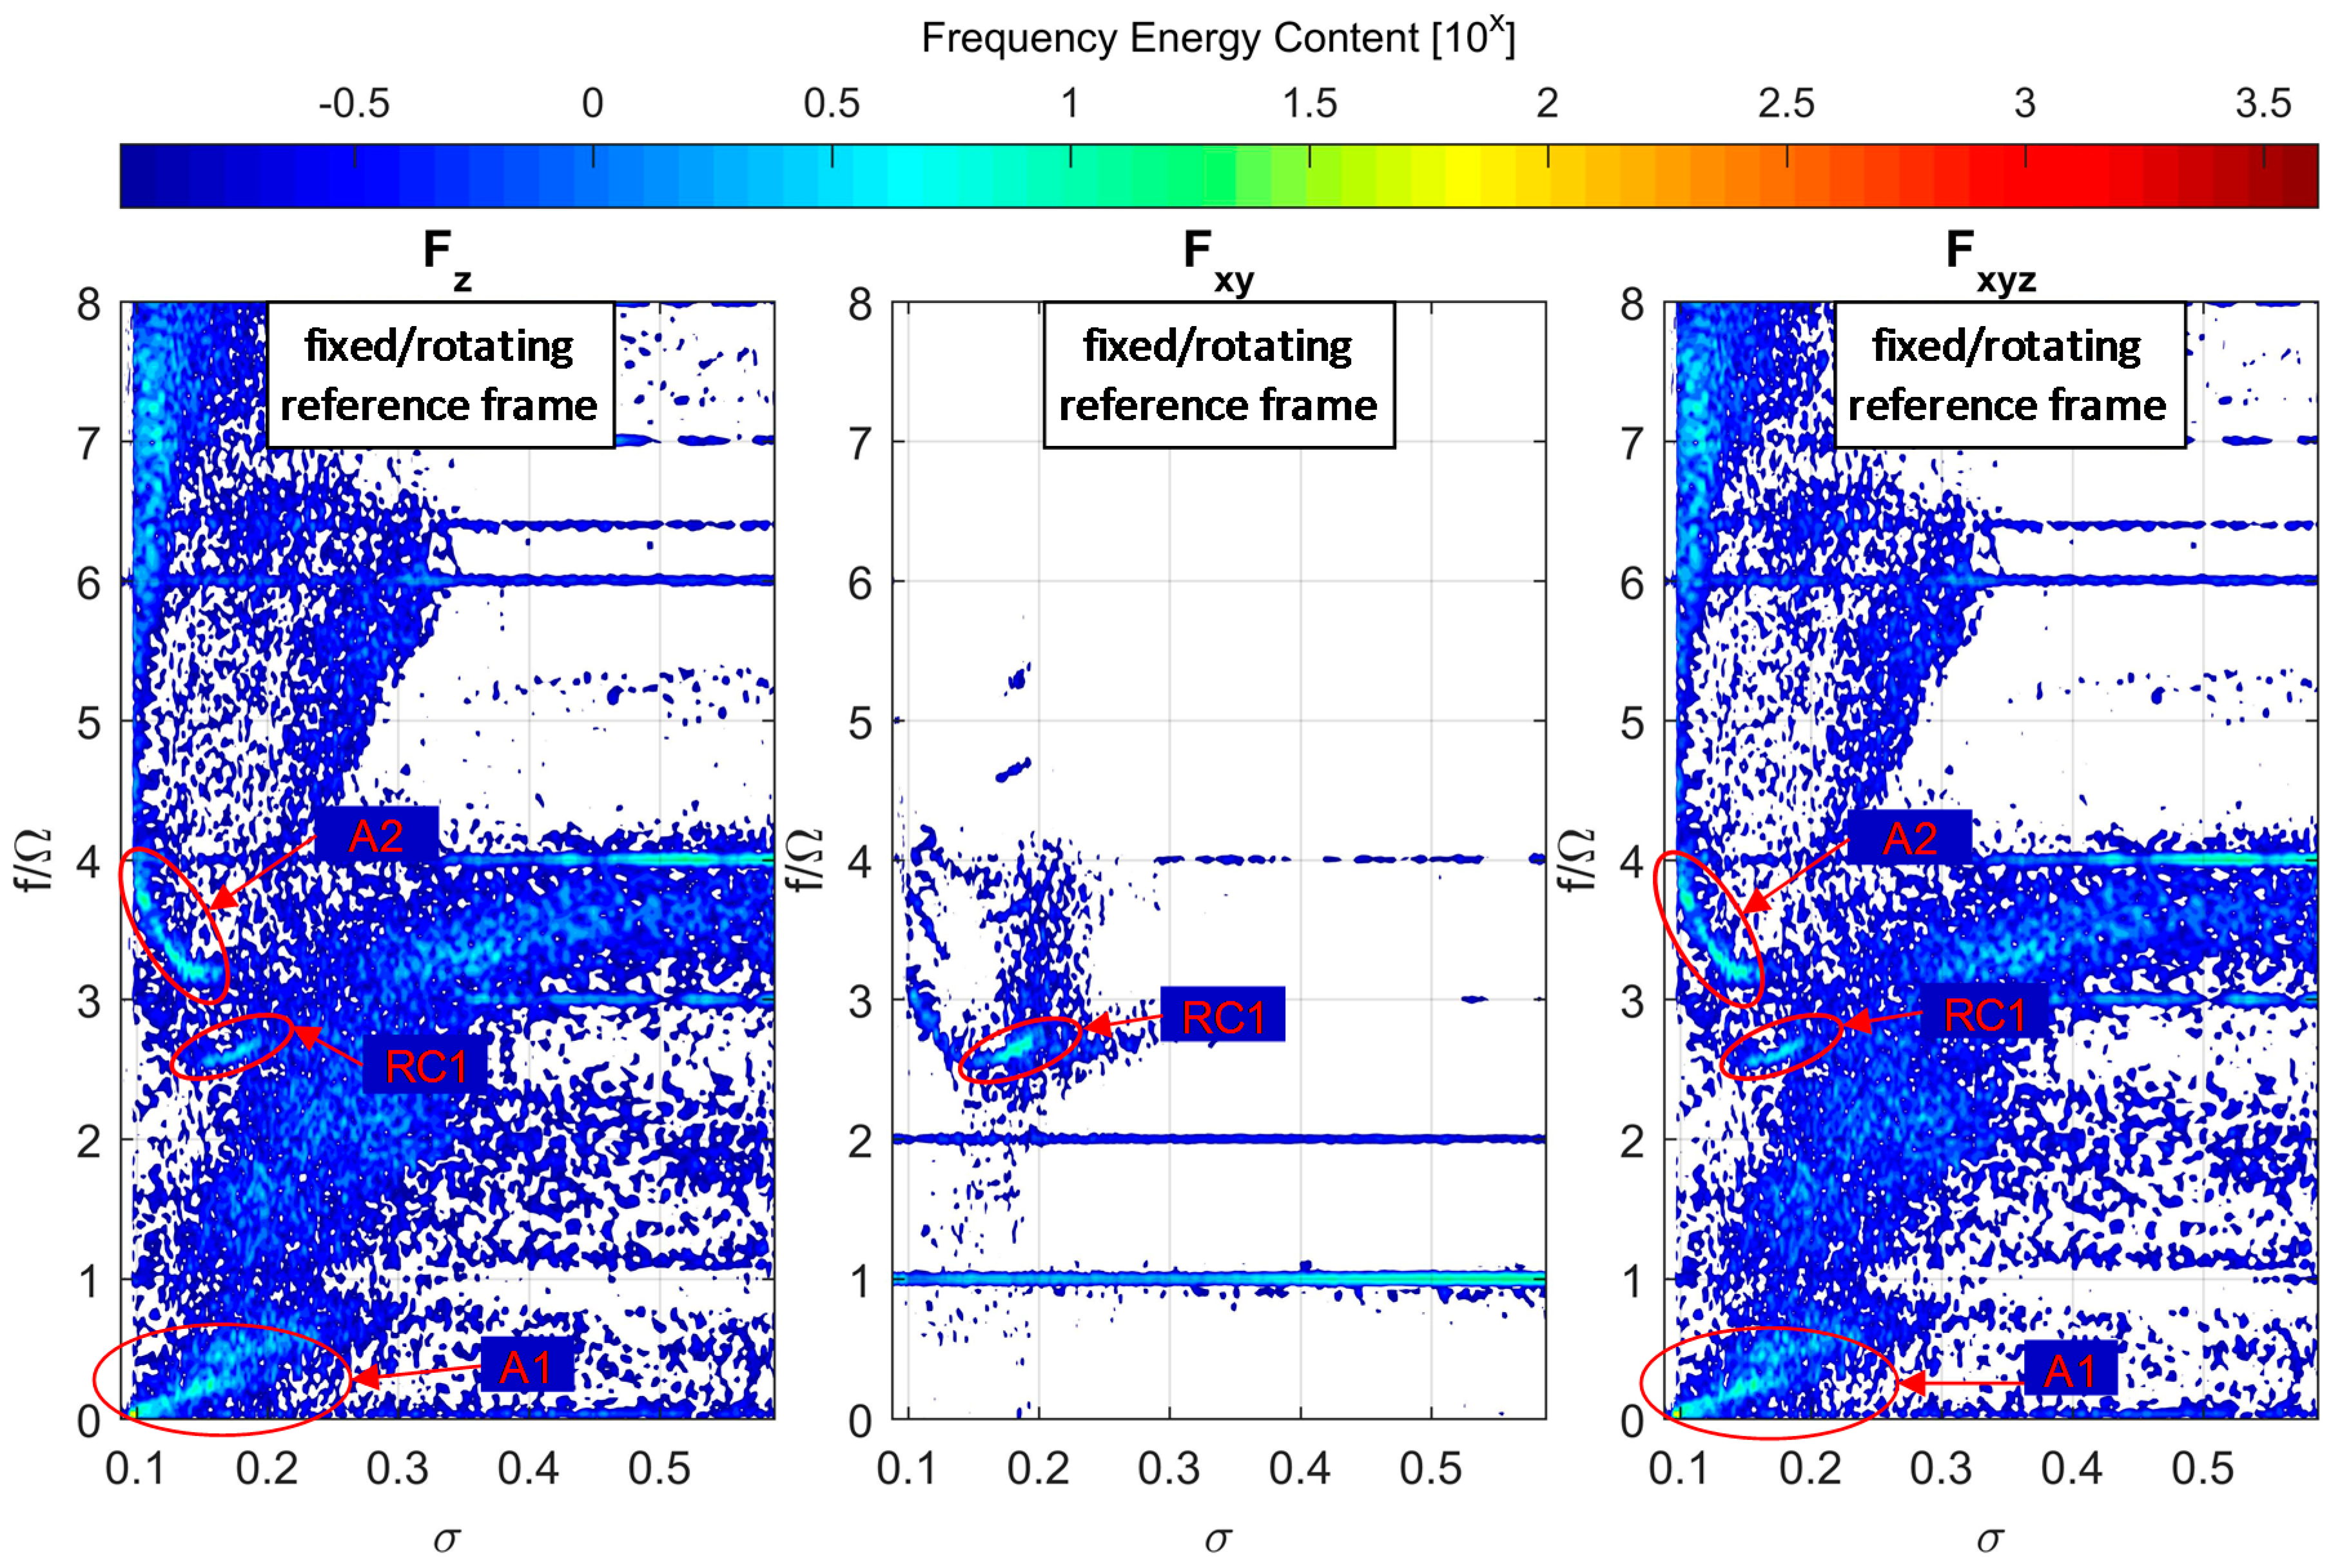
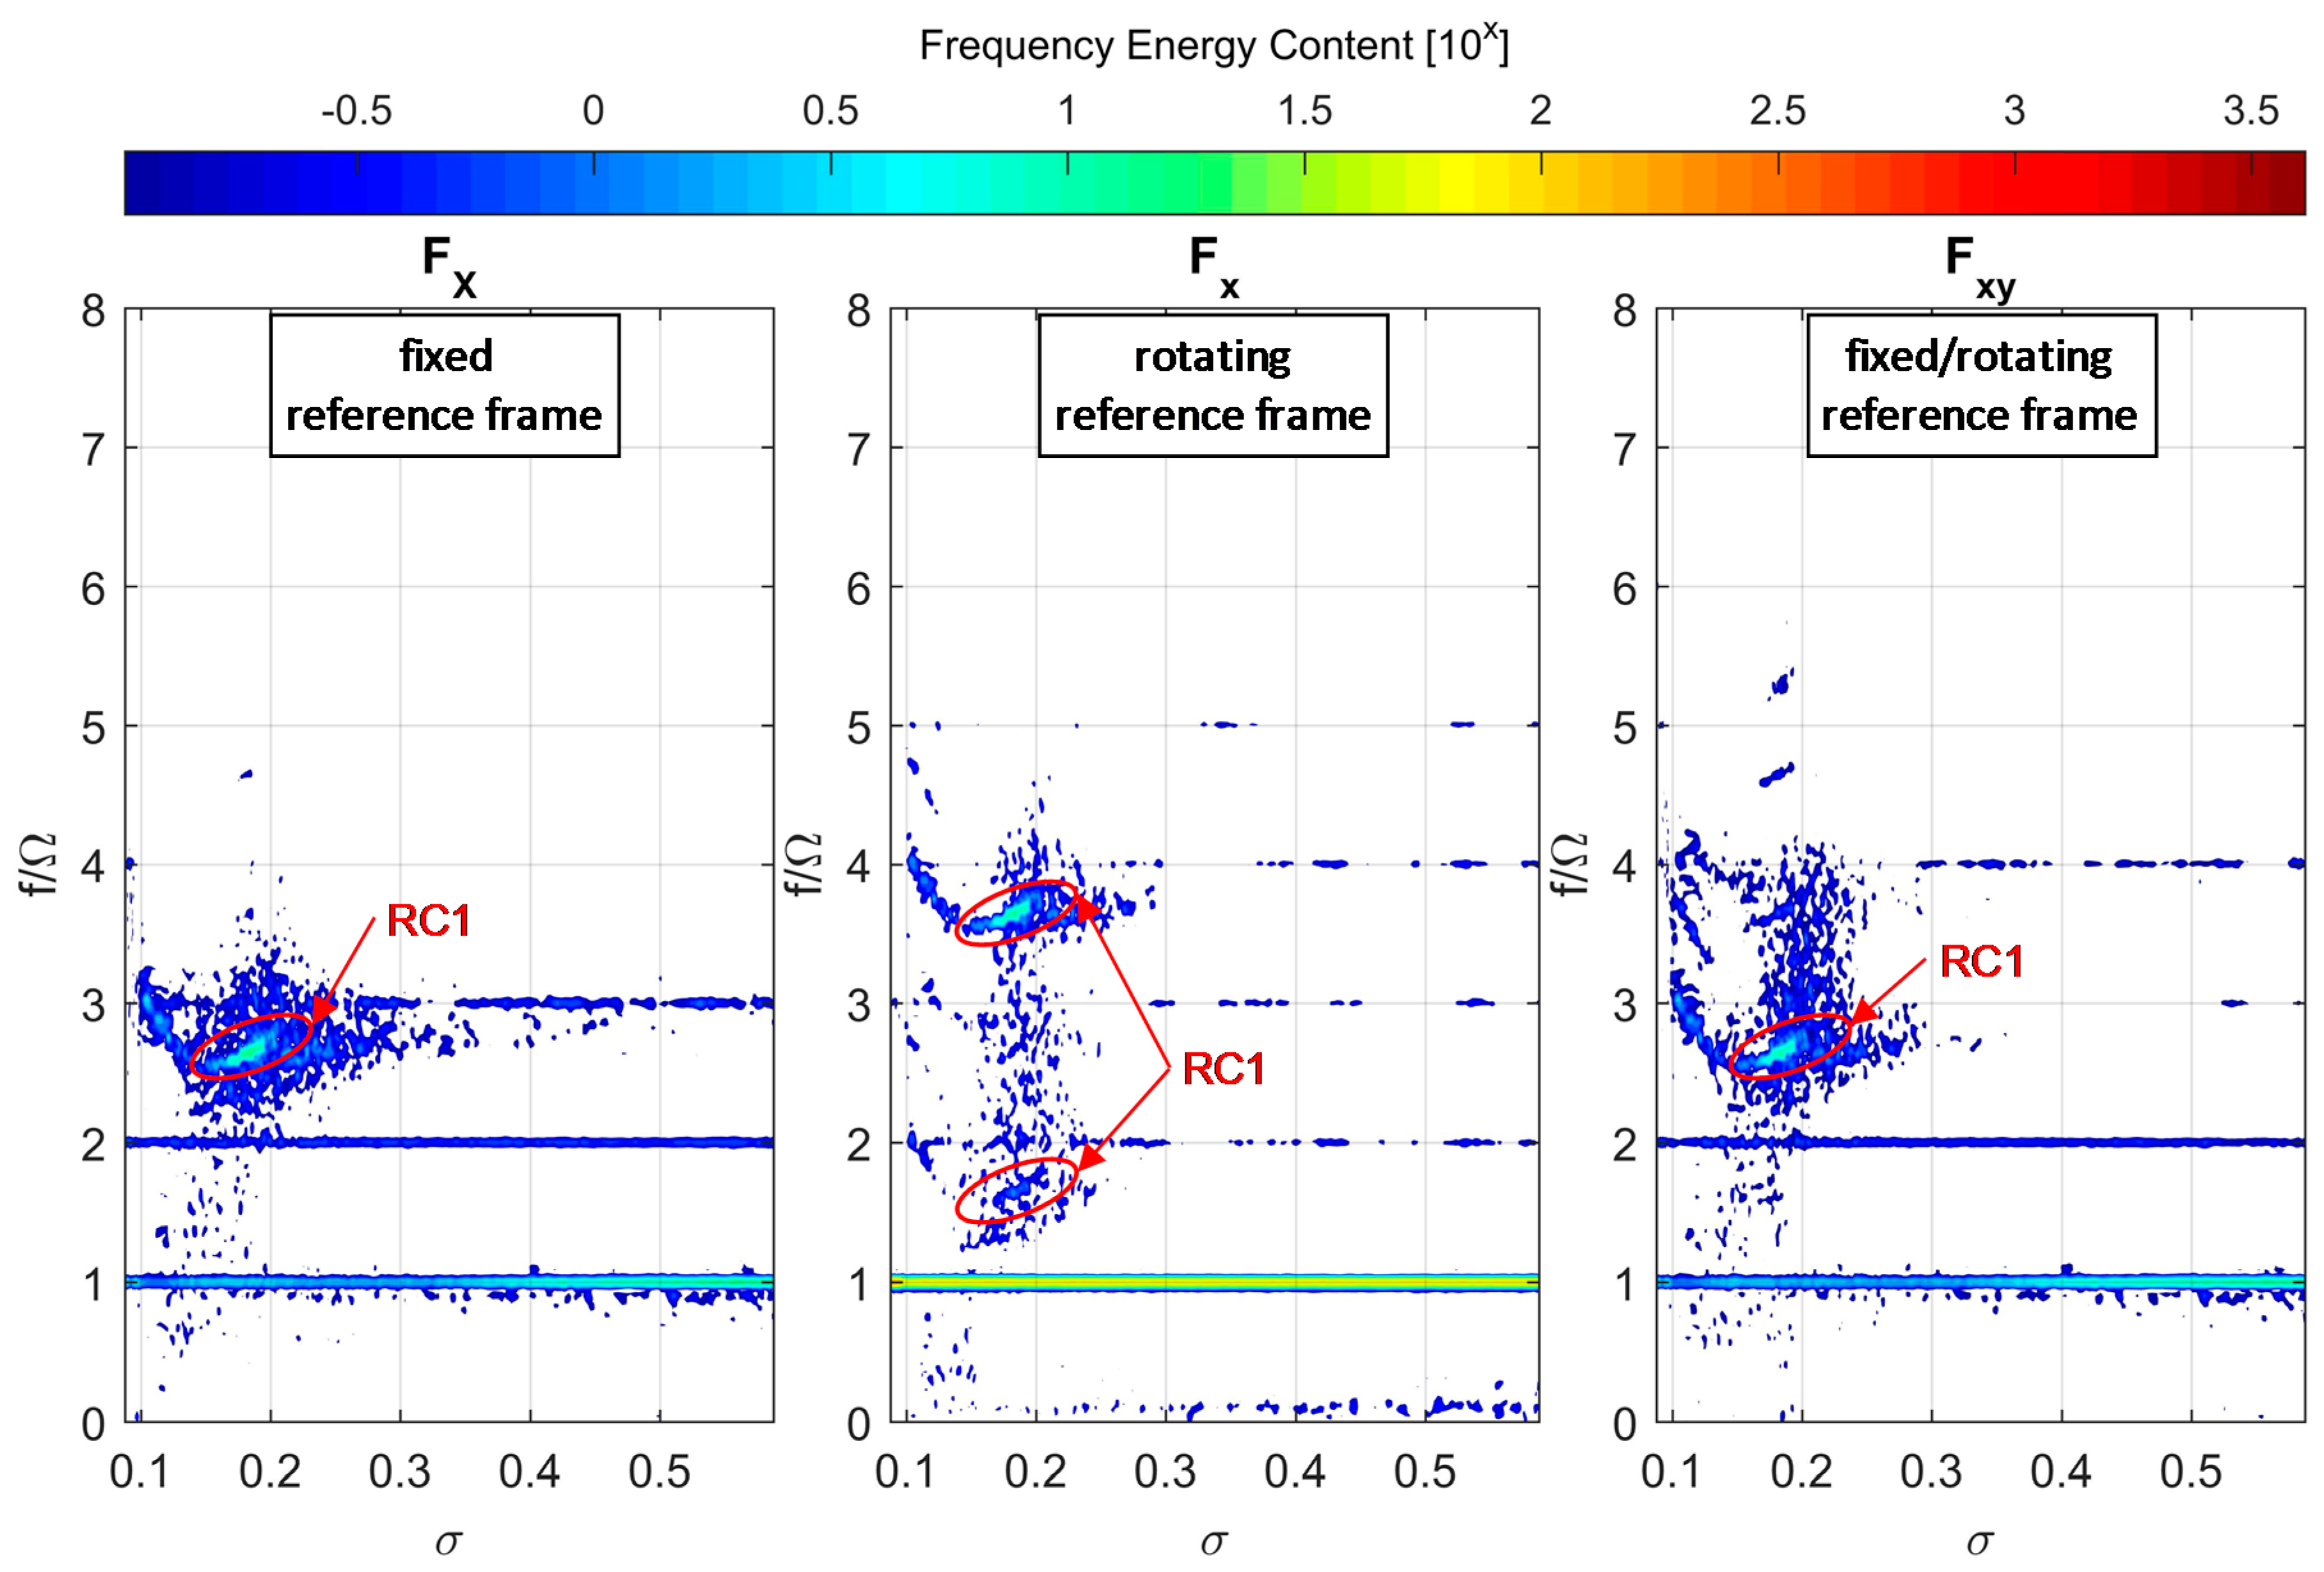
3.3. Flow Instabilities and Unsteady Fluid Forces
- , whose intensity depends on the combination of ;
- ;
- .
4. Conclusions and Future Work
Nomenclature
| Axial | |
| Fluctuation amplitude | |
| Fluctuation energy | |
| Force intensity fluctuation | |
| Force | |
| Full scale | |
| Blade number | |
| Volume flow rate | |
| Rotating cavitation | |
| Reynolds | |
| Power spectrum density | |
| Temperature | |
| Frequency | |
| Flow instability lobes | |
| Pressure | |
| Radius | |
| Axial length, rotating axis |
| Variation | |
| Flow coefficient | |
| Head coefficient | |
| Rotating speed, rotating frequency | |
| Coherence between sensors and | |
| Fluid kinematic viscosity | |
| Fluid density | |
| Cavitation number | |
| Force angular frequency | |
| Cross-spectrum phase | |
| Force initial phase | |
| Azimuthal direction |
| Design | |
| Nominal | |
| Total | |
| Chamber | |
| Inlet | |
| Vapor | |
| Rotating frame | |
| Fixed frame |
Author Contributions
Acknowledgments
Conflicts of Interest
References
- Bhattacharyya, A.; Acosta, A.J.; Brennen, C.E.; Caughey, T.K. Rotordynamic Forces in Cavitating Inducers. J. Fluids Eng. 1997, 119, 768. [Google Scholar] [CrossRef][Green Version]
- Bhattacharyya, A. Internal Flows and Force Matrices in Axial Flow Inducers. Ph.D. Thesis, California Institute of Technology, Pasadena, CA, USA, 1994. [Google Scholar]
- Franz, R.J. Experimental Investigation of the Effect of Cavitation on the Rotordynamic Forces on a Whirling Centrifugal Pump Impeller. Ph.D. Thesis, California Institute of Technology, Pasadena, CA, USA, 1989. [Google Scholar]
- Rosenmann, W. Experimental investigations of hydrodynamically induced shaft forces with a three bladed inducer. In Proceedings of the ASME Symposium on Cavitation in Fluid Machinery, Chicago, IL, USA, 7–11 November 1965; pp. 172–195. [Google Scholar]
- Ehrich, F.; Childs, D. Self-Excited Vibrations in High Performance Turbomachinery. Mech. Eng. 1984, 106, 66–79. [Google Scholar]
- Hergt, P.; Krieger, P. Radial Forces in Centrifugal Pumps with Guide Vanes. Proc. Inst. Mech. Eng. 1969, 184, 101–107. [Google Scholar] [CrossRef]
- Suzuki, T.; Prunières, R.; Horiguchi, H.; Tsukiya, T.; Taenaka, Y.; Tsujimoto, Y. Measurements of Rotordynamic Forces on an Artificial Heart Pump Impeller. J. Fluids Eng. 2007, 129, 1422–1427. [Google Scholar] [CrossRef]
- Brennen, C.E.; Franz, R.; Arndt, N. Effects of Cavitation on Rotordynamic Force Matrices. In Proceedings of the 3rd Conference on Advanced Earth-to-Orbit Propulsion Technology; Richmond, R.J., Wu, S.T., Eds.; NASA: Washington, DC, USA, 1988; pp. 227–239. [Google Scholar]
- Hashimoto, T.; Yoshida, M.; Watanabe, M. Experimental Study on Rotating Cavitation of Rocket Propellant Pump Inducers. J. Propuls. Power 1997, 13, 488–494. [Google Scholar] [CrossRef]
- Tsujimoto, Y.; Yoshida, Y.; Maekawa, Y.; Watanabe, S.; Hashimoto, T. Observations of Oscillating Cavitation of an Inducer. J. Fluids Eng. 1997, 119, 775–781. [Google Scholar] [CrossRef]
- Zoladz, T. Observations on rotating cavitation and cavitation surge from the development of the Fastrac engine turbopump. In Proceedings of the 36th AIAA/ASME/SAE/ASEE Joint Propulsion Conference and Exhibit, Las Vegas, NV, USA, 24–28 July 2000. [Google Scholar]
- Tsujimoto, Y.; Semenov, Y. New Types of Cavitation Instabilities in Inducers. In Proceedings of the 4th International Conference on Launcher Technology “Space Launcher Liquid Propulsion”, Liege, Belgium, 3–6 December 2002. [Google Scholar]
- Subbaraman, M.; Patton, M. Suppressing Higher-Order Cavitation Phenomena in Axial Inducers. In Proceedings of the 6th International Symposium on Cavitation, Wageningen, The Netherlands, 11–15 September 2006. [Google Scholar]
- Kamijo, K.; Yoshida, M.; Tsujimoto, Y. Hydraulic and mechanical performance of LE-7 LOX pump inducer. J. Propuls. Power 1993, 9, 819–826. [Google Scholar] [CrossRef]
- Cervone, A.; Bramanti, C.; Rapposelli, E.; Torre, L.; d’Agostino, L. Experimental Characterization of Cavitation Instabilities in a Two-Bladed Axial Inducer. J. Propuls. Power 2006, 22, 1389–1395. [Google Scholar] [CrossRef]
- Cervone, A.; Torre, L.; Pasini, A.; d’Agostino, L. Cavitation and Flow Instabilities in a 3- Bladed Axial Inducer Designed by Means of a Reduced Order Analytical Model. In Proceedings of the 7th International Symposium on Cavitation, Ann Arbor, MI, USA, 17–22 August 2009. [Google Scholar]
- Torre, L.; Pace, G.; Miloro, P.; Pasini, A.; Cervone, A.; d’Agostino, L. Flow Instabilities on a Three Bladed Axial Inducer at Variable Tip Clearance. In Proceedings of the 13th International Symposium on Transport Phenomena and Dynamics of Rotating Machinery, Honolulu, HI, USA, 4–9 April 2010. [Google Scholar]
- Friedrichs, J.; Kosyna, G. Rotating Cavitation in a Centrifugal Pump Impeller of Low Specific Speed. J. Fluids Eng. 2002, 124, 356–362. [Google Scholar] [CrossRef]
- Yamamoto, K. Instability in a Cavitating Centrifugal Pump. JSME Int. J. Ser 2 Fluids Eng. Heat Transf. Power Combust. Thermophys. Prop. 1991, 34, 9–17. [Google Scholar] [CrossRef][Green Version]
- Valentini, D.; Pace, G.; Torre, L.; Pasini, A.; d’Agostino, L. Influences of the Operating Conditions on the Rotordynamic Forces Acting on a Three-Bladed Inducer Under Forced Whirl Motion. J. Fluids Eng. 2015, 137, 071304–071304-10. [Google Scholar] [CrossRef]
- Valentini, D.; Pace, G.; Pasini, A.; Torre, L.; Hadavandi, R.; d’Agostino, L. Fluid-induced rotordynamic forces on a whirling centrifugal pump. Eur. J. Mech. B/Fluids 2017, 61, 336–345. [Google Scholar] [CrossRef]
- Valentini, D.; Pace, G.; Torre, L.; Pasini, A.; d’Agostino, L. Pumping and Suction Performance of a Whirling Inducer. In Proceedings of the Space Propulsion 2014, Cologne, Germany, 19–22 May 2014. [Google Scholar]
- Pace, G.; Pasini, A.; Torre, L.; Valentini, D.; d’Agostino, L. Cavitating Pump Rotordynamic Test Facility at ALTA S.p.A.: Upgraded Capabilities of a Unique Test Rig. In Space Propulsion Conference 2012; ESA: Bordeaux, France, May 2012. [Google Scholar]
- Pasini, A. Pumping Performance Similarity, Cavitation-Induced Instabilities and Fluid-Induced Rotordynamic Forces in Tapered Inducers. Ph.D. Thesis, University of Pisa, Pisa, Italy, 2010. [Google Scholar]
- d’Agostino, L. Comparison of rotordynamic fluid forces in axial inducers and centrifugal turbopump impellers. IOP Conf. Ser. Mater. Sci. Eng. 2016, 129, 012001. [Google Scholar] [CrossRef]
- d’Agostino, L.; Torre, L.; Pasini, A.; Baccarella, D.; Cervone, A.; Milani, A. A Reduced Order Model for Preliminary Design and Performance Prediction of Tapered Inducers: Comparison with Numerical Simulations. In Proceedings of the 44th AIAA/ASME/SAE/ASEE Joint Propulsion Conference & Exhibit, Hartford, CT, USA, 21–23 July 2008. [Google Scholar]
- d’Agostino, L.; Torre, L.; Pasini, A.; Cervone, A. On the Preliminary Design and Noncavitating Performance Prediction of Tapered Axial Inducers. J. Fluids Eng. 2008, 130, 111303:1–111303:8. [Google Scholar] [CrossRef]
- Valentini, D.; Pasini, A.; Pace, G.; Torre, L.; d’Agostino, L. Experimental Validation of a Reduced Order for Radial Turbopump Design. In Proceedings of the 49th AIAA/ASME/SAE/ASEE Joint Propulsion Conference, San Jose, CA, USA, 14–17 July 2013. [Google Scholar]
- Pace, G.; Valentini, D.; Pasini, A.; Torre, L.; Fu, Y.; d’Agostino, L. Effects of Geometry on Flow Instabilities of Different Three-Bladed Axial Inducers. J. Fluids Eng. 2015, 137, 041304. [Google Scholar] [CrossRef]
- Bendat, J.S.; Piersol, A.G. Random Data: Analysis and Measurement Procedures; Wiley Series in Probability and Statistics; John Wiley & Sons, Inc.: Hoboken, NJ, USA, 2010; ISBN 978-1-118-03242-8. [Google Scholar]
- Brennen, C.E. Hydrodynamics of Pumps; Concepts ETI, Inc. and Oxford University Press: Oxford, UK, 1994. [Google Scholar]
- Coutier-Delgosha, O.; Dazin, A.; Caignaert, G.; Bois, G. Analysis of Cavitation Instabilities in a Four-Blade Inducer. Int. J. Rotating Mach. 2012, 2012. [Google Scholar] [CrossRef][Green Version]


| Force Component | Error (95% Confidence) |
|---|---|
| ±1.19 N | |
| ±1.49 N | |
| ±1.80 N |
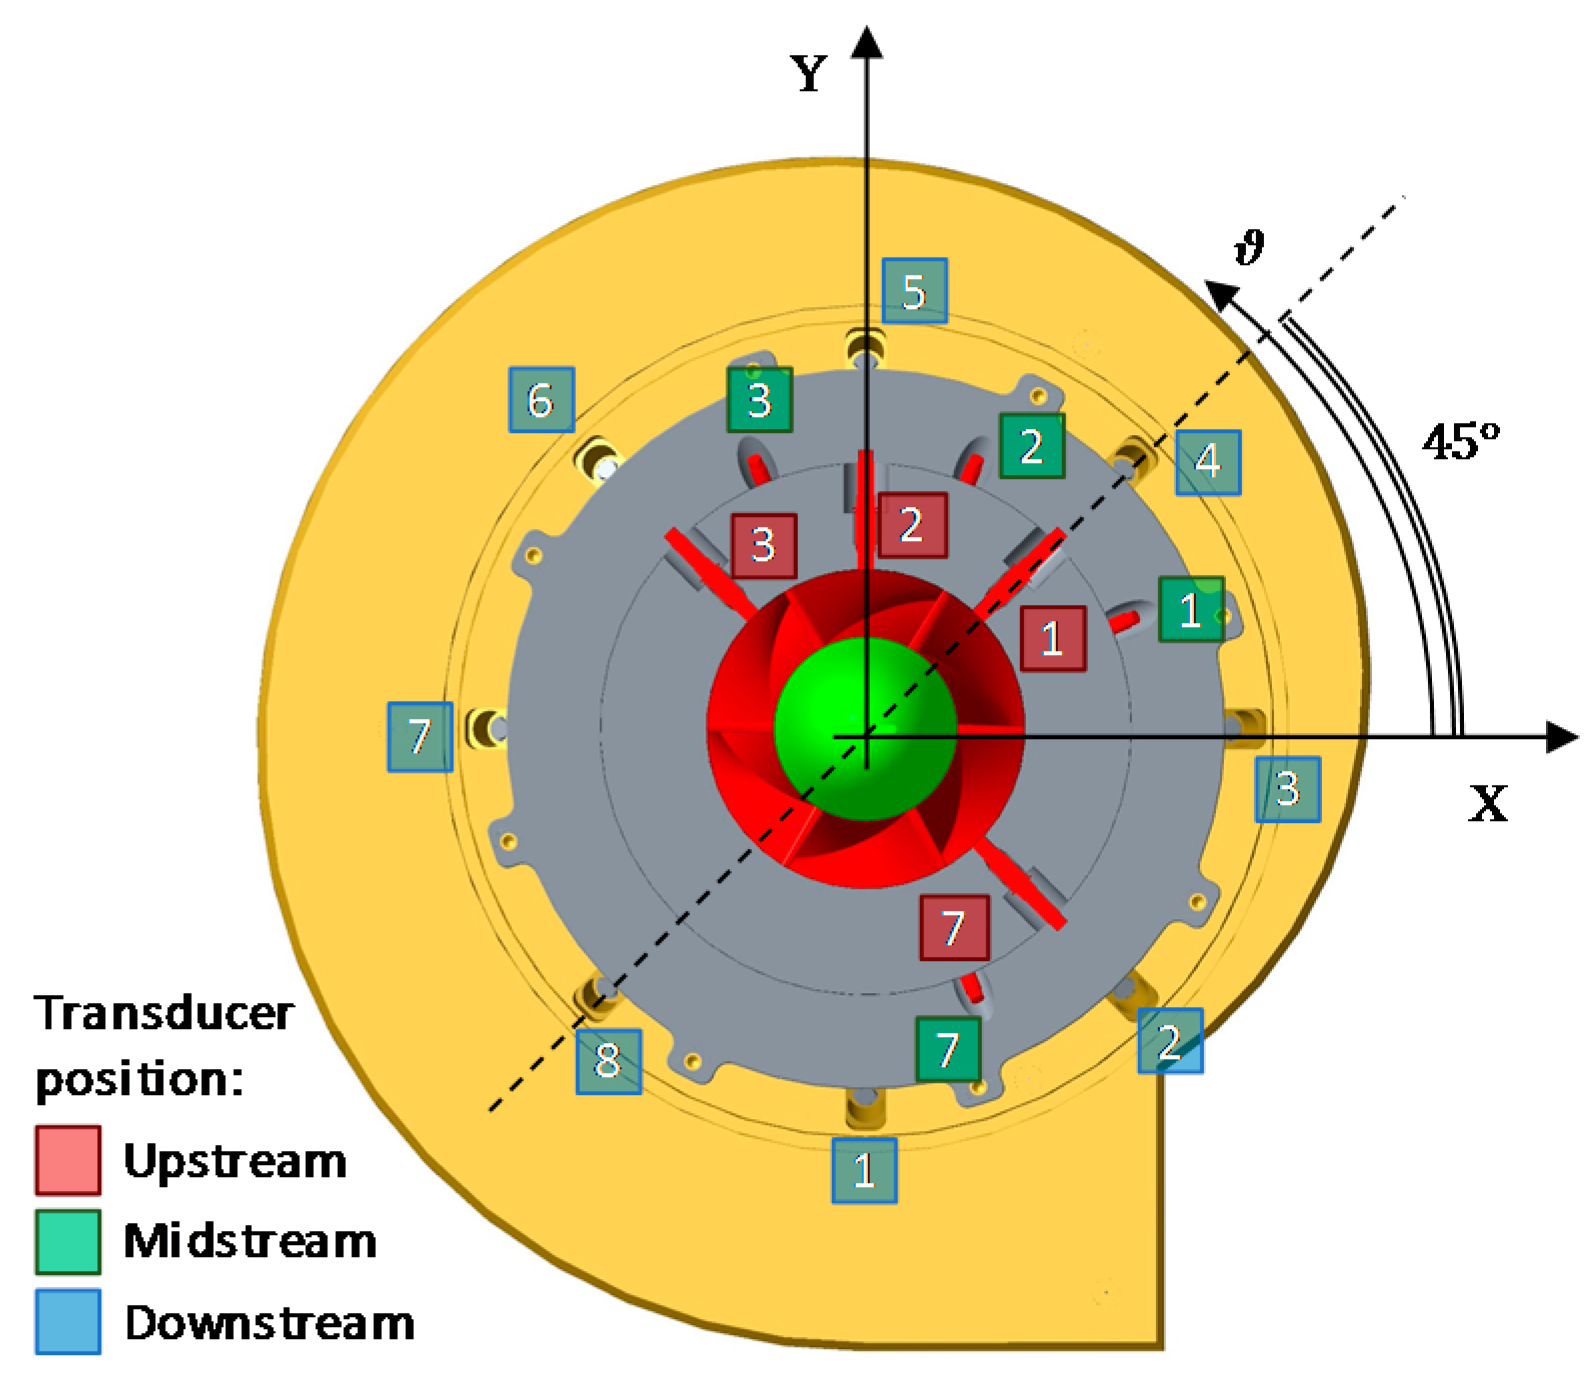
| Position | Tap |
|---|---|
| Upstream | 1, 2, 3, 4 |
| Midstream | 1, 7 |
| Downstream | 1, 2, 3, 7 |
| Parameter | Unit | Symbol | Value |
|---|---|---|---|
| Design flow coefficient @r2 | [--] | 0.120 | |
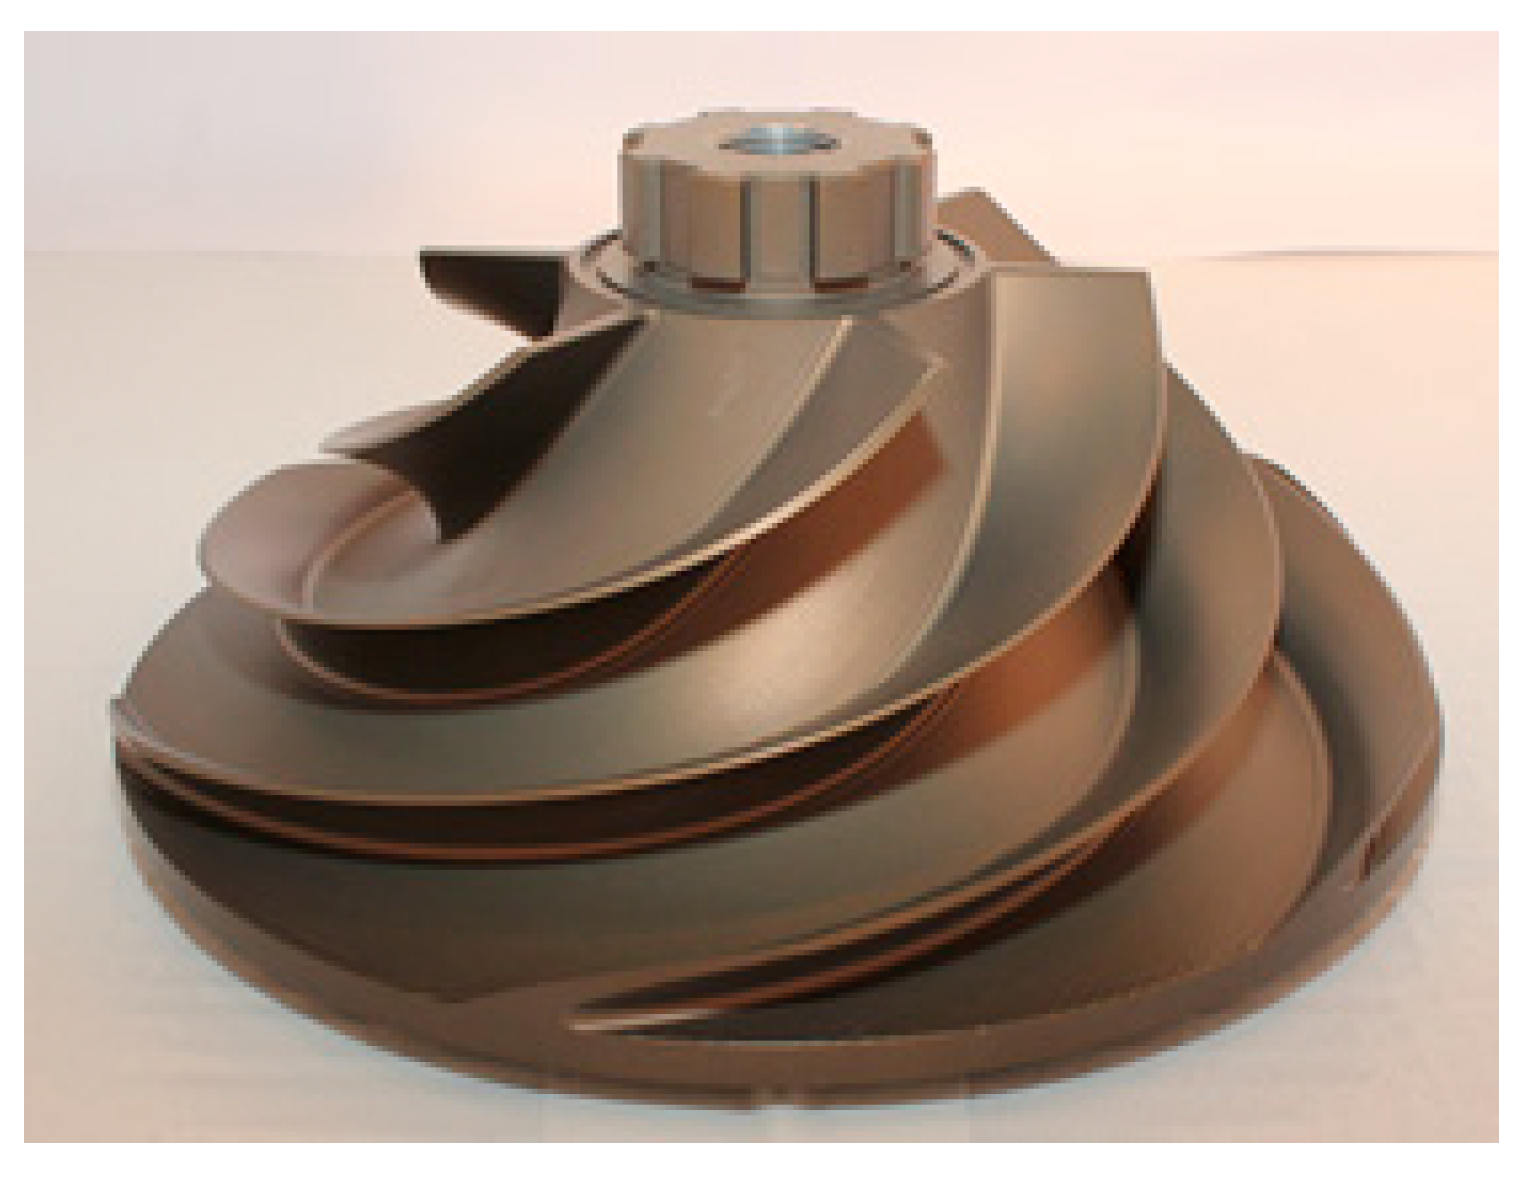
| Number of blades | [--] | 6 | |
| Outlet radius | [mm] | 105.00 | |
| Inlet tip radius | [mm] | 55.50 | |
| Inlet hub radius | [mm] | 31.42 | |
| Axial length | [mm] | 67.00 | |
| Inlet tip blade angle | [deg] | 47.70 | |
| Inlet backsweep angle | [deg] | 0 | |
| Diffuser outlet radius | [mm] | 126 | |
| Design Rotating Speed | [rad/s] | Ω | 157.1 |
| [rpm] | 1500 | ||
| Design volume flowrate | [m3/s] | 0.022 | |
| Mean blade height | [mm] | 18.84 | |
| Tip solidity | [--] | 2.64 | |
| Incidence tip angle @ design | [deg] | 18.90 | |
| Outlet tip blade mean angle | [deg] | 89.94 | |
| Outlet tip backsweep angle | [deg] | 64.00 |
| Total Head Coefficient | |
| Flow Coefficient | |
| Reynolds Number |
| Head Coefficient | |
| Cavitation Number |
| Sampling Frequency | 5000 Hz |
| Temperature | 20 °C |
| Experiment Duration (cont.) | 240 s |
| Sub-Block Duration | 5 s |
| Φ(Φ/ΦD) | Identified Phenomena |
|---|---|
| 0.096 (0.8) | Rotating (1 lobe and 2 lobes); axial |
| 0.108 (0.9) | Rotating (1 lobe and 2 lobes); axial |
| 0.120 (1.0) | Rotating (1 lobe); axial |
| 0.132 (1.1) | Rotating (1 lobe); axial |
| 0.144 (1.2) | Axial |
| ID | Frequency Range f/Ω (f [Hz]) | σ Range | Characteristics | Major Station |
|---|---|---|---|---|
| A1 | 0.1–0.38 (3–11) | 0.16–0.12 | Axial | Up |
| RC1 | 2.57–2.74 (75–80) | 0.2–0.16 | Rotating 1 lobe | Up |
| RC2 | 2.33–2.85 (68–83) | 0.16–0.11 | Rotating 2 lobes | Mid |
| A2 | 3.22–3.81 (94–111) | 0.16–0.10 | Axial | Down |
| RC3 | 3.26–3.46 (95–101) | 0.19–0.14 | Rotating 1 lobe | Mid |
© 2018 by the authors. Licensee MDPI, Basel, Switzerland. This article is an open access article distributed under the terms and conditions of the Creative Commons Attribution (CC BY-NC-ND) license (https://creativecommons.org/licenses/by-nc-nd/4.0/).
Share and Cite
Valentini, D.; Pace, G.; Pasini, A.; Hadavandi, R.; D’Agostino, L. Experimental Characterization of Unsteady Forces Triggered by Cavitation on a Centrifugal Pump. Int. J. Turbomach. Propuls. Power 2018, 3, 13. https://doi.org/10.3390/ijtpp3020013
Valentini D, Pace G, Pasini A, Hadavandi R, D’Agostino L. Experimental Characterization of Unsteady Forces Triggered by Cavitation on a Centrifugal Pump. International Journal of Turbomachinery, Propulsion and Power. 2018; 3(2):13. https://doi.org/10.3390/ijtpp3020013
Chicago/Turabian StyleValentini, Dario, Giovanni Pace, Angelo Pasini, Ruzbeh Hadavandi, and Luca D’Agostino. 2018. "Experimental Characterization of Unsteady Forces Triggered by Cavitation on a Centrifugal Pump" International Journal of Turbomachinery, Propulsion and Power 3, no. 2: 13. https://doi.org/10.3390/ijtpp3020013
APA StyleValentini, D., Pace, G., Pasini, A., Hadavandi, R., & D’Agostino, L. (2018). Experimental Characterization of Unsteady Forces Triggered by Cavitation on a Centrifugal Pump. International Journal of Turbomachinery, Propulsion and Power, 3(2), 13. https://doi.org/10.3390/ijtpp3020013