1. Introduction
Virtual reality (VR) has demonstrated significant potential for enhancing learning outcomes across diverse educational domains [
1]. The immersive nature of VR enables embodied, multimodal learning experiences particularly suited for skill-based domains such as sign language instruction [
2], where learners must simultaneously encode handshape, orientation, movement, location, and facial expressions. Recent systematic reviews confirm that VR-based sign language learning systems produce measurable improvements in learning outcomes and engagement compared to conventional instruction [
3].
Despite these promising developments, a critical gap persists in the literature: while studies document the general effectiveness of VR sign language systems, they have not systematically examined how objective behavioral engagement indicators extracted from learner interactions relate to user engagement. Contemporary VR learning research emphasizes behavioral metrics derived from built-in tracking: head and hand movements, movement entropy, and exploration patterns. These metrics can be used as synchronous indicators of engagement and intrinsic motivation, providing real-time insight into cognitive states [
4]. Indeed, these behavioral indicators are scalable, continuously available from the learning platform, and can support real-time adaptive feedback without additional instrumentation.
The present study addresses this gap by proposing the following research questions: (i) Which specific behavioral indicators, automatically captured during VR interaction, predict learning success in sign language training? and (ii) Do these indicators evolve dynamically throughout the learning process? Addressing these questions is essential for developing adaptive VR learning systems that can provide real-time support based on learner engagement patterns. Specifically, we examined how three indicators of behavioral engagement, namely Visual Attention (VA), Post-Playback Viewing Time (PPVT), and Video Replay Frequency (VRF), correlate with learning performance, and we employed a Generalized Linear Model (GLM) regression to evaluate their combined predictive power. Finally, we analyzed how VA changes over the course of the interaction with the VR sign language application.
Our framework is grounded in established learning science theories: eye-tracking research establishing gaze duration as a proxy for cognitive engagement [
5,
6], cognitive load theory identifying fixation patterns as indicators of information processing [
7], and self-regulated learning theory showing that voluntary content revisits reflect metacognitive strategies [
8,
9]. Specifically, this study examines learner engagement in SONAR (the interested reader can find the application at the following link:
https://sidequestvr.com/app/37864/ (accessed on 26 February 2026)), a VR application developed within the ISENSE project for sign language training. This application places users in the role of a hearing student interacting with a deaf avatar on a simulated university campus during the first day of class. The participants, 117 university students, completed a self-paced Training phase that allowed video replays, followed by a Validation quiz aimed at assessing retention. We then evaluate whether the engagement indicators are associated with learning success by relating them to quiz performance through correlational analyses and regression-based modeling. In addition, we move beyond aggregate measures by examining how visual attention changes over time throughout the interaction, highlighting temporal engagement patterns across the learning and assessment phases.
Our principal findings are threefold: (i) VA and PPVT are strong, statistically significant predictors of learning performance, with VA emerging as the dominant indicator; (ii) VRF shows negligible correlation with performance, suggesting that engagement quality supersedes repetition quantity; (iii) temporal analysis reveals structured engagement patterns with characteristic peaks during training and assessment phases, confirming the task-driven nature of the observed attention patterns. These findings extend recent work on learning analytics into sign language VR contexts [
10]. Practically, these metrics can be automatically computed to enable real-time attention-aware learning analytics, supporting adaptive instructional interventions such as refocusing prompts or targeted content review.
The remainder of this paper is organized as follows.
Section 2 reviews literature on VR for education, VR-based sign language instruction, and engagement measurement in immersive environments.
Section 3 describes the SONAR VR application.
Section 4 formally introduces the engagement framework and research questions.
Section 5 presents the study design and data collection procedures.
Section 6 reports quantitative analyses addressing the research questions.
Section 7 interprets findings in the context of prior work and discusses limitations.
Section 8 summarizes contributions and implications for adaptive VR learning systems.
3. App Description
The SONAR application is a VR platform developed within and supported by the ISENSE project (
https://www.isenseproject.eu/ (accessed on 26 February 2026)), an Erasmus+ funded initiative focused on inclusive higher education for deaf and hard-of-hearing students. The application was designed and implemented by some members of the current authorial team as part of this project. The interested reader can find the application at the following link:
https://sidequestvr.com/app/37864/ (accessed on 26 February 2026). It places users in the role of a hearing student interacting with a deaf avatar on a simulated university campus during the first day of class. The experience is structured into two distinct phases: Training and Validation. Users can interact with the virtual environment using either controllers or hand gestures.
3.1. Overview
The participant finds themselves on their first day of class at university, inside a tiered lecture hall. At the beginning of the experience, they are able to navigate through the classroom and observe the different virtual elements present in the environment, such as the blackboard, classmates interacting with each other, textbooks, and other objects. In one of the seats, Essie, a deaf classmate, can be found, with whom the participant can interact to communicate using sign language.
Upon approaching Essie, the application presents the user with two options: Training and Validation. Once one of these options is selected, whose differences will be explained later, a conversation in sign language is initiated. During this interaction, the participant is shown how to sign several basic phrases that can be used to introduce oneself and establish an initial contact with a classmate. The conversation consists of 12 interactions, each composed of one user contribution followed by a response from the deaf classmate’s avatar. These interactions are listed in
Table 1.
The SONAR application supports six languages: English, Spanish, Italian, German, Austrian, and Polish. Communication is facilitated through two modes: animated avatars that display International Sign Language (for English) or the corresponding national sign languages for the other languages, and prerecorded videos featuring different signed statements. These videos were recorded by professional sign language interpreters in the respective sign languages of each country.
3.2. Training and Validation Phases
As previously described, the experience is structured into two distinct phases: a Training phase, designed to support sign language learning, and a Validation phase, intended to assess the user’s acquired signing skills.
When the Training phase is selected, the conversation takes place directly, guiding the user through the signing of several basic phrases. During this phase, the user is allowed to practice the signs associated with each phrase while observing the natural flow of the dialog. All signed expressions performed by both the sender (hearing participant) and the receiver (deaf avatar) can be replayed multiple times. In this way, learners can repeatedly observe the movements from within a first-person situated interaction with Essie rather than through a flat video.
In the Validation phase, the same conversational sequence used in Training is presented again. However, whenever the user is required to act as the sender, they must choose one out of three possible signing options displayed in the interface. Each option is presented as a short video embedded in the virtual classroom, and the user selects their answer directly in the 3D scene (by pointing the controller or using a simple confirm gesture), maintaining the feeling of interacting with Essie in a shared space rather than clicking on a 2D menu. A scoring mechanism is employed for assessment: a correct selection on the first attempt yields 50 points, 25 points are awarded if the correct option is selected on the second attempt, and 0 points are assigned if both attempts are incorrect.
Methodologically, the Training phase focuses on information encoding through self-regulated interaction, allowing learners to control the pace and focus of their learning. Conversely, the Validation phase is designed for information retrieval and assessment, as it tests the learner’s ability to recognize and reproduce the signs in a contextualized 3D environment.
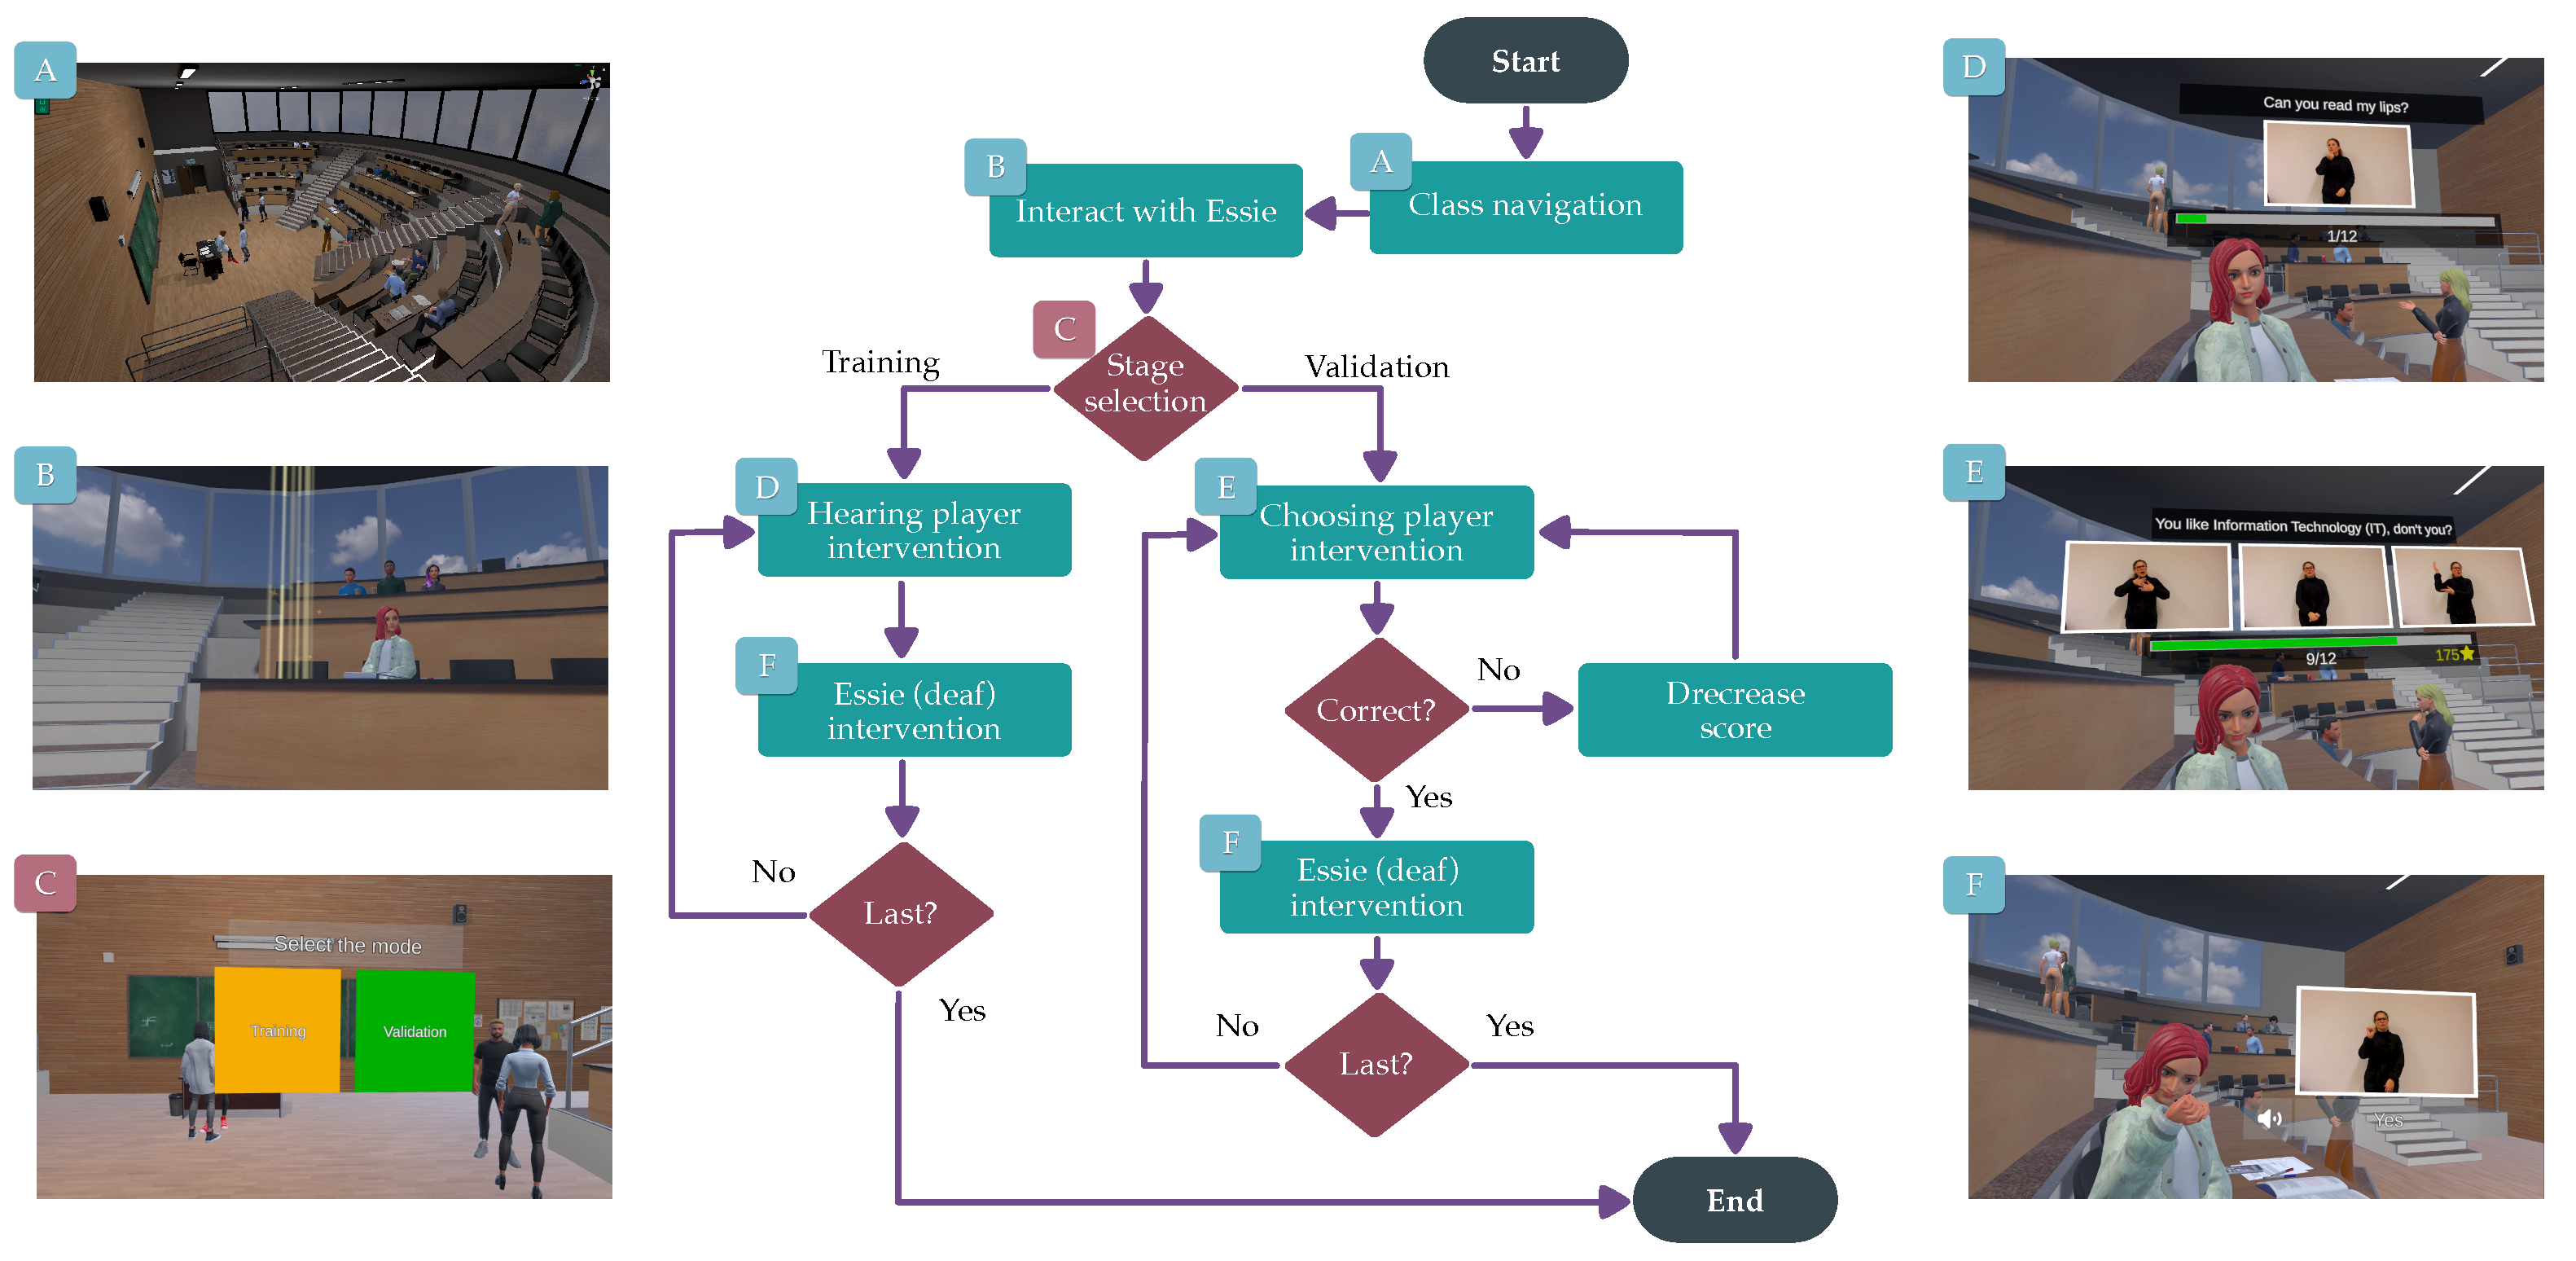
Figure 1 illustrates the flow diagram of the proposed experience, detailing the sequence of interactions and decision points that structure the learner’s progression. The diagram summarizes the main stages of the experience, from initial classroom navigation and interaction with the deaf avatar to the selection between Training and Validation modes. It also highlights the different interaction dynamics, feedback mechanisms, and finish conditions that control each phase, providing an overview of the system logic underlying the sign language learning and assessment process.
3.3. Deployment Setup and Interaction with the Environment
Users can interact with the virtual environment through Meta Quest devices, supporting six degrees of freedom (6DoF) tracking. Locomotion can be performed using the standard handheld controllers, enabling both linear displacement and teleportation-based navigation within the virtual classroom.
To facilitate continuous sign language practice and reduce the need for physical controllers during interaction, a controller-free locomotion mechanism based on hand gestures has also been implemented. In this mode, users can navigate the environment by extending both arms. Additional interactions, such as selection or confirmation, are performed through intuitive hand gestures, including pointing with the index finger and confirming selections by closing the fist. This implementation allows for a complete interaction without interrupting signing activities and preserves the benefits of embodied, spatially situated observation that differentiate the VR experience from conventional 2D video-based materials. The immersive 6DoF setup in SONAR enables learners to slightly change their viewpoint relative to Essie, thereby inspecting handshapes, orientations, and trajectories from different angles while remaining within a coherent 3D classroom scene. The choice to use a VR environment instead of a 2D video interface is consistent with prior work showing that immersive VR via HMDs can outperform less immersive methods in terms of learning outcomes and engagement [
4,
11].
5. Experimental Setting
The study involved 117 university students who attended a VR sign language training session lasting approximately 15–20 min, followed by a validation phase of approximately 10–15 min. Each participant was exposed to the same set of interactions (videos; see
Table 1), which were always presented in a fixed order. The sample comprised participants with varying levels of prior VR exposure: 56.1% had no previous experience with VR environments, while the remaining 43.9% reported few prior VR interactions. Regarding sign language knowledge, 86% of participants had no prior experience with sign language.
As described in
Section 3.3, the application provides two different types of interaction: handled and controller-free. In the present study, all participants used the controller-free hand-tracking modality exclusively. This methodological choice was made to maximize immersion for the sign language learning environment, where continuous hand availability is essential for learners to practice signs while observing instructional videos. The controller-free modality also eliminates potential confounds from controller manipulation during behavioral data collection, ensuring that head orientation tracking for Visual Attention measurement and interaction timestamps for PPVT and VRF calculation reflect genuine learning behaviors rather than device-handling actions.
Each student completed two consecutive phases. In the Training phase, participants freely watched the 12 videos one by one, with the possibility to replay each video (once it had finished) as many times as desired. In the subsequent Validation phase, they answered a quiz in which each item required selecting the video that matched a target signed phrase previously seen in the Training phase. Each quiz item in the Validation phase was associated with exactly one video from the Training phase, as described in
Section 3. A Training–Validation session comprising 12 items was implemented because this number allowed the complete protocol to be conducted within approximately 30 min, while maintaining an adequate number of observations per participant. Increasing the number of items would have extended the session duration and potentially introduced fatigue effects that could have confounded the performance measures.
User interaction information were collected throughout the Training and Validation phases. Specifically, VA is calculated in both Training and Validation phases, while VRF and PPVT are only related to the Training Phase. For RQ1, we first examined the distribution of quiz scores and then computed Pearson correlations between the three behavioral engagement variables (i.e., VA, VRF, PPVT) and the performance variable defined as the number of correct answers obtained in the Validation quiz (
Section 6.1.1). We then complemented this analysis with a regression study in which the proportion of correct answers was modeled as a function of VA, PPVT, and VRF in order to assess their joint and unique contributions to learning performance (
Section 6.1.2). In relation to RQ2, the same time-stamped interaction logs were used to characterise the general evolution of learners’ attention and engagement during video viewing, by analysing the temporal patterns of VA, across the Training and Validation phase and within individual videos (
Section 6.2).
It is important to note that this study employs a purely correlational design without control conditions. All sessions were conducted under standardized conditions in controlled laboratory settings, using the Meta Quest default parameters; instructions and task structures were kept constant across participants, ensuring consistent exposure to the training materials and interaction procedures. This design allows us to identify predictive relationships but does not permit causal inferences regarding the effects of engagement on learning performance. Experimental validation through controlled designs would be necessary to establish causality.
6. Results
In this section we show all the results associated to RQ1 and RQ2. Specifically, in
Section 6.1, we investigate which of the three behavioral indicators is the most informative for predicting the users’ learning performance. In
Section 6.2, we discuss the dynamic of VA during the Training and Validation phases, highlighting the peaks and the trend of the curve.
6.1. RQ1: How Are Behavioral Indicators of Engagement Related to Learning Performance in an Immersive Sign Language Scenario?
This subsection presents quantitative analyses of user interaction data recorded during the VR sign language session, focusing on the association between engagement metrics and overall performance. In
Section 6.1.1 we perform a correlation analysis between behavioral indicators and performance, while in
Section 6.1.2 we use a binomial GLM to predict the number of correct answers using the three behavioral indicators as features.
6.1.1. Correlation Between Engagement and Performance
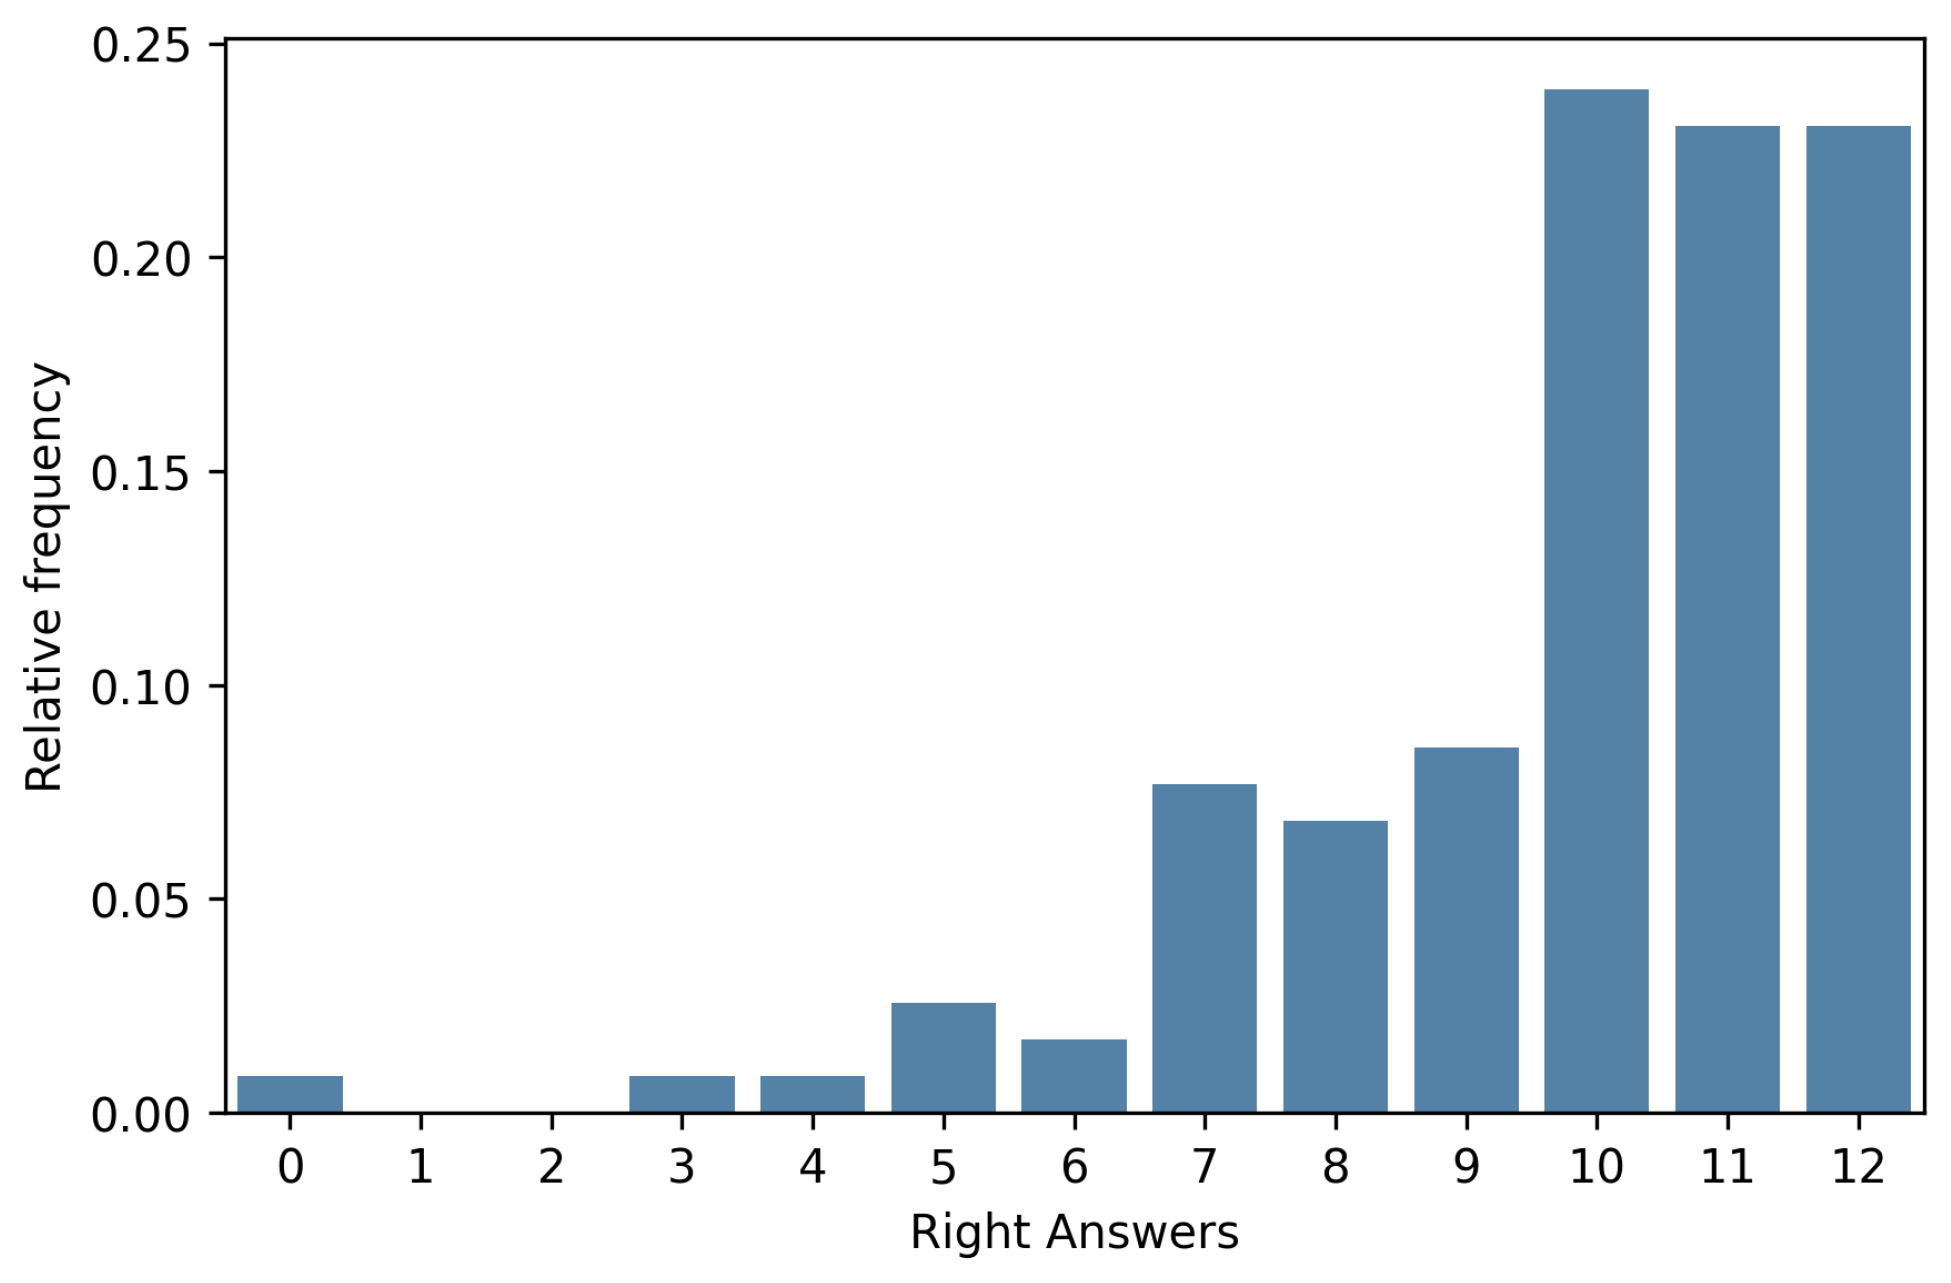
In
Figure 2 we show the distribution of correct answers in the Validation phase. The distribution is shifted toward higher scores, with a mean of
and standard deviation of
. This indicates that most participants successfully answered the majority of quiz items.
To investigate the relationship between behavioral engagement and learning outcomes, we computed Pearson correlation coefficients between the three engagement metrics defined in
Section 4 and quiz performance.
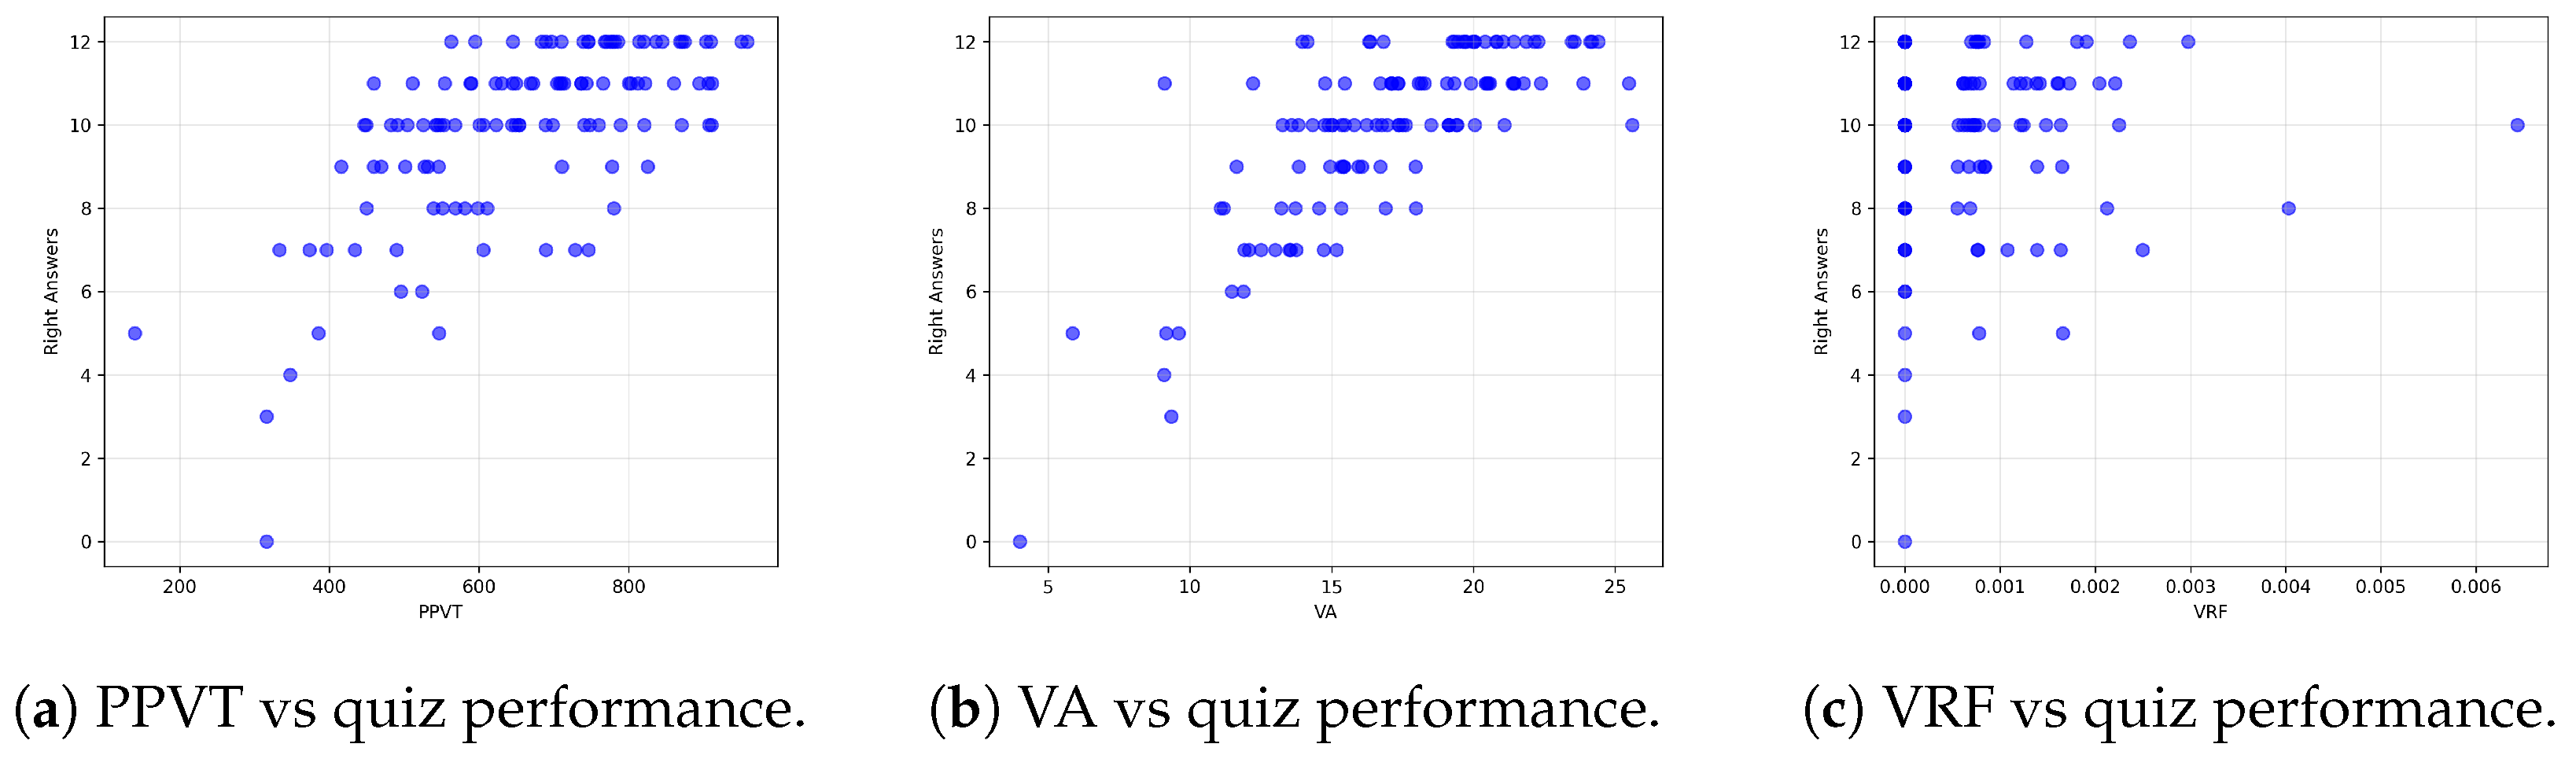
PPVT exhibited a strong positive correlation with performance (
,
), as illustrated in
Figure 3a. Participants who maintained videos visible on the screen for extended durations after playback ended, ostensibly engaging in reflection or mental rehearsal, achieved notably better learning outcomes.
VA showed the strongest correlation with quiz performance (
,
), as shown in
Figure 3b. This metric, operationalized as the proportion of time the user’s gaze was oriented toward the video screen, reflects sustained attention directed toward instructional content. The strong positive relationship indicates that participants who maintained consistent visual focus on the signing model achieved substantially higher quiz scores.
In contrast, VRF displayed a negligible and non-significant correlation with performance (
,
), as shown in
Figure 3c. This finding indicates that the raw number of times participants replayed videos does not meaningfully predict learning success. The lack of correlation suggests that engagement quality matters substantially more than the sheer quantity of repetitions.
6.1.2. Regression Analysis of Behavioral Engagement and Performance
To examine the joint contribution of behavioral engagement metrics to learning performance, we modeled quiz performance as a function of the three engagement indicators. At the participant level, performance was expressed as the proportion of correct answers in the Validation phase. We fitted a binomial GLM with logit link function, using standardized versions of Visual Attention (
), Post-Playback Viewing Time (
), and Video Replay Frequency (
) as predictors:
Table 2 presents the estimated coefficients on the log-odds scale, their standard errors, z-statistics, significance levels, and corresponding Odds Ratios.
and
emerge as positive and highly significant predictors of performance.
shows a near-zero and non-significant coefficient, indicating negligible additional predictive value once the other metrics are included. The model achieves a Cox-Snell pseudo-
of 0.8309, indicating that these engagement metrics jointly explain a substantial proportion of variance in learning outcomes. It is worth noting that this substantial predictive power is partly attributable to the specific distribution of the performance data (
Figure 2). Since the majority of participants achieved high scores (mean = 9.846), the dataset presents a ‘ceiling effect’ where instances of low performance are distinct exceptions. The GLM effectively leverages the engagement metrics (
and
) to discriminate these specific cases of lower performance from the high-performing majority, resulting in high model fit indices typical of datasets with this type of skewness. For this reason, the pseudo-
value should not be interpreted as evidence of near-complete explanatory power in a general learning context, but rather as an indication that, within this restricted and skewed performance range, the selected behavioral indicators separate high- and low-performing learners relatively well.
The positive coefficients for and indicate that, holding other variables constant, participants exhibiting higher VA and longer PPVT achieve better quiz performance. Since the predictors are standardized, a one-unit increase corresponds to a one standard deviation increase in the respective engagement metric. Interpreted as Odds Ratios, a one standard deviation increase in multiplies the odds of correctly answering a quiz item by approximately 2.13, while a one standard deviation increase in multiplies the odds by approximately 1.54. These effect sizes demonstrate that both sustained visual focus on the signing model and additional processing time after playback are strongly associated with successful recognition and comprehension of signed phrases.
Conversely, the coefficient for is near zero and not statistically significant (). Its Odds Ratio is approximately 0.97, representing essentially no change. This result indicates that, once VA and PPVT are accounted for, the VRF provides no meaningful additional predictive information. The qualitative aspects of engagement appear far more informative for predicting learning outcomes than the quantity of repetitions alone.
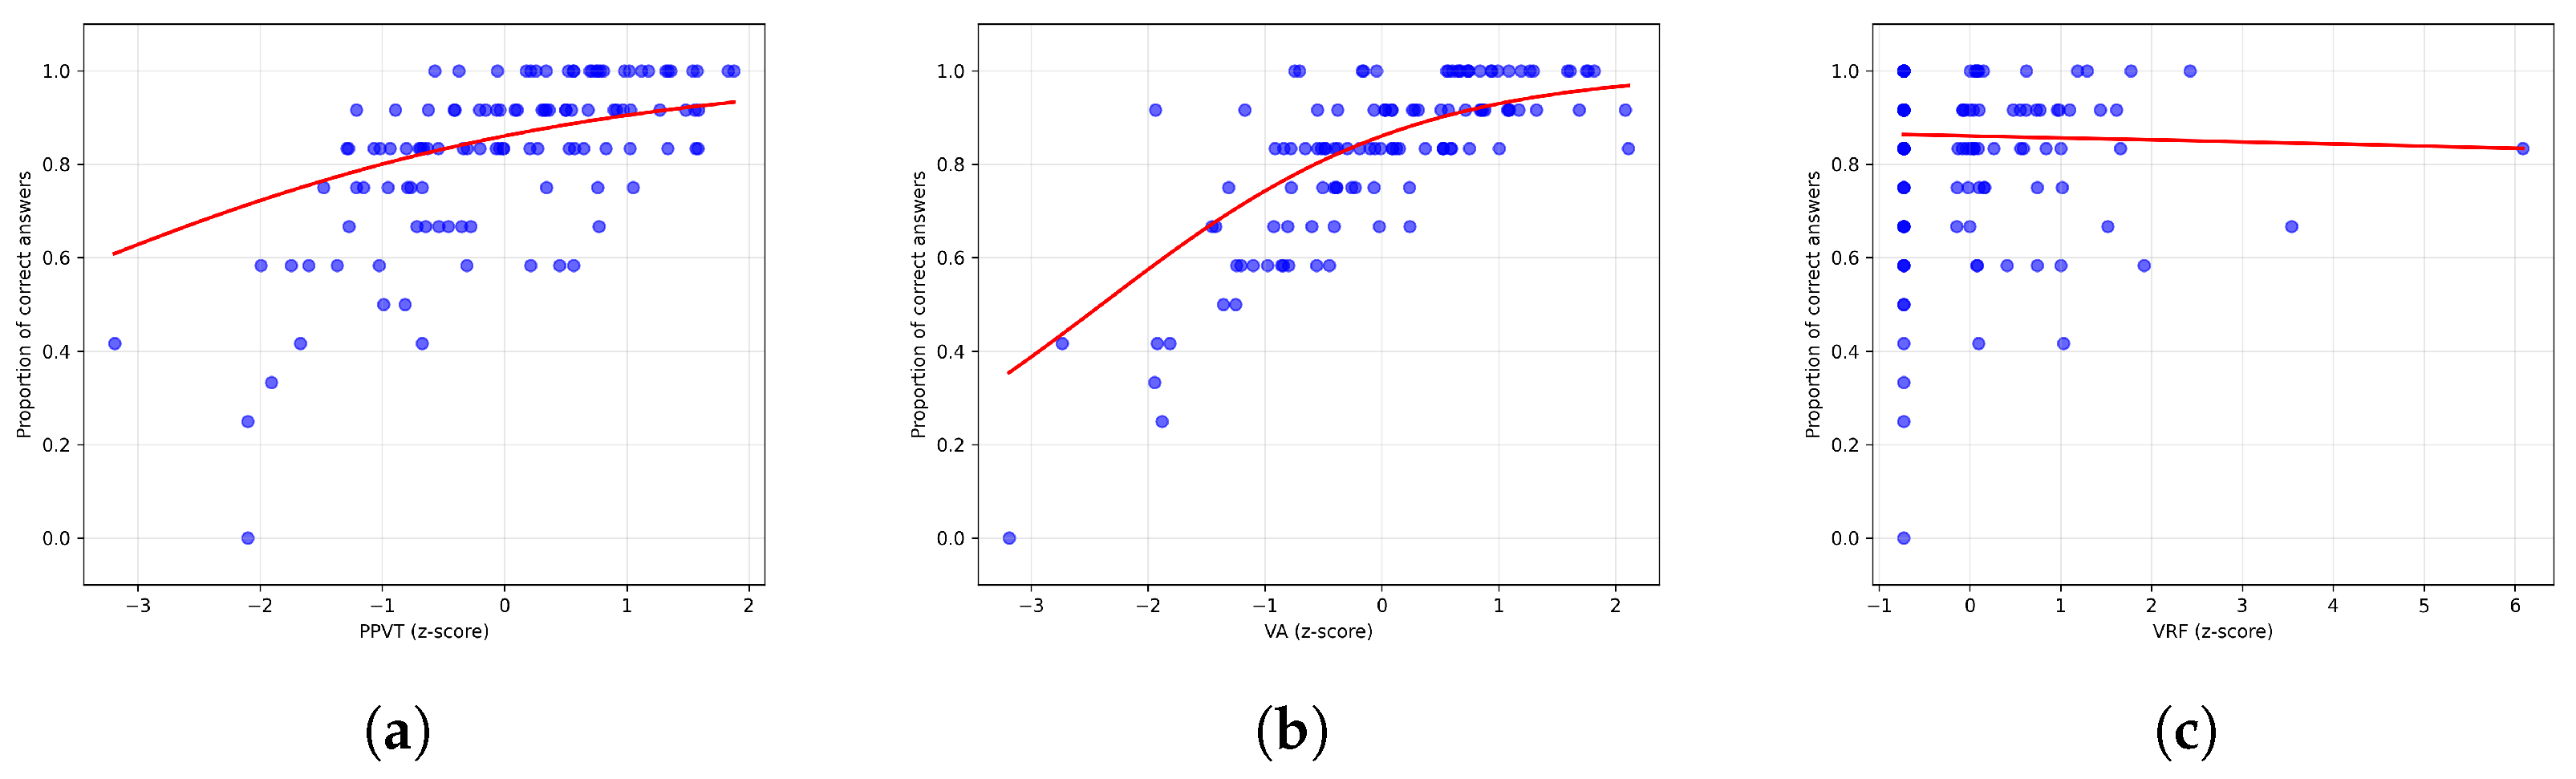
Figure 4 displays the GLM predictions for the proportion of correct answers as a function of each standardized engagement metric. In all three panels, blue dots represent observed participant quiz scores, while the red curve shows the model-predicted probability of a correct response when varying one predictor while holding the others at their mean values.
Across the plots,
and
show clearly increasing regression curves, visually confirming that longer PPVT and higher VA are associated with higher predicted performance. The nearly flat curve for
confirms that changes in VRF have a negligible impact on predicted performance, consistent with its non-significant coefficient in
Table 2.
6.2. RQ2: What Do These Behavioral Metrics Suggest About Learners’ Engagement Processes?
Given the findings from RQ1, we focus exclusively on VA as the primary indicator for characterizing engagement processes throughout the training activity. This choice is justified by both empirical and theoretical considerations. In RQ1, VRF showed negligible correlation with learning performance and contributed no significant predictive value in the regression model. PPVT, while correlated with performance, represents a static summary measure aggregated across the entire training session and lacks temporal resolution. In contrast, VA can be measured and sampled at fine temporal scales, providing moment-to-moment information about how learners allocate their visual focus during both Training and Validation activities.
The decision to use VA as a time-varying indicator of engagement aligns with established research on gaze-based measures in learning environments. Eye-tracking research has consistently demonstrated that gaze direction and fixation patterns serve as direct, real-time indicators of where learners direct their attention and, by extension, where they focus their cognitive resources [
5,
6]. In immersive learning environments, these gaze-based metrics have been operationalized as temporal indicators of engagement precisely because they can be sampled continuously throughout the learning process, allowing researchers to characterize how engagement unfolds and changes across time [
6]. Advanced analytical frameworks have developed temporal profiles of VA, aggregating moment-by-moment gaze data across learners to derive general engagement patterns that reveal when engagement peaks or declines during learning activities [
5].
Consequently, in our analysis of RQ2, we use VA as the primary temporal indicator of engagement. Rather than treating engagement as a single static aggregate, we analyze how VA evolves across the sequence of Training and Validation videos, identifying temporal patterns and dynamics that characterize learners’ engagement processes during sign language VR training. This process-oriented perspective complements the outcome-oriented analysis from RQ1, revealing not only whether engagement predicts performance, but also how engagement unfolds dynamically as learners interact with the instructional material.
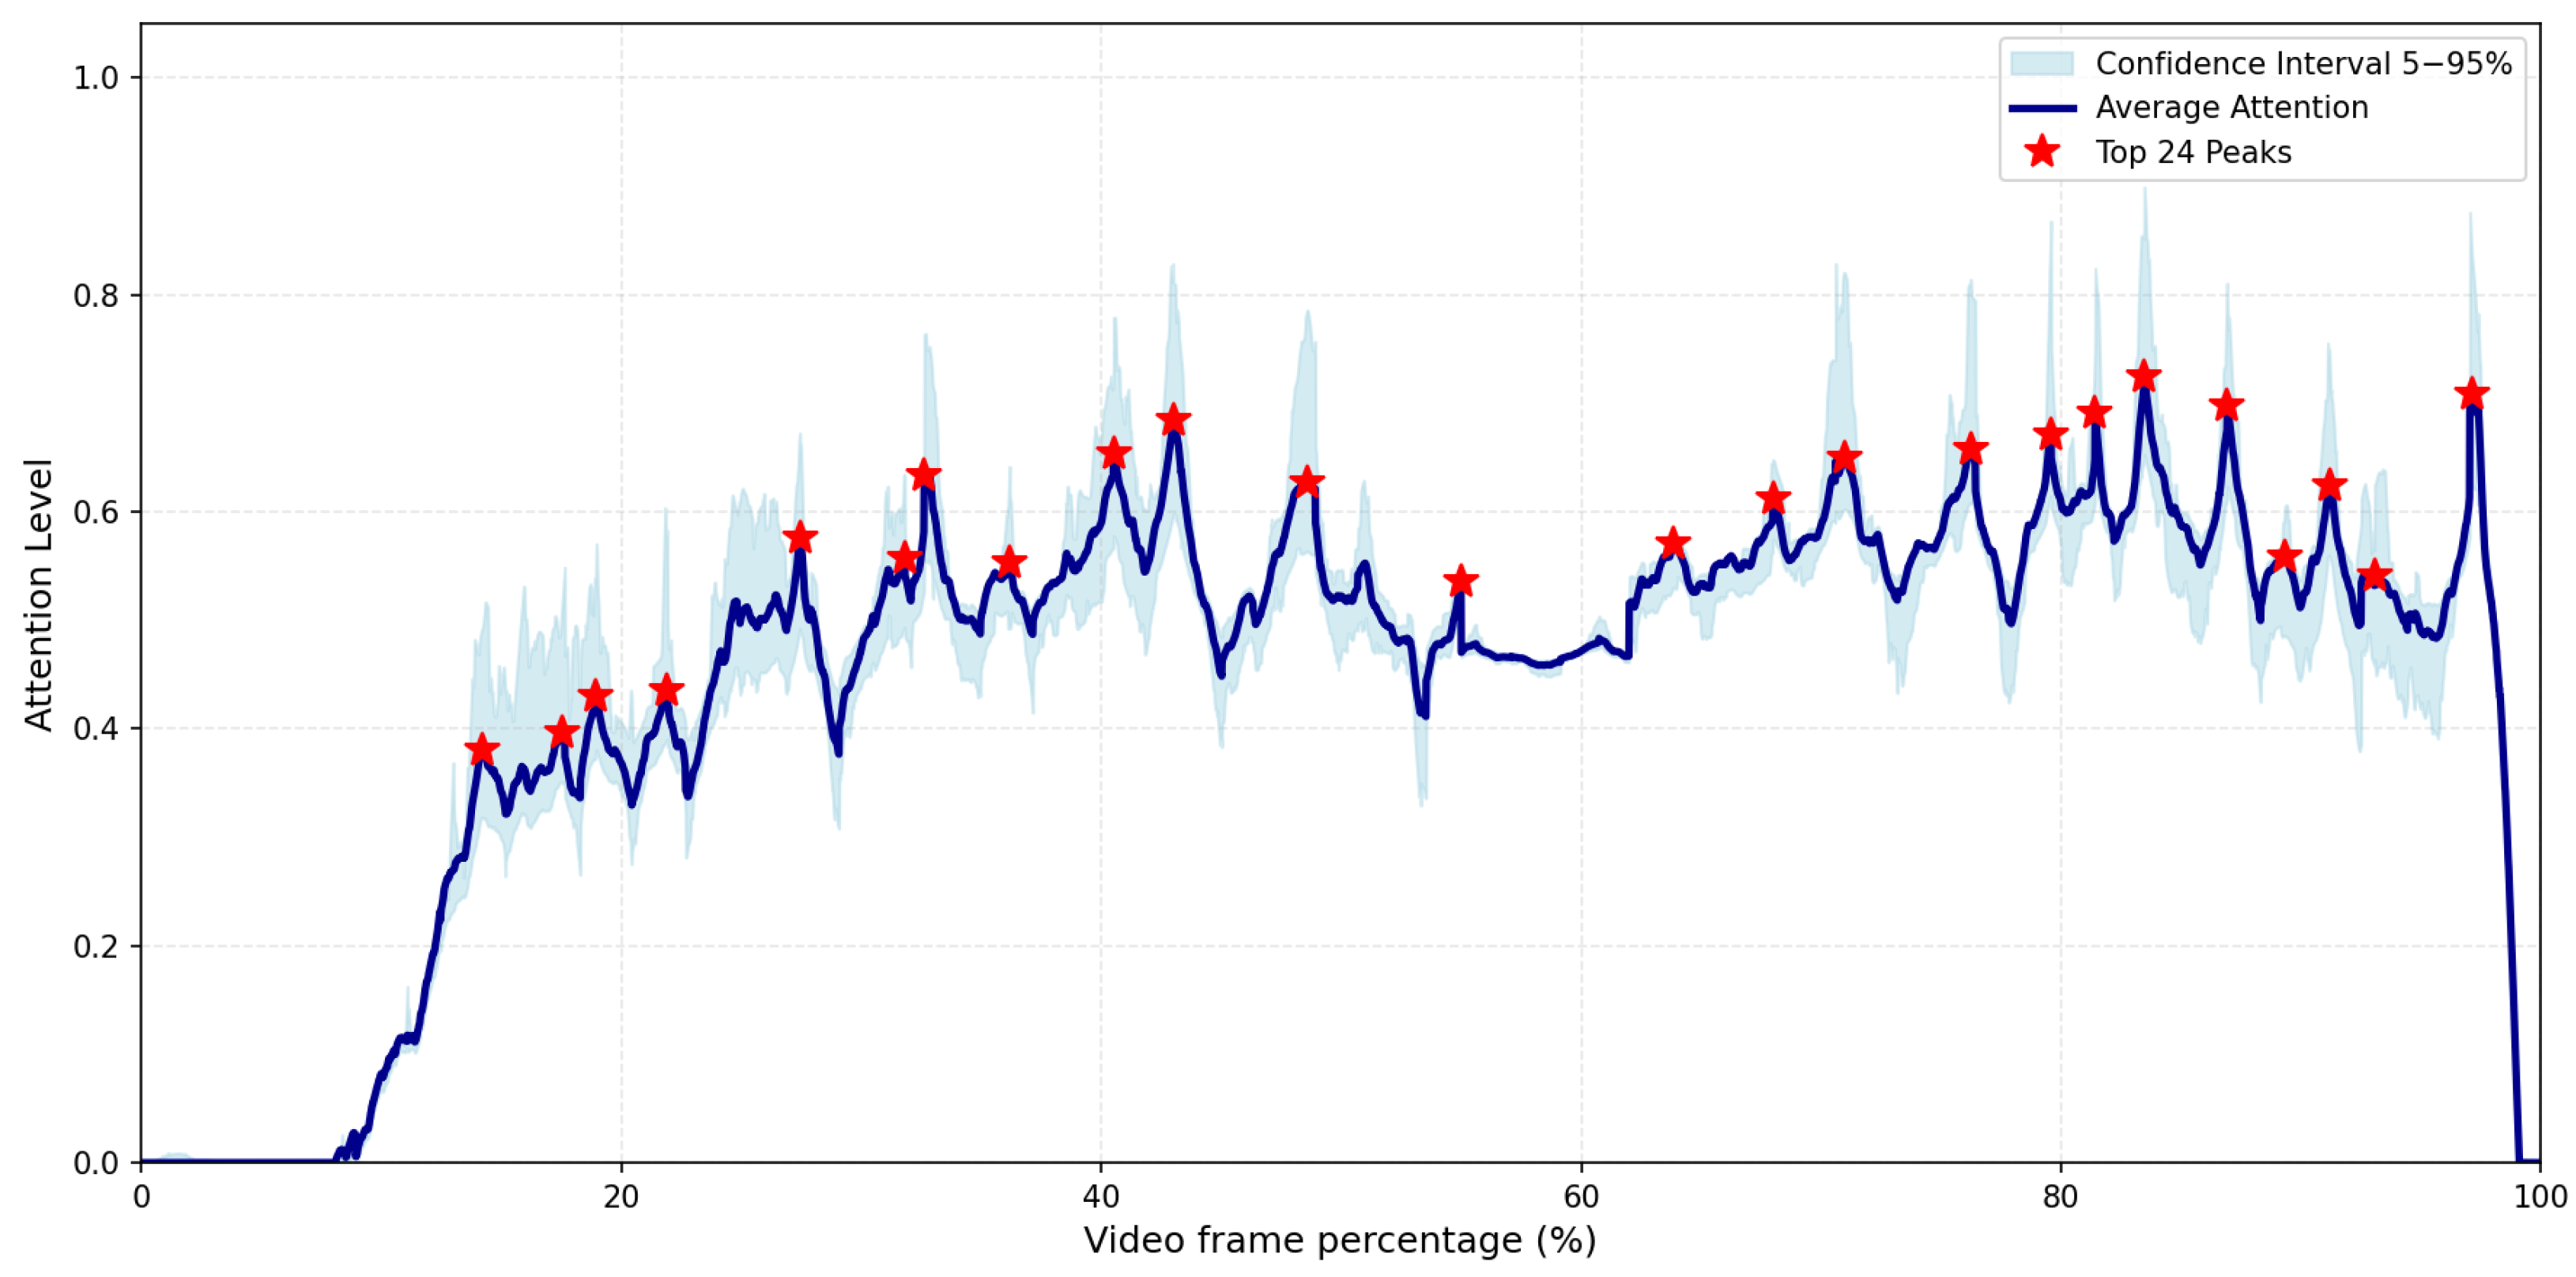
Figure 5 presents the aggregated temporal profile of VA across all 117 participants throughout their complete interaction with the VR application. The profile reveals distinct patterns of engagement that correspond to the different phases and cognitive demands of the learning experience.
During the initial portion of the profile (0 to approximately 15 percent), VA increases gradually as learners begin their interaction with the application. This slow ramp-up reflects a characteristic pattern in immersive learning environments where participants require time to acclimate to the virtual environment and transition their attentional resources from environmental exploration to focused engagement with instructional content. Research on immersive learning has documented that learners initially allocate attention to environmental exploration and familiarization with interface elements before settling into focused engagement with the learning material [
50].
Following this initial phase, the profile shows 12 distinct peaks, each corresponding to one of the 12 training videos presented during the instructional phase. These peaks represent moments of heightened VA during the presentation of signing demonstrations, indicating that learners direct concentrated visual focus toward specific moments within each video. The emergence of distinct peaks suggests that different moments within each training video elicit varying levels of visual attention. In multimedia learning, learners modulate their attentional allocation based on perceived salience and task relevance of different content segments [
5,
37]. In sign language learning, these peaks likely correspond to moments when manual articulation, handshape transitions, or facial expressions are most prominent or when linguistic information is densest.
Between consecutive peaks, VA shows noticeable declines before recovering toward the next peak. This oscillating pattern within the training phase reflects characteristic attention dynamics in which learners maintain high focus during moments of high informational density, then experience transient reductions in visual attention in the intervals following these moments. One interpretation is that after observing key articulatory or linguistic information, learners engage in internal processing, reflection, or mental rehearsal rather than maintaining continuous visual focus on the signing model. This pattern is consistent with cognitive science research on attention and working memory, which demonstrates that learners benefit from periods of distributed attention that allow for encoding and consolidation of perceived information [
37]. The declines may also reflect natural variations in motor behavior and saliency across the content, where moments of lower visual prominence naturally redirect learner attention.
A marked transition occurs at approximately 55 to 63 percent of the profile, where VA drops to a lower, more stable baseline. This plateau corresponds to the transition from the training phase to the Validation phase. Following the plateau, the profile exhibits a second set of 12 peaks, each corresponding to one of the 12 quiz items in the Validation phase. These peaks appear as learners are presented with recognition and decision-making tasks, indicating moments when quiz items capture their visual attention. The appearance of these validation peaks indicates that learners return to the task with increased visual focus during assessment activities. These validation peaks indicate sustained engaged visual processing during the recognition and selection tasks required by the quiz.
Immediately following the completion of the validation phase (near 100 percent of the profile), VA shows a sharp, dramatic collapse. This precipitous decline reflects the moment at which learners exit the interactive application and conclude their engagement with the system. The sharp drop indicates that the elevated VA observed throughout both phases is task-driven and stimulus-dependent, contingent on the presence of active instructional or assessment activities.
The temporal structure of VA revealed in this aggregated profile illuminates how learners allocate visual attention across different types of cognitive engagement in sign language learning. The distinct peaks corresponding to training videos reflect intensive visual perception when learners extract motor and linguistic information from signing demonstrations. The presence of peaks during validation, suggests that learners maintain engaged visual processing when retrieving and recognizing previously observed signs. The intervening periods of lower VA may represent cognitive processing windows during which learners consolidate perceived information or mentally rehearse observed signs.
7. Discussion
This study provides empirical evidence regarding the role of behavioral engagement indicators in predicting learning performance in VR-based sign language training, addressing a significant gap in the literature. From the analysis of the users’ interaction, we extracted insights about the three behavioral indicators. From a correlational perspective, VA emerges as the most correlated variable with respect to validation quiz performance (
,
), a result aligned with established literature on eye-tracking and cognitive load theory [
37]. Indeed, in the context of sign language, maintaining stable visual attention on the model is essential for accurately perceiving manual articulation, facial expressions, and body movements that jointly convey linguistic information [
5,
6]. Our results extend these established theoretical principles to the specific domain of VR-based sign language education, a context previously lacking empirical investigation.
PPVT emerges as the second most correlated variable (
,
), suggesting that the time spent observing the video after playback completion may serve as an operational proxy for post-presentation cognitive processes critical for consolidating motor representations [
47]. During this temporal window, learners likely engage in internal simulation, perceptual review of observed signs, and reflection on how learned elements relate to prior knowledge. This result is consistent with hypotheses derived from motor learning research, which has demonstrated that extended observation of movement demonstrations, particularly after the movement concludes, facilitates internal simulation and consolidation of motor representations [
38]. However, our study did not directly measure internal simulation processes; the observed correlation between PPVT and performance suggests a relationship that may involve such mechanisms, but alternative explanations (e.g., simple memory rehearsal, comparative analysis between signs, or individual differences in processing speed) cannot be excluded based on our data alone. In terms of cognitive load theory, post-playback time may represent a window in which learners deliberately reduce extraneous cognitive load (visual distraction from motion) while maintaining germane cognitive processing (internal review of learned material), although the specific cognitive mechanisms underlying this behavioral pattern warrant further investigation through complementary methods such as concurrent verbalization or neuroimaging.
Notably, VRF (
,
) shows negligible and non-significant correlation with performance, in contrast with some of the related literature [
9]. In reality, this reflects a fundamental principle of motor learning research: the quality of deliberate practice outweighs the amount of exposure [
37]. This result is conceptually interesting and invites reconsideration of simple models of self-regulated learning that equate replay frequency with engagement level or metacognitive sophistication. In the context of visually mediated motor acquisition tasks such as sign language, attentional quality during initial viewing appears to outweigh the quantity of subsequent repetitions. An alternative interpretation is that replay may sometimes represent a compensatory strategy employed by learners who failed to maintain focused visual attention during initial viewing; in this case, low replay would indicate effective initial perception rather than inferior engagement. This hypothesis merits empirical investigation in future studies employing experimental designs that deliberately manipulate replay opportunities.
The binomial GLM indicates that both standardized VA and PPVT are significant predictors of quiz performance (regression coefficients, odds ratios). Increases in VA are associated with a higher likelihood of correct responses (odds ratio), while PPVT also shows a positive, though more moderate, contribution (odds ratio). In contrast, VRF does not exhibit a meaningful effect on performance (p-value, odds ratio), suggesting a negligible association with quiz outcomes. The model demonstrates strong explanatory power (Cox-Snell pseudo-), which can be partially attributed to the distribution of the performance data: most participants achieved very high scores, resulting in a ceiling effect in which lower performance levels occur only infrequently.
The analysis of the distribution of the VA over time revealed distinct peaks corresponding to training videos and additional peaks during validation, interspersed with periods of reduced attention. This temporal dynamic provides empirical evidence that engagement is not a static global state but rather a dynamic process evolving in response to specific task demands and environmental stimuli [
5]. The observed attention dips between peaks may operationally index post-presentation cognitive processing windows during which learners consolidate perceived information, mentally rehearse observed sign sequences, or prepare for the subsequent segment, though alternative explanations such as natural fatigue or task-switching costs cannot be ruled out based on behavioral data alone. This alignment between our empirical observations and established principles of cognitive science strengthens the validity of our temporal analysis framework and supports interpretation of observed patterns as authentic reflections of learning processes rather than measurement artifacts.
These results validate and extend existing research frameworks on learning analytics and engagement measurement through automatically-derived behavioral indicators extracted from interaction traces [
33,
34]. They confirm that in the specific educational domain of VR-based sign language learning, automatically-derived behavioral indicators provide reliable and predictively significant signals of learning performance. The null finding for VRF adds an important cautionary note to simplistic self-regulated learning models.
Practically, these results suggest concrete pathways toward attention-aware learning analytics systems in immersive sign language educational applications. VA and PPVT signals could be computed in real time within educational VR applications, enabling adaptive feedback and targeted instructional interventions. However, implementation of such adaptive systems requires rigorous experimental validation before large-scale deployment, as overly intrusive feedback could produce counterintuitive effects.
Despite these interesting implications, the study presents some limitations. The sample comprises 117 European university students without significant prior sign language experience; results may differ substantially in more diverse populations including children, older adults, individuals with cognitive disabilities, or those with prior sign language knowledge. The learning material was restricted to 12 basic phrases within a coherent narrative context; tasks of greater scope, higher grammatical complexity, larger sign sets, or decontextualized content could alter engagement dynamics or learning performance substantially. Additionally, while our behavioral indicators serve as operational proxies for underlying cognitive processes, they do not provide direct access to learners’ internal mental states. Future work incorporating complementary measures such as think-aloud protocols or physiological indicators could triangulate these findings and provide richer insights into the cognitive mechanisms underlying the observed behavioral patterns.
Moreover this work is a correlational study, indeed, while our regression model demonstrates robust covariation between VA, PPVT, and performance, we cannot determine whether high VA or extended PPVT directly cause improved learning outcomes, or whether both are consequences of other learner characteristics such as motivation or prior VR knowledge. Future experimental studies that systematically manipulate engagement indicators would be necessary to establish causal relationships and test whether interventions targeting these behavioral indicators can effectively enhance learning outcomes.
Finally, the study focuses solely on immediate learning within a single session; it is still unclear whether the engagement effects observed persist over longer periods, or how well brief engagement patterns predict performance in longer-term learning protocols.
8. Conclusions and Future Works
This paper shows that objective behavioral traces collected in a VR sign language learning application can predict learning outcomes and reveal time-varying engagement dynamics, with VA and PPVT emerging as the most informative indicators and VRF providing limited predictive value in this setting. In addition, aggregated VA profiles highlight structured engagement patterns across training and validation, reinforcing the value of temporal process analysis alongside outcome prediction.
These findings support a practical path toward attention-aware learning analytics in immersive sign language education, where engagement signals can be used not only for post-hoc evaluation but also for designing adaptive support. A promising direction is to move from prediction to causally grounded design by validating whether real-time, attention-contingent feedback and targeted review policies measurably improve learning efficiency and retention.
In the future, we plan to extend our dataset; indeed, the participants were university students who generally performed well. Future studies involving more heterogeneous populations or more challenging tasks might yield more moderate goodness-of-fit values as the variance in performance increases. Other future work should incorporate richer temporal and sequence-based modeling of interactions (beyond counts) and assess generalization across different languages, sign sets, and longer-term learning protocols.




 ,
,