Article

Assessing the Physical Stability of Soil Organic Carbon in Roadside Ecosystems

by
Nour Srour
1,
Evelyne Thiffault
1,* and
Jean-François Boucher
2
1
Research Center on Renewable Materials, Department of Wood and Forest Sciences, Université Laval, Quebec City, QC G1V 0A6, Canada
2
Centre for Forest Research, Department of Fundamental Sciences, Université du Québec à Chicoutimi, Chicoutimi, QC G7H 2B1, Canada
*
Author to whom correspondence should be addressed.
Urban Sci. 2025, 9(4), 90; https://doi.org/10.3390/urbansci9040090
Submission received: 13 January 2025 / Revised: 10 March 2025 / Accepted: 18 March 2025 / Published: 21 March 2025

Abstract

Understanding the factors controlling the stability of soil organic carbon stocks, notably in urban areas such as roadsides, can contribute to a better quantification of the ecosystem services that these areas can provide, a key to improving urban planning and management. This study assessed soil carbon stability based on physical fractions in roadside ecosystems of southern Quebec, Canada. We measured the carbon content of soil mineral-associated (MAOC) and particulate (POC) organic carbon physical fractions of roadsides with different land uses and investigated relationships with road density, soil concentration of heavy metals, and soil salinity. We used the MAOC/POC ratio to evaluate the carbon storage potential of each physical fraction. The stable physical fraction MAOC contained a higher carbon content than the labile soil fraction POC across different depths. The MAOC/POC ratio was higher for sites with a more recent history of agriculture abandonment. MAOC was positively linked to road density, soil salinity, and heavy metal concentration. This study suggested that roadside soils have a high capacity to store carbon in a stable form. Additionally, the chemical properties of roadside soils did not adversely affect the physical stability of soil carbon, especially in the top mineral soil.

1. Introduction

Soil organic carbon represents the most significant terrestrial carbon pool, with 1700 gigatonnes (Gt) of carbon globally [1]. While soils of natural forest ecosystems contain high amounts of carbon, more disturbed areas, such as those found in urban environments, can also have substantial soil carbon stocks [2].
Roadsides are located alongside transportation roads and can extend into the surrounding areas. Roadsides are a type of informal green space [3] within urban areas that are often overlooked [4] or analyzed only through the lens of their adverse environmental effects [5]. Indeed, roadsides are often characterized by compacted soils that exhibit low nutrient and organic matter contents and are vulnerable to disturbances caused by road construction and maintenance [6]. However, despite these challenges, roadside ecosystems can play a significant role in carbon storage in vegetation and soil and in providing ecosystem services in urban environments [5]. For instance, roadsides dominated by trees and shrubs have been identified as substantial carbon reservoirs in the Province of Quebec (Canada), with an average soil carbon stock of 106 Mg ha−1. Similarly, roadsides dominated by herbs can store up to 84 Mg ha−1 in soils [7]. By studying the carbon storage capacity and physical stability of roadside soils, we can effectively manage these areas as carbon sinks and long-term reservoirs to help mitigate the effects of climate change. Moreover, a better understanding of the ecological characteristics of urban green spaces, such as, roadsides should lead to a better quantification of the ecosystem services they can provide, which is an important key to improving urban planning and management toward more socially and environmentally friendly urban areas [8].
To mitigate climate change, it is crucial to protect soil organic carbon from mineralization and increase its residence time in the soil through different stabilization mechanisms, and when possible, enhance stocks of stable organic carbon, even in soils submitted to higher anthropogenic pressure like those located along road networks (i.e., roadsides). These mechanisms include selective preservation through increased chemical recalcitrance, physical protection, and the promotion of organo-mineral associations [9,10]. Selective preservation produces soil organic matter (SOM) resistant to decomposition by microorganisms, while physical protection refers to the burial of SOM in aggregates, making it inaccessible to microorganisms and enzymes. Organo-mineral associations involve physicochemical interactions between SOM, mineral surfaces, and metal ions, which safeguard SOM by forming cationic bridges, exchanging ligands, and via Van der Waals forces [10].
Physical fractionation is a widely used method to assess the stability of SOM [11,12]. The physical fractionation approach separates soil organic carbon into particulate organic carbon (POC) and mineral-associated organic carbon (MAOC). MAOC has a lower carbon-to-nitrogen (C/N) ratio and is believed to be resistant to decomposition, allowing longer persistence than POC. MAOC constitutes an important organic matter stabilization mechanism in soils [13]. The properties of MAOC are thought to make it less vulnerable to climate change and contribute to long-term soil carbon storage [12]. SOM physical stability can be affected by several factors, such as soil properties [14,15], vegetation characteristics [16], climatic factors, and land management [17,18].
While soil organic matter is crucial in maintaining physical soil stability, it also influences the activity and immobilization of heavy metals in soil via its active functional groups, such as carboxy and hydroxyl groups. In addition, the size of soil particles greatly affects the distribution, mobility, and availability of heavy metals [19]. Thus, it is crucial to consider these interactions when studying physical soil stability.
Roadside soils are frequently contaminated with pollutants from vehicle emissions and maintenance activities related to road infrastructure, such as the use of de-icing salt. Heavy metal concentrations, such as iron (Fe), zinc (Zn), manganese (Mn), copper (Cu), lead (Pb), and cadmium (Cd), are highest at the surface near the road and gradually decrease with distance from the road and soil depth [20]. The retention of heavy metals by SOM and soil clay particles [21] affects the rate of SOM decomposition [22] and soil carbon storage [23]. While soluble organic compounds can form complexes with heavy metals in the soil solution, making them more available to living organisms, heavy metals bound to the solid phase of soil organic matter show reduced mobility and availability [24].
In transportation infrastructures, road salts can migrate to the soil of nearby roadside ecosystems, alter the stability of aggregates [24], affect the SOM decomposition rate, and decrease tree productivity [25]. The presence of salts like NaCl increases Na+ ion concentration in the soil solution, which can accelerate the leaching of other cations (e.g., calcium (Ca) or magnesium (Mg)), thus decreasing aggregate and organic matter stability and altering soil structure [24]. While the study of She et al. [26] indicated that an increase in soil salinity could contribute to a decrease in carbon stability due to the negative impact of salinity on microbial activity, the impact of salt on soil carbon stability remains unclear.
Using the southern part of Quebec (Canada) as a case study, the primary objective of this study was to assess the soil carbon physical stability of roadsides as a way to increase the understanding of the ecological processes driving these urban ecosystems and evaluate their environmental significance within urban areas. This involved analyzing the characteristics of roadsides, including road density and soil properties. To achieve this objective, we measured the carbon content of physical soil fractions, i.e., MAOC and POC, at various depths collected on a gradient of roadsides with contrasting vegetation and land uses and bordering road networks of various densities. Furthermore, we examined the physicochemical properties of roadside soils related to heavy metal and salt contamination and the relationships with the carbon content of soil physical fractions.

2. Materials and Methods
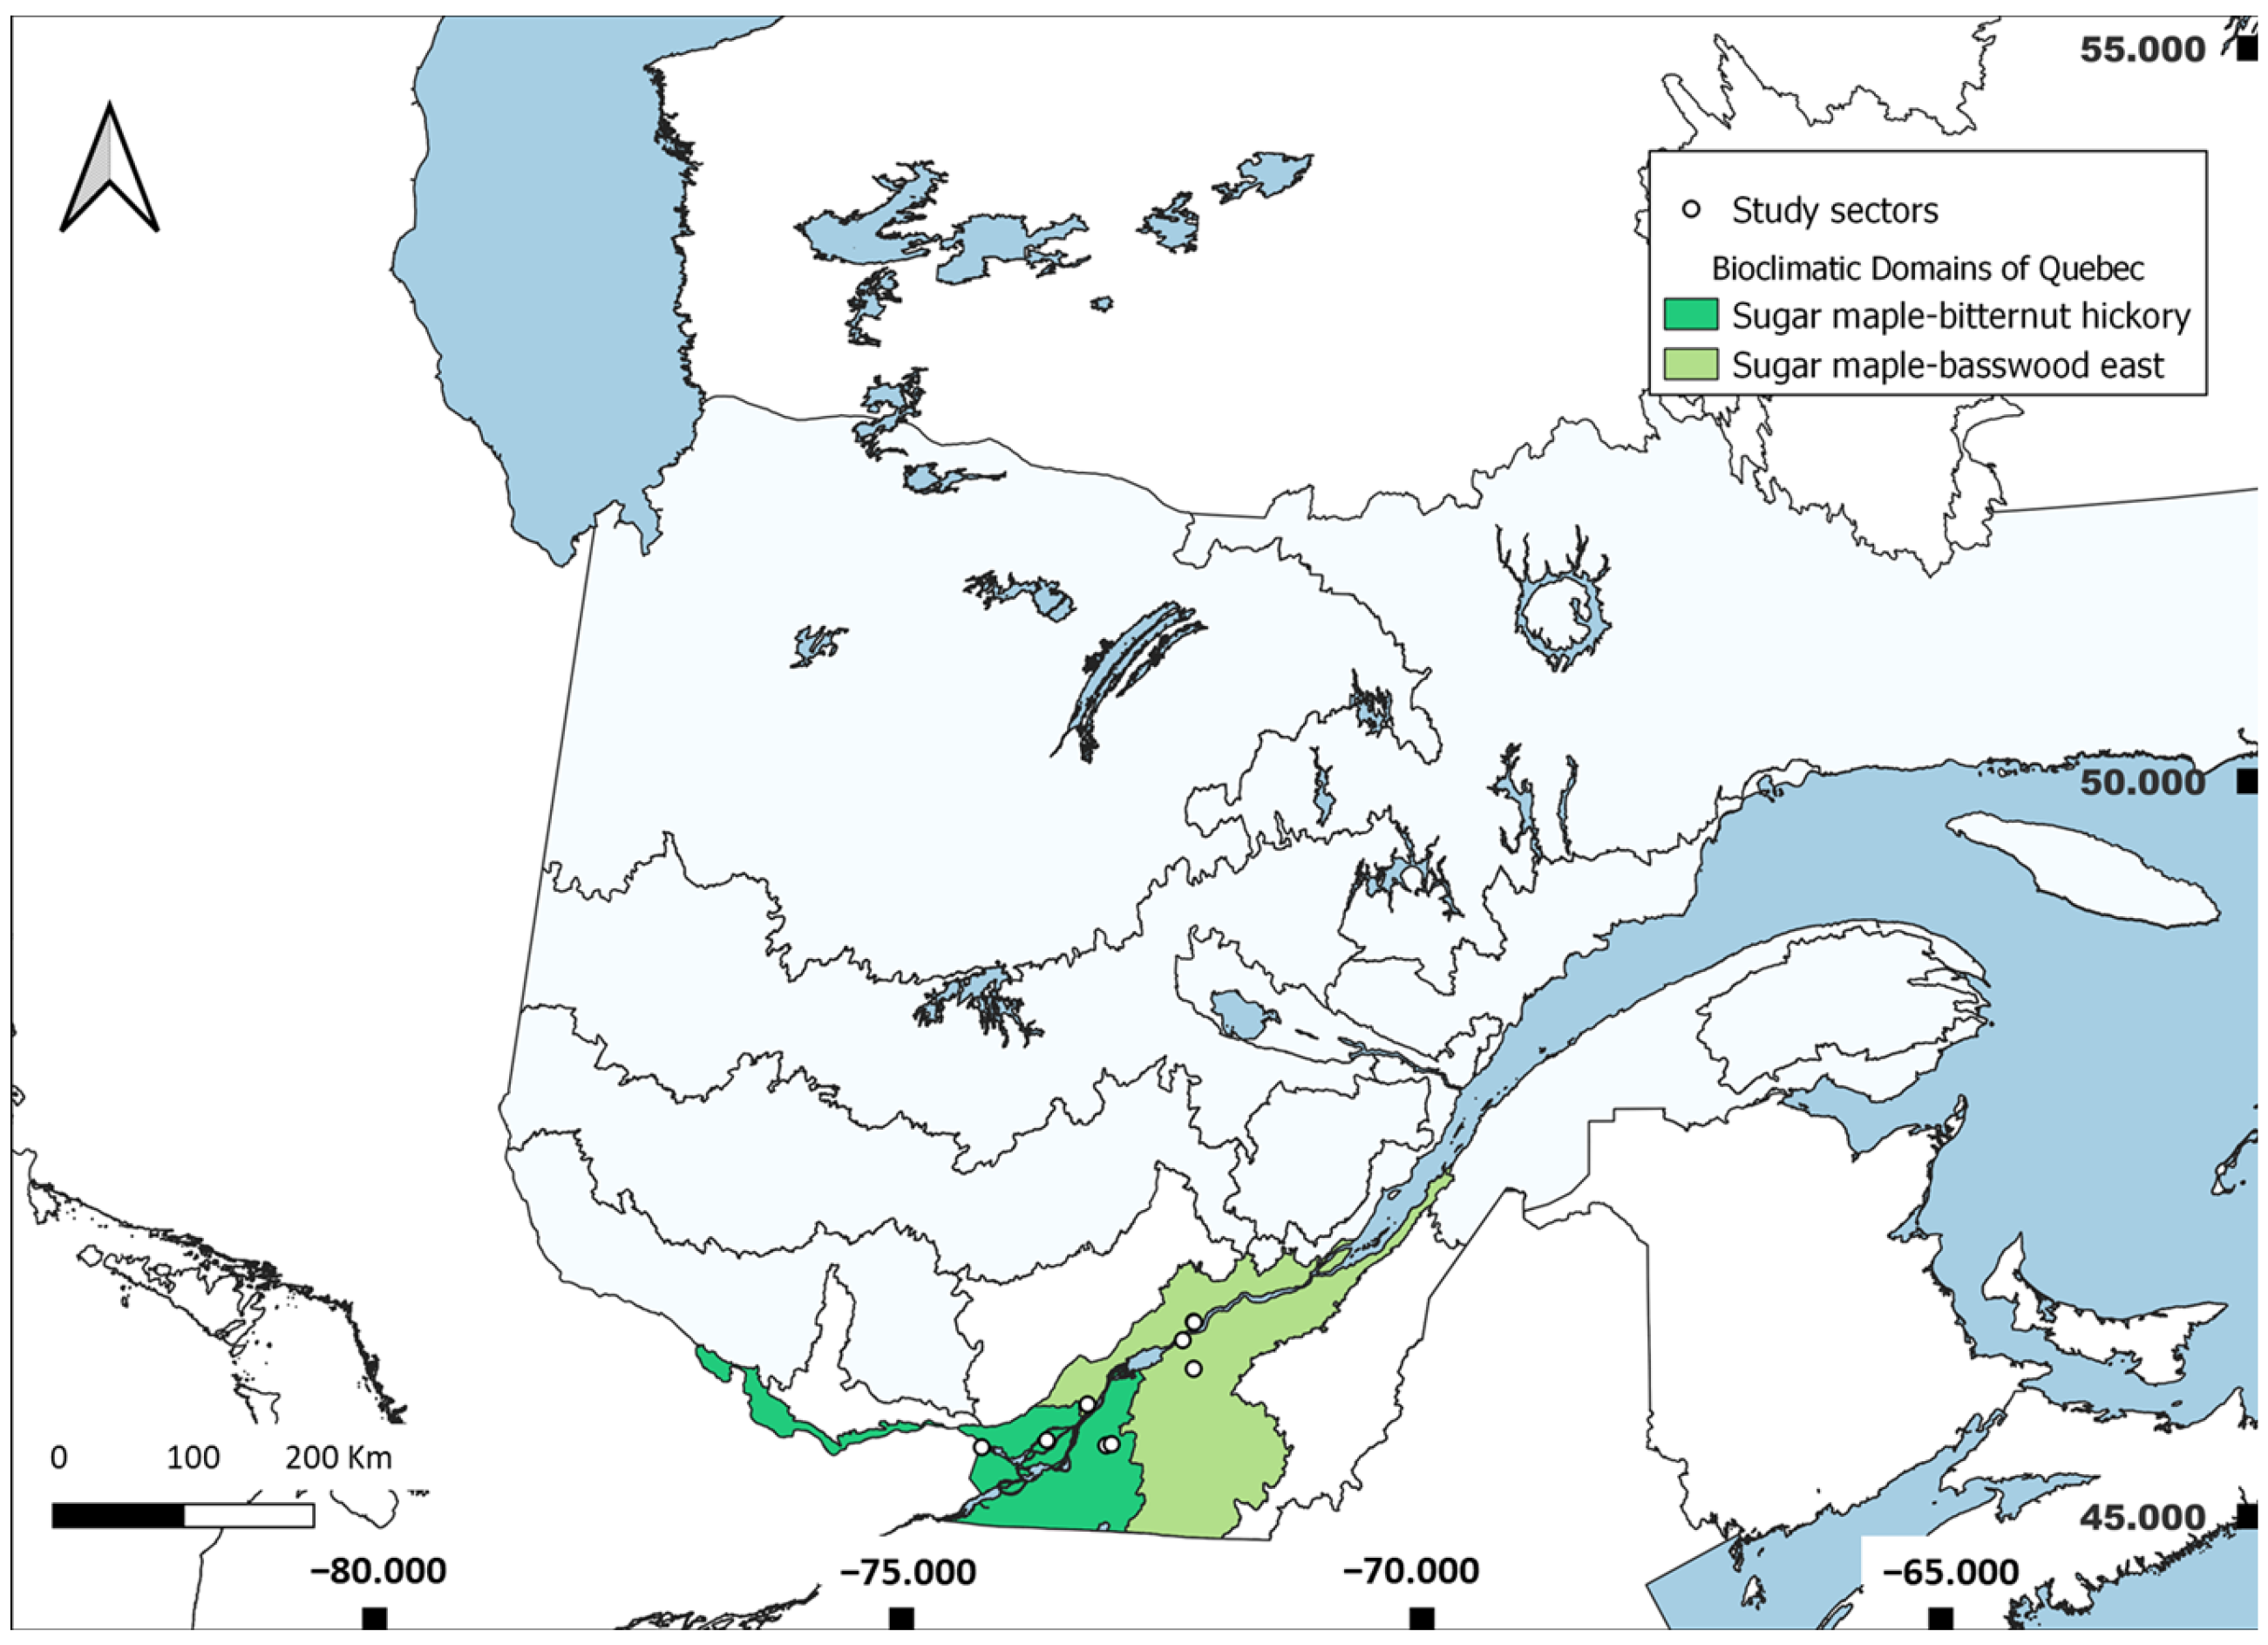
2.1. Study Sites

This study was conducted in four regions of southern Quebec: Mauricie, Montréal, Montérégie, and Laval. These regions comprise the sugar maple–bitternut hickory bioclimatic zone in the south and the sugar maple–basswood bioclimatic zone in the north [27] (Figure 1). A total of 50 roadsides were randomly selected among all potential roadsides of these regions; criteria for potential roadsides included a minimum area of 300 m2 and safe access for the field crew. Sites were located within the St. Lawrence Lowlands Platform and the Appalachians geological provinces, which are characterized by limestone, sandstone, mudstone, and shale; soils of the study sites are mostly young (<10,000 years), have developed from marine deposits and are classified as melanic, sombric, or dystric brunisols. Selected roadsides were characterized by varying vegetation assemblages (herbs, shrubs, and trees). They included different types of roads, such as highway medians, highway rights-of-way, local and regional collectors, and arterial roads. Roadsides were further classified into four types of current land use based on information from the ecoforest map of Quebec [27]: agricultural land, abandoned agricultural land, forest, and right-of-way. Since most sites had been classified as agricultural lands at some point in the past, a rough estimate of the year of agriculture abandonment and conversion to another land use was calculated for each site in 10-year increments using ecoforest maps; maps were available for the years 1975, 1985, 1995, 2005, and 2015. Sites that had been continuously classified as forests over time were included in the 1975 category. For further details on the selected sites and their land use history, see [7].
For each roadside, road density was calculated by measuring the length of roads within a 1 km buffer zone around the roadside and expressed as meters of roads per km2 of land.

2.2. Sampling Procedure

The soil sampling procedure was based on Canada’s National Forest Inventory ground sampling guidelines [28]. One circular inventory plot was installed on each of the 50 selected roadsides. Plots had an area of 400 m2 (radius = 11.28 m) when at least 25% of the surface area of the roadside was covered by trees with a diameter at breast height > 9 cm or 200 m2 (radius = 7.98 m) when trees > 9 cm covered less than 25% of the site area.
Two soil stations were established on each plot. For each soil station, the mineral horizons were collected using a metal core with an internal diameter of 5 cm at three depths: 0–15 cm, 15–35 cm, and 35–55 cm. Due to limitations in accessing deeper horizons, the procedure was not always feasible: soil compaction during soil sampling prevented the collection of deeper soil samples at some sites, specifically on roadsides classified as rights-of-way.
Soil samples were placed in plastic bags and kept in coolers on the field for a few hours before being frozen in the laboratory. The samples were thawed and air-dried for one week and then sieved at 2 mm. The coarse fractions that did not pass through the sieve were separated into organic fractions (roots, buried wood, and other organic material) and mineral fractions (rocks). All sieved samples were ground to 250 µm and oven-dried (105 °C); carbon concentration (%) was then measured by a Leco TruMac CNS Analyzer (LECO Corporation, St Joseph, MI, USA). C concentration and bulk density were then used to calculate soil C content in megagrams of carbon per hectare (Mg C ha−1).

2.3. Soil Physical Fractionation

The experimental protocol of physical soil fractionation was adapted from Carter et al. [13]. This protocol was performed on samples from a subset of 23 roadsides selected to represent a gradient of vegetation cover. For each sample from this subset, 25 g of soil was weighed and combined with 100 milliliters of distilled water and 10 glass beads (5 mm in diameter) in a 250 mL Erlenmeyer flask. After being stirred at 160 rotations per minute for 16 h, the mixture was wet sieved at 53 µm to isolate the fine fraction (smaller than 53 µm) and the coarse fraction (ranging between 53 and 2000 µm). These two fractions were then oven-dried for approximately one week and weighed. The dried fractions were ground, and their carbon concentration was measured using a Leco TruMac CNS analyzer. The mass percentage (%) of all isolated fractions was determined to obtain the C concentration of the light and heavy fractions. The coarse fraction was considered particulate organic carbon (POC), while the fine fraction was defined as organic carbon associated with minerals (MAOC) [12].

2.4. Analysis of Physicochemical Soil Properties

Soil samples from the first 15 cm of the mineral horizons collected in all 50 plots were analyzed to measure the concentration of eight heavy metals, including As, Cd, Cu, Cr, Co, Mn, Pb, and Zn. The analysis was carried out using inductively coupled plasma optic emission spectroscopy (ICP-OES 5110, Agilent Technologies, Santa Clara, CA, USA), a sensitive and accurate technique for measuring heavy metal concentration in soil.
In addition to heavy metal concentrations, soil salinity, pH, and texture were measured at different soil depths (0–15 cm, 15–35 cm, and 35–55 cm). Soil salinity was determined by measuring the conductivity of the soil solution and was expressed as the amount of dissolved ions in the soil solution. The pH was measured in a water suspension from the soil [29]. To determine the soil texture, the Bouyoucos method was used [30], a widely accepted technique for determining soil texture that involves the measurement of the percentage of clay, silt, and sand in the soil.
The measured metal levels were compared to the average element content in the Earth’s crust, also known as the geochemical background concentration [31]. The Contamination Factors (CF) were then used, defined as the ratios of the concentration of the analyzed metals to their background content [32]. The formula for determining CF is as follows:
C F = C m e t a l / C b a c k g r o u n d
where Cmetal represents a given metal concentration in a soil sample, and Cbackground represents the geochemical background value of the metal; CF calculations make it possible to identify whether high metal levels have an anthropogenic origin (as opposed to a natural/geological origin) [32]. Similarly, the standard soil criteria described in [31] were used to assess soil salinity levels.

2.5. Data Analyses

All statistical analyses were conducted using the R software package 4.1.2 [33].
The Shapiro–Wilk test was used to check the normality of the data, and the Fligner–Killeen test was used to test for variance homogeneity. As the data did not follow a normal distribution, non-parametric Kruskal–Wallis tests, followed by the Dunn test, were employed to assess pairwise differences.
We first evaluated whether there were significant differences in soil organic carbon fractions (i.e., MAOC and POC) between roadside current land uses and soil depths (i.e., 0–15 cm, 15–35 cm, 35–55 cm, and the entire soil profile (0–55 cm)) using the subset of 23 sites for which fractionation was performed. The current land use categories were the following: abandoned agricultural land (2 sites), agricultural land (1 site), forest (13 sites), and right-of-way (7 sites).
The Kruskal–Wallis test was then used to compare soil texture and road density between roadside current land uses, using all 50 roadsides (abandoned agricultural land: 9 sites; agricultural land: 2 sites; forest: 30 sites; right-of-way: 9 sites). Road density was used as a proxy to reflect pollution and disturbance from transportation and road maintenance; road length within a given buffer is easy to compute and has been found to be significantly related to heavy metal concentration in soils [34,35]. Differences in heavy metal concentration (this analysis was restricted to the first depth of mineral soil (0–15 cm)), soil solution conductivity, and pH among different land uses were then tested. Next, the Pearson correlation (R) method was used to examine the correlations between road density and soil parameters.
The correlation between soil organic carbon fractions and soil parameters at the 0–15 cm soil depth was explored using the 23 roadsides on which both sets of variables were measured. Furthermore, a multiple regression model with significant predictors was conducted to select the best predictors of carbon storage in soil physical fractions. The collinearity of the model with total predictors was tested using Variance Inflation Factors (VIF), and the independent variables with VIF < 5 [36] were selected. We evaluated the performance of fitted models by testing the Akaike information criterion (AIC) and the R2. All predictors were mean-centered and scaled by one standard deviation to facilitate the interpretation of model results. p < 0.05 was used for significance.

3. Results

3.1. Roadside Characteristics

Based on the analysis of soil granulometry, no significant difference in soil texture could be found between roadsides of different regions and land use categories (p > 0.05). The sand percentage varied between 40 and 49% across roadsides, whereas the clay percentage ranged between 19 and 31%. However, the Kruskal–Wallis analysis showed a significant difference in road density within a 1 km radius between roadsides classified in different land uses. The road density was significantly higher for sites classified as rights-of-way (10,782 m km−2) and lowest for sites classified as abandoned agricultural land (950 m km−2) (Figure 2).

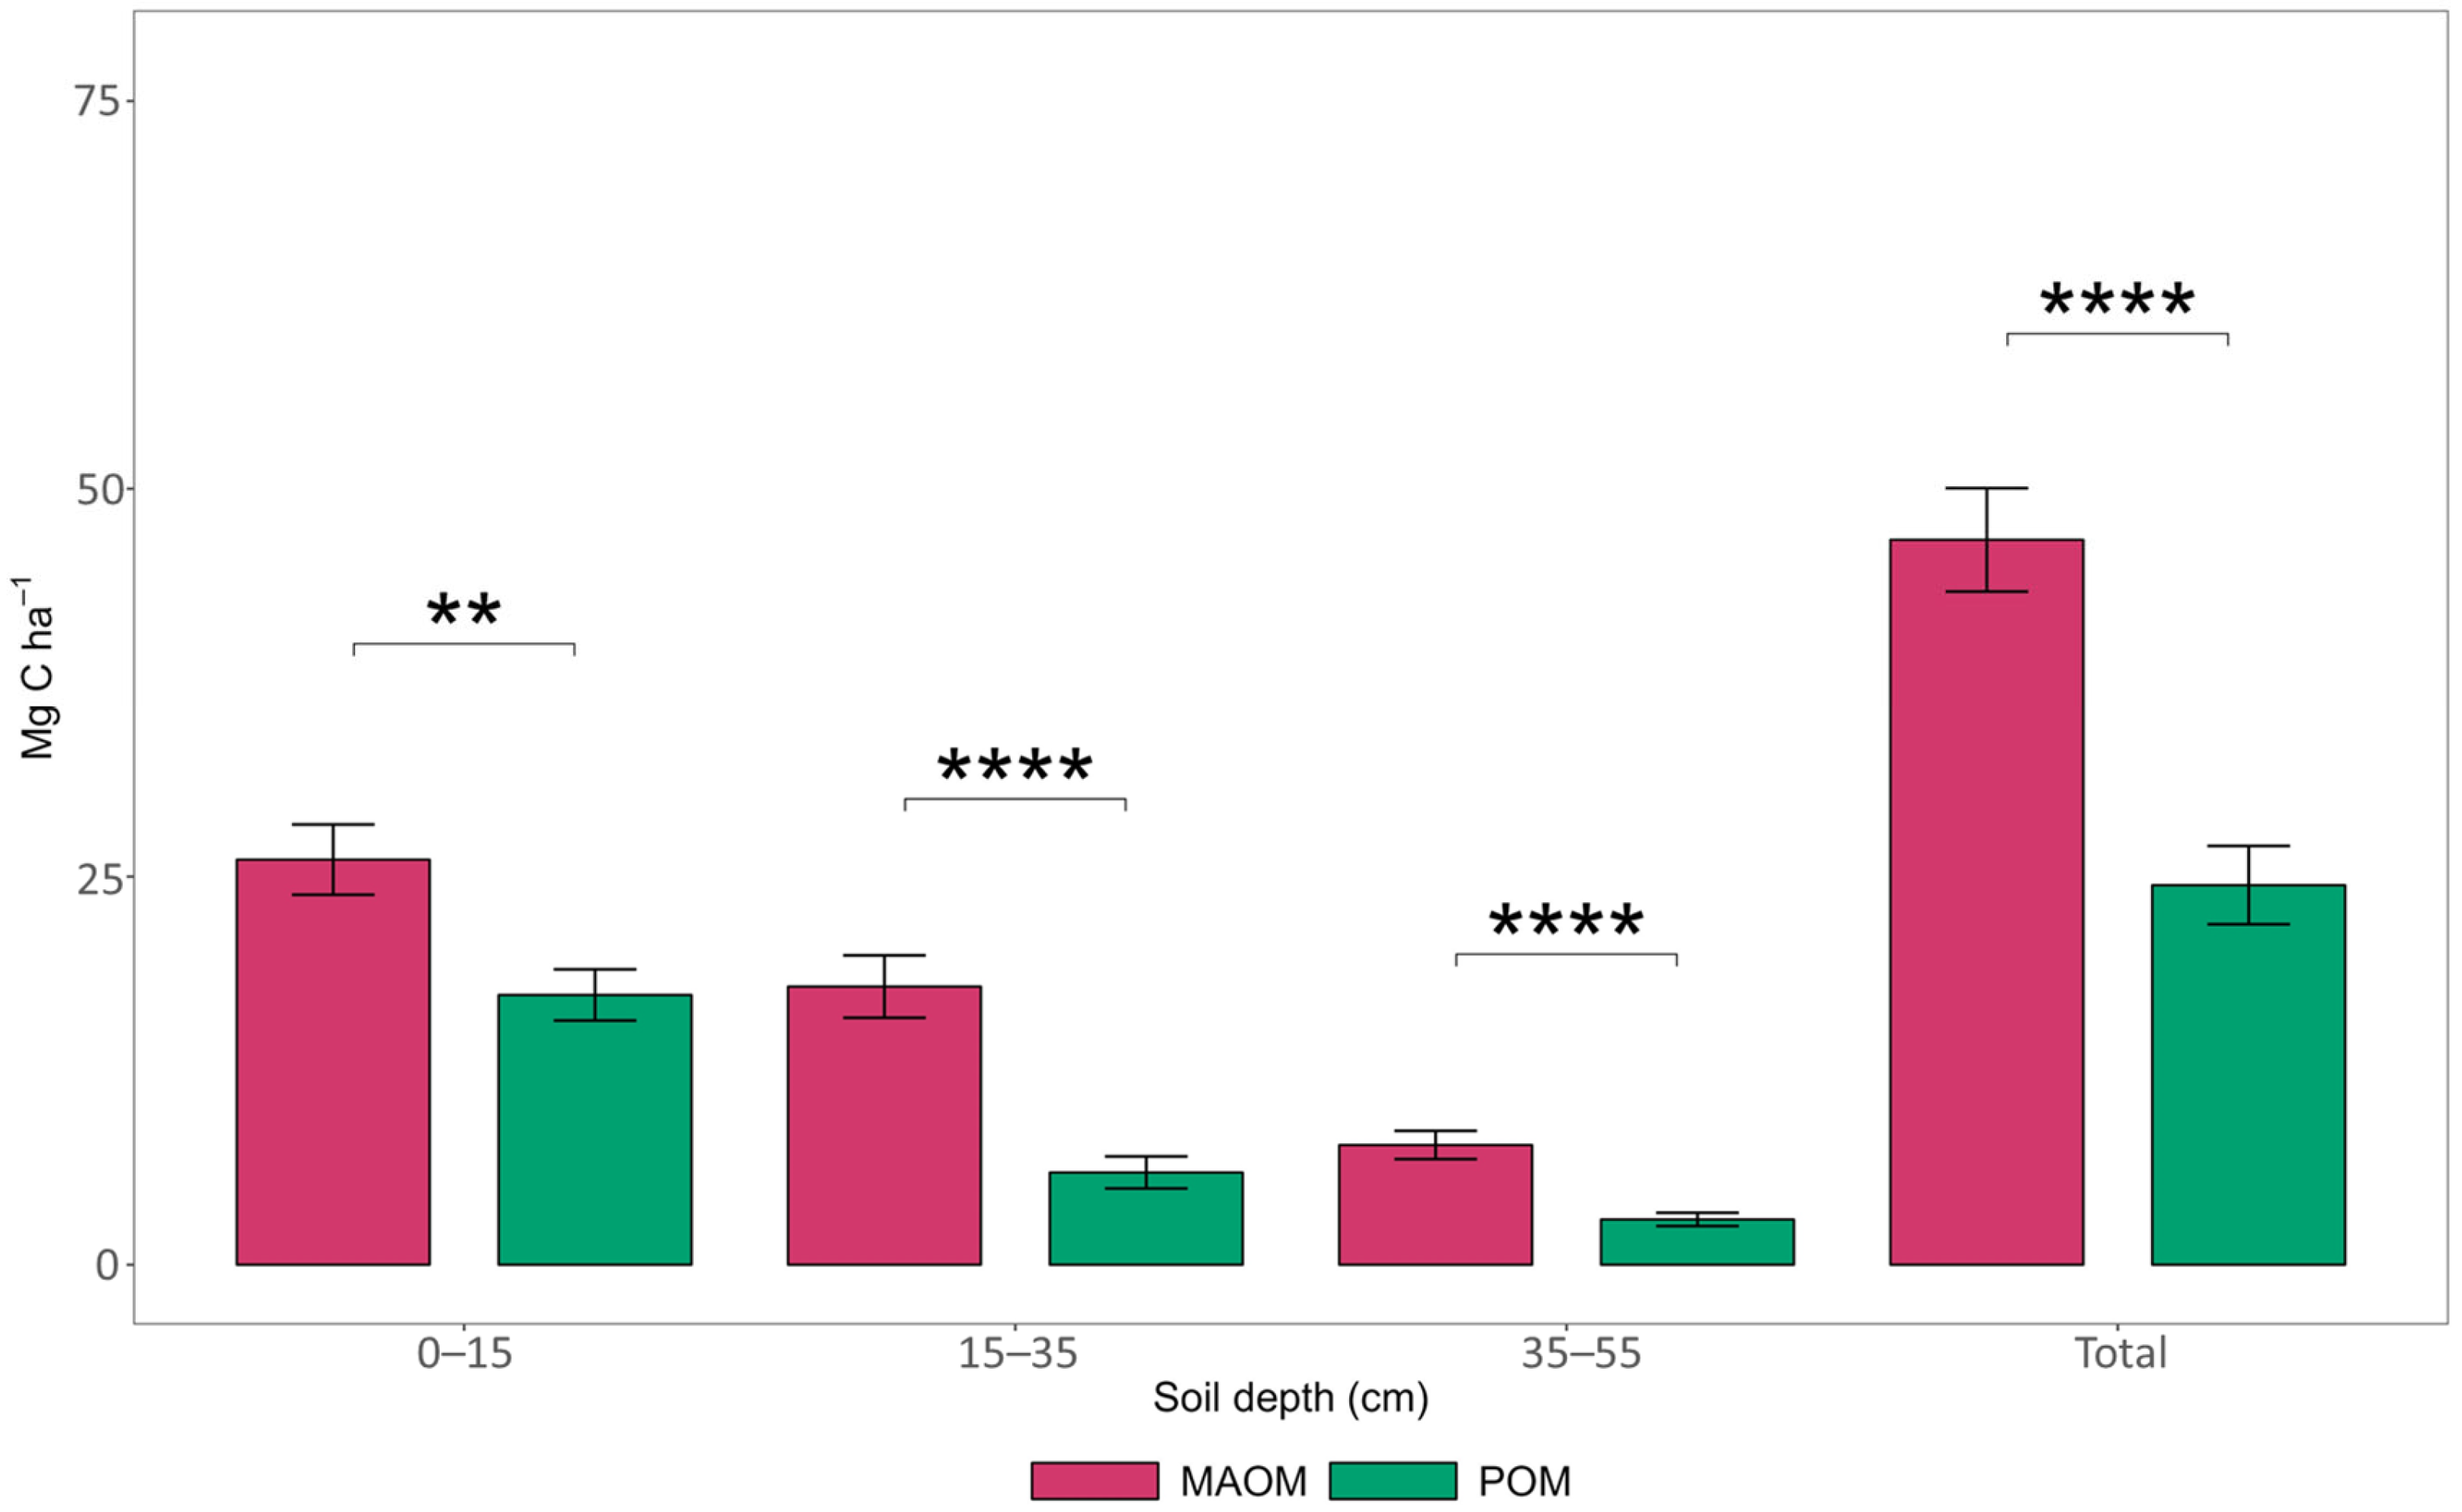
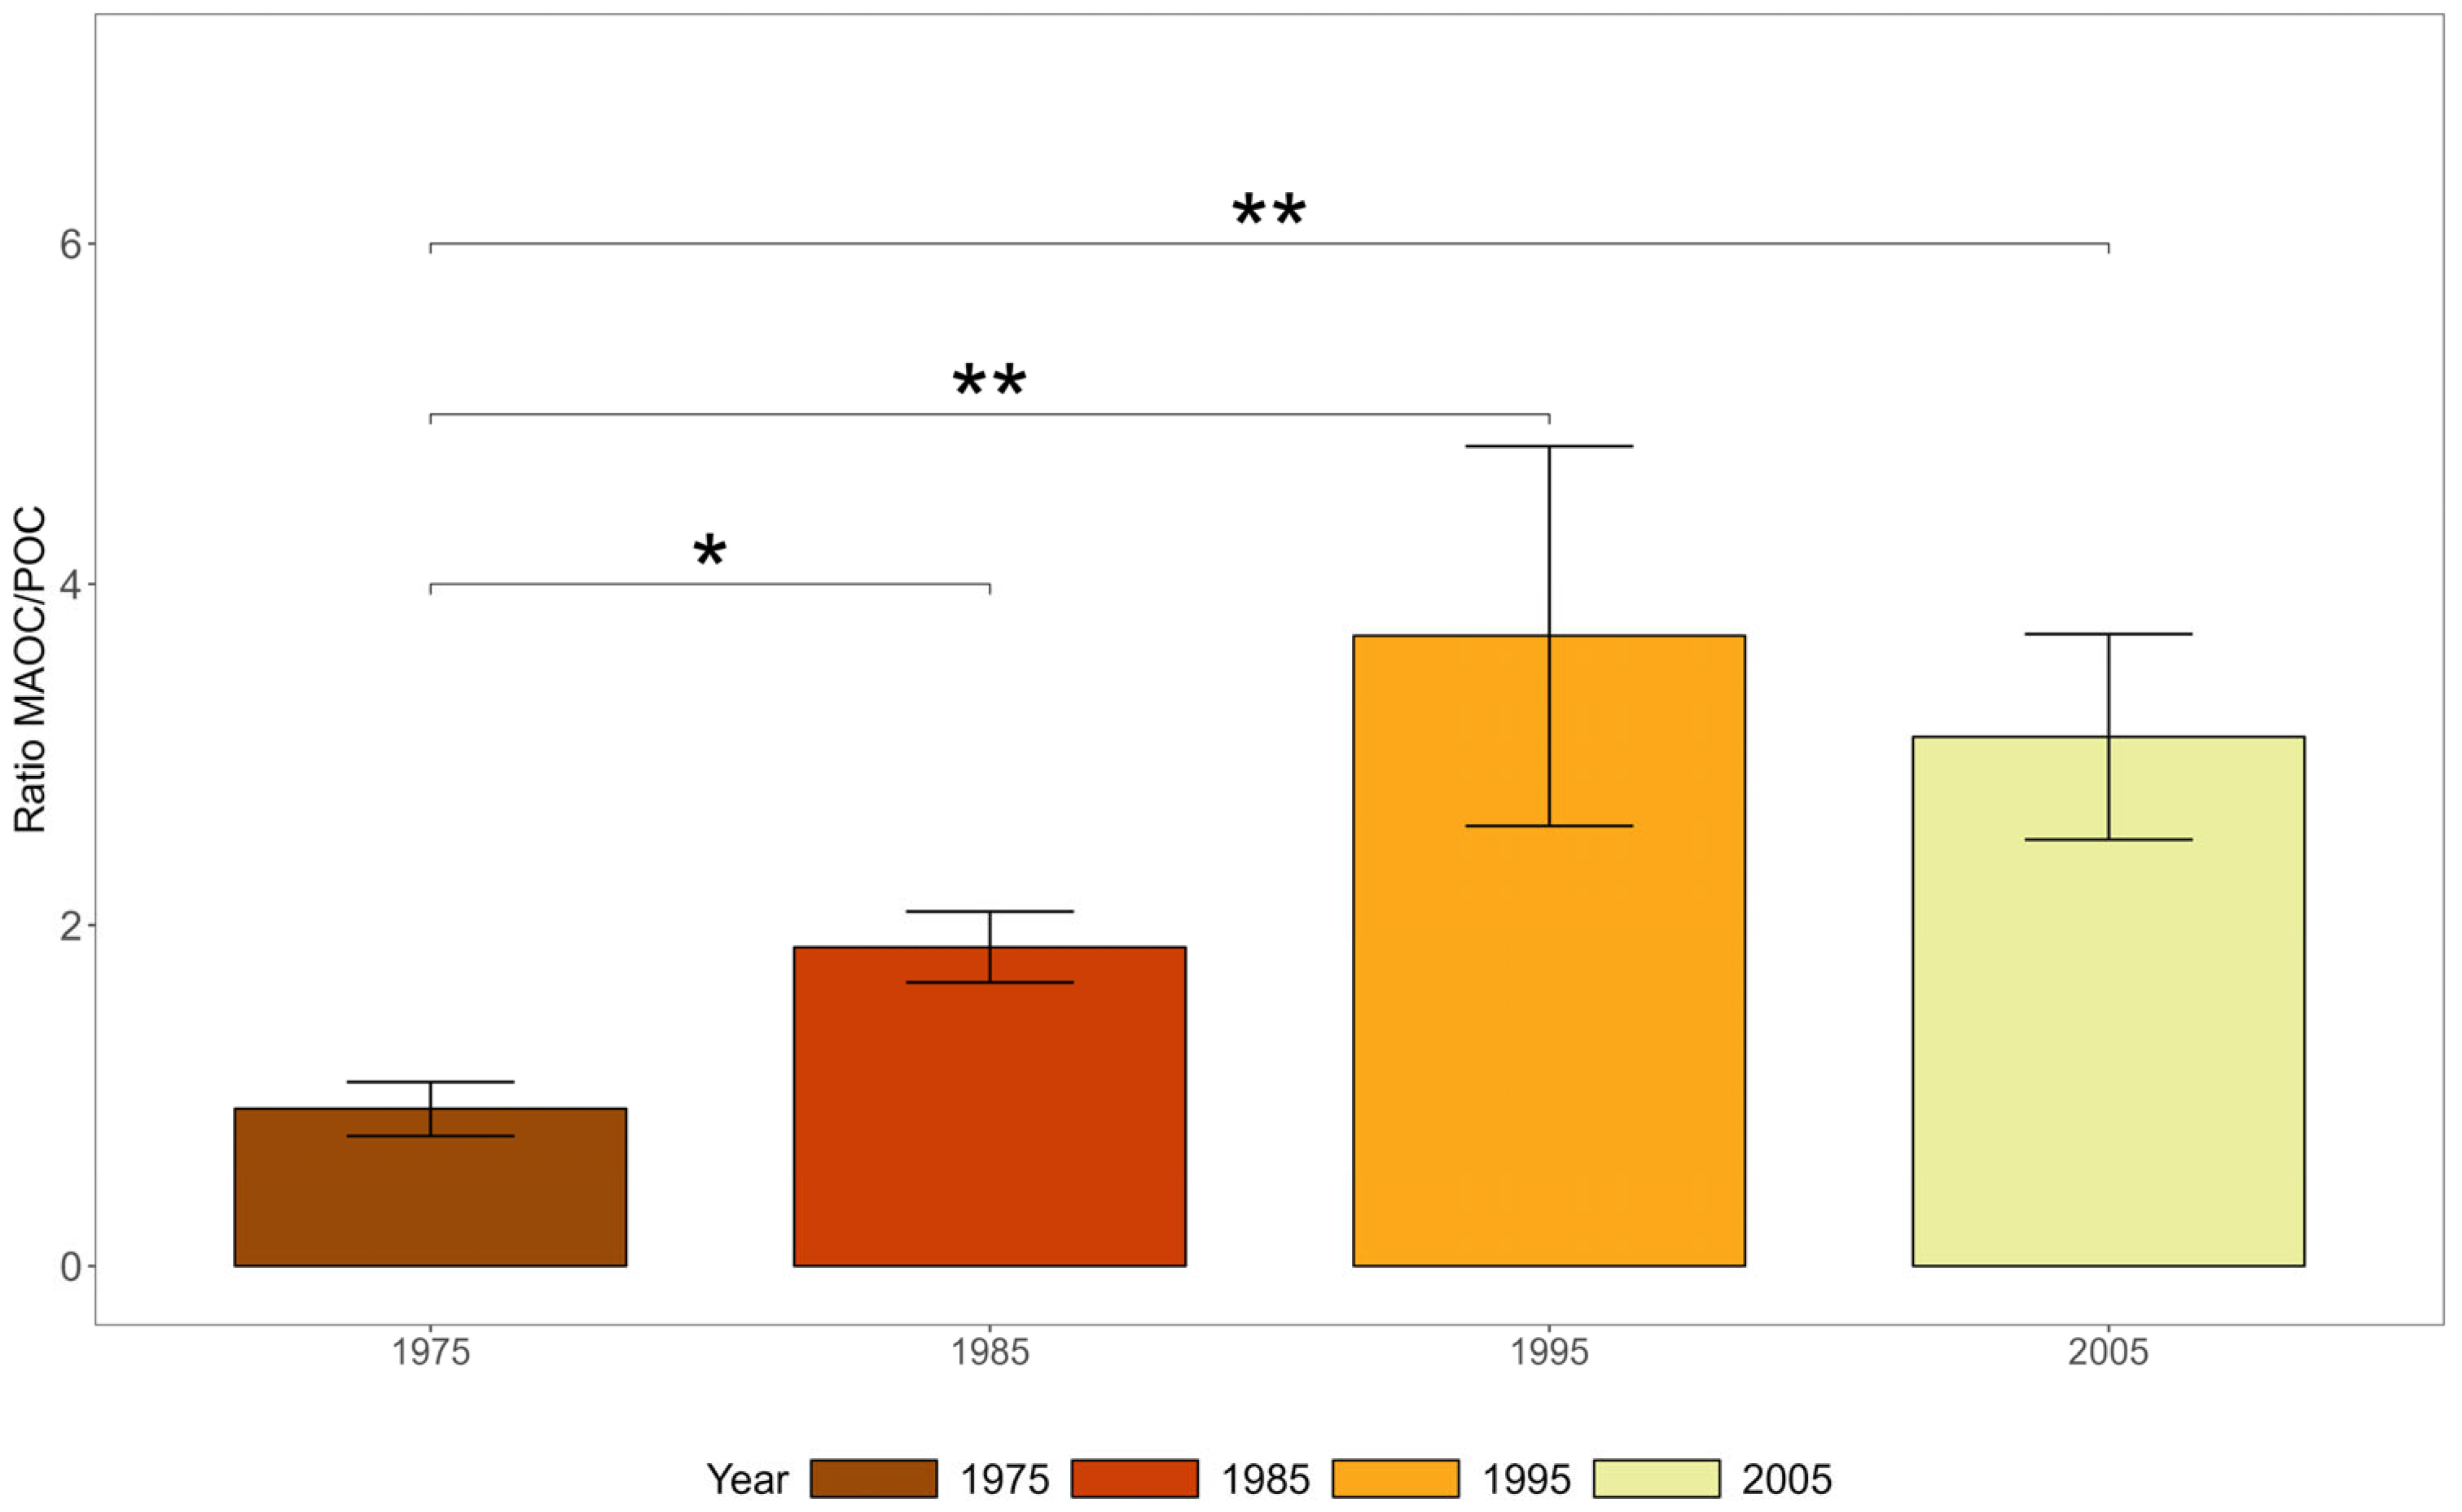
3.2. Carbon Storage in Soil Fractions

The Kruskal–Wallis test revealed no significant difference in carbon stocks between land use types for MAOC and POC fractions at different depths (Figure 3). However, when pooling together all roadsides, soil carbon content differed significantly between the MAOC and POC fractions for all studied soil depths (0–15 cm, 15–35 cm, and 35–55 cm, and total soil 0–55 cm): the more stable MAOC fraction had higher carbon stocks compared to the more labile POC fraction (Figure 4). Carbon stocks in both MAOC and POC fractions decreased with depth, and the highest values were found at the shallowest mineral depth (0–15 cm). This decrease with depth was more pronounced and abrupt for the POC fraction than for the MAOC fraction (Figure 4). The stable soil fraction MAOC contained 60% of soil carbon, while 40% was found in the labile fraction POC at a depth of 0–15 cm. At a depth of 15–35 cm, 75% of soil carbon was present in MAOC and 25% in POC. Similarly, at a depth of 35–55 cm, 72% of soil carbon was present in MAOC, while 28% was found in POC. The mineral soil horizons (0–55 cm) contained 66% of soil carbon in the stable fraction MAOC and 34% in the labile fraction POC.
Furthermore, a Kruskal–Wallis test showed that the ratio of MAOC/POC in the soil was significantly lower at the 0–15 cm depth (with a value of 1.9) compared with the ratio at the 15–35 cm depth (value of 4.8), while the latter was similar with that measured at the 35–55 cm depth (3.5). The MAOC/POC ratio of the overall mineral soil (up to a depth of 55 cm) was 2.3.
Moreover, while the MAOC/POC ratio of the overall mineral soil did not vary according to land use, a Kruskal–Wallis test showed that it significantly varied according to the (approximate) year of agricultural abandonment and conversion to another land use: sites with more recent abandonment had a higher MAOC/POC ratio, and sites for which agriculture was abandoned further in the past, or sites that have been classified as forests since at least 1975, had a lower ratio (Figure 5).

3.3. Soil Chemical and Physical Properties

To assess the degree of heavy metal contamination, we analyzed the contamination factor (CF) of heavy metals in soils of roadsides. According to the average value of CF and based on the criteria of Beaulieu [31], roadsides were not considered to be contaminated with heavy metals (CF < 1) (Figure 6). However, the soil solution conductivity of the sampled sites showed that the soil salinity of studied roadsides could be considered moderate (conductivity > 0.7 mS cm−1).
The results of the Kruskal–Wallis test suggested significant differences in heavy metal concentrations (As, Co, Cu, Pb) among roadsides with different current land uses. Roadsides classified as abandoned agricultural lands had the highest concentration of As and Co, those classified as forests had the highest concentration of Pb, and those classified as rights-of-way had the highest concentration of Cu (Table 1). The Dunn post hoc test provided further evidence of this difference by showing that the concentration of Co differed significantly between roadsides classified as forests and abandoned agricultural lands, with forest sites having the lowest concentration of Co. Also, the concentration of Cu was found to be different between roadsides classified as forests and rights-of-way, with the highest concentration in the latter (Table 1).
Additionally, the Kruskal–Wallis test results showed that soil solution conductivity differed significantly across land uses at depths of 0–15 cm and 15–35 cm, with the highest conductivity detected in soils from roadsides classified as rights-of-way and the lowest in soils from those classified as agricultural lands. However, we found no significant difference in soil solution conductivity between land uses at the 35–55 cm soil depth (Table 1). Finally, the soil of roadsides classified as forests was acidic, while soil from rights-of-way was neutral, with a significant difference between land uses in pH at depths of 0–15 cm and 15–35 cm (Table 1).

3.4. Correlation Between Road Density and Soil Properties

The Pearson correlation analysis between road density and soil properties of roadsides revealed a positive and significant correlation between road density and the concentration of Cu in the 0–15 cm soil depth (Table 2). A significant positive correlation between road density and conductivity was also found at a soil depth of 15–35 cm. Additionally, a strong and significant positive correlation was observed between road density and soil pH measured at 0–15 and 15–35 cm soil depths.

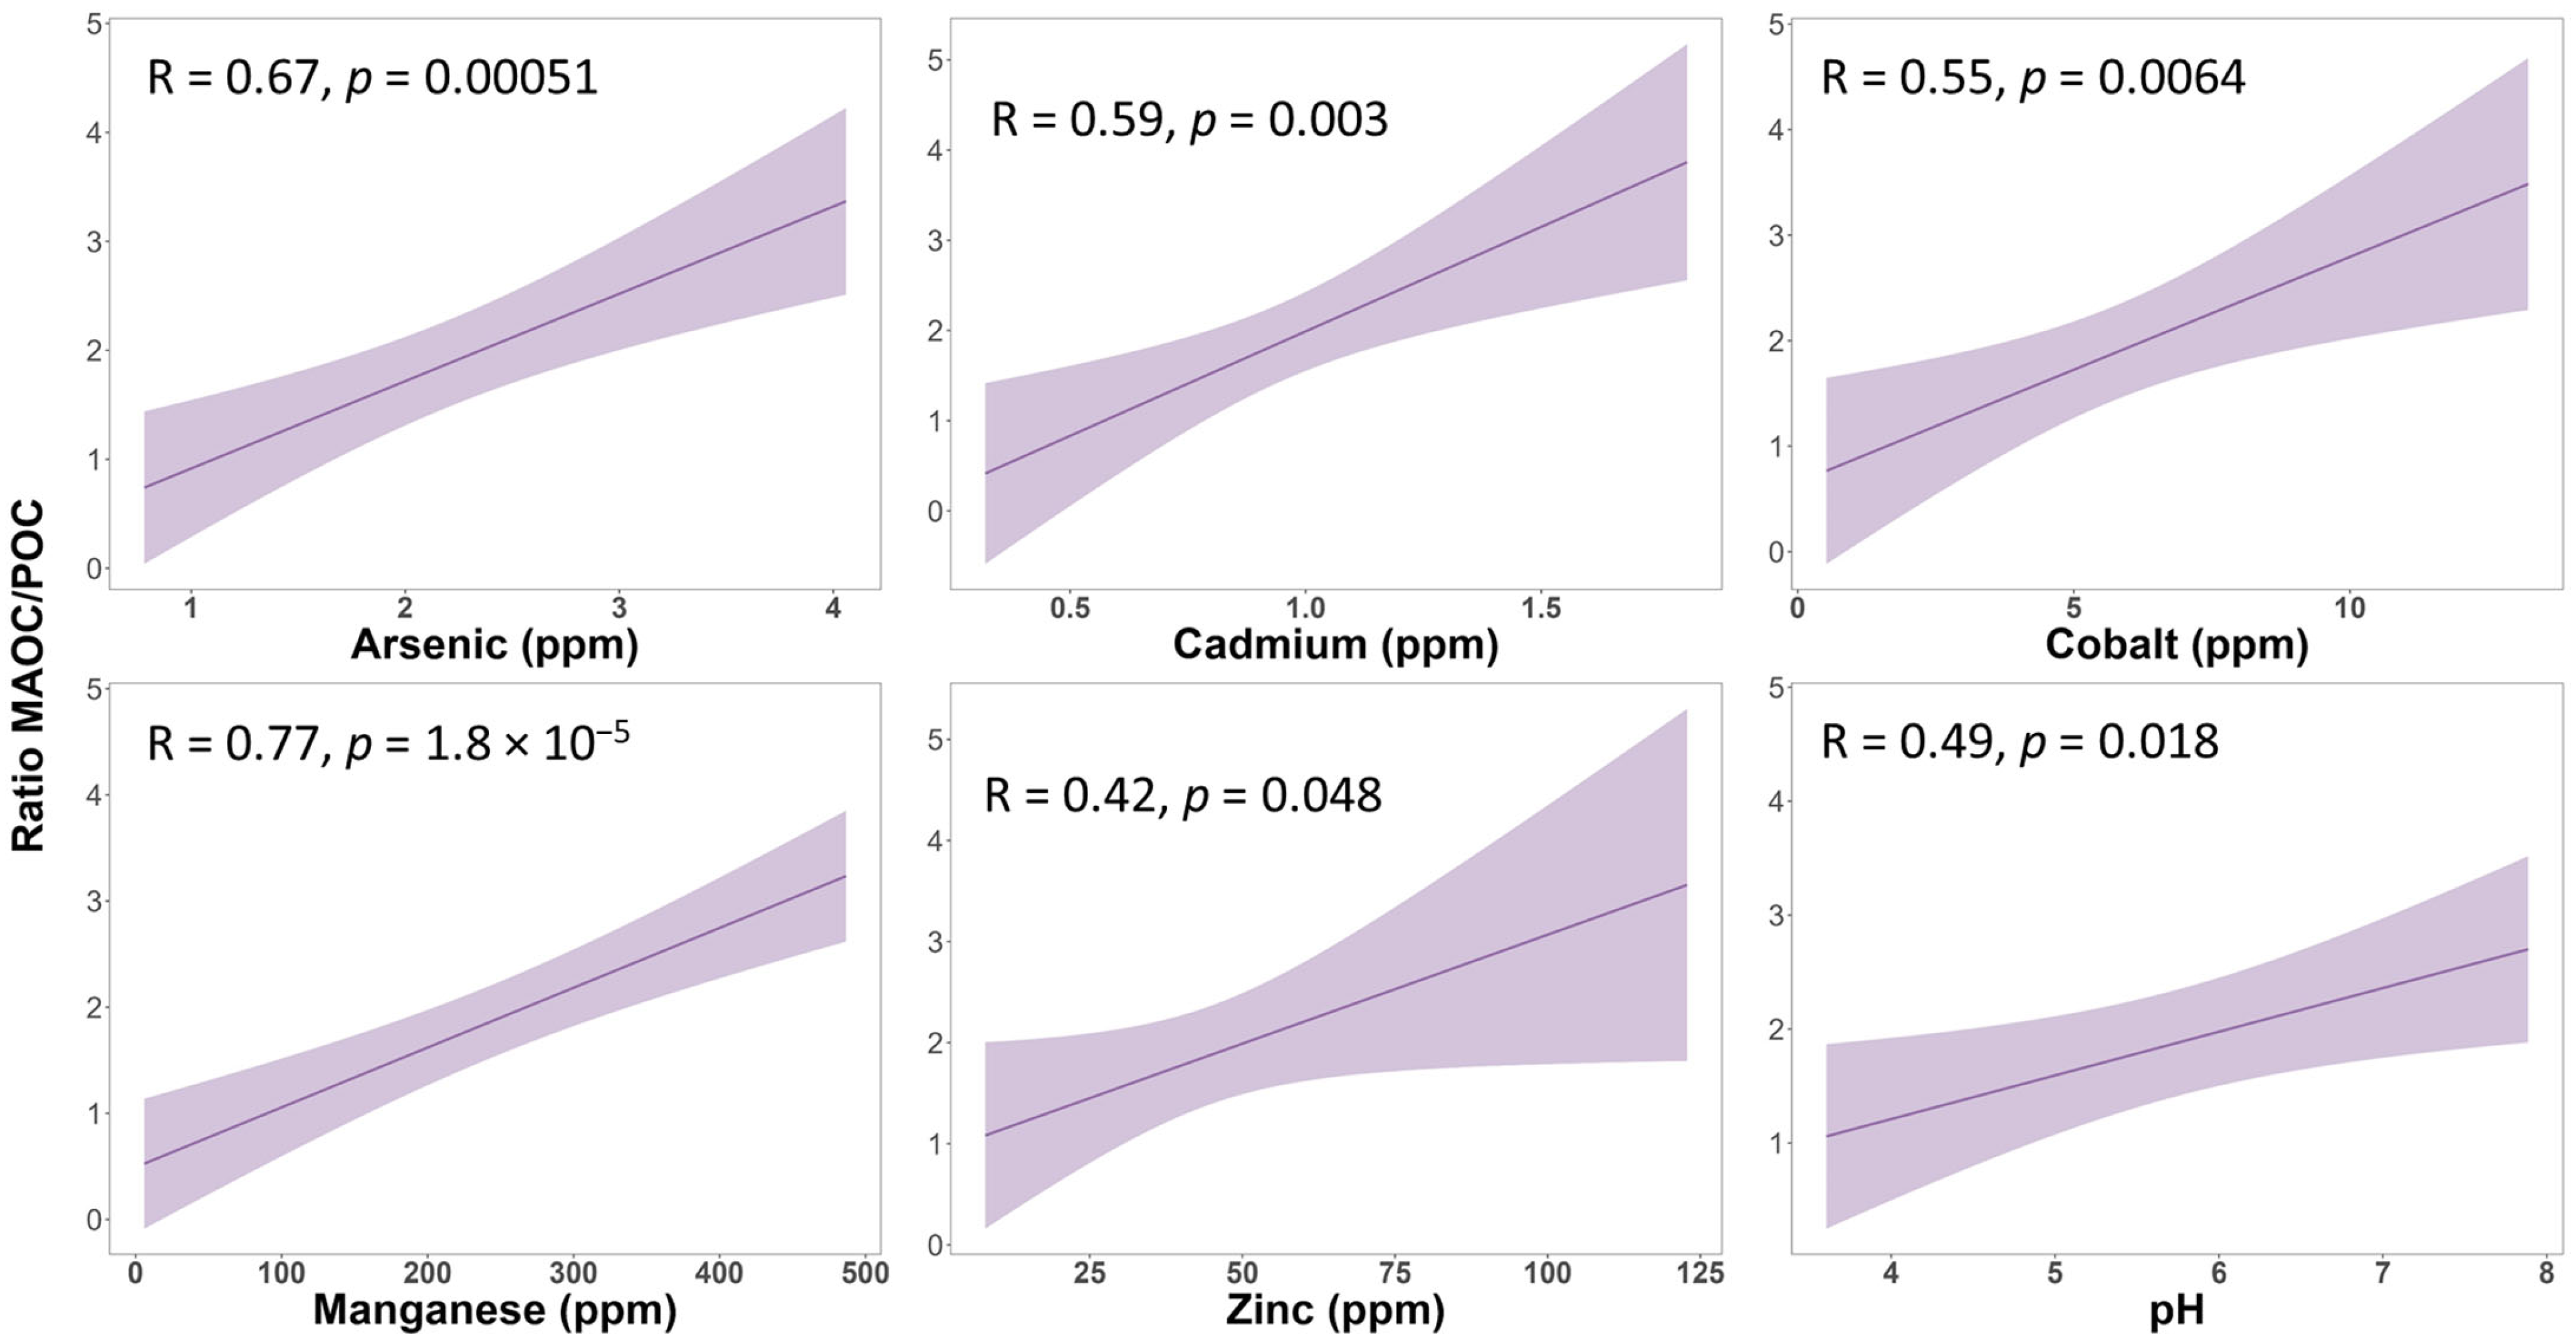
3.5. Relationship Between Carbon Stocks in Soil Fractions and Physicochemical Soil Properties

The correlation analysis between roadside soil properties and soil carbon fractions at the 0–15 cm soil depth indicated that the amount of carbon content in the MAOC fraction was significantly and positively correlated to road density, soil concentration of heavy metals (Co, Cu, Mn, Zn), soil solution conductivity, and soil pH. On the other hand, some heavy metals (Cd, Mn) showed a negative correlation with carbon stocks in the POC fraction, while Pb had a significant and positive correlation with that fraction (Figure 7). Additionally, the correlation analysis revealed that the soil heavy metal concentrations (As, Cd, Co, Mn, and Zn) and pH were positively correlated with the MAOC/POC ratio (Figure 8).
Regarding the combined effect of all significant variables (road density, concentration of heavy metals, and soil solution conductivity) on carbon storage in soil physical fractions at the 0–15 cm soil depth, the best multiple regression model for MAOC fraction indicated a significant and positive relationship between carbon storage in the MAOC fraction and road density. In contrast, no significant relationship was found for heavy metal concentration and soil solution conductivity. However, the multiple regression model for carbon storage in the POC fraction did not reveal any significant relationship between the studied soil properties and carbon content in this fraction (Table 3). Additionally, the regression analysis highlighted that Mn concentration positively impacted the ratio of MAOC/POC (Table 3). Simplified models based only on significant variables for carbon storage in MAOC (road density) and the MAOC/POC ratio (Mn concentration) yielded adjusted R2 of 0.27 and 0.57, respectively (Table 4), compared with adjusted R2 of 0.29 and 0.60 for the full models.

4. Discussion

Roadsides and other transportation-related green spaces are ubiquitous in urban environments due to the important area occupied by road infrastructures, but the ecological and environmental role of these ecosystems is not well understood and integrated into urban planning [4]. This study assessed the carbon stability in soil physical fractions of roadside ecosystems and examined the effect of roadside characteristics, such as road density and soil physicochemical properties, on this stability. It revealed that while road density, used as a proxy for traffic, disturbance, and pollution from transportation and road maintenance, varied across the different land uses of roadsides (i.e., agricultural land (active or abandoned), forest or right-of-way), there was no significant difference in soil physical fraction carbon content between these land uses. However, we observed significant variations in soil fraction carbon content at different soil depths, with high carbon content in the stable fraction compared to the labile fraction. Furthermore, a strong correlation was found between soil properties and road density in roadside ecosystems. The multiple linear regression model showed that road density was the best predictor of soil carbon content in the stable MAOC fraction at 0–15 cm of soil depth. This suggests that road density can impact the soil properties of the surrounding environment; these properties, in turn, play an important role in determining the physical stability of carbon in soil fractions. The history of land use of the roadsides (rather than their current land use) likely helps explain their soil carbon physical stability.

4.1. Carbon Storage in Soil Physical Fractions Across Roadside Land Uses

This study found that road density (in m of road per km2 of land) within a 1 km radius of roadsides varied depending on the land use of the roadside, with a higher density in areas classified as road rights-of-way and a lower density in areas classified as abandoned agricultural lands and forests. This could be attributed to the need for road safety in rights-of-way. Roads constructed in these areas may require more lanes to ensure safer driving conditions [37]. Additionally, road maintenance and construction activities require a high length of area to be easily accessed, which may increase the density of roads in these areas compared to sites classified as abandoned agricultural lands or forests.
However, this analysis indicated no significant variation in the amount of carbon of soil fractions across different land use types, in contrast to previous studies in which land use influenced soil fraction carbon stability. A study of the impact of land use change on soil organic carbon stocks and soil fractions in Europe revealed that following the afforestation of grasslands, there was an increase in carbon storage in the POC soil fraction [38]. Additionally, Sainepo et al. [39] found a significant difference in carbon content in MAOC and POC between land use types: they showed that shrublands contain more carbon in POC and in MAOC soil fractions than grasslands due to the low rate of disturbance in this area and the higher quantity and quality of litter input, increasing organic matter input, particularly in the POC fraction in topsoil [40]. The absence of a land use effect in results may be partly attributed to the fact that the soil texture on the roadsides did not show any significant differences between different types of land use.
Moreover, most of the ecosystems in this study have a somewhat similar recent history (i.e., <40 years) of having developed from agricultural land [41]. Roadsides with different land uses in this study were previously found to have significantly different vegetation structures and aboveground carbon stocks (roadsides classified as forests having higher carbon stocks) but somewhat similar mineral soil carbon content [7]. Roadsides classified as rights-of-way had the highest road density, but also had low tree cover and aboveground carbon stocks, and vegetation dominated by herbaceous species [7]. This may have acted as a confounding factor in our study, as the quantity and quality of carbon inputs into soils (e.g., litterfall) can influence both MAOC content and decomposition rate [42]. Interestingly, roadsides for which agriculture was abandoned further in the past, or which have been classified as forests since at least 1975, showed a lower MAOC/POC ratio than roadsides that were more recently converted from agriculture (irrespective of the current land use), suggesting that the dynamics of carbon fractions vary with the history of land use.
Yet, soil depth played a significant role in carbon storage in soil fractions. There was a general decrease in carbon storage in both soil fractions as soil depth increased, with higher carbon storage in the MAOC fraction compared to the POC. This aligns with the study of Schrumpf et al. [43] in European soils that evaluated the effect of soil depth on carbon fractions under different types of vegetation and land use. They found that the decrease in the mineralization rate due to the binding of organic carbon to the minerals in deep soil leads to an increase in the stability of carbon and the residence time with increased soil depth. The high carbon stocks in MAOC fraction found in roadside ecosystems might be attributed to human activity that disturbs the soil and increases organic matter–mineral compound interactions. Microbial activity can be lower in sites near roads compared to more protected areas [44], leading to slower decomposition of organic matter and higher carbon stability in these soils [40]. Indeed, this trend was more pronounced in rights-of-way areas exposed to high road density. While no direct measurements of microbial communities or decomposition rates were taken, this is a potential path that could explain the significant distribution of carbon storage in the stable fraction MAOC compared to the labile fraction POC.

4.2. Relationships Between Road Density and Physicochemical Soil Properties

Road density was associated with increased soil concentration of copper (Cu). Heightened atmospheric Cu deposition from traffic emissions has been observed on sites designated as road rights-of-way [45]. We also found that soil solution conductivity (a proxy for soil salinity) at depths between 15 and 35 cm significantly correlated with road density. Human activities such as road maintenance, development, fertilizer use, and drainage practices can significantly impact the salinity levels in the soil at varying depths [46]. In addition, soil near roads can accumulate salt due to surface runoff, resulting in higher soil salinity in the road rights-of-way compared to other locations. Various factors, such as soil characteristics, porosity, and permeability, can drive the concentration of ions to deeper layers [47]. Additionally, the physical characteristics of the roadside can alter the hydrological process of the soil, leading to reduced permeability and increased soil compaction, which can contribute to salt accumulation in soil due to evapo-concentration [47]. Furthermore, previous research has shown that roadside areas have more pores, which could affect and increase leaching, facilitating leaching and increasing salt transport to deeper depths [48]. These findings can explain the positive relationship between road density and the 15–35 cm salinity level of roadside soils.

4.3. Relationship Between Carbon Stock in Soil Fractions and Physicochemical Soil Properties

Regarding specific heavy metals, Cu, zinc (Zn), manganese (Mn), and chromium (Cr) were positively associated with the amount of carbon in the MAOC soil fraction, suggesting that this fraction plays a role in retaining heavy metals. Studies have shown that the size of soil aggregates plays a role in heavy metal distribution and concentration; as the soil fraction size increases, the concentration of heavy metals decreases [19,49,50,51]. Indeed, the carbon storage found in the MAOC fraction (<53 µm) of roadside soils was higher than that in POC (>53 µm). Research by Xu et al. [52] revealed high concentrations of Cu and Cd in the soil fraction < 53 µm, possibly due to heavy metal adsorption to the surface area. Similar results were reported by Xiao et al. [51], who found that heavy metal distribution was influenced by soil fractionation. In addition, the concentration of heavy metals (Co, Cr, Cu, Pb, and Zn) has been correlated with the amount of carbon in mineral-associated fraction and occluded light fraction [21]; this was due to the interaction between metal and organic matter and the formation of complex metal–organic ligands. Interestingly, the Pb concentration measured in roadside soils was positively correlated to the carbon content of the POC fraction, suggesting that this metal was preferentially linked to the labile soil fraction.
Limited studies have been conducted to evaluate the long-term effects of organo–metal complex stability, as extensive experimentation is required [19]. However, the immobilization of heavy metals can be reversible, making them available for uptake by microorganisms and plants in natural conditions [53]. As soil organic matter degrades over time, heavy metals that were once immobilized in the soil become more bioavailable and can be absorbed by plants [54]. Additionally, the ability of soil to release immobilized heavy metals is influenced by environmental factors such as pH and redox potential, which can have long-term effects on the release of immobilized metals [19]. Overall, the studied roadsides had low levels of heavy metals and showed no signs of contamination; the range of heavy metal concentrations was similar to that measured in non-roadside, relatively undisturbed forest ecosystems of southern Quebec (Table 5). In fact, all measured heavy metal concentrations were below the typical background values of soils from the geological provinces of the study sites, and well below threshold values for ecotoxicological risk to ecosystems according to Quebec provincial criteria [31].
This analysis also revealed a significant positive relationship between MAOC fraction carbon storage and soil salinity. The soil salinity of studied roadsides was classified as moderate according to Quebec provincial criteria and was higher than the range of values observed in control forest ecosystems (Table 5). Several studies have shown that salinity could affect carbon content in soil fractions, possibly due to the decrease in organic matter decomposition rates caused by a reduction in soil microorganism activity that results from soil salinization. For example, She et al. [26] highlighted that increased soil salinity can impact the decomposition of organic matter in the stable carbon fraction and thus reduce carbon dioxide emissions. Soil salinity can also decrease the osmotic potential and reduce the biomass and activity of microorganisms (bacteria and fungi) [55]. Indeed, studies have reported a negative relationship between soil salinity and CO2 emission, particularly in soils with low soil salt levels [56,57]. Additionally, Setia et al. [56] observed that the effects of salinity on carbon decomposition depend on the type of salt used, such as KCl or NaCl, which we could not evaluate in this study. Studies about soil microbial communities in roadside ecosystems would be needed to confirm whether microbial activity and processes (such as decomposition) are significantly impacted by the observed soil salinity levels and whether this is a driver of carbon accumulation in the MAOC fraction.
Results showed that soil pH positively affected the soil carbon content of the stable fraction. When soil pH levels increase, it can reduce microorganism activity and soil respiration rates, ultimately affecting the decomposition of organic matter and increasing soil carbon stability [58], as observed in the MAOC fraction of right-of-way sites. Additionally, Kupka and Gruba [59] have shown that the sorption of dissolved organic matter increases with pH, which can be attributed to the increase in exchangeable Ca2+ at pH > 5. The presence of calcium at high pH can effectively decrease the solubility of organic matter by creating a bridge while also promoting the stability of organic matter through Van der Waals forces. This may explain the consistent trend observed in this study, where higher pH levels in right-of-way sites had higher carbon soil content in the MAOC fraction.
The observational nature of our experimental design limits the causal inferences that can be drawn from this study, as other factors, such as site management, vegetation composition, etc., may have confounding effects on soil carbon and stability. Moreover, the relationships between soil carbon fractions and physical soil parameters, such as porosity and hydraulic conductivity, have not been explored, although the latter are often impacted by urban management [60] and have been found to influence carbon stabilization processes [61]. Yet, according to the multiple regression analysis, the road density of studied sites was the best predictor for carbon storage in the MAOC soil fraction at a depth of 0–15 cm. The soil concentration of some heavy metals (Cu, Mn, and Zn), while correlated with MAOC in bivariate analyses, did not provide any significant explanatory value to it, suggesting that their effects on MAOC carbon storage might act in a non-linear or interactive way or are confounded by road density. Moreover, findings indicated a positive relationship between the road density and the concentration of heavy metals and salinity in the soil, suggesting that the soil physicochemical properties of the roadside could influence carbon storage in a stable form while simultaneously reducing their leaching into the soil.

5. Conclusions

This study evaluated the stability of soil carbon in physical fractions of roadside ecosystems and investigated the effects of road density and physicochemical soil properties on this stability. Road density was revealed as an important predictor of the amount of soil carbon in the stable fraction (MAOC) of these ecosystems. Although the exact ecological processes that may explain these results have not been investigated, the impacts of transportation and road maintenance activities (for which road density can be seen as a proxy) on soil heavy metal concentrations and salinity are thought to be involved; interactions with land use, vegetation management, and development are also possible.
Roadside ecosystems are an integral part of urban areas that can, if properly managed, provide ecosystem services and benefits to populations; there is, however, a need to understand the specific ecological properties of these ecosystems so that they be incorporated into urban planning. The findings of this study revealed that roadside soils (studied down to 55 cm in depth) contained 66% of carbon in the stable fraction (MAOC), while 34% of carbon was found in the labile fraction (POC). Most of the carbon stored in roadside soil is stable, making it more resistant to decomposition and disturbance. This suggests that roadside ecosystems, even though they are subjected to anthropogenic pressure, can act as stable soil carbon reservoirs, which can contribute to the regulation of carbon fluxes.
Interestingly, road characteristics such as road density, heavy metals, and salt contamination did not negatively impact stable soil carbon. Instead, heavy metals and salt appeared to preferentially associate with the stable fraction (MAOC) of soil organic matter. Therefore, soil organic matter seems crucial in immobilizing heavy metals and preventing their leaching. Further studies could help better understand the long-term impact of complex organo-minerals on the environment and how the degradation of organic matter could contribute to the remobilization of heavy metals. Furthermore, these results emphasize the importance of protecting the upper soil layers of roadside ecosystems because this is where the highest stocks of the more stable soil fraction are found, and this fraction might help to limit heavy metal pollution in surrounding ecosystems. In urban management, these ecosystems thus have the potential to serve as both carbon stores and environmental buffers for more sensitive areas.
However, while the study sites were located in and around the most urbanized area of the province of Quebec, most sites have a recent history of agricultural use and/or are classified as forests. It would be interesting to evaluate if roadside ecosystems with different histories and overall levels of anthropogenic pressure may experience more profound and lasting alterations that would necessitate more concerted efforts of ecological restoration.

Author Contributions

Conceptualization, N.S., E.T. and J.-F.B.; methodology, N.S. and E.T.; formal analysis, N.S.; writing—original draft preparation, N.S.; writing—review and editing, N.S., E.T. and J.-F.B.; project administration, E.T.; funding acquisition, E.T. All authors have read and agreed to the published version of the manuscript.

Funding

This research was funded by the Quebec Ministry of Transportation (Research project R 833.1; PI: E. Thiffault) and by a NSERC Discovery grant to E. Thiffault (RGPIN-2018-05755).

Data Availability Statement

The data of this study are available at https://doi.org/10.6084/m9.figshare.24904611.v3.

Acknowledgments

The authors thank the Quebec Ministry of Transportation for its financial support; the Forestry Education and Research Center of Sainte-Foy (CERFO) for site identification and documentation; and the members of Team Carbone at Université Laval. Special thanks to David Rivest and Alain Paquette for contributing to the overall project.

Conflicts of Interest

The authors declare no conflicts of interest. The funders had no role in the design of the study; in the collection, analyses, or interpretation of data; in the writing of the manuscript; or in the decision to publish the results.

References

  1. Friedlingstein, P.; O’Sullivan, M.; Jones, M.W.; Andrew, R.M.; Gregor, L.; Hauck, J.; Le Quéré, C.; Luijkx, I.T.; Olsen, A.; Peters, G.P.; et al. Global Carbon Budget 2022. Earth Syst. Sci. Data 2022, 14, 4811–4900. [Google Scholar] [CrossRef]
  2. Pouyat, R.V.; Yesilonis, I.D.; Nowak, D.J. Carbon Storage by Urban Soils in the United States. J. Environ. Qual. 2006, 35, 1566–1575. [Google Scholar] [CrossRef]
  3. Rupprecht, C.D.D.; Byrne, J.A. Informal Urban Green-Space: Comparison of Quantity and Characteristics in Brisbane, Australia and Sapporo, Japan. PLoS ONE 2014, 9, e99784. [Google Scholar] [CrossRef]
  4. Skaldina, O.; Nylund, A.; Ramula, S. Neglected Puzzle Pieces of Urban Green Infrastructure: Richness, Cover, and Composition of Insect-Pollinated Plants in Traffic-Related Green Spaces. Landsc. Ecol. 2024, 39, 80. [Google Scholar] [CrossRef]
  5. Säumel, I.; Weber, F.; Kowarik, I. Toward Livable and Healthy Urban Streets: Roadside Vegetation Provides Ecosystem Services Where People Live and Move. Environ. Sci. Policy 2016, 62, 24–33. [Google Scholar] [CrossRef]
  6. Steinfeld, D.E.; Riley, S.A.; Wilkinson, K.M.; Landis, T.D.; Riley, L.E. A Manager’s Guide to Roadside Revegetation Using Native Plants; Umatilla National Forest (Agency: U.S.), Ed.; Federal Highway Administration, Western Federal Lands Highway Division: Washington, DC, USA, 2007.
  7. Srour, N.; Thiffault, E.; Boucher, J.-F. Quantifying Carbon Stocks and Functional Diversity of Roadside Ecosystems—A Case Study in Quebec, Canada. Urban For. Urban Green. 2024, 91, 128163. [Google Scholar] [CrossRef]
  8. Gaston, K.J.; Ávila-Jiménez, M.L.; Edmondson, J.L. REVIEW: Managing Urban Ecosystems for Goods and Services. J. Appl. Ecol. 2013, 50, 830–840. [Google Scholar] [CrossRef]
  9. Jastrow, J.D.; Amonette, J.E.; Bailey, V.L. Mechanisms Controlling Soil Carbon Turnover and Their Potential Application for Enhancing Carbon Sequestration. Clim. Chang. 2007, 80, 5–23. [Google Scholar] [CrossRef]
  10. Von Lützow, M.; Kögel-Knabner, I.; Ludwig, B.; Matzner, E.; Flessa, H.; Ekschmitt, K.; Guggenberger, G.; Marschner, B.; Kalbitz, K. Stabilization Mechanisms of Organic Matter in Four Temperate Soils: Development and Application of a Conceptual Model. J. Plant Nutr. Soil Sci. 2008, 171, 111–124. [Google Scholar] [CrossRef]
  11. Angst, G.; Mueller, C.W.; Prater, I.; Angst, Š.; Frouz, J.; Jílková, V.; Peterse, F.; Nierop, K.G.J. Earthworms Act as Biochemical Reactors to Convert Labile Plant Compounds into Stabilized Soil Microbial Necromass. Commun. Biol. 2019, 2, 441. [Google Scholar] [CrossRef] [PubMed]
  12. Lavallee, J.M.; Soong, J.L.; Cotrufo, M.F. Conceptualizing Soil Organic Matter into Particulate and Mineral-Associated Forms to Address Global Change in the 21st Century. Glob. Chang. Biol. 2020, 26, 261–273. [Google Scholar] [CrossRef] [PubMed]
  13. Carter, M.; Angers, D.; Gregorich, E.; Bolinder, M. Characterizing Organic Matter Retention for Surface Soils in Eastern Canada Using Density and Particle Size Fractions. Can. J. Soil Sci. 2003, 83, 11–23. [Google Scholar] [CrossRef]
  14. Saidy, A.R.; Smernik, R.J.; Baldock, J.A.; Kaiser, K.; Sanderman, J.; Macdonald, L.M. Effects of Clay Mineralogy and Hydrous Iron Oxides on Labile Organic Carbon Stabilisation. Geoderma 2012, 173–174, 104–110. [Google Scholar] [CrossRef]
  15. Six, J.; Bossuyt, H.; Degryze, S.; Denef, K. A History of Research on the Link between (Micro)Aggregates, Soil Biota, and Soil Organic Matter Dynamics. Soil Tillage Res. 2004, 79, 7–31. [Google Scholar] [CrossRef]
  16. Erktan, A.; Cécillon, L.; Graf, F.; Roumet, C.; Legout, C.; Rey, F. Increase in Soil Aggregate Stability along a Mediterranean Successional Gradient in Severely Eroded Gully Bed Ecosystems: Combined Effects of Soil, Root Traits and Plant Community Characteristics. Plant Soil 2016, 398, 121–137. [Google Scholar] [CrossRef]
  17. Bronick, C.J.; Lal, R. Soil Structure and Management: A Review. Geoderma 2005, 124, 3–22. [Google Scholar] [CrossRef]
  18. Lal, R. Forest Soils and Carbon Sequestration. For. Ecol. Manag. 2005, 220, 242–258. [Google Scholar] [CrossRef]
  19. Li, Q.; Wang, Y.; Li, Y.; Li, L.; Tang, M.; Hu, W.; Chen, L.; Ai, S. Speciation of Heavy Metals in Soils and Their Immobilization at Micro-Scale Interfaces among Diverse Soil Components. Sci. Total Environ. 2022, 825, 153862. [Google Scholar] [CrossRef]
  20. Sieghardt, M.; Mursch-Radlgruber, E.; Paoletti, E.; Couenberg, E.; Dimitrakopoulus, A.; Rego, F.; Hatzistathis, A.; Randrup, T.B. The Abiotic Urban Environment: Impact of Urban Growing Conditions on Urban Vegetation. In Urban Forests and Trees: A Reference Book; Konijnendijk, C., Nilsson, K., Randrup, T., Schipperijn, J., Eds.; Springer: Berlin/Heidelberg, Germany, 2005; pp. 281–323. ISBN 978-3-540-27684-5. [Google Scholar]
  21. Lasota, J.; Błońska, E.; Łyszczarz, S.; Tibbett, M. Forest Humus Type Governs Heavy Metal Accumulation in Specific Organic Matter Fractions. Water Air Soil Pollut. 2020, 231, 80. [Google Scholar] [CrossRef]
  22. Quenea, K.; Lamy, I.; Winterton, P.; Bermond, A.; Dumat, C. Interactions between Metals and Soil Organic Matter in Various Particle Size Fractions of Soil Contaminated with Waste Water. Geoderma 2009, 149, 217–223. [Google Scholar] [CrossRef]
  23. Enya, O.; Heaney, N.; Iniama, G.; Lin, C. Effects of Heavy Metals on Organic Matter Decomposition in Inundated Soils: Microcosm Experiment and Field Examination. Sci. Total Environ. 2020, 724, 138223. [Google Scholar] [CrossRef] [PubMed]
  24. Green, S.-M.; Machin, R.; Cresser, M. Effect of Long-Term Changes in Soil Chemistry Induced by Road Salt Applications on N-Transformations in Roadside Soils. Environ. Pollut. 2008, 152, 20–31. [Google Scholar] [CrossRef]
  25. Equiza, M.A.; Calvo-Polanco, M.; Cirelli, D.; Señorans, J.; Wartenbe, M.; Saunders, C.; Zwiazek, J.J. Long-Term Impact of Road Salt (NaCl) on Soil and Urban Trees in Edmonton, Canada. Urban For. Urban Green. 2017, 21, 16–28. [Google Scholar] [CrossRef]
  26. She, R.; Yu, Y.; Ge, C.; Yao, H. Soil Texture Alters the Impact of Salinity on Carbon Mineralization. Agronomy 2021, 11, 128. [Google Scholar] [CrossRef]
  27. Cartographie du 5e Inventaire Écoforestier du Québec Méridional—Méthodes et Données Associées. Available online: https://mffp.gouv.qc.ca/nos-publications/cartographie-5e-inventaire-methodes-donnees-associees/ (accessed on 29 May 2023).
  28. National Forest Inventory. In Canada’s National Forest Inventory Ground Sampling Guidelines; Canadian National Forest Inventory Task Force: Ottawa, ON, Canada, 2008.
  29. Centre D’expertise en Analyse Environnementale du Québec, 2014 Centre D’expertise En Analyse Environnementale Du Québec. MA. 100 Ph 1.1. Détermination Du Ph: Méthode Électrométrique. Édition—PDF Free Download. Available online: https://docplayer.fr/32257992-Centre-d-expertise-en-analyse-environnementale-du-quebec-ma-100-ph-1-1-determination-du-ph-methode-electrometrique-edition.html (accessed on 18 June 2023).
  30. Carter, M.R.; Gregorich, E.G. (Eds.) Soil Sampling and Methods of Analysis, 2nd ed.; CRC Press: Boca Raton, FL, USA, 2007; ISBN 978-0-429-12622-2. [Google Scholar]
  31. Beaulieu, M. 2021 Guide d’intervention—Protection des sols et Réhabilitation des Terrains Contaminés; Ministère de l’Environnement et de la Lutte Contre les Changements Climatiques: Quebec City, QC, Canada, 2021.
  32. Hakanson, L. An Ecological Risk Index for Aquatic Pollution Control.a Sedimentological Approach. Water Res. 1980, 14, 975–1001. [Google Scholar] [CrossRef]
  33. R Core Team. R: A Language and Environment for Statistical Computing; R Foundation for Statistical Computing: Vienna, Austria, 2021; Available online: https://cir.nii.ac.jp/crid/1570854175843385600 (accessed on 25 June 2023).
  34. Wang, N.; Guan, Q.; Sun, Y.; Wang, B.; Ma, Y.; Shao, W.; Li, H. Predicting the Spatial Pollution of Soil Heavy Metals by Using the Distance Determination Coefficient Method. Sci. Total Environ. 2021, 799, 149452. [Google Scholar] [CrossRef] [PubMed]
  35. Fang, S.; Qiao, Y.; Yin, C.; Yang, X.; Li, N. Characterizing the Physical and Demographic Variables Associated with Heavy Metal Distribution along Urban-Rural Gradient. Environ. Monit. Assess. 2015, 187, 570. [Google Scholar] [CrossRef]
  36. James, G.; Witten, D.; Hastie, T.; Tibshirani, R. An Introduction to Statistical Learning: With Applications in R; Springer Texts in Statistics; Springer: New York, NY, USA, 2021; ISBN 978-1-07-161417-4. [Google Scholar]
  37. O’Sullivan, O.S.; Holt, A.R.; Warren, P.H.; Evans, K.L. Optimising UK Urban Road Verge Contributions to Biodiversity and Ecosystem Services with Cost-Effective Management. J. Environ. Manag. 2017, 191, 162–171. [Google Scholar] [CrossRef]
  38. Poeplau, C.; Don, A. Sensitivity of Soil Organic Carbon Stocks and Fractions to Different Land-Use Changes across Europe. Geoderma 2013, 192, 189–201. [Google Scholar] [CrossRef]
  39. Sainepo, B.M.; Gachene, C.K.; Karuma, A. Assessment of Soil Organic Carbon Fractions and Carbon Management Index under Different Land Use Types in Olesharo Catchment, Narok County, Kenya. Carbon Balance Manag. 2018, 13, 4. [Google Scholar] [CrossRef]
  40. Laik, R.; Kumar, K.; Das, D.K.; Chaturvedi, O.P. Labile Soil Organic Matter Pools in a Calciorthent after 18 Years of Afforestation by Different Plantations. Appl. Soil Ecol. 2009, 42, 71–78. [Google Scholar] [CrossRef]
  41. Srour, N.; Thiffault, E.; Boucher, J.-F. Exploring the Potential of Roadside Plantation for Carbon Sequestration Using Simulation in Southern Quebec, Canada. Forests 2024, 15, 264. [Google Scholar] [CrossRef]
  42. Zhang, F.; Chen, X.; Yao, S.; Ye, Y.; Zhang, B. Responses of Soil Mineral-Associated and Particulate Organic Carbon to Carbon Input: A Meta-Analysis. Sci. Total Environ. 2022, 829, 154626. [Google Scholar] [CrossRef]
  43. Schrumpf, M.; Kaiser, K.; Guggenberger, G.; Persson, T.; Kögel-Knabner, I.; Schulze, E.-D. Storage and Stability of Organic Carbon in Soils as Related to Depth, Occlusion within Aggregates, and Attachment to Minerals. Biogeosciences 2013, 10, 1675–1691. [Google Scholar] [CrossRef]
  44. Papa, S.; Bartoli, G.; Pellegrino, A.; Fioretto, A. Microbial Activities and Trace Element Contents in an Urban Soil. Environ. Monit. Assess. 2010, 165, 193–203. [Google Scholar] [CrossRef] [PubMed]
  45. Gunawardena, J.; Ziyath, A.M.; Egodawatta, P.; Ayoko, G.A.; Goonetilleke, A. Sources and Transport Pathways of Common Heavy Metals to Urban Road Surfaces. Ecol. Eng. 2015, 77, 98–102. [Google Scholar] [CrossRef]
  46. Das, R.S.; Rahman, M.; Sufian, N.P.; Rahman, S.M.A.; Siddique, M.A.M. Assessment of Soil Salinity in the Accreted and Non-Accreted Land and Its Implication on the Agricultural Aspects of the Noakhali Coastal Region, Bangladesh. Heliyon 2020, 6, e04926. [Google Scholar] [CrossRef] [PubMed]
  47. Shannon, T.P.; Ahler, S.J.; Mathers, A.; Ziter, C.D.; Dugan, H.A. Road Salt Impact on Soil Electrical Conductivity across an Urban Landscape. J. Urban Ecol. 2020, 6, juaa006. [Google Scholar] [CrossRef]
  48. Zeng, S.-L.; Zhang, T.-T.; Gao, Y.; Li, B.; Fang, C.-M.; Flory, S.L.; Zhao, B. Road Effects on Vegetation Composition in a Saline Environment. J. Plant Ecol. 2012, 5, 206–218. [Google Scholar] [CrossRef]
  49. Gong, C.; Ma, L.; Cheng, H.; Liu, Y.; Xu, D.; Li, B.; Liu, F.; Ren, Y.; Liu, Z.; Zhao, C.; et al. Characterization of the Particle Size Fraction Associated Heavy Metals in Tropical Arable Soils from Hainan Island, China. J. Geochem. Explor. 2014, 139, 109–114. [Google Scholar] [CrossRef]
  50. Huang, B.; Li, Z.; Huang, J.; Guo, L.; Nie, X.; Wang, Y.; Zhang, Y.; Zeng, G. Adsorption Characteristics of Cu and Zn onto Various Size Fractions of Aggregates from Red Paddy Soil. J. Hazard. Mater. 2014, 264, 176–183. [Google Scholar] [CrossRef] [PubMed]
  51. Xiao, R.; Zhang, M.; Yao, X.; Ma, Z.; Yu, F.; Bai, J. Heavy Metal Distribution in Different Soil Aggregate Size Classes from Restored Brackish Marsh, Oil Exploitation Zone, and Tidal Mud Flat of the Yellow River Delta. J. Soils Sediments 2016, 16, 821–830. [Google Scholar] [CrossRef]
  52. Xu, L.; Cui, H.; Zheng, X.; Zhou, J.; Zhang, W.; Liang, J.; Zhou, J. Changes in the Heavy Metal Distributions in Whole Soil and Aggregates Affected by the Application of Alkaline Materials and Phytoremediation. RSC Adv. 2017, 7, 41033–41042. [Google Scholar] [CrossRef]
  53. Bolan, N.; Kunhikrishnan, A.; Thangarajan, R.; Kumpiene, J.; Park, J.; Makino, T.; Kirkham, M.B.; Scheckel, K. Remediation of Heavy Metal(Loid)s Contaminated Soils--to Mobilize or to Immobilize? J. Hazard. Mater. 2014, 266, 141–166. [Google Scholar] [CrossRef]
  54. Stefanowicz, A.M.; Kapusta, P.; Zubek, S.; Stanek, M.; Woch, M.W. Soil Organic Matter Prevails over Heavy Metal Pollution and Vegetation as a Factor Shaping Soil Microbial Communities at Historical Zn–Pb Mining Sites. Chemosphere 2020, 240, 124922. [Google Scholar] [CrossRef]
  55. Rath, K.M.; Rousk, J. Salt Effects on the Soil Microbial Decomposer Community and Their Role in Organic Carbon Cycling: A Review. Soil Biol. Biochem. 2015, 81, 108–123. [Google Scholar] [CrossRef]
  56. Setia, R.; Marschner, P.; Baldock, J.; Chittleborough, D.; Verma, V. Relationships between Carbon Dioxide Emission and Soil Properties in Salt-Affected Landscapes. Soil Biol. Biochem. 2011, 43, 667–674. [Google Scholar] [CrossRef]
  57. Zhang, L.; Song, L.; Wang, B.; Shao, H.; Zhang, L.; Qin, X. Co-Effects of Salinity and Moisture on CO2 and N2O Emissions of Laboratory-Incubated Salt-Affected Soils from Different Vegetation Types. Geoderma 2018, 332, 109–120. [Google Scholar] [CrossRef]
  58. Caravaca, F.; Lozano, Z.; Rodríguez-Caballero, G.; Roldán, A. Spatial Shifts in Soil Microbial Activity and Degradation of Pasture Cover Caused by Prolonged Exposure to Cement Dust. Land Degrad. Dev. 2017, 28, 1329–1335. [Google Scholar] [CrossRef]
  59. Kupka, D.; Gruba, P. Effect of PH on the Sorption of Dissolved Organic Carbon Derived from Six Tree Species in Forest Soils. Ecol. Indic. 2022, 140, 108975. [Google Scholar] [CrossRef]
  60. Chen, Y.; Day, S.D.; Wick, A.F.; McGuire, K.J. Influence of Urban Land Development and Subsequent Soil Rehabilitation on Soil Aggregates, Carbon, and Hydraulic Conductivity. Sci. Total Environ. 2014, 494–495, 329–336. [Google Scholar] [CrossRef]
  61. Bailey, V.L.; Pries, C.H.; Lajtha, K. What Do We Know about Soil Carbon Destabilization? Environ. Res. Lett. 2019, 14, 083004. [Google Scholar] [CrossRef]
Figure 1. Location of study sectors within the bioclimatic domains of Quebec.
Urbansci 09 00090 g001
Figure 2. Road density (m km−2) across different land use types. **** p < 0.0001; *** p < 0.001.
Urbansci 09 00090 g002
Figure 3. Soil carbon stocks in the mineral-associated organic carbon fraction (MAOC) and particulate organic carbon fraction (POC) at different soil depths and for land uses.
Urbansci 09 00090 g003
Figure 4. Soil carbon stocks in the mineral-associated organic carbon fraction (MAOC) and particulate organic carbon fraction (POC) at different soil depths across all roadsides (n = 23 sites). **** p < 0.0001; ** p < 0.01.
Urbansci 09 00090 g004
Figure 5. Ratio of total carbon soil carbon stocks (all depths) in the mineral-associated organic carbon fraction (MAOC) on the particulate organic carbon fraction (POC) (MAOC/POC ratio) according to the approximate year of agricultural abandonment on roadsides (n = 23 sites). Roadsides continuously classified as forests since 1975 are included in the 1975 category. ** p < 0.01; * p < 0.05.
Urbansci 09 00090 g005
Figure 6. Box plots for contamination factor (CF) of heavy metals (As, Cd, Co, Cr, Cu, Mn, Pb, Zn) in soils from roadsides (0–15 cm depth) with different land uses. CF < 1 indicates low soil contamination; 1 < CF < 3 indicates moderate soil contamination, and 3 < CF < 6 indicates high soil contamination.
Urbansci 09 00090 g006
Figure 7. Pearson correlation (R) between road density, soil heavy metal concentration, soil solution conductivity, pH, and the amount of carbon present in stable fraction MAOC and labile fraction POC (0–15 cm depth). p < 0.05 refers to a significant correlation.
Urbansci 09 00090 g007
Figure 8. Pearson correlation (R) between soil properties and the ratio of MAOC/POC (0–15 cm depth). Only significant correlations with a p-value < 0.05 are shown.
Urbansci 09 00090 g008
Table 1. Means and standard error of studied soil parameters (heavy metals, soil solution conductivity, pH) and p-value (Kruskal–Wallis test) between different land uses (AAL: abandoned agricultural land, AL: agricultural land, forest, and ROW: right-of-way). n indicates the number of sites in each land use. ** p < 0.01; * p < 0.05.
Soil ParametersAAL (n = 9)AL (n = 2)Forest (n = 30)ROW (n = 9)p-Value (Kruskal–Wallis)
MeanSDMeanSDMeanSDMeanSD
As 0–15 cm (ppm)3.090.362.070.342.060.252.280.320.03 *
Cd 0–15 cm (ppm)1.230.100.770.191.000.110.930.020.12
Co 0–15 cm (ppm)8.320.694.691.695.571.116.220.300.05
Cr 0–15 cm (ppm)21.911.3715.838.0417.242.8819.001.440.19
Cu 0–15 cm (ppm)14.481.558.003.449.861.3316.421.270.01 **
Mn 0–15 cm (ppm)380.1444.17154.4863.06305.3690.64332.7143.210.06
Pb 0–15 cm (ppm)12.811.374.980.7120.552.4814.091.190.04 *
Zn 0–15 cm (ppm)52.653.4126.167.5239.725.3947.233.400.11
Conductivity 0–15 cm
(mS cm−1)
0.840.070.550.080.640.060.920.090.03 *
Conductivity 15–35 cm
(mS cm−1)
0.490.080.170.040.370.080.800.100.00 **
Conductivity 35–55 cm
(mS cm−1)
0.360.040.200.090.280.040.460.180.30
pHwater 0–15 cm5.160.175.130.024.600.166.520.530.01 **
pHwater 15–35 cm5.470.185.160.235.160.157.180.340.00 **
pHwater 35–55 cm5.700.235.480.105.430.136.170.470.40
Table 2. Pearson correlation between road density and soil parameters. **** p < 0.0001; ** p < 0.01; * p < 0.05.
Soil ParametersPearson Correlation Coefficient
As (0–15 cm)0.13
Cd (0–15 cm)−0.15
Co (0–15 cm)0.02
Cr (0–15 cm)0.05
Cu (0–15 cm)0.33 *
Mn (0–15 cm)0.048
Pb (0–15 cm)−0.10
Zn (0–15 cm)0.07
Conductivity (0–15 cm)0.27
Conductivity (15–35 cm)0.51 **
Conductivity (35–55 cm)0.10
pH (0–15 cm)0.69 ****
pH (15–35 cm)0.76 ****
pH (35–55 cm)0.27
Table 3. Multiple regression analysis between soil parameters and carbon storage in MAOC, POC, and the ratio MAOC/POC (0–15 cm depth). The values enclosed in parentheses represent the standard error. n = number of samples. *** p < 0.001; ** p < 0.01; * p < 0.05.
MAOC ModelPOC ModelRatio MAOC/POC Model
(Intercept)26.90 ***(Intercept)17.38 ***(Intercept)1.87 ***
(1.90) (1.34) (0.16)
Road density5.53 *Cd−1.12As0.32
(2.55) (1.84) (0.23)
Cu−1.15Mn−2.90Mn1.09 **
(3.71) (1.97) (0.36)
Zn3.40Pb2.49Zn−0.16
(23.12) (1.50) (0.23)
Mn−0.25 pH−0.36
(3.69) (0.26)
Conductivity2.36
(2.64)
n23n23n23
R20.45R20.43R20.67
Adjusted R20.29Adjusted R20.34Adjusted R20.60
Table 4. Simplified model of the multiple regression analysis between soil parameters and carbon storage in MAOC and the ratio MAOC/POC (0–15 cm depth). The values enclosed in parentheses represent the standard error. n = number of samples. *** p < 0.001; ** p < 0.01.
MAOC Simplified ModelRatio MAOC/POC Simplified Model
(Intercept)26.09 ***(Intercept)1.87 ***
(1.93) (0.16)
Road density5.98 **Mn0.93 ***
(1.97) (0.17)
n23n23
R20.30R20.59
Adjusted R20.27Adjusted R20.57
Table 5. Means and standard error of heavy metal concentration, soil solution conductivity, and pH of mineral soil horizons at the 0–15 cm depth from natural forest ecosystems of southern Quebec. n = 12.
MeanSD
As (ppm)3.372.77
Cd (ppm)0.850.34
Co (ppm)2.731.96
Cr (ppm)23.2819.43
Cu (ppm)6.274.75
Mn (ppm)165.97182.9
Pb (ppm)22.998.71
Zn (ppm)23.2217.18
Conductivity (mS cm−1)0.080.03
pHwater4.070.22
Disclaimer/Publisher’s Note: The statements, opinions and data contained in all publications are solely those of the individual author(s) and contributor(s) and not of MDPI and/or the editor(s). MDPI and/or the editor(s) disclaim responsibility for any injury to people or property resulting from any ideas, methods, instructions or products referred to in the content.

