Article

Year-Round Activity Patterns of Badgers (Meles meles) and Mesocarnivore Communities in Urban and Sub-Urban Areas

by
Francesco Bisi
*,†,
Pietro Grespan
,
Claudia Tranquillo
,
Adriano Martinoli
,
Lucas Armand Wauters
and
Damiano Giovanni Preatoni
Environment Analysis and Management Unit, Guido Tosi Research Group, Department of Theoretical and Applied Sciences, University of Insubria, Via J. H. Dunant, 3, 21100 Varese, Italy
*
Author to whom correspondence should be addressed.
These authors contributed equally to this work.
Urban Sci. 2025, 9(11), 453; https://doi.org/10.3390/urbansci9110453 (registering DOI)
Submission received: 2 September 2025 / Revised: 25 September 2025 / Accepted: 29 October 2025 / Published: 1 November 2025

Abstract

Urbanisation exerts profound effects on biodiversity, driving species extinctions while promoting behavioural adaptations in generalist taxa. The European badger (Meles meles) exemplifies such adaptability, exploiting anthropogenic resources and modifying activity rhythms. This study assessed badger activity within the Varese province in northern Italy, comparing an urban park and a sub-urban landscape. From August 2023 to August 2024, camera traps recorded badgers and sympatric mesocarnivores, including red foxes (Vulpes vulpes), domestic cats (Felis catus), and beech martens (Martes foina). Despite high activity overlap between sites (∆ = 0.87), the Mardia–Watson–Wheeler test revealed significant differences. Urban badgers displayed heightened nocturnality relative to sub-urban individuals, consistent with comparisons to nearby protected natural areas. This pattern indicates anthropogenic disturbance as a driver of temporal adjustment. Urban badgers are active from 18:00 to 07:00, whereas sub-urban badgers are active from 17:00 to 08:00. The later onset and earlier termination of urban activity suggest behavioural avoidance of human presence. Red foxes exhibited even greater nocturnality in urban settings, while domestic cats were primarily crepuscular and less frequently detected, particularly in sub-urban areas. Results underline the ecological plasticity of badgers, highlighting their capacity to accommodate urban pressures and providing city administrations with information to improve park management planning.

Graphical Abstract

1. Introduction

Nowadays, 75% of the European human population lives in cities [1] and the trend is expected to increase in the future [2]. This large-scale urbanisation is one of the most important drivers causing biodiversity loss [3]. In this context, many species go extinct [4,5], while others adapt, modifying their activity patterns, their habits, and more generally their behaviour [6,7,8]. Urban development accelerates extinction rates at local levels and often leads to the loss of native species [9,10]. Overall, urbanisation is one of the fastest and most persistent human threats for biodiversity [9]. Within cities, urbanisation usually reduces both species richness and evenness [11] and alters the species composition of biotic communities. As a consequence, biological communities in cities are often dissimilar to surrounding ones, as urban species are reshuffled into novel “urban” communities [11,12]. Although diversity, as previously mentioned, decreases with development, some mammals take advantage of favourable conditions within the urban matrix. In general, urban vertebrates are often generalists that can exploit a wide variety of habitats, including those altered by human activities [13,14].
Depending on the structure of cities within the urban matrix, it is possible to find green spaces such as small woodlands, public parks, and private gardens that can contribute to shaping fauna community [15]. For animals and especially mammals, these green patches are important for them to thrive in cities [16].
The mammalian species living in these green spots are termed urban adapters [9]. Urban adapters are often generalist and, in non-urban areas, they commonly thrive on edges. These animals exploit many food sources, including human-subsidised foods, such as cultivated plants and garbage [9]. Common urban-adapted mammals include burrowing species, which can find refuge in their burrows beneath porches and houses [17].
Many medium-sized carnivores, like red fox (Vulpes vulpes), coyote (Canis latrans) and European badger (Meles meles), that consume a wide variety of prey and can also forage on human-subsidised food supplies [18], have remarkable success in the city. Sometimes, their presence is also favoured by the absence of potential predators [9,18,19].
The red fox, one of the most adaptable carnivores, is very common in cities all around the world [20] and among the first to dwell in urban habitats. Besides red foxes, badger populations have become a stable presence in urban environments in recent decades and, in the near future, they are expected be a permanent element of urban areas [21]. Badgers exhibit high flexibility in diet, home range size and social organisation, territorial behaviour, and dispersal. Once they settle in urban environments, these attributes facilitate coexistence with humans [22]. Badgers that live in the city tend to expand their diet range to include anthropogenic food sources, which are often more abundant than natural food sources (e.g., refuse and garden crops) and use a variety of sites for denning [23]. However, urban areas also produce new challenges; for example, roads contribute to habitat fragmentation [24] and road accidents have been listed as a major cause of mortality, and an estimated 50,000 badgers are believed to die on British roads each year [20]. Furthermore, with their digging and foraging activities, badgers can come into conflict with people [25].
To adapt to urban environments, mammals can also modify their activity patterns to avoid humans [26], for example, by becoming more strongly nocturnal in urbanised areas [8]. In the wild, badgers are generally nocturnal [27], and their activity may be influenced by weather factors, life cycle, and variation in food availability [28].
In the context of increasing urbanisation, we investigated whether badgers, and mesocarnivores in general, alter their activity patterns and whether these changes could lead to greater temporal overlap between species. In this study, we analysed the activity patterns of two clans (the social units of badgers consisting of several sexually mature males and females [29]), in two different sites in the Varese province (northern Italy), using camera traps. The first clan inhabits a city garden park within a heavily urbanised area, whereas the second one occupies a sub-urban area characterised by a field–urban–wood mosaic. We compared activity patterns between the two sites to evaluate the badgers’ behavioural response. Furthermore, we compared the activity patterns of the mesocarnivore communities (badger, red fox, domestic cat (Felis silvestris catus) and beech marten (Martes foina) at both sites as they may share similar environmental requirements. This comparison allowed us to examine whether temporal overlaps among species differ in urban environments compared to areas with lower human pressure. Finally, we compared badger activity patterns with those observed in two nearby protected natural areas to assess any differences between urban and natural environments.

2. Material and Methods

2.1. Study Area

The two study sites are in the Varese province, in the Lombardy region, Northern Italy (Figure 1a). The study site within the city of Varese (79,018 residents [30]) is in the Villa Baragiola urban park (VB) (45°83′ N, 8°79′ E) (Figure 1b). The park covers about five hectares and consists of a few buildings and green spaces. The site, featuring a small wood patch with rich shrub cover, as well as another accessible area to citizens, is characterised by many exotic tree species. Within the urban park, a small expansion basin for the Vellone river has been created to limit the damage from flooding of this small river crossing the city. The park is fenced off. The most common tree species in the park is chestnut (Castanea sativa). The northern slope has a high percentage of shrub cover, with hedges, like common laurel (Prunus laurocerasus), but also with bushes; the most common is elmleaf blackberry (Rubus ulmifolius) [31]. Nearby, there are other green areas and private gardens, while the forested areas of Campo dei Fiori Regional Park, about 1 km from Villa Baragiola, are connected by the river corridor. In fact, the Vellone River, which only floods after rainfall, creates a green strip with trees and shrubs in a residential area, situated between the Campo dei Fiori forest and Villa Baragiola park (Figure 1b).
The sub-urban study site is in the municipality of Castelseprio (CS, 1330 residents [30]), a little village, about 17 km southeast of Varese (45°70′ N, 8°85′ E). The area is a typical rural landscape with fields alternating with broadleaf woods (Figure 1c). Open areas are mainly mowing meadows and cornfields. The woods consist of broad-leaved trees, with some Scots pine (Pinus sylvestris) [32]. River Tenore crosses the study site. The study site was seven hectares. Castelseprio study site is close to the Pineta di Appiano Gentile e Tradate Regional Park (5 km).
To account for differences in urbanisation levels, we measured land use cover within a 1 km radius of the sett sites using Corine Land Cover 2018 [33] data. In VB, artificial surfaces account for 91%, agricultural areas 0.5%, and forest and seminatural areas 8.5%. In CS, these same land-use categories account for 13.4%, 52.4%, and 34.2%, respectively. The 1 km radius was chosen based on the average home range size of badgers [34].
To obtain a more precise picture of activity patterns, as a second step, we included in our analysis data collected with camera traps in two nearby protected areas: Campo dei Fiori Regional Park (CDF) and Pineta Regional Park (PP) (Figure S1). The first is a prealpine park, immediately north of Varese city; beech (Fagus sylvatica) is the widespread tree species, accompanied by chestnut and ash. Pineta park is a foothill and flat protected area, near the CS study site; the park is dominated by mixed Scots pine and broadleaf forests (CDF: artificial surfaces 6%, agricultural areas 5%, and forest and seminatural area 89%; PP: artificial surfaces 5%, agricultural areas 25%, and forest and seminatural area 70%).
The mean temperature in the city of Varese in the period 1967–2024 was 12.9 °C, while the average annual rainfall in the period 1966–2019 was 1561 mm [35].

2.2. Data Collection

We operated 40 camera traps, 25 in CS and 15 in VB, from August 2023 to August 2024. We were able to conduct a year-round analysis because badgers in the warmest, south-western part of their range, such as our study area, do not hibernate, and their activity remains relatively constant [36]. The camera traps used were Browning, BolyGuard, and Cuddeback models. Each camera trap worked 62 days (9–221) on average. Camera traps were placed on natural supports, trees, or fallen trees at a height of 20 to 100 cm above the ground, in order to maximise the capture angle and detection area. In CS, all the camera traps were placed near signs of badger presence in a 150 m buffer area from burrows, main or outlier. In VB, all the camera traps were placed within the fenced park in a 150 m buffer area from the main sett, with the exception of the two camera traps placed along the Vellone river at 170 and 650 m from the city park border. In VB, the distance between camera traps operating at the same time ranged between 20 and 190 m (mean 96 m). In CS, the distance ranged from 15 to 180 m (mean 92 m).
Each camera trap was set to record a video of 20 s duration and a minimum latency interval between consecutive videos. Camera traps were operated throughout the 24 h cycle.
Given that the two study sites were located in urban and sub-urban contexts, we incorporated the analysis data collected from two nearby protected areas (Regional Parks) to provide a comparative framework for badger activity patterns. We are aware that there are differences in camera trap deployment methodologies, but this does not affect information collected on activity patterns. The study period for CDF corresponded to the entire year 2022, during which 92 camera traps were deployed across a grid of 21 squares throughout the park, each measuring 2 km per side [37]. In PP, camera traps were active in the same period as CDF throughout 2022. A total of 34 camera traps were used, positioned within a grid of 19 squares, each also measuring 2 km per side [38] and, in this case, throughout the entire park area. The camera trap settings were the same as those used in CS and VB study sites.

2.3. Data Analysis

2.3.1. Mammal Community

All analysis were carried out with the R programme (version 4.3.2 [39]). In VB and CS, we tested for differences between the medium–large mammal community of the two sites. We calculated the relative abundance index (RAI) dividing the number of events of each species by the efforts (camera trap days); in this way, we calculated the number of videos acquired per day [40]. To test if the two mammal communities differed from each other, we compared RAI for each species between urban and sub-urban site with a Mann–Whitney U test [41]. Finally, we tested the differences between the two sites, considering only the RAI of mesocarnivores (badger, red fox, cat, and beech marten).

2.3.2. Activity Patterns

For the study of activity patterns, firstly, we tested if activity patterns were different between urban and sub-urban environments. Secondly, we analysed activity patterns and their overlap between mesocarnivores, not only wild ones (badgers, foxes and beech martens) but also including domestic cats. Furthermore, we measured, only for badgers, the overlap between four different seasons (winter, spring, summer and autumn) in the two study sites separately. Every seasons included three months: December, January, and February were winter; March, April, and May were spring; June, July, and August were summer; September, October, and November were autumn. Finally, we investigated changes in activity patterns between our urban/sub-urban study areas, with separate study sites, and the two Regional Parks. For all the analysis, the times of the recorded events of the species were considered and the R package overlap (0.3.9) was used [42]. With the non-parametric Kernel Density Estimate method [43], we produced an estimate of circadian activity patterns via a density probability function. Once the patterns for the different areas were calculated, they were compared to each other to test for differences. Following Ridout and Linkie [43] methods, a coefficient of overlapping, Dhat4 (∆4), was calculated, the best for large samples size. ∆ lies in the interval [0, 1], with ∆ = 1 if and only if the densities are identical and ∆ = 0 if and only if f(x)g(x) = 0 for all x. Considering the limited number of beech marten videos in CS (12, Table S1), we also tested Dhat1 (∆1), which is more appropriate for small sample sizes [43], specifically for the badger–marten comparison in CS. Given the very similar results between Dhat4 and Dhat1, we present the comparison using the same coefficient of overlap (∆4). Then, we calculated the 95% confidence intervals for ∆4 estimates from 1000 bootstrap samples [44,45]. Because the coefficient of overlap is purely descriptive [46], we investigated activity differences for species and sites with circular statistic (R package circular 0.5–1). We used the Mardia–Watson–Wheeler test (MWW test; [47]) to compare the distribution of detections amongst each species or site pair in the 24 h, to test whether activity patterns differed significantly. MWW test is more appropriate in activity pattern studies: it provides a threshold value to check significant differences between two activity patterns [44,46].

3. Results

3.1. Mammal Community

Camera traps worked for a total of 2475 days (59,400 h); in particular, the camera trapping effort was 1319 days in VB and 1156 days in CS. Each camera trap remained in operation for a different length of time. From August 2023 to August 2024, we identified 9 mammal species in 4494 videos recorded in VB and 14 mammal species in 1090 videos recorded in CS (Table S1). We recorded up to four badgers together in a single video in VB and up to five in CS; therefore, these represent the minimum number of individuals present at the study sites.
The badger was the most recaptured species with 1944 total occurrences: 1420 in VB and 524 in CS. Comparing the RAI of every species (Table S1), we did not record significant differences in mammal communities between the two study sites (Mann–Whitney U test, W = 23, p = 0.07). Focusing only on mesocarnivores (badgers, red foxes, cats, and beech martens), important differences between the two sites were registered for frequency events (Table S1), but comparing the RAI of the two sites, the two communities of mesocarnivores did not differ significantly (Mann–Whitney U test, W = 0, p = 0.125).

3.2. Activity Patterns

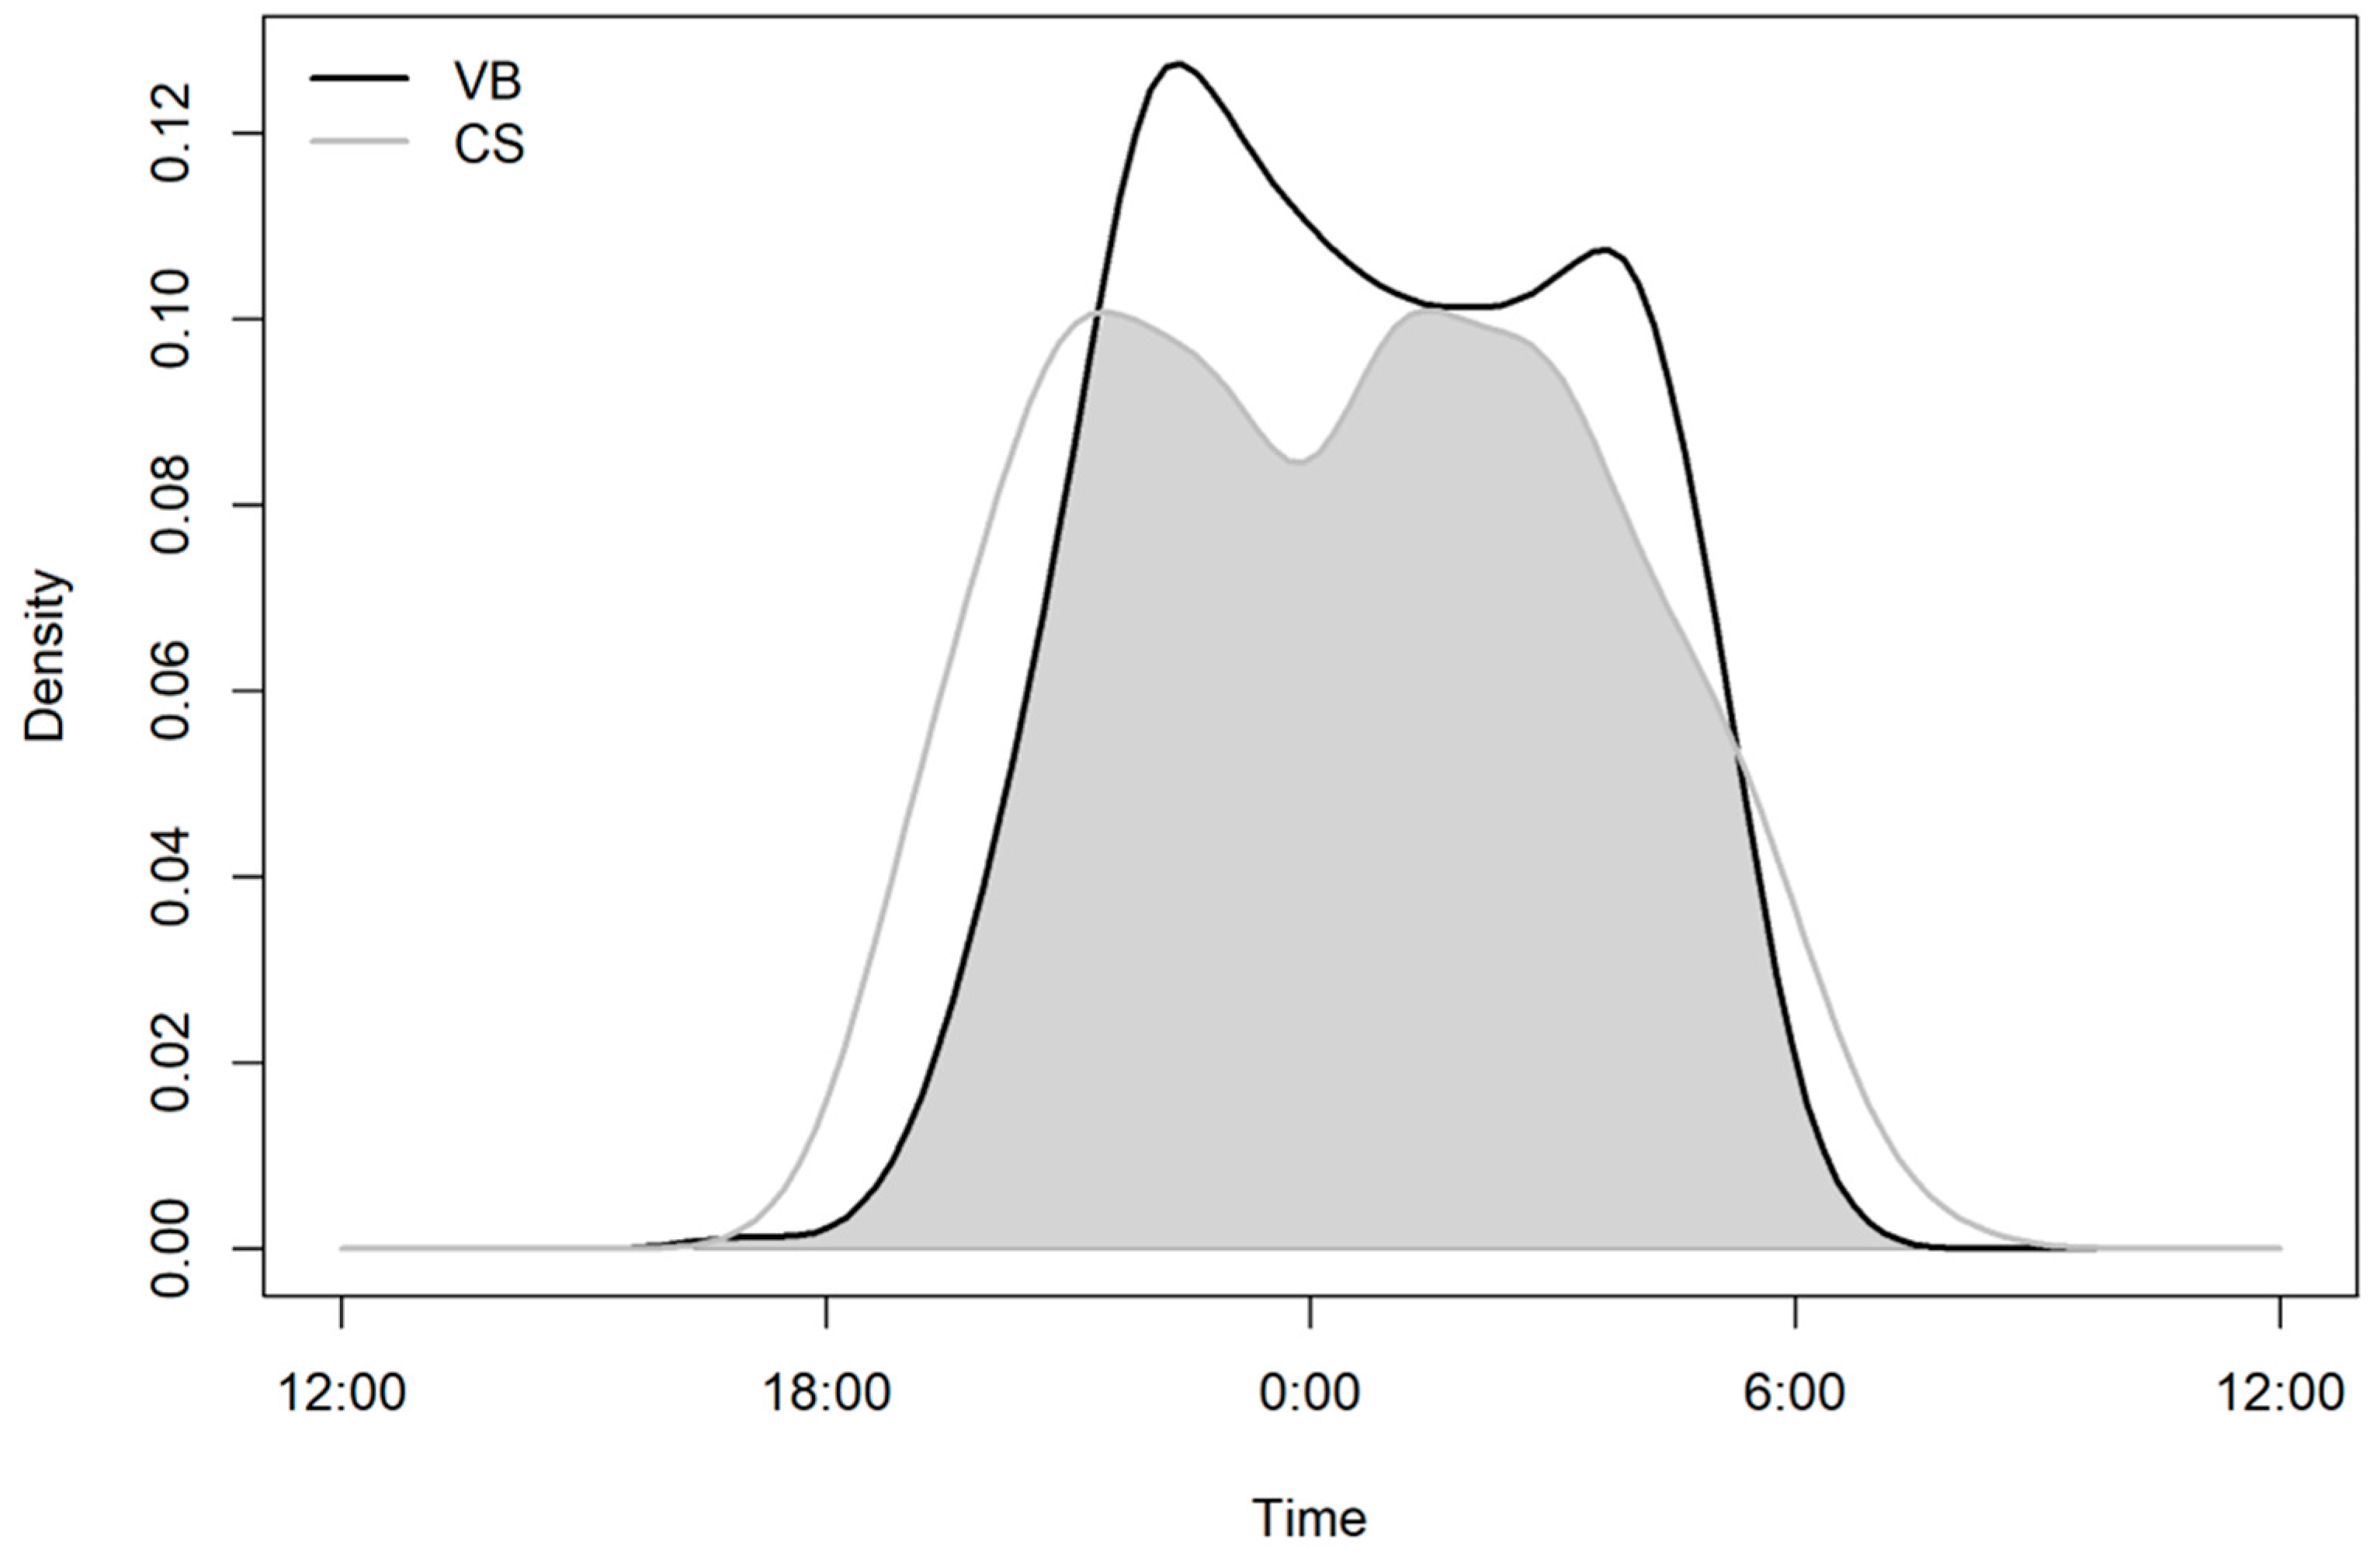
We analysed the overlap between badgers in urban area (VB) and sub-urban area (CS). The coefficient of overlap (∆4) was 0.87 (0.84–0.90) (Figure 2). Despite this high overlap, the Mardia–Watson–Wheeler test revealed that badgers showed statistically different use of the diel cycle between VB and CS (MWW test, W = 0.89, df = 2, p < 0.001).
Activity patterns are bimodal, even if the peaks are not very marked. The first peak is approximately between 10:00 p.m. and 11:00 p.m. for both urban and sub-urban area. The second peak for VB is about 4:00 a.m., while in CS, it is closer to the first one, at about 2:00 a.m. (Figure 2).
Badger activity in the sub-urban area starts about an hour earlier than in the urban park, at 5:00 p.m. and 6:00 p.m., respectively. In the same way, the limit of activity in the morning is later in sub-urban area, around 8:00 a.m., while in VB it is around 7:00 a.m.
As second step, we analysed the overlap between mesocarnivores (badgers, cats, foxes, and beech martens) at VB (Figure 3a, Table 1) and for CS (Figure 3b, Table 1). Comparisons between badgers’ activity and that of foxes and cats and beech martens, according to the MWW test, yielded significantly different results in both sites, except for the marten in CS (W = 0.62, df = 2, p < 0.001 with foxes in VB; W = 11.52, df = 2, p < 0.001 with cats in VB; W = 0.32, df = 2, 0.001 < p < 0.01 with beech martens in VB; W = 0.63, df = 2, p < 0.001 with foxes in CS; W = 0.68, df = 2, p < 0.001 with cats in CS, W = 0.17, df = 2, 0.005 < p < 0.10 with beech martens in CS). This exception may have been influenced by the low number of videos for beech marten.
The seasonal analysis yielded different results for the two study sites. In the urban area (VB), the overlap between seasons was high, averaging 0.86. In contrast, the sub-urban area (CS) showed a lower average seasonal overlap of 0.69. These values represent the mean overlap across all pairs of seasons (Table S2).
Finally, we tested for differences in badger activity patterns between the two study sites and the two regional parks (Table 2; Figures S2 and S3). Activity in VB yielded different results compared to that of the two regional parks with MWW test: Campo dei Fiori Park (W = 0.48, df = 2, p < 0.001) and Pineta Park (W = 0.26, df = 2, 0.01 < p < 0.05). Badgers in urban park were more nocturnal than in the two regional parks. On the other side, activity in CS was not different compared to that of the two regional parks. Activity patterns in sub-urban and in natural environment yielded similar results: there was a higher temporal overlap and the diel cycle was not statistically different.

4. Discussion

Overall, badger was the most captured species even if in VB, domestic cats were the most captured species, followed by badgers, dogs and humans; this emphasises how the urban park is greatly influenced by the presence of humans and their pets. In the sub-urban site (CS), the community was similar to the city, except for the presence of two Cervidae, roe (Capreolus capreolus) and red deer (Cervus elaphus), two lagomorphs, brown hare (Lepus europaeus) and cotton tail (Sylvilagus floridanus), and dormouse (Glis glis). Wild boar (Sus scrofa) was also recorded in the urban site.
In VB, capture frequencies of cats and badgers were similar (Table S1), whereas foxes occurred at approximately one quarter of their frequency. In CS, badger detections exceeded those of cats by 25-fold and foxes by 17-fold. Beech martens were present at both sites but were five times more frequent in VB than in CS. Thus, while overall mesocarnivore communities did not differ significantly, site-specific differences were evident. The higher number of cat detections in Varese likely reflects the presence of residential areas, where most cats are free-ranging pets that preferentially use green spaces such as VB [48,49]. In contrast, the few cats detected in CS were likely strays reliant on anthropogenic resources for food and shelter [50].
The presence of cats in areas frequented by other mesocarnivores may lead to interspecific competition. Although domestic cats are primarily diurnal, they extend their ranging activity into the night [49]. Owned cats also exhibit peaks of activity in early morning and evening hours [51], overlapping with those of wild species. Our results indicate limited competition between cats and badgers, but stronger potential competition between cats and foxes. In urban areas, camera trap footage documented both species exploiting similar prey resources, with occasional direct interactions. No direct encounters between cats and badgers were recorded. Although badgers and foxes are known to share dens and tolerate one another [52], we observed only a single encounter, during which a badger charged and displaced a fox, consistent with observations by Macdonald et al. [53].
Badgers were strictly nocturnal in both study sites. We recorded only one badger video during daylight, at 1:00 p.m. in CS. In the video, four badgers, a female with three cubs, were moving during the day in a heavy rain period. It is possible that the badgers had to leave the den due to a problem of flooding.
Activity peaked between 10:00 p.m. and 2:00 a.m., similar to the pattern described by Goszczyński et al. [28] in Poland. However, unlike their findings, we observed bimodal activity patterns at both sites. The first peak occurred at a similar time in both areas, while the second peak in VB was more shifted toward the morning.
The coefficient of overlap (∆4) between activity in city and sub-urban sites is remarkably high (0.87), indicating a similar behaviour, but as explained by the MWW test, there are differences between the two patterns. Badger activity in the sub-urban area started earlier, likely due to lower levels of human disturbance. Before 6:00 p.m. VB is still frequented by people and their dogs. Furthermore, activity in CS remains evident until 9:00 p.m., so activity during dusk and in the early hours of darkness is greater in sub-urban than in urban area. In the morning, during the early hours of daylight, activity is greater in CS, starting at 5:00 a.m. Morning activity in the sub-urban area ended later than in urban, as badgers in VB had completed their activity by the time the park opened to the public at 07:00. The more concentrated nocturnal activity in VB may result from the city park remaining open to the public until at least 6:00 p.m.; similar patterns of activity have been documented in urban parks in Mexico for species of medium-sized mammals [54]. In general, we observed that badgers in urban areas are more strictly nocturnal than in sub-urban areas, likely to avoid humans, which were recorded with higher RAI values in urban areas (Table S1) [55]. In contexts where parks remain open for 24 h or close later at night, activity patterns may differ: badgers might become even more nocturnal, or in cases of high human disturbance, their presence may become unstable or absent altogether.
Comparing mesocarnivore activity patterns in VB (Figure 3a), badgers and foxes exhibited greater similarity than badgers and cats. Domestic cats’ activity showed two minor peaks, at dusk and dawn, with activity generally distributed throughout the day and increasing during twilight and nighttime, whereas badgers concentrated their activity strictly at night. Overlap between badgers and foxes was high (∆4 = 0.90), reflecting strictly nocturnal activity in the urban environment. These results indicate substantial temporal overlap between the two species, in contrast to studies conducted in more natural areas [56]. In the sub-urban site, badger and fox activity patterns were more similar to each other than to cats (Figure 3b), although this pattern was less pronounced than in the urban landscape. In CS, cats were likely stray whereas in VB, they were mostly pets; stray cats typically show greater nocturnal activity compared to pet cats [49]. Analysis of red fox activity across environments revealed that sub-urban foxes exhibited increased activity in the morning, extending until midday, while urban foxes were primarily nocturnal, with all activity ceasing before 09:00, consistent with observations in Sydney [55].
Seasonal analysis showed that in the sub-urban context (CS), badger activity patterns varied significantly between seasons, with low overlap across different seasons. In contrast, in the urban area (VB), seasonal overlap was higher and activity patterns remained more stable throughout the year (Table S2). This suggests that badgers and their activity patterns in urban environments could be less influenced by seasonality. This topic warrants further investigation.
Including data that is also from the two regional parks nearby the study sites (Figures S2 and S3), we can say that the sub-urban site is similar to more natural environments. In contrast, in the urban site, activity is more strictly nocturnal and different from natural areas, supporting our hypothesis that badgers in the urban park adjust their behaviour to avoid human presence. However, this comparison with natural areas deserves further investigation, given the differences in data collection.
As our research focused on two sites, it would be valuable to include additional areas at different levels of urbanisation to better investigate badger adaptation to urban environments.

5. Conclusions

Although we observed that the available hours for badger activity in urban areas are reduced, badgers have nonetheless successfully colonised cities. It is likely that the benefits of urban living outweigh the constraints imposed by the shorter activity periods. We are aware that our study focused on only two badger clans; therefore, for future research, it would be optimal to expand the sample size to include additional clans, possibly in other cities or sub-urban contexts. By expanding the sample to other sites, it would also be possible to include additional environmental covariates collected from satellite images in the analysis. Given the considerable ecological plasticity of the species [22], it is plausible that variations in environmental conditions could lead to changes in activity patterns, even within urban settings. On the other hand, the reduction and/or disappearance of highly specialised species in urban environments [57] warrants further study. These findings highlight the importance of understanding species-specific behavioural adaptations to urbanisation, which can inform urban planning and wildlife conservation strategies aimed at promoting coexistence between humans and medium-sized carnivores.

Supplementary Materials

The following supporting information can be downloaded at: https://www.mdpi.com/article/10.3390/urbansci9110453/s1. Figure S1: Map with the two study sites and the two regional parks. Figure S2: Badgers’ activity overlap patterns between regional parks and VB. Figure S3: Badgers’ activity overlap patterns between regional parks and CS. Table S1: Cameratraps events and RAI. Table S2: Seasons’ coefficients of overlap.

Author Contributions

Conceptualisation, F.B. and P.G.; data curation, F.B. and P.G.; formal analysis, F.B. and P.G.; methodology, F.B. and P.G.; supervision, F.B., P.G., A.M. and D.G.P.; writing—original draft, F.B., P.G., C.T., A.M., L.A.W. and D.G.P.; writing—review and editing, F.B., P.G., C.T. and L.A.W. All authors have read and agreed to the published version of the manuscript.

Funding

The authors declare that no funds, grants, or other support were received during the preparation of this manuscript.

Data Availability Statement

Data are available from the corresponding author upon reasonable request.

Acknowledgments

We thank Varese municipality for their collaboration in working in the urban park. We are also grateful to Parco Campo dei Fiori and Parco Pineta di Appiano Gentile e Tradate for their collaboration in field work in the protected areas. The authors also thank Francesca Sanguinetti and Linda Leone for helping with data collection.

Conflicts of Interest

The authors declare they have no financial or non-financial interests.

References

  1. EEA. Urban Sprawl in Europe—The Ignored Challenge, Report EEA n. 10/2006; European Environment Agency: Copenhagen, Denmark, 2006. [Google Scholar]
  2. United Nations. World Population Prospects 2024: Summary of Results; UN DESA/POP/2024/TR/NO. 9; United Nations: New York, NY, USA, 2024. [Google Scholar]
  3. Czech, B.; Krausman, P.R.; Devers, P.K. Economic associations among causes of species endangerment in the United States: Associations among causes of species endangerment in the United States reflect the integration of economic sectors, supporting the theory and evidence that economic growth proceeds at the competitive exclusion of nonhuman species in the aggregate. BioScience 2000, 50, 593–601. [Google Scholar] [CrossRef]
  4. McDonald, R.I.; Kareiva, P.; Forman, R.T. The implications of current and future urbanization for global protected areas and biodiversity conservation. Biol. Conserv. 2008, 141, 1695–1703. [Google Scholar] [CrossRef]
  5. Buczkowski, G.; Richmond, D.S. The Effect of Urbanization on Ant Abundance and Diversity: A Temporal Examination of Factors Affecting Biodiversity. PLoS ONE 2012, 7, e41729. [Google Scholar] [CrossRef]
  6. Ditchkoff, S.S.; Saalfeld, S.T.; Gibson, C.J. Animal behavior in urban ecosystems: Modifications due to human-induced stress. Urban Ecosyst. 2006, 9, 5–12. [Google Scholar] [CrossRef]
  7. Lowry, H.; Lill, A.; Wong, B.B. Behavioural responses of wildlife to urban environments. Biol. Rev. 2013, 88, 537–549. [Google Scholar] [CrossRef]
  8. Gaynor, K.M.; Hojnowski, C.E.; Carter, N.H.; Brashares, J.S. The influence of human disturbance on wildlife nocturnality. Science 2018, 360, 1232–1235. [Google Scholar] [CrossRef]
  9. McKinney, M.L. Urbanization, Biodiversity, and Conservation: The impacts of urbanization on native species are poorly studied, but educating a highly urbanized human 91 population about these impacts can greatly improve species conservation in all ecosystems. Bioscience 2002, 52, 883–890. [Google Scholar] [CrossRef]
  10. McKinney, M.L. Urbanization as a major cause of biotic homogenization. Biol. Conserv. 2006, 127, 247–260. [Google Scholar] [CrossRef]
  11. Grimm, N.B.; Faeth, S.H.; Golubiewski, N.E.; Redman, C.L.; Wu, J.; Bai, X.; Briggs, J.M. Global change and the ecology of cities. Science 2008, 319, 756–760. [Google Scholar] [CrossRef]
  12. Angold, P.G.; Sadler, J.P.; Hill, M.O.; Pullin, A.; Rushton, S.; Austin, K. Biodiversity in urban habitat patches. Sci. Total Environ. 2006, 360, 196–204. [Google Scholar] [CrossRef]
  13. Elmqvist, T.; Zipperer, W.; Güneralp, B. Urbanization, habitat loss, biodiversity decline: Solution pathways to break the cycle. In Routledge Handbook of Urbanization and Global Environmental Change; Seta, K., Solecki, W.D., Griffith, C.A., Eds.; Routledge: London, UK, 2016; pp. 139–151. [Google Scholar]
  14. Ducatez, S.; Sayol, F.; Sol, D.; Lefebvre, L. Are urban vertebrates city specialists, artificial habitat exploiters, or environmental generalists? Integr. Comp. Biol. 2018, 58, 929–938. [Google Scholar] [CrossRef]
  15. Van Helden, B.E.; Close, P.G.; Steven, R. Mammal conservation in a changing world: Can urban gardens play a role? Urban Ecosyst. 2020, 23, 555–567. [Google Scholar] [CrossRef]
  16. Gallo, T.; Fidino, M.; Lehrer, E.W.; Magle, S.B. Mammal diversity and metacommunity dynamics in urban green spaces: Implications for urban wildlife conservation. Ecol. Appl. 2017, 27, 2330–2341. [Google Scholar] [CrossRef]
  17. McCleery, R. Urban mammals. Urban Ecosyst. Ecol. 2010, 55, 87–102. [Google Scholar] [CrossRef]
  18. Prugh, L.R.; Stoner, C.J.; Epps, C.W.; Bean, W.T.; Ripple, W.J.; Laliberte, A.S.; Brashares, J.S. The rise of the mesopredator. Bioscience 2009, 59, 779–791. [Google Scholar] [CrossRef]
  19. Crooks, K.R.; Soulé, M.E. Mesopredator release and avifaunal extinctions in a fragmented system. Nature 1999, 400, 563–566. [Google Scholar] [CrossRef]
  20. Bateman, P.W.; Fleming, P.A. Big city life: Carnivores in urban environments. J. Zool. 2012, 287, 1–23. [Google Scholar] [CrossRef]
  21. Huck, M.; Davison, J.; Roper, T.J. Predicting European badger Meles meles sett distribution in urban environments. Wildl. Biol. 2008, 14, 188–198. [Google Scholar] [CrossRef]
  22. Geiger, M.; Taucher, A.L.; Gloor, S.; Hegglin, D.; Bontadina, F. In the footsteps of city foxes: Evidence for a rise of urban badger populations in Switzerland. Hystrix 2018, 29, 236–238. [Google Scholar] [CrossRef]
  23. Delahay, R.J.; Davison, J.; Poole, D.W.; Matthews, A.J.; Wilson, C.J.; Heydon, M.J.; Roper, T.J. Managing conflict between humans and wildlife: Trends in licensed operations to resolve problems with badgers Meles meles in England. Mammal Rev. 2009, 39, 53–66. [Google Scholar] [CrossRef]
  24. Shi, H.; Shi, T.; Yang, Z.; Wang, Z.; Han, F.; Wang, C. Effect of roads on ecological corridors used for wildlife movement in a natural heritage site. Sustainability 2018, 10, 2725. [Google Scholar] [CrossRef]
  25. Herr, J.; Schley, L.; Engel, E.; Roper, T.J. Den preferences and denning behaviour in urban stone martens (Martes foina). MammBio 2010, 75, 138–145. [Google Scholar] [CrossRef]
  26. George, S.L.; Crooks, K.R. Recreation and large mammal activity in an urban nature reserve. Biol. Conserv. 2006, 133, 107–117. [Google Scholar] [CrossRef]
  27. Rodríguez, A.; Martin, R.; Delibes, M. Space use and activity in a Mediterranean population of badgers Meles meles. Acta Theriol. 1996, 41, 59–72. [Google Scholar] [CrossRef]
  28. Goszczyński, J.; Juszko, S.; Pacia, A.; Skoczyńska, J. Activity of badgers (Meles meles) in Central Poland. MammBio 2005, 70, 1–11. [Google Scholar] [CrossRef]
  29. Kruuk, H.H.; Parish, T. Changes in the size of groups and ranges of the European badger (Meles meles L.) in an area in Scotland. J. Anim. Ecol. 1987, 56, 351–364. [Google Scholar] [CrossRef]
  30. ISTAT, Istituto Nazionale di Statistica. Demography in Figures. Resident Population; ISTAT, Istituto Nazionale di Statistica: Rome, Italy, 2025. [Google Scholar]
  31. Barolo, C.; Castelli, L.; Merico, I.; Cardani, P. Guida ai Parchi Cittadini; Bosetti Group: Gorla Maggiore, Italy, 2016; Volume 5. [Google Scholar]
  32. Gennari, I.; Sportaro, E. Racconto di un Paesaggio Complesso. Percorso Attraverso gli Ambienti della Valle Olona, da Castelseprio al Parco Pineta. Master’s Thesis, Politecnico di Milano, Milan, Italy, 2014. [Google Scholar]
  33. Corine Land Cover 2018. European Union’s Copernicus Land Monitoring Service Information. Available online: https://land.copernicus.eu/en/products/corine-land-cover/clc2018 (accessed on 30 May 2025).
  34. Gaughran, A.; Kelly, D.J.; MacWhite, T.; Mullen, E.; Maher, P.; Good, M.; Marples, N.M. Super-ranging. A new ranging strategy in European badgers. PLoS ONE 2018, 13, e0191818. [Google Scholar] [CrossRef]
  35. Centro Geofisico Prealpino. Statistiche Storiche. Varese. 2025. Available online: https://www.astrogeo.va.it/statistiche/clima.php (accessed on 23 September 2025).
  36. Kowalczyk, R.; Jȩdrzejewska, B.; Zalewski, A. Annual and circadian activity patterns of badgers (Meles meles) in Białowieża Primeval Forest (eastern Poland) compared with other Palaearctic populations. J. Biogeogr. 2003, 30, 463–472. [Google Scholar] [CrossRef]
  37. Panebianco, M. Analisi della Presenza degli Ungulati nel Parco Naturale Regionale Campo dei Fiori Attraverso l’applicazione di Modelli di Occupancy. Master’s Thesis, Insubria University, Varese-Como, Italy, 2021–2022. [Google Scholar]
  38. Gallina, V. Gli Ungulati nel parco Regionale della Pineta di Appiano Gentile e Tradate: Analisi della Presenza e dell’andamento delle Popolazioni. Master’s Thesis, Insubria University, Varese-Como, Italy, 2021–2022. [Google Scholar]
  39. R Core Team. R: A Language and Environment for Statistical Computing; R Foundation for Statistical Computing: Vienna, Austria, 2024; Available online: https://www.r-project.org/ (accessed on 5 June 2025).
  40. O’Brien, T.G.; Kinnaird, M.F.; Wibisono, H.T. Crouching tigers, hidden prey: Sumatran tiger and prey populations in a tropical forest landscape. Anim. Conserv. 2003, 6, 131–139. [Google Scholar] [CrossRef]
  41. Mann, H.B.; Whitney, D.R. On a test of whether one of two random variables is stochastically larger than the other. Ann. Math Stat. 1947, 18, 50–60. [Google Scholar] [CrossRef]
  42. Meredith, M.; Ridout, M.; Campbell, L.A. Overlap: Estimates of Coefficient of Overlapping for Animal Activity Patterns. 2024. Available online: https://CRAN.R-project.org/package=overlap (accessed on 25 May 2025).
  43. Ridout, M.S.; Linkie, M. Estimating overlap of daily activity patterns from camera trap data. J. Agr. Biol. Envir. St. 2009, 14, 322–337. [Google Scholar] [CrossRef]
  44. Cremonesi, G.; Bisi, F.; Gaffi, L.; Zaw, T.; Naing, H.; Moe, K.; Aung, Z.; Gagliardi, A.; Wauters, L.A.; Preatoni, D.G.; et al. Evaluation of human disturbance on the activity of medium-large mammals in Myanmar tropical forests. Forests 2021, 12, 290. [Google Scholar] [CrossRef]
  45. Meredith, M.; Ridout, M. Overview of the Overlap Package. R. Proj, 1–9. 2014. Available online: https://cran.r-project.org/web/packages/overlap/overlap.pdf (accessed on 26 May 2025).
  46. Monterroso, P.; Alves, P.C.; Ferreras, P. Plasticity in circadian activity patterns of mesocarnivores in Southwestern Europe: Implications for species coexistence. Behav. Ecol. Sociobiol. 2014, 68, 1403–1417. [Google Scholar] [CrossRef]
  47. Batschelet, E. Circular Statistics in Biology; Academic Press: London, UK, 1981. [Google Scholar]
  48. Pirie, T.J.; Thomas, R.L.; Fellowes, M.D. Pet cats (Felis catus) from urban boundaries use different habitats, have larger home ranges and kill more prey than cats from the suburbs. Landsc. Urban Plan. 2022, 220, 104338. [Google Scholar] [CrossRef]
  49. Thomas, R.L.; Baker, P.J.; Fellowes, M.D. Ranging characteristics of the domestic cat (Felis catus) in an urban environment. Urban Ecosyst. 2014, 17, 911–921. [Google Scholar] [CrossRef]
  50. Vantwoudt, B.D. Roaming, stray, and feral domestic cats and dogs as wildlife problems. In Proceedings of the Fourteenth Vertebrate Pest Conference, Sacramento, CA, USA, 6–8 March 1990; Volume 14, pp. 291–295. [Google Scholar]
  51. Horn, J.A.; Mateus-Pinilla, N.; Warner, R.E.; Heske, E.J. Home range, habitat use, and activity patterns of free-roaming domestic cats. J. Wildl. Manag. 2011, 75, 1177–1185. [Google Scholar] [CrossRef]
  52. Mori, E.; Menchetti, M.; Balestrieri, A. Interspecific den sharing: A study on European badger setts using camera traps. Acta Ethol. 2015, 18, 121–126. [Google Scholar] [CrossRef]
  53. Macdonald, D.W.; Buesching, C.D.; Stopka, P.; Henderson, J.; Ellwood, S.A.; Baker, S.E. Encounters between two sympatric carnivores: Red foxes (Vulpes vulpes) and European badgers (Meles meles). J. Zool. 2004, 263, 385–392. [Google Scholar] [CrossRef]
  54. Mella-Méndez, I.; Flores-Peredo, R.; Pérez-Torres, J.; Hernández-González, S.; GonzálezUribe, D.U.; del Socorro Bolívar-Cimé, B. Activity patterns and temporal niche partitioning of dogs and medium-sized wild mammals in urban parks of Xalapa, Mexico. Urban Ecosyst. 2019, 22, 1061–1070. [Google Scholar] [CrossRef]
  55. Gil-Fernández, M.; Harcourt, R.; Newsome, T.; Towerton, A.; Carthey, A. Adaptations of the red fox (Vulpes vulpes) to urban environments in Sydney, Australia. J. Urban Ecol. 2020, 6, juaa009. [Google Scholar] [CrossRef]
  56. Torretta, E.; Serafini, M.; Puopolo, F.; Schenone, L. Spatial and temporal adjustments allowing the coexistence among carnivores in Liguria (NW Italy). Acta Ethol. 2016, 19, 123–132. [Google Scholar] [CrossRef]
  57. McIntyre, N.E.; Rango, J.; Fagan, W.F.; Faeth, S.H. Ground arthropod community structure in a heterogeneous urban environment. Landsc. Urban Plan. 2001, 52, 257–274. [Google Scholar] [CrossRef]
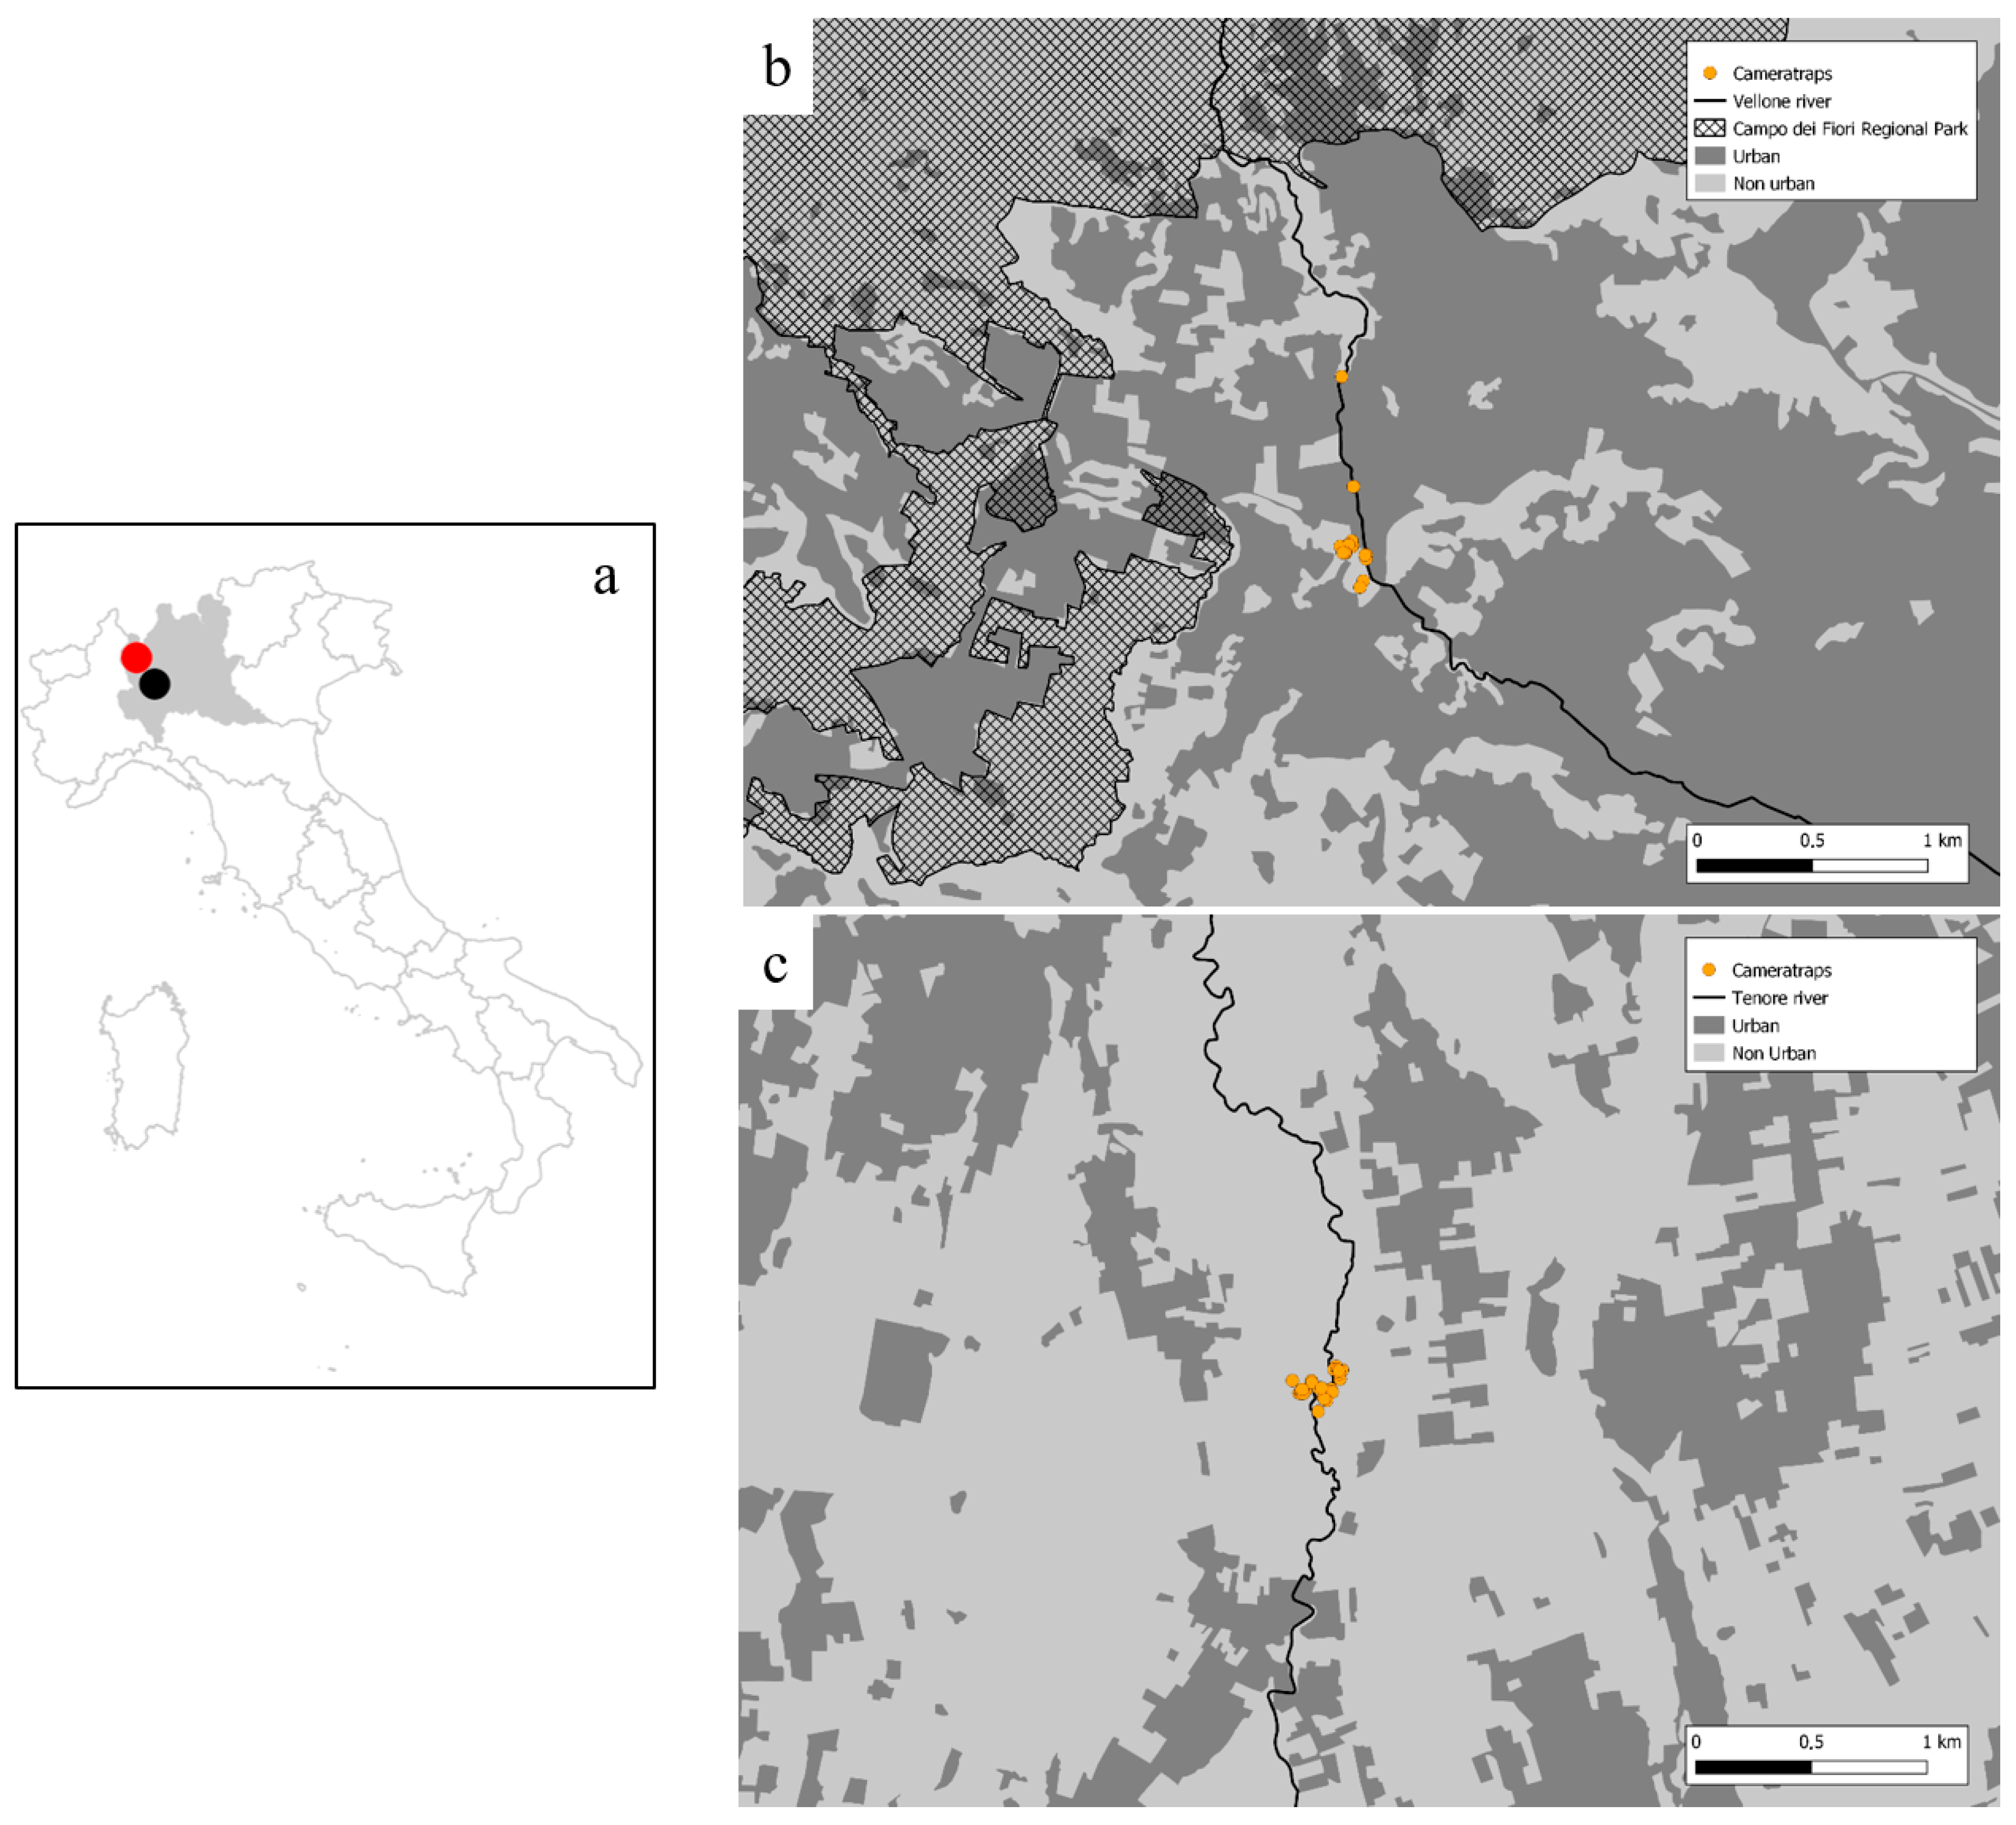
Figure 1. Lombardy region (a) with Milan (black dot) and Varese (red dot). Camera traps position in Villa Baragiola (VB) (b) and in Castelseprio (CS) (c). Dark grey is urban tissue, while light grey is non-urban areas.
Urbansci 09 00453 g001
Figure 2. Badgers’ activity patterns in urban area (black line) and in sub-urban area (grey line) and their overlap (grey area).
Urbansci 09 00453 g002
Figure 3. Overlap between mesocarnivores’ activity patterns in urban area (VB), (a) and in sub-urban area (CS), (b): badgers (continuous line), foxes (dot line), cats (dashed line), and beech martens (dot-dash line).
Urbansci 09 00453 g003
Table 1. Coefficient of overlap (Dhats4) and confidence interval between badgers and cats, badgers and foxes, badgers and beech martens in urban (VB) and sub-urban area (CS).
SpeciesVBCS
Badger–cat0.62 (0.59–0.65)0.67 (0.56–0.79)
Badger–fox0.90 (0.86–0.94)0.76 (0.66–0.85)
Badger–beech marten0.83 (0.74–0.93)0.75 (0.57–0.92)
Table 2. Coefficient of overlap (Dhats4) and confidence interval between urban (VB) and regional parks and between sub-urban (CS) and regional parks.
SitesVBCS
Campo dei Fiori0.86 (0.79–0.92)0.92 (0.86–0.97)
Pineta Park0.79 (0.67–0.91)0.88 (0.77–0.99)
Disclaimer/Publisher’s Note: The statements, opinions and data contained in all publications are solely those of the individual author(s) and contributor(s) and not of MDPI and/or the editor(s). MDPI and/or the editor(s) disclaim responsibility for any injury to people or property resulting from any ideas, methods, instructions or products referred to in the content.