Article

Integrating Data Mining and Microsimulation Modelling to Reduce Traffic Congestion: A Case Study of Signalized Intersections in Dhaka, Bangladesh

by
S.M. Labib
1,*,
Hossain Mohiuddin
2,
Irfan Mohammad Al Hasib
3,
Shariful Hasnine Sabuj
4 and
Shrabanti Hira
5
1
School of Environment, Education and Development (SEED), University of Manchester, Arthur Lewis Building (1st Floor), Oxford Road, Manchester M13 9PL, UK
2
School of Urban and Regional Planning, The University of Iowa, Iowa City, IA 52242, USA
3
Pi Labs Bangladesh Ltd., Dhaka 1215, Bangladesh
4
Dmoney Bangladesh Limited, Dhaka 1212, Bangladesh
5
SilvaCarbon-NASA/UMD fellowship 2018, US forest service, Washington, DC 20250-1111, USA
*
Author to whom correspondence should be addressed.
Urban Sci. 2019, 3(2), 41; https://doi.org/10.3390/urbansci3020041
Submission received: 5 March 2019 / Revised: 3 April 2019 / Accepted: 10 April 2019 / Published: 12 April 2019

Abstract

:
A growing body of research has applied intelligent transportation technologies to reduce traffic congestion at signalized intersections. However, most of these studies have not considered the systematic integration of traffic data collection methods when simulating optimum signal timing. The present study developed a three-part system to create optimized variable signal timing profiles for a congested intersection in Dhaka, regulated by fixed-time traffic signals. Video footage of traffic from the studied intersection was analyzed using a computer vision tool that extracted traffic flow data. The data underwent a further data-mining process, resulting in greater than 90% data accuracy. The final data set was then analyzed by a local traffic expert. Two hybrid scenarios based on the data and the expert’s input were created and simulated at the micro level. The resultant, custom, variable timing profiles for the traffic signals yielded a 40% reduction in vehicle queue length, increases in average travel speed, and a significant overall reduction in traffic congestion.

1. Introduction

With the continuing growth in both urban populations and the number of personal vehicles, traffic congestion and delays in journey time are critical issues for the overall sustainability of urban transportation systems around the globe [1,2,3,4]. The consequences of traffic congestion (e.g., increases in traffic safety issues, delays, and traffic-related air pollution) have been widely investigated in different city contexts globally [4,5,6]. These issues are of significant interest to transportation planners and managers tasked with overcoming increasing urban transportation challenges. Inefficiencies in traffic signal operation and the resultant deficiencies in traffic management have received critical attention due to their influence on congestion, vehicle speed, journey time, and vehicular emission levels [1,3,5]. Recent studies [4,5,6,7] have suggested that context optimized traffic signals are more efficient and can help reduce congestion, improve vehicle speed, and reduce overall air pollution. There is a growing body of literature that recognizes the importance of real-time/near real-time optimized traffic signaling systems as aids in overcoming traffic congestion, increasing traffic safety, and reducing the level of emissions from vehicles [1,5,6]. However, studies investigating the relevance of optimized traffic signaling systems currently provide conflicting results as to what type of optimization (e.g., real-time or near-real-time) is required under various traffic conditions in different cities and urban areas in both the developed and developing worlds [1,2,5,6,7]. Additionally, there is a lack of technical understanding regarding which type of modelling (e.g., microsimulation vs. macro simulation) provides better results and how integration between real-time traffic data and optimization processes can improve existing traffic control systems at signalized intersections.
At present, there are three types of signal controlling schemes commonly used in isolated intersections (i.e., fixed-time, actuated control, and adaptive control) [1,8]. The predominant control system used at most isolated intersections in cities around the world is a fixed-time control [8]. Fixed-time control systems use a predetermined timing cycle of traffic lights, and such systems are often based on the assumption of a stable and regular flow of traffic with a minimal average delay for vehicles [8,9]. However, it is now widely recognized that traffic flow frequently fluctuates, characterized by different cycles of traffic and movements of people within any given travel zone during different periods of the day. In many instances, peak time traffic flow is drastically greater than off-peak flow [7,10,11]. Hence, using fixed-time control systems in varying traffic conditions, characterized by either regular or irregular dynamic changes in traffic volume, may not successfully minimize the average delay experienced by vehicles at different times in the day (e.g., morning vs. noon; evening vs. night) [1,8,9,10]. Therefore, to improve traffic movement within a transportation network and reduce traffic congestion, many cities and urban areas have deployed systems that permit the optimization of traffic signal timing by implementing either actuated control or adaptive control signaling systems instead of traditional fixed-time signal systems [1,7,12].
Optimizing traffic signal timing in real or near-real-time requires the continuous processing of massive volumes of traffic movement information, including traffic flow, speed, location, and the modal share of different transportation modes. To obtain this information, existing intelligent transportation systems (ITS) utilize a wide variety of technologies for data acquisition, including GPS tracking, video analysis, loop detector, piezoelectric sensors, and recently connected vehicle technologies [7,11,13]. Over the last two decades, the use of GPS tracking and CCTV video analysis have experienced exponential growth.
GPS and connected vehicle technologies are robust data gathering techniques, but data-gathering supported by these technologies is often more expensive than alternative data-acquisition methods. By contrast, CCTV-based video analyses are becoming increasingly cost-effective and easier to implement in the context of effective data-acquisition at isolated traffic intersections. However, to date, there has not been enough confirmation to support policy decisions by urban planners and traffic managers regarding less-expensive alternate technologies for integrating and automating the signal updating process. The use of technologies such as video analysis tools in conjunction with data mining (e.g., automated traffic counting, classifying vehicles, and localizing vehicles) may not only overcome current cost-based deficiencies in traffic data collection [14], but may also allow data to be integrated in microsimulation modelling to obtain optimized traffic signal timing in congested traffic intersections [1,3].
The present study’s purpose was to develop an integrated automated traffic data mining technique based on the video analysis of traffic at an isolated signalized intersection. Additionally, this data was utilized to model the traffic in micro simulations, with the intention of discovering optimized signal timing patterns. This modelling, in turn, allowed the creation of variable timing profiles customized to a given isolated intersection. These variable timing profiles allowed signal timing to vary with different levels of traffic volume throughout the day and night based on the results of the optimized traffic flow simulations. The key novelty of this research is the integration of different technological and processed-based solutions to develop a semi-automated system that can reduce traffic congestion effectively. Additionally, the system developed in this study can be implemented at a lower cost than highly sophisticated and expensive systems, such as adaptive or fully actuated city-wide traffic control systems [15].
The present study was conducted on an isolated signalized intersection in the city of Dhaka. Previously, Labib et al. [2] and Khadem [16] found that most intersections in Dhaka have obsolete traffic signal systems with fixed timing cycles that are poorly suited to current traffic patterns and flows. These fixed signal timing cycles result in increases in traffic congestion and vehicular emissions and reduced traffic speed at affected intersections [2,16,17,18]. The present study illustrates that a combination of low-cost hardware (e.g., CCTV), simulation software, and minimum expert inputs could be integrated and applied to implement optimized signal timing on real-world traffic conditions in high-traffic urban environments. To the authors’ knowledge, no such study has been conducted in the context of a city like Dhaka.

2. Related Work

2.1. Data Mining in Traffic Management: Video Analysis

Within the wider domain of transportation management, data mining refers to processes and systems that extract implicit knowledge and rules from large traffic data that govern the movement of traffic under different real-world conditions [19,20]. The recent developments of integrated Internet, Wi-Fi, sensors, and server technologies, and the emerging development of connected vehicles, provide opportunities to collect a large amount of real-time or near-real-time traffic data (e.g., vehicle volume, speed, intensity, trajectories, vehicle types, and accident events) [11,19,21]. This information constitutes Big-data in the context of traffic management, and extracting meaningful insight (e.g., patterns of traffic traveling in certain corridors, traffic congestion at specific intersections), and traffic managers can use these insights to make informed, quick, and reliable decisions that increase the efficiency of the traffic network [19,20,21]. There are several tools used in traffic Big-data mining. The most common data mining tools are associated with (a) vision-driven data mining (e.g., video log analyses); (b) multi-sensor data mining (e.g., GPS and loop-detectors data analyses); (c) learning-based mining (e.g., using artificial intelligence models and rule extraction); visualization-based mining (e.g., line charts, data images); and (d) geospatial data mining (e.g., GIS tools used to extract spatial information related to traffic networks) [19,21].
In recent years, video image processing has been adopted for real-time traffic data mining because of benefits associated with fast response times; easy installation, operation, and maintenance; and the ability to monitor wide areas [13,22,23]. Among different sources of traffic videos, closed-circuit television (CCTV) has obtained wider attention, and this system is a closed video system that uses video cameras to transmit images that can then be monitored or recorded [22]. Diverse data on large regions can be collected through CCTV, increasing the scope for automatic analysis of urban traffic activity. Processed data extracted from visual imaging using CCTV and other traffic videos (e.g., simulated videos) can provide valuable information regarding traffic parameters including speed, traffic composition, vehicle shapes, vehicle types, vehicle identification numbers, traffic violations or road accidents, and turning movements important to junction design [13,22,23,24]. This data aids in transportation management and provide advantages over other data collection methods [13,22,23]. Additionally, video image processing makes the traffic data mining process easier by identifying the pattern or rules of traffic movement [13,19].
Vehicle detection using video analysis can be conducted using multiple methods (e.g., frame differencing, optical flow, and background subtraction (BS)) [13,25]. In the case of optical flow, vehicles are detected using pixel level intensity, and this method is more functional if a video capturing device is moving. The method is less efficient in real-time conditions due to massive computational requirements [13,26]. The frame differencing method uses the intensity of pixel variations to identify moving objects in the videos and consider dynamic environmental conditions within the frames of the videos they analyze. Frame differencing is vulnerable to vehicle misclassification when the background and a vehicle have a similar color. Frame differencing is also unable to detect static objects within the video frames [13]. In contrast to vehicle detection and frame differencing, BS is a more robust method considering its ability to detect both static and moving objects and the fact that BS is not affected by the color of vehicles [13,27]. Considering the robustness of BS algorithms, many recent studies and applications of vehicle detection from video analysis used this method and obtained accuracies around 95% in simple traffic scenarios and over 70% accuracy in complex scenarios [13,28,29]. Within the BS approach, there are several parametric (e.g., single Gaussian or median filter); non-parametric (e.g., kernel density estimation); and predictive (e.g., Kalman filter) techniques used for detecting vehicles of different categories in a region of interest (ROI) [30,31]. These regions of interest can be detected based on predefined virtual loops (e.g., rectangular box within the video frames) or by using blob tracking where the algorithm also detects the vehicle trajectory within the ROI [32]. Using a method such as optical flow or BS with a virtual loop or blob tracking usually depends on the need of the system design and context of the system where they will be applied. Current literature suggests the BS method, along with parametric techniques using virtual loops, are receiving wider appreciation due to their robustness and simplicity in use.

2.2. Signal Time Optimizations Using Simulation Models

Signal time optimization to reduce traffic congestion was first proposed in the 1950s [1]. With the advent of modern technologies, the availability of real-time data, data mining tools, and wider use of micro and macro-simulation models, traffic signal timing management has become more efficient [1,13,19]. The optimization of traffic signal systems is typically achieved through the use of two different types of signal optimization systems, the split cycle and offset optimization technique (SCOOT) [33] and the microprocessor optimised vehicle actuation (MOVA) [34].
SCOOT systems optimize multiple linked signalized traffic junctions at the city scale or within certain zones of a city [1,33]. By contrast, MOVA is used to optimize single signalized traffic junctions at the microscale [34]. SCOOT systems minimize overall traffic congestion, vehicle stops-starts, and journey times by synchronizing green-red signal times based on traffic flow approaching a junction and traffic flow running between consecutive junctions [34,35]. These systems efficiently manage macroscale traffic; however, SCOOT requires considerable investment and management. Simulation software such as TRANSYT and LinSig are popular software environments for SCOOT optimization processes [12,36].
In contrast to SCOOT, MOVA optimizes the signal time cycle based on vehicle flow approaching a single junction. The MOVA process does not account for multiple junctions or the traffic moving between consecutive junctions [37]. MOVA is less resource intensive, works significantly better for high traffic flow, and is focused on increasing junction capacity. Therefore, MOVA systems can be utilized independently in several junctions in a city instead of a city-wide SCOOT system [37,38]. Several modelling software programs are available for MOVA systems. OSCADY [39], PTV-VISSIM, and Vistro [12,40,41] are MOVA systems commonly used for simulation modelling when optimizing and evaluating unconnected single junctions.
Several studies have utilized simulation methods with different optimization algorithms (e.g., genetic algorithm [GA], particle swarm optimization [POS], and artificial neural network [ANN]) to reduce traffic congestion at signalized intersections [8]. Gökçe et al. [42] applied a POS optimization method and a VISSIM simulation to study a signalized roundabout in Turkey. Gökçe et al. found that compared to a fixed signal time, optimized signalling systems can result in significant decreases in average delay times. Ghanim and Abu-Lebdeh [43] utilized both genetic algorithms and ANN to optimize traffic signal timing dynamically within VISSIM. Ghanim and Abu-Lebdeh reported a considerable reduction in delay time based on the optimization provided by the algorithms. Several other studies also applied signal optimization integration with simulation modelling [1,12,17,33]. However, these studies mostly used static traffic data that was collected and operated manually. In addition, these studies seldom integrated any expert knowledge from traffic managers to optimize signal times. The present study addressed these research gaps and produced evidence demonstrating that automatic traffic data collection and simulation modelling can be used to design effective signal timing in signalized traffic intersections in Dhaka.

2.3. Studies on Dhaka’s Traffic Signals

Dhaka served as the study site for this research. Dhaka City Corporation is the authoritative body responsible for installing and managing traffic signals within the metropolitan area. At the beginning period of the signal installation, an inadequate systematic approach was applied to determine signal timing [16]. Subsequent research was conducted to analyze the condition of the signalized intersections and evaluate operational alternatives. One of the most comprehensive studies to address the operational issues of Dhaka’s intersections was conducted by Hadiuzzaman [44]. Hadiuzzaman developed a saturation flow and delay model for selected intersections that estimated delays in the selected intersections using several models, namely the Webster Delay Model, the TRANSYT Model, Ackelik’s Model, Reilly’s Model, and the Highway Capacity Manual 2000 Model. The estimated values of these models were compared in reference to the traffic conditions of Dhaka. Based on these comparisons, a modified delay model was proposed. At the final stage of the study, an AIMSUN simulation model applied to estimate the vehicles stop in the over-saturated approaches of the selected intersections. The study did not result in any specific suggestions regarding traffic signal timing or automation.
In another study, Roy et al. [17] attempted to improve the level of service of Dhaka’s Science Laboratory-Elephant Road intersections using the VISSIM software platform. Using field survey counts, this study modeled the existing signal timing. The study evaluated three different signal timing scenarios with reference to average traffic speed, average delay, and average queue length. Based on this analysis, this study proposed some effective signal timing alternatives. A similar study was conducted by Bhuyian et al. [45] using Webster’s model of saturation flow to address the inefficiency of Dhaka’s pre-timed intersections. Using existing field traffic counts and estimated traffic calculations, the study proposed alternative signal timing to improve the efficacy of the city’s pre-timed signalized system.
Due to emergent concerns about climate change and air pollution in megacities, the efficient management of congested intersections in the developing world is a topic of interest in the transport sector. Labib et al. [2] conducted a comprehensive study to address concerns regarding vehicle CO2 emissions in selected intersections in Dhaka. Using a combination of field traffic counts and remote sensing data, this study calculated an Emission Bio-Capacity Index for each of the selected intersections in Dhaka. The study identified unsustainable CO2 emission levels in most of the intersections because of the absence of optimized signal systems.
The aforementioned studies on Dhaka’s transportation system provide proof that traffic signal systems can become inadequate and ineffective, and they pointed to the need for further improvement in signal system management. Several transportation infrastructure development projects are currently underway in Dhaka (e.g., the metro rail and the elevated expressway). However, these projects are designed to address issues related to increasing numbers of vehicles [2], congestion, and travel demands. The topic of traffic signal timing has not received adequate attention from city authorities. Therefore, further investigations are necessary to highlight the potential for improvement resulting from this aspect of traffic management.

3. Materials and Methods

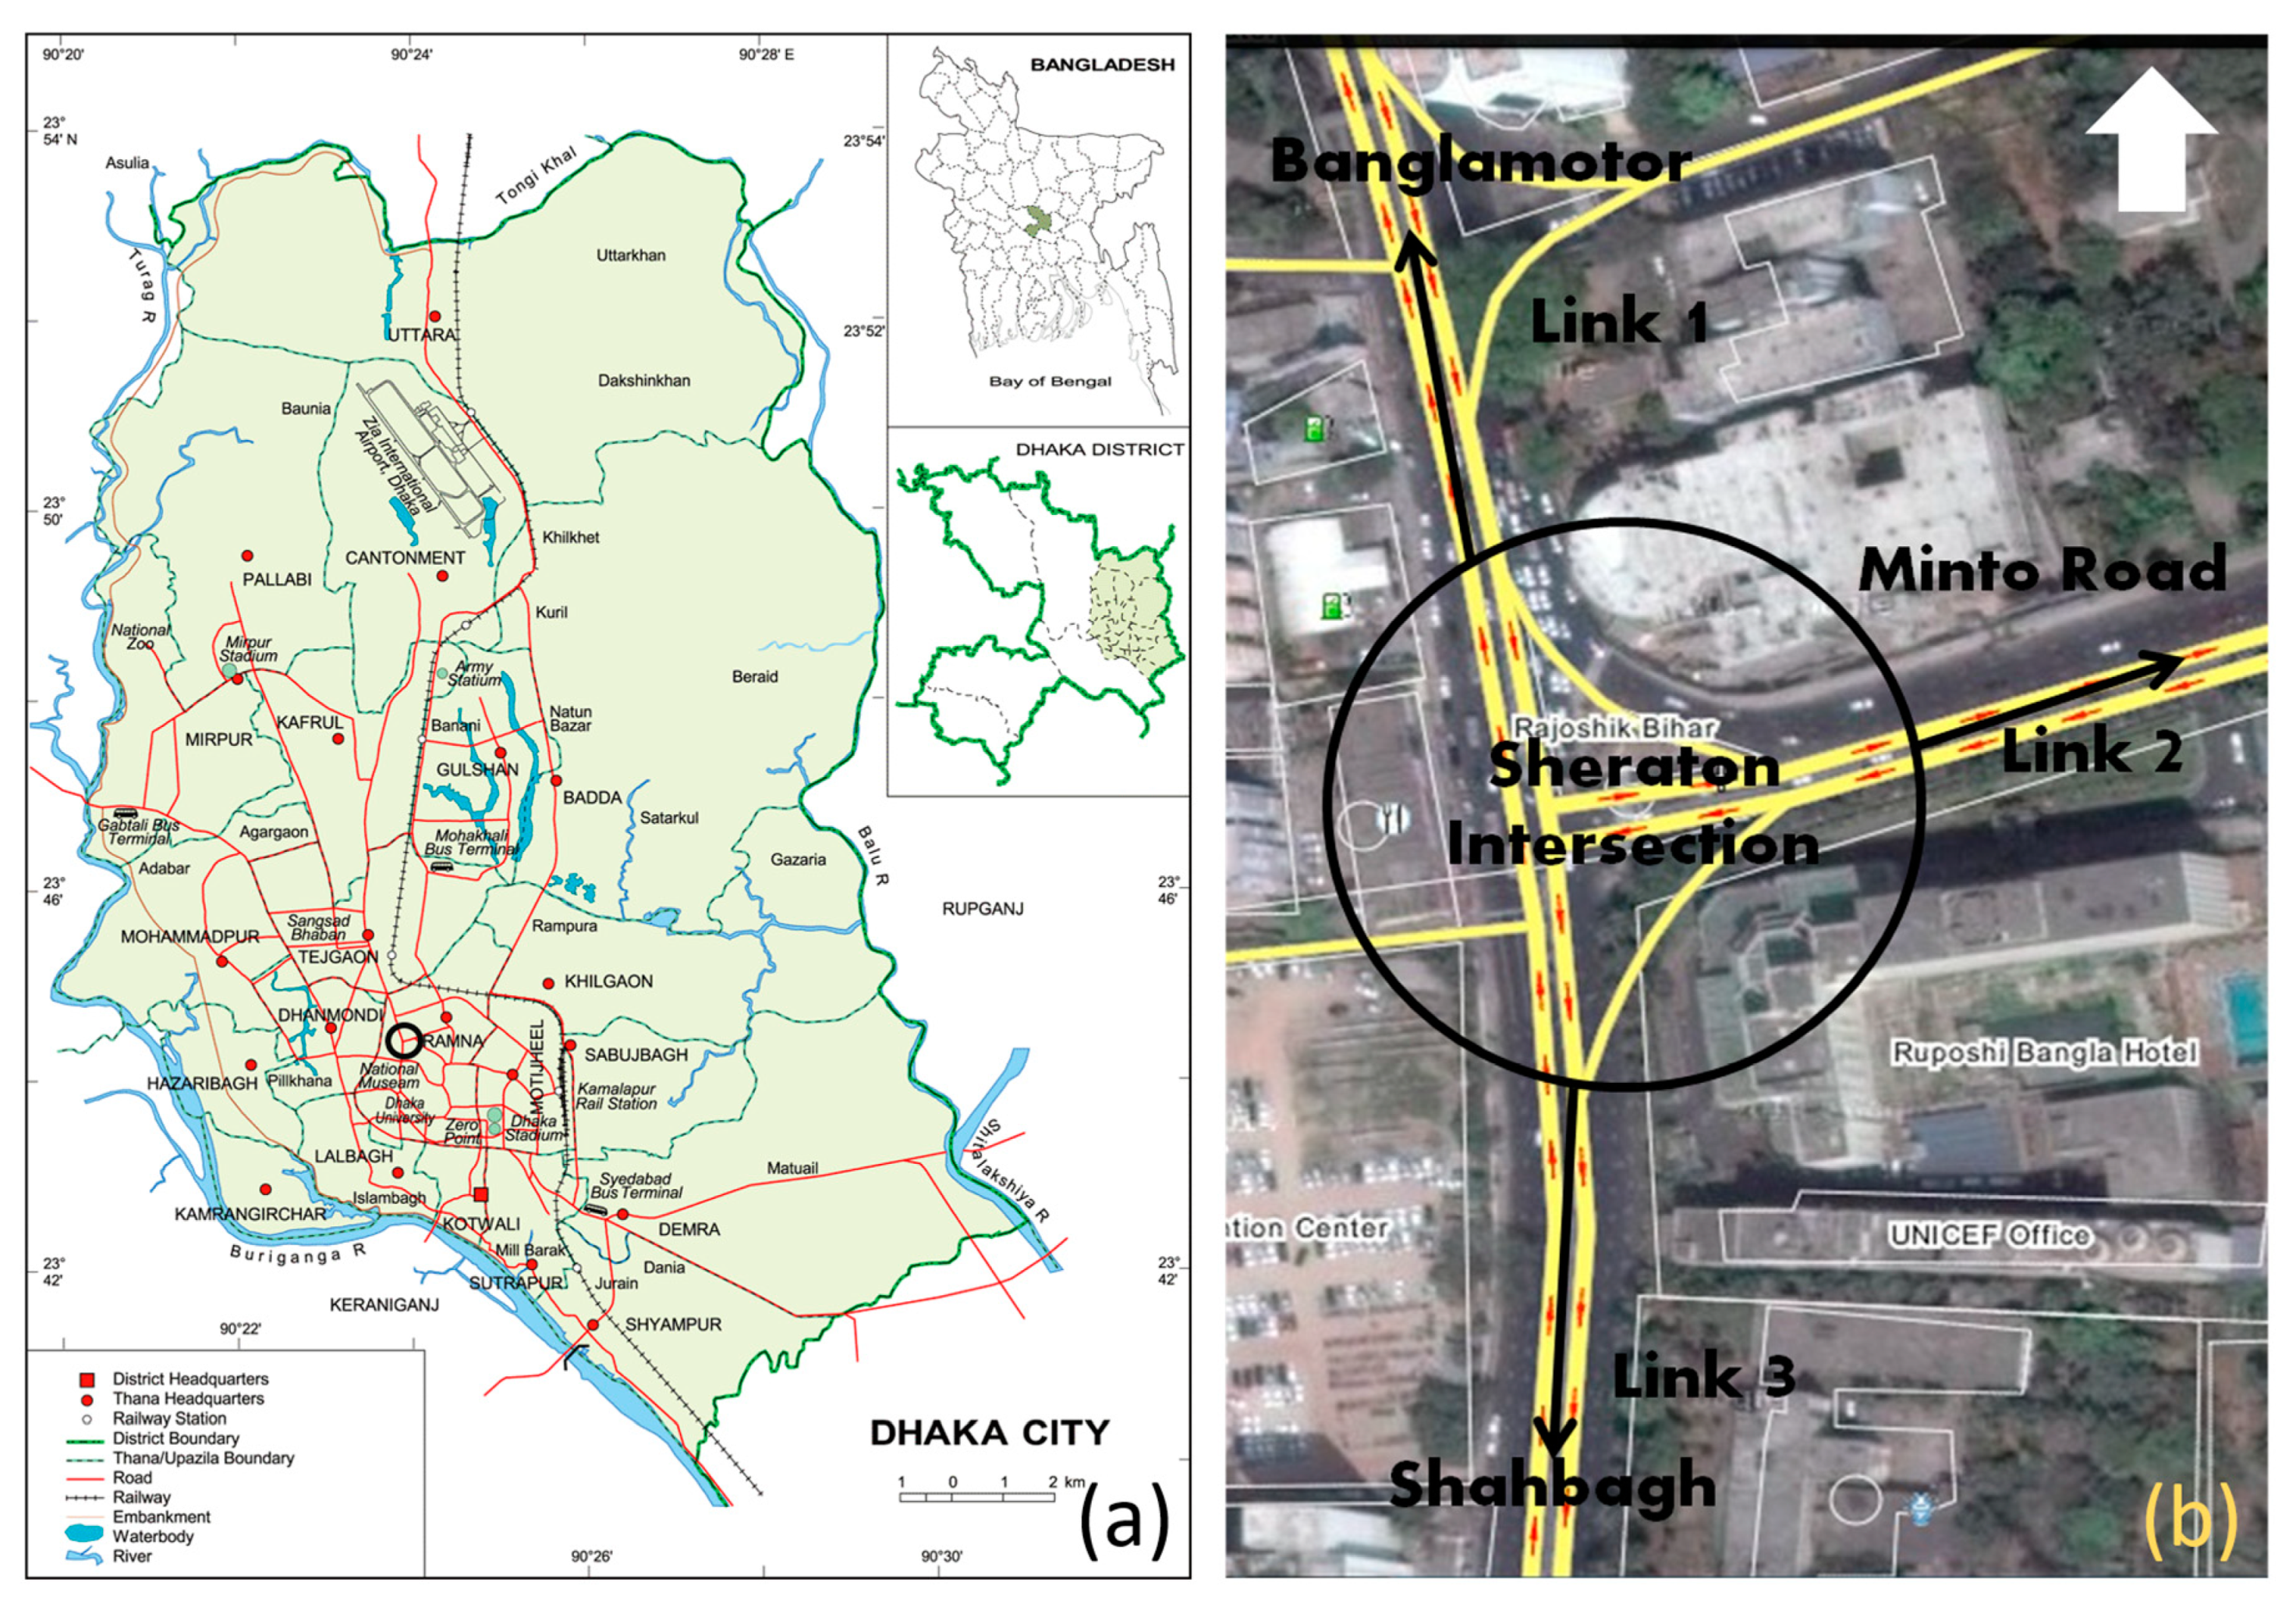
3.1. Case Study Area

A single traffic intersection in Dhaka was selected as a case study area. Dhaka’s road network, which is roughly 3000 km in length, comprises 7% of the total city area [46]. There are approximately 650 major intersections in Dhaka, of which, 70 have traffic lights [16,47]. Most of these signal lights are fixed-timed or pretimed [16]. Frequently, fixed-timed patterns cannot cope with Dhaka’s high traffic volume conditions, and this causes traffic delays [2,16]. The Dhaka Metropolitan Police (DMP) control the signal timing in some intersections manually. In most of these intersections, operational deficiencies exist [2,16].
For this case study, a three-leg intersection named ‘Sheraton Hotel Junction’ was selected. This is one of the busiest intersections in Dhaka as it is surrounded by important commercial areas, and the renowned five-star hotel The Intercontinental (previously the Sheraton Hotel) is located at one corner of this intersection. The latitude of the intersection is 23.709 and the longitude is 90.407. The legs of the intersection direct traffic towards the Bangla Motor area on the north side, Shahbag on the south side, and Minto Road on the east side (Figure 1). This intersection is a pretimed intersection used by a heterogeneous mixture of traffic. The most common vehicles found in the intersection were cars, covered vans (HGV), buses, vans, and motorcycles. Traffic flows in both directions on each leg of the intersection, and each direction consists of three effective lanes.

3.2. Traffic Data Collection at Base Level

The base condition traffic data were collected using manual counts. Surveyors were assigned to collect the data in each direction of the junction. There are three links in this intersection, and they were each assigned a number, as shown in Figure 1b. Each of these links supports traffic flow in both directions. Each directional flow represents three lanes. Therefore, each of these links comprises six lanes supporting traffic flow in both directions. The field traffic counts were done in 15 min intervals during a single weekday in March of 2015 from 7 to 11 am (Dhaka’s peak morning travel hours). Collected data included traffic volume counts in each direction and signal light timing. The vehicle counts were recorded by modes. These base level traffic data were used to simulate existing traffic conditions with fixed-signal timing. Later, this information was used to evaluate how the changes in signal timing affected traffic flow, speed, and congestion levels.

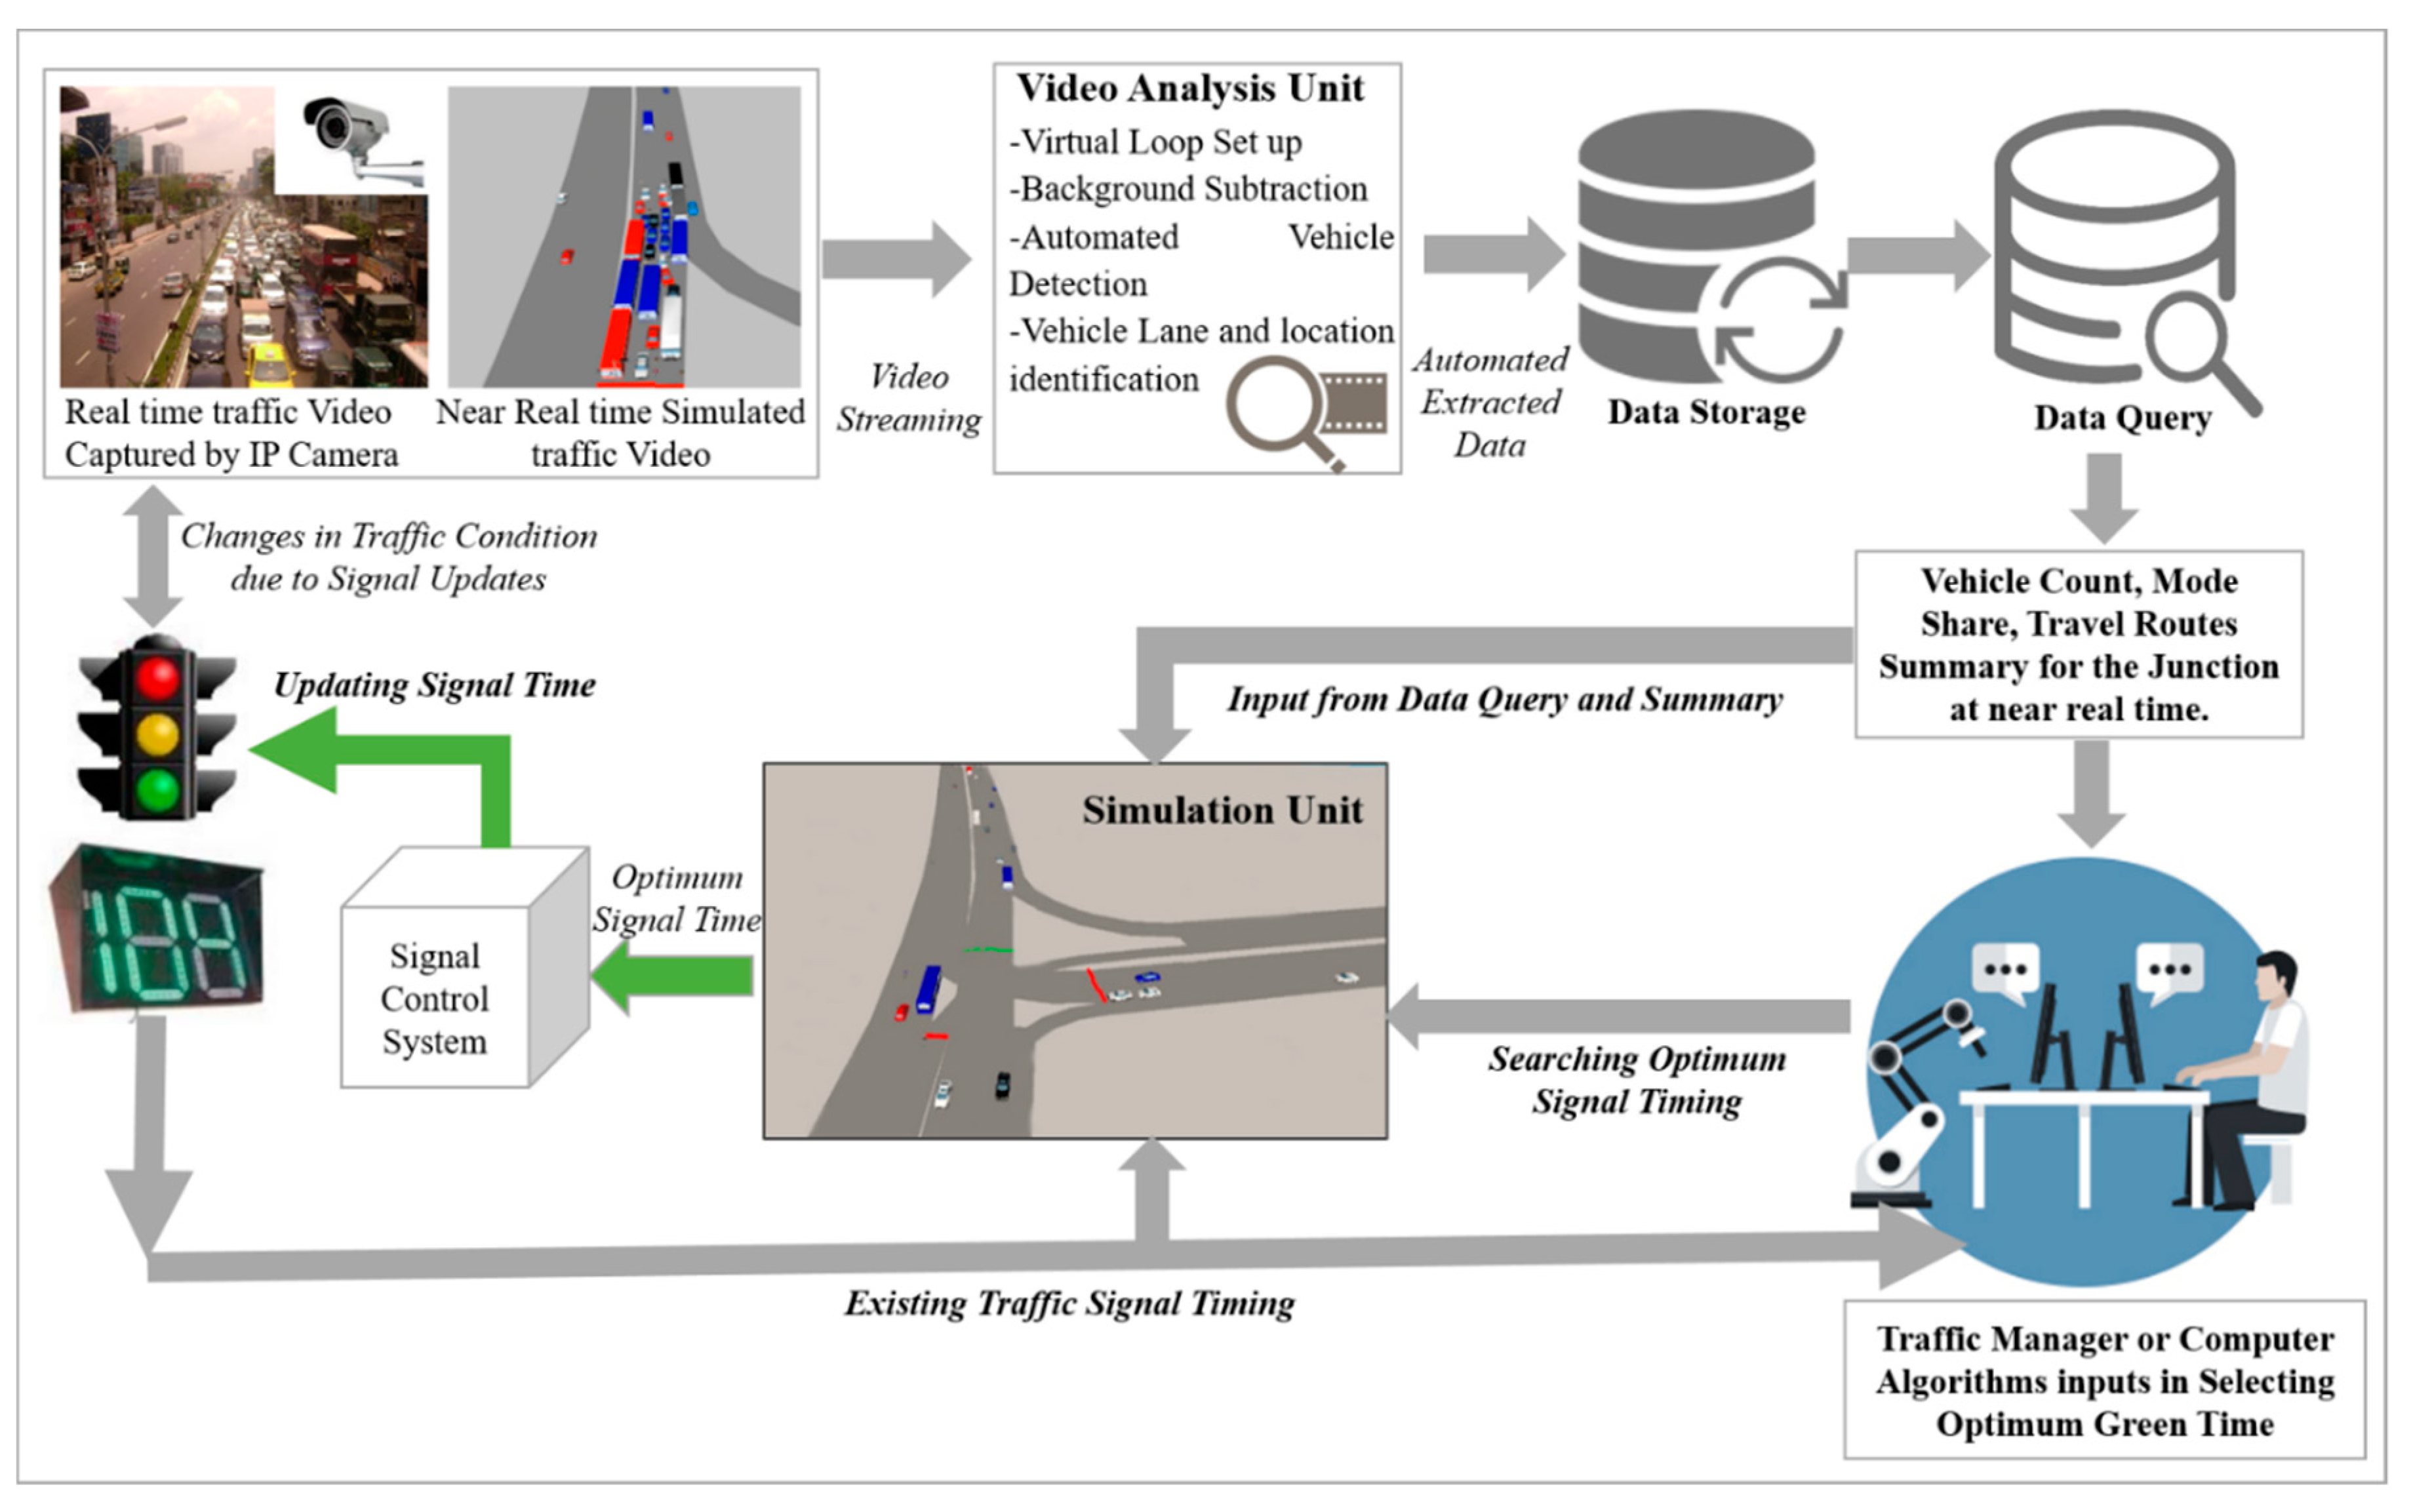
3.3. Overview of the Proposed System

This study proposed an integrated system that combines data mining and simulation processes to update traffic signal timing. The proposed system used video analysis to extract information regarding vehicle types and numbers of vehicles traveling in different links of the studied junction. These data were then used to run simulation models to identify optimum signal timing patterns that could reduce congestion levels. Figure 2 illustrates the overall design of the proposed system. The process starts with streaming videos from live or simulated sources. Streamed videos act as sources of vehicle-related information required to run the next process. The videos enter the ‘Video Analysis Unit’ (Subsystem 1), where the virtual loop detectors use an algorithm (discussed in the next section) to detect and classify different vehicles and related information such as the lane, link connection, and location on the road links. These data are then stored in the data storage system (i.e., a server). In the next step of the system (Subsystem 2), an automatic query process run from the server produces a summary of information at each 15 min interval. This information includes the numbers and types of vehicles detected in different links of the junction, how many vehicles interchanges from one link to another link, and vice versa. All this information is essential for preparing a simulation model as necessary inputs for the third subsystem of the proposed system.
As illustrated in Figure 2, the video analysis and query results produce key inputs required for the ‘Simulation Unit’ (Subsystem 3). The Simulation Unit enabled experimentation with different signal time scenarios that changed vehicle flow and signal timing speed. These scenarios were then compared to the results of the existing signal timing. There are two approaches that this proposed system can implement to reduce congestion by achieving the optimum signal time, either using computer algorithms to obtain the optimum signal time [8] or using expert knowledge of the local traffic conditions (e.g., peak/off-peak flow, driver behavior, and vehicle mix). With these approaches, different signal timing combinations can be explored in the simulation, and the best results can be implemented to reduce congestion. Once the simulation unit produced an optimal signal timing that reduces congestion and increases vehicle speed at the junction, the signal timing parameters can be sent to the traffic light control system. Actual changes in traffic congestion and speed at the junction can then be observed.
It should be noted that the video analysis, data-mining, and simulation subunits developed in this proposed system have already been applied in other studies focused on transportation management [12,13,22,40]. However, the system proposed in this study integrated these three subsystems and partially automated the process of integration. Previous studies either utilized one of these subsystems or applied a more manual approach to management solutions (e.g., standalone use of vehicle tracking, 13). This study not only combined subsystems (e.g., running an automatic query to produce summary information) but also introduced the option to integrate local experts’ knowledge. These steps were taken to provide more efficacy and effectiveness when managing the traffic signal timing.

3.4. Micro-Simulation Model

In order to replicate the actual traffic conditions at the selected junction within the simulation environment, a business-as-usual or base simulation model was created using VISSIM microsimulation model software. The base model served two purposes in this study. The first was to mimic the actual traffic conditions in a simulation system, thus allowing for the evaluation of changes after adjusting the signal timing. The second purpose was to produce 3D videos (vehicles traveling) of different links that would allow the proposed automation system to be tested when updating the signal timing.
In order to generate the base model, the three-legged traffic junction (i.e., Sheraton Hotel Junction) was drawn in VISSIM, incorporating the actual geometric measurements of different traffic lanes obtained from field measurements. From the field survey, data on the traffic flow per hour, the modal share of different vehicles, the interchanges among different links, and the existing signal timing were included in the base model. Additionally, traffic behavior parameters (i.e., car following, lane changing, and lateral values) were selected for the base model (supp 1). The parameters in Table 1 represent the values of some key variables required to run stochastic microsimulations based on the Wiedemann car-following model. This car-following model data, along with data on lane and lateral changing behavior, were necessary inputs for the fundamental algorithms that run the microsimulation in VISSIM [48]. A detailed discussion of these parameters and the car-following model is beyond the scope of this paper, but a comprehensive discussion can be found in Fellendorf and Peter [48].
Signal time used in the base model were collected during the field survey. For this traffic intersection, the signal cycle was 165 s. As illustrated in Figure 3, Link-1 had 80 s of green time, Link-2 had 25 s of green time, and Link-3 had 40 s of green time.

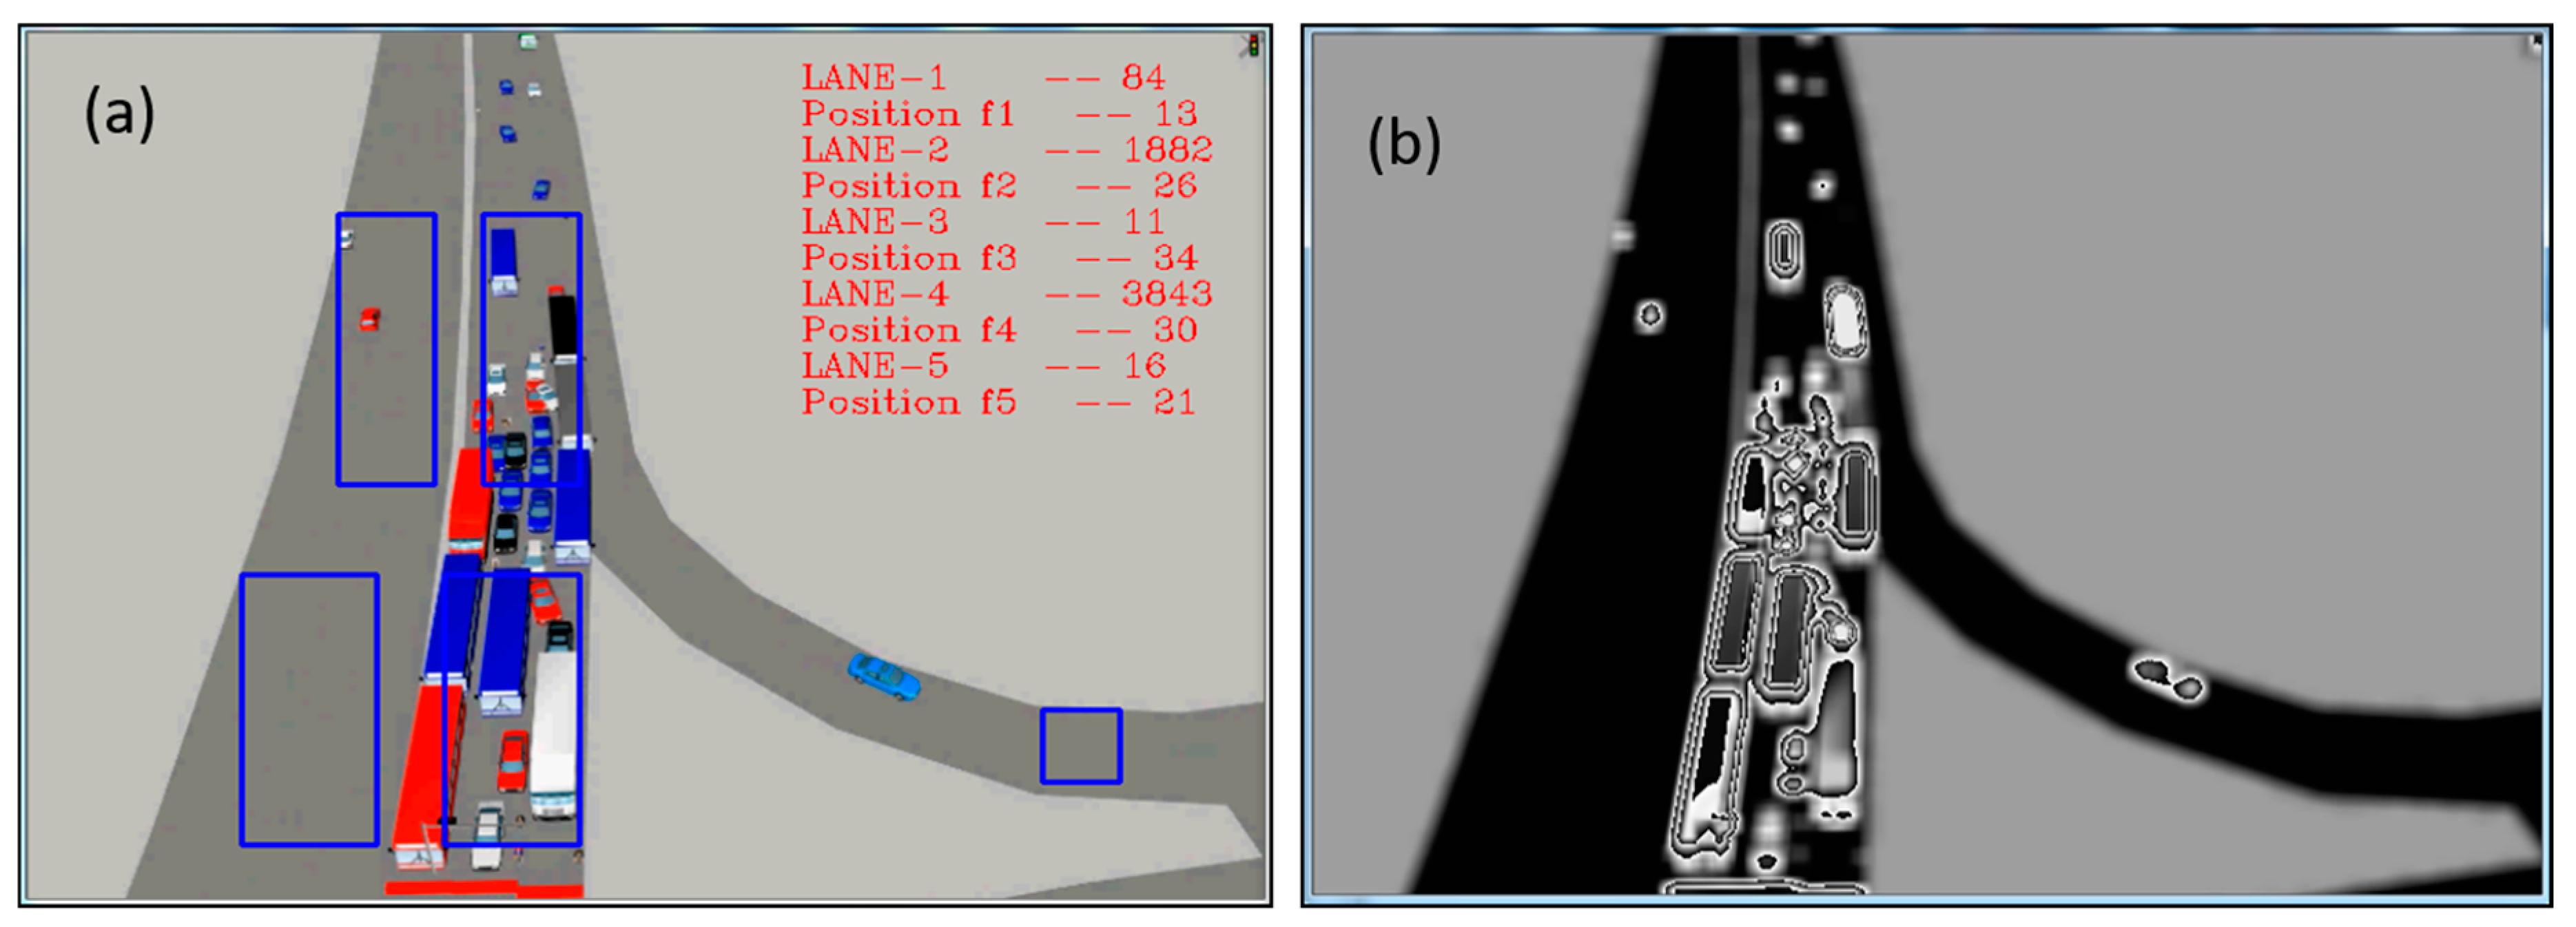
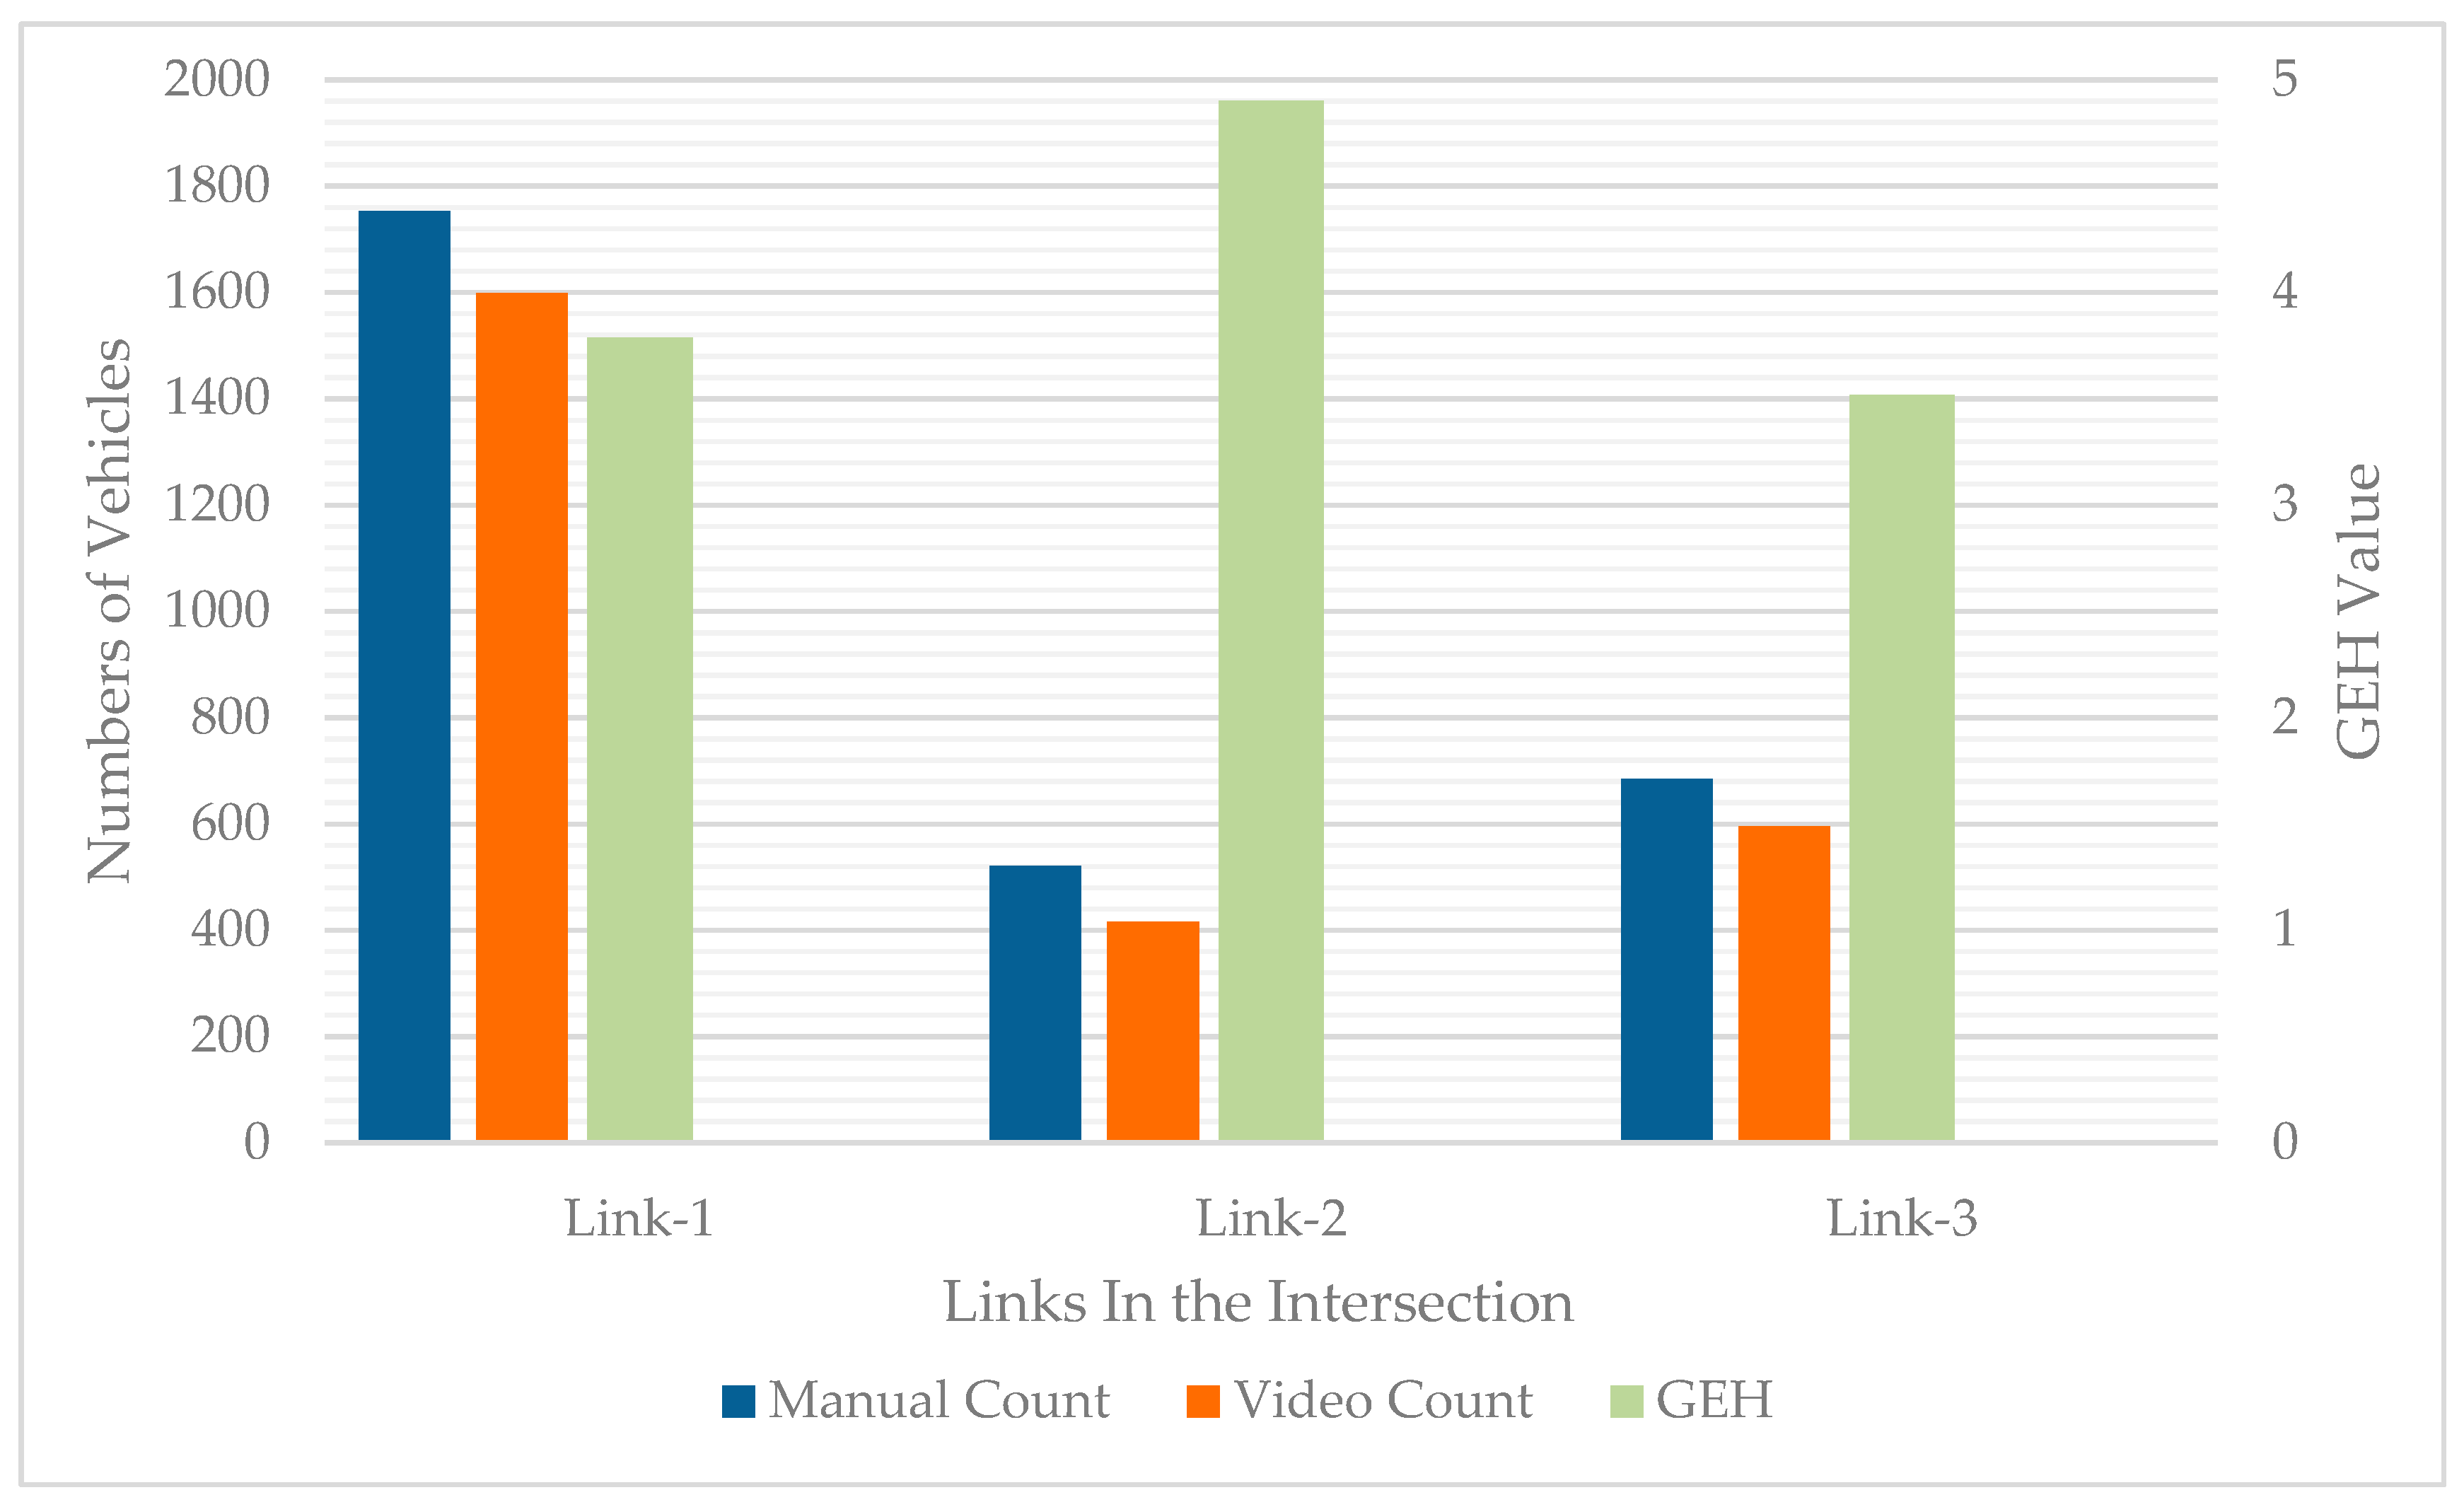
3.5. Video Analysis Unit

Developing and applying an automated vehicle count system from traffic videos was one of the crucial aspects of this study. The video analysis unit is essential to the proposed system as it analyzes any traffic-related videos (e.g., live traffic or simulation videos) to extract the necessary information automatically. Traffic videos will be streamed into this system from a pre-defined hard disk drive (HDD) where the videos are stored. For each road link of the intersection (e.g., Link-1), a fixed video frame will be utilized. To process the video frames in the video processing unit, a script has been developed using the Python programming language. The processing of stored video frames will be performed with one of the Open Source Computer Vision Library-openCV algorithms [29,49] (e.g., example code, Table 2). Code block-1 initiates the script and libraries (e.g., numpy, cv2), imports and resizes the video(s), and indicates the methods that will be utilized in detecting the vehicle classes [50]. Block-2 declares the data file as comma-separated values (CSV) on which the detected information will be stored, selects the method, and runs the basic algorithm to detect different vehicle types. Additionally, block-2 subtracts the background, delineates different frames/predefined virtual loops and their attributes, and declares image moments to detect different vehicles as objects within the virtual loops. Finally, block-3 detects different vehicle types (e.g., cars, buses) based on image moments and threshold values for different vehicles.
In this study, within the Python script for vehicle identification, a “Template matching algorithm” was developed utilizing openCV [49]. In the first step, background subtraction has been performed for the videos entered in the system (Code Block-2, Table 2). This study utilized simulated 3D videos due to the unavailability of CCTV traffic videos of the selected intersection. In the next step, an image sample was extracted from a frame of the stored video stream. The ideal image is a lower-sized image (i.e., an image size of 50:50 pixels where the video frame is 640:480 pixels). Thus, vehicle images are obtained by searching in the frame using a “template.” These templates pass through the entire frame covering every pixel (2D convolution), and each pixel is assigned a value based on the normalized sum of differences of corresponding pixel values between a portion of the frame consisting of neighboring values for each pixel of frame and template image [49]. If the matching value of each vehicle exceeded the threshold value of sample vehicle sizes (determined based on experimenting with different vehicle types, Code Block-3), then that type of vehicle would be assumed to be detected. Thus, matching for each type of vehicle is conducted individually throughout the whole frame. Finally, the data is written in a text file and sent to the database as CSV file format.
In addition to identifying different vehicle types and their positions on the links, the script also detected vehicle occlusion conditions during the red signal. When links showed red signals, vehicle occlusions formed [50], and within the virtual loop template, the matching algorithm was unable to detect any individual vehicles. The script marked that condition as ‘Red Signal’ and recorded this in the database. This process allowed the system to explain the occlusions in different links and therefore, aid in understanding vehicle queue length during congestion periods. However, this also introduced problems related to false detection during vehicle occlusion and underestimating the actual numbers of vehicles traveling through the virtual loop [50]. Careful attention was given when setting the virtual loop position within the frame. Based on the recommendation by Xia et al. [13], a decision was made to position the loop close to the bottom view in order to reduce the potential for false detections due to vehicle occlusion. Overall, the script recorded not only the vehicle types and their locations but also the signal timing. By utilizing this data when running a query in the database, a comprehensive summary of the junction was obtained.

3.6. Data Mining: Running Automatic Query

The video analysis unit detected the vehicles, their position, and interchanges from one lane to another. However, the database also needed to summarize output such as total vehicle volume and mode share (e.g., percentage of different vehicles) to provide useful inputs for the simulation modelling. Producing a summary that can be directly integrated into a simulation unit requires running queries at a certain interval (e.g., hourly). To automate the summary production, this study developed and ran query scripts rather than manually running a query each time. The script has been written in PHP code so that the query can be presented in any web browser. The script imported the data produced from the ‘Video Analysis Unit’ subsystem and produced a summary based on those observations. The script has two major sections. The first code block converts and exports the data from the video analysis (saved as a CSV file) into a MySQL database (Example Block-1, Table 3). The second code block (Example Block-2, Table 3) runs the query from the MySQL database and produces the summary required for simulation model inputs.

3.7. Signal Timing Updates (Tuning) and Related Changes

Updating fixed signal timing to reduce traffic congestion is the main objective of this study. The video analysis (computer vision technique) and query produced the information traffic patterns. However, these methods cannot inform decisions regarding how signal timing should be updated to reduce congestion. To optimize signal timing, the consequent effects of these patterns needed to be checked in simulation models. Signal timing optimization can be accomplished using two approaches, either using computer algorithms and artificial intelligence (discussed in Section 2.2) or utilizing expert knowledge based on previous experience and context-specific information. Usually, previous studies have utilized computer algorithms without considering context-specific expert knowledge. By contrast, in this study, expert knowledge and context-specific information have been applied to update signal timing and observe if such changes actually reduce traffic congestion. The expert-based approach produced two scenarios: (1) changing the signal cycle time as well as green time for different links—Scenerio1 (SC1), and (2) keeping the original signal cycle time but changing the green time for different links—Scenerio2 (SC2).
There are numerous possible scenarios that can be evaluated. However, for Scenario-1, the previous experience of morning peak hour traffic in Dhaka suggested that either changing the signal cycle by shortening it and allocating more green time for congested link/s may influence the congestion. Additionally, several traffic manuals also suggested that shorter signal cycles often are more effective at managing traffic flow at intersections [51]. In contrast, for Scenario-2, keeping the existing signal cycle length (165 s) but increasing the green time for the congested link (Link-1) seems more logical, considering that more traffic will be added in the queue with less green time allocated. Previous studies also indicated that extending the green time for congested links may reduce overall congestion for an intersection [43,52]. Based on these arguments, two new signal timing cycles were proposed and tested for Scenario-1 and Scenario-2 (Figure 4).
In addition to signal timing and cycle length, expert observations of the driving behavior in Dhaka led to changes in the traffic behavior parameter values applied when running the experimental scenarios. The new parameter values are listed in Table 4. In Dhaka, vehicles usually are in closer proximity, both when stopped and when moving, compared to the VISSIM default. The expert noted that most drivers do not consider it necessary to provide a safe distance of more than 1.00 m between vehicles, and field observation validated this assertion. Therefore, the new car following parameters reduced average standstill and safety distances (Table 4). Vehicles in Dhaka also usually do not follow exact lane markers based on field observations. Vehicles frequently take any position in the lane rather than the usual standard of being at the middle of the lane. Thus, ‘any position’ was selected for the desired position. Vehicles in Dhaka generally maintain shorter lateral distances (e.g., 0.3 m) when changing direction or overtaking (or attempting to overtake) other vehicles on the same lane. Therefore, these parameters were also changed. The context-specific, expert knowledge of Dhaka’s traffic not only aided in producing more realistic simulations, but the information also introduced new insights into the model that usual computer algorithms may not have added without prior training using artificial intelligence or data-driven methods. For these reasons, using expert knowledge was considered a more viable option for this study.

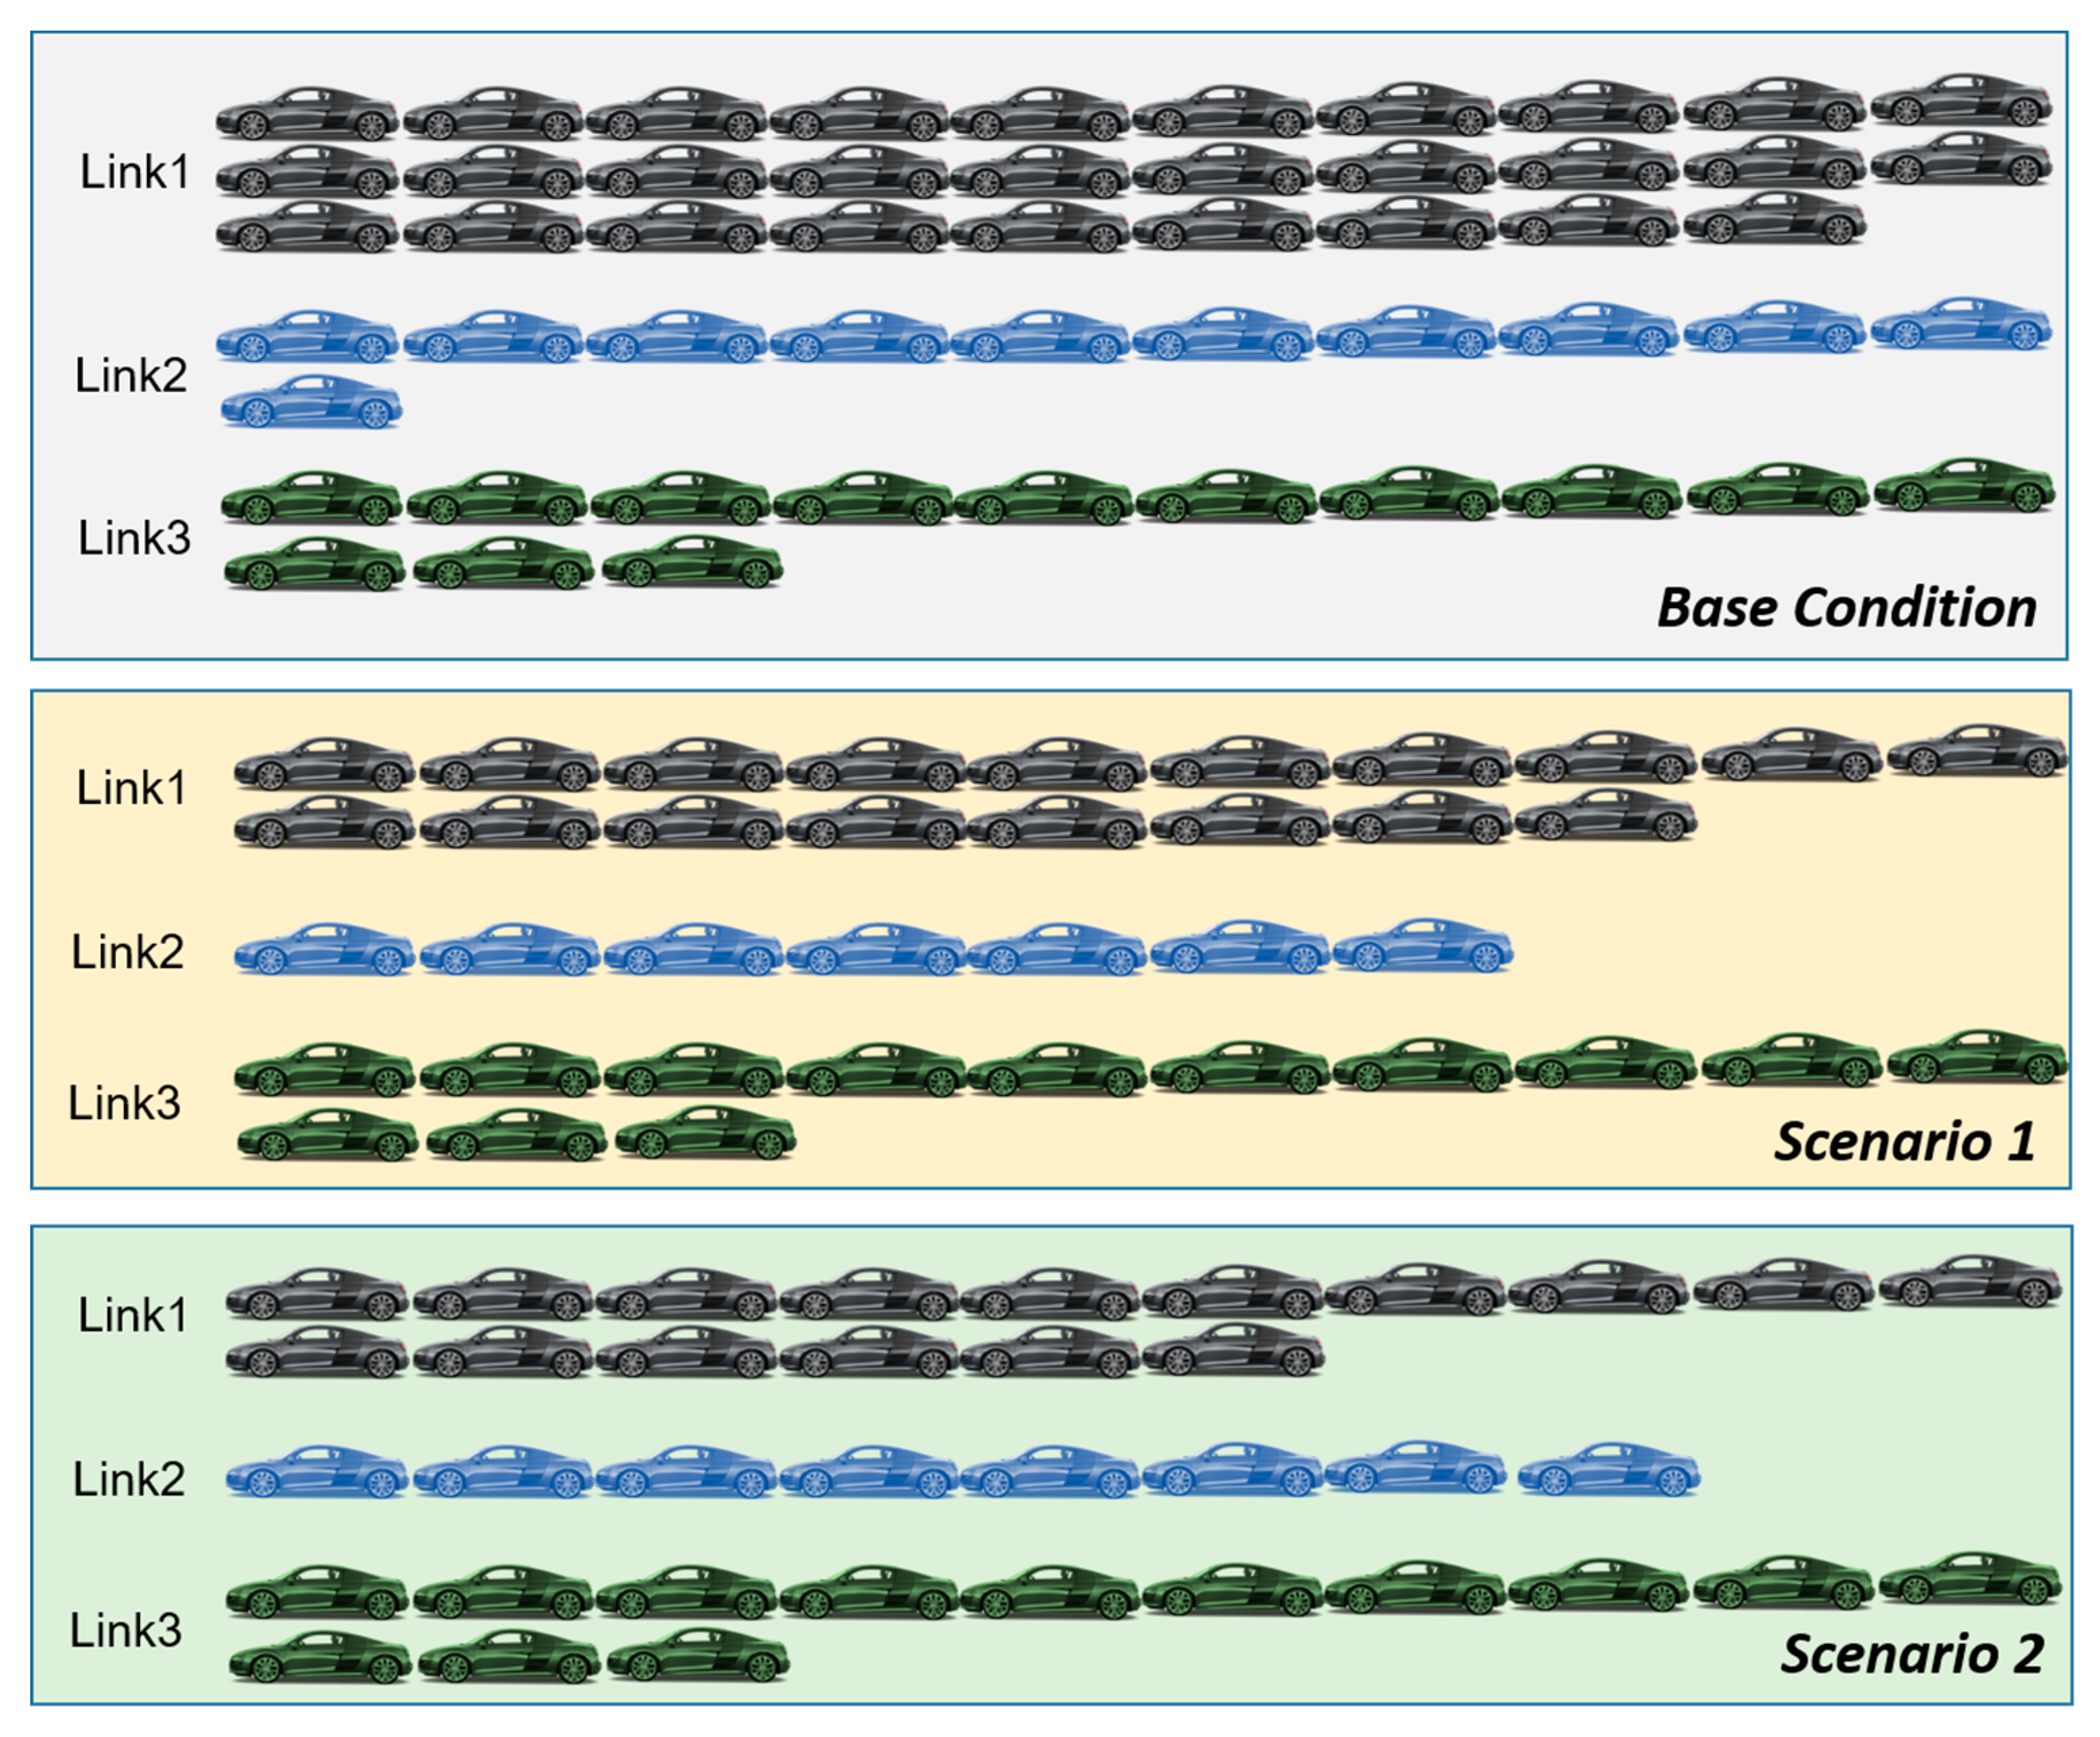
3.8. Evaluation of Tuned Signal Scenarios

Reduction in traffic congestion and increasing a vehicle’s average speed are the indicators considered for evaluating the effectiveness of the tuned signal time scenarios. These two indicators are usually outputs of the VISSIM microsimulation model [45]. Reduction in congestion is explained in terms of reduction in the queue length in each link of the intersection. Specifically, the objective of this study was to reduce queue length in the congested link of the intersection in comparison to the base level condition. Additionally, possible increases in vehicle speed approaching and crossing the intersection are considered a positive change [1,43,45].
In addition to evaluating the effect of signal changes, the accuracy of the simulated model traffic volume and the video analysis traffic volume was evaluated using “GEH Statistic” [53,54]. Geoffrey E. Havers developed a continuous volume tolerance formula while working as a transport planner in London, England in the 1970s. Although its mathematical form is similar to a chi-squared test, it is not a true statistical test. Rather, it is an empirical formula that has proven useful for a variety of traffic analysis purposes:
G E H =   2 ( M C ) 2 M + C
where,
M = the hourly traffic volume from the traffic model (or new count)
C = the real-world hourly traffic count (Image detection traffic count or the forecasted traffic)
For traffic modelling work in the “baseline” scenario, a GEH less than 5.0 is considered a good match between the modeled and observed hourly volumes, a GEH greater than 5.0 is considered for further investigation, and a GEH greater than 8.0 is considered to be unsuitable [53,54].

4. Results

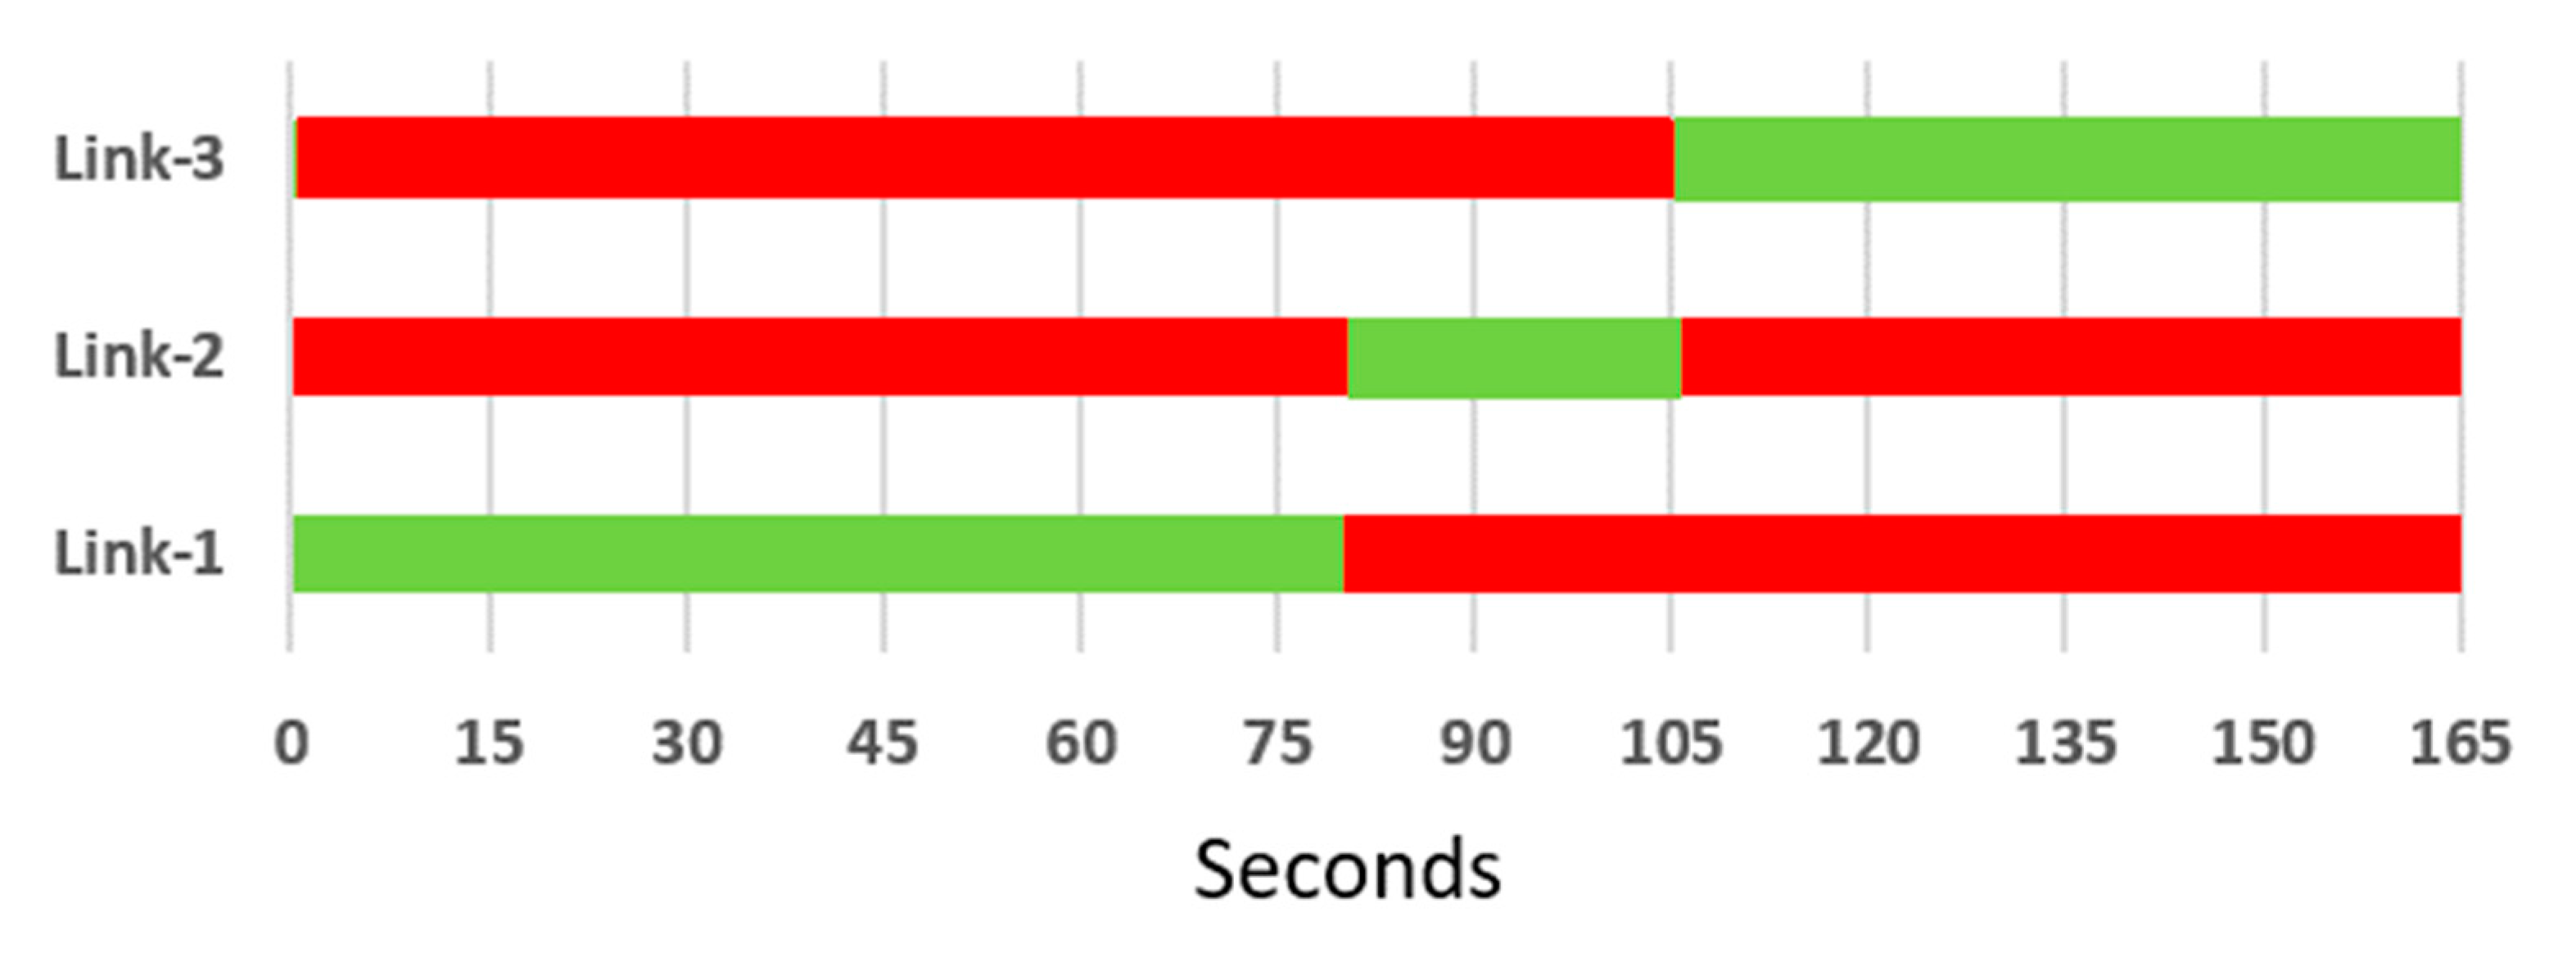
4.1. Overview of Existing Traffic Conditions

The most dominant vehicle using the intersection was cars, followed by motorcycles, buses, and HGVs (Table 5). It is noticeable that Link-1 had approximately three-times the traffic volume than Link-2 and Link-3. Link-1 was also the most congested link in the intersection. This was because Link-1 is connected to Dhaka’s Central Business District (CBD), Motijheel. In the morning peak hours, traffic is normally directed towards CBD, and this study period took place during the morning peak hours. Link-1 collects huge morning peak traffic from preceding intersections, namely the ‘Bangla Motor Intersection’ and ‘Frame-gate Intersection’. Because of this high volume of traffic, Link-1 has a longer green signal time (80 s) than the other links.
In comparison to a standard urban three-lane road, the hourly volume of traffic is relatively high in Link-1, and this result was also observed in the previous study by Hadiuzzaman [44] for the Sheraton Hotel Intersection. Due to this higher hourly volume of traffic, both intersection delay time and queue length increased in this study area. Higher traffic volume and longer queue length created extreme congestion and a near saturation traffic flow situation in Link-1. The result is a considerable delay in travel during the morning peak hours and, consequently, extra fuel consumption and CO2 emissions in the study area.
The base simulated model also summarizes the traffic condition of the studied junction. The base model tried to mimic the field data and traffic condition with the existing signal timing. The results of the base model are presented in Table 6. As presented in Table 6, the simulated models found very similar traffic volume for all three links. GEH values less than five indicated that the simulated volume is representative of the actual field survey volume. The base model shows the queue length for each link and indicates that the major arterial link directed towards the CBD was the most congested link (Link-1) with the highest queue length (i.e., 131 m) and an average speed of 26.3 km/h.
The overview indicates that during the morning peak time, this intersection has a relatively low travel speed, and the numbers of stops on Link-1 are nearly three times the number of stops on Link-2 and Link-3, which are off-peak during morning hours (Table 6). Thus, it can be argued that, in addition to high traffic volume during morning-peak, the signal timing in this intersection is demonstrating poor performance in managing congestion and travel speed. The simulated result of the base model successfully mimics the existing condition of the intersection and therefore produced reliable 3D traffic videos, which were used for automatic traffic data counts during the video analysis unit.
The video analysis of the 3D simulated video extracted necessary traffic data required to further update the signal timing in the proposed scenarios. The visual outcome of the video analysis script is illustrated in Figure 5. Figure 5a shows the virtual loop setting on Link-1. There are few virtual loops positioned to not only detect vehicle types and count them but also to produce vehicle interchange information required for simulation modelling. After placing the virtual loops before running the template matching algorithm background, subtraction was conducted in the script, and the subtracted background is illustrated in Figure 5b. When running the script, these interfaces remain visible, and related information is displayed in the Python editor. See the text in Figure 5a.
The overall system developed for the video analysis unit detected the vehicle types, and later, the query section produced a traffic condition summary for the intersection presented in Table 7. Table 7 presents the comparison between the actual vehicle volume observed in the 3D traffic video and the vehicle volume extracted by the video analysis unit. The numbers indicate that the video analysis unit underestimated the numbers of vehicles. The error percentages indicate that, overall, the video analysis demonstrated, approximately, a 5% error when detecting and counting vehicle volume. However, the GEH values for all links are below five. This finding indicates that despite miscounting the vehicle numbers, the video analysis volume was very close to representing the actual volume. Therefore, it can be argued that the video analysis outcomes are reliable representations of the traffic conditions in the intersection.

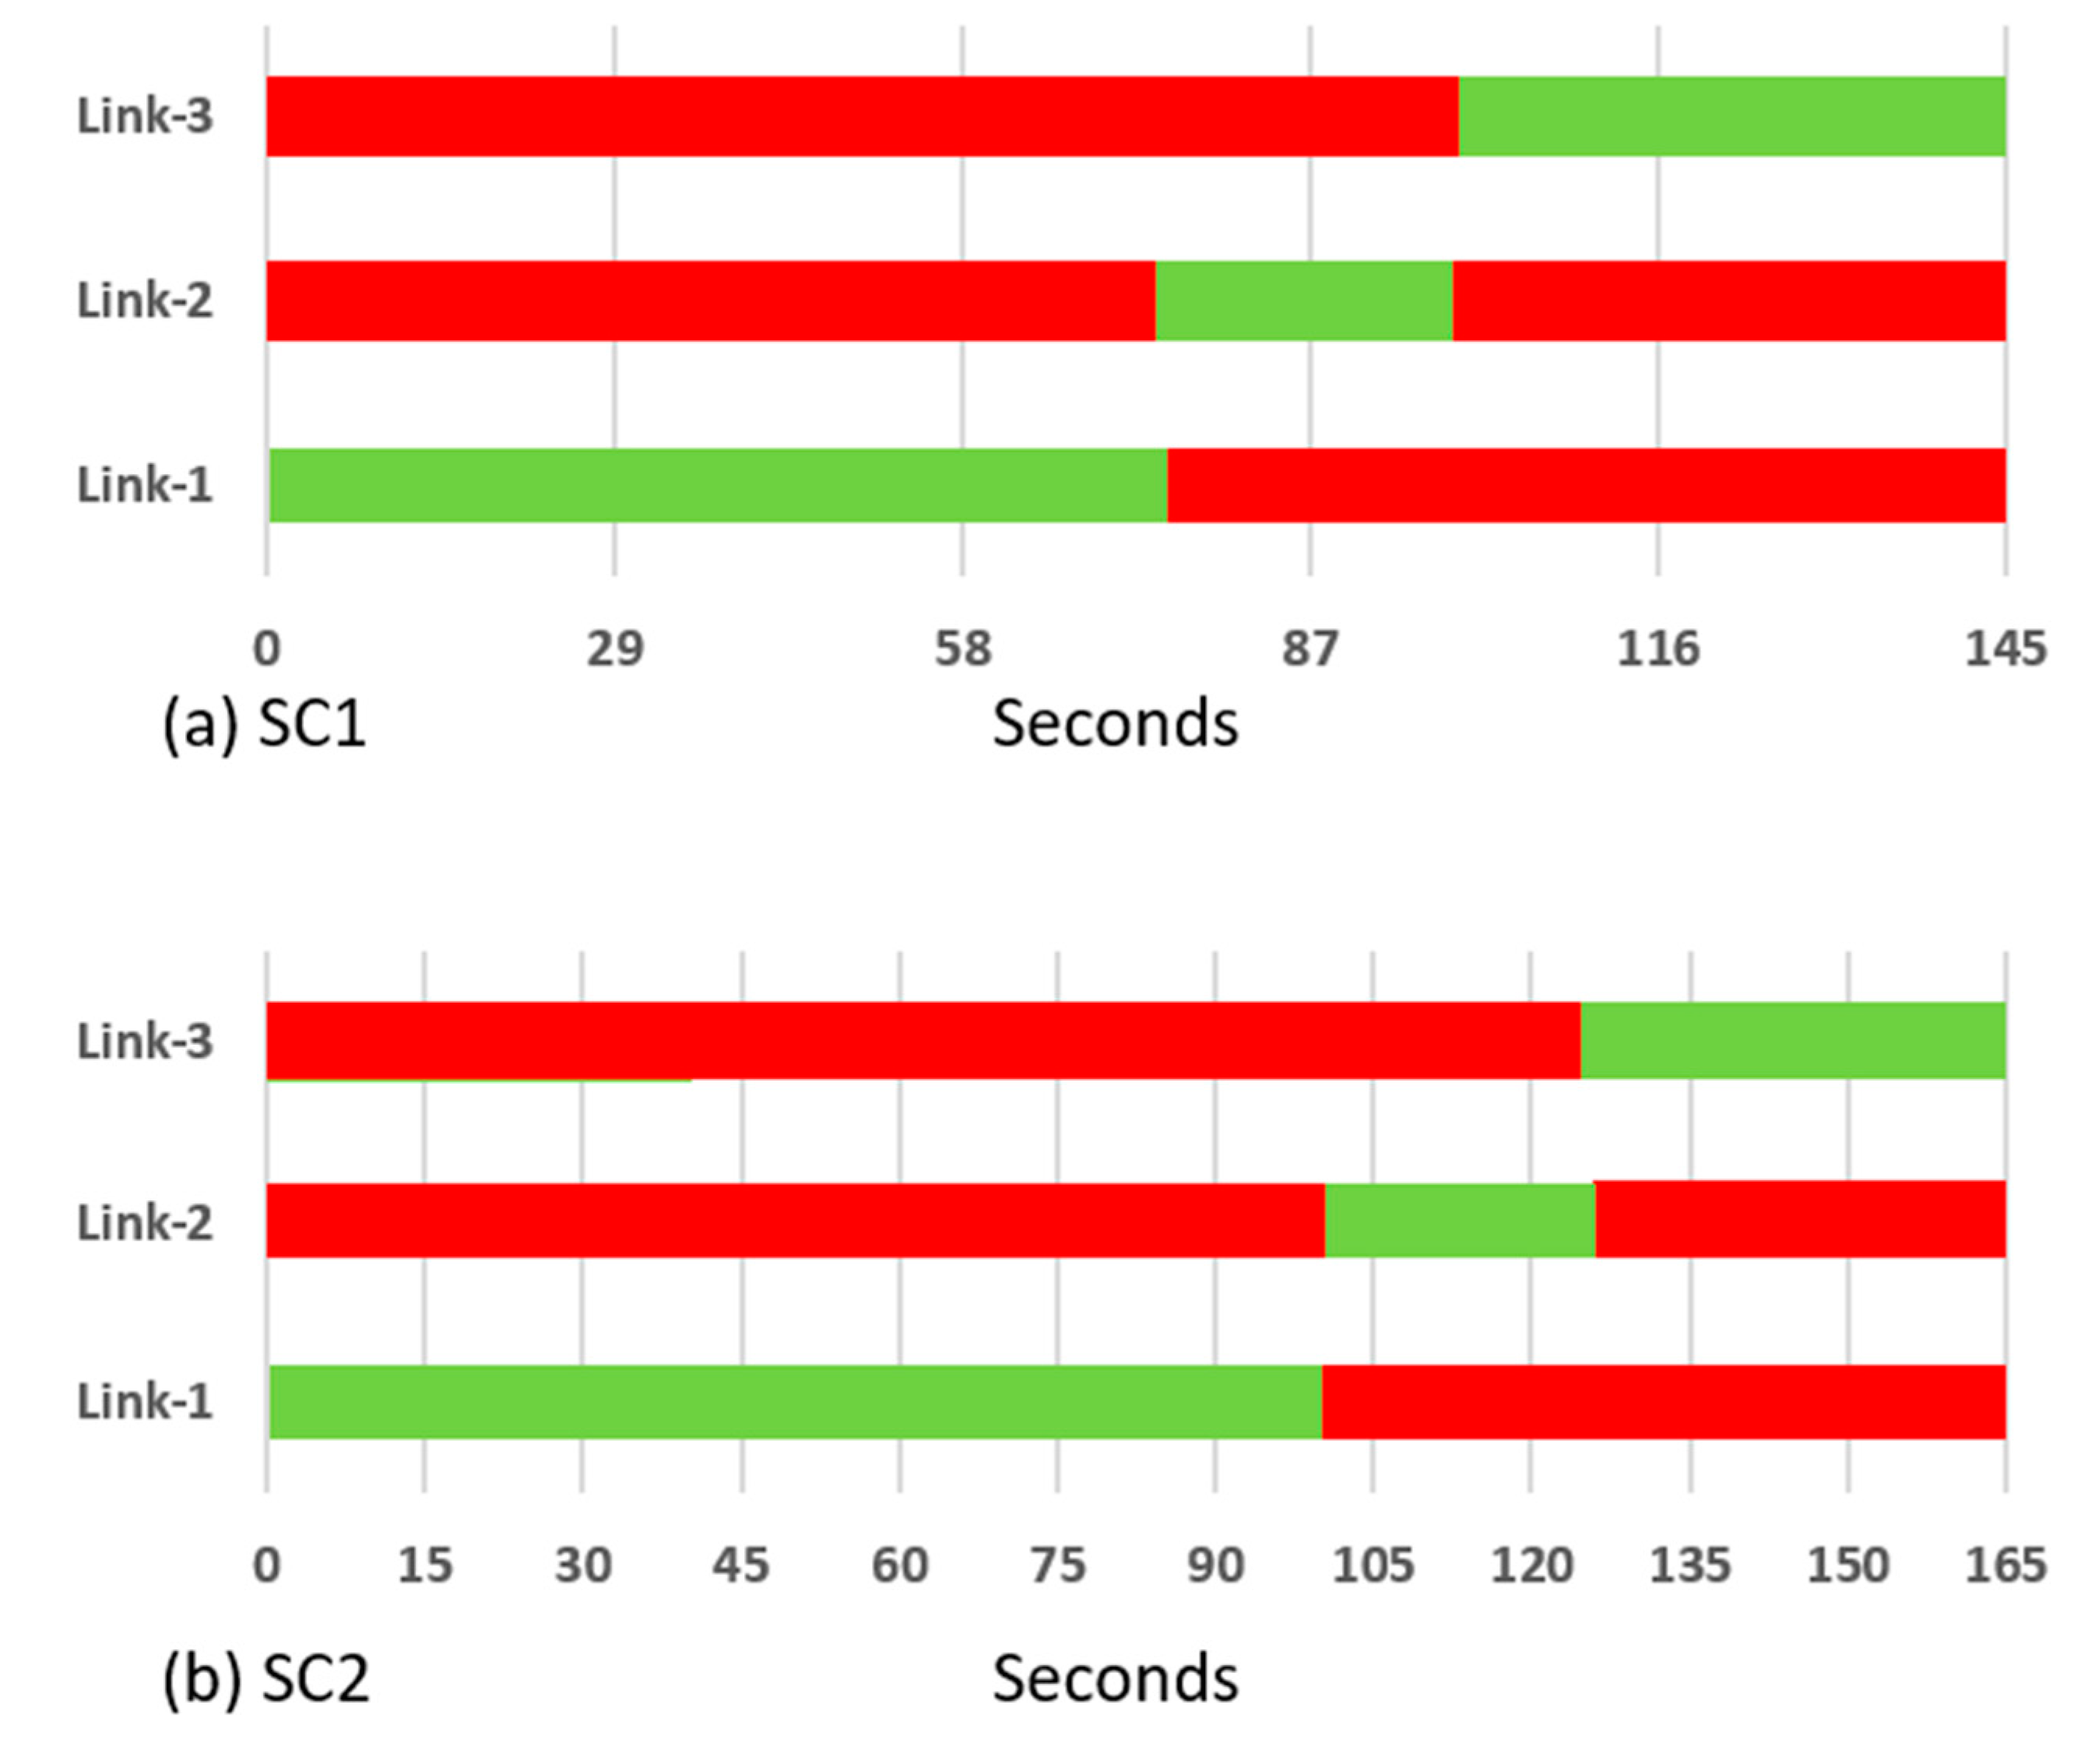
4.2. Results of Tuned Signal Timing

The video analysis traffic data, along with the proposed variable signal timing for Scenario-1 and Scenario-2, produced two simulation outputs and provided opportunities to evaluate the effectiveness of signal time tuning for the Sheraton Hotel Intersection. The results of these two simulated scenarios are presented in Table 8. As illustrated in Table 8, for Scenario-1, the simulated volume was slightly overestimated compared to the video analysis volume. However, the GEH values for all links were less than 5. The acceptable GEH values mean that the simulated volumes in Scenario-1 reflect the actual traffic volume. The simulation results show that for Scenario-1, the updated signal time has considerably reduced the queue length for Link-1.
In the base model there was a 165 s signal cycle (i.e., Link-1 green time: 80 s, Link-2 green time: 25 s, Link-3 green time: 60 s), and the queue length was 131 m. In Scenario-1, the signal cycle was 145 s seconds (i.e., Link-1 green time: 75 s, Link-2 green time: 25 s, Link-3 green time: 45 s), and the queue length became 81 m. Scenario-1 represented a 38.16% reduction in queue length for the congested link (Link-1) of the intersection. There was also a considerable reduction (38%) in queue length for Link-2. For Link-3, the queue length was only reduced by 3 m. Figure 6 illustrates the queue length (in approximate numbers of cars) changes for different scenarios compared to the base condition. It is clear from Figure 6 that the congestion level, measured by the numbers of cars in the queues, was significantly reduced for Scenario-1 compared to base level, and the highest reductions were observed for Link-1 and Link-2.
For Scenario-2, the simulated traffic volume is also slightly overestimated; however, the GEH values for all links were less than five. Thus, the simulated scenario can be accepted as an accurate representation of the observed volume. In Scenario-2, the signal cycle length remained the same as the base condition, but the green time for the links changed. Scenario-2’s updated signal time was still 165 s, but the Link-1 green time was 100 s, the Link-2 green time was 25 s, and the Link-3 green time was 40 s. The additional 20 s of green time for Link-1 (compared to the base condition) resulted in a considerable reduction of queue length. Compared to the queue lengths for the base condition (i.e., 131 m for Link-1) and Scenario-1 (i.e., 81 m for Link-1), the queue length for Link-1 in Scenario-2 was 75 m (Table 8). The updated signal time of Scenario-2 resulted in a 42.7% reduction in queue length for the congested link compared to the base condition and an additional 4.7% queue length reduction compared to Scenario-1. For Link-2, there was a 30% reduction in queue length (compared to the base condition), but compared to Scenario-1, there was an 8% increase observed in the queue length for Link-2. Additionally, for Link-3, the queue length was only reduced by 2 m (Table 8).
The increase of queue length in Link-2 (compared to Scenario-1) and insignificant reduction in queue length for Link-3 were the logical outcomes of the signal timing used when modelling Scenario-2. In this case, more green time was allocated for the congested Link-1. Thus, while there was a slight increase in queue length for Link-2 compared to Scenario-1, there was a considerable reduction in queue length compared to the base condition. For Link-3, there was almost no congestion observed, and the vehicle flow was relatively free from congestion. Thus, the changes in queue length with tuned signal timing were not significant. Considering all the results, it can be argued that the signal timing in Scenario-2 was most effective in reducing congestion in the intersection. In addition, the overall comparison in the visual representation of queue length in Figure 6 confirms that the lowest queue length (measured in numbers of cars) for Link-1 was observed in Scenario-2. Therefore, Scenario-2 more effectively fulfills the objective to reduce the congestion in the intersection.
For Link-1, the numbers of stops significantly dropped for both Scenario-1 (Stops 278) and Scenario-2 (Stops 272, Table 8) compared to the base condition (Stops 615, Table 6). This variance indicates that under the updated signal condition, vehicle operation was smooth in the simulation. Additionally, this finding means the vehicles had reduced delay time on the congested link. However, the increase in average travel speed was not substantially high compared to the base condition. The average vehicle speed was 26.96 km/h at the base condition, but for Scenario-1 the average speed was increased by 0.2 km/h and became 27.16 km/h. For Scenario-2, the average speed increased by 0.58 km/h, becoming 27.54 km/h. For the congested link (Link-1), the average speed increased by 1 km/h in Scenario-2. Thus, it can be argued that the change in signal time had more influence on the average speed of the congested link than other links in the intersection. The possible reason for the minor increase in vehicle speed may be attributed to the signal capacity and presence of near saturation flow at the congested links and the connecting intersections (Bangla Motor and Shahbagh).

5. Discussion

5.1. Evatulation of Proposed Traffic Signal System and Solutions

The purpose of the present study was to develop an expert system that automatically extracts traffic-related information from intersection video footage and utilizes the extracted data to optimally model traffic signal timing to reduce traffic congestion. This study’s aim was achieved by the development and integration of three subsystems into a semi-automatic traffic management system. The first subsystem extracted data from traffic videos, the second subsystem performed mining processes on the extracted data, and the third subsystem used the data to run several microsimulations based on expert input to the data sets (see Section 3.3).
The present study applied openCV algorithms to video analysis of traffic footage (e.g., BS and template matching) to achieve vehicle detection. Test results demonstrated that the video analysis system could detect and classify vehicles with more than 90% accuracy. This result complies with other previous research that used video analysis for vehicle detection and classification in which 70–95% accuracy was obtained in various traffic scenarios (e.g., free-flow or congested) [13,28,55]. Thus, for the present study, the video analysis system was both significantly accurate and reliable. However, it should be noted that the video analysis vehicle count is not identical to the manual count, and the number of vehicles detected by video analysis was lower than the manual observation (Figure 7). The reason for this was that the video analysis used the background subtraction method, and during congestion or vehicle occlusion (red signal), the script was not able to detect vehicles properly due to lack of motion. Similar outcomes were observed in other studies [13,15,50]. This issue resulted in lower numbers of vehicles detected and misclassification of vehicle types. Nonetheless, the GEH statistics (discussed in detail in Section 3.8) indicated the differences between the manual count and the video count for all three links were insignificant (GEH values are less than five, Figure 7). This indicates that the video count can be accepted as a reflection of real traffic volume. As a result, it was applicable to practical traffic management applications.
In addition to video-based vehicle information extraction, the system proposed in this study improved the process of using the extracted data by integrating a newly developed MySQL-based automatic query system to facilitate the process of data-mining. Substantial current research has utilized vehicle tracking utilizing video analysis [13,25,28,29]. However, applying data mining by a query to produce useful summaries of the results of such tracking has rarely been explored to date. To the authors’ best knowledge such approaches have not yet been applied to traffic studies in the context of cities such as Dhaka. The use of such a query-based approach enhanced the efficiency of the proposed system and assisted in producing useful information from large traffic databases. These methods can be replicated in other studies that utilize big traffic data from different sources (e.g., GPS, CCTV video) [20]. The query process used in this study produced the necessary information required for microsimulations (e.g., the vehicle flow summary and the vehicle turning rate) and allowed modelling of two different hybrid signal timing scenarios that reduced traffic congestion compared to the base scenario of a single fixed timing rate for an isolated intersection.
Ultimately, reducing traffic congestion was the true goal of the present study. The results indicated that the selected case study intersection (i.e., the Sheraton Hotel Intersection) had high traffic volume during peak hours and poorly designed fixed timing of the traffic signals. These factors caused considerable unnecessary congestion in the intersection. It should be noted that this finding was in accord with several recent studies on Dhaka’s traffic including studies by Labib et al. [2], Hadiuzzaman [44], and Roy et al. [17]. These studies all noted that traffic volume was high on all the major roads and intersections in Dhaka and that the existing fixed-timing system was obsolete and did not provide effective traffic management.
The present study proposed and tested two variable timing signal scenarios. These scenarios were based on simulations that incorporated a combination of extracted traffic data and expert knowledge (hybrid system). In both scenarios, a significant reduction in the queue length of different links was observed. Additionally, the average travel speed was increased by a small margin. The combination of expert knowledge with microsimulations based on intersection-specific data provided an opportunity to effectively address intersection congestion in cities such as Dhaka, where traffic is not only more heterogeneous than in developed world contexts but also exhibits more random driver behaviors [44,56,57]. The proposed traffic management system and the resulting solutions developed for the present study significantly reduced the congestion of the intersection under study.
The solutions in this paper reduced queue length by 42% for the most congested link (Link-1) and 30% for Link-3. Thus, an overall significant reduction in delays in vehicle operation was achieved. In previous studies, Tian and Zhang [12] applied adaptive control for three intersections in Hefei, China using TRYNSYT optimization and VISSIM simulation. Their study observed 1.5 to 13.9% less delay in their intersections. Ren et al.’s [58] adaptive control system decreased vehicle delay by 40%. Liu et al. [59] achieved a 10% reduction in average delay with an optimized actuated control system. In comparison with these studies, it can be argued that the performance of the proposed system and solutions are satisfactory.

5.2. Policy Implications

Dhaka is not only the world’s densest metro area, but it is also one of the fastest growing megacities with increasing population [47,60,61]. Due to a combination of continual increases in population and accompanying economic activity, traffic volumes and congestion continue to increase [2,44]. The present study demonstrated that traffic management with intersection flow optimization based on hybrid-variable signal timing is relatively effective, even in budget-constrained, developing-world urban areas. As a result, such urban areas can benefit from optimized traffic management systems that do not require extensive and costly modifications to urban infrastructure such as those often required when using actuated signal optimization methods. As of the time of writing, traffic congestion in Dhaka consumes 3.2 million person-hours per day, and this figure is rising as congestion increases. Technically sophisticated and costly ITS systems (e.g., actuated, adaptive control systems) have long been deployed in developed world cities to optimize traffic management. However, the present study suggests that, for a city like Dhaka, it is possible to establish an intelligent signal system that can reduce congestion with a low-cost integrated traffic signal management system. The findings from this study can be useful for policy makers and traffic planners seeking alternative options for reducing traffic congestion.

5.3. Limitations of the Study

The present study successfully developed and tested a new system to update fixed traffic signal timing using video analysis, data mining, and microsimulation modelling. It demonstrated the use of this system in a case study utilizing real-world data. However, the present study and its methodological approach were not free from limitations. The first limitation was that the present study only considers updating signal timing with a pre-programmed variable timing profile. The present study could not explore how much difference continuous real-time traffic data would make when changing signal timing. It must be noted that real-time traffic video in Dhaka was not available at the time of the present study. A second limitation was that the optimization scenarios all considered the intersection as an isolated entity. Thus, different results might be possible under conditions where data from multiple intersections are used (see Section 2.2). A third limitation was that the present study assumed that the geometric design of the intersection was fixed. Modifications of the geometric design of the intersection might also aid traffic flow optimization in conjunction with various timing scenarios. The fourth limitation was that only two scenarios were tested combining expert knowledge and contextual information. The present study’s approach to data analysis based on the selected data extraction and data mining methods were not the only possible approaches to data analysis. Utilizing AI and highly sophisticated optimization algorithms (e.g., POS, GA, ANN) many possible scenarios could be tested quickly using the present study’s analytic approach. However, this approach was beyond either the financial or temporal scope of the present study.
The final limitation was the cost of the software. In this study VISSIM micro-simulation software was utilized, and licensing is costly. Therefore, the overall cost related to this study was not significantly low. However, it should be noted that several pieces of open source traffic simulation software (e.g., Simulation of Urban Mobility-SUMO) [62] are available and can be used instead of VISSIM; however, the integrated application of these open source software packages was not tested in this paper. For future studies, such applications can be integrated and tested to design a system with a minimum overall cost.

6. Conclusions

Improving traffic conditions in fast-growing urban areas of the developing world is a matter of ongoing concern to urban planners, traffic managers, and environmental advocates to both uplift travel efficiency and the quality of the natural world. Elimination of nearly obsolete fixed-time signals at busy intersections in favor of variable timing signal systems geared to extant traffic conditions can make a significant difference to traffic congestion, safety, and air-borne pollution. The present study demonstrated the integration of various available and relatively low-cost technologies to create a more efficient traffic signal management system. The proposed system combined video data analysis, data mining, and expert opinion to optimize variable signal timing profiles and reduce congestion at a signalized intersection based on microsimulations.
The proposed system was tested on real-world data collected from a congested intersection in Dhaka, and results suggested that the system could improve traffic outcomes more cost-effectively than ITS systems through the use of real-time traffic videos. Additionally, the inclusion of the expert opinion-based scenarios averted the need for sophisticated and data-intensive AI systems and infrastructure and addressed the gap in the contemporary research on signal tuning and optimization. The video analysis algorithm used in this study successfully detected the location and composition of the vehicles in the intersection with minor errors for vehicle occlusion. Both scenarios developed utilizing microsimulations of extant real-world traffic conditions resulted in improvements in traffic conditions characterized by significantly reduced vehicle queue lengths (e.g., approximately 40% reduction on congested links) and an increase in the average traffic speed. The significant reduction of the queue length illustrated the effectiveness of the application of the custom variable timing profile on traffic congestion at the intersection under study and validated the outcome of the proposed system supporting its testing at other intersections in Dhaka and other urban areas.
The results of the present study suggest several areas that might prove useful for future research. The first of these is to study the effect of changes on intersection infrastructure and site geometry on traffic optimization based on variable signal timing in response to traffic conditions. Future studies might include detection of pedestrians and bicyclists crossing the intersection and incorporate these considerations into overall vehicular volumes to better optimize signal timing in dimensions that include these participants and their safety in intersection activity. Finally, given the low cost and effectiveness of the technologies utilized in the present study and the rapid spread of data networks, both fixed and wireless, further research can explore the possibility of designing a networked system integrating all signalized intersections in a city such as Dhaka.

Author Contributions

S.M.L. conceived and designed the work and co-wrote the manuscript; S.M.L. and H.M. performed the data processing and analysis for VISSIM modelling. I.M.A.H. and S.H.S. designed and developed the software system in conjunction with S.M.L., I.M.A.H. and S.H.S. also ran the video analysis and automated the process. S.H. provided commentary and final editing on the paper.

Funding

This research received no external funding.

Acknowledgments

This work was conducted during S.M.L. and H.M.’s pursuit of Master’s Degrees at Bangladesh University of Engineer and Technology (BUET). The VISSIM modelling was taught and supervised by Md. Hadiuzzaman, BUET, the authors thank him for his effort in teaching the necessary skills. The authors also like thanks the other group members (Md. Mashrur Rahaman, Uttama Barua, Kawser Bin Zaman) for assisting in the field survey and scenario development. The authors thank Zhi Chen of the School of Urban and Regional Planning, University of Iowa for his assistance with the pseudocode. Last but not least, thanks to the editors and three anonymous reviewers of this paper for their constructive comments and suggestions, their comments and suggestions helped improving the paper.

Conflicts of Interest

The authors declare no conflict of interest.

References

  1. Ma, X.; Jin, J.; Lei, W. Multi-criteria analysis of optimal signal plans using microscopic traffic models. Transp. Res. Part D Transp. Environ. 2014, 32, 1–14. [Google Scholar] [CrossRef] [Green Version]
  2. Labib, S.; Neema, M.; Rahaman, Z.; Patwary, S.; Shakil, S. Carbon dioxide emission and bio-capacity indexing for transportation activities: A methodological development in determining the sustainability of vehicular transportation systems. J. Environ. Manag. 2018, 223, 57–73. [Google Scholar] [CrossRef] [PubMed]
  3. Pop, M.D. Traffic lights management using optimization tool. Procedia-Soc. Behav. Sci. 2018, 238, 323–330. [Google Scholar] [CrossRef]
  4. Bottino, A.; Garbo, A.; Loiacono, C.; Quer, S. Street viewer: An autonomous vision based traffic tracking system. Sensors 2016, 16, 813. [Google Scholar] [CrossRef]
  5. Kwak, J.; Park, B.; Lee, J. Evaluating the impacts of urban corridor traffic signal optimization on vehicle emissions and fuel consumption. Transp. Plan. Technol. 2012, 35, 145–160. [Google Scholar] [CrossRef]
  6. Lee, J.; Park, B.B.; Malakorn, K.; So, J.J. Sustainability assessments of cooperative vehicle intersection control at an urban corridor. Transp. Res. Part C Emerg. Technol. 2013, 32, 193–206. [Google Scholar] [CrossRef]
  7. Jing, P.; Hao, H.; Long, C. An Adaptive Traffic Signal Control in a Connected Vehicle Environment: A Systematic Review. Information 2017, 8, 101. [Google Scholar] [CrossRef]
  8. Zhao, D.; Dai, Y.; Zhang, Z. Computational intelligence in urban traffic signal control: A survey. IEEE Trans. Syst. Man Cybern. Part C (Appl. Rev.) 2012, 42, 485–494. [Google Scholar] [CrossRef]
  9. Miller, A.J. Settings for fixed-cycle traffic signals. J. Oper. Res. Soc. 1963, 14, 373–386. [Google Scholar] [CrossRef]
  10. Feng, Y.; Head, K.L.; Khoshmagham, S.; Zamanipour, M. A real-time adaptive signal control in a connected vehicle environment. Transp. Res. Part C Emerg. Technol. 2015, 55, 460–473. [Google Scholar] [CrossRef]
  11. Gordon, R. Intelligent Transportation Systems; Springer: Cham, Switzerland, 2016. [Google Scholar]
  12. Tian, R.; Zhang, X. Design and Evaluation of an Adaptive Traffic Signal Control System—A Case Study in Hefei, China. Transp. Res. Procedia 2017, 21, 141–153. [Google Scholar] [CrossRef]
  13. Xia, Y.; Shi, X.; Song, G.; Geng, Q.; Liu, Y. Towards improving quality of video-based vehicle counting method for traffic flow estimation. Signal Process. 2016, 120, 672–681. [Google Scholar] [CrossRef]
  14. Vaughn, D. Vehicle Speed Control Based on GPS/MAP Matching of Posted Speeds. U.S. Patent 5,485,161, 16 January 1996. [Google Scholar]
  15. Moutakki, Z.; Ouloul, I.; Afdel, K.; Amghar, A. Real-Time Video Surveillance System for Traffic Management with Background Subtraction Using Codebook Model and Occlusion Handling. Transp. Telecommun. J. 2017, 18, 297–306. [Google Scholar] [CrossRef] [Green Version]
  16. Khadem, R. Deficiency of Traffic Signal Control System in Dhaka City. Master’s Thesis, Bangladesh University of Engineering and Technology, Dhaka, Bangladesh, 2011. [Google Scholar]
  17. Roy, K.; Barua, S.; Das, A. A Study on Feasible Traffic Operation Alternatives at Signalized Intersection in Dhaka City. In International Conference on Recent Innovation in Civil Engineering for Sustainable Development; Department of Civil Engineering, DUET: Gazipur, Bangladesh, 2015; pp. 656–660. [Google Scholar]
  18. Labib, S.; Mohiuddin, H.; Shakil, S. Transport Sustainability of Dhaka: A Measure of Ecological Footprint and Means for Sustainable Transportation System. J. Bangladesh Inst. Plan. 2013, 6, 137–147. [Google Scholar]
  19. Zhang, J.; Wang, F.; Wang, K.; Lin, W.; Xu, X.; Chen, C. Data-Driven Intelligent Transportation Systems: A Survey. IEEE Trans. Intell. Transp. Syst. 2011, 12, 1624–1639. [Google Scholar] [CrossRef]
  20. Barai, S.K. Data mining applications in transportation engineering. Transport 2003, 18, 216–223. [Google Scholar] [CrossRef]
  21. Lu, E.H.C.; Lee, W.C.; Tseng, V.S. Mining fastest path from trajectories with multiple destinations in road networks. Knowl. Inf. Syst. 2011, 29, 25–53. [Google Scholar] [CrossRef]
  22. Kurdi, H.A. Review of Closed Circuit Television (CCTV) Techniques for Vehicles Traffic Management. Int. J. Comput. Sci. Inf. Technol. 2014, 6, 199–206. [Google Scholar] [CrossRef]
  23. Kastrinaki, V.; Michalis, Z.; Kostas, K. A survey of video processing techniques for traffic applications. Image Vis. Comput. 2003, 21, 359–381. [Google Scholar] [CrossRef] [Green Version]
  24. Chong, Y.; Chen, W.; Li, Z.; Lam, W.H.; Zheng, C.; Li, Q. Integrated real-time vision-based preceding vehicle detection in urban roads. Neurocomputing 2013, 116, 144–149. [Google Scholar] [CrossRef]
  25. Zhang, H.; Wu, K. A vehicle detection algorithm based on three-frame differencing and background subtraction. In Proceedings of the Fifth International Symposium on Computational Intelligence and Design, Hangzhou, China, 28–29 October 2012; pp. 148–151. [Google Scholar] [CrossRef]
  26. Liu, Y.; Lu, Y.; Shi, Q.; Ding, J. Optical flow based urban road vehicle tracking. In Proceedings of the 9th International Conference on Computational Intelligence and Security (CIS), Leshan, China, 14–15 December 2013; pp. 391–395. [Google Scholar] [CrossRef]
  27. Cheung, S.; Kamath, C. Robust Background Subtraction with Foreground Validation for Urban Traffic Video. EURASIP J. Adv. Signal Process. 2005, 14, 726261. [Google Scholar] [CrossRef]
  28. Bragatto, T.A.; Ruas, G.I.; Benso, V.A.; Lamar, M.V.; Aldigueri, D.; Teixeira, G.L.; Yamashita, Y. A new approach to multiple vehicle tracking in intersections using harris corners and adaptive background subtraction. In Proceedings of the Intelligent Vehicles Symposium, Eindhoven, The Netherlands, 4–6 June 2008; pp. 548–553. [Google Scholar] [CrossRef]
  29. Uke, N.; Thool, R. Moving vehicle detection for measuring traffic count using openCV. J. Autom. Control Eng. 2013, 1, 349–352. [Google Scholar] [CrossRef]
  30. Abdulrahim, K.; Salam, R.A. Traffic surveillance: A review of vision based vehicle detection, recognition and tracking. Int. J. Appl. Eng. Res. 2016, 11, 713–726. [Google Scholar]
  31. Barcellos, P.; Bouvié, C.; Escouto, F.; Scharcanski, J. A novel video based system for detecting and counting vehicles at user-defined virtual loops. Expert Syst. Appl. 2015, 42, 1845–1856. [Google Scholar] [CrossRef]
  32. Li, D.; Liang, B.; Zhang, W. Real-time moving vehicle detection, tracking, and counting system implemented with OpenCV. In Proceedings of the 2014 4th IEEE International Conference on Information Science and Technology (ICIST), Shenzhen, China, 26–28 April 2014; pp. 631–634. [Google Scholar] [CrossRef]
  33. Stevanovic, A.; Stevanovic, J.; Zhang, K.; Batterman, S. Optimizing Traffic Control to Reduce Fuel Consumption and Vehicular Emissions. Transp. Res. Rec. J. Transp. Res. Board 2009, 2128, 105–113. [Google Scholar] [CrossRef]
  34. Hamilton, A.; Waterson, B.; Cherrett, T.; Robinson, A.; Snell, I. The evolution of urban traffic control: Changing policy and technology. Transp. Plan. Technol. 2013, 36, 24–43. [Google Scholar] [CrossRef]
  35. Heung, T.; Ho, T.; Fung, Y. Coordinated Road-Junction Traffic Control by Dynamic Programming. IEEE Trans. Intell. Transp. Syst. 2005, 6, 341–350. [Google Scholar] [CrossRef] [Green Version]
  36. Mulandi, J.; Stevanovic, A.; Martin, P. Cross-Evaluation of Signal Timing Optimized by Various Traffic Simulation and Signal Optimization Tools. Transp. Res. Rec. J. Transp. Res. Board 2010, 2192, 147–155. [Google Scholar] [CrossRef]
  37. Tenekeci, G. A modelling technique for assessing linked MOVA. Proc. Inst. Civ. Eng.-Transp. 2007, 160, 125–138. [Google Scholar] [CrossRef]
  38. Wood, K.; Crabtree, M.; Kirkham, A.; Maxwell, A.; Robbins, R. Survey of MOVA and SCOOT Operation at M42 Junction 6; TRL Published Project Report; TRL limited: Wokingham, UK, 2008; Available online: https://trl.co.uk/sites/default/files/PPR252_secure.PDF (accessed on 10 March 2018).
  39. Cantarella, G.; de Luca, S.; Di Pace, R.; Memoli, S. Network Signal Setting Design: Meta-heuristic optimisation methods. Transp. Res. Part C Emerg. Technol. 2015, 55, 24–45. [Google Scholar] [CrossRef]
  40. Park, B.; Schneeberger, J. Microscopic Simulation Model Calibration and Validation: Case Study of VISSIM Simulation Model for a Coordinated Actuated Signal System. Transp. Res. Rec. J. Transp. Res. Board 2003, 1856, 185–192. [Google Scholar] [CrossRef]
  41. Yulianto, B.; Adventaras, B.S.; Dyan, R.W.P. Analysis of signalized intersection performance using IHCM 1997 method and PTV Vistro software. MATEC Web Conf. 2018, 195, 04012. [Google Scholar] [CrossRef]
  42. Gökçe, M.A.; Öner, E.; Işık, G. Traffic signal optimization with Particle Swarm Optimization for signalized roundabouts. Simulation 2015, 91, 456–466. [Google Scholar] [CrossRef]
  43. Ghanim, M.; Abu-Lebdeh, G. Real-Time Dynamic Transit Signal Priority Optimization for Coordinated Traffic Networks Using Genetic Algorithms and Artificial Neural Networks. J. Intell. Transp. Syst. 2015, 19, 327–338. [Google Scholar] [CrossRef]
  44. Hadiuzzaman, M. Development of a Saturation Flow and Delay Models for Signalized Intersection in Dhaka City. Master’s Thesis, Bangladesh University of Engineering and Technology, Dhaka, Bangladesh, 2008. [Google Scholar]
  45. Bhuiyan, M.A.A.; Khan, I.R.; Khan, M.R.M.; Rifaat, S.M. Optimizing signal timing: An efficient way to handle traffic congestion in developing countries. In Proceedings of the 5th Brunei International Conference on Engineering and Technology (BICET 2014), Bandar Seri Begawan, Brunei, 1–3 November 2014; pp. 1–6. [Google Scholar] [CrossRef]
  46. Hobbes, M. Welcome to the Traffic Capital of the World. Available online: https://newrepublic.com/article/118416/what-dhaka-bangladesh-traffic-capital-world-can-teach-us (accessed on 29 December 2018).
  47. Labib, S.; Harris, A. The potentials of Sentinel-2 and LandSat-8 data in green infrastructure extraction, using object based image analysis (OBIA) method. Eur. J. Remote Sens. 2018, 51, 231–240. [Google Scholar] [CrossRef]
  48. Fellendorf, M.; Peter, V. Fundamentals of Traffic Simulation; Barceló, J., Ed.; Springer: New York, NY, USA, 2010; Chapter 2; pp. 63–93. [Google Scholar]
  49. OpenCV Template Matching—OpenCV 2.4.13.7 Documentation. Available online: https://docs.opencv.org/2.4/doc/tutorials/imgproc/histograms/template_matching/template_matching.html (accessed on 10 March 2018).
  50. Velazquez-Pupo, R.; Sierra-Romero, A.; Torres-Roman, D.; Shkvarko, Y.; Santiago-Paz, J.; Gómez-Gutiérrez, D.; Robles-Valdez, D.; Hermosillo-Reynoso, F.; Romero-Delgado, M. Vehicle Detection with Occlusion Handling, Tracking, and OC-SVM Classification: A High Performance Vision-Based System. Sensors 2018, 18, 374. [Google Scholar] [CrossRef]
  51. Cycle Length Determination. Available online: https://www.webpages.uidaho.edu/niatt_labmanual/Chapters/signaltimingdesign/professionalpractice/CycleLengthDetermination.htm (accessed on 12 March 2018).
  52. Murat, Y.; Gedizlioglu, E. A fuzzy logic multi-phased signal control model for isolated junctions. Transp. Res. Part C Emerg. Technol. 2005, 13, 19–36. [Google Scholar] [CrossRef]
  53. Chitturi, M.; Shaw, J.; Campbell, J.; Noyce, D. Validation of Origin–Destination Data from Bluetooth Reidentification and Aerial Observation. Transp. Res. Rec. J. Transp. Res. Board 2014, 2430, 116–123. [Google Scholar] [CrossRef]
  54. Dowling, R.; Skabardonis, A.; Halkias, J.; McHale, G.; Zammit, G. Guidelines for Calibration of Microsimulation Models: Framework and Applications. Transp. Res. Rec. J. Transp. Res. Board 2004, 1876, 1–9. [Google Scholar] [CrossRef]
  55. Thiang AT, G.; Lim, R. Type of vehicle recognition using template matching method. In Proceedings of the International Conference on Electrical, Electronics, Communication and Information, Jakarta, Indonesia, 7–8 March 2001. [Google Scholar]
  56. Mahmud, K.; Gope, K.; Chowdhury, S. Possible Causes & Solutions of Traffic Jam and Their Impact on the Economy of Dhaka City. J. Manag. Sustain. 2012, 2, 112. [Google Scholar] [CrossRef]
  57. Labib, S.; Rahaman, M.; Patwary, M. Green Transport Planning for Dhaka City: Measures for Environment Friendly Transportation System. Bachelor’s Thesis, Bangladesh University of Engineering and Technology, Department of Urban and Regional Planning, Dhaka, Bangladesh, 2014. [Google Scholar] [CrossRef]
  58. Ren, Y.; Wang, Y.; Yu, G.; Liu, H.; Xiao, L. An Adaptive Signal Control Scheme to Prevent Intersection Traffic Blockage. IEEE Trans. Intell. Transp. Syst. 2016, 1–10. [Google Scholar] [CrossRef]
  59. Liu, H.; Oh, J.; Recker, W. Adaptive Signal Control System with Online Performance Measure for a Single Intersection. Transp. Res. Rec. J. Transp. Res. Board 2002, 1811, 131–138. [Google Scholar] [CrossRef]
  60. Labib, S.M.; Rahaman, Z.; Patwary, M.S.H. Comprehensive evaluation of urban public Non-Motorized Transportation Facility services in Dhaka. In Proceedings of the 8th Multidisciplinary Academic Conference, Prague, Czech Republic, 14–15 October 2016; pp. 124–132. [Google Scholar]
  61. Labib, S.M. Volunteer GIS (VGIS) based waste management: A conceptual design and use of web 2.0 for smart waste management in Dhaka City. In Proceedings of the 2017 Third International Conference on Research in Computational Intelligence and Communication Networks (ICRCICN), Kolkata, India, 3–5 November 2017; pp. 137–141. [Google Scholar] [CrossRef]
  62. Krajzewicz, D.; Jakob, E.; Michael, B.; Laura, B. Recent development and applications of SUMO-Simulation of Urban MObility. Int. J. Adv. Syst. Meas. 2012, 5, 128–138. [Google Scholar]
Figure 1. (a) Dhaka city Map, the black circle indicating the location of the case study intersection Source: [47]; (b) Google Earth Map of the case study intersection indicating three links.
Urbansci 03 00041 g001
Figure 2. Conceptual design of the proposed system showing the integration of the three subsystems. Subsystem 1: video analysis, Subsystem 2: automated query, Subsystem 3: simulation.
Urbansci 03 00041 g002
Figure 3. Base condition fixed-time green and red signal cycle for different links for the case study intersection.
Urbansci 03 00041 g003
Figure 4. Proposed updated signal timing for the case study junction. (a) Signal timing for Scenario-1, with a total 145 s cycle length and 75 s of green time for Link-1; (b) Scenario-2 signal timing with a 165 s cycle length and 100 s of green time for Link-1. SC1, Scenario-1; SC2, Scenario-2.
Urbansci 03 00041 g004
Figure 5. (a) Initiating the python script, importing the 3D traffic video, setting the virtual loop for vehicle detection and count for Link-1. (b) Background subtraction for vehicle detection using openCV.
Urbansci 03 00041 g005
Figure 6. Visual comparisons of queue length in terms of numbers of cars for the base condition, Scenario-1, and Scenario-2 updated signal timing. Base condition (Link-1: 29, Link-2: 11, Link-3: 13 cars), Scenario-1 (Link-1: 18, Link-2: 7, Link-3: 13 cars), Scenario-2 (Link-1: 16, Link-2: 8, Link-3: 13 cars).
Urbansci 03 00041 g006
Figure 7. Comparisons of manual and video count traffic volume for the three links in the junction. The secondary axis shows the GEH value.
Urbansci 03 00041 g007
Table 1. Base model traffic behaviour parameters.
Traffic Behaviour ParametersBase Model Parameters
Car following Avg. Stand still 2.00 (m)
Additive part of safety 2.00 (m)
Multiplic. Part of safety 2.00 (m)
Lane changing General Behaviour Free lane selection
Lateral ChangeDesired Position Middle of lane
Consider Next turning direction Not Marked
Over take on same lane Not marked
Min. lateral distance 1 at 0 km/h1 at 50 km/h
Table 2. Pseudo code snippets used in the scripts to extract vehicle information from videos.
BlockCode Snippet
Block-1# Libraries
Import numpy, Computer Vision Library, Time
# Import template, footage, and resize videos
Bring in video footage with CV2. VideoCapture
Bring in template image with CV2. Imread
Resize video width to 20
Resize video height to 20
#setup and select a method of detection
Methods [Coefficient, Coefficient Normalized, Correlation, Correlation Normalized, Square Difference, Square Difference Normalized]
Block-2# Select a Method
Select Square Difference Normalized method
CV2. FONT_HERSHEY_COMPLEX
# Data Collection
Create a CSV file with 5 points at (0,0), a at 300, b at 500
While
Read footage
Resize frame to (640, 480)
Run matching algorithm with CV@, match template
Remove the background
Resize result of the matching algorithm
Set 5 virtual loop frames
Define 5 image moments to select objects
Template match for different objects
Block-3Detect car if moment 1 is greater than threshold of 300 and less than threshold of 500
Record information
Sleep for 0.09
Detect buses if moment 1 is greater than threshold of 500
Record information
Table 3. Code snippet to automate summary production by running query.
BlockCode Snippet
Block-1:establish Connection With Database (host, user);
If file Open (fileName) == TRUE then:
while get Data From CSV(fileName) !== FALSE:
If validate Data(type, position, lane) == TRUE then:
:sql = Insert into table (type, position, lane) values (data [0], data [1], data [2]);
:query = mysql_query(sql);
file Close(fileName);
Block-2: establish Connection With Database (host, user);
If connection Establish With Database == FALSE then:
Kill Session With Database();
break;
:user Input Of Lane = user Input Of Lane From Web;
:user Input Of Type = user Input Of Type From Web;
:sqlQuery = select * from table where lane= ‘user Input Of Lane’ and type = ‘user Input Of Type’;
If (fetch Result (sqlQuery) == TRUE) then:
If (num Of Row Fetch > 0) then:
show Type Position Lane And Number Of Vehicle Count (type, position, lane, count);
else:
show No Data Found();
close Database ConnectionConnection();
Table 4. Changes in traffic behaviour parameters for scenario-1 and scenario-2 models.
Traffic Behaviour ParametersBase Model ValuesDifferent Scenarios Values
Car following Avg. Stand still 2.00 (m)1.30 (m)
Additive part of safety 2.00 (m)1.00 (m)
Multiplic. Part of safety 2.00 (m)1.00 (m)
Lane changing General Behaviour Free lane selectionFree lane selection
Lateral changeDesired Position Middle of laneAny Position
Consider next turning direction Not markedMarked
Over take on same lane Not markedMarked (Left and Right)
Min. lateral distance 1 at 0 km/h1 at 50 km/h0.3 at 0 km/h0.3 at 50 km/h
Table 5. Modal distribution of traffic in three links of the sheraton intersection.
ModeLink-1Link-2Link-3
Volume CountVolume %Volume CountVolume %Volume CountVolume %
Car877503596934350
HGV533102345
Bus316180012318
Motor cycle508291462817826
Total1753100516100678100
Table 6. Base model simulation results for sheraton hotel intersection.
Link Field Survey VolumeBase Model Simulated VolumeGEH ValueQueue Length (m)No. of StopsSpeed (km/h)
Link-1175317160.88813161626.1
Link-25214801.8335034529.6
Link-36856970.4576113425.2
Table 7. Observed and video analysis traffic volume comparison.
LinkSimulated Volume (Base Model 3D Video)Video Analysis VolumeGHE ValueError Percentage
Link-1171615982.8986.731
Link-24804153.0723.707
Link-36975963.3975.761
Table 8. Scenario-1 and scenario-2 simulation outputs.
ScenarioLinkVideo Analysis VolumeNew Simulated VolumeGEH ValueQueue Length (m)No. of StopsSpeed (km/h)
Scenario-1Link-1159817072.6818127826.2
Link-24154833.2093131829.8
Link-35966883.6305813425.5
Scenario-2Link-1159817172.9227527227.3
Link-24154843.2543631829.8
Link-35966913.7445913425.5

