1. Introduction
Low-density suburbanisation has been the dominant trend of urban growth in major cities in the US, Canada and Australia since the end of WWII [
1,
2]. In addition to a general world population increase, urban areas in particular are expected to house more than half of the world’s population by 2020 [
3], and two thirds (66%) by 2050 [
4]. The effects of urbanisation on the environment around the world have become a major concern [
5]. Urban expansion is one of the major causes of natural ecosystem degradation [
6] as it displaces natural land cover and destroys natural habitats [
7,
8]. By removing vegetation, these changes reduce the rate of atmospheric carbon dioxide sequestration [
9] and the cooling effect provided by vegetation to the atmosphere, resulting in the urban heat island effect [
10,
11], among other problems. In many cases, urban expansion has exacerbated spatial inequalities as amenities often remain concentrated in the central areas [
12]. It results in job-worker imbalances which are a significant contributor to long commuting distances and reliance on unsustainable travel modes [
12,
13,
14,
15].
The pace and trajectory of urban expansion is driven by many external factors, which can either constrain the expansion or facilitate it into urban sprawl. Urban sprawl is often the physical outcome of urbanisation, and is usually the term used to denote unsustainable urban expansion [
5]. The phenomenon of urban sprawl/expansion has been discussed extensively in the literature. Several studies have also investigated forces that affect urban growth and shape the urban form, however, this is neither uniform nor constant. Catalán, Saurí [
16] assert that the study of urban form “must be approached and understood taking into account specific geographical and historical contexts in which particular urban forms shape cities” (p. 174). A polarisation of case studies on North-American urban expansion and transitional urban patterns of some European cities (e.g., Barcelona and Athens) is noted in the literature. An overwhelming amount of studies ascribes sprawling largely to increasing automobile usage and road network expansions [
17,
18,
19,
20,
21]. Also evident in the literature is the wealth of theoretical discussion highlighting the debate between compact and dispersed urban forms. There is limited study on the evolution of dispersed urban form in different contexts outside these trends. Studies of urban growth drivers interwoven along the trajectory of city development are imperative.
Perth presents a good opportunity to study the pattern of expansion in post-colonial cities. The evolutionary journey of Perth from a small colonial town of 1829 to a modern metropolis has attracted the interest of urban scientists due to its rapid and dispersed suburbanisation that made it one of the most sprawling cities in the world (see, among others, Alexander and McManus [
22]; Alexander, Greive [
23]; Falconer, Newman [
24] Curtis and Mellor [
25] and Troy [
26]). In 1970, the Perth Metropolitan Region (PMR) contained 0.7 million people in about 500 km
2 of area. While the population was twice as much in 2005, the footprint area, on the other hand, had more than doubled [
27]. In 2015, the population within the PMR was 2.04 million, which amounted to 79% of the total Western Australian population. The highest population growth in the state happened in Perth’s outer suburbs [
28]. The metropolitan area of Perth now spans more than 100 km from north to south. The city recorded a maximum density of just 3600 people per km
2 in 2015 [
28,
29]. Today, Perth (with just about 2 million people) has a larger area (1566 km
2) than some of the older and most populated cities in the world including Hong Kong (285 km
2 for 7.3 million people), Madrid (1321 km
2 for 6.2 million people) and Istanbul (1360 km
2 for 13.8 million over) [
30].
Studies have identified transport as a major driver of urban growth [
11,
18,
31,
32]. In Perth, the state government has invested significantly in transport infrastructure over the years. As Alexander and McManus [
22] describe it, “Perth laid out freeways like red carpet to welcome the automobile” (p. 6). The city has also, to date, invested in about 180 km of heavy rail across five passenger lines—plus one currently under construction to the airport, all of which run electric trains. These investments facilitated the city’s expansion, as they alleviated the effects of living further from the city centre [
25]. Undoubtedly, economic development also plays a fundamental role in driving urban expansion [
18,
33,
34,
35]. In addition to making transport investments possible, the associated improving quality of life enables families to cope with longer distance commutes. These infrastructure (and other urban development) expansions occur under a system of planning regulations that evolves over time. As it rezones and releases land for development, the planning framework directly influences the pattern (shape, direction and pace) of how the urban form evolves. The planning framework in Perth has applied different philosophies over the years. At one point expansion from the city centre was encouraged [
36] and now the policies are advocating limiting future expansion outside the current urban footprint for a compact urban form [
37].
This paper investigates the role of transport developments in driving urban form change in the PMR. Given that transport is also influenced by other factors, and the importance of the combinations of these factors [
34], we start our analysis by relating past transport developments to economic milestones and planning framework. Thus, we identify the major milestones under the broad themes of transport, economic development and planning framework that happened in the state since British colonisation, and develop and deconstruct their timelines in relation to land development. We advance our analysis into a focus on the interaction between transport and urban growth. The paper ends by mapping and quantifying changes in urban land over the past five decades.
1.1. Data
A large part of the information in this work is a product of reviewing historical literature on Perth and the state of Western Australia (WA). Government publications, museum archives, population data and academic articles have been reviewed and analysed to understand and examine the growth of Perth and develop a timeline of milestones. The WA Department of Planning provided copies of the PMR statutory plans and historic Metropolitan Region Scheme (MRS) data for the years 1963, 1971, 1992, 2002, 2012 and 2016 (the MRS is a statutory plan of broad land zones for future development in Perth).
1.2. Study Area
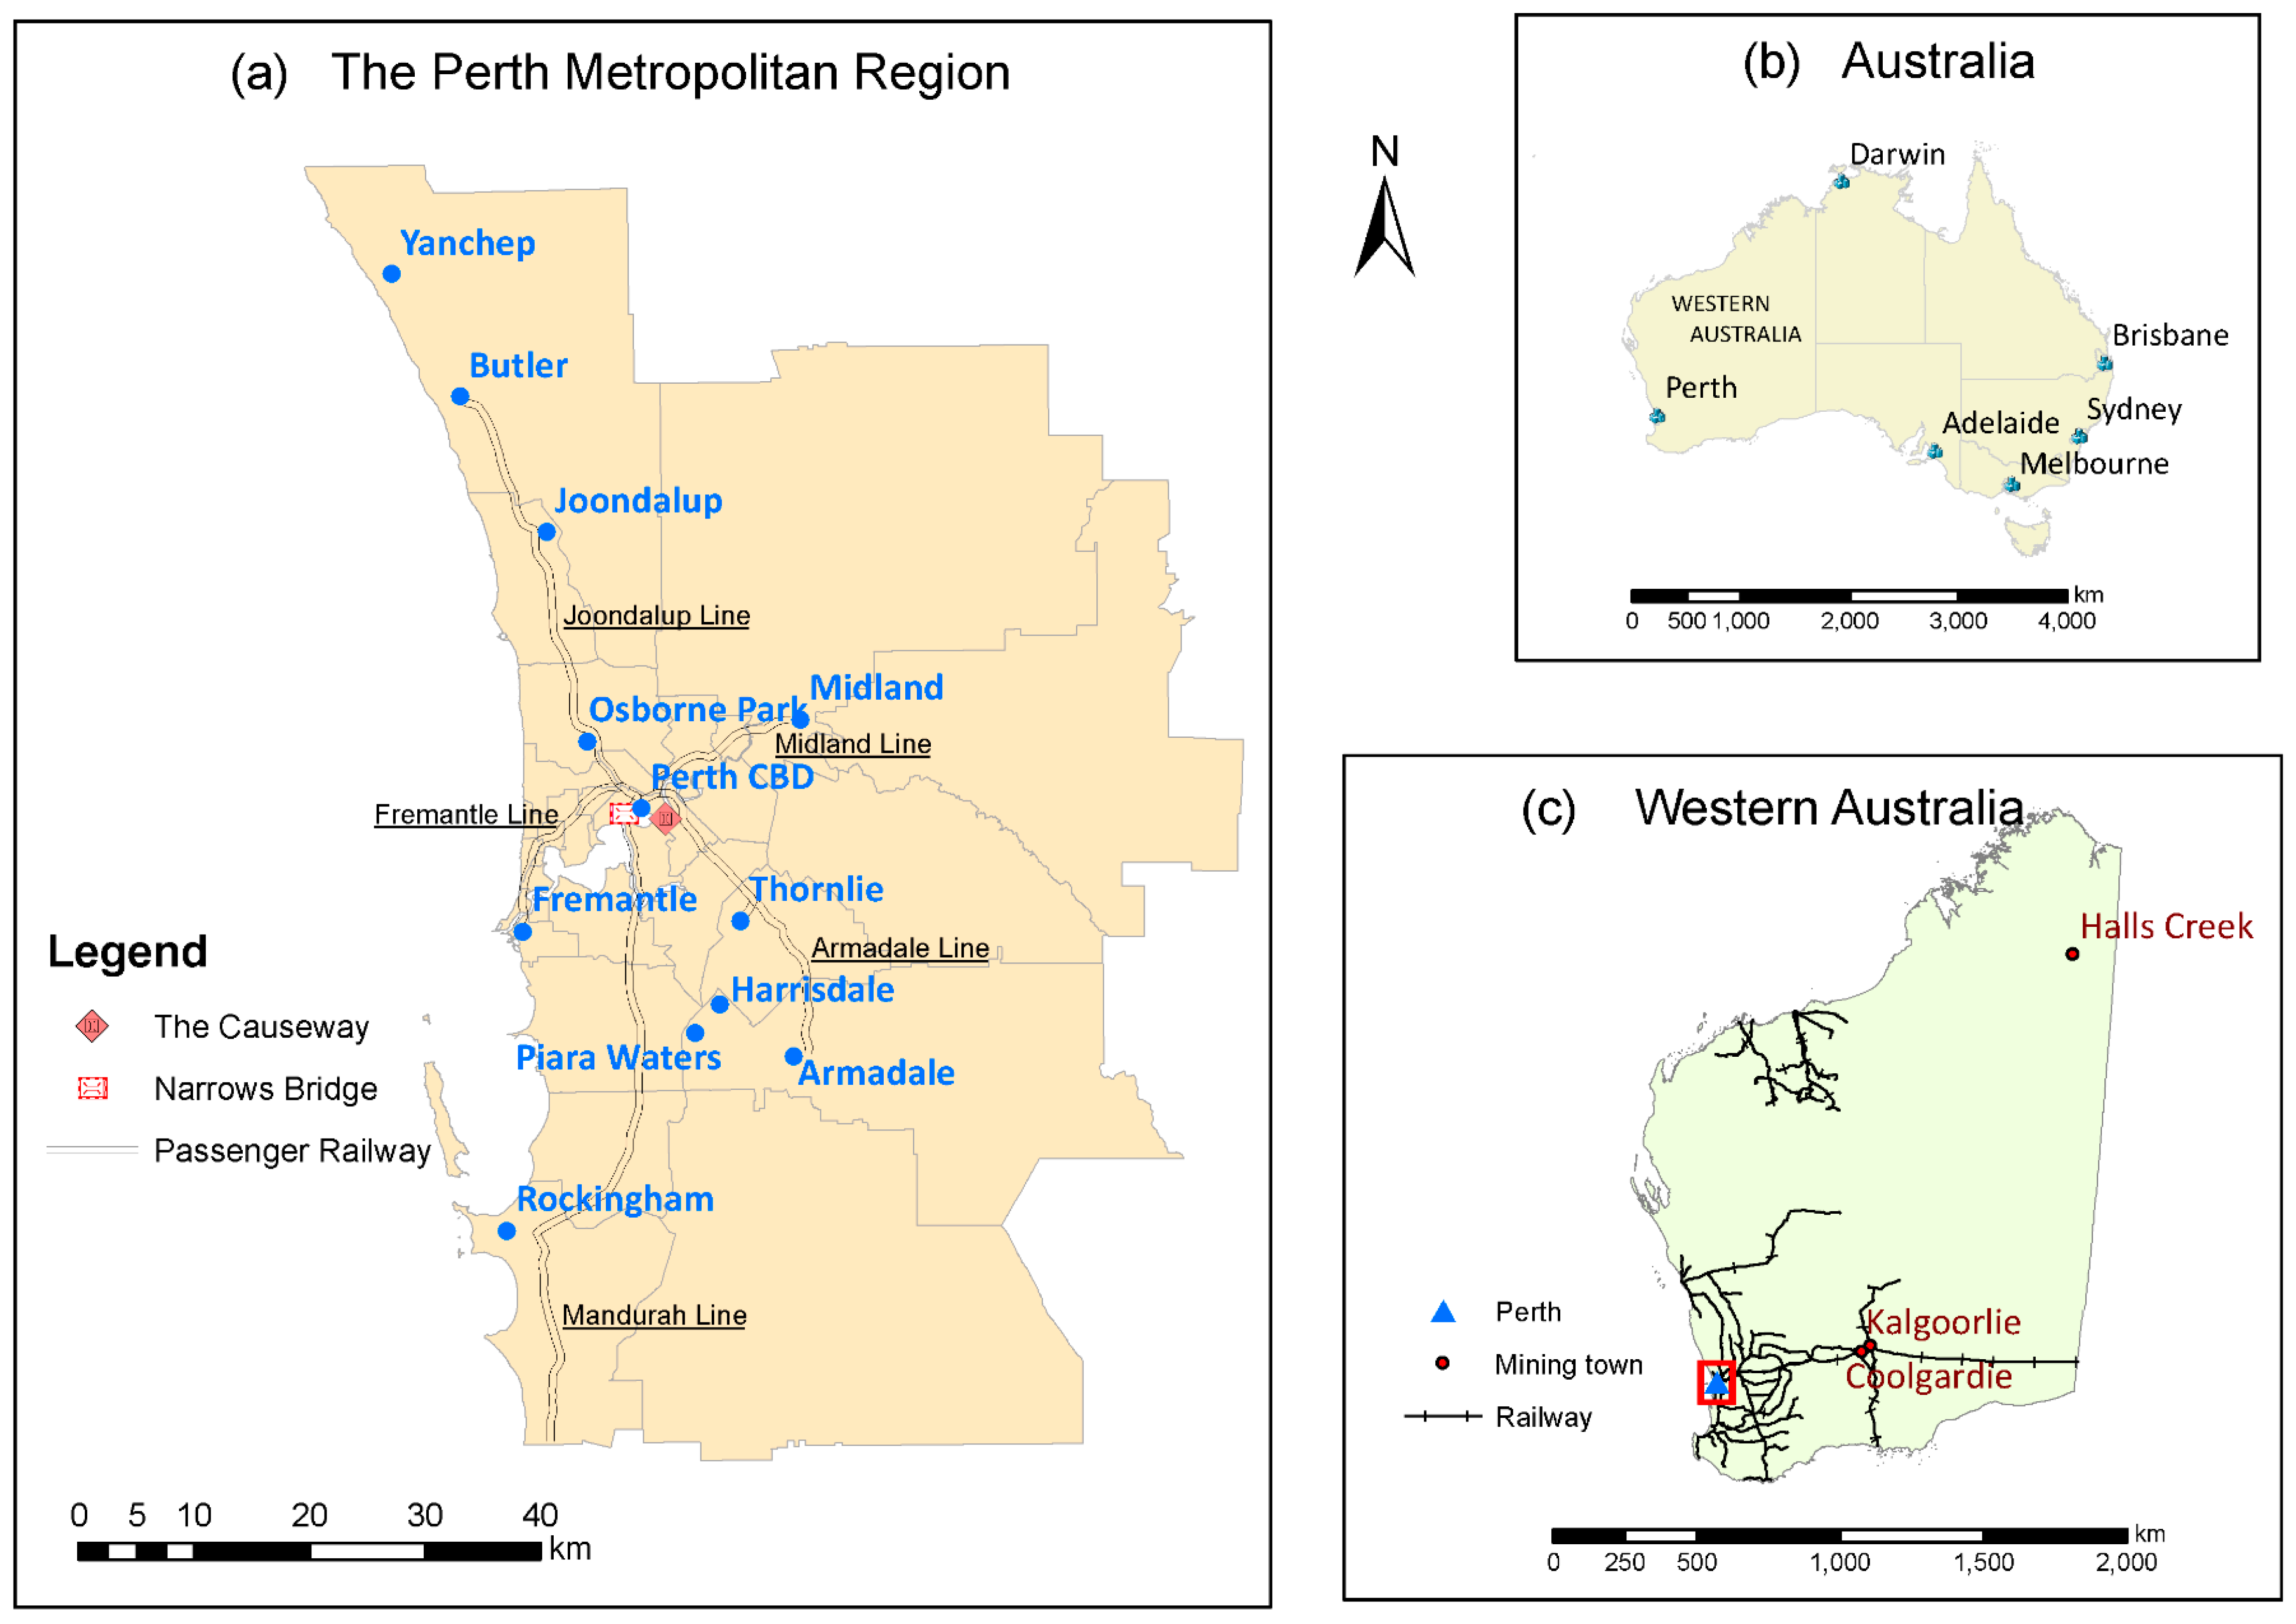
Perth is the State Capital of Western Australia. It is located on the south-western coast of Australia, and happens to be the nation’s most isolated city. The metropolitan region of Perth consists of 30 Local Government Areas (LGAs) that roll out detailed planning within their areas in conformity with the MRS zoning.
Figure 1 shows the geographical location of Perth, as well as some key places within the PMR. The subdivision lines within the PMR map depict LGAs.
2. Deconstructing the Timelines of City Development
Perth is relatively a young city that was founded under two centuries ago, in 1829. From its inception, Perth was a miniscule colony of two small settlement points, one at the mouth of the Swan River in Fremantle and the other on the northern bank of the river about 15 kilometres upstream at the present-day Perth Central Business District (CBD) (see
Figure 1a). In its earlier years, the colony had limited planning regulation that mainly provided for current needs with little projection inputs. From the 1950s, planners sought “to accommodate economic growth and the Australian suburban dream of home and car ownership” [
38]. Perth is ranked among the least dense cities in the world, having an urban footprint that has become larger than many bigger (by population) cities within a much shorter period [
30]. With its metropolitan population expected to increase by an additional one million people within the next two decades [
39], it is necessary to understand the region-specific factors that will influence Perth’s future urban form.
In this regard, we propose to deconstruct city development milestones from 1829 (when Perth was founded as a British colony) up to 2016. We borrow the definition of ‘deconstruction’ from Dear [
40], who refers to it as historicising the growth of a city looking through physical factors including transport and other infrastructural development, economic shifts and land use planning. We contend that a timeline analysis can be effectively utilised to understand how the major transport milestones—amid the influence of economic development and planning regulation—impacted on land use development of Perth.
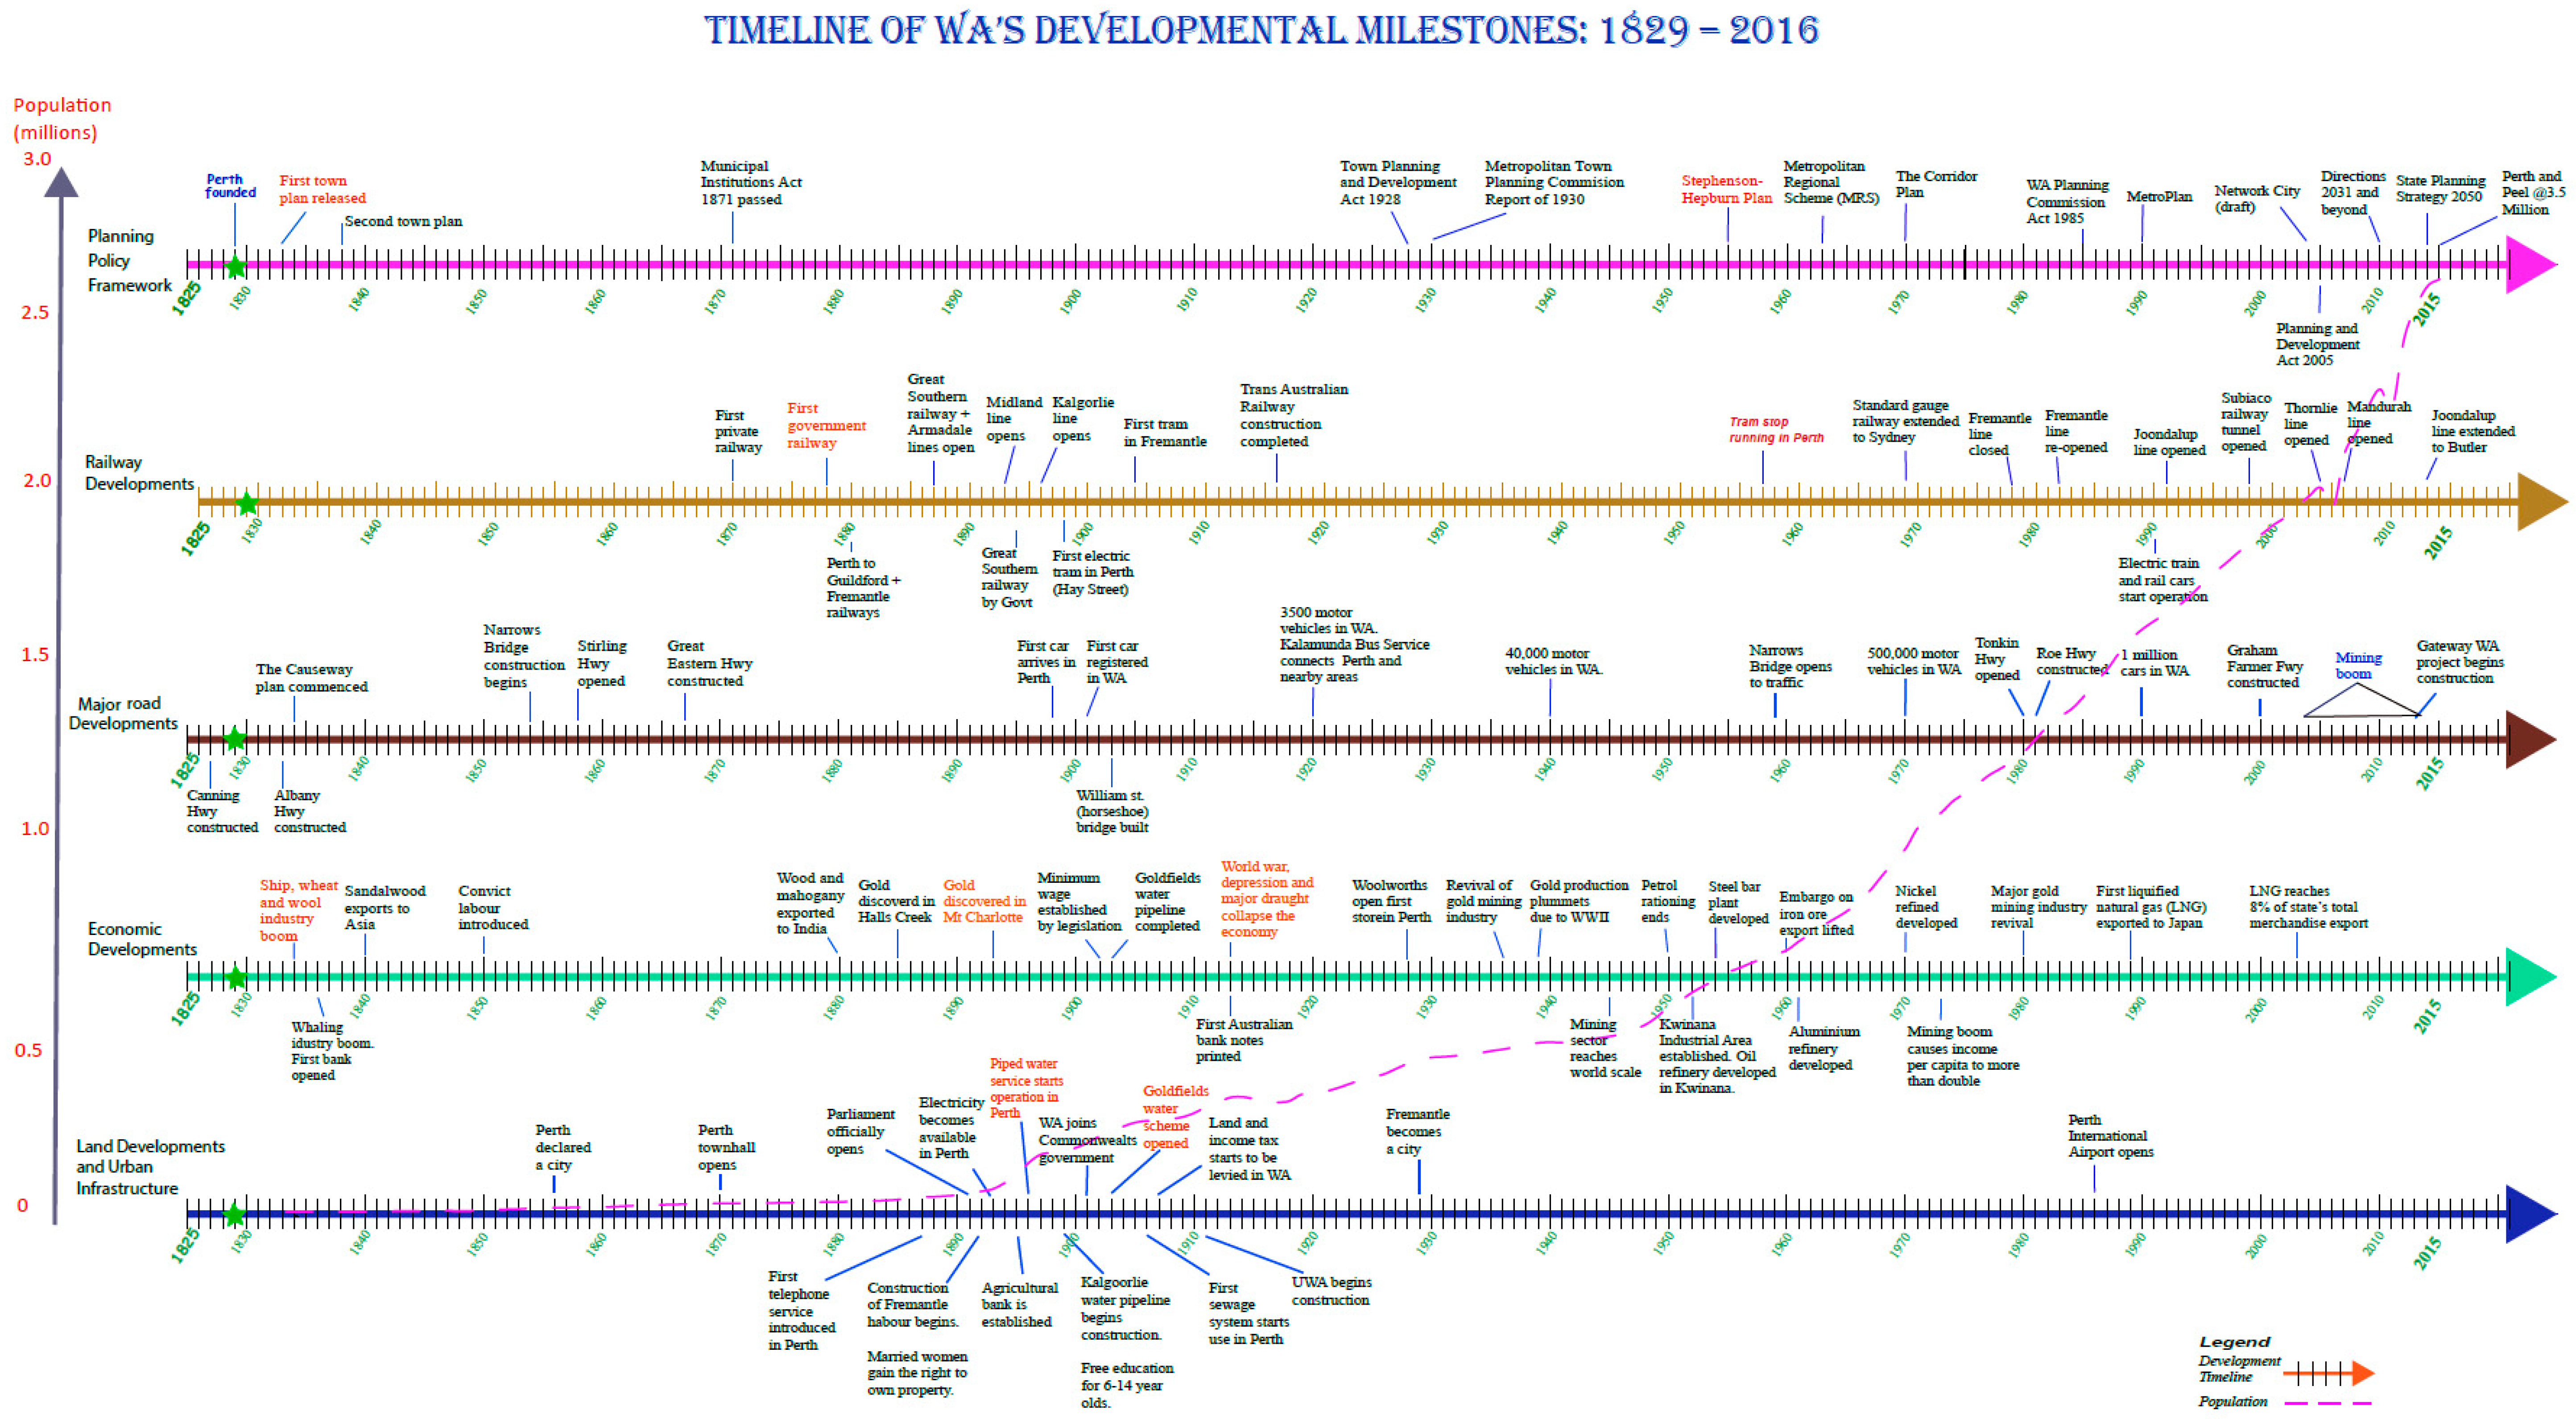
Figure 2 presents a timeline of developments under four themes, viz. planning framework, transport developments, economic milestones (in the State) and the resultant land use developments. Transport developments, as a focus of the study, are divided into two timelines to distinguish between rail and road developments. We also have a State population graph superimposed across the timelines, which enables for a cross-comparison of the milestones against population growth.
It is important to note that given the breadth of the period, it would be impossible to include all events in the timeline. While we attempt to identify the most prominent events within the theoretical scope of this study, Dear [
40] warns that such historical interpretations are often shaped by idiosyncrasies of the observer and observed.
The first timeline tracks the evolution of planning framework by highlighting the release of key planning documents. The two transport timelines trace the introduction of major roads and railways connecting areas within WA and other states across the country. Economic developments denote major economic activities in the colony/state impacting on general development such as industrial boom, mineral discovery or flagship policies for major economic restructuring. The last timeline shows major land and other infrastructure developments which ensued from the influence of transport developments, economic milestones and/or planning regulations.
A cross-section inspection of the timelines reveals that the construction of transport infrastructure significantly contributed to urban land development. The trend was spread out through the spectrum of time, with some of the most significant highways constructed in the early to mid-nineteenth century (1827–1858), while the recent constructions were in the late twentieth century (from the 1980s). Nonetheless, the period between the late 1800s and early 1900s was rather dormant in terms of major road/highway construction. Ironically this is the period during which the private automobile arrived and multiplied in numbers in the state. According to the Revolutions Transport Museum, the number of motor vehicles on the state roads grew from 3500 in the 1920s to 500,000 in the 1970s. This number had doubled just 20 years later, reaching the million mark in the 1990s. This trend is consistent with the high rate of urban expansion in the late twentieth century, which is reflective of easier commuting ability between suburbs and the city centre.
The first major roads of the state predated railway lines, the first of which was only constructed in the latter half of the nineteenth century (1871). This railway was constructed by a private company, out of timber. Interestingly, the trough of dormancy in the major roads timeline coincides with an upsurge of railway constructions. Some of the key rail links with surrounding urban centres and major towns were established in the late nineteenth century. The trains were mixed (freight and passengers), with passenger trains mainly within the urban areas. The railway construction industry, too, had a dormant period. In 1992, the opening of Joondalup Line connecting the northern suburbs to the city centre appeared as a breakthrough after almost 100 years. This somewhat marked the resurrection of rail in the state, as the southeast suburbs were connected through Thornlie Line just 12 years later. About three years after that, a major urban centre in the south was linked through Mandurah Line at the end of 2007. In 2014 the Joondalup line was extended along the northern coast to follow the prolonged suburban sprawl- the Butler extension.
The early stage of railway development was enabled by the state’s economic boom. From its establishment, the state had a shaky economy that could not propel a steady development. The discovery of gold in Halls Creek, Coolgardie and Mt Charlotte (in 1885, 1892 and 1893 respectively), commonly referred to as the gold rush, changed the fate of the state forever [
41]. It transformed it from a poor, sparsely populated desert colony to a mineral-rich economy. The gold era is credited for being the major enabler of the first ‘
railway construction period’ in the state. It certainly played a large part in the growth of household incomes, to which the rise of motor vehicle numbers can be ascribed. A lot of other land use and planned developments also came after the gold rush. This is despite the fact that Perth was declared a city in 1856, 30 years before the Halls Creek gold discovery.
Impacts from the First World War, Great (economic) Depression (1929–1930) and drought are also evident across the timelines. The war led to a collapse of the economy, and no new infrastructural projects were undertaken during the war and immediate post-war period. As a result, all major land use developments were halted.
The juxtaposed timelines clearly demonstrate the resulting impacts of organised planning efforts, transport infrastructure and economic developments on urban expansion during the city’s history. There were very few planning interventions observed in the early years. The colony’s establishment in 1829 followed Sir James Stirling’s (first Governor of WA) survey two years prior, and his consequent persistence and exaggerated description of the soil fertility in the area [
42]. The beauty of the landscape, fresh water springs, fertile soils and availability of building materials proclaimed by Stirling (and supported by gardener and colonial botanist, Charles Frazer) were some of the factors that led to the colony’s establishment, and attracted people to the area. No prior arrangement had been made to establish a colony, so the settlement was laid out hastily upon arrival of the first settlers [
43]. Despite the expedited establishment, growth thereafter was very slow due to low population growth and highly limited public investment.
With the introduction of convict labour in 1850, a few road and land developments occurred. Later, the gold rush triggered the need, and provided the means, to invest in port development (e.g., Fremantle harbour) and establish rail networks between key economic centres. The resource boom also brought other land development measures and urban services (e.g., piped water supply and sewage system) to support the increasing population. The city experienced a slow and steady population growth, resulting in expansion of the urban footprint. This growth justified investment in tram transport which led to the introduction of electric trams in Perth (1899) and the first tram operating in Fremantle (1905) to facilitate travel particularly for the outlying suburb residents commuting to the city centre.
The first official regional plan for the PMR was released in 1955, which was followed by gazetting statutory land use zones in 1963, known as the Metropolitan Region Scheme (MRS). Subsequent regional plans followed in 1970 (the
Corridor Plan) and 1990 (
MetroPlan). It is important to note that while the direction of development generally adhered to these statutory documents, a significant amount of development still happened outside of the identified growth areas. For instance, Adams [
27] noted that by 1990 “urban zoned land had indeed spread into these corridors [of the 1970 Corridor Plan]; as well as into many other areas which had not been identified for urban growth potential” (p. 39).
The state population graph communicates another interesting piece of information when juxtaposed against the timelines (
Figure 2). A population growth rate of 27% was recorded between 1849 and 1850, the same year in which convict labour was introduced in the colony. The population trend line shows that a significant leap occurred between the late 1880s and early 1890s. We performed a spikes check [
44] and it revealed that a more than 20% yearly growth was recorded between 1894 and 1896. It is evident that the gold rush significantly contributed in population growth during this period. The availability of electricity, piped water supply and improved links with mining towns are equally considered to have attracted more people in the city in the early 1890s. The growing trend was, however, disrupted in the early 1910s, causing a declining trend until the end of the decade roughly due to the WWI. The recent mining boom of the twenty-first century (2003/04-2013/14) also had a big effect in the state’s population growth. The highest growth was seen during this period, albeit with some fluctuations.
5. The Pattern of Perth’s Urban Form Evolution
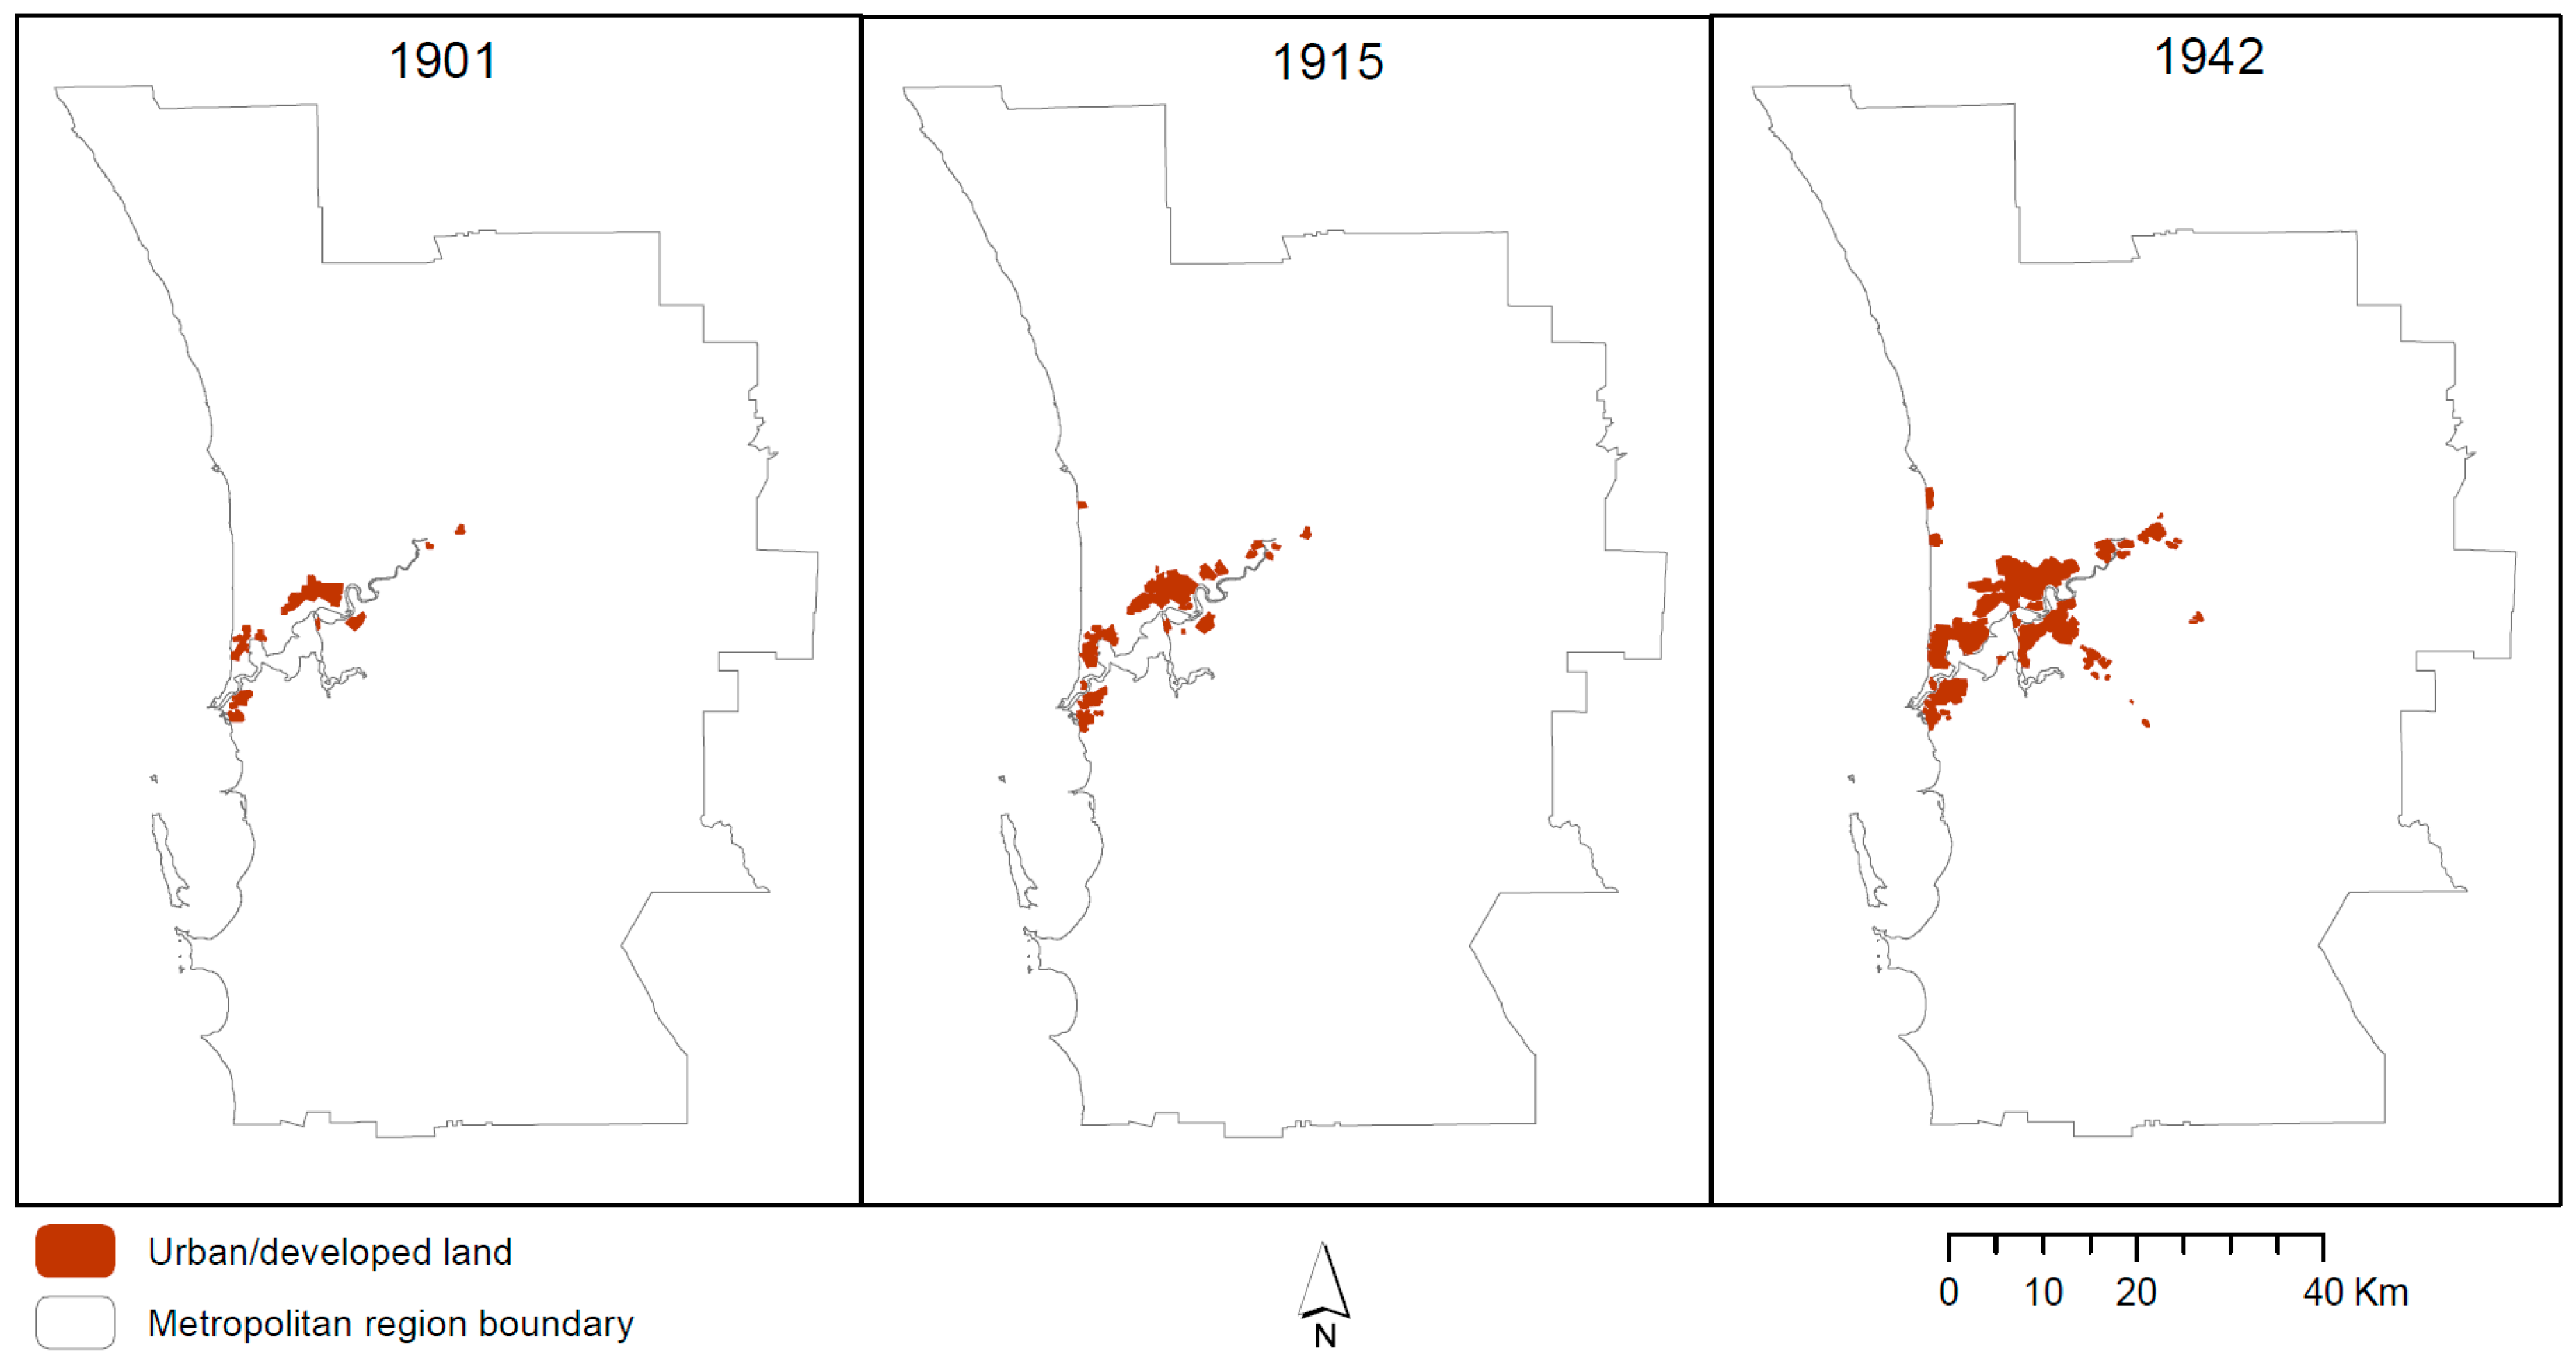
Using information from Stephenson and Hepburn [
50] we present in
Figure 3, snapshots of Perth’s urban footprint in 1901, 1915 and 1942. It is worth noting that the PMR boundary did not, at the time, exist as depicted in the figure, but is provided for purposes of illustration only. We have further updated Stephenson and Hepburn’s efforts using the MRS zones from 1963 to 2016 in
Figure 4 (next section). The two figures give us a time series from which we can observe the growth pattern over the last century.
Figure 3 confirms the confinement of growth to areas around the river in the early years, leading to a jointure of the formerly dis-contiguous colonial centres of Perth and Fremantle. It is also clear that land development (contiguous) was relatively faster on the northern side of the river than on the southern side. It is highly plausible that since the CBD was on the northern side, the river was an access barrier for people on the south, making the northern suburbs more desirable, until the Narrows Bridge was opened in 1959, as there was only one way to access the CBD from southern suburbs i.e., via the Causeway (see
Figure 1a).
A linear expansion deviating from the river in the south-eastern direction became visible from 1942. This shows how residences followed the railway line (Armadale) going farther from the city centre (explained further in the next section).
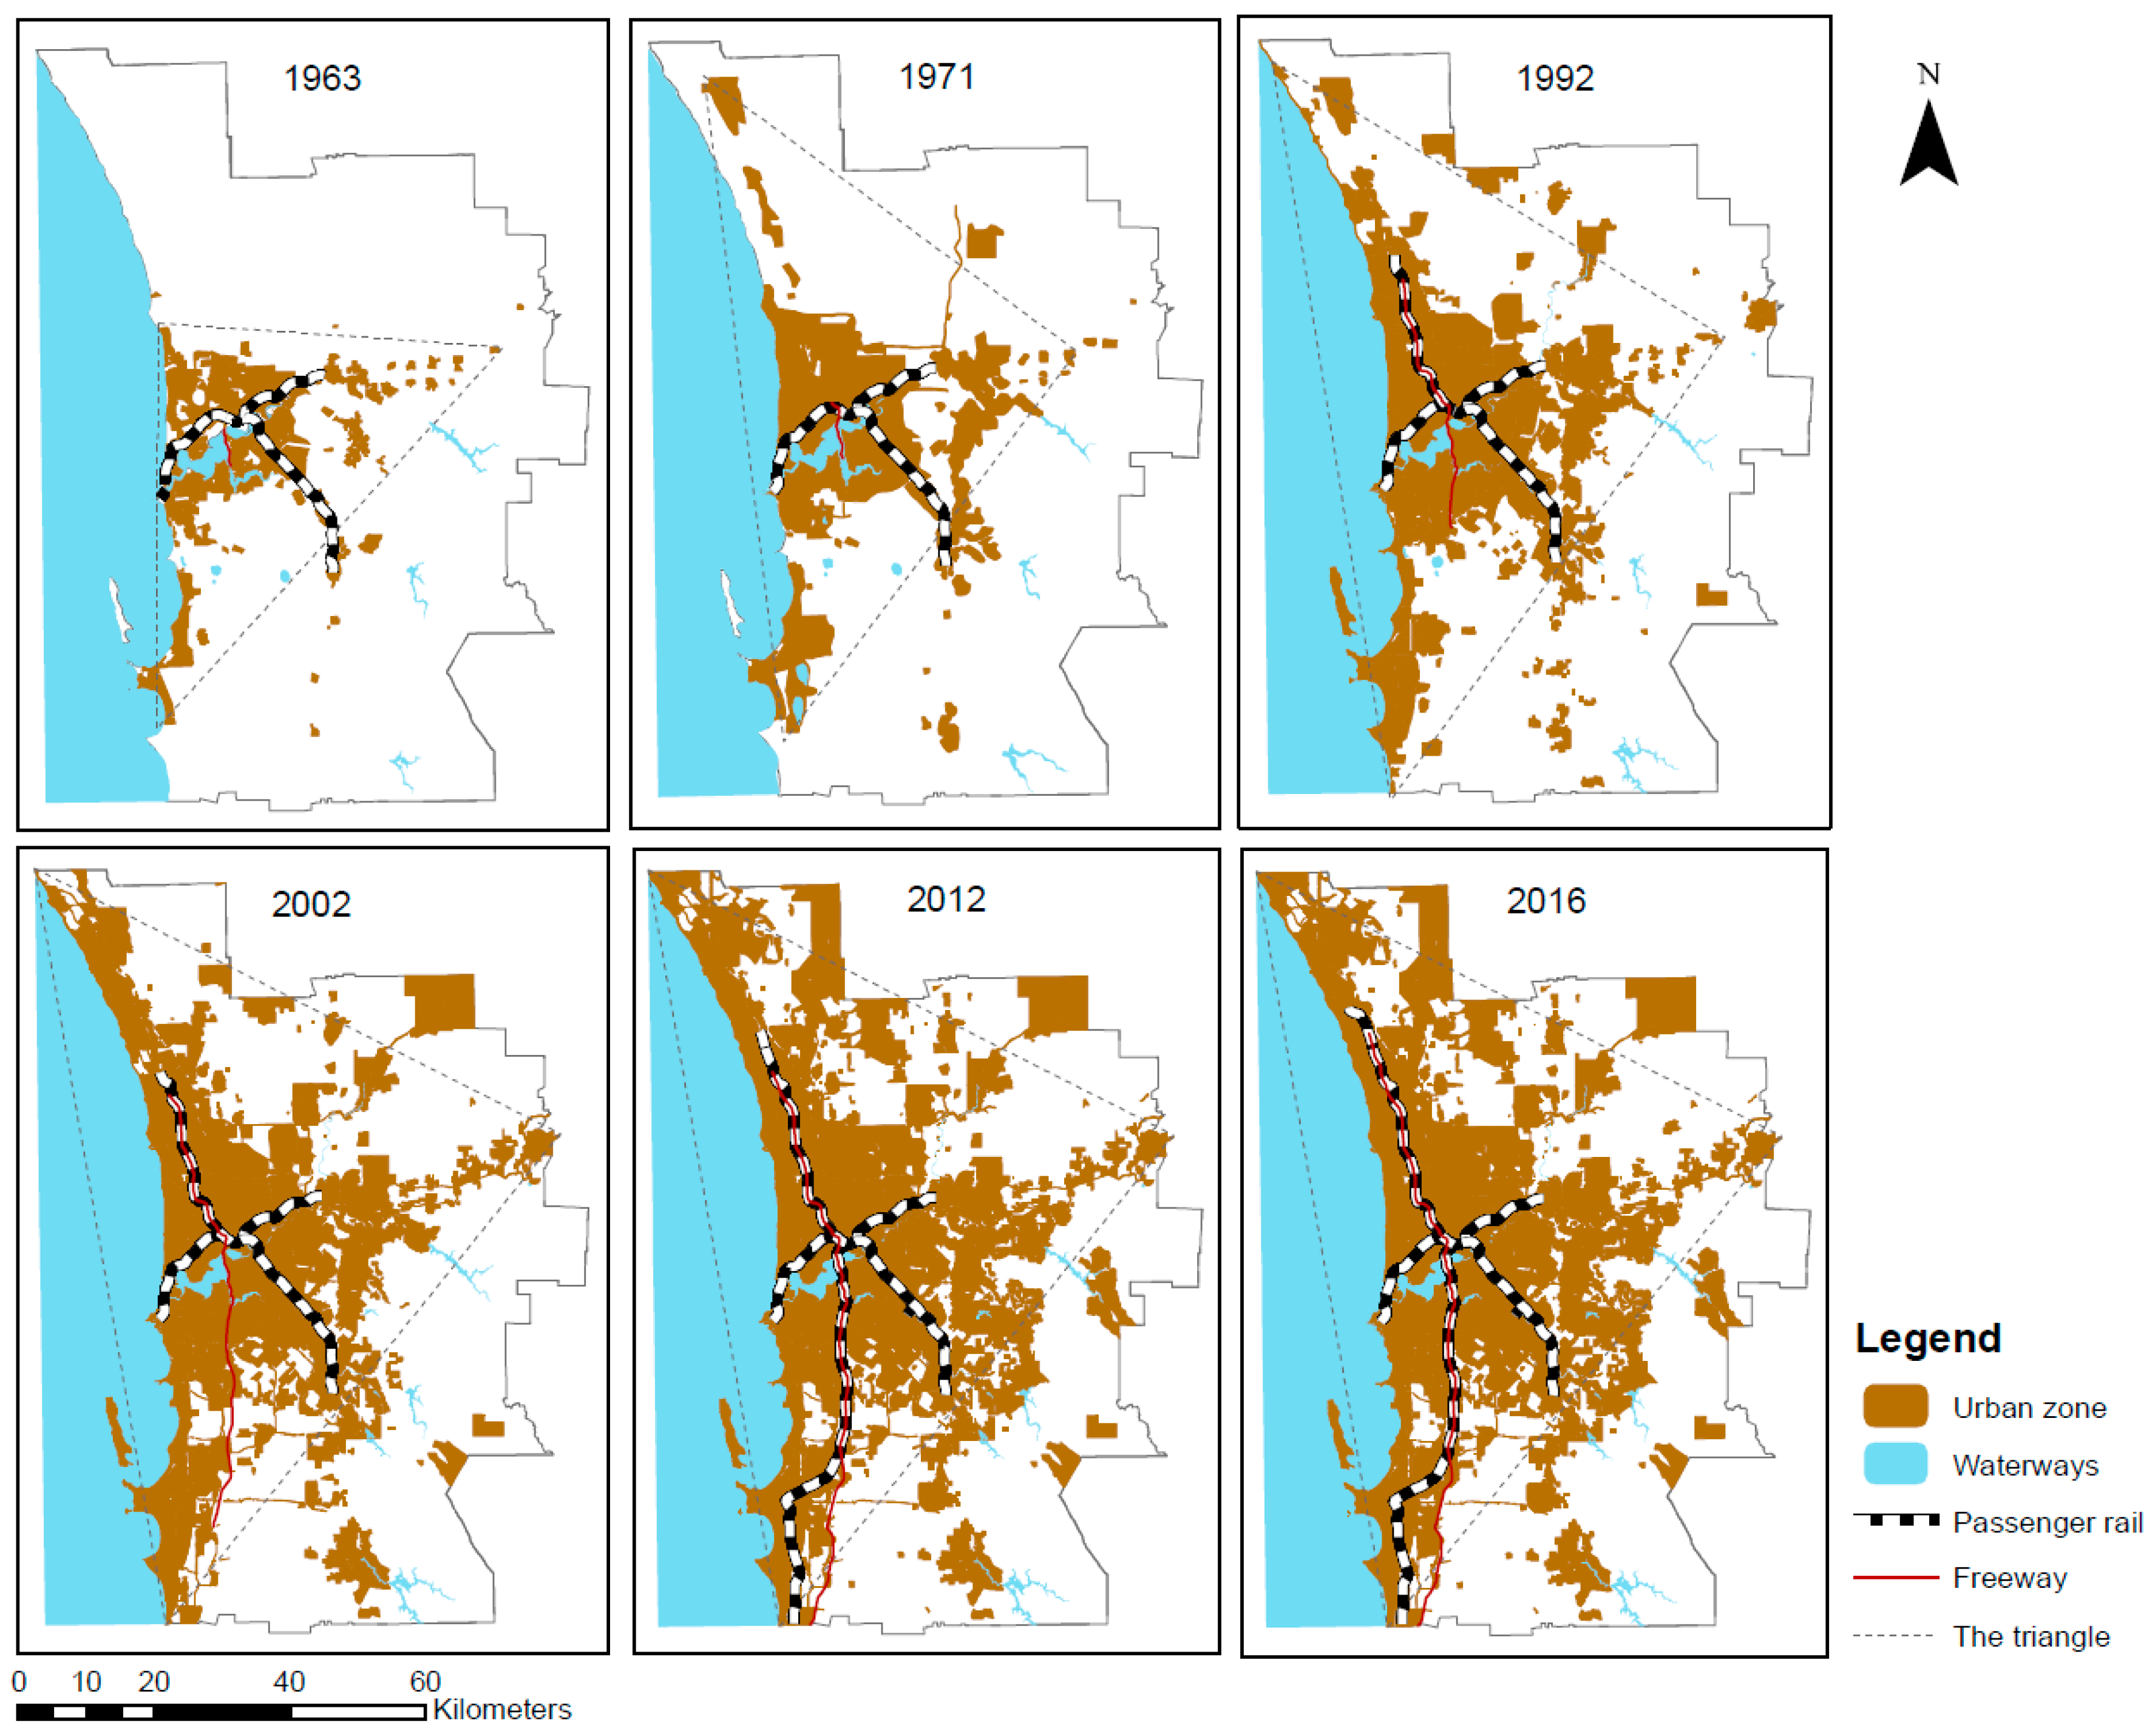
In recent years (2000–2016), urban expansion has been marked by reduced outward growth, as confirmed by our footprint mapping exercise in
Figure 4. During this period, growth was more interstitial as the state government sought to restrain sprawl and move towards greater density through infill and mixed-use developments. During this period, the government produced three strategic planning documents;
Directions 2031 and Beyond [
51],
State Planning Strategy 2050 [
52] and
Perth and Peel @ 3.5 million [
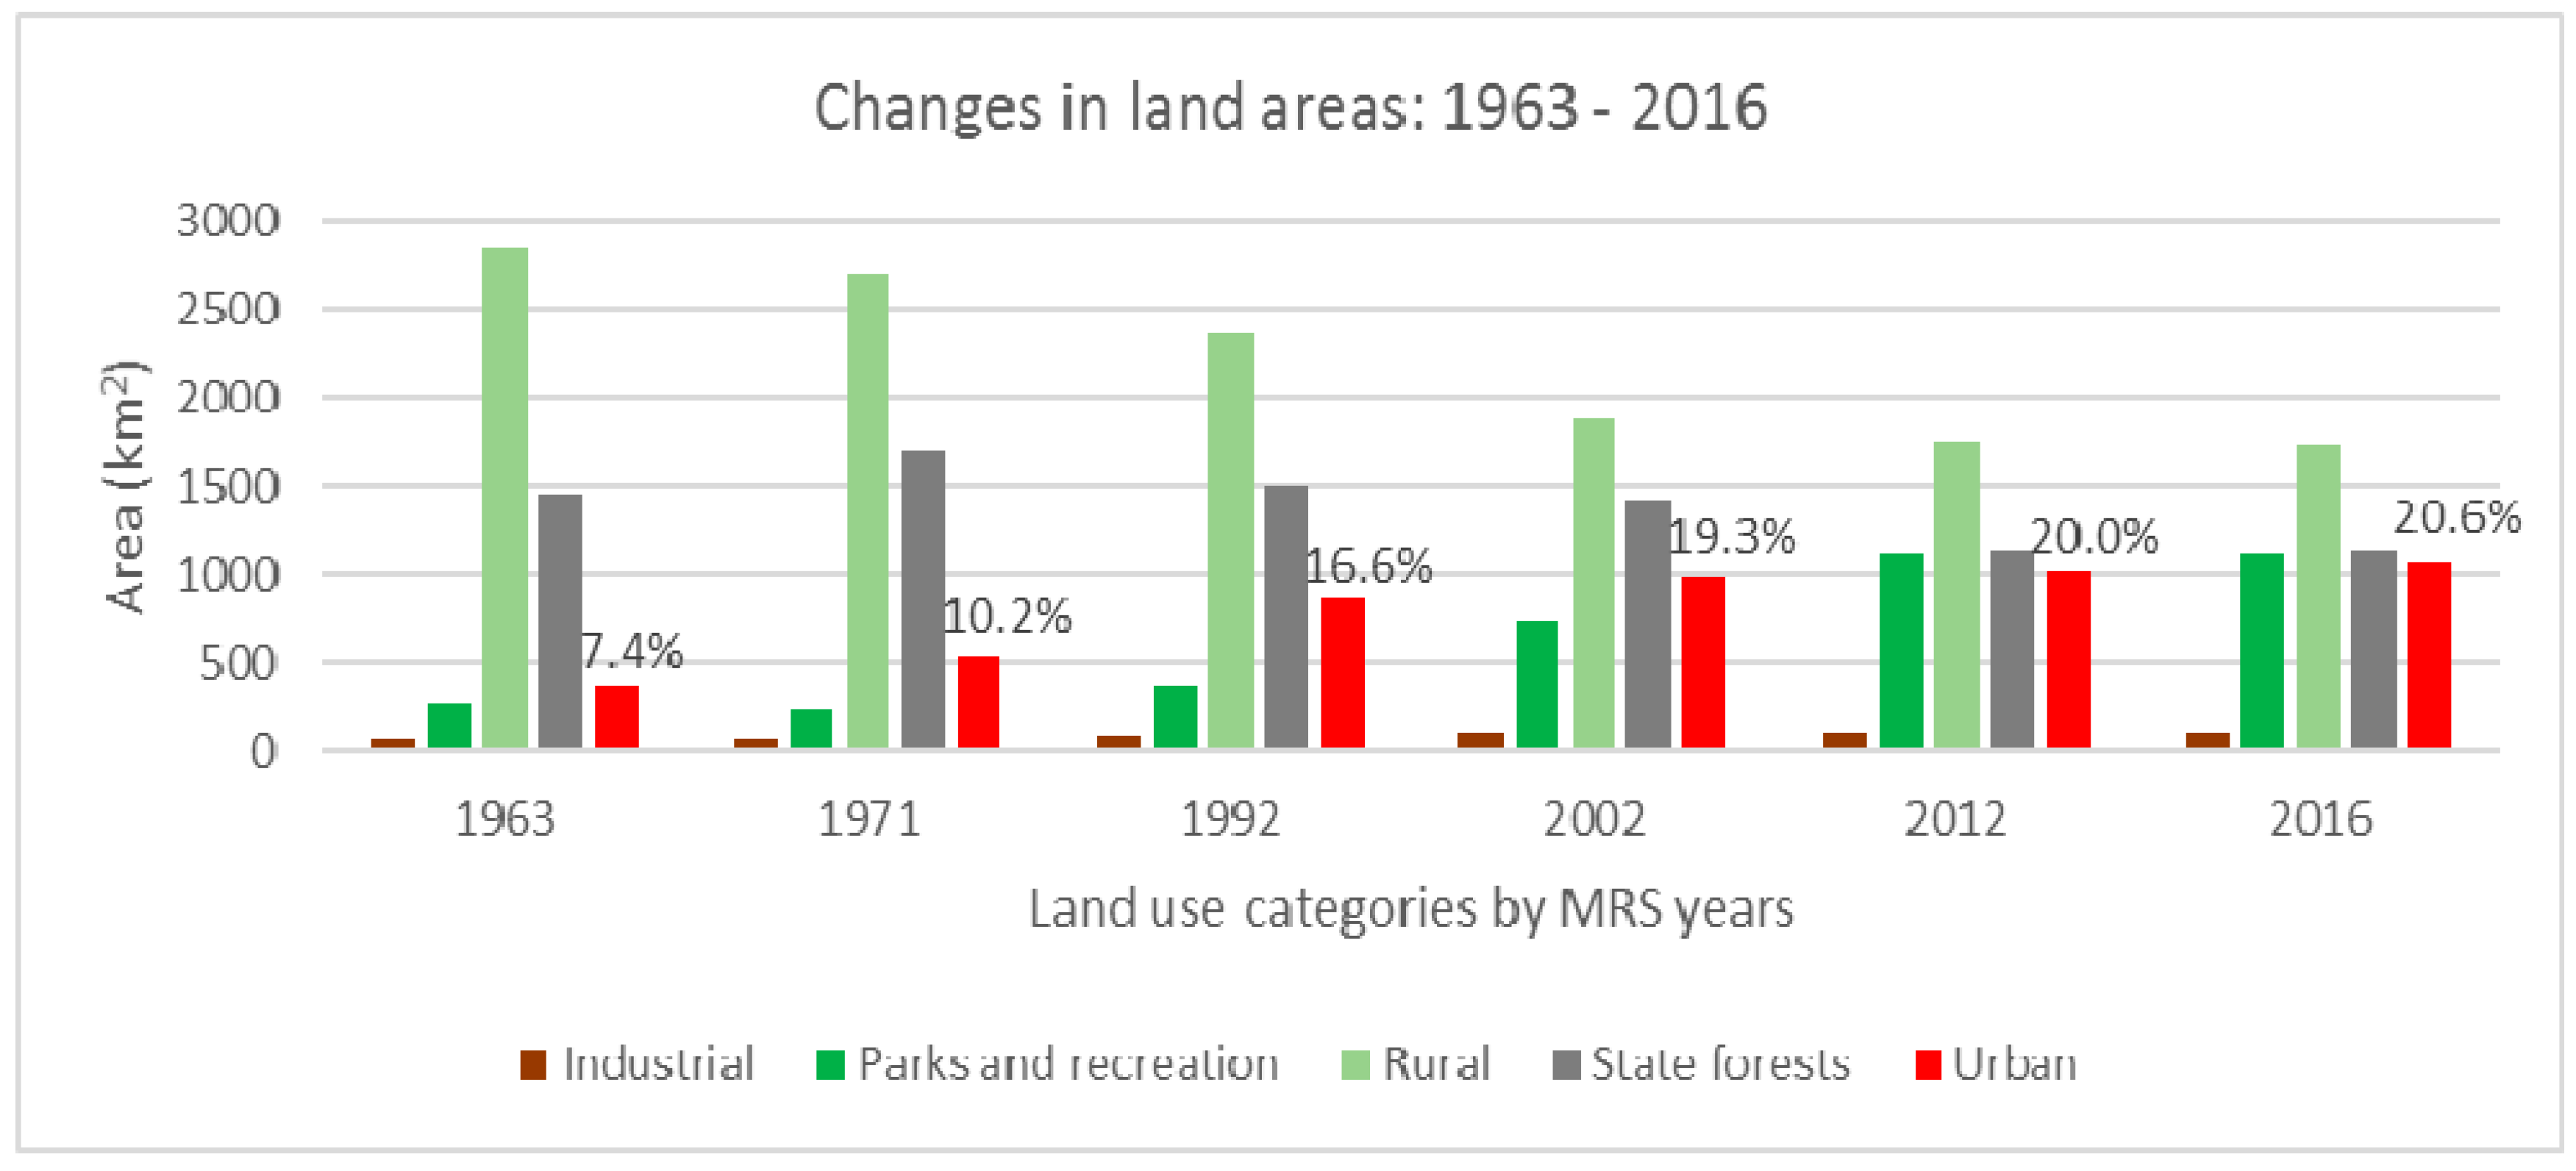
37]. At the core of each of these documents is advocacy for less outward expansion and more densification for accommodating current and future population demands. As a matter of fact, the total urban land increased by 2.75% between 1992 and 2002, but only increased by 0.59% from 2002 to 2012, and by 1.26% over a longer period of 2002 to 2016 (see
Table 1).
Overall, the expansion of Perth’s urban footprint imitated a triangular shape, delimited by the ocean on the base and following the Swan River at the triangle’s peak (see
Figure 4). The CBD lies in the centre of the triangle, as the centre of gravity or driving force of development. As Perth expanded towards the north and south, the shape of the triangle gradually changed from
acute triangle with all angles less than 90 degrees to an
obtuse triangle with one angle at the peak larger than 90 degrees. This may signify urban sprawl along the coast which led to Perth overtaking some of the world’s biggest cities in its footprint expansion. Coastal developments, also termed as ‘sea change’, have been a common phenomenon in Australia for several decades [
53,
54,
55]. Sea change migrants move to coastal areas for lifestyle reasons [
53,
56] since “coastal views and short travel times to the sea [are] perceived as valuable amenities, and hence the growth of coastal suburbs” [
57]. Some other factors also contributed to this growth pattern, such as geographical terrain, e.g., escarpments on the east confined expansion closer to and along the coast where land is more developable.
6. Interaction between Transport Infrastructure and the Urban Form
We analysed the extent of urban land use zones in the MRS over the last five decades in
Figure 4. An urban land in this case consists of residential, commercial, recreational and industrial zones. Also shown in the figure are the freeways and passenger railways that existed at the respective years. As indicated in the previous sections, transport infrastructure was a strong determinant of the urban form in the early years of Perth’s evolution. Tramlines attracted residential settlements in the late nineteenth century, and the connection of built-up land between Perth CBD and Fremantle along the Swan River also happened to follow the Fremantle railway line. The southerly expansion, while it started with dispersed settlements on the coast, later compacted and expanded towards and along the freeway.
Three railway lines (Fremantle, Midland and Armadale) were present at the first MRS (1963), from the great ‘railway era’ of the late nineteenth century. These lines formed the backbone of urban expansion, leading to visible concentration of developments in the north-eastern and south-eastern directions. However, these lines have not been extended and the rapid urban growth has now sprawled beyond (in the case of Armadale and Midland) and away from them. It is a similar situation, if not worse, with the longer north and south lines where some of the furthest developments from the CBD have occurred. When the Joondalup Line was constructed in 1992 after almost a century of railway construction dormancy, it did not go the full extent of the urban expansion. And despite the urban development expansion southward, it was not until 2007 that the Mandurah line was opened.
The 7.5 km extension of the Joondalup Line (to Butler) in 2014 is the latest addition to Perth’s railways, and it still fell behind the rather linear urban land expansion along the coast. The 2016 MRS shows that urban land has gone beyond each of the terminals and some lines may require extension. From this information, it is evident that the MRS has been availing land for urban development well ahead of transit development. This is a deviation from the earlier trend of urban expansion following transport links. This has led to a prominent level of dependence on the automobile in Perth [
22,
58], as it is the most accessible transport mode particularly for the outlying residents where transit option are limited.
8. Conclusions
We presented a timeline of developmental milestones in WA since the founding of the Swan River colony by the British Government. Following the three themes, we demonstrate how the transport developments, planning regulations and economic milestones, contributed to the evolution of urban form in Perth. We advanced the discussion into a focus on transport evolution and how it informed the fashion in which the urban form evolved over the last century, and particularly during the era of the MRSs.
A deconstruction of the timelines showed that planning regulation was limited in the early years of the colony, as were land developments. However, as the population increased, it became imperative to not only regulate current developments but also plan for future growth. Economically, the state struggled for the better part of the nineteenth century. Agriculture, as the major industry driving the economy, did not allow for much investment in development. The discovery of gold in the late nineteenth century was a turning point for the state, allowing more investment in infrastructure (e.g., railways, electric trams and piped water). The population also increased rapidly due to interstate and overseas immigration. Many of these people settled in Perth and created a land demand that propelled urban expansion.
The city’s transformation to car dependence could also be ascribed to the flourishing economy, as car ownership grew with commuting distances to newer outer suburbs. The transport developments—which were also enabled by the economic growth, and provided for by the planning regulations—supported or encouraged the sprawling urban footprint. In fact, the urban footprint evolved around transport corridors such as the river and railways. The railways were, however, overtaken by urban expansion from the late twentieth century, and newer ones were built to catch up in already developed areas. This was a deviation from the olden trend where urban expansion was heralded and shaped by transport infrastructure developments, and particularly railway developments in the case of Perth.
With coastal developments stretching further north and south, and radial expansion around the spine of the Swan River, Perth’s footprint developed into a triangular shape. As the triangle grew, its shape changed from acute to obtuse triangle (with reference to the angle inland). Nonetheless, the expansion has slowed down in the twenty-first century. This reflects the government’s efforts to limit sprawl and densify developments.
Overall, the general trend has been an increase in population and urban expansion in the PMR despite some challenges such as the world war, Great Depression and droughts. Considering the mining boom that just ended, and indeed all those that have happened since the advent of the goldfields, it is clear that the state will always have a ‘boom and bust’ economy. As such, planning in Perth needs to incorporate this dimension, and anticipate depressions as a fabric of a mining-based economy. This paper provides a historical benchmark of the city’s performance, which can help planners and policy makers in managing urban expansion in the metropolitan area.
An important insight from this study is that public transport in the form of trams and trains had great influence on the pattern of urban growth. These findings indicate that modern and future cities could leverage the same kind of influence from similar transport modes such as heavy and light rail transit. Sustainable growth could be induced by promoting higher density and mixed developments in their catchment areas. A major challenge lies in increasing the competitiveness of public transport against the car, particularly in the suburban areas where public transport is hugely uncompetitive [
12]. This could be done through appropriate improvements to public transport efficiency including wider geographic coverage and higher service frequency to reduce walking, waiting and transfer times.
For its relatively small population size, Perth has some of the longest distances between the city centre and its suburbs particularly on the north-south dimension. This pattern is a product of a combination of factors including escarpments which curtail easterly expansion, sea change or coastal migration, and transport related factors such as the passenger train, freeways and high car dependence and ownership. Together, these factors created a unique set of circumstances that have given metropolitan Perth an elongated urban footprint. This study has shown that the city spread more widely as mobility became easier and more flexible. As a city that is now so reliant on the ubiquitous and highly flexible automobile, strategies to mitigate unsustainable urban expansion are particularly imperative. While new technological revolutions in transportation such as the autonomous vehicle could continue to increase the ease of mobility, they also present a unique opportunity for city authorities to introduce nuanced, powerful policies with which they could induce sustainable urban growth.

 ,
, 


