1. Introduction
Transportation policies are always deeply inclined to adopt the technological advances, politics, and environmental concerns of present times, and car-oriented development has always dominated the transportation planning practices. These automobile centric planning and policy practices often marginalize certain portions of society. In response to changing social values [
1,
2], the policy objectives have progressed and ushered in the concept of sustainability—the “3Es”, Economy, Environment, and Equity [
3]. Equity is being considered in most public transportation policies, which is a direct result of the civil rights movement and environmental justice mandate [
2]. However, safeguarding equity for diverse social and economic groups [
1] is problematic. Several transportation agencies conducted various analyses to examine how to comply with these mandates, but these equity analyses have mainly been concerned with accessibility, allocation of funding, and job accessibility. They fall short in addressing alternative modes of transportation. An increasing number of organizations and community advocates are proposing that bicycle equity be considered in all current and future transportation infrastructure projects. For bicycle equity, as they did with transportation equity, they advocate for fair treatment in policy formation, decision making, and equal distribution of investments, irrespective of race/ethnicity, national origin, or income level.
Since the inception of the Bike Sharing system in 2010 with the Capital Bikeshare in Washington D.C. [
4] the concept has garnered incredible responses. Bike sharing is an emerging mode of transportation that operates by providing publicly available bicycles for rent. It can reduce car usage and congestion in dense urban areas while promoting a healthy and environmentally friendly lifestyle. Easy access, a convenient payment system, and active transportation enabled the rapid growth of the bike sharing system. Now more than 80 systems are operating within the United States. The size and scale of these systems vary from just 25 bikes and three stations in Des Moines, Iowa to 6000 bikes at more than 300 stations in New York City [
5]. Baltimore City launched its own bike share program “Baltimore Bike Share (BBS)” in 2016 with 20 stations and 200 bikes which has grown to 39 stations, including five Lyft partnered stations [
6]. The BBS system was designed to serve both residents and visitors who wanted to enjoy riding or commuting without the worry of parking. However, the City of Baltimore ended the relationship with the BBS in August 2018, focusing instead on companies supplying dockless bicycles and scooters. Despite BBS’ short life, it served as an important case study, and this research created valuable methodology and metrics for planning equitable bike share systems.
At its peak, the BBS was the largest fleet of pedelec bikes in North America [
6], which was an immense help to the riders as the topography of Baltimore varies a lot within a short distance. The pedelec proved essential for riders for whom destinations were at higher altitudes, such as Morgan State University, Hampden, Johns Hopkins University, or Druid Hill Park. From 2009 to 2015, the general bike traffic has increased by 40% in Baltimore [
7]. The now-defunct BBS system had planned to meet that growing demand by expanding to up to 57 stations with 500 bikes, mostly electrics, during its final phase of development.
The main objective of this study is to evaluate the equity of existing bike share infrastructure in Baltimore and provide a methodology for planning new bike share infrastructure using equity and level of traffic stress (LTS) (i.e., safety) as the primary determinants. This paper attempts to identify the equity gaps in terms of bicycle access by using geographic information systems (GIS) and socio-economic information to spatially categorize underprivileged groups in relation to bicycle infrastructure and LTS network.
2. Literature Review
Equity is the measurement of fair and impartial treatment to everyone; it provides similar advantage, and considerations toward all concerned. The concept of equity and its evaluation in public programs has increased significantly [
8] and environmental justice regulations also require equity analysis for all government funded investments (including infrastructure and policies). Nowadays equity is considered in most of the transportation planning documents [
9], yet very few explain how equity is going to be measured and included in performance measures [
10]. This is because transportation equity can be hard to evaluate, and even harder to interpret [
11,
12,
13]. Equity evaluations are highly dependent on the values and concerns of stakeholders and the paradigm considered. For example, policies and decisions may seem equitable when evaluated one way but inequitable when evaluated another [
12]. In general, most of the time equity is considered in terms of horizontal equity and vertical equity. Fairness and egalitarianism are evaluated in horizontal equity, which measures the equal distribution of impacts received between individuals and groups that share the same ability and needs [
12,
14]. Most of the transportation policies are horizontally equitable if they are fairly distributed among the servicing area, with all groups of people receiving similar allocations of resources and bearing equal cost [
14]. This indicates that the spatial distribution of public transport facilities be equally accessible to all residents. However, accomplishing equal distribution in cities is often more problematic because the built environment and land use naturally develops centers and peripheries [
13,
15]. Vertical equity, often referred to as outcome equity, is concerned with spreading resources across social groups that diverge in their ability and/or need. If the transportation policies are redistributive— favoring the disadvantaged and compensating for overall inequalities [
12,
14]—they can achieve vertical equity. This equity principle requires identifying disadvantaged groups that may be in greater need of alternative transportation choices [
10,
15].
Transit infrastructure, especially the bike share infrastructure, is not evenly distributed in Baltimore. Disadvantaged and vulnerable communities are often transit dependent and live in undersupplied areas [
10]. An alternative mode of transportation such as bike share can bridge the transportation gap for these underrepresented communities. The underrepresented communities referred as “equity communities” may be in greater need of alternative transportation choices or subject to barriers when using existing ones [
9,
10,
14]. Equity gap analysis categorizes people in need by demographic and geographic factors by evaluating vulnerability indicators of disadvantaged populations. These groups are most likely to experience inequitable benefits from a given transportation system [
10,
12,
15]. The disadvantaged population in transportation can be categorized mainly in two ways: (1) Environmental Justice vulnerable group, and (2) Transit Dependent vulnerable group [
10,
16]. Transit infrastructure is not evenly distributed and access to it is often stratified by race, ethnicity, and social class. The Environmental Justice framework can advocate for addressing such inequalities across communities and significantly help to eradicate institutional/systematic disparity [
9]. Historically black neighborhoods are more welcoming of pedestrian access [
15] but bike lanes are often perceived as white lanes [
17]. Minority persons (non-white) and low income (below poverty level) households are less likely to own a car and mostly depend on public or non-motorized forms of transportation [
12,
18]. Marginalized populations need alternative modes of transportation and often are more likely to adopt newer options if they are cheaper, safer, and easily accessible [
19]. Persons without cars or the ability to drive are often classified as transit dependent population [
10,
16] and they find mobility challenging, not only in access to infrastructure [
10], but also in economic inequality [
1]. As the disadvantage is being considered at an individual level, one person can be part of more than one vulnerable group. Thus, the degree of disadvantage should be taken into consideration in equity assessments [
10,
12]. The problem lies within identifying the right scale for these indicators. The League of American Bicyclists considers a percentage of total population [
16] for each indicator within given administrative boundaries, mostly census blocks. Cities like Chicago [
16] and Portland [
20] applied similar methodology for their equity evaluation. These indicators are useful to estimate the state of the vulnerable groups within a geographic boundary but ignore the safety and the population density. Addressing the major needs of the communities - i.e., safety, access, and walking distance to mixed use retail - can encourage them to adopt alternative modes of transportation like biking and dockless scooters [
16,
21].
This study tries to evaluate equity in terms of density rather than the percentage within the block group and provides a methodology for incorporating level of traffic stress (LTS), in addition to equity, into bike share planning. It measures safety as the percentage of bikeable roads within a census block and categorizes them based on the level of stress network (LTS). The LTS network provides quantitative measures of comfort and connectivity. It was originally developed by the Mineta Transportation Institute. Kittleson and Associates, a local engineering consulting firm, has adopted the LTS network for the Department of Transportation, Baltimore City [
22]. The Kittleson LTS network is used as reference here. The LTS assigns each road segment to one of four levels, ranging from LTS 1 (lowest stress) to LTS 4 (highest stress) based on lanes, speed limit, parking availability, presence of a centerline, intersections, and the type and width of bicycle lanes where they exist [
23]. The distribution of transportation infrastructure facilities is often measured by accessibility to them. Accessibility is widely used in transportation planning and policy decisions, as it indicates one’s ability to reach desired services or infrastructure. It illustrates how much effort is required, using the transportation system, to reach services or activities from a given location [
24]. It is one of the key ways to evaluate the accessibility of the system. Access is mostly concerned with convenience of transportation infrastructure to a person or area and when it relates to transportation, it is a measurement of distance and/or cost based on origin-destination [
25]. For this study, an accessibility analysis is performed on bike share infrastructure.
The study effectively establishes a method to assess the equity of bike share infrastructure using population density. Additionally, this study provides a GIS-based methodology for planning bikeshare using equity and level of traffic stress. Utilization of accessibility measures in project prioritization and the equity of accessibility have not been fully integrated in transportation planning for Baltimore. Incorporating equity in transportation policies in cities is often challenging because the built environment and land use naturally develop into centers and peripheries [
25,
26] and infrastructure often is not spread equally across socio-demographic groups that diverge in their ability and/or need [
10,
12]. This study illustrates the comparison between existing equity gap metrics and our adapted density-based metric and provides recommendations for future expansion of bikeshare in Baltimore City.
4. Bike Equity Index Development
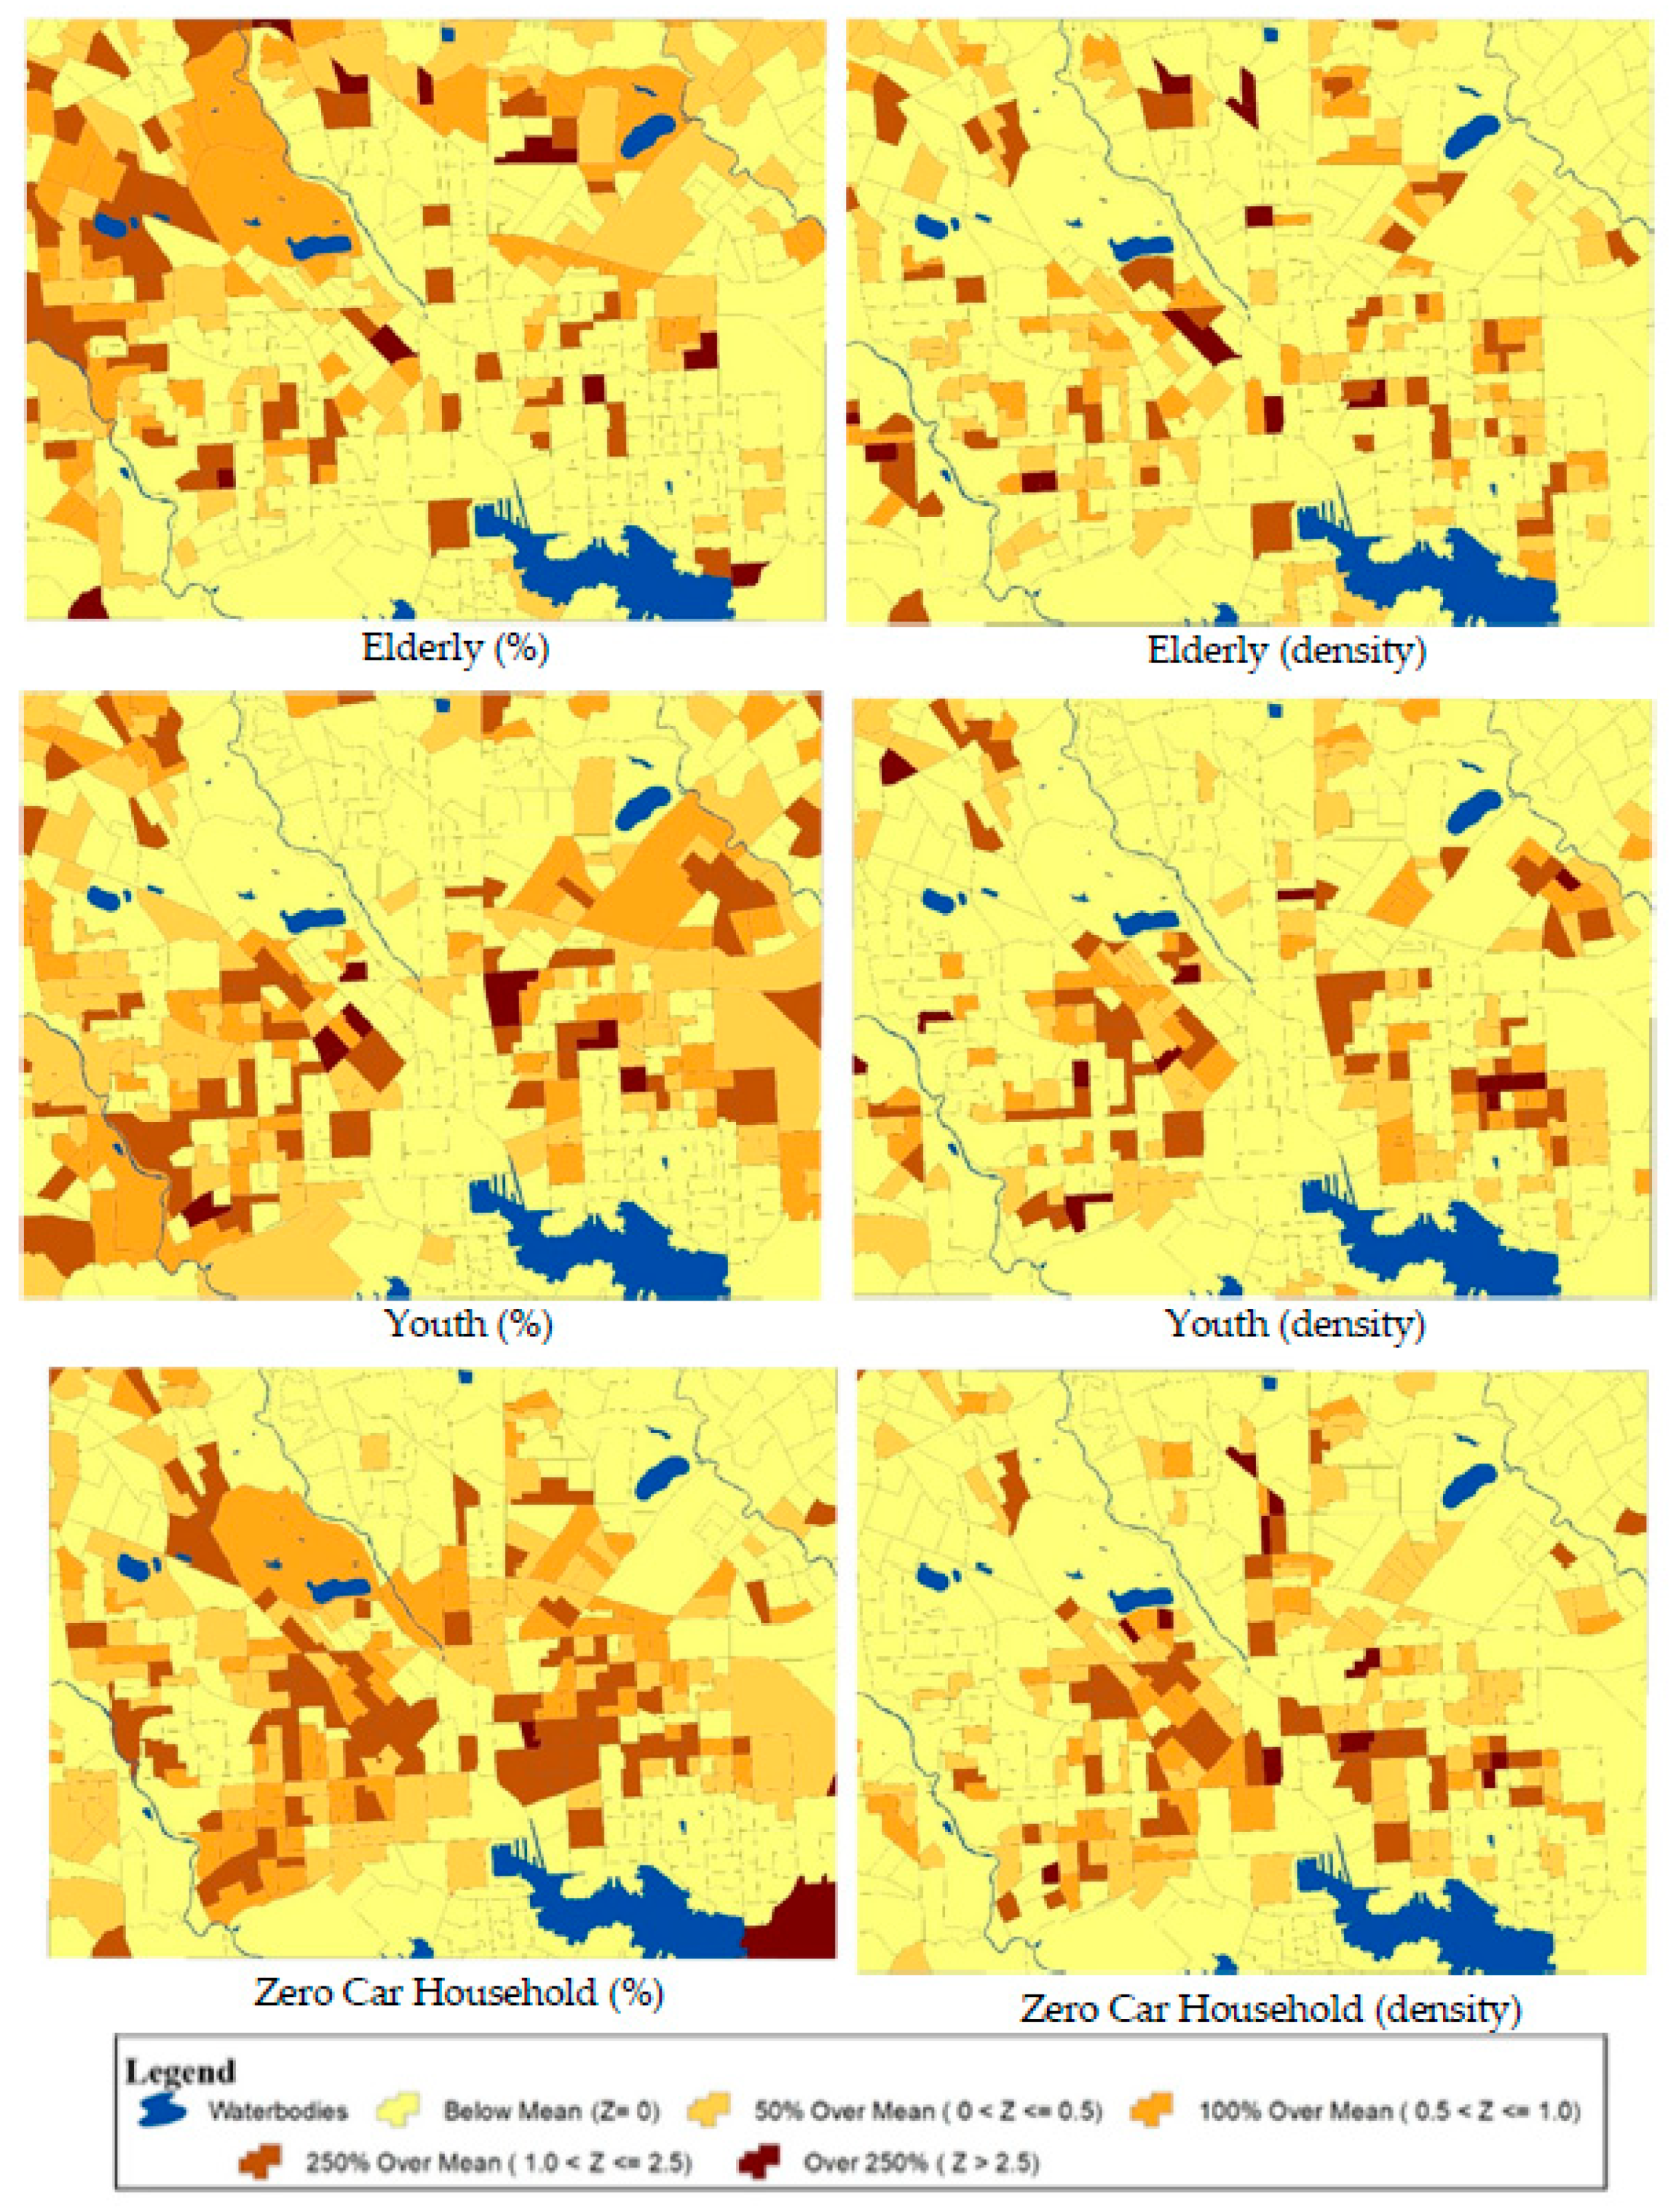
The Bike Equity Index used in this study is a composite measure of the ACS Census data from five demographic groups—people under 18 years old (Youth) and older than 65 years old (Elderly), minorities (non-white, non-Hispanic), low-income and zero-car households. These indicators can be categorized into two groups: (1) Transit dependent indicators and (2) Environmental Justice indicators
The Bike Equity Index (BEI) initially used in this study is adopted from the methodology developed by Rachel Prelog, who published a report at the League of American Bicyclists [
16]. The index is useful to identify gaps and improve decision in communities at the census block group level. The five indicators derived from the ACS data table are used to develop the BEI. To combine the indicators into a single Bicycle Equity Index measurement, values for each indicator are standardized using the z-score statistic. The z-score for each block group i, the mean, and standard deviation for all block groups in the study, is calculated. The z-score statistic represents how many standard deviations from the mean the value is for a region; see (1).
where x is the percentage of the indicator, μ is the mean, and σ is the standard deviation
Upon calculating the z-scores from all five indicators, they are summed to create the BEI for each census block group. All the indicators were given equal weight and only positive z-scores are used in the index construction while negative scores are converted to zero. It negates the diminishing effect of the below average values (negative z-scores) and no single indicator was thought to be more imperative in equity consideration.
The BEI index developed by Rachel Prelong for Chicago [
16] considered the percentage of each indicator per block group. Our proposed BEI considers the population (or household) per square (land area within each census block group) mile. Therefore, considering population density in developing the equity index is useful for the planning of bikeshare stations. This study proposes a new equity index which is expressed by the following equation:
where, E
i = max{0, z-Score of elderly population per square mi}; Y
i = max{0, z-Score of youth population per square mi}; C
i = max{0, z-Score of zero car households per square mi}; M
i = max{0, z-Score of minority (non-white) population per square mi}; L
i = max{0, z-Score of low income population per square mi}.
Using density as normalization provides a better scenario for planning purposes. Density assumes uniform distribution of indicators throughout the census block group and considers both the population and size of the census block. However, if we consider percentage, it only provides a ratio of the indicator compared to the total population in that block group, whether there is one household in the block group or per 1000 households.
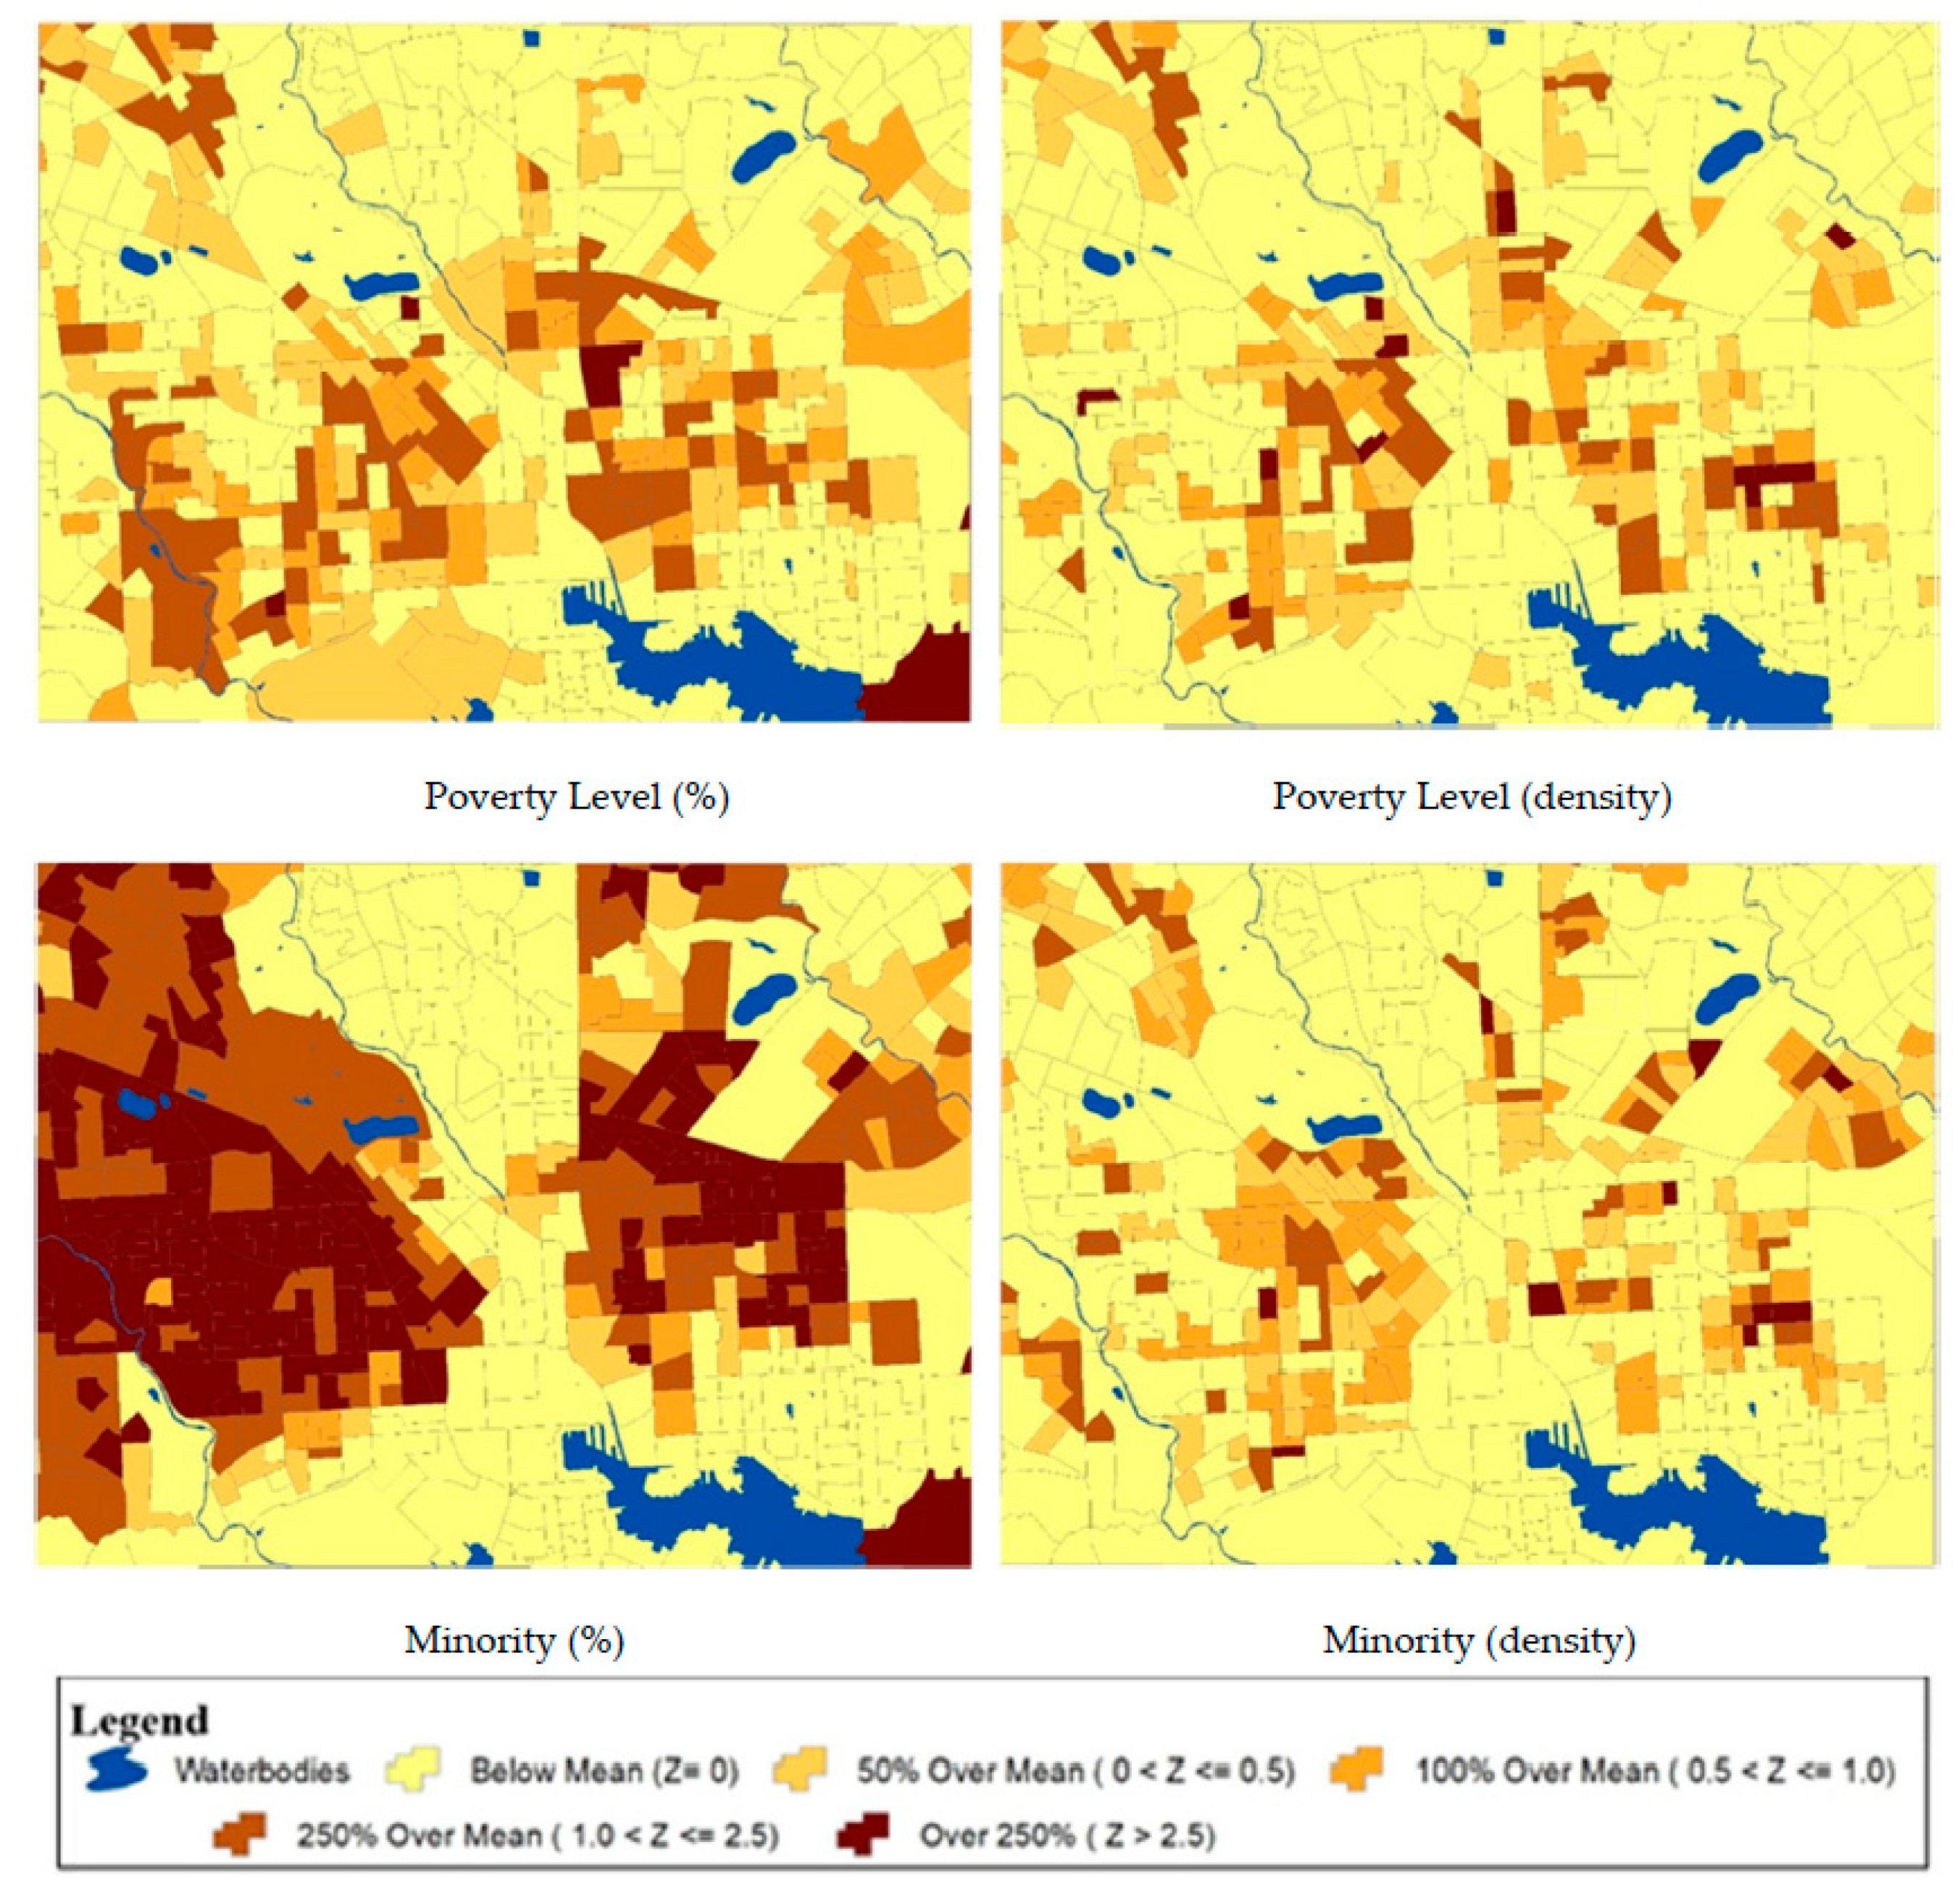
Figure 2 shows the z-scores of the transit dependent indicators,
Figure 3 shows z-scores for the equity indicators, and
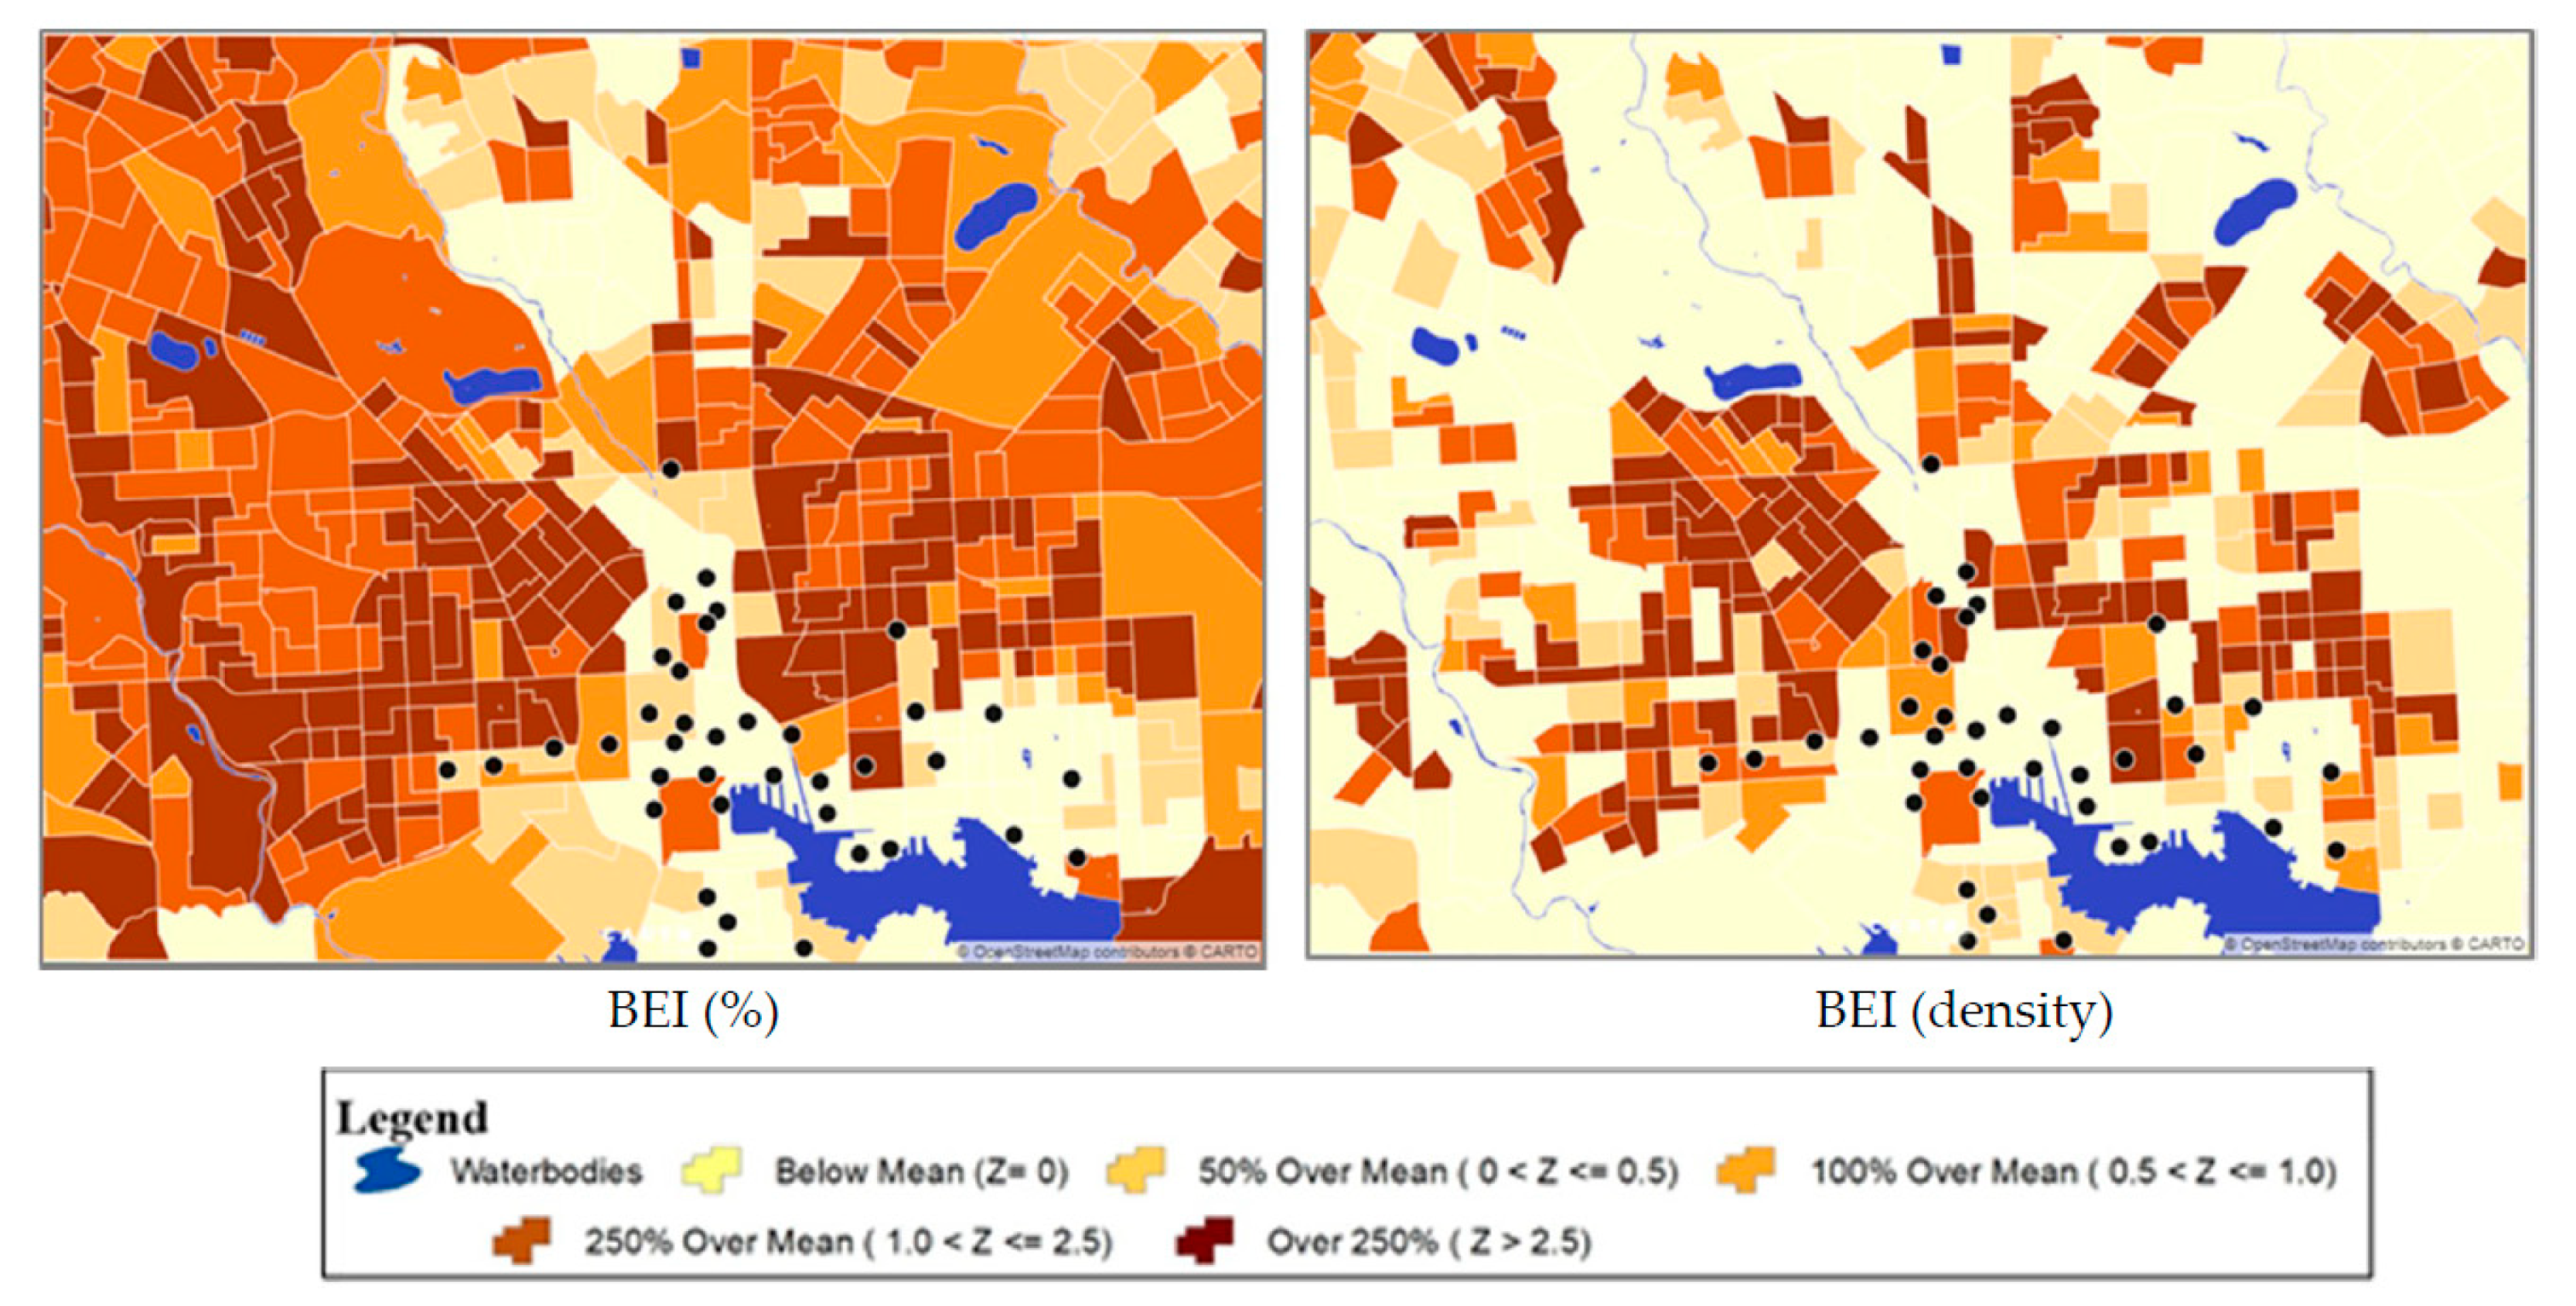
Figure 4 provides a comparison of the BEI using the two methods.
5. Results and Discussion
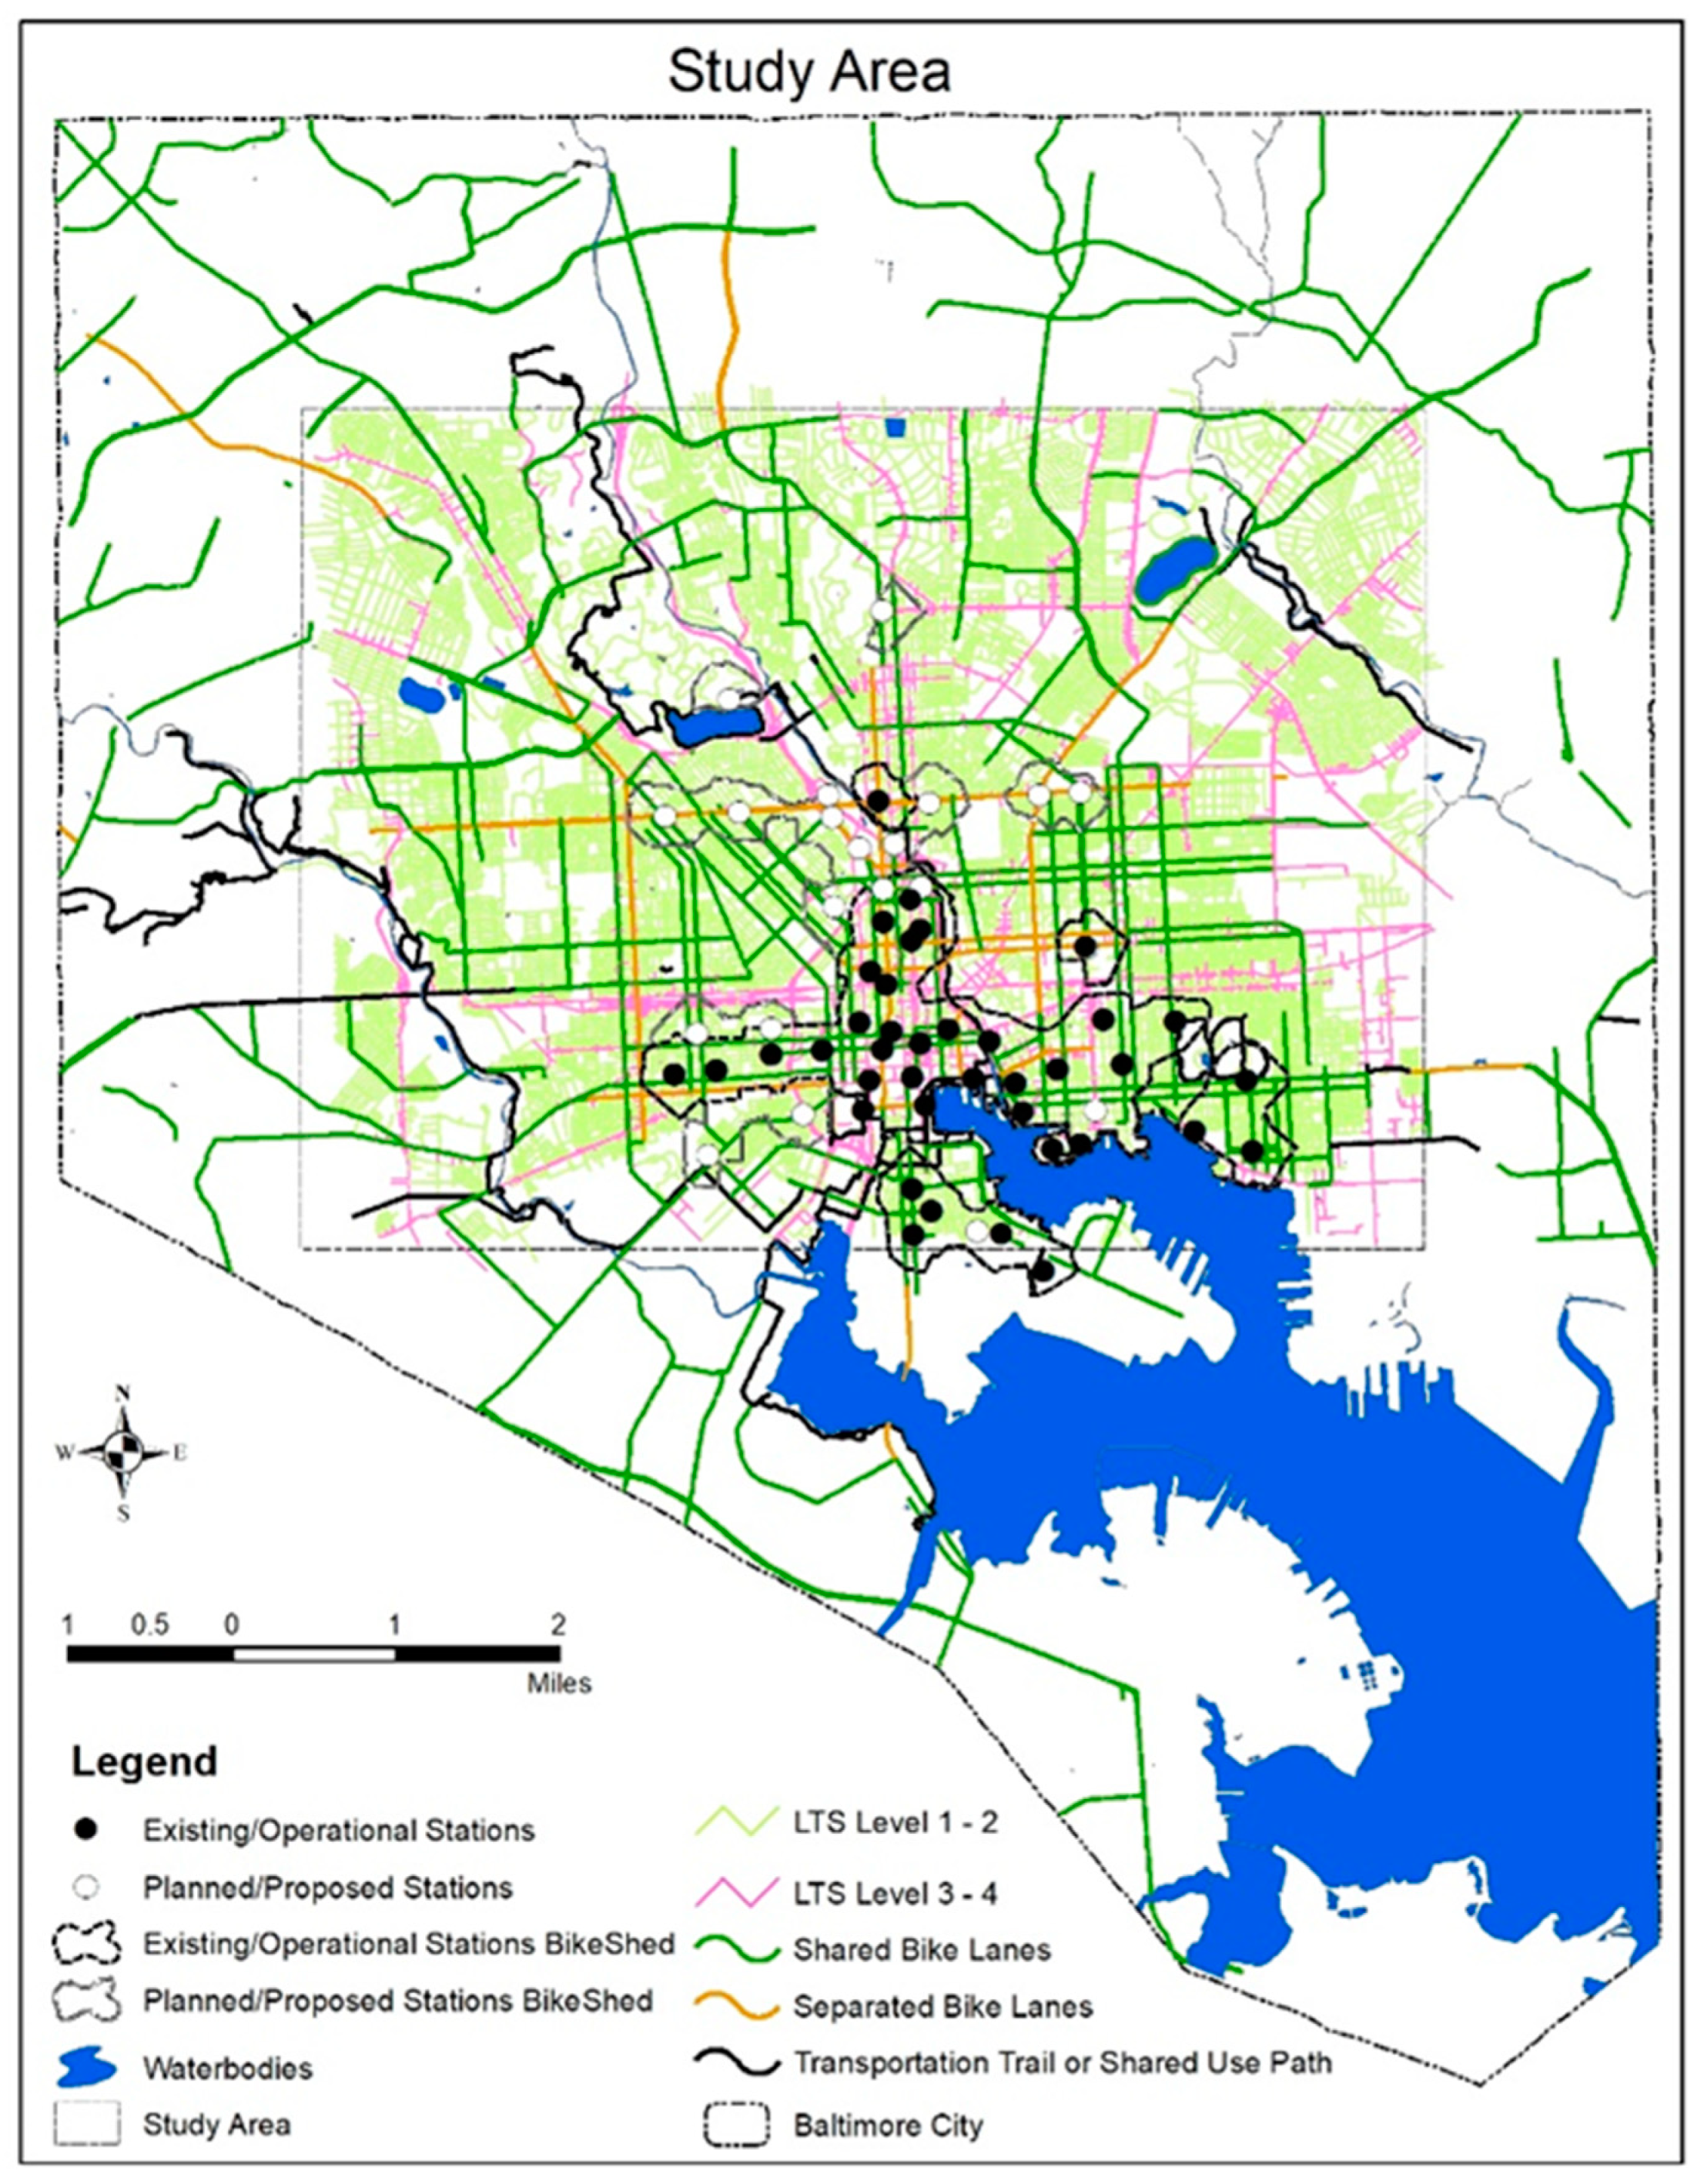
Baltimore City was relatively new to the bikeshare concept. Its bikeshare program was launched in 2016. Though the city is trying to revamp its public transportation and promote alternative and active modes of transportation, it lacks in accessibility and infrastructure related to biking. Only 15.36% of roads in Baltimore have dedicated bike lanes, but only 2.45% of the block groups within the city do not have any bikeable infrastructure.
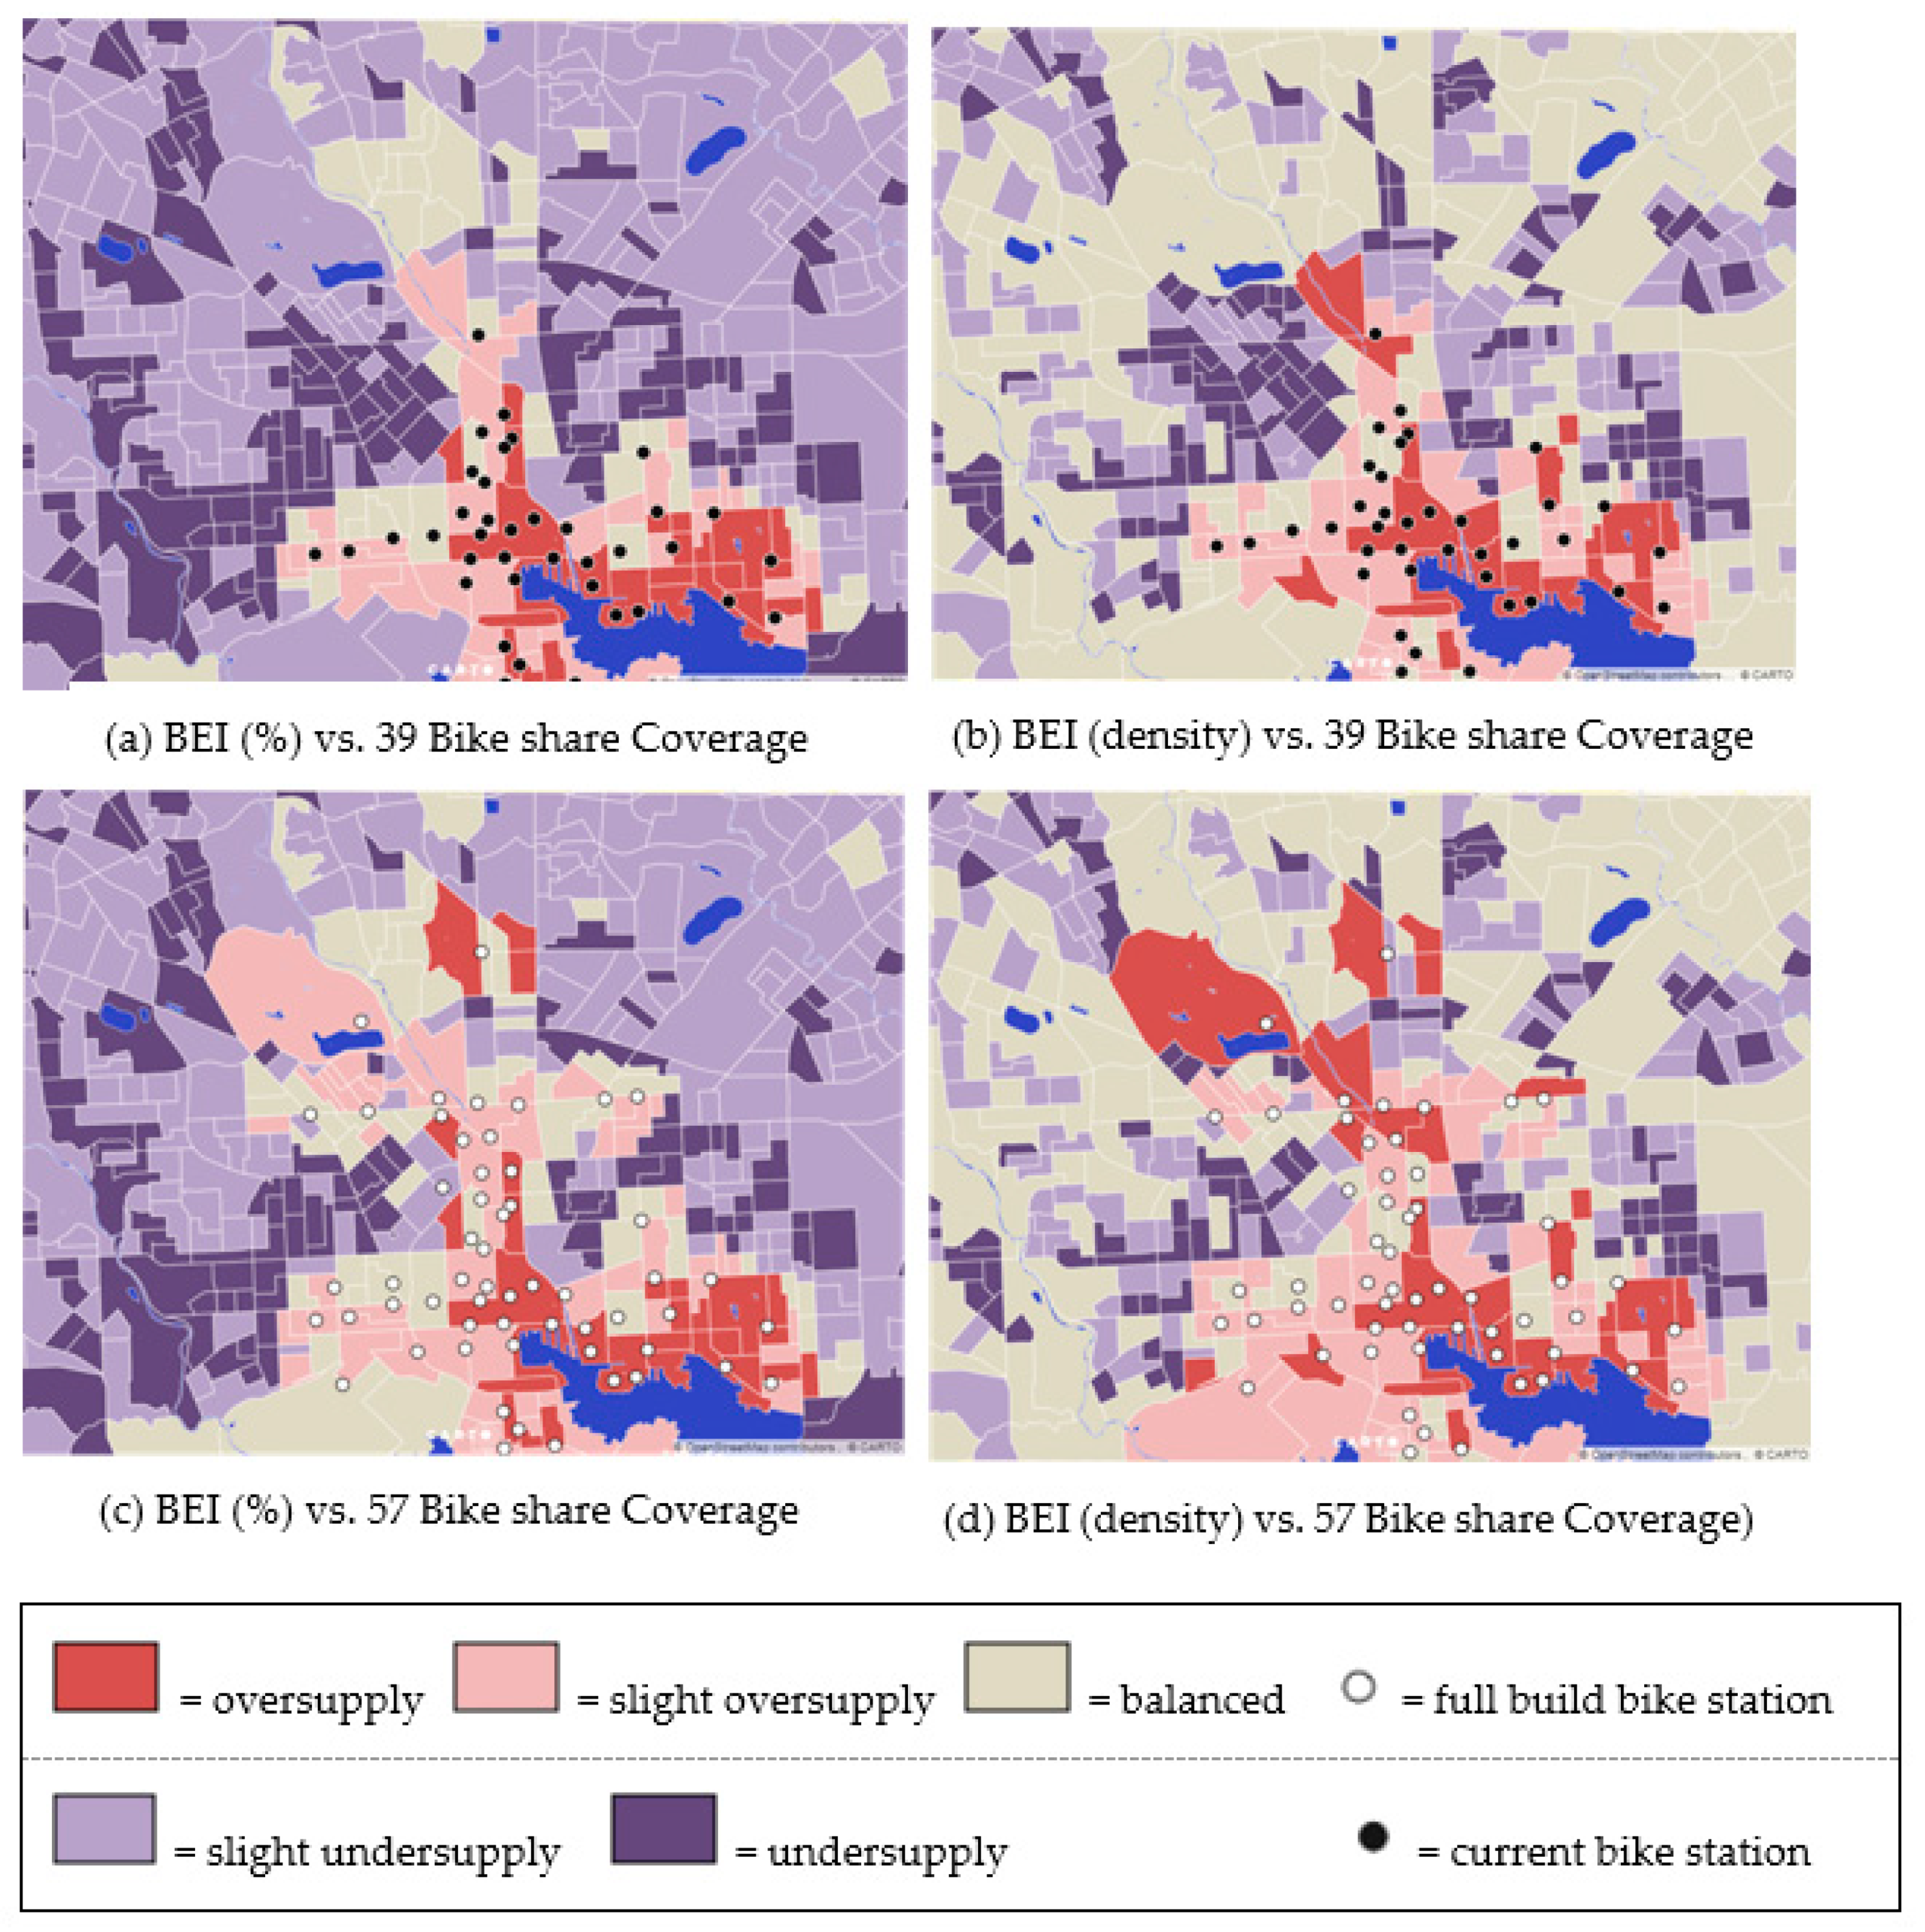
Table 1 shows the percent of the population (in bold) and percent of census block groups (in italics) which fall into each group. The bikeshed areas (catchment of quarter mile network distance) intersecting multiple block groups are proportionally attributed to each group as they would have similar access. Then they were compared with the total area of each region yielding a percent of bikeshare coverage metric for each block group.
Table 1 categorizes bikeshare coverage into three categories: no coverage (none), partial coverage (part), full coverage (full). The Bike Equity Index is divided into three groups as well: Low Need (BEI = 0), Medium Need (0 < BEI ≤ 2.5), and High Need (BEI > 2.5).
The program did have 39 bikeshare stations in Baltimore City. Due to the small size of the system, 81% of all census blocks in the study area did not have access to bike share, which illustrated the importance of prioritizing development and expansion of such networks. Stations should be deployed where the most people and those with the greatest need would benefit from the system. Most of the bike share coverage was concentrated in medium need areas when measuring by density; see
Table 1 (Part A and B).
Figure 5 presents the categories in
Table 1 graphically. Red indicates block groups that have an oversupply of station access based on need; purple represents an undersupply of station access based on need; and gray represents a well-balanced block group. The BEI using percentages determines most of the city is unbalanced; however, the density BEI shows much of the outlying areas of the city as balanced since the population density in those areas does not warrant a bike share location. BEI-density is more representative of the bike share planning process as it considers both the population and land area. Using BEI-density, the average BEI for persons with access to bike share is 1.44; for those without access it is 2.25; see
Table 2.
The authors strongly believe that a population density base index should be considered in equity studies. As shown in
Figure 5, the consideration of density provides planners with a targeted geographic area for bike share infrastructure. This is critically important for smaller systems as station density is an important determinant of ridership for larger networks.
6. Expanding Baltimore’s Bike share System Discussion
Equity should be an important determinant during the planning process and not simply used as a post-implementation metric. We propose a GIS-based methodology to plan the expansion of future bike share facilities using the density-based bike equity index and the level of traffic stress.
Table 2 illustrates the individual level average density BEI and LTS scores with and without access to the bike share. For the level of traffic stress, the total length of stressful roads (LTS 3 & 4) was compared with total road length within each block group. Then the percentage of unsafe road lengths ((LTS 3 & 4)/(Total road length)) was standardized by z-score. A low LTS index indicates low traffic stress (i.e., a lower percentage of high stress roads). Similar to the BEI, negative z-scores are rounded up to zero to prevent the cancelation of effects. The three categories for the LTS index are as follows: low stress (Z = 0), medium stress (0 < Z ≤ 1), and high stress (Z > 1).
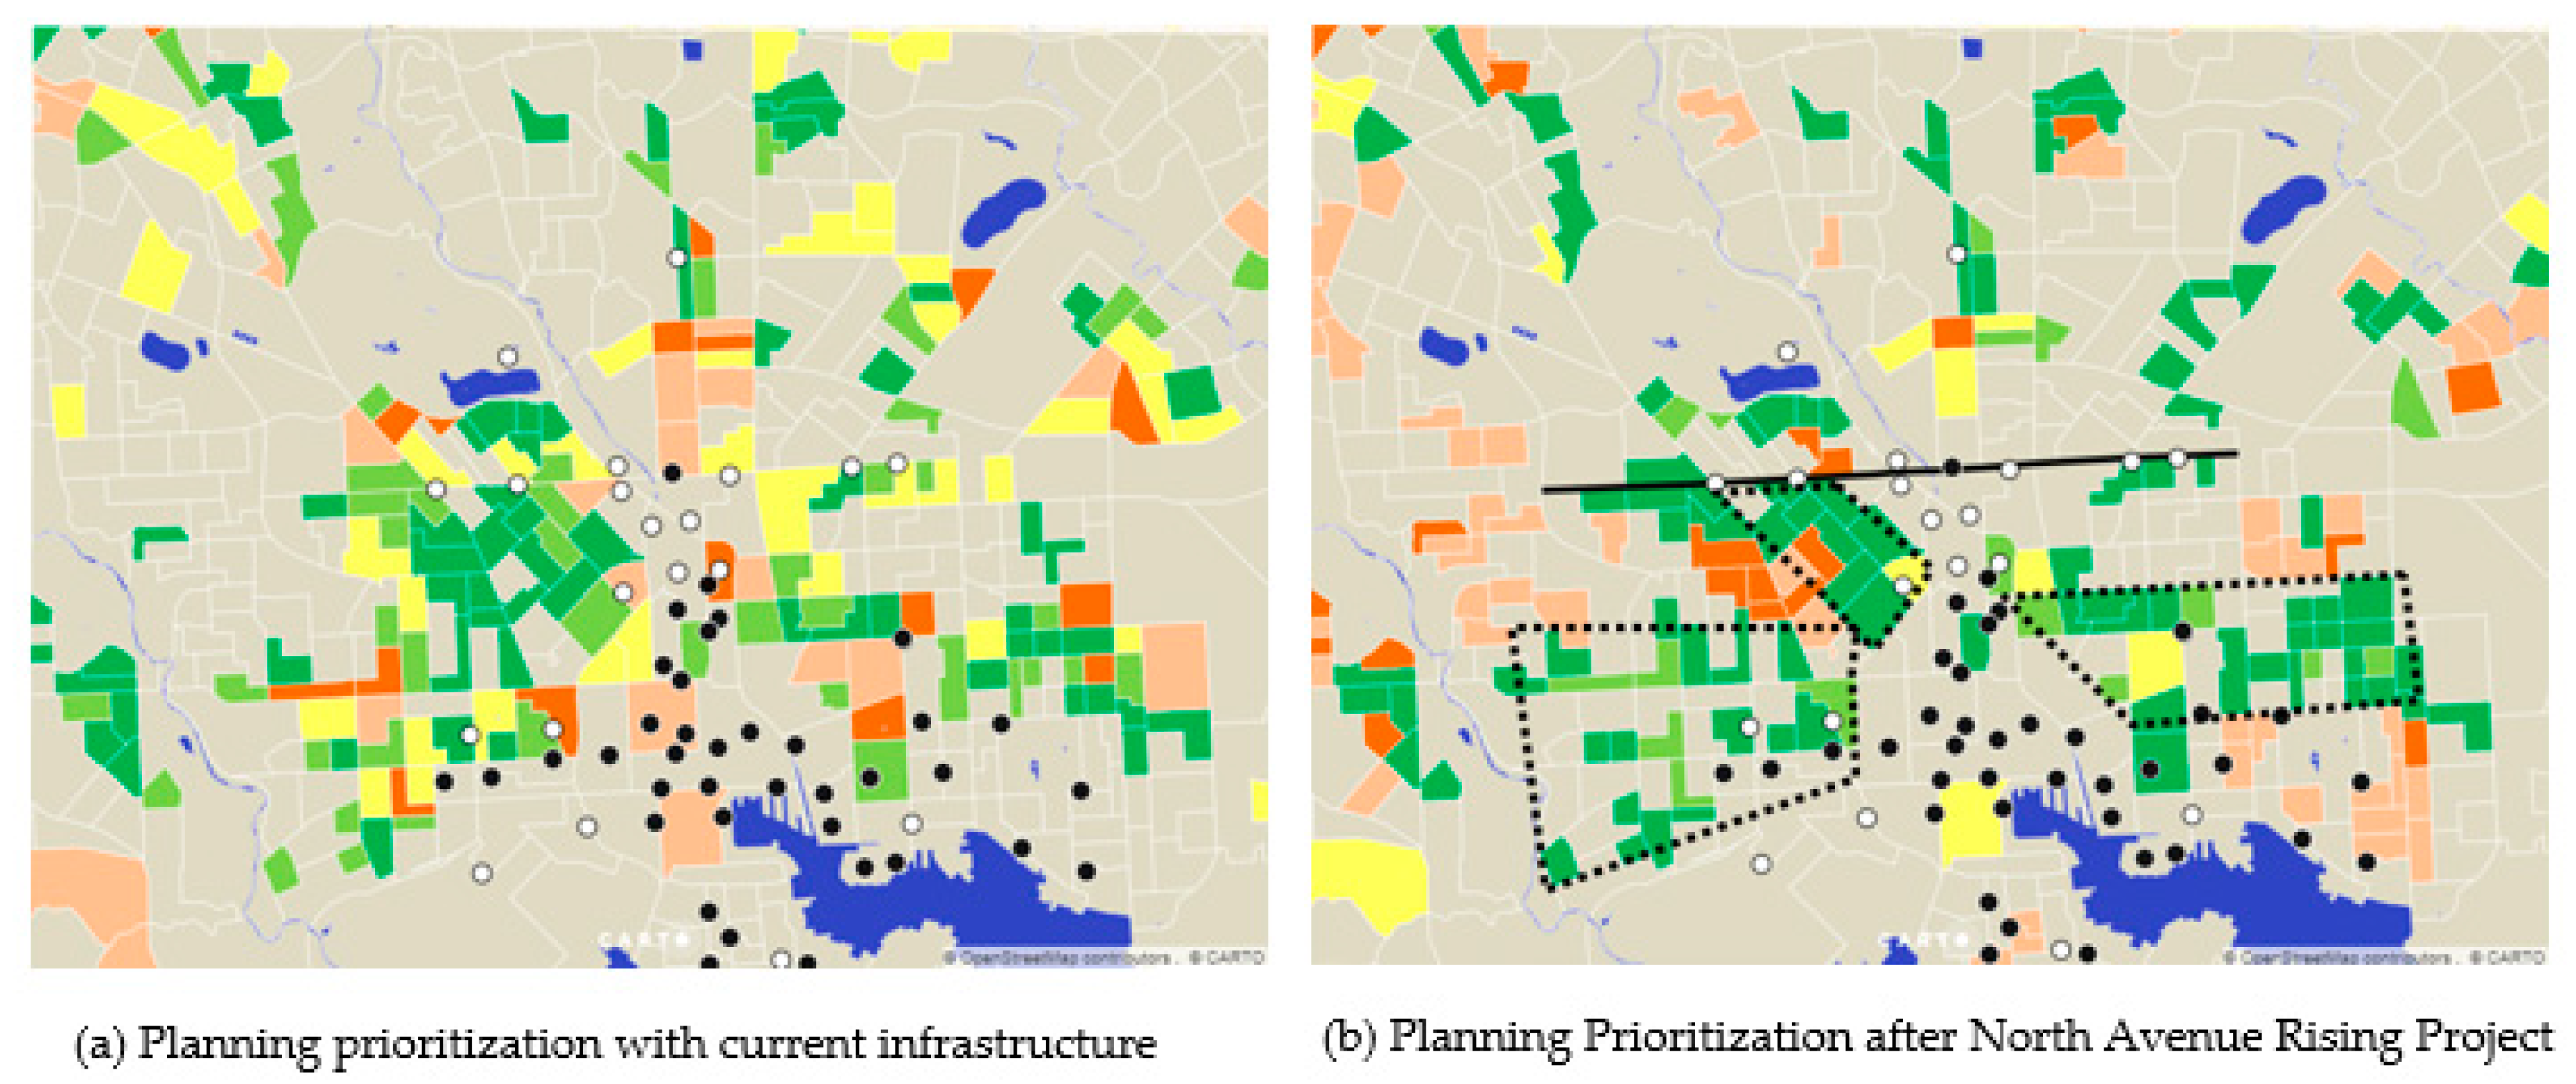
Table 3 shows the breakdown by BEI-density and LTS index in a planning perspective. Block groups with high need and low stress (shown in green) are prime for bikeshare investment. Conversely, block groups with high need and high stress require bike infrastructure (e.g., bike lanes) or traffic calming before implementing bike share (shown in orange).
Figure 6 shows these areas geographically. The current average level of traffic stress index for those who had access to bike share was 0.54, whereas those who did not have access to bike share had an average LTS index of 0.37; see
Table 2,
Table 3 (Part A), and
Figure 6a. Currently, 15% of the population reside in block groups with high need and low stress. The bike share program was started with the goal of creating a sustainable network of alternative transportation for all walks of lives. Yet the existing infrastructure for bike share in Baltimore was not aligned with the planning principles; one would expect bikeshare to be built in safer locations or locations with low traffic stress. Before the system ended, the planned expansion for the bike share was along North Avenue (denoted by a black line in
Figure 6b) and in central Baltimore; see the dashed line in
Figure 6b. The new stations were being planned alongside the North Avenue Rising project which is being funded in part through the TIGER (Transportation Investment Generating Economic Recovery) grant program. The North Ave Rising multimodal roadway is a good example of how additional infrastructure can improve bikability and safety within a region [
10]. Transportation improvements include dedicated bus lanes, streetscaping and bike facilities (bike share stations and dedicated bus bike lanes).
Table 3 (Part B) shows the LTS Index breakdown by BEI with the addition of the bike lane along North Avenue. 21% of the population now live in high-need, low-stress zones. Though this lane did not greatly change the overall LTS index for the study site, the addition of the bike infrastructure lowers the level of traffic stress in the full design from 0.47 to 0.29 for those with bike share access under a fully built scenario; see
Table 2.
Under this full build-out scenario, equity is slightly improved to a BEI of 1.96 compared to the current BEI of 1.44. Despite this improvement, the City of Baltimore could benefit from more equitable placement of bike stations. Station installation within the high-need and low-stress zones marked by black dashed lines in
Figure 6b would have improved the equity for the system and should be considered for future systems. To enhance the equity of the former system, the research team would have recommended that the City of Baltimore prioritize bike share system expansion into the neighborhoods to the east (Franklin Square, Lexington) and west (Washington Hill, Butcher’s Hill, Highlandtown) of the downtown corridor.
7. Future Research and Conclusion
The GIS-based BEI-Density developed for Baltimore City is part of ongoing research among the bike share community. Other cities may adopt this study and modify it according to their specifications; it also may provide insights for dockless systems as well. After developing indexes for several cities, a comprehensive BEI can be established which can serve for most of the cities across the country. The following criterion can be considered in future research:
New bikeshed area calculation for access based on residential population density, land use, facilities, attractions, origin-destination trips, etc.
Considering the elevation of the road and land use pattern to evaluate the comfort in ridership.
Assigning weight to the indicators can help identify priority areas for investments.
Redistribution of the Bike Stations to create more locations tied to destinations (parks, trails).
In its short life, the BBS experienced a number of challenges, from missing bikes to staff turnover. Yet the system showed promise, and there is a clearly a demand for bike share trips in the city. The bicycle as transportation is an integral component of the city’s transportation and sustainability goals, but those ambitions must be paired with attention to the communities that benefit—or do not benefit—from public policy and infrastructure investment. Sustainable transportation is not achievable unless it delivers just outcomes and does not further marginalize the already-marginalized population.
A Bike Equity Index that can be used to evaluate cities across the country is much needed. This study provides a pathway for that by taking previous research a little further and suggesting possible future development. A comprehensive BEI should be considered as a requirement before any substantial investments because it will help reduce the social disparities. An equitable geographic and socio-economic distribution of bicycle infrastructure will serve all the residents and develop a comprehensive connected network throughout the city.


