Urban Land-Use Dynamics in the Niger Delta: The Case of Greater Port Harcourt Watershed


Abstract
:1. Introduction
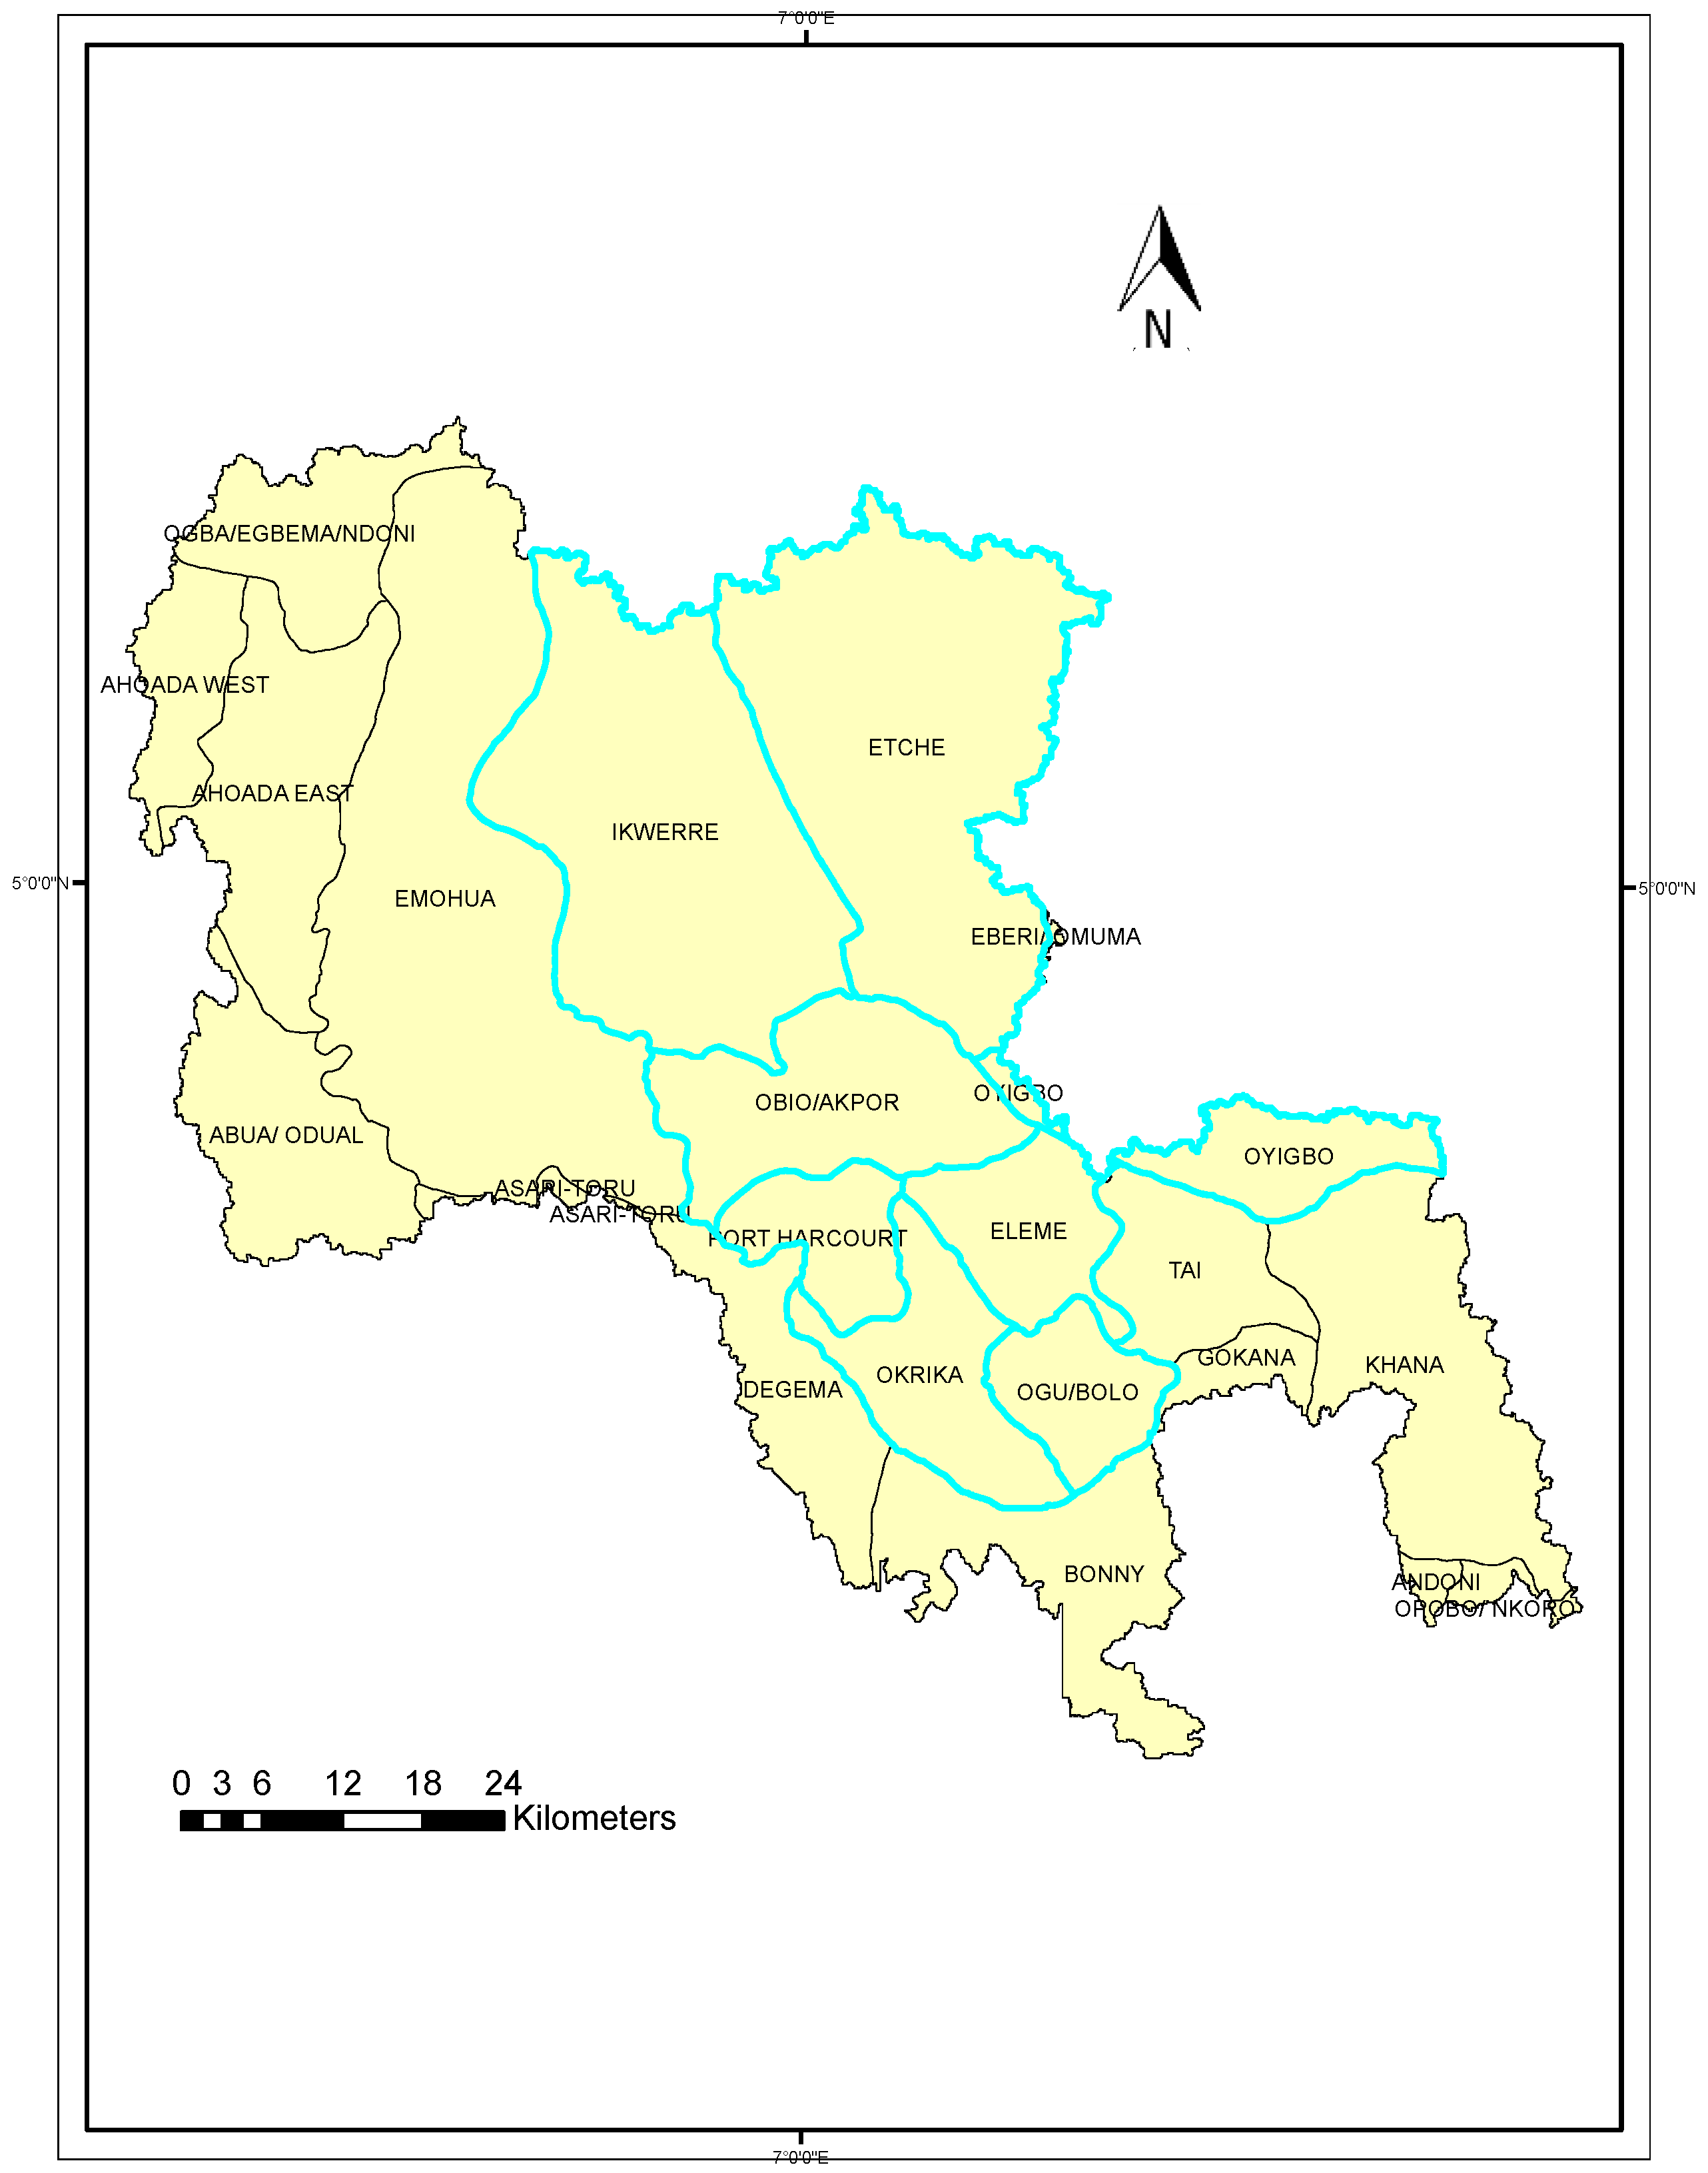
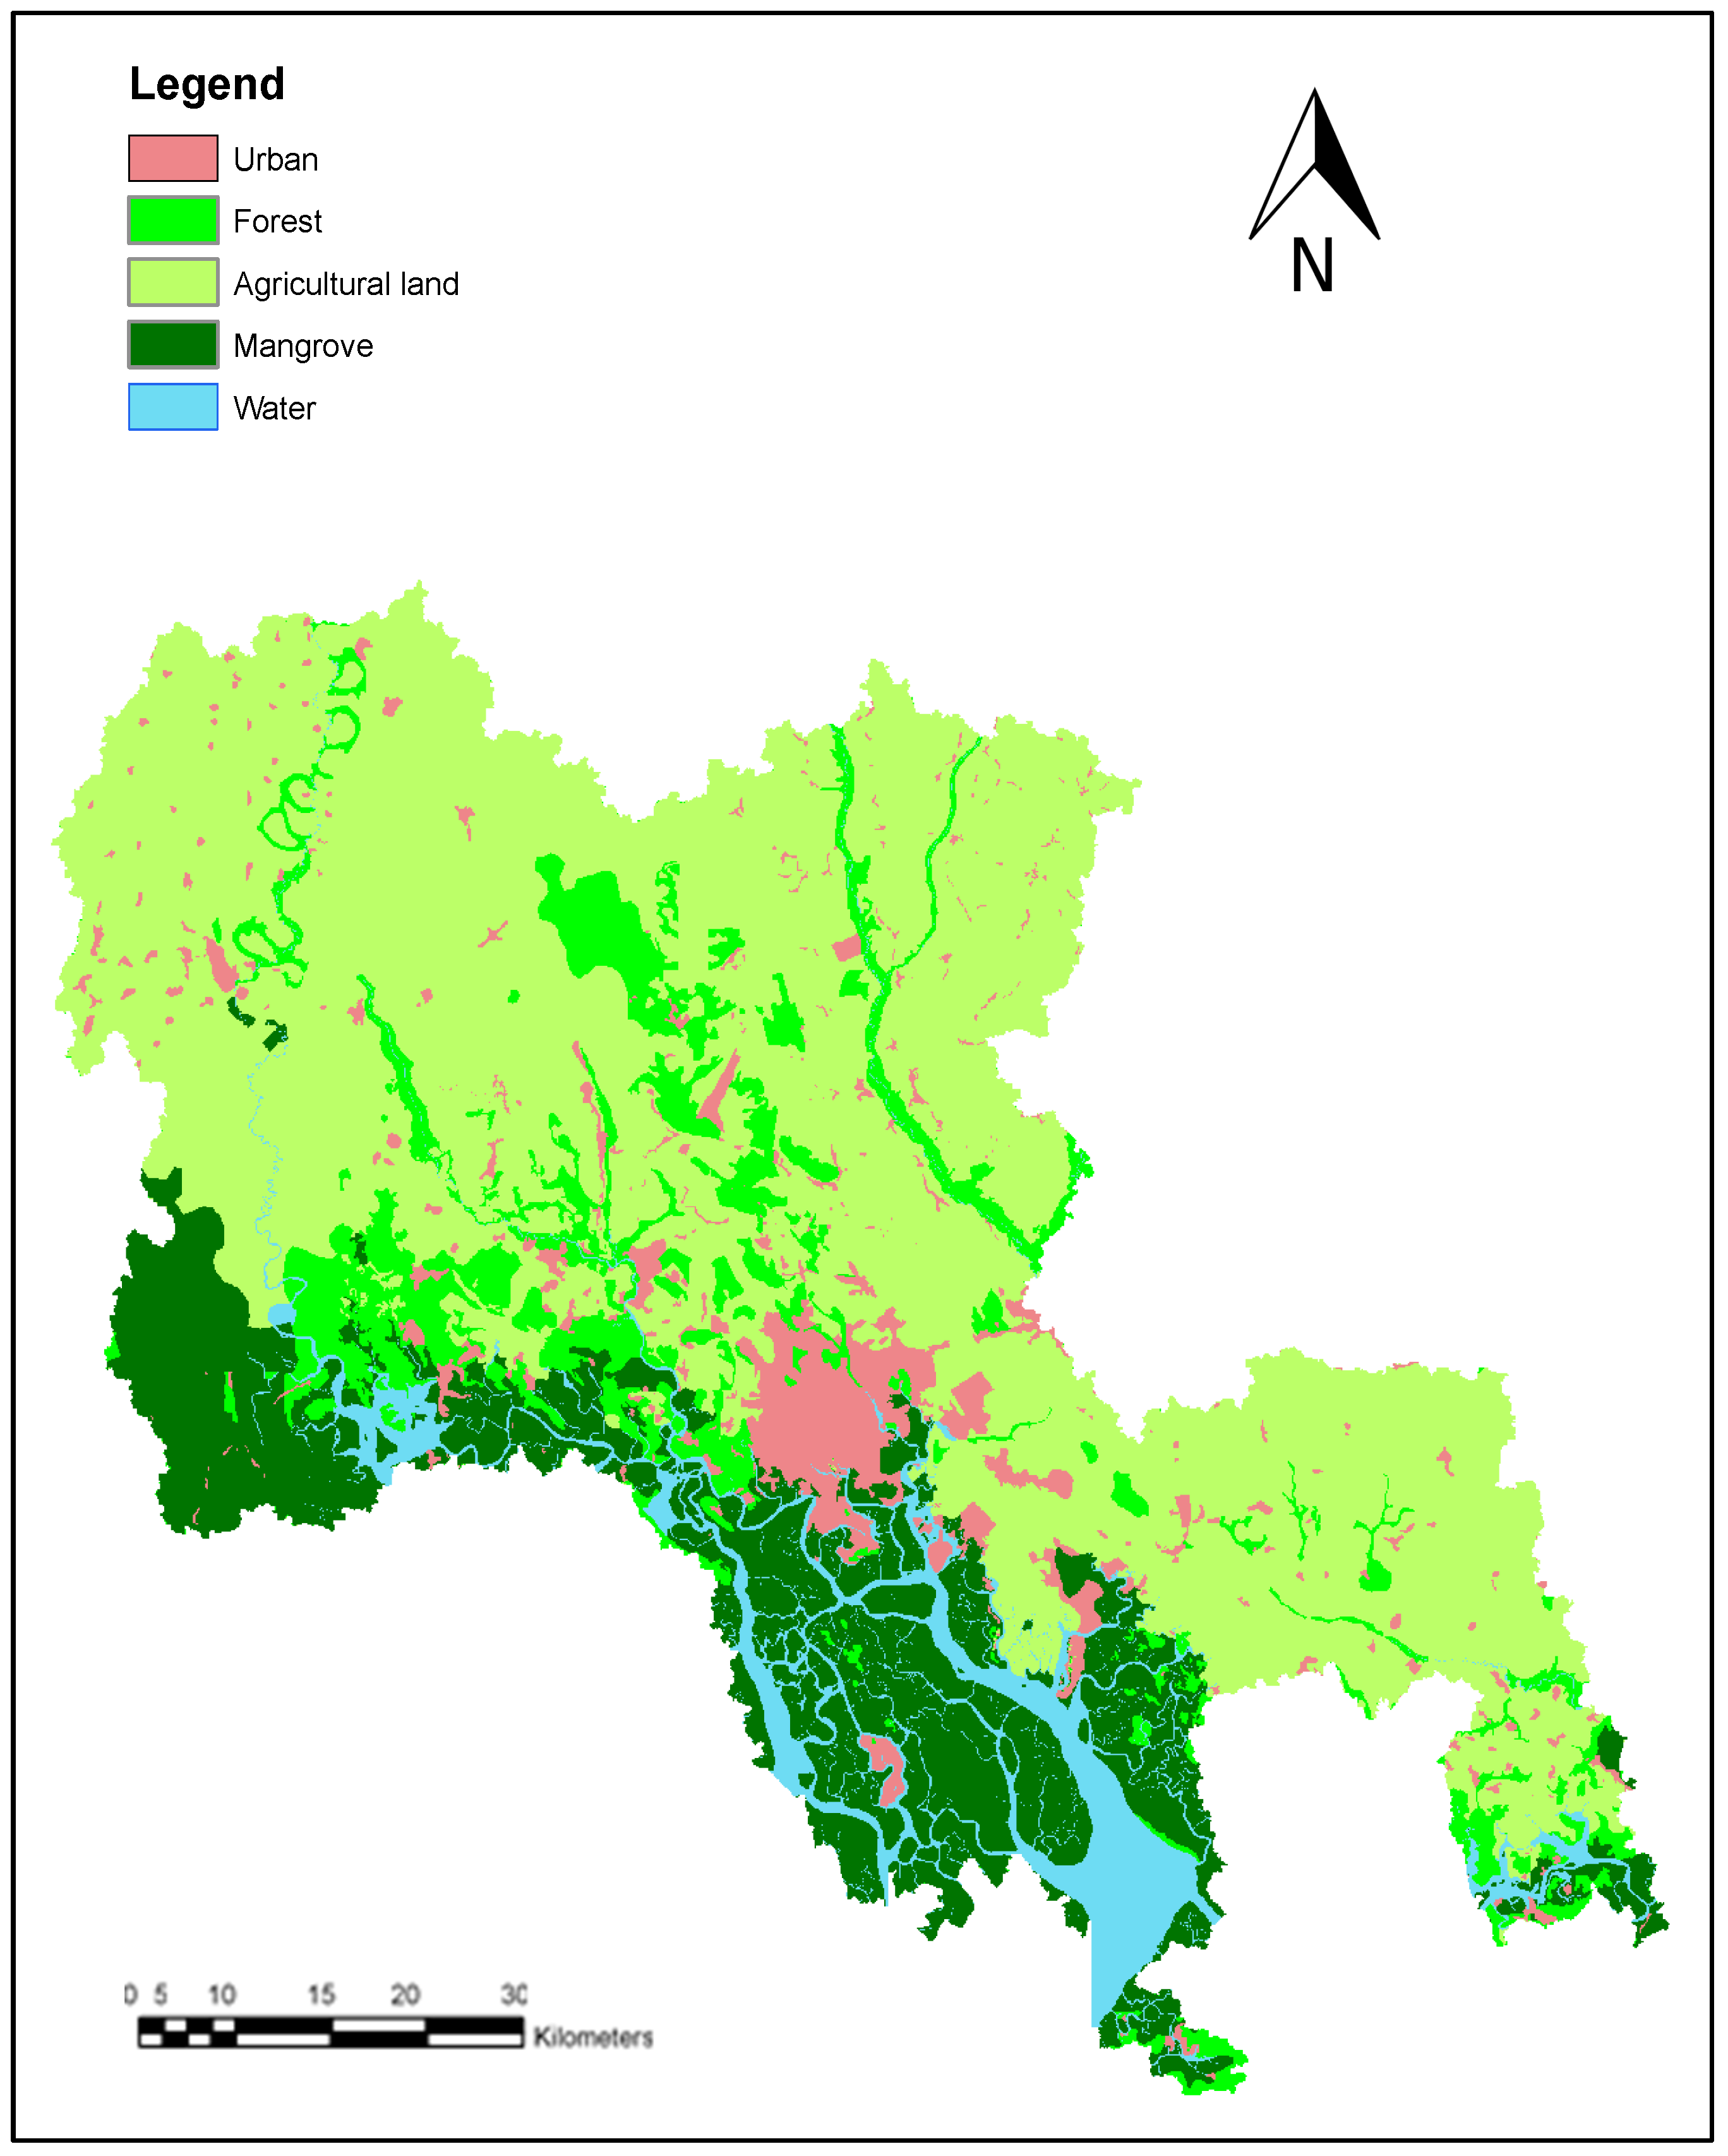
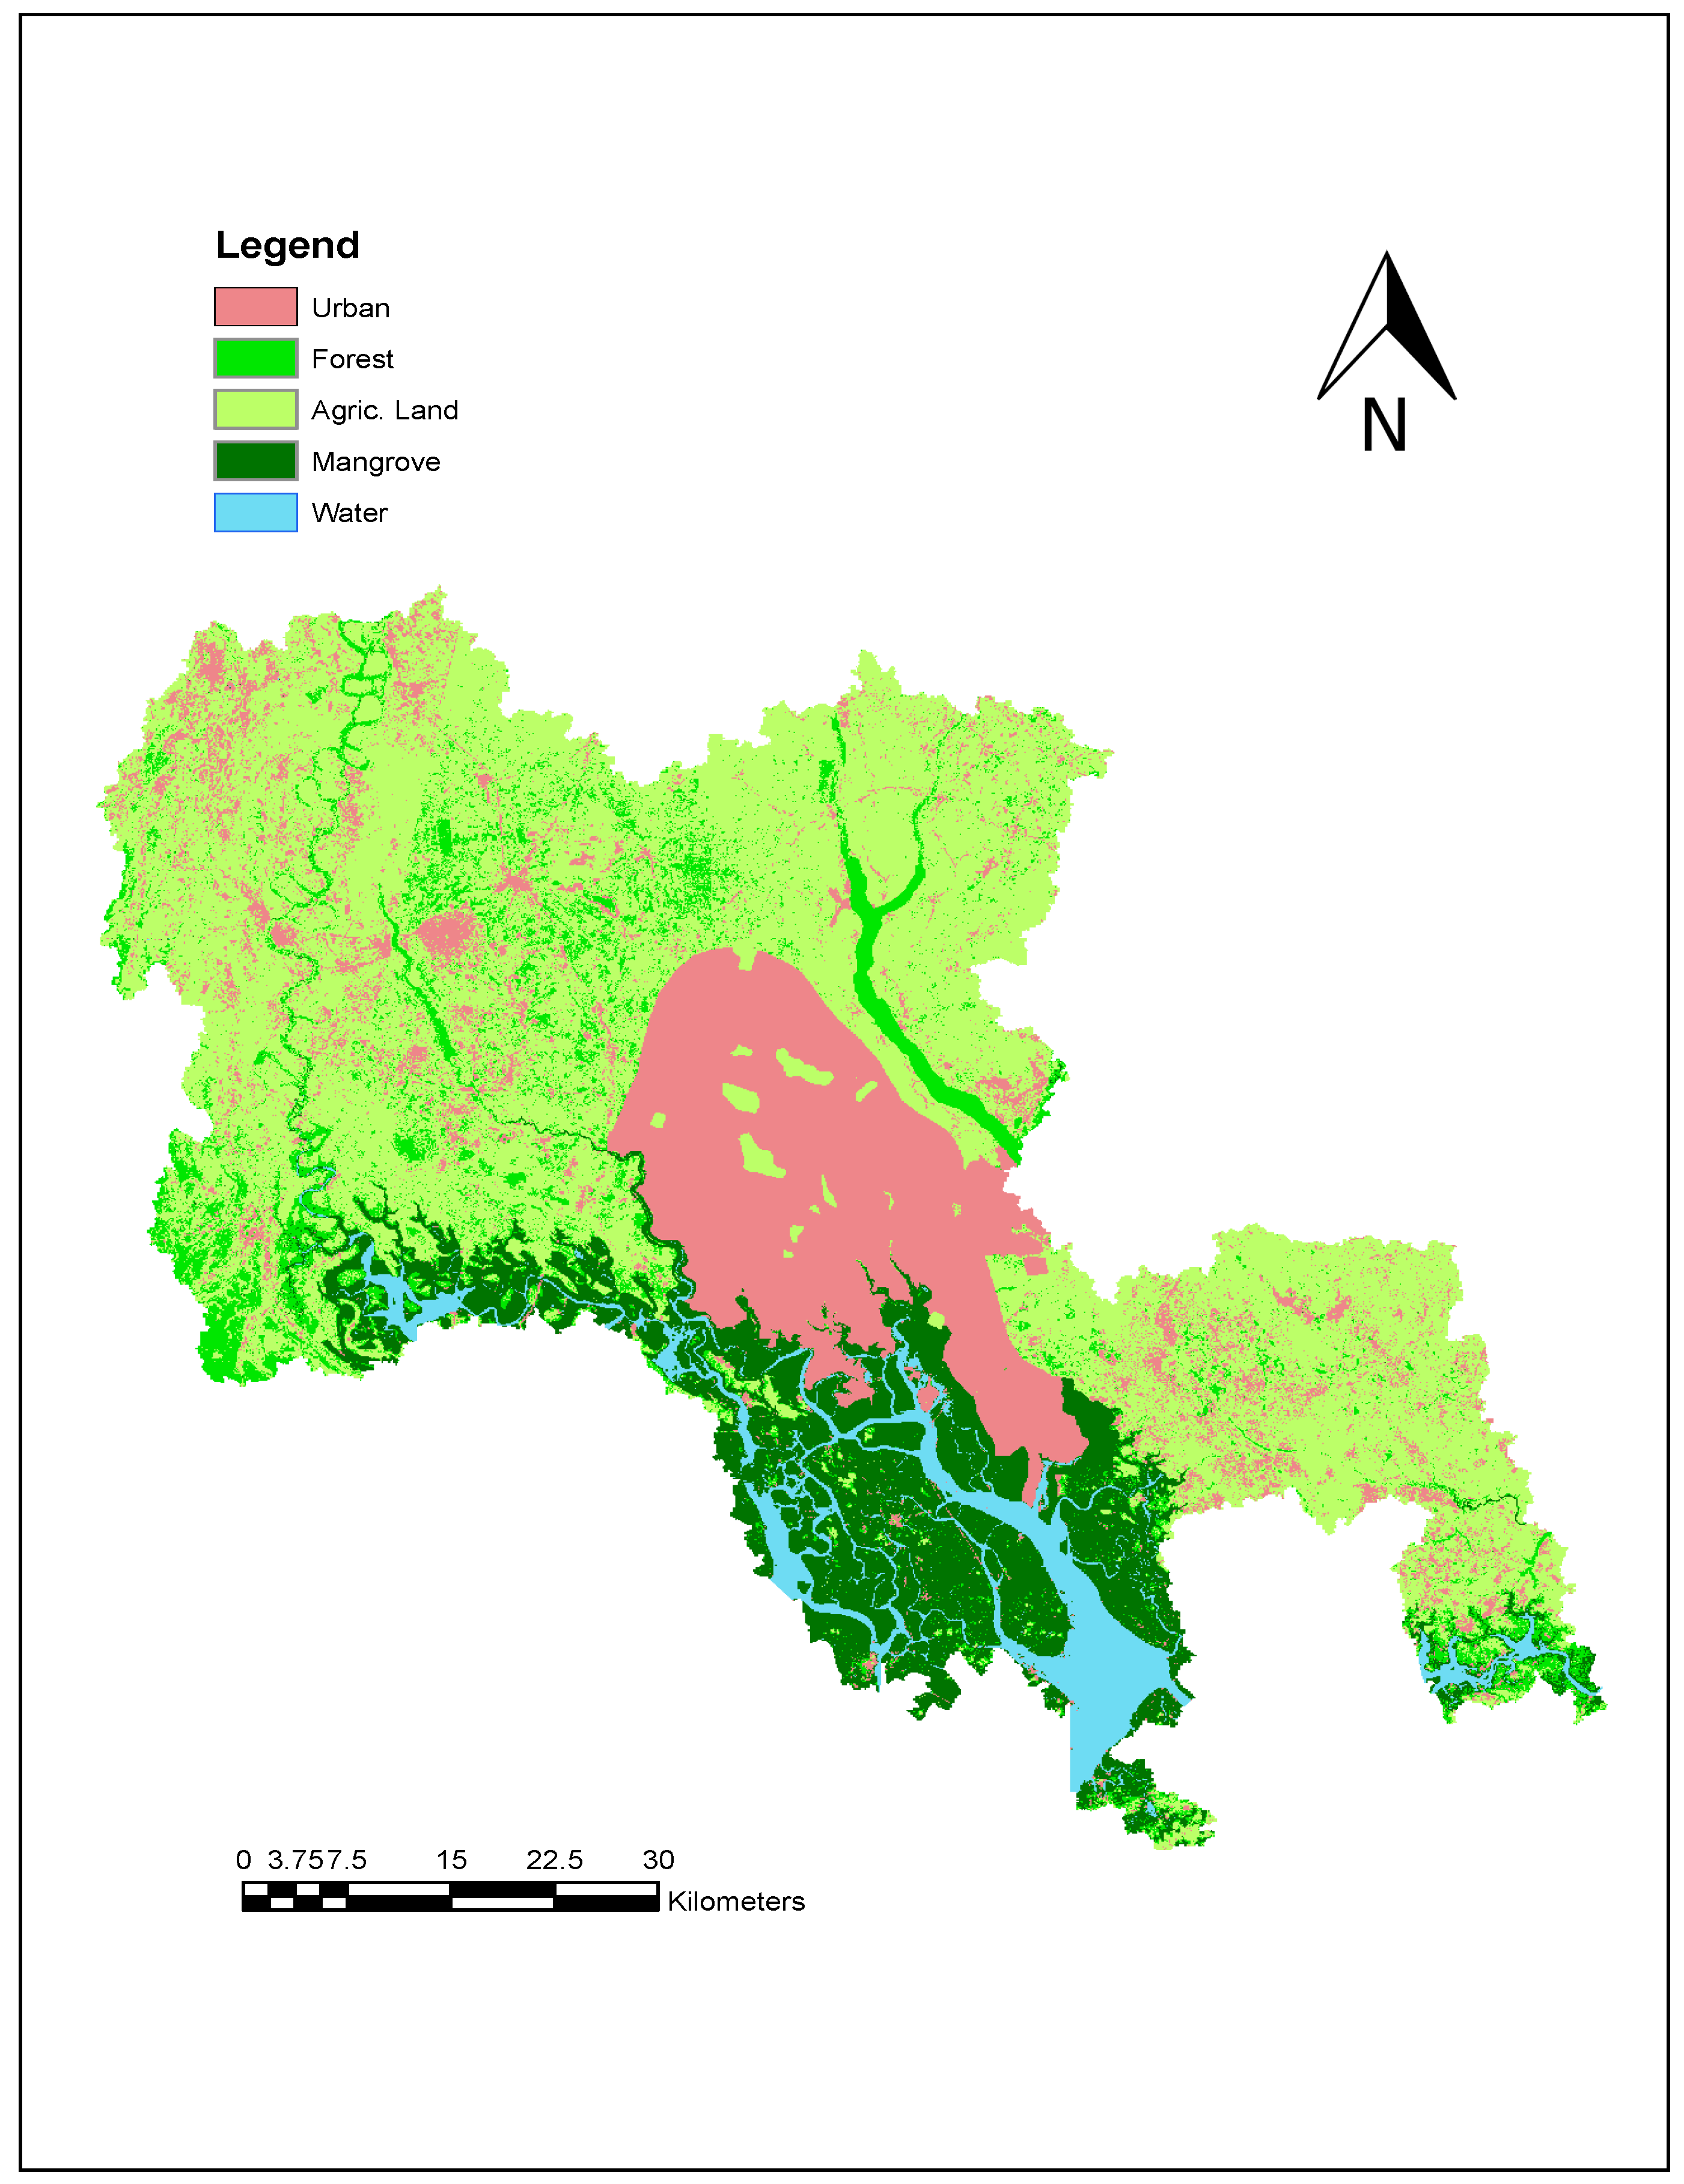
2. Study Area
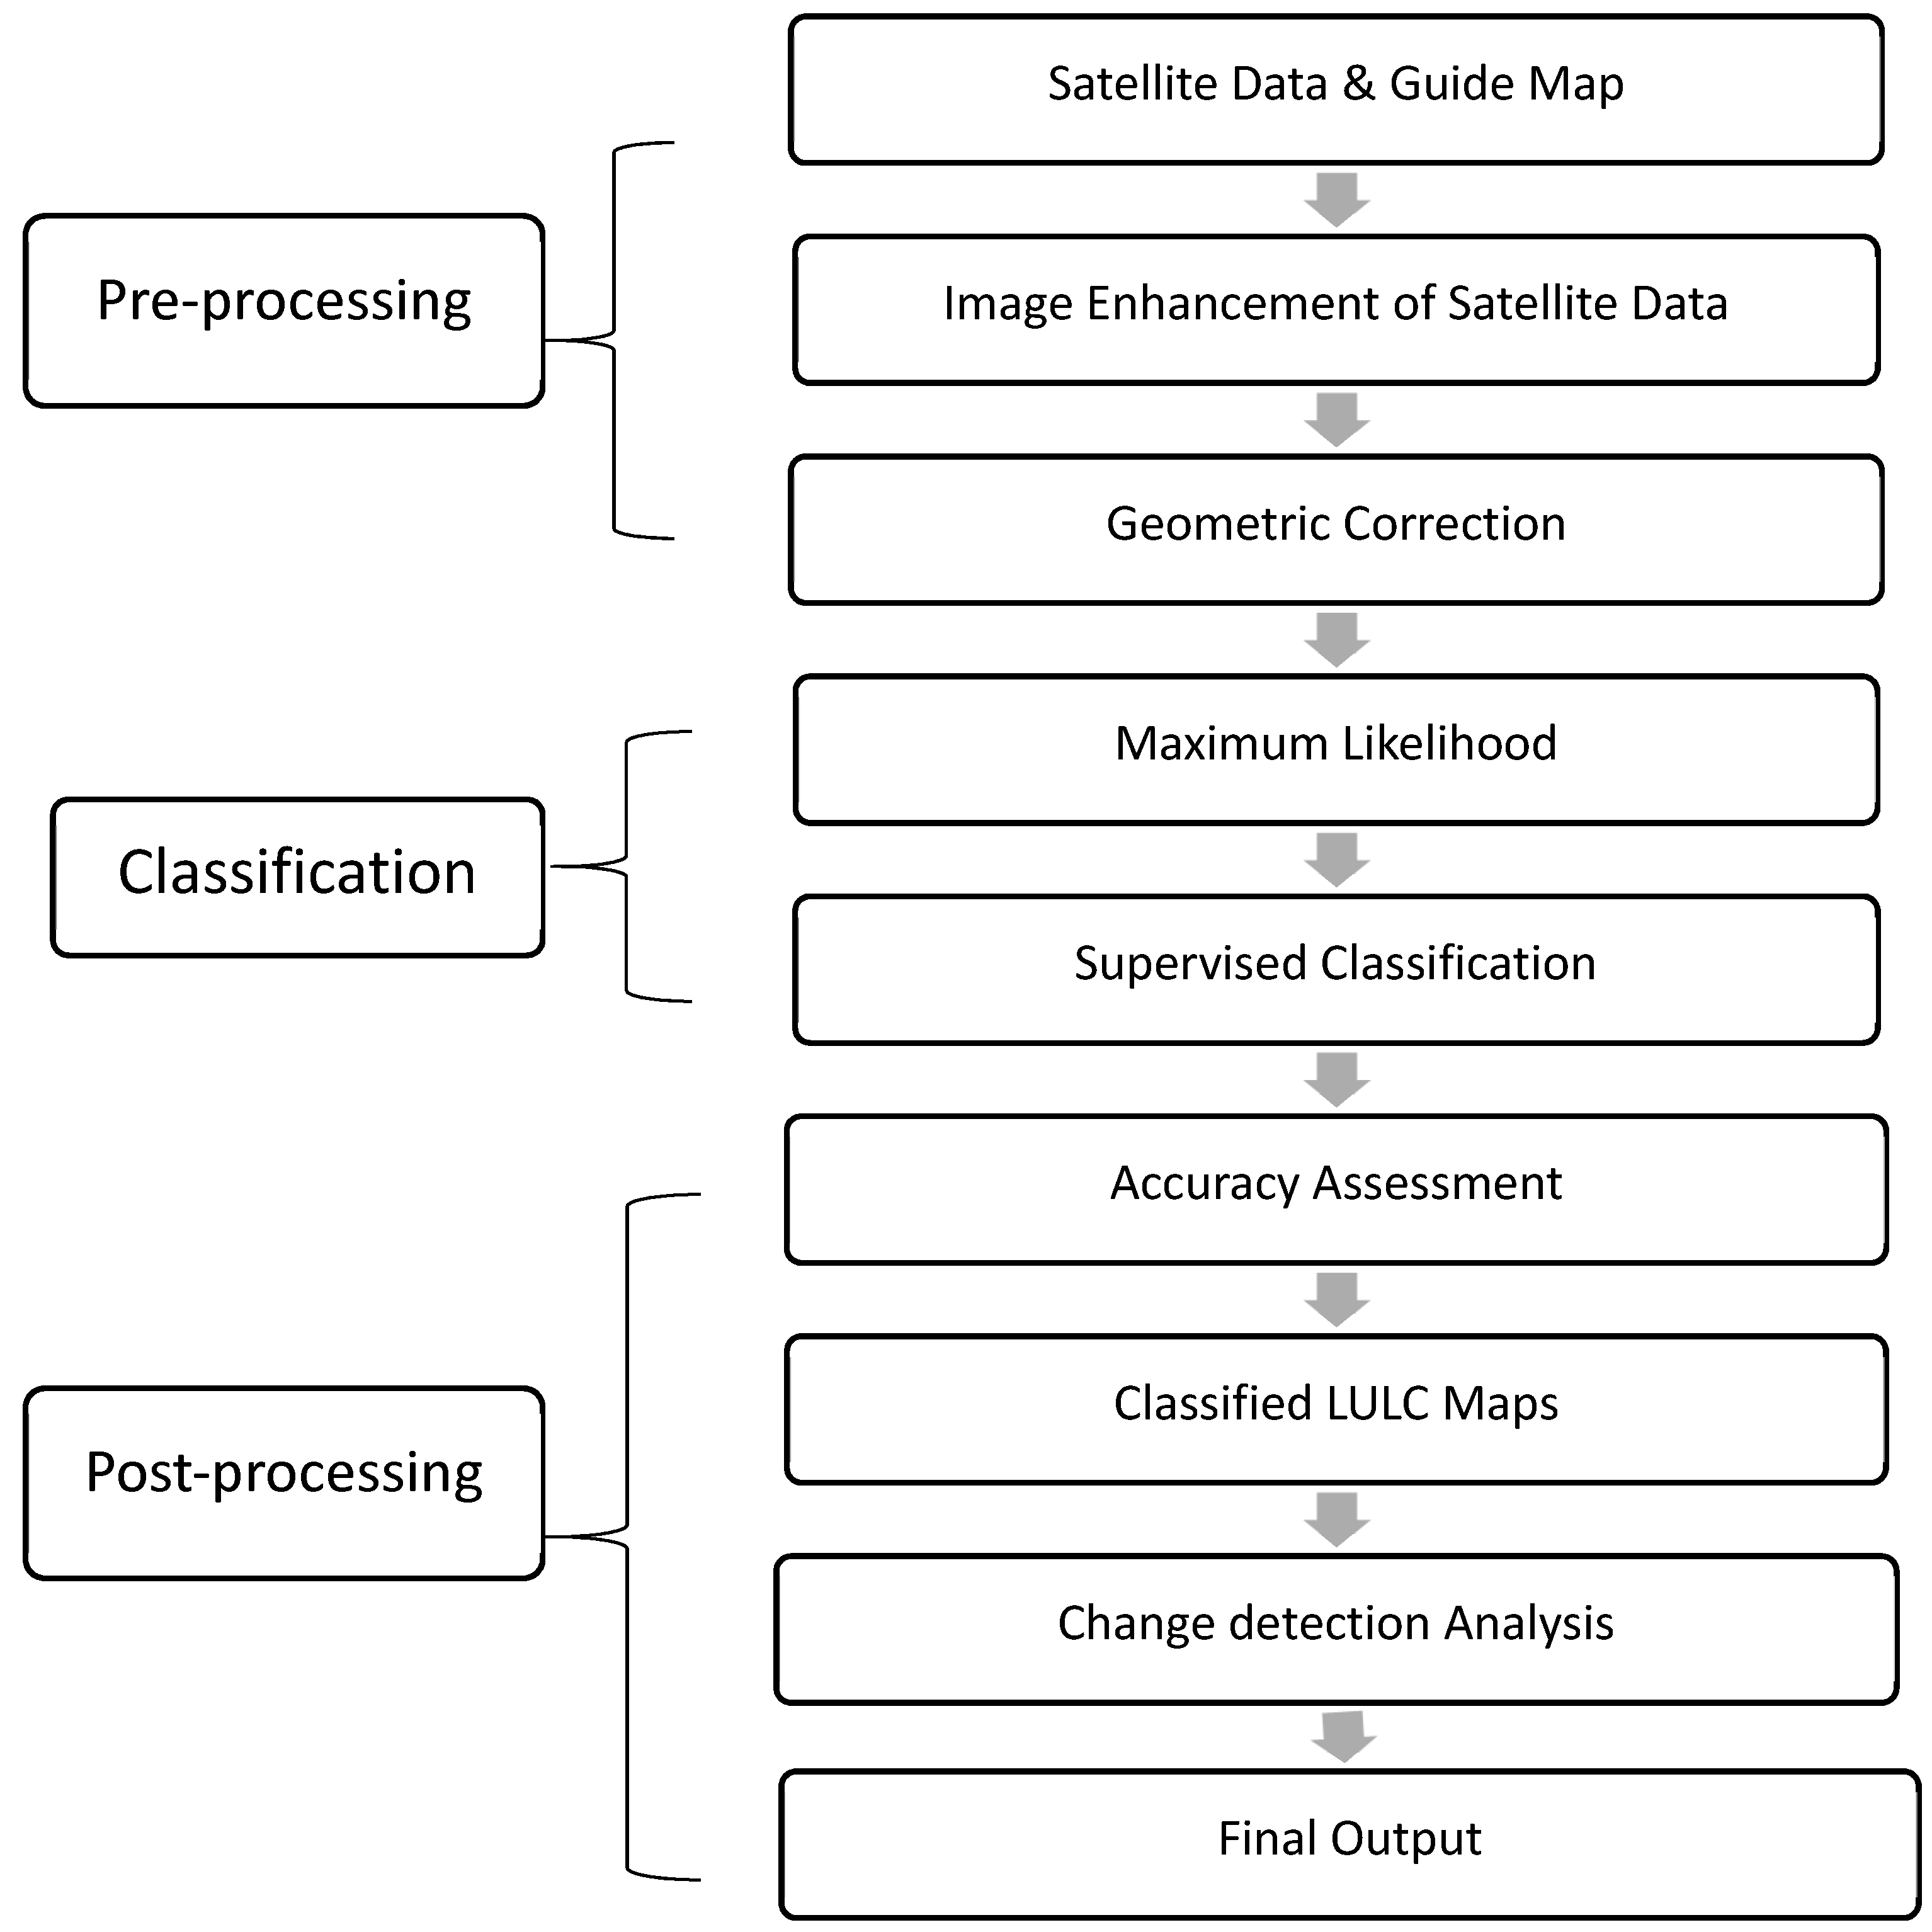
3. Materials and Methods
3.1. Data Acquisition
3.2. Image Processing
3.3. Supervised Classification
3.4. Post-Processing
3.5. LULC Change Detection and Analysis
3.6. Procedure for Estimating Changes to Future Urban Area
4. Results
4.1. Accuracy Assessment
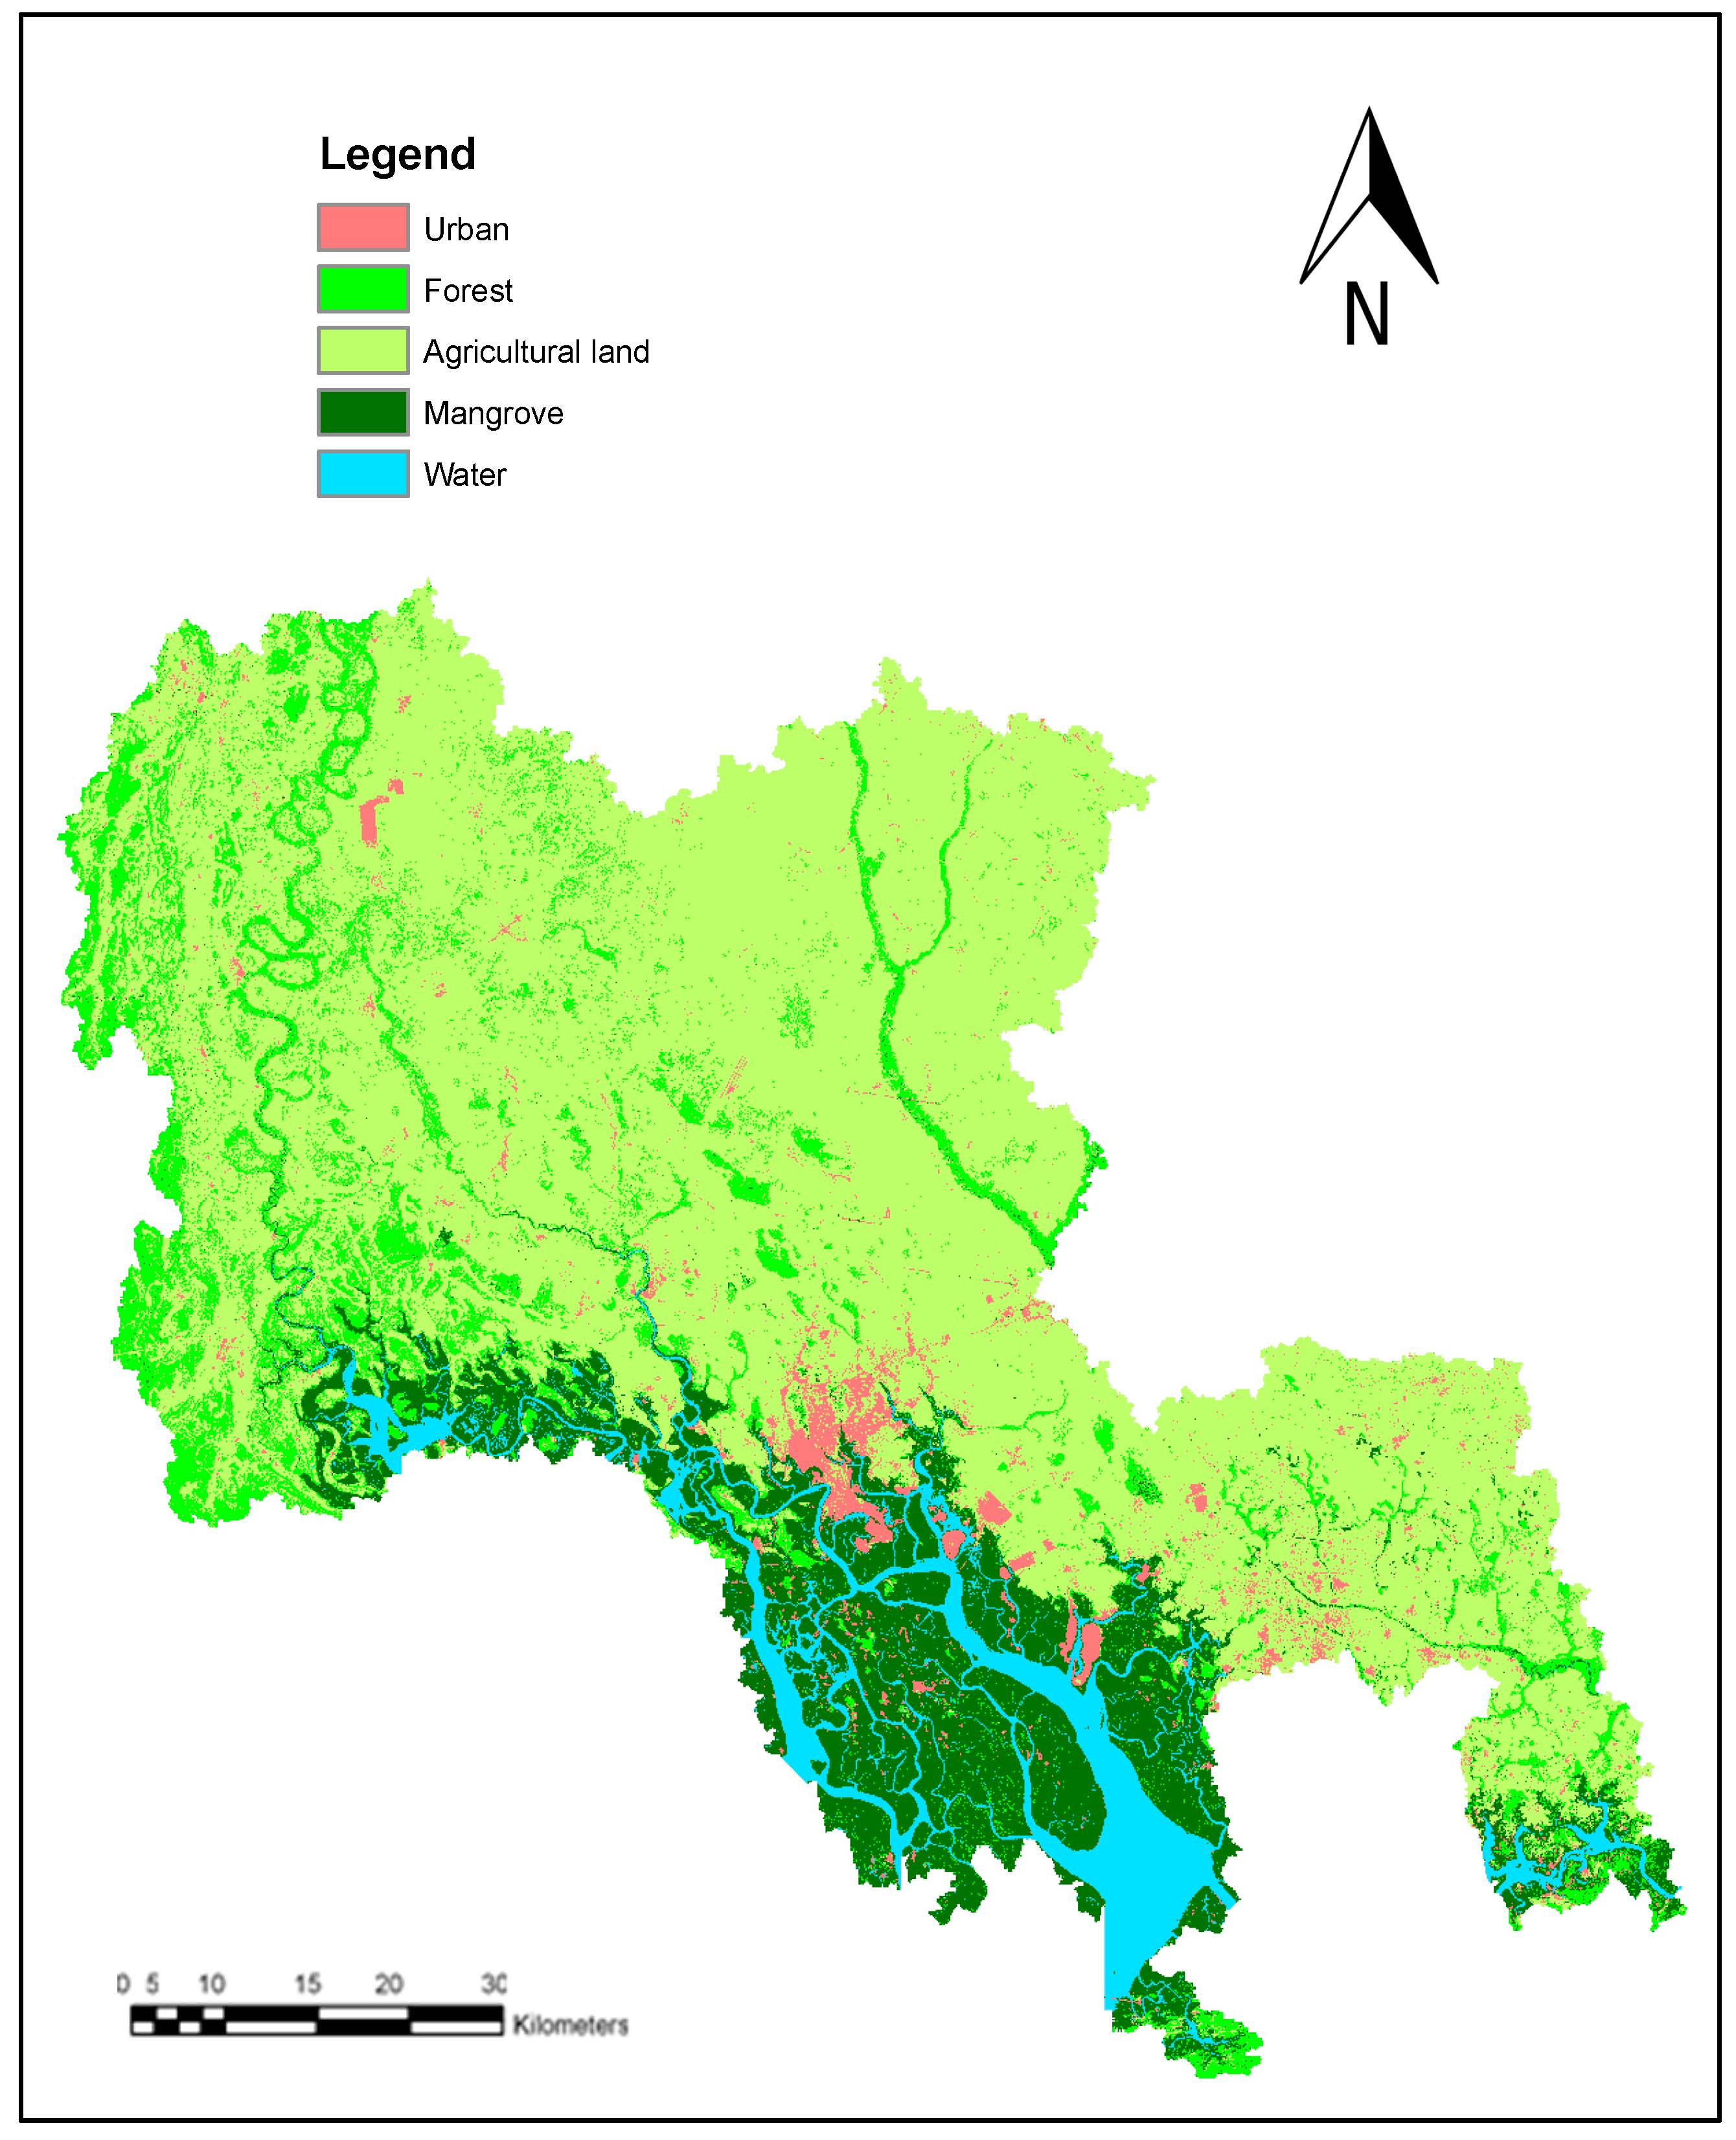
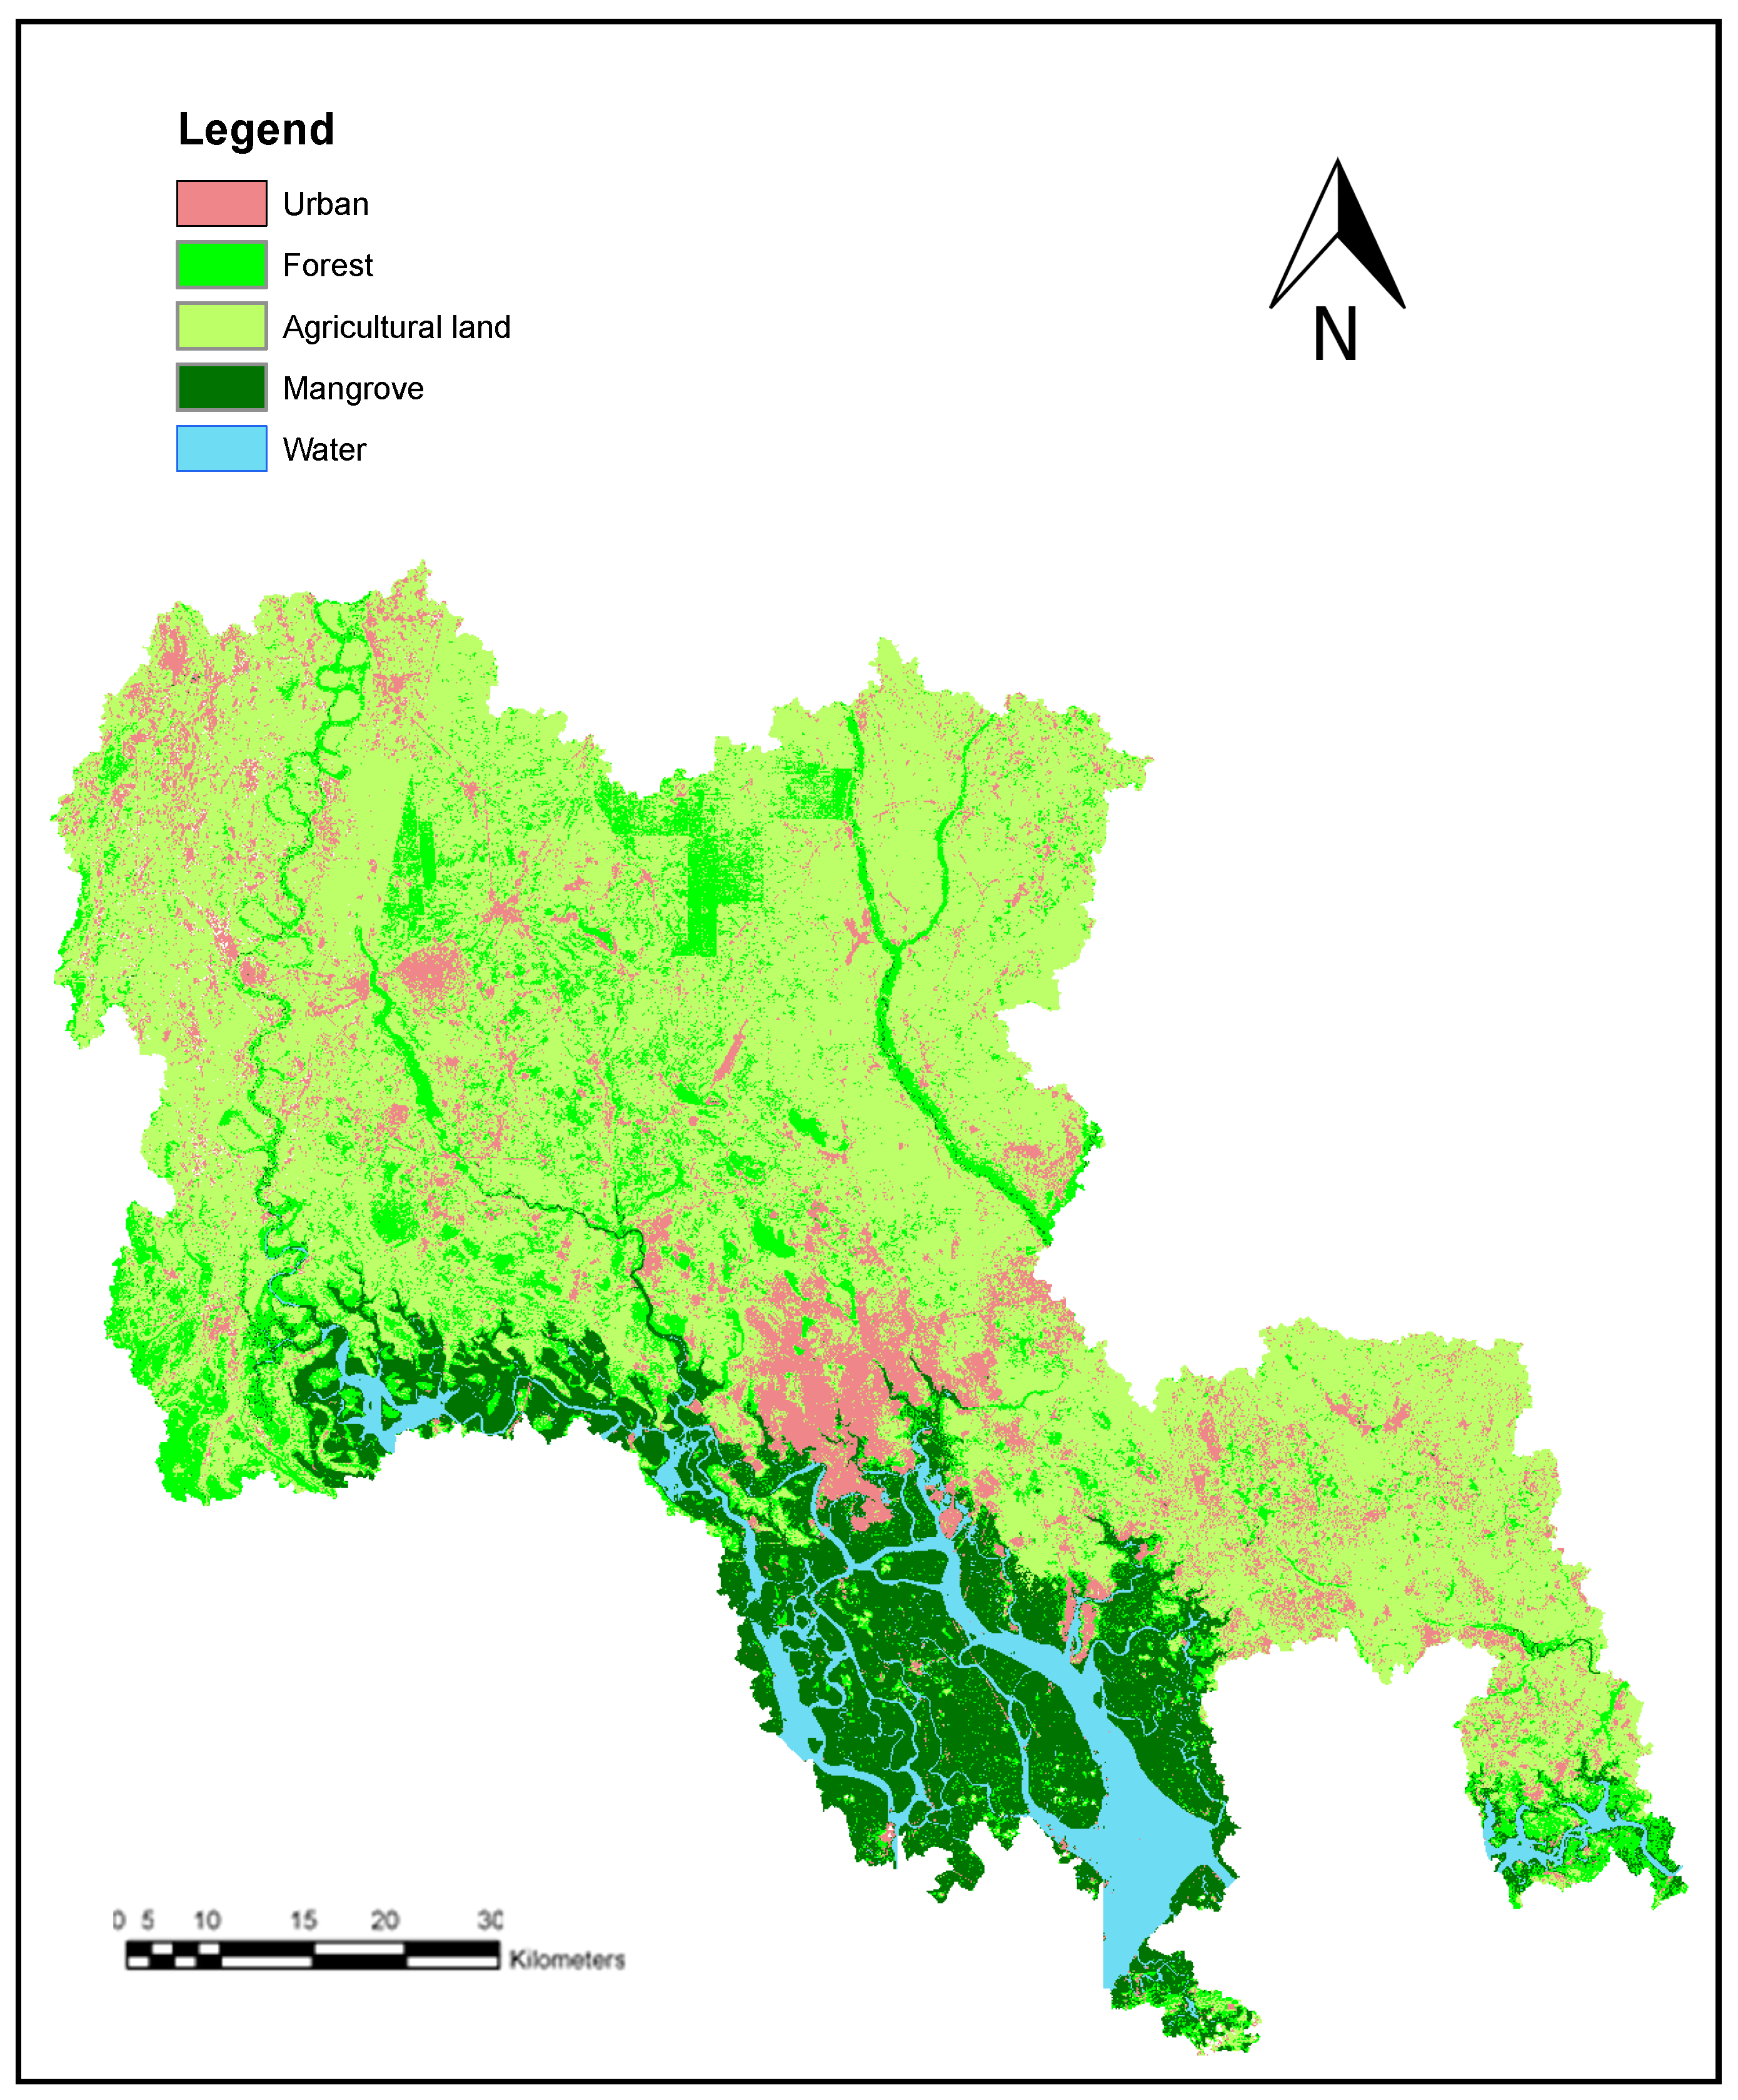
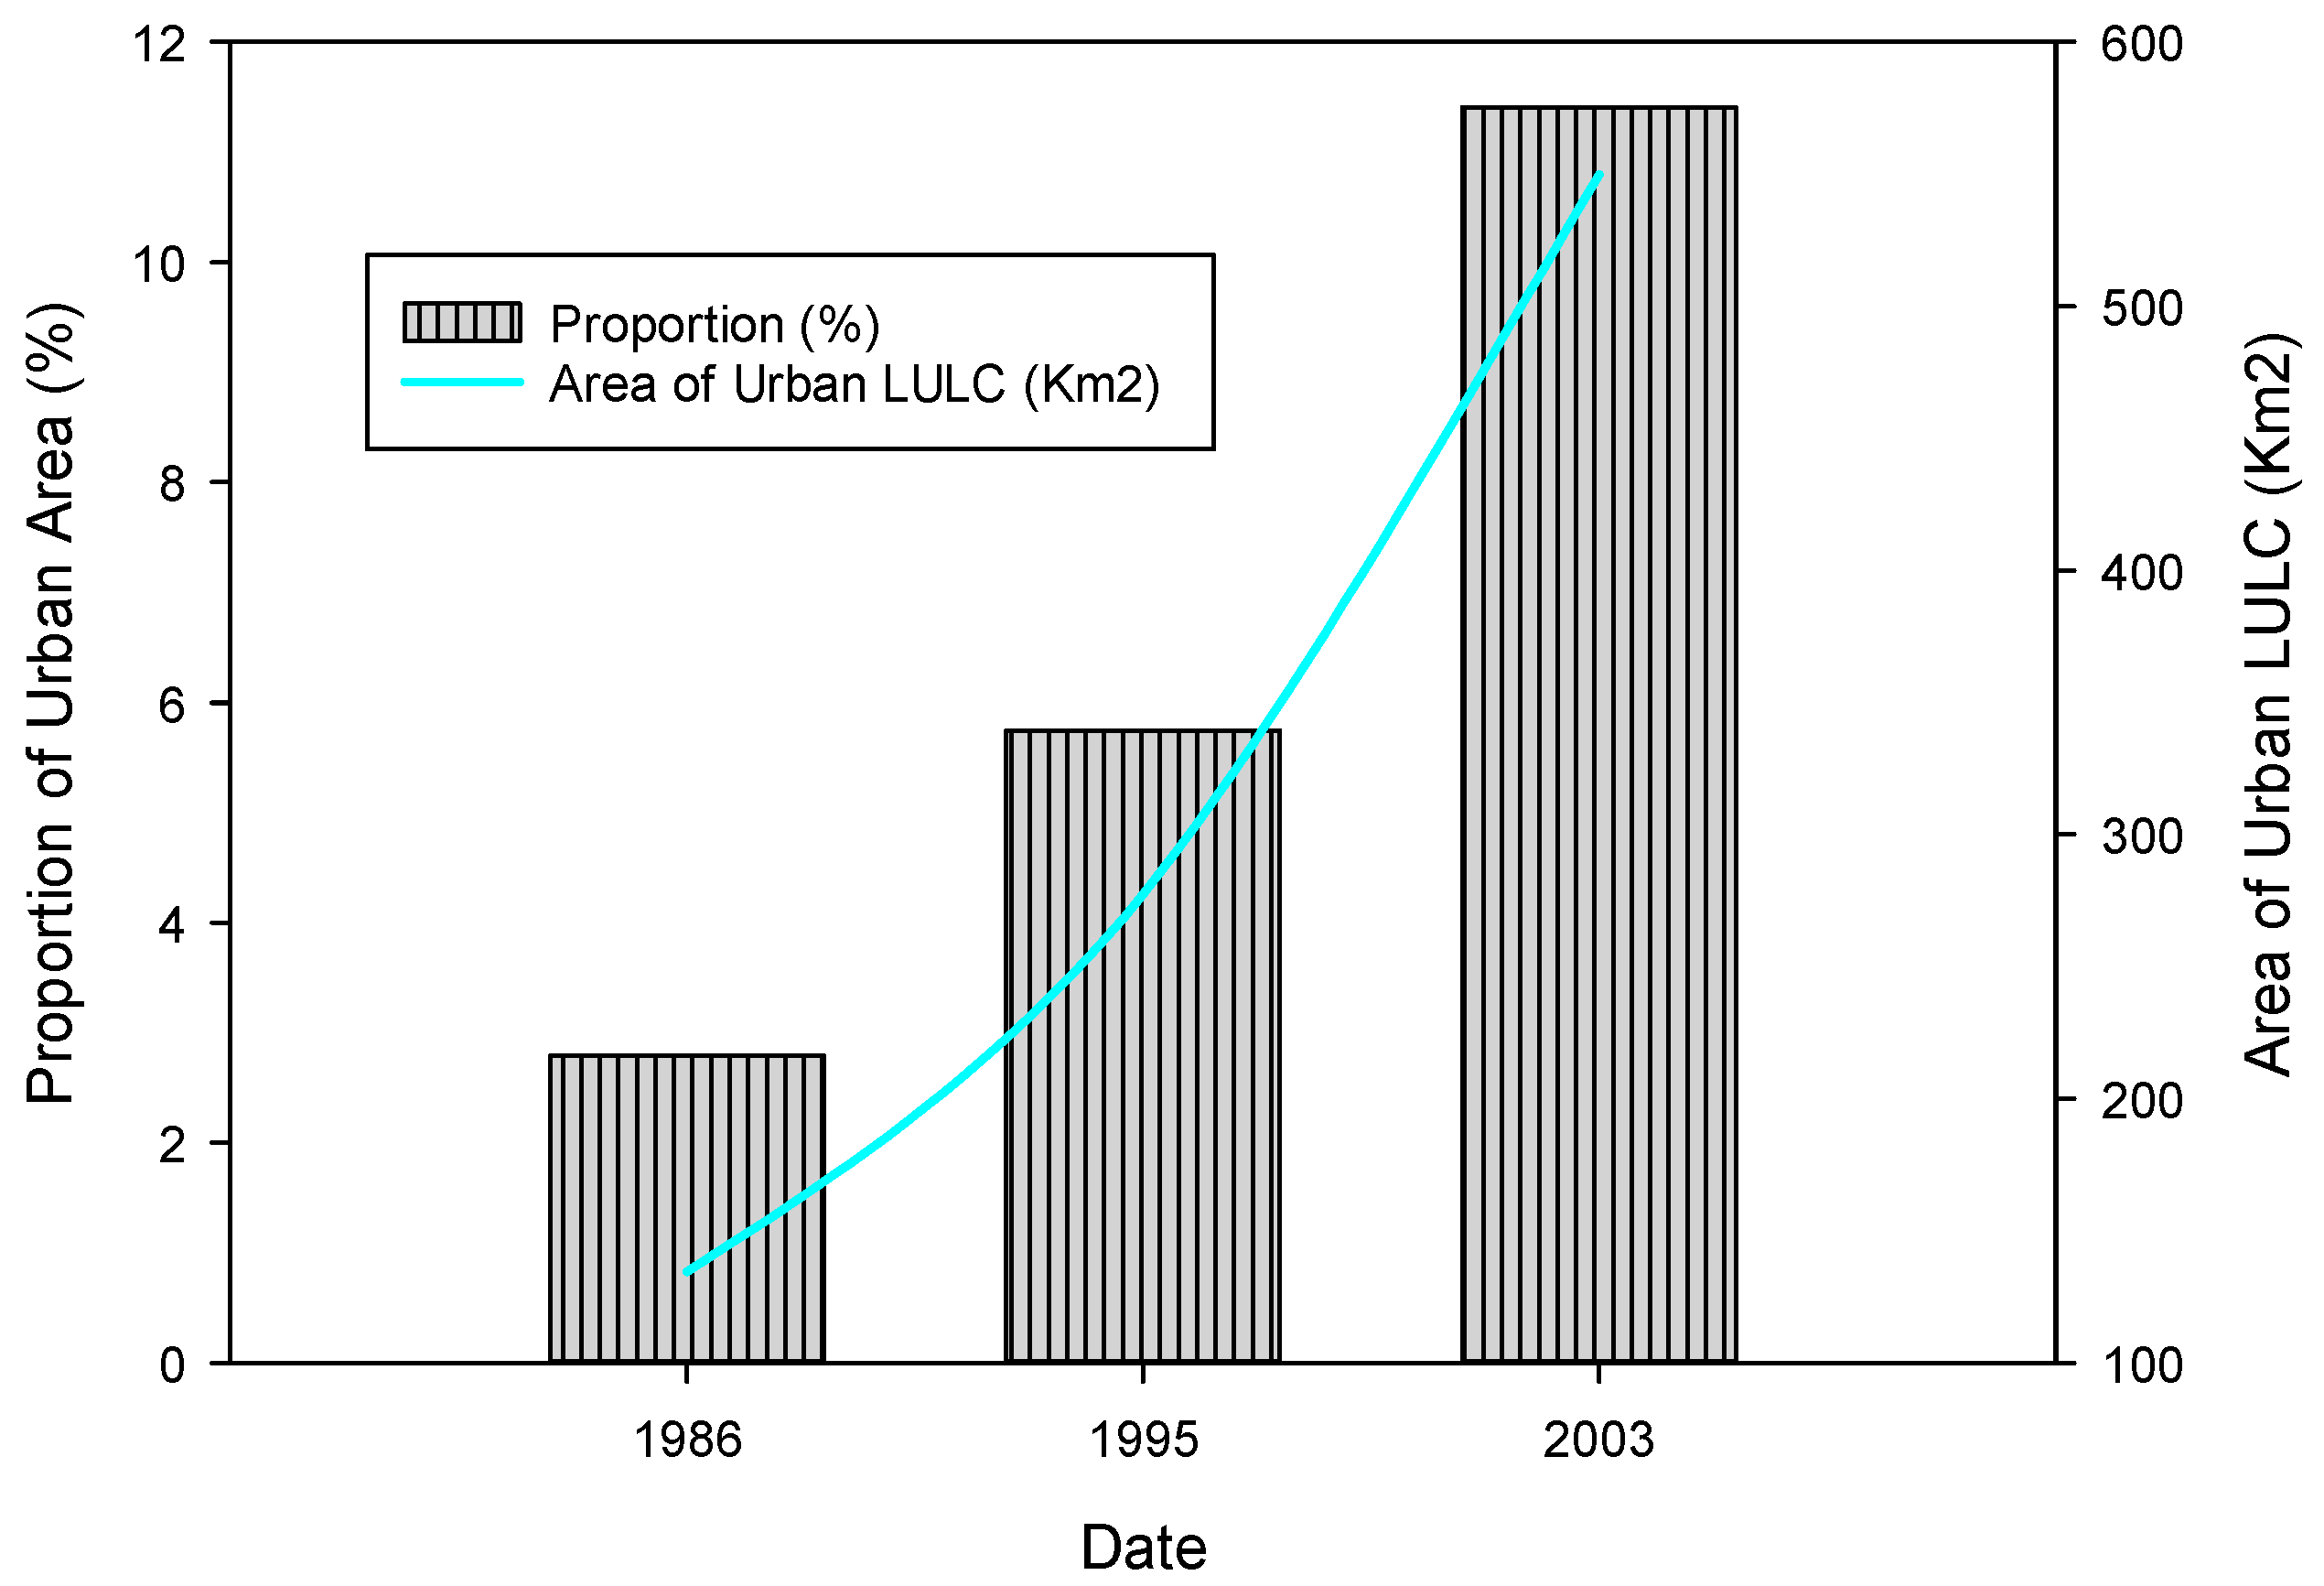
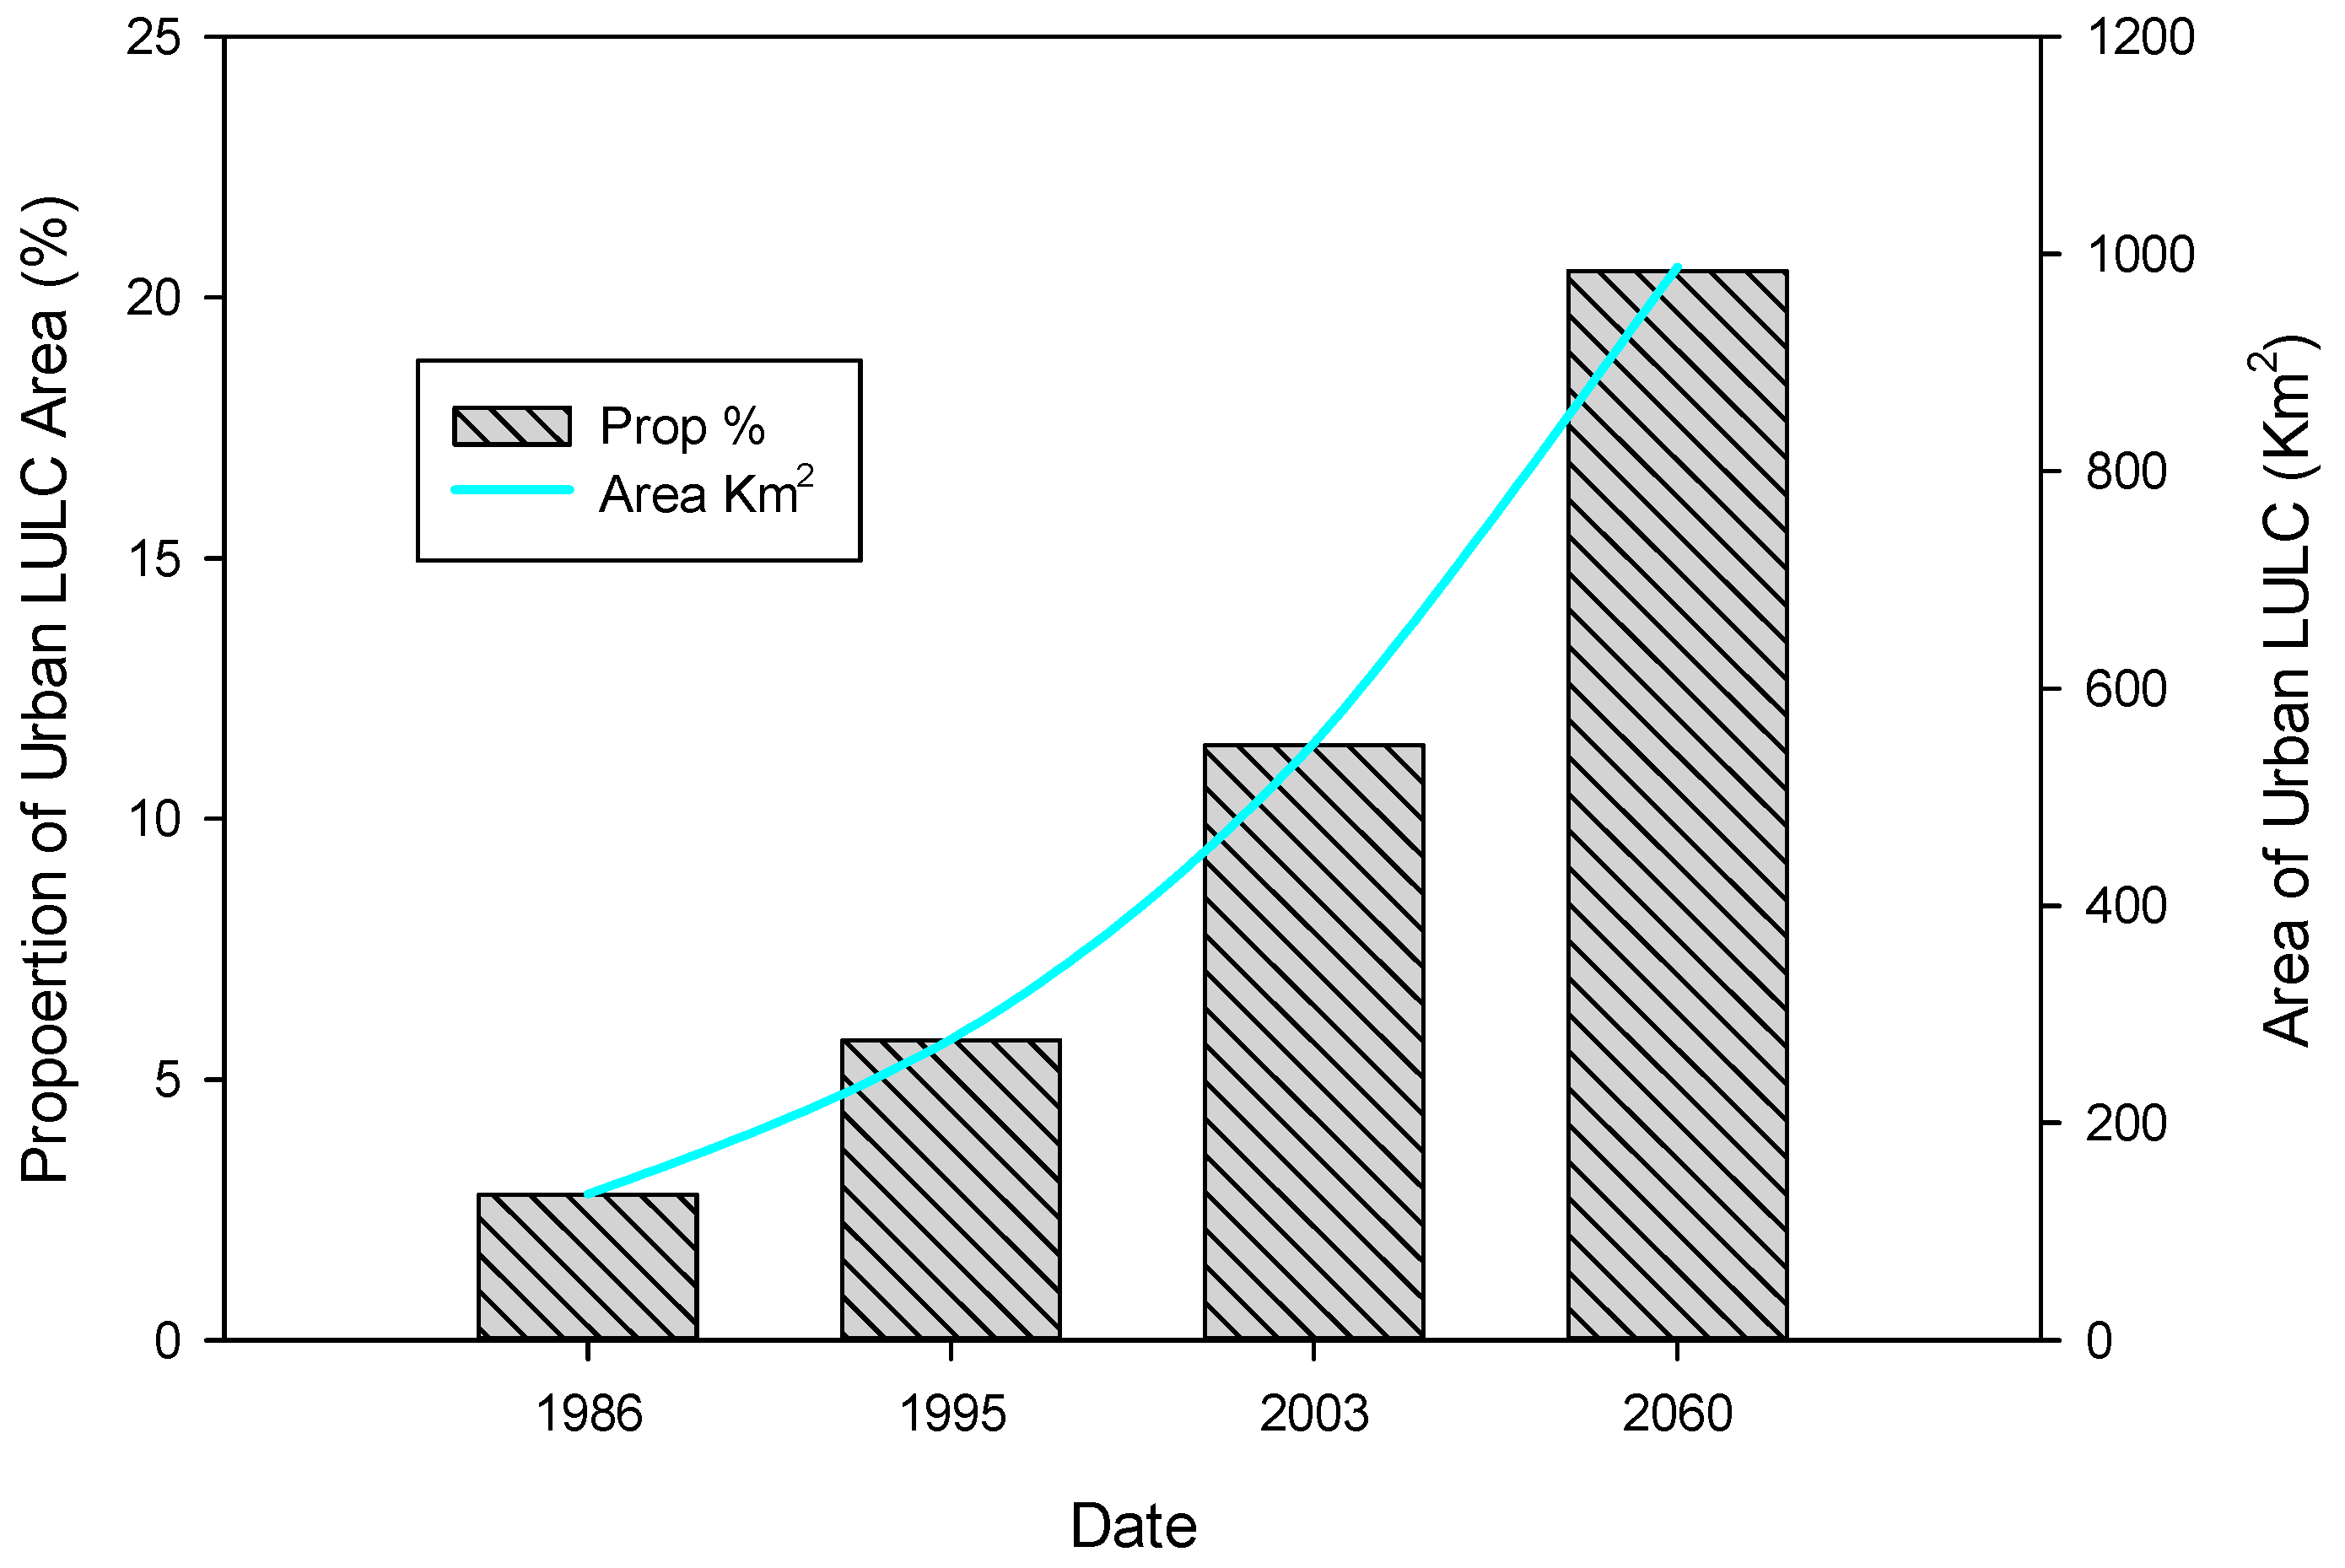
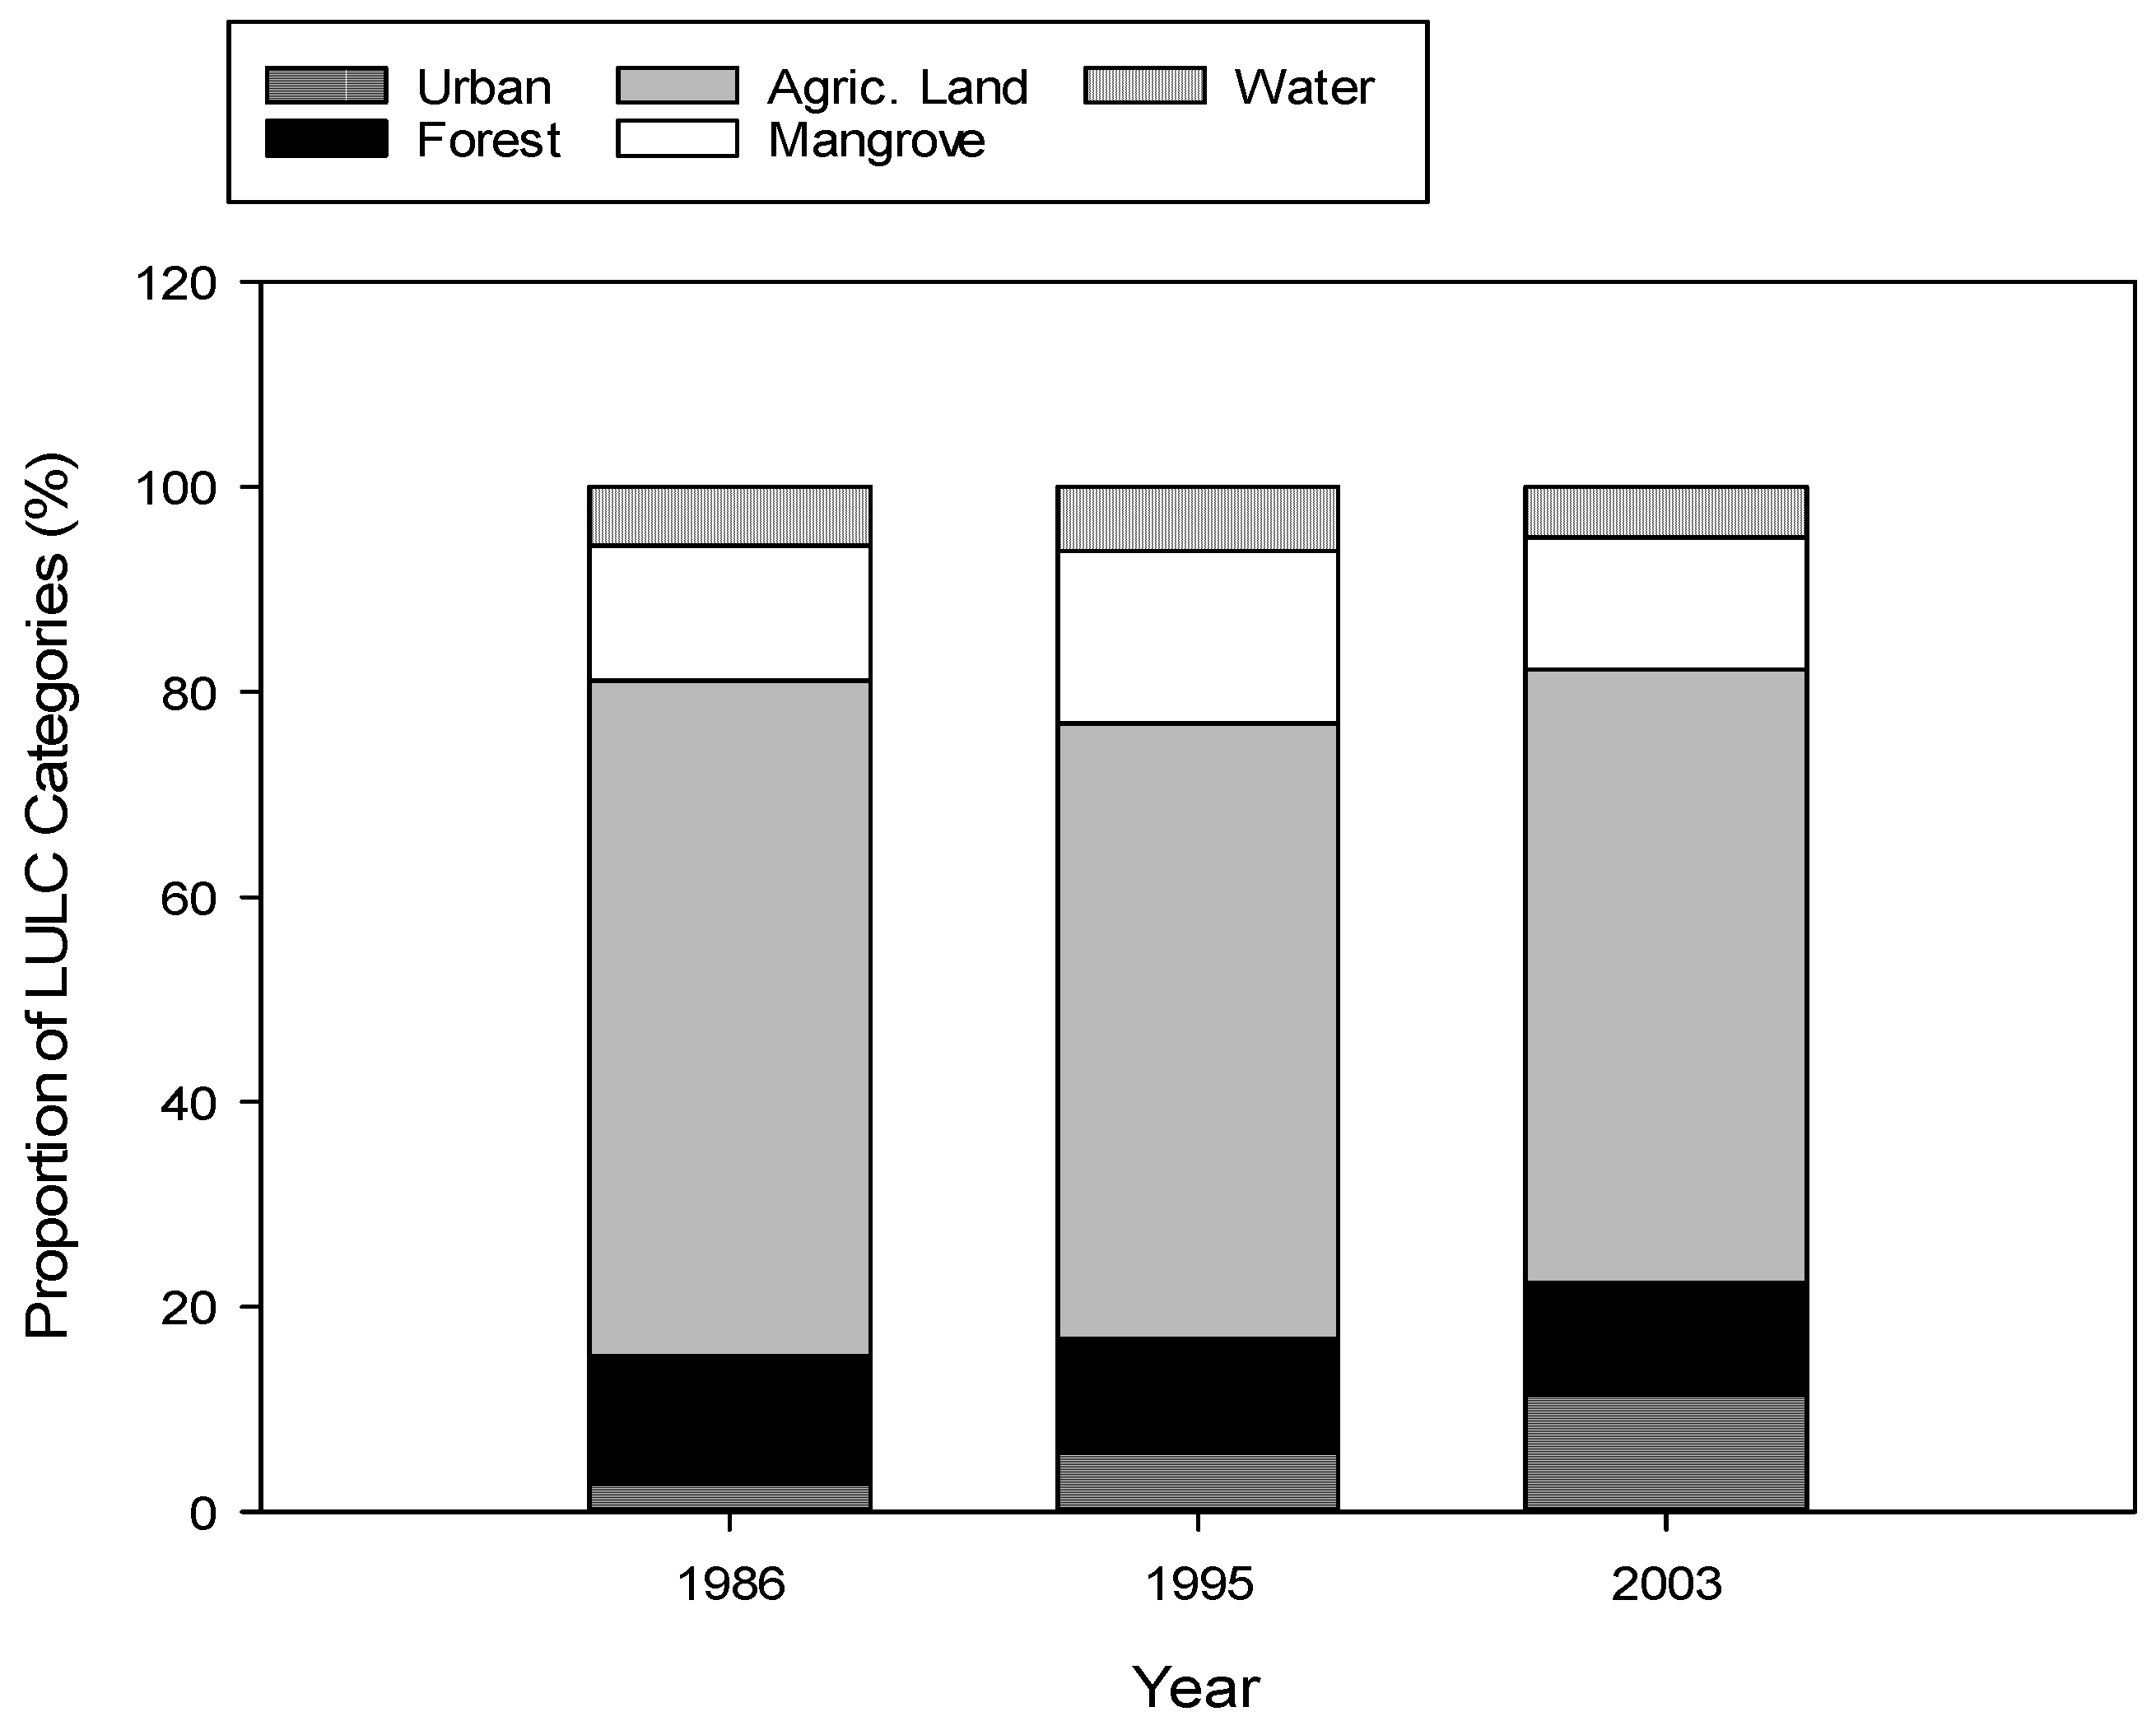
4.2. Extent of Historical Urban LULC Change
4.3. Estimated Extent of Urban LULC Change by 2060
4.4. Comparison of the Extent of Urban and Non-Urban Change Categories
4.5. Analysis of the Nature of Historical Changes.
4.5.1. Urban Transitions
4.5.2. Non-Urban Transitions
4.6. Analysis of Landscape Persistence and Components of Change
4.7. Inter-Category Net and Swap Change and Gain-to-Persistence Ratio
5. Discussion
5.1. What Was the Extent of Historical LULC Changes
5.2. What Is the Extent of Future Urban LULC Changes Due to the Implementation of the Plan by 2060?
5.3. What Was the Nature of Historical LULC Changes?
5.4. What Are the Dominant Forces and Tendencies of Land-Use Change?
5.5. Does the Application of the Multisource Data Affect Result Accuracy?
6. Conclusions
Author Contributions
Funding
Acknowledgments
Conflicts of Interest
References
- Wheater, H.; Evans, E. Land use, water management and future flood risk. Land Use Policy 2009, 26 (Suppl. 1), S251–S264. [Google Scholar] [CrossRef]
- Jha, A.K.; Bloch, R.; Lamond, J. Cities and Flooding: A Guide to Integrated Urban Flood Risk Management for the 21st Century; World Bank Publications: Washington, DC, USA, 2012. [Google Scholar]
- Miller, J.D.; Kim, H.; Kjeldsen, T.R.; Packman, J.; Grebby, S.; Dearden, R. Assessing the impact of urbanization on storm runoff in a peri-urban catchment using historical change in impervious cover. J. Hydrol. 2014, 515, 59–70. [Google Scholar] [CrossRef] [Green Version]
- Seto, K.C.; Fragkias, M.; Güneralp, B.; Reilly, M.K. A meta-analysis of global urban land expansion. PLoS ONE 2011, 6, e23777. [Google Scholar] [CrossRef] [PubMed]
- Savini, J.; Kammerer, J.C. Urban Growth and the Water Regimen; US Govt. Print. Off.: Arlington, VA, USA, 1961. [Google Scholar]
- Davis, K. The urbanization of the human population. Sci. Am. 1965, 213, 40–53. [Google Scholar] [CrossRef]
- UN. World Urbanization Prospects 2014: Highlights; United Nations Publications: New York, NY, USA, 2014. [Google Scholar]
- UNFCCC. Climate Change: Impacts, Vulnerabilities and Adaptation in Developing Countries; Climate Change Secretariat (UNFCCC): Bonn, Germany, 2007. [Google Scholar]
- Osti, R.; Tanaka, S.; Tokioka, T. Flood hazard mapping in developing countries: Problems and prospects. Disaster Prev. Manag. Int. J. 2008, 17, 104–113. [Google Scholar] [CrossRef]
- Li, W.; Xie, Y.; Hao, F. Applying an improved rapid impact assessment matrix method to strategic environmental assessment of urban planning in China. Environ. Impact Assess. Rev. 2014, 46, 13–24. [Google Scholar] [CrossRef]
- Abam, T.K.S. Regional Hydrological Research Perspectives in the Niger Delta. Hydrol. Sci. J. 2001, 46, 13–25. [Google Scholar] [CrossRef]
- Wolpe, H. Urban politics in Nigeria: A study of Port Harcourt; University of California Press: Berkeley, CA, USA, 1974. [Google Scholar]
- Izeogu, C.V. Urban development and the environment in Port Harcourt. Environ. Urban. 1989, 1, 59–68. [Google Scholar] [CrossRef]
- Verml. Greater Port-Harcourt City Phase 1A Development Environmental Impact Assessment; Greater Port-Harcourt City Development Authourity: Port Harcourt, Nigeria, 2009.
- Theis, M.; Lloyd-Jones, T.; Adenekan, S.; Gusah, S.; Moor, M.; Mulyawan, B.; Gusah, D. Port Harcourt Waterfront Urban Regeneration: Scoping Study. Project Report; 1905632061; MLC Press, University of Westminister: London, UK, 2009. [Google Scholar]
- Cookey-Gam, A. An Overview of the Greater Port Harcourt City Master Plan and Opportunities in Building a World Class City over the Next 20 Years; Greater Portharcourt Development Authority: Portharcourt, Nigeria, 2010. [Google Scholar]
- Zanganeh Shahraki, S.; Sauri, D.; Serra, P.; Modugno, S.; Seifolddini, F.; Pourahmad, A. Urban sprawl pattern and land-use change detection in Yazd, Iran. Habitat Int. 2011, 35, 521–528. [Google Scholar] [CrossRef]
- Tripathi, R.; Sengupta, S.K.; Patra, A.; Chang, H.; Jung, I.W. Climate change, urban development, and community perception of an extreme flood: A case study of Vernonia, Oregon, USA. Appl. Geogr. 2014, 46, 137–146. [Google Scholar] [CrossRef]
- Hegazy, I.R.; Kaloop, M.R. Monitoring urban growth and land use change detection with GIS and remote sensing techniques in Daqahlia governorate Egypt. Int. J. Sustain. Built Environ. 2015, 4, 117–124. [Google Scholar] [CrossRef]
- Du, J.; Qian, L.; Rui, H.; Zuo, T.; Zheng, D.; Xu, Y.; Xu, C.Y. Assessing the effects of urbanization on annual runoff and flood events using an integrated hydrological modeling system for Qinhuai River basin, China. J. Hydrol. 2012, 464–465, 127–139. [Google Scholar] [CrossRef]
- Chen, Y.; Zhou, H.; Zhang, H.; Du, G.; Zhou, J. Urban flood risk warning under rapid urbanization. Environ. Res. 2015, 139, 3–10. [Google Scholar] [CrossRef] [PubMed]
- Ali, M.; Khan, S.J.; Aslam, I.; Khan, Z. Simulation of the impacts of land-use change on surface runoff of Lai Nullah Basin in Islamabad, Pakistan. Landsc. Urban Plan. 2011, 102, 271–279. [Google Scholar] [CrossRef]
- Suriya, S.; Mudgal, B.V. Impact of urbanization on flooding: The Thirusoolam sub watershed—A case study. J. Hydrol. 2012, 412–413, 210–219. [Google Scholar] [CrossRef]
- Knebl, M.R.; Yang, Z.L.; Hutchison, K.; Maidment, D.R. Regional scale flood modeling using NEXRAD rainfall, GIS, and HEC-HMS/RAS: A case study for the San Antonio River Basin Summer 2002 storm event. J. Environ. Manag. 2005, 75, 325–336. [Google Scholar] [CrossRef] [PubMed]
- McColl, C.; Aggett, G. Land-use forecasting and hydrologic model integration for improved land-use decision support. J. Environ. Manag. 2007, 84, 494–512. [Google Scholar] [CrossRef] [PubMed]
- Duan, M.; Zhang, J.; Liu, Z.; Aekakkararungroj, A. Use of remote sensing and GIS for flood hazard mapping in Chiang Mai Province, northern Thailand. In Proceedings of the International Conference on Geospatial Solutions for Emergency Management and the 50th Anniversary of the Chinese Academy of Surveying and Mapping, Beijing, China, 14–16 September 2009; pp. 14–16. [Google Scholar]
- Yang, X.T.; Liu, H.; Gao, X. Land cover changed object detection in remote sensing data with medium spatial resolution. Int. J. Appl. Earth Obs. Geoinform. 2015, 38, 129–137. [Google Scholar] [CrossRef]
- Oni, S.K.; Futter, M.N.; Buttle, J.; Dillon, P.J. Hydrological footprints of urban developments in the Lake Simcoe watershed, Canada: A combined paired-catchment and change detection modelling approach. Hydrol. Process. 2015, 29, 1829–1843. [Google Scholar] [CrossRef]
- Deng, J.S.; Wang, K.; Hong, Y.; Qi, J.G. Spatio-temporal dynamics and evolution of land use change and landscape pattern in response to rapid urbanization. Landsc. Urban Plan. 2009, 92, 187–198. [Google Scholar] [CrossRef]
- Al Kuwari, N.Y.; Kaiser, M.F. Impact of North Gas Field development on landuse/landcover changes at Al Khore, North Qatar, using remote sensing and GIS. Appl. Geogr. 2011, 31, 1144–1153. [Google Scholar] [CrossRef]
- Abd El-Kawy, O.R.; Rød, J.K.; Ismail, H.A.; Suliman, A.S. Land use and land cover change detection in the western Nile delta of Egypt using remote sensing data. Appl. Geogr. 2011, 31, 483–494. [Google Scholar] [CrossRef]
- Lunetta, R.S.; Knight, J.F.; Ediriwickrema, J.; Lyon, J.G.; Worthy, L.D. Land-cover change detection using multi-temporal MODIS NDVI data. Remote Sens. Environ. 2006, 105, 142–154. [Google Scholar] [CrossRef]
- Lu, D.; Mausel, P.; Brondízio, E.; Moran, E. Change detection techniques. Int. J. Remote Sens. 2004, 25, 2365–2401. [Google Scholar] [CrossRef]
- Singh, A. Review Article Digital change detection techniques using remotely-sensed data. Int. J. Remote Sens. 1989, 10, 989–1003. [Google Scholar] [CrossRef] [Green Version]
- Peiman, R. Pre-classification and post-classification change-detection techniques to monitor land-cover and land-use change using multi-temporal Landsat imagery: A case study on Pisa Province in Italy. Int. J. Remote Sens. 2011, 32, 4365–4381. [Google Scholar] [CrossRef]
- Pontius, R.G.; Shusas, E.; McEachern, M. Detecting important categorical land changes while accounting for persistence. Agric. Ecosyst. Environ. 2004, 101, 251–268. [Google Scholar] [CrossRef]
- Mmom, P.C.; Fred-Nwagwu, F.W. Analysis of Landuse and Landcover Change around the City of Port Harcourt, Nigeria. Glob. Adv. Res. J. 2013, 2, 76–86. [Google Scholar]
- Ikechukwu, E.E. The Socio-Economic Impact of the Greater Port Harcourt Development Project on the Residents of the Affected Areas. Open J. Soc. Sci. 2015, 3, 82–93. [Google Scholar] [CrossRef]
- Demographia. Demographia World Urban Areas; Demographia: Paris, France, 2017. [Google Scholar]
- NDDC. Niger Delta Regional Development Master Plan; Niger Delta Development Commission: Port Harcourt, Nigeria, 2006. [Google Scholar]
- Omole, F.K.; Akinbamijo, O.B. Land development and planning laws in Nigeria: The historical account. J. Law Policy Glob. 2012, 8, 25. [Google Scholar]
- Lamond, J.; Awuah, K.B.; Lewis, E.; Bloch, R.; Falade, J.B. Urban Land, Planning and Governance Systems in Nigeria; Project Report; ICF International: London, UK, 2015. [Google Scholar]
- Aribigbola, A. Imroving urban land use planning and management in Nigeria: The case of Akure. Cercet. Pr. Și Teor. În Manag. Urban 2008, 3, 1–14. [Google Scholar]
- Ede, P.N.; Owei, O.B.; Akarolo, C.I. Does the Greater Port Harcourt Master Plan 2008 meet Aspirations for Liveable City. In Proceedings of the ISOCARP Congress 2011 Liveable Cities-Urbanising World, Meeting the Challenge, Wuhan, China, 25–28 October 2011; p. 12. [Google Scholar]
- Nagi, R. Classifying Landsat Image Services to Make a Land Cover Map. Available online: http://blogs.esri.com/esri/arcgis/2011/05/28/classifying-landsat-image-services-to-make-a-land-cover-map/ (accessed on 6 September 2015).
- Richards, J.A.; Richards, J. Remote Sensing Digital Image Analysis; Springer: Berlin/Heidelberg, Germany, 1999; Volume 3. [Google Scholar]
- Kafi, K.; Shafri, H.; Shariff, A. An analysis of LULC change detection using remotely sensed data; A Case study of Bauchi City. In Proceedings of the IOP Conference Series: Earth and Environmental Science, Beijing, China, 22–26 April 2013; p. 012056. [Google Scholar]
- Enaruvbe, G.O.; Ige-Olumide, O. Geospatial analysis of land-use change processes in a densely populated coastal city: The case of Port Harcourt, south-east Nigeria. Geocarto Int. 2014, 30, 441–456. [Google Scholar] [CrossRef]
- Viera, A.J.; Garrett, J.M. Understanding interobserver agreement: The kappa statistic. Fam. Med. 2005, 37, 360–363. [Google Scholar] [PubMed]
- Howarth, P.J.; Wickware, G.M. Procedures for change detection using Landsat digital data. Int. J. Remote Sens. 1981, 2, 277–291. [Google Scholar] [CrossRef]
- Shalaby, A.; Tateishi, R. Remote sensing and GIS for mapping and monitoring land cover and land-use changes in the Northwestern coastal zone of Egypt. Appl. Geogr. 2007, 27, 28–41. [Google Scholar] [CrossRef]
- Yuan, F.; Sawaya, K.E.; Loeffelholz, B.C.; Bauer, M.E. Land cover classification and change analysis of the Twin Cities (Minnesota) Metropolitan Area by multitemporal Landsat remote sensing. Remote Sens. Environ. 2005, 98, 317–328. [Google Scholar] [CrossRef]
- Chavez, P.S.; MacKinnon, D.J. Automatic detection of vegetation changes in the southwestern United States using remotely sensed images. Photogramm. Eng. Remote Sens. 1994, 60, 571–582. [Google Scholar]
- Allan, J.D. Landscapes and riverscapes: The influence of land use on stream ecosystems. Annu. Rev. Ecol. Evol. Syst. 2004, 35, 257–284. [Google Scholar] [CrossRef]
- Manandhar, R.; Odeh, I.O.A.; Pontius, R.G., Jr. Analysis of twenty years of categorical land transitions in the Lower Hunter of New South Wales, Australia. Agric. Ecosyst. Environ. 2010, 135, 336–346. [Google Scholar] [CrossRef]
- Leopold, L. Hydrology for urban planning. In US Geological Survey; Washington, DC, USA, 1968; Available online: http://eps.berkeley.edu/people/lunaleopold/ (accessed on 19 November 2018).
- Agaton, M.; Setiawan, Y.; Effendi, H. Land Use/Land Cover Change Detection in an Urban Watershed: A Case Study of Upper Citarum Watershed, West Java Province, Indonesia. Procedia Environ. Sci. 2016, 33, 654–660. [Google Scholar] [CrossRef]
- Butt, A.; Shabbir, R.; Ahmad, S.S.; Aziz, N. Land use change mapping and analysis using Remote Sensing and GIS: A case study of Simly watershed, Islamabad, Pakistan. Egypt. J. Remote Sens. Space Sci. 2015, 18, 251–259. [Google Scholar] [CrossRef] [Green Version]
- He, C.; Zhao, Y.; Huang, Q.; Zhang, Q.; Zhang, D. Alternative future analysis for assessing the potential impact of climate change on urban landscape dynamics. Sci. Total Environ. 2015, 532, 48–60. [Google Scholar] [CrossRef] [PubMed]
- Xiao, J.; Shen, Y.; Ge, J.; Tateishi, R.; Tang, C.; Liang, Y.; Huang, Z. Evaluating urban expansion and land use change in Shijiazhuang, China, by using GIS and remote sensing. Landsc. Urban Plan. 2006, 75, 69–80. [Google Scholar] [CrossRef]
- Quan, B.; Chen, J.-F.; Qiu, H.-L.; Römkens, M.J.M.; Yang, X.-Q.; Jiang, S.-F.; Li, B.-C. Spatial-temporal pattern and driving forces of land use changes in Xiamen. Pedosphere 2006, 16, 477–488. [Google Scholar] [CrossRef]
- Hersperger, A.; Bürgi, M. Driving forces of landscape change in the urbanizing Limmat valley, Switzerland. In Modelling Land-Use Change; Springer: Dordrecht, The Netherlands, 2007; pp. 45–60. [Google Scholar]
- Li, G.; Sun, S.; Fang, C. The varying driving forces of urban expansion in China: Insights from a spatial-temporal analysis. Landsc. Urban Plan. 2018, 174, 63–77. [Google Scholar] [CrossRef]
- Akukwe, T.I.; Ogbodo, C. Spatial Analysis of Vulnerability to Flooding in Port Harcourt Metropolis, Nigeria. SAGE Open 2015, 5. [Google Scholar] [CrossRef] [Green Version]
- Owei, O.B.; Obinna, V.C.; Ede, P.N. The Challenges of Sustainable Land Use Planning in Nigerian Cities. The Case of Port Harcourt. In Proceedings of the ISOCARP Congress, Nairobi, Kenya, 19–23 September 2010. [Google Scholar]
- Wizor, C.H. Residential Development Dynamics in Port Harcourt Metropolis: Implication for Efficient Urban Planning. J. Environ. Earth Sci. 2014, 4, 78–85. [Google Scholar]
- UNDESA. World Urbanization Prospects: The 2014 Revision. United Nations, Department of Economic and Social Affairs; Population Division: New York, NY, USA, 2015. [Google Scholar]
- Obafemi, A.A.; Odubo, T.V. Waterfronts Redevelopments in Port Harcourt Metropolis: Issues and Socio-Economic Implications for Urban Environmental Management. Int. J. Eng. Sci. 2013, 2, 1–14. [Google Scholar]
- Sudhira, H.S.; Ramachandra, T.V.; Jagadish, K.S. Urban sprawl: Metrics, dynamics and modelling using GIS. Int. J. Appl. Earth Obs. Geoinform. 2004, 5, 29–39. [Google Scholar] [CrossRef]
- Abbas, H.B.; Routray, J.K. Assessing factors affecting flood-induced public health risks in Kassala State of Sudan. Oper. Res. Health Care 2014, 3, 215–225. [Google Scholar] [CrossRef]
- Wu, K.-Y.; Ye, X.-Y.; Qi, Z.-F.; Zhang, H. Impacts of land use/land cover change and socioeconomic development on regional ecosystem services: The case of fast-growing Hangzhou metropolitan area, China. Cities 2013, 31, 276–284. [Google Scholar] [CrossRef]
- Liang, J.; Zhong, M.; Zeng, G.; Chen, G.; Hua, S.; Li, X.; Yuan, Y.; Wu, H.; Gao, X. Risk management for optimal land use planning integrating ecosystem services values: A case study in Changsha, Middle China. Sci. Total Environ. 2017, 579, 1675–1682. [Google Scholar] [CrossRef] [PubMed]
- Cobbinah, P.B.; Erdiaw-Kwasie, M.O.; Amoateng, P. Africa’s urbanisation: Implications for sustainable development. Cities 2015, 47, 62–72. [Google Scholar] [CrossRef]
- Ozdemir, H.; Sampson, C.; de Almeida, G.A.; Bates, P. Evaluating scale and roughness effects in urban flood modelling using terrestrial LIDAR data. Hydrol. Earth Syst. Sci. 2013, 10, 5903–5942. [Google Scholar] [CrossRef]
- Mwangi, H.M.; Julich, S.; Patil, S.D.; McDonald, M.A.; Feger, K.H. Modelling the impact of agroforestry on hydrology of Mara River Basin in East Africa. Hydrol. Process. 2016, 30, 3139–3155. [Google Scholar] [CrossRef]
- Bathurst, J.C.; Iroumé, A.; Cisneros, F.; Fallas, J.; Iturraspe, R.; Novillo, M.G.; Urciuolo, A.; de Bièvre, B.; Borges, V.G.; Coello, C.; et al. Forest impact on floods due to extreme rainfall and snowmelt in four Latin American environments 1: Field data analysis. J. Hydrol. 2011, 400, 281–291. [Google Scholar] [CrossRef]


| Year | Path/Row | Sensor | Satellite | Original Bands Numbers | Pixel Resolution | Spectral Range | Map Band Combination |
|---|---|---|---|---|---|---|---|
| 1986 | 188/056 188/057 189/056 189/057 | TM | Landsat-5 | 1,2,3,4,5,7 | 30 m | 0.450–2.35 µm | Red Green Blue |
| 2003 | 188/056 188/057 189/056 189/057 | ETM+ | Landsat-7 | 1,2,3,4,5,7 | 30 m | 0.450–2.35 µm | Red Green Blue |
| Class Name | 1986 | 2003 | Change | |||
|---|---|---|---|---|---|---|
| Percentage | Square Kilometers | Percentage | Square Kilometers | Square Kilometers | Percentage | |
| Urban | 2.8 | 134.5 | 11.4 | 550.0 | 415.5 | 308.9 |
| Forest | 12.5 | 600.2 | 10.9 | 526.5 | −73.7 | −12.3 |
| Agric. Land | 65.9 | 3174.6 | 59.9 | 2885.5 | −289.2 | −9.1 |
| Mangrove | 13.2 | 636.4 | 12.9 | 622.3 | −14.1 | −2.2 |
| Water | 5.7 | 275.3 | 4.9 | 236.7 | −38.6 | −14.0 |
| Total | 4821.0 | 4821.0 | ||||
| Class Name | 1986 | 1995 | Change | |||
|---|---|---|---|---|---|---|
| Percentage | Square Kilometers | Percentage | Square Kilometers | Square Kilometers | Percentage | |
| Urban | 2.8 | 134.5 | 5.8 | 277.3 | 142.8 | 106.1 |
| Forest | 12.5 | 600.2 | 11.1 | 534.6 | −65.6 | −10.9 |
| Agric. Land | 65.9 | 3174.6 | 60.1 | 2896.2 | −278.4 | −8.8 |
| Mangrove | 13.2 | 636.4 | 16.9 | 812.8 | 176.5 | 27.7 |
| Water | 5.7 | 275.3 | 6.2 | 300.1 | 24.8 | 9.0 |
| Total | 4821.0 | 4821.0 | ||||
| Class Name | 1995 | 2003 | Change | |||
|---|---|---|---|---|---|---|
| Percentage | Square Kilometers | Percentage | Square Kilometers | Square Kilometers | Percentage | |
| Urban | 5.8 | 277.3 | 11.4 | 550.0 | 272.7 | 98.4 |
| Forest | 11.1 | 534.6 | 10.9 | 526.5 | −8.1 | −1.5 |
| Agric. Land | 60.1 | 2896.2 | 59.4 | 2862.5 | −33.7 | −1.2 |
| Mangrove | 16.9 | 812.8 | 12.9 | 622.3 | −190.5 | −23.4 |
| Water | 6.2 | 300.1 | 4.9 | 236.7 | −63.4 | −21.1 |
| Total | 4821.0 | 4821.0 | ||||
| LULC Category | Urban | Forest | Agric. Land | Mangrove | Water | 1986 Total | 1986 Gross Loss |
|---|---|---|---|---|---|---|---|
| Urban | 97.2 | 5.1 | 27.3 | 4.8 | 0.1 | 134.5 | 37.3 |
| Forest | 13.3 | 242.4 | 321.0 | 23.3 | 0.3 | 600.2 | 357.8 |
| Agric. Land | 422.3 | 229.5 | 2520.3 | 2.6 | 0.0 | 3174.6 | 654.4 |
| Mangrove | 15.3 | 49.4 | 16.7 | 550.8 | 4.3 | 636.4 | 85.6 |
| Water | 1.9 | 0.2 | 0.3 | 40.9 | 232.0 | 275.3 | 43.3 |
| 2003 Total | 550.0 | 526.5 | 2885.5 | 622.3 | 236.7 | 4821.0 | |
| 2003 Gross Gain | 452.8 | 284.2 | 365.2 | 71.6 | 4.7 |
| LULC Category | Urban | Forest | Agric. Land | Mangrove | Water | 1986 Total | 1986 Gross Loss |
|---|---|---|---|---|---|---|---|
| Urban | 71.1 | 4.0 | 41.3 | 15.1 | 3.1 | 134.5 | 63.4 |
| Forest | 6.7 | 189.7 | 258.6 | 135.2 | 10.1 | 600.2 | 410.6 |
| Agric. Land | 181.5 | 300.4 | 2552.7 | 134.1 | 5.9 | 3174.6 | 621.9 |
| Mangrove | 14.4 | 37.8 | 41.2 | 481.5 | 60.1 | 635.0 | 153.5 |
| Water | 3.5 | 2.7 | 2.5 | 47.0 | 220.9 | 276.7 | 55.7 |
| 1995 Total | 277.3 | 534.6 | 2896.2 | 812.8 | 300.1 | 4821.0 | |
| 1995 Gross Gain | 206.2 | 344.9 | 343.5 | 331.4 | 79.2 |
| LULC Category | Urban | Forest | Agric. Land | Mangrove | Water | 1995 Total | 1995 Gross Loss |
|---|---|---|---|---|---|---|---|
| Urban | 163.0 | 8.3 | 91.8 | 12.1 | 2.0 | 277.3 | 114.3 |
| Forest | 26.9 | 151.7 | 325.1 | 29.3 | 1.6 | 534.6 | 382.9 |
| Agric. Land | 326.2 | 226.1 | 2317.5 | 24.8 | 1.6 | 2896.2 | 578.7 |
| Mangrove | 28.4 | 129.5 | 145.0 | 481.2 | 28.9 | 812.8 | 331.7 |
| Water | 5.6 | 11.0 | 6.1 | 74.9 | 202.6 | 300.1 | 97.5 |
| 2003 Total | 550.0 | 526.5 | 2885.5 | 622.3 | 236.7 | 4821.0 | |
| Gross Gain | 387.0 | 374.8 | 568.0 | 141.2 | 34.1 |
| Gross Gain | Gross Loss | Persistence | Total Change | Absolute Net Change | Swap Change | |||||||
|---|---|---|---|---|---|---|---|---|---|---|---|---|
| 1986–2003 | Urban | 452.8 | Agric. Land | 654.4 | Agric. Land | 2520.3 | Agric. Land | 1019.6 | Urban | 415.5 | Agric. Land | 730.4 |
| Agric. Land | 365.2 | Forest | 357.8 | Mangrove | 550.8 | Forest | 642.0 | Agric. Land | 289.2 | Forest | 568.3 | |
| Forest | 284.2 | Mangrove | 85.6 | Forest | 242.4 | Urban | 490.1 | Forest | 73.7 | Mangrove | 143.1 | |
| Mangrove | 71.6 | Water | 43.3 | Water | 232.0 | Mangrove | 157.2 | Water | 38.6 | Urban | 74.7 | |
| Water | 4.7 | Urban | 37.3 | Urban | 97.2 | Water | 48.0 | Mangrove | 14.1 | Water | 9.4 | |
| Total | 1178.4 | Total | 1178.4 | Total | 3642.6 | Total | 2356.8 | Total | 830.9 | Total | 1525.9 | |
| Gross Gain | Gross Loss | Persistence | Total Change | Absolute Net Change | Swap Change | |||||||
|---|---|---|---|---|---|---|---|---|---|---|---|---|
| 1986–1995 | Forest | 344.9 | Agric. Land | 621.9 | Agric. Land | 2552.7 | Agric. Land | 965.4 | Agric. Land | 278.4 | Forest | 689.9 |
| Agric. Land | 343.5 | Forest | 410.6 | Mangrove | 481.5 | Forest | 755.5 | Mangrove | 177.8 | Agric. Land | 687.0 | |
| Mangrove | 331.4 | Mangrove | 153.5 | Water | 220.9 | Mangrove | 484.9 | Urban | 142.8 | Mangrove | 307.0 | |
| Urban | 206.2 | Urban | 63.4 | Forest | 189.7 | Urban | 269.6 | Forest | 65.6 | Urban | 126.8 | |
| Water | 79.2 | Water | 55.7 | Urban | 71.1 | Water | 134.9 | Water | 23.5 | Water | 111.4 | |
| Total | 1305.1 | Total | 1305.1 | Total | 3515.9 | Total | 2610.3 | Total | 688.1 | Total | 1922.2 | |
| Gross Gain | Gross Loss | Persistence | Total Change | Net Change | Swap Change | |||||||
|---|---|---|---|---|---|---|---|---|---|---|---|---|
| 1995–2003 | Agric. Land | 568.0 | Agric. Land | 578.7 | Agric. Land | 2317.5 | Agric. Land | 1146.7 | Urban | 272.7 | Agric. Land | 1135.9 |
| Urban | 387.0 | Forest | 382.9 | Mangrove | 481.2 | Forest | 757.7 | Mangrove | 190.5 | Forest | 749.7 | |
| Forest | 374.8 | Mangrove | 331.7 | Water | 202.6 | Urban | 501.3 | Water | 63.4 | Mangrove | 282.3 | |
| Mangrove | 141.2 | Urban | 114.3 | Urban | 163.0 | Mangrove | 472.8 | Agric. Land | 10.7 | Urban | 228.6 | |
| Water | 34.1 | Water | 97.5 | Forest | 151.7 | Water | 131.6 | Forest | 8.1 | Water | 68.2 | |
| Total | 1505.0 | Total | 1505.0 | Total | 3315.9 | Total | 3010.1 | Total | 545.4 | Total | 2464.7 | |
| Time Period | LULC Category | Gain-to-Persistence Ratio | Loss-to-Persistence Ratio |
|---|---|---|---|
| 1986–2003 | Urban | 4.7 | 0.4 |
| Forest | 1.2 | 1.5 | |
| Agric. Land | 0.1 | 0.3 | |
| Mangrove | 0.1 | 0.2 | |
| Water | 0.0 | 0.2 | |
| 1986–1995 | Urban | 2.9 | 0.9 |
| Forest | 1.8 | 2.2 | |
| Agric. Land | 0.1 | 0.2 | |
| Mangrove | 0.7 | 0.3 | |
| Water | 0.4 | 0.3 | |
| 1995–2003 | Urban | 2.4 | 0.7 |
| Forest | 2.5 | 2.5 | |
| Agric. Land | 0.3 | 0.3 | |
| Mangrove | 0.3 | 0.7 | |
| Water | 0.2 | 0.5 |
© 2018 by the authors. Licensee MDPI, Basel, Switzerland. This article is an open access article distributed under the terms and conditions of the Creative Commons Attribution (CC BY) license (http://creativecommons.org/licenses/by/4.0/).
Share and Cite
Dan-Jumbo, N.G.; Metzger, M.J.; Clark, A.P. Urban Land-Use Dynamics in the Niger Delta: The Case of Greater Port Harcourt Watershed. Urban Sci. 2018, 2, 108. https://doi.org/10.3390/urbansci2040108
Dan-Jumbo NG, Metzger MJ, Clark AP. Urban Land-Use Dynamics in the Niger Delta: The Case of Greater Port Harcourt Watershed. Urban Science. 2018; 2(4):108. https://doi.org/10.3390/urbansci2040108
Chicago/Turabian StyleDan-Jumbo, Nimi G., Marc J. Metzger, and Andrew P. Clark. 2018. "Urban Land-Use Dynamics in the Niger Delta: The Case of Greater Port Harcourt Watershed" Urban Science 2, no. 4: 108. https://doi.org/10.3390/urbansci2040108
APA StyleDan-Jumbo, N. G., Metzger, M. J., & Clark, A. P. (2018). Urban Land-Use Dynamics in the Niger Delta: The Case of Greater Port Harcourt Watershed. Urban Science, 2(4), 108. https://doi.org/10.3390/urbansci2040108